musk corporation
TRANSCRIPT
AhmedZayedColeVanLeuvenMohammedAbdelmageedRahulShaha
TheMUSKcorporation

AGENDA
Company Management and StrategyPerformance Review and Analysis
Key Decisions - Good and BadStatus and Future Outlook

COMPANY MANAGEMENT AND STRATEGY
- By Rahul Shaha
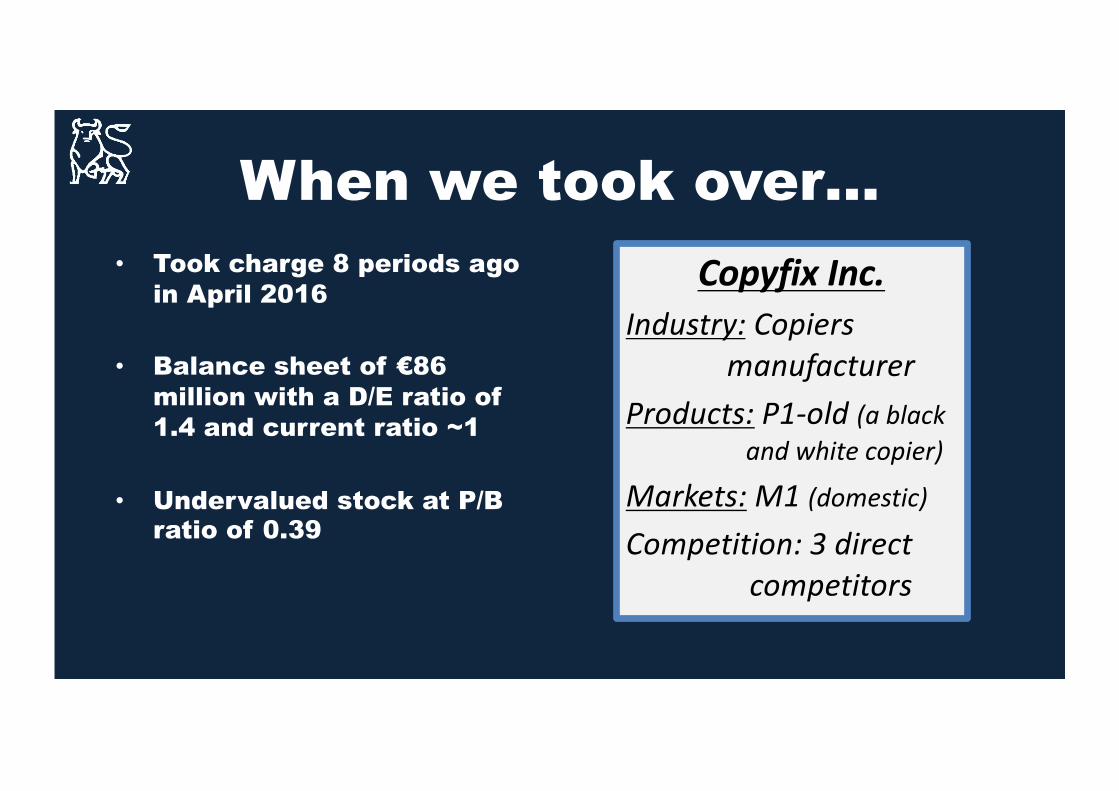
When we took over…• Took charge 8 periods ago
in April 2016
• Balance sheet of €86 million with a D/E ratio of 1.4 and current ratio ~1
• Undervalued stock at P/B ratio of 0.39
Copyfix Inc.Industry: Copiers
manufacturerProducts: P1-old(ablack
andwhitecopier)
Markets: M1(domestic)
Competition:3directcompetitors

MUSK CORP.Rebranding
EqualityEthical Practices
Customer centricityShareholder centricity
Open platform governance
Core Values

Executive Management
MUSK Corp.
Rahul ShahaProduction, Strategic Controlling
Mohammed AbdelmageedFinance and Accounting
Ahmed HassanProcurement, R&D
Cole van LeuvenSales and Advertising

LEAN MANAGEMENTCore Strategy

Why Lean?• Leverage strengths of
executive board
• Single product, predictable demand
• Pricing Strategy: Cost+
DEPARTMENTAL STRATEGIES
ResponsibilitiesStrategies

Departmental Strategies
Production•Increase productivity•Maximum use of lines•Maintain workers utilization ~95%
Procurement•Buy more to get cheaper price
•Eye on inventory
Sales & Advertising•Keep track of regressive curve (use curve-fitting tools)
•Link Advertising and sales volume closely
R & D•Maintain indexes above 100
•Scenario-driven investments
Finance•Excel-based simulation
•Precise costing•Thorough and continuous optimization

STRATEGIC ADAPTATIONS
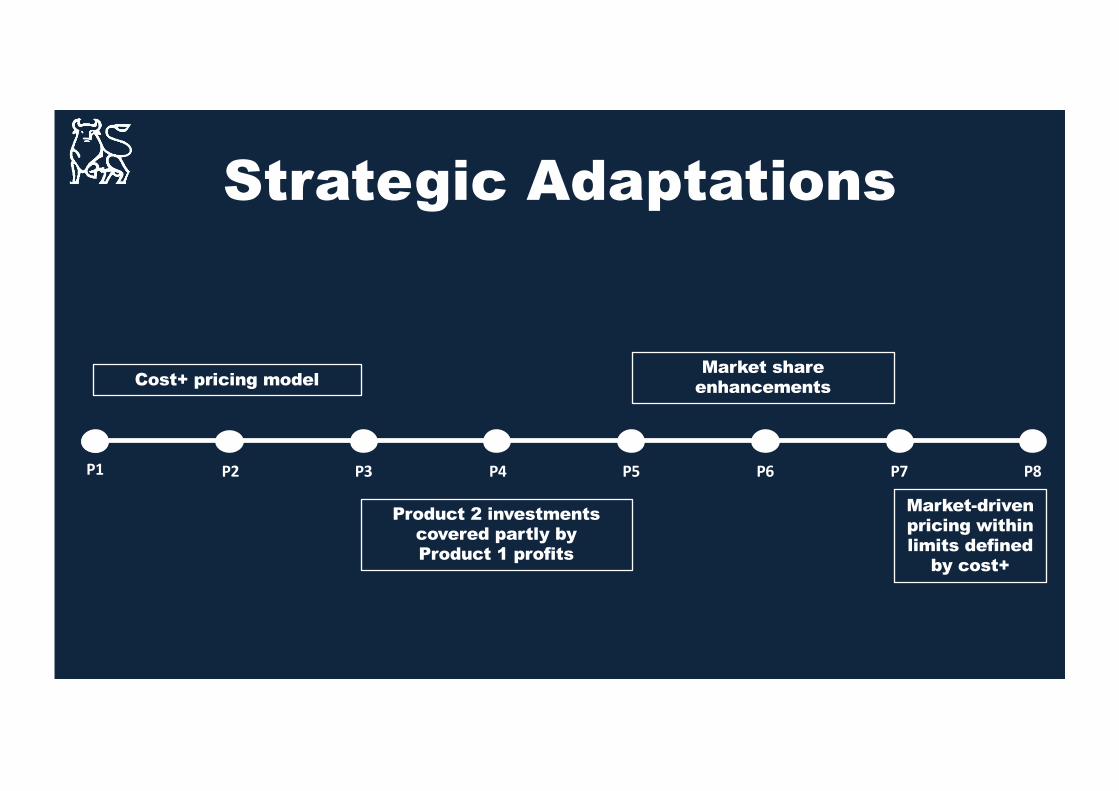
Strategic Adaptations
P1 P8P2 P3 P4 P5 P6 P7
Cost+ pricing model
Market-driven pricing within limits defined
by cost+
Product 2 investments covered partly by Product 1 profits
Market share enhancements
KEY DECISIONS- By Cole Van Leuven

BEST DECISIONS
Data Driven Decision-Making
Overtime Penalty Avoidance (P7)
New Line vs Overtime
No Long-term loans
9/3/16 MuskCorp- ShareholderMeet 14

WORST DECISIONS
Layoff Limit
Capacity Planning
Overdraft Penalties
9/3/16 MuskCorp- ShareholderMeet 15

MUSK FACTS AND FIGURES- By Mohammed Abdelmageed

Facts and figures
100%102%
105%107% 107% 108%
105%107%
117%
100% 101% 102%
108%
90%
95%
100%
105%
110%
115%
120%
0 1 2 3 4 5 6 7 8
TEC
HN
OLO
GY
IND
EX %
Technology indices
P1 index P2 index
60%
70%
80%
90%
100%
110%
0 1 2 3 4 5 6 7 8
Utilization rates
Lines CU Personnel U

Facts and figures
1548 1577 1564 15381716
19011784
18571686
400
782925
1840
0
400
800
1200
1600
2000
0 1 2 3 4 5 6 7 8
MAR
GIN
IN E
UR
Contribution margin
P1 margin P2 margin

Facts and figures
129
157.9
189.5
149.4
181.2
223.9
186.4
245.4 253.2
0
50
100
150
200
250
300
0 2 4 6 8
REV
ENU
ES M
ILLI
ON
EU
R
Company revenues
20%
27% 27%
21%
31%32%
27%28%
25%
0%
10%
20%
30%
40%
0 2 4 6 8M
ARKE
T SH
ARE
%
Total market share

11.30%
13.90%14.30%
2.60%
-0.60%
17.00%
5.40%
13.60%13.90%
-2%
0%
2%
4%
6%
8%
10%
12%
14%
16%
18%
0 1 2 3 4 5 6 7 8R
OS
%
Return on Sales %
Facts and figures
60%
70%
80%
90%
100%
1 2 3 4 5 6 7 8
CGM PLANNING QUALITY
CGM quality P1 CGM quality P2
17%
11%

Facts and figures
2.6
30.4
87
122.9134
112.3122.1
150.9
169.4
0
20
40
60
80
100
120
140
160
180
0 1 2 3 4 5 6 7 8
MVA
MIL
LIO
N E
UR
Cumulative MVA

Facts and figures
34.3
69.9
110
83.9
0
68.9
125
152.4165
0
20
40
60
80
100
120
140
160
180
0 1 2 3 4 5 6 7 8
VALU
E IN
M E
UR
Company value

Facts and figures
1.1
1.7
2.1
1.7
0.0
0.8
1.31.2
1.1
0.0
0.5
1.0
1.5
2.0
2.5
0 1 2 3 4 5 6 7 8
Price to Book value

COMPANY STATUS AND FUTURE OUTLOOK
- By Ahmed Hassan

Company StatusFactor Period 0 Period 8 ChangeEquity capital 31.6 146.4 4.6
Declared dividends 0 11.2 11.2
Return on sales 11.3 13.9 1.2
Corporate image 63.8 104.8 1.6
Equity-Debt ratio 0.7 9.76 13.4
Price-Book ratio 0.4 1.1 2.8
Value Of The Company(m Euro) 34.3 165 4.8
9/3/16 MuskCorp- ShareholderMeet 25

Future Outlook
0.7
3.01.8
1.0-0.1
1.3 1.42.6
9.8
11.7
16.2
-2
0
2
4
6
8
10
12
14
16
18
0 1 2 3 4 5 6 7 8 9 10
Equi
ty-D
ebt r
atio
Period
Equity-Debt Ratio outlook

Future Outlook
34.3
69.9
11083.9
0
68.9
125
152.4165
204.2
248.5
0
50
100
150
200
250
300
0 1 2 3 4 5 6 7 8 9 10
Com
pany
Val
ue
period
Company Value outlook
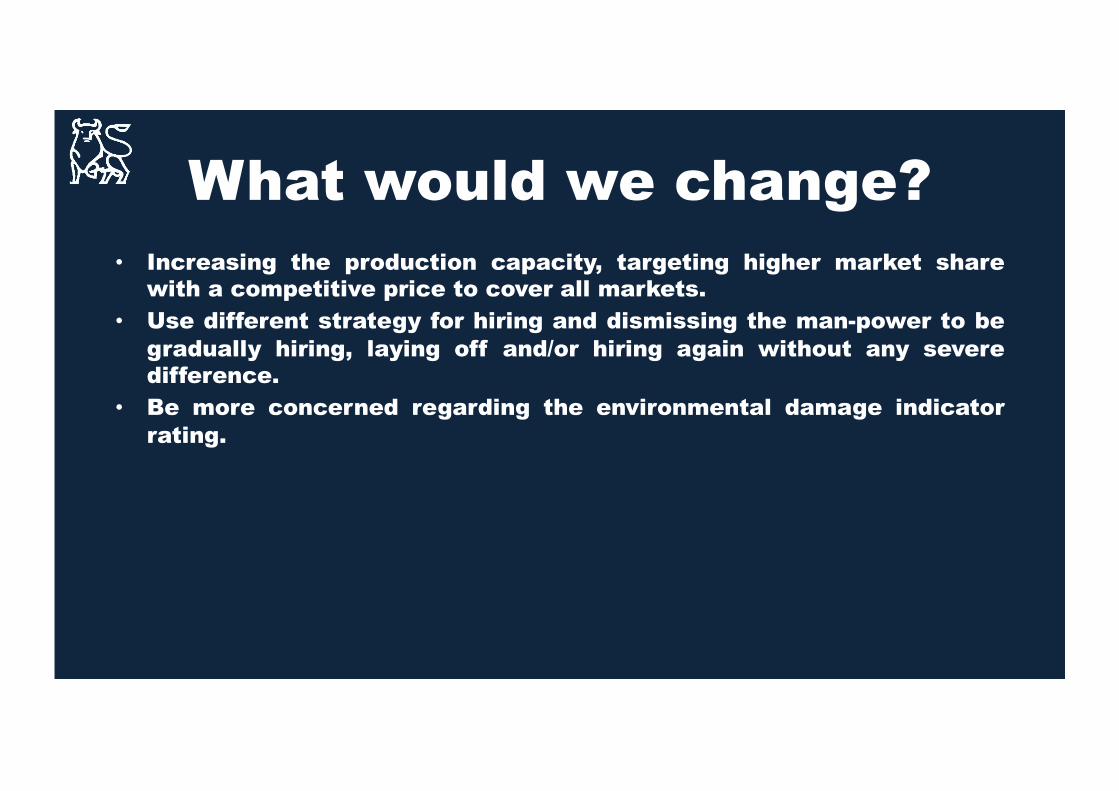
What would we change?• Increasing the production capacity, targeting higher market share
with a competitive price to cover all markets.• Use different strategy for hiring and dismissing the man-power to be
gradually hiring, laying off and/or hiring again without any severedifference.
• Be more concerned regarding the environmental damage indicatorrating.

Thank You.