music style and composition - vcaa.vic.edu.au · music style and composition. graded assessment 3....
TRANSCRIPT
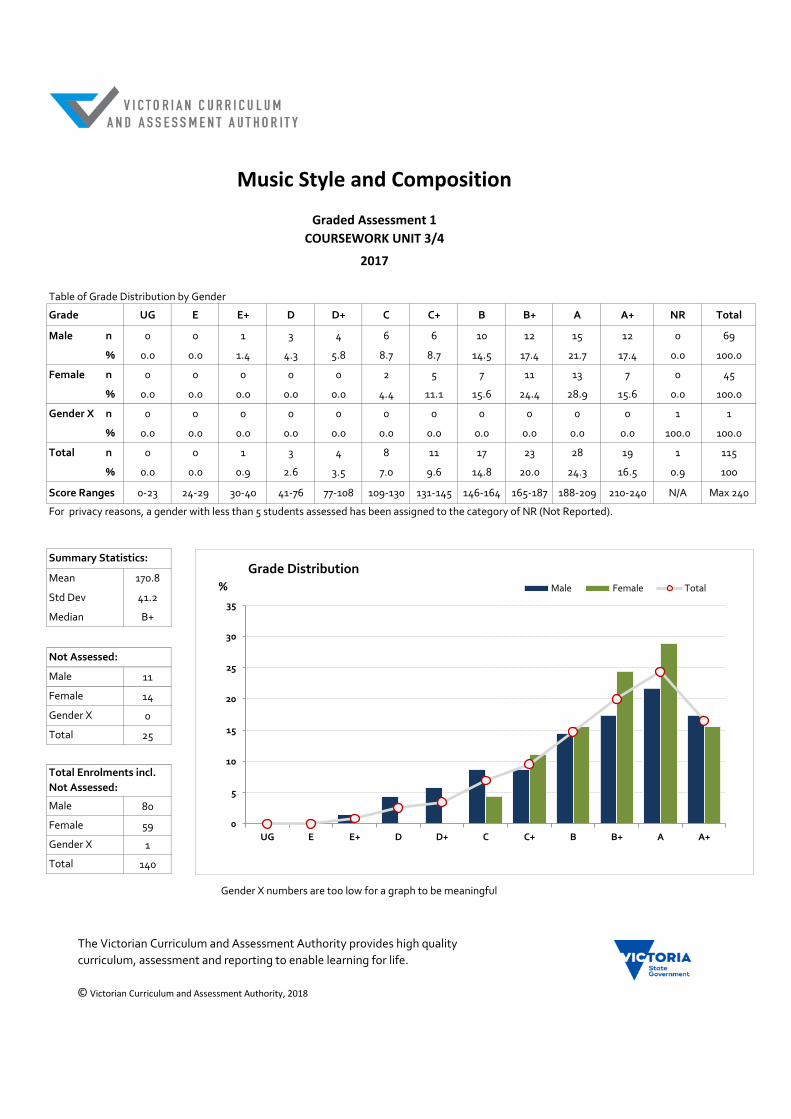
Table of Grade Distribution by Gender
Grade UG E E+ D D+ C C+ B B+ A A+ NR Total
Male n 0 0 1 3 4 6 6 10 12 15 12 0 69
% 0.0 0.0 1.4 4.3 5.8 8.7 8.7 14.5 17.4 21.7 17.4 0.0 100.0
Female n 0 0 0 0 0 2 5 7 11 13 7 0 45
% 0.0 0.0 0.0 0.0 0.0 4.4 11.1 15.6 24.4 28.9 15.6 0.0 100.0
Gender X n 0 0 0 0 0 0 0 0 0 0 0 1 1
% 0.0 0.0 0.0 0.0 0.0 0.0 0.0 0.0 0.0 0.0 0.0 100.0 100.0
Total n 0 0 1 3 4 8 11 17 23 28 19 1 115
% 0.0 0.0 0.9 2.6 3.5 7.0 9.6 14.8 20.0 24.3 16.5 0.9 100
Score Ranges 0-23 24-29 30-40 41-76 77-108 109-130 131-145 146-164 165-187 188-209 210-240 N/A Max 240
Mean 170.8
Std Dev 41.2
Median B+
11
14
0
25
80
59
1
140
Gender X
Total
Gender X numbers are too low for a graph to be meaningful
Music Style and Composition
Graded Assessment 1
COURSEWORK UNIT 3/4
2017
Not Assessed:
Summary Statistics:
Male
Female
Gender X
Total
For privacy reasons, a gender with less than 5 students assessed has been assigned to the category of NR (Not Reported).
Total Enrolments incl.
Not Assessed:
Male
Female
No graph is supplied for this GA as student numbers are too small for a graph to be meaningfull.
0
5
10
15
20
25
30
35
UG E E+ D D+ C C+ B B+ A A+
%
Grade Distribution
Male Female Total
The Victorian Curriculum and Assessment Authority provides high quality
curriculum, assessment and reporting to enable learning for life.
© Victorian Curriculum and Assessment Authority, 2018
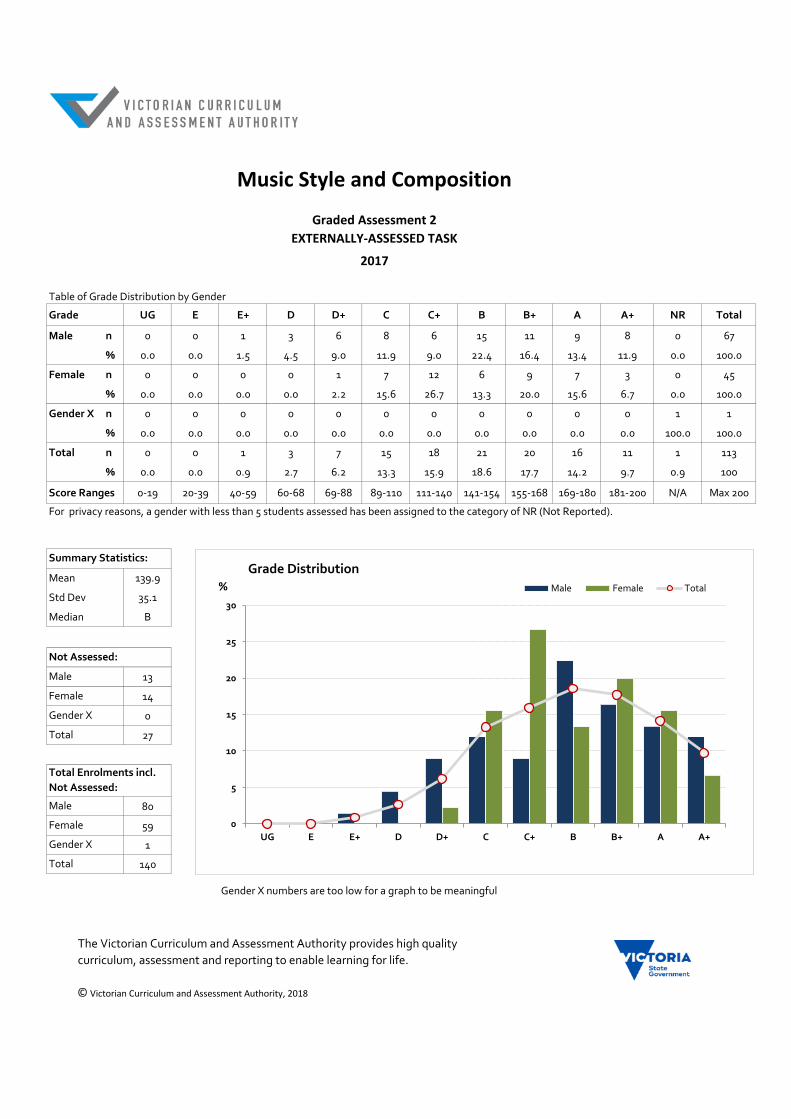
Table of Grade Distribution by Gender
Grade UG E E+ D D+ C C+ B B+ A A+ NR Total
Male n 0 0 1 3 6 8 6 15 11 9 8 0 67
% 0.0 0.0 1.5 4.5 9.0 11.9 9.0 22.4 16.4 13.4 11.9 0.0 100.0
Female n 0 0 0 0 1 7 12 6 9 7 3 0 45
% 0.0 0.0 0.0 0.0 2.2 15.6 26.7 13.3 20.0 15.6 6.7 0.0 100.0
Gender X n 0 0 0 0 0 0 0 0 0 0 0 1 1
% 0.0 0.0 0.0 0.0 0.0 0.0 0.0 0.0 0.0 0.0 0.0 100.0 100.0
Total n 0 0 1 3 7 15 18 21 20 16 11 1 113
% 0.0 0.0 0.9 2.7 6.2 13.3 15.9 18.6 17.7 14.2 9.7 0.9 100
Score Ranges 0-19 20-39 40-59 60-68 69-88 89-110 111-140 141-154 155-168 169-180 181-200 N/A Max 200
Mean 139.9
Std Dev 35.1
Median B
13
14
0
27
80
59
1
140
Gender X
Total
Gender X numbers are too low for a graph to be meaningful
Music Style and Composition
Graded Assessment 2
EXTERNALLY-ASSESSED TASK
2017
Not Assessed:
Summary Statistics:
Male
Female
Gender X
Total
For privacy reasons, a gender with less than 5 students assessed has been assigned to the category of NR (Not Reported).
Total Enrolments incl.
Not Assessed:
Male
Female
No graph is supplied for this GA as student numbers are too small for a graph to be meaningfull.
0
5
10
15
20
25
30
UG E E+ D D+ C C+ B B+ A A+
%
Grade Distribution
Male Female Total
The Victorian Curriculum and Assessment Authority provides high quality
curriculum, assessment and reporting to enable learning for life.
© Victorian Curriculum and Assessment Authority, 2018
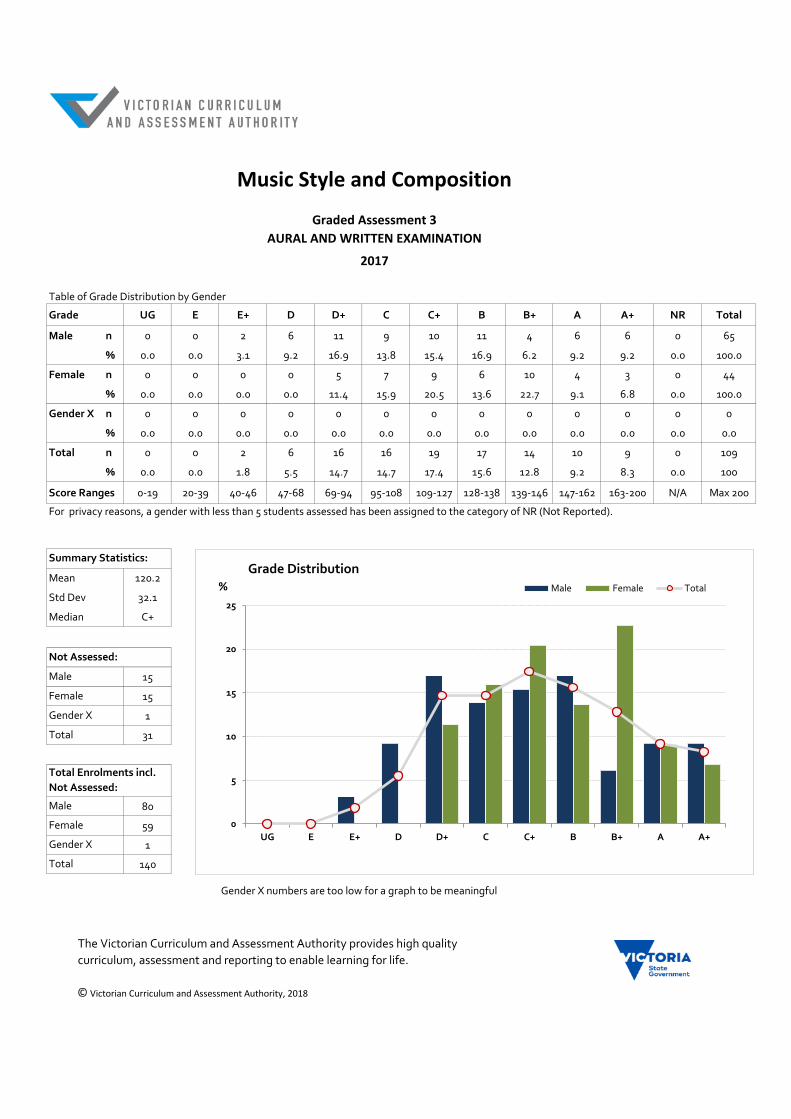
Table of Grade Distribution by Gender
Grade UG E E+ D D+ C C+ B B+ A A+ NR Total
Male n 0 0 2 6 11 9 10 11 4 6 6 0 65
% 0.0 0.0 3.1 9.2 16.9 13.8 15.4 16.9 6.2 9.2 9.2 0.0 100.0
Female n 0 0 0 0 5 7 9 6 10 4 3 0 44
% 0.0 0.0 0.0 0.0 11.4 15.9 20.5 13.6 22.7 9.1 6.8 0.0 100.0
Gender X n 0 0 0 0 0 0 0 0 0 0 0 0 0
% 0.0 0.0 0.0 0.0 0.0 0.0 0.0 0.0 0.0 0.0 0.0 0.0 0.0
Total n 0 0 2 6 16 16 19 17 14 10 9 0 109
% 0.0 0.0 1.8 5.5 14.7 14.7 17.4 15.6 12.8 9.2 8.3 0.0 100
Score Ranges 0-19 20-39 40-46 47-68 69-94 95-108 109-127 128-138 139-146 147-162 163-200 N/A Max 200
Mean 120.2
Std Dev 32.1
Median C+
15
15
1
31
80
59
1
140
Gender X
Total
Gender X numbers are too low for a graph to be meaningful
Music Style and Composition
Graded Assessment 3
AURAL AND WRITTEN EXAMINATION
2017
Not Assessed:
Summary Statistics:
Male
Female
Gender X
Total
For privacy reasons, a gender with less than 5 students assessed has been assigned to the category of NR (Not Reported).
Total Enrolments incl.
Not Assessed:
Male
Female
No graph is supplied for this GA as student numbers are too small for a graph to be meaningfull.
0
5
10
15
20
25
UG E E+ D D+ C C+ B B+ A A+
%
Grade Distribution
Male Female Total
The Victorian Curriculum and Assessment Authority provides high quality
curriculum, assessment and reporting to enable learning for life.
© Victorian Curriculum and Assessment Authority, 2018