municipal solid waste dryer by using waste heat...
TRANSCRIPT
MUNICIPAL SOLID WASTE DRYER
BY USING WASTE HEAT DESIGN
By
Mr. Chatchawan LAWANANGKUL
ID 51211631
September 2013 of Degree Conferral
Research Report Presented to
the Faculty of the Graduate School of Asia Pacific Studies
Ritsumeikan Asia Pacific University
in Partial Fulfillment of the Requirements for
the Degree of Master of Science in International Cooperation Policy
CERTIFICATION
I, Chatchawan Lawanangkul, declare that this thesis, submitted in fulfillment of the requirements
for the award of, Master of Science in International Cooperation Policy in the Graduate School
of Asia Pacific Studies, Ritsumeikan Asia Pacific University, is wholly my own original work
unless otherwise referenced or acknowledged. The document has not been submitted for
qualifications at other academic institutions.
Chatchawan Lawanangkul
15 July 2013
TABLE OF CONTENTS
PAGE
LIST OF TABLES i
LIST OF FIGURES ii
EXECUTIVE SUMMARY v
CHAPTER 1 INTRODUCTION 1
1.1. Background 3
1.1.1. Background on Thailand’s Energy consumption 3
1.1.2. Background on the gasification 7
1.1.3. Background on energy from waste 13
1.1.3.1. Waste 13
1.1.3.2. Energy from waste 15
1.1.3.3. Waste to energy process (electricity) 15
1.1.3.4. Process technology 18
1.1.3.5. Conclusion 21
1.2. Objective 22
1.3. Expected outcomes 23
1.4. Scope of work 24
1.5. Methodology 25
CHAPTER 2 LITURATURE REVIEW 27
2.1. Gasifier: Gasifier for damp fuel 27
2.1.1. Previous attempts with wet wood 27
2.1.2. Monorator invention 29
2.1.3. The principle of the monorator 30
2.1.4. Conclusions 31
2.2. Dryer: Application of pulse combustion technology in spray drying process 32
2.2.1. Introduction 32
2.2.2. Pulse Combustion Drying Application 33
2.2.3. Pulse Combustion Spray Drying Unit 35
2.2.4. Modeling of Evaporation and Drying Process In Time Dependent
Pulsating Flow
37
2.2.5. Conclusions 37
2.3. Waste heat recovery system 38
2.3.1. Case study wood waste gasification and thermal oxidation 38
2.3.2. Gasification: an alternative process for energy recovery and disposal of
municipal solid wastes
40
CHAPTER 3 PROJECT WORK PROCEDURES 43
3.1. Selecting the process of improvement 43
3.2. Information of dryer 43
3.2.1. Rotary dryers 45
3.2.2. Spray dryers 47
3.2.3. Continuous fluid bed dryer 48
3.2.4. Tray dryers 49
3.3. Selection of dryer 53
3.3.1. Selection Criteria 53
3.3.2. Conclusion of selection 56
CHAPTER 4 CALCULATION AND SOLUTION 58
4.1. Technical calculation (Design of dying system) 58
4.2. Financial calculation 80
4.2.1. Construction cost 80
4.2.2. Operating cost 81
4.2.3. Maintenance cost 82
4.2.4. Profit after applying the fuel drying system 82
4.2.5. Time requirement for breakeven point 87
CHAPTER 5 PROJECT OUTCOMES 88
5.1. Engineering part: Dryer & Mixer 88
5.2. Financial part 90
CHAPTER 6 DISCUSSION 91
CHAPTER 7 CONCLUSION 93
REFERENCES 94
APPENDICES
Appendix A1 98
Appendix A2 112
Appendix A3 117
Appendix A4 125
Appendix A5 136
Appendix A6 139
Appendix A7 142
Appendix A8 144
Appendix A9 145
i
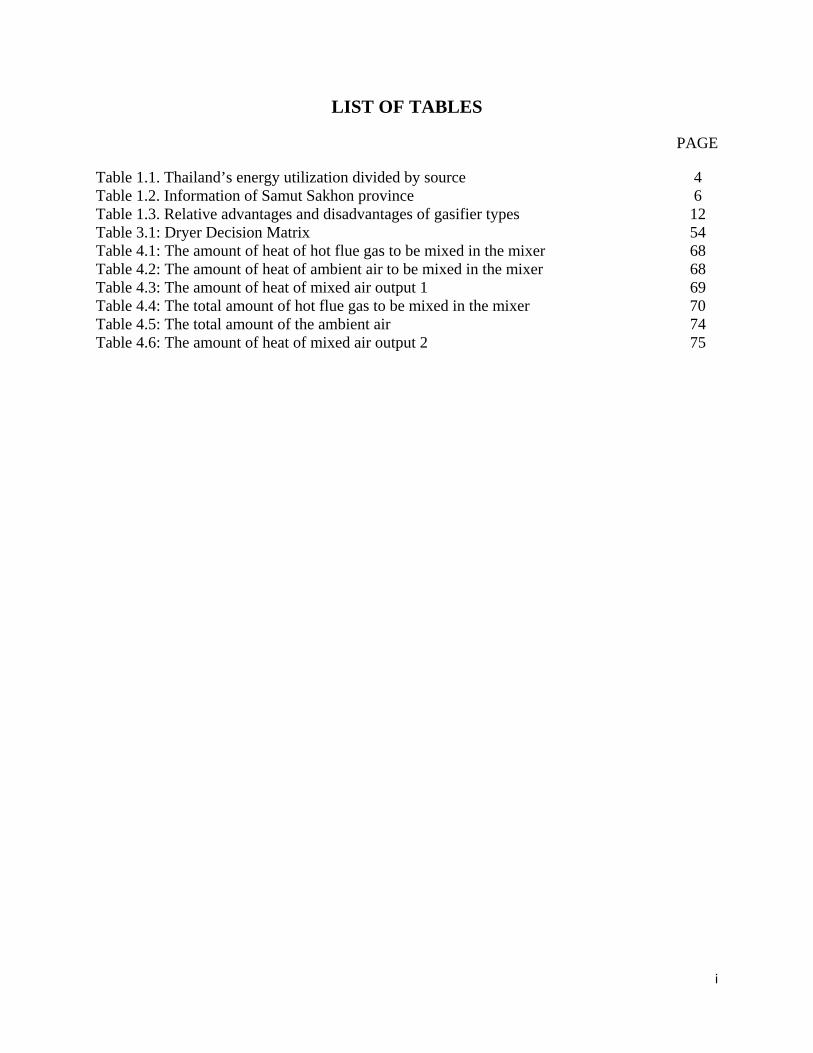
LIST OF TABLES
PAGE
Table 1.1. Thailand’s energy utilization divided by source 4 Table 1.2. Information of Samut Sakhon province 6 Table 1.3. Relative advantages and disadvantages of gasifier types 12 Table 3.1: Dryer Decision Matrix 54 Table 4.1: The amount of heat of hot flue gas to be mixed in the mixer 68 Table 4.2: The amount of heat of ambient air to be mixed in the mixer 68 Table 4.3: The amount of heat of mixed air output 1 69 Table 4.4: The total amount of hot flue gas to be mixed in the mixer 70 Table 4.5: The total amount of the ambient air 74 Table 4.6: The amount of heat of mixed air output 2 75
ii
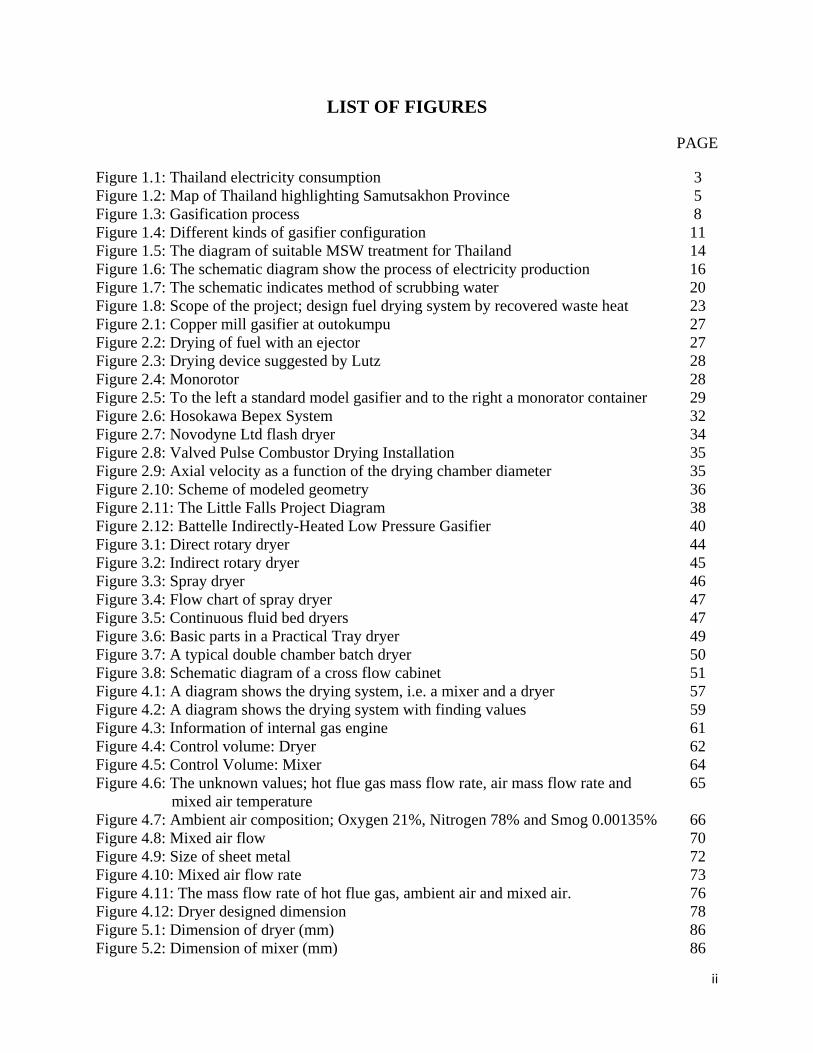
LIST OF FIGURES
PAGE
Figure 1.1: Thailand electricity consumption 3 Figure 1.2: Map of Thailand highlighting Samutsakhon Province 5 Figure 1.3: Gasification process 8 Figure 1.4: Different kinds of gasifier configuration 11 Figure 1.5: The diagram of suitable MSW treatment for Thailand 14 Figure 1.6: The schematic diagram show the process of electricity production 16 Figure 1.7: The schematic indicates method of scrubbing water 20 Figure 1.8: Scope of the project; design fuel drying system by recovered waste heat 23 Figure 2.1: Copper mill gasifier at outokumpu 27 Figure 2.2: Drying of fuel with an ejector 27 Figure 2.3: Drying device suggested by Lutz 28 Figure 2.4: Monorotor 28 Figure 2.5: To the left a standard model gasifier and to the right a monorator container 29 Figure 2.6: Hosokawa Bepex System 32 Figure 2.7: Novodyne Ltd flash dryer 34 Figure 2.8: Valved Pulse Combustor Drying Installation 35 Figure 2.9: Axial velocity as a function of the drying chamber diameter 35 Figure 2.10: Scheme of modeled geometry 36 Figure 2.11: The Little Falls Project Diagram 38 Figure 2.12: Battelle Indirectly-Heated Low Pressure Gasifier 40 Figure 3.1: Direct rotary dryer 44 Figure 3.2: Indirect rotary dryer 45 Figure 3.3: Spray dryer 46 Figure 3.4: Flow chart of spray dryer 47 Figure 3.5: Continuous fluid bed dryers 47 Figure 3.6: Basic parts in a Practical Tray dryer 49 Figure 3.7: A typical double chamber batch dryer 50 Figure 3.8: Schematic diagram of a cross flow cabinet 51 Figure 4.1: A diagram shows the drying system, i.e. a mixer and a dryer 57 Figure 4.2: A diagram shows the drying system with finding values 59 Figure 4.3: Information of internal gas engine 61 Figure 4.4: Control volume: Dryer 62 Figure 4.5: Control Volume: Mixer 64 Figure 4.6: The unknown values; hot flue gas mass flow rate, air mass flow rate and mixed air temperature
65
Figure 4.7: Ambient air composition; Oxygen 21%, Nitrogen 78% and Smog 0.00135% 66 Figure 4.8: Mixed air flow 70 Figure 4.9: Size of sheet metal 72 Figure 4.10: Mixed air flow rate 73 Figure 4.11: The mass flow rate of hot flue gas, ambient air and mixed air. 76 Figure 4.12: Dryer designed dimension 78 Figure 5.1: Dimension of dryer (mm) 86 Figure 5.2: Dimension of mixer (mm) 86

iii
Figure 5.3: Overall 3D design; Dryer, Mixer, 2 Blowers, 2 Dampers 87 Figure 5.4: Simulation view with the power plant in 3D overview 87
iv
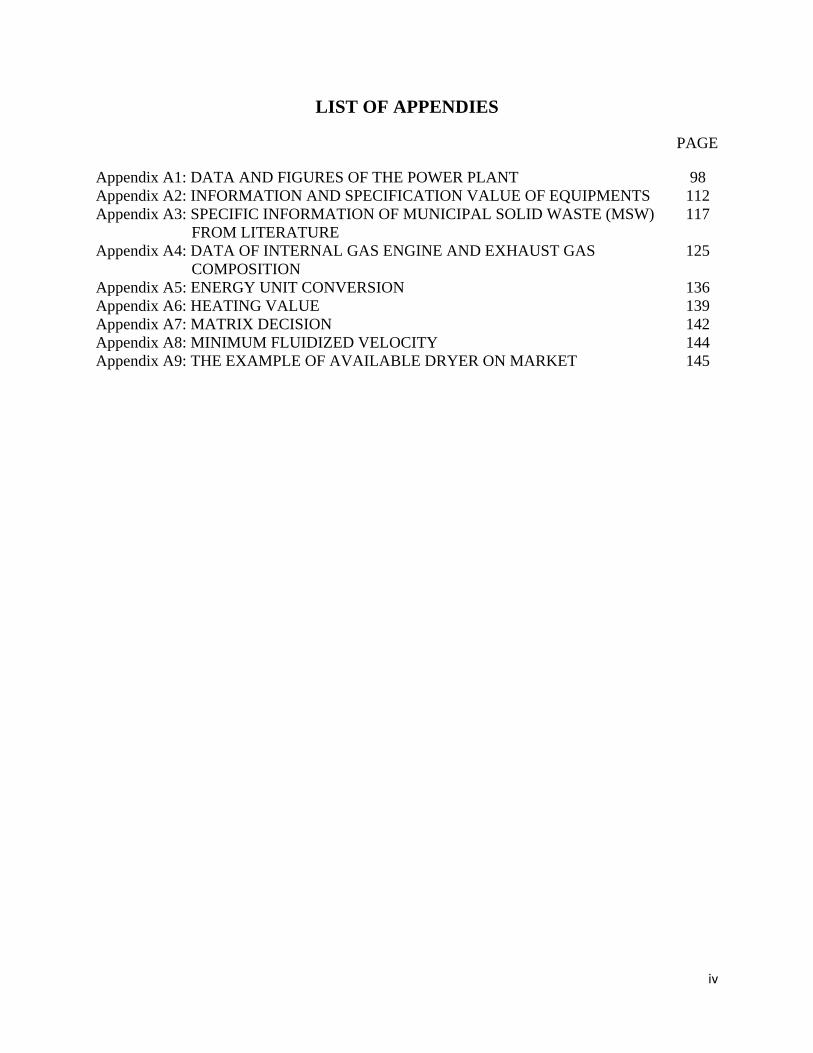
LIST OF APPENDIES
PAGE
Appendix A1: DATA AND FIGURES OF THE POWER PLANT 98 Appendix A2: INFORMATION AND SPECIFICATION VALUE OF EQUIPMENTS 112 Appendix A3: SPECIFIC INFORMATION OF MUNICIPAL SOLID WASTE (MSW) FROM LITERATURE
117
Appendix A4: DATA OF INTERNAL GAS ENGINE AND EXHAUST GAS COMPOSITION
125
Appendix A5: ENERGY UNIT CONVERSION 136 Appendix A6: HEATING VALUE 139 Appendix A7: MATRIX DECISION 142 Appendix A8: MINIMUM FLUIDIZED VELOCITY 144 Appendix A9: THE EXAMPLE OF AVAILABLE DRYER ON MARKET 145
v
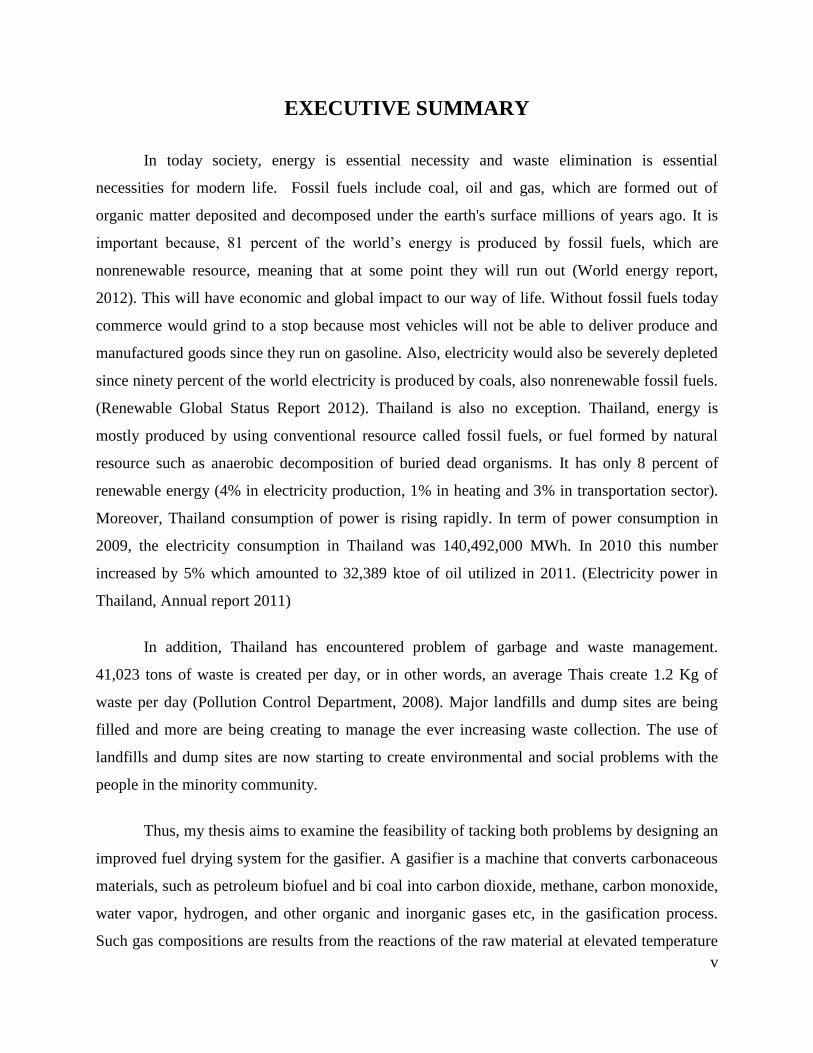
EXECUTIVE SUMMARY
In today society, energy is essential necessity and waste elimination is essential
necessities for modern life. Fossil fuels include coal, oil and gas, which are formed out of
organic matter deposited and decomposed under the earth's surface millions of years ago. It is
important because, 81 percent of the world’s energy is produced by fossil fuels, which are
nonrenewable resource, meaning that at some point they will run out (World energy report,
2012). This will have economic and global impact to our way of life. Without fossil fuels today
commerce would grind to a stop because most vehicles will not be able to deliver produce and
manufactured goods since they run on gasoline. Also, electricity would also be severely depleted
since ninety percent of the world electricity is produced by coals, also nonrenewable fossil fuels.
(Renewable Global Status Report 2012). Thailand is also no exception. Thailand, energy is
mostly produced by using conventional resource called fossil fuels, or fuel formed by natural
resource such as anaerobic decomposition of buried dead organisms. It has only 8 percent of
renewable energy (4% in electricity production, 1% in heating and 3% in transportation sector).
Moreover, Thailand consumption of power is rising rapidly. In term of power consumption in
2009, the electricity consumption in Thailand was 140,492,000 MWh. In 2010 this number
increased by 5% which amounted to 32,389 ktoe of oil utilized in 2011. (Electricity power in
Thailand, Annual report 2011)
In addition, Thailand has encountered problem of garbage and waste management.
41,023 tons of waste is created per day, or in other words, an average Thais create 1.2 Kg of
waste per day (Pollution Control Department, 2008). Major landfills and dump sites are being
filled and more are being creating to manage the ever increasing waste collection. The use of
landfills and dump sites are now starting to create environmental and social problems with the
people in the minority community.
Thus, my thesis aims to examine the feasibility of tacking both problems by designing an
improved fuel drying system for the gasifier. A gasifier is a machine that converts carbonaceous
materials, such as petroleum biofuel and bi coal into carbon dioxide, methane, carbon monoxide,
water vapor, hydrogen, and other organic and inorganic gases etc, in the gasification process.
Such gas compositions are results from the reactions of the raw material at elevated temperature
vi
with fixed quantity of steam and oxygen. The byproduct from the mixture is synthesis gas or
syngas and is by itself a combustible fuels/ gases. In addition, gasification process can be started
using materials that are not fossil fuels such as organic waste or biomass.
The research will focus on a real gasifier power plant which is located in existing landfill
site in Samutsakorn province, Thailand. The site has more than 500,000 tons of deposited waste
and more than 300 tons of municipal solid waste (MSW) added daily that need to be treated. The
plant is designed to produce an electrical power output 400 kW using combustible waste or
refuse derived fuel as fuel.
After careful deliberation and research to improve the thermal efficiency of the system, a
new designed of the improved gasifier was chosen. It dries moist MSW by recovered waste heat,
which is not only commercially profitable but also environmentally friendly since the utilized
fuels are biomass. This is done by finding the most suitable type, size and material of dryer to
reduce the moisture of the MSW from 50% to 20%. Thus, as moisture content decreases, the
lower heating value (LHV) of MSW is increased. This means that lower amount of MSW input
could be utilized to produce the same amount of output energy. (The lower the moisture content,
the higher is the heating value) As a result, the gasifier with dryer system will effectively
generate a higher amount of energy to the Samutsakorn power plant at a lower input cost,
thereby, creating a saving cost of saved 2,695.7 baht per day with the breakeven point at 586
days after implementation.
In addition, this dryer design not only solves the real world problem from Samutsakorn
power plant but also took into consideration the financial aspect of the implementation of the
design. This includes the construction cost, operation cost, maintenance cost, as well as the
construction loan cost. Also, given the total cost and profit per day from implementing the
design, an exact breakeven point could be found to be 586 days.
Finally, this design is only in the beginning phase, further improvements could and need
to be made for the betterment of the system to increase efficiency as well as effectiveness of the
whole system for a better plant and thereby a better society, and a greener world. Lastly, I hope
my designs could be used as a basis for improving the gasifier worldwide.
1
CHAPTER 1
INTRODUCTION
Generally speaking, resource and energy are necessity to human’s daily life in term of
economy, environment and society not only for Thailand but also the world. Nowadays, in
Thailand, energy is mostly produced by using conventional resource called fossil fuels, or
fuel formed by natural resource such as anaerobic decomposition of buried dead organisms.
Realizing that these resources may run out in very near future, Thailand’s government has
supported the usage of renewable energy resources in order to increase the production of
alternative energy, alleviate the country’s fuel importation and reduce global warming.
Renewable energy is energy generated from natural resources which are naturally
replenished or in other words renewable for example as waste, geothermal heat, tide, water,
sunlight, wind, and biomass. Given the location and weather conditions of Thailand, some of
these options are not economically viable for producing energy. Thailand, however, is an
agricultural country; as such there are plenty of biomass and waste which can be used to
produce energy. (Global Status Report, Renewables 2011)
Biomass is biological material derived from living organisms and is considered to be
organic matter. Wastes on the other hand are the substances or objects which are disposed of
or are intended to be disposed of which can be divided into organic and inorganic matter such
as metal, glass and hydrocarbon compound. The organic matter and hydrocarbon compound
can be used to produce energy via the process called “gasification” and result in the product
called “syngas”. (Lynn and Judy Osburn, 1993)
Gasification is a process that converts carbonaceous materials, such as petroleum
biofuel and bi coal into carbon dioxide, methane, carbon monoxide, water vapor, hydrogen,
and other organic and inorganic gases etc. Such gas compositions are results from the
reactions of the raw material at elevated temperature with fixed quantity of steam and
oxygen. The byproduct from the mixture is synthesis gas or syngas and is by itself a
combustible fuels/ gases. In addition, gasification process can be started using materials that
are not fossil fuels such as organic waste or biomass. The process can be done by using
“gasifier”. (Klass, Donald L., 1998)
2
A gasifier is a machine in which the biomass or waste are fed into and burnt in the
shortage of oxygen process called reduction atmosphere. Although there are many types of
gasifier, improvement are still feasible in term of thermal efficiency, environmental concerns
and applications.
This study examines the feasibility of improving the thermal efficiency of the gasifier
by design a new fuel drying system before being fed into gasifier by using recovered waste
heat. The research will focus on a power plant which is located in existing landfill site in
Samutsakorn province, Thailand. The site has more than 500,000 tons of deposited waste and
more than 300 tons of municipal solid waste (MSW) added daily that need to be treated. The
plant is designed to produce an electrical power output 400 kW using combustible waste or
refuse derived fuel as fuel. Currently, the gasification process is used in the plant to generate
the electricity. In addition, gasifier is also used as a major part of gasification process; still
there are possibilities of further improvements in term of thermal efficiency and
environmental concerns which will be addressed within this thesis.
3
1.1 BACKGROUND
1.1.1 Background on Thailand’s Energy Consumption
1.1.1.1 Preface
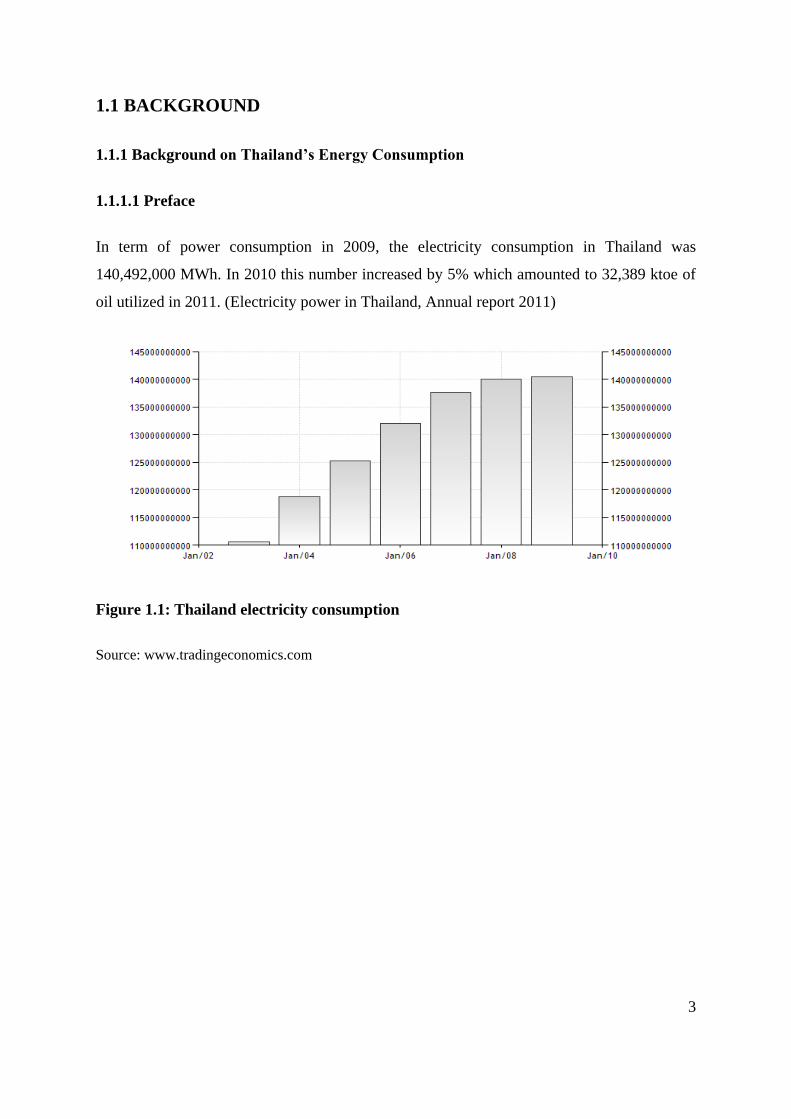
In term of power consumption in 2009, the electricity consumption in Thailand was
140,492,000 MWh. In 2010 this number increased by 5% which amounted to 32,389 ktoe of
oil utilized in 2011. (Electricity power in Thailand, Annual report 2011)
Figure 1.1: Thailand electricity consumption
Source: www.tradingeconomics.com
4
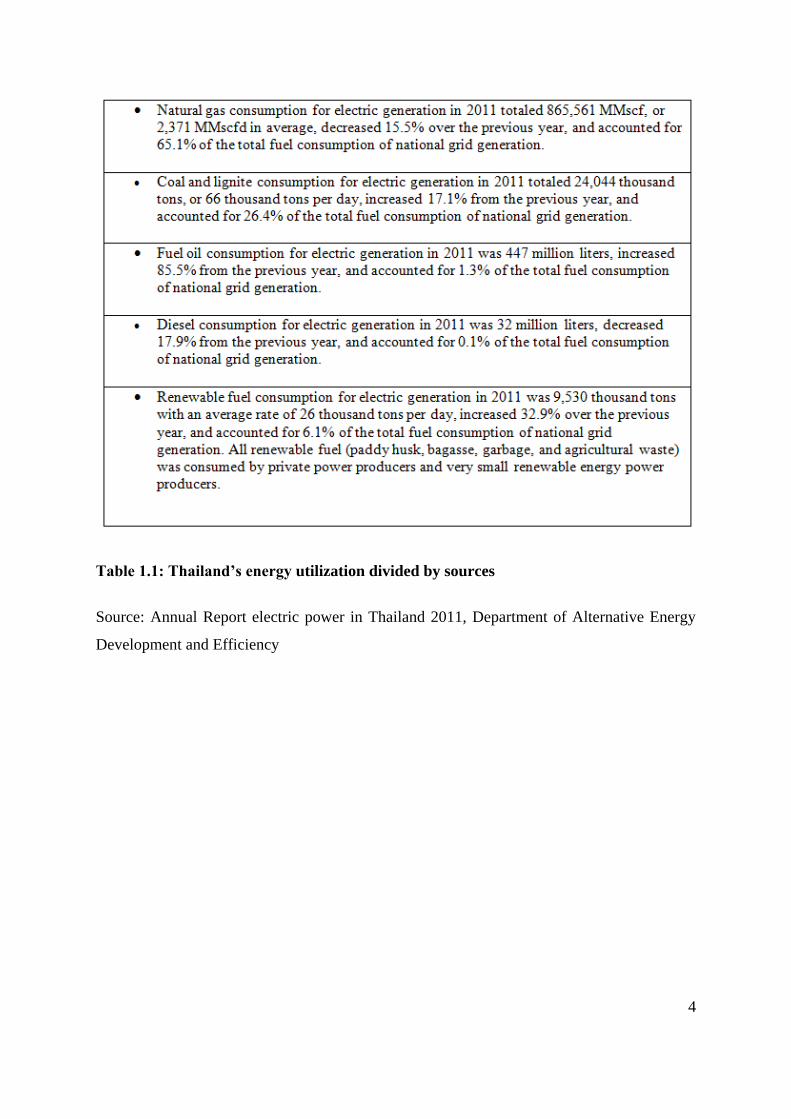
Table 1.1: Thailand’s energy utilization divided by sources
Source: Annual Report electric power in Thailand 2011, Department of Alternative Energy
Development and Efficiency

5
1.1.1.2 Power plant at Samutsakorn province.
Samutsakhon is one of the central provinces of Thailand. It is surrounded by Bangkok,
Ratchaburi, Nakhon Pathom, and Samut Songkhram provinces.
Figure 1.2: Map of Thailand highlighting Samutsakhon Province
Source: http://www.samutsakhon.go.th/index_n.htm
6
Area
• Total 872.3 km2 (336.8 sq mi)
Population (2011)
• Total 499,098
• Rank Ranked 53rd
Density 570/km2 (1,500/sq mi)
• Density rank Ranked 4th
Electricity consumption (2011) 6,953 GWh/year
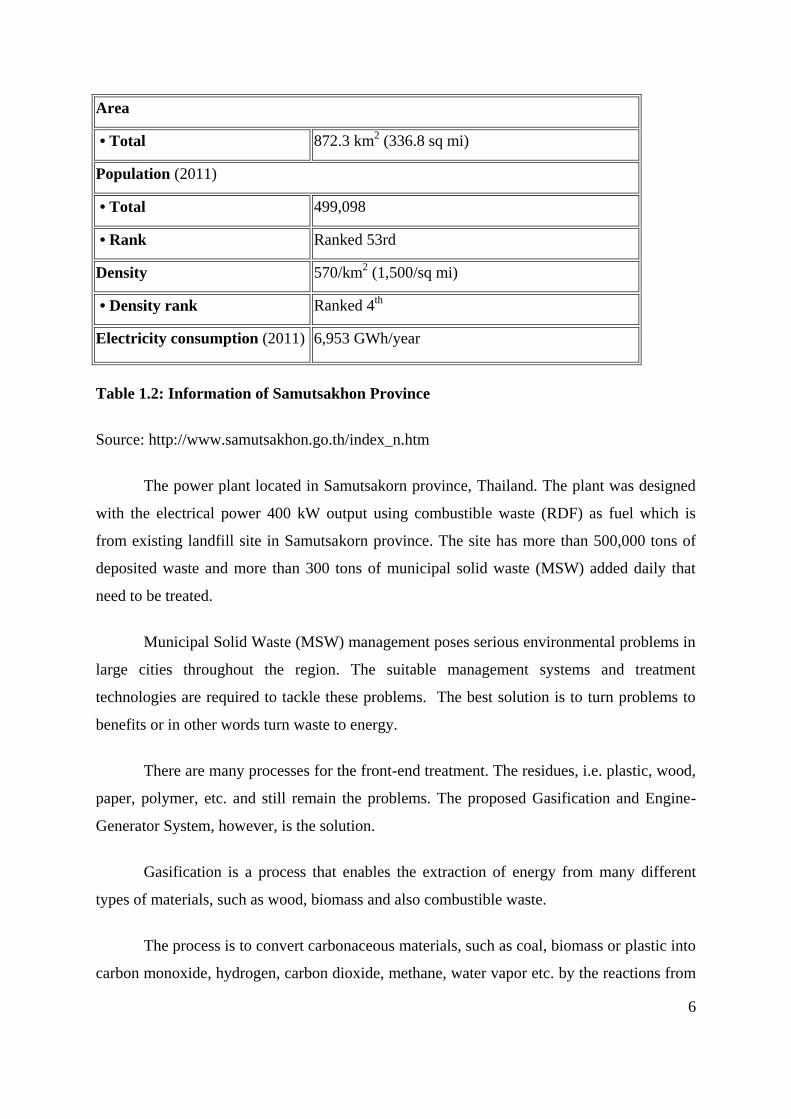
Table 1.2: Information of Samutsakhon Province
Source: http://www.samutsakhon.go.th/index_n.htm
The power plant located in Samutsakorn province, Thailand. The plant was designed
with the electrical power 400 kW output using combustible waste (RDF) as fuel which is
from existing landfill site in Samutsakorn province. The site has more than 500,000 tons of
deposited waste and more than 300 tons of municipal solid waste (MSW) added daily that
need to be treated.
Municipal Solid Waste (MSW) management poses serious environmental problems in
large cities throughout the region. The suitable management systems and treatment
technologies are required to tackle these problems. The best solution is to turn problems to
benefits or in other words turn waste to energy.
There are many processes for the front-end treatment. The residues, i.e. plastic, wood,
paper, polymer, etc. and still remain the problems. The proposed Gasification and Engine-
Generator System, however, is the solution.
Gasification is a process that enables the extraction of energy from many different
types of materials, such as wood, biomass and also combustible waste.
The process is to convert carbonaceous materials, such as coal, biomass or plastic into
carbon monoxide, hydrogen, carbon dioxide, methane, water vapor etc. by the reactions from
7
the raw material at high temperature with a controlled amount of oxygen. The resulting gas
mixture is called synthesis gas or syngas and is itself a fuel. (Beychok, Coal gasification and
the Phenosolvan process)
1.1.2 Background on the gasification
1.1.2.1 The definition of gasification
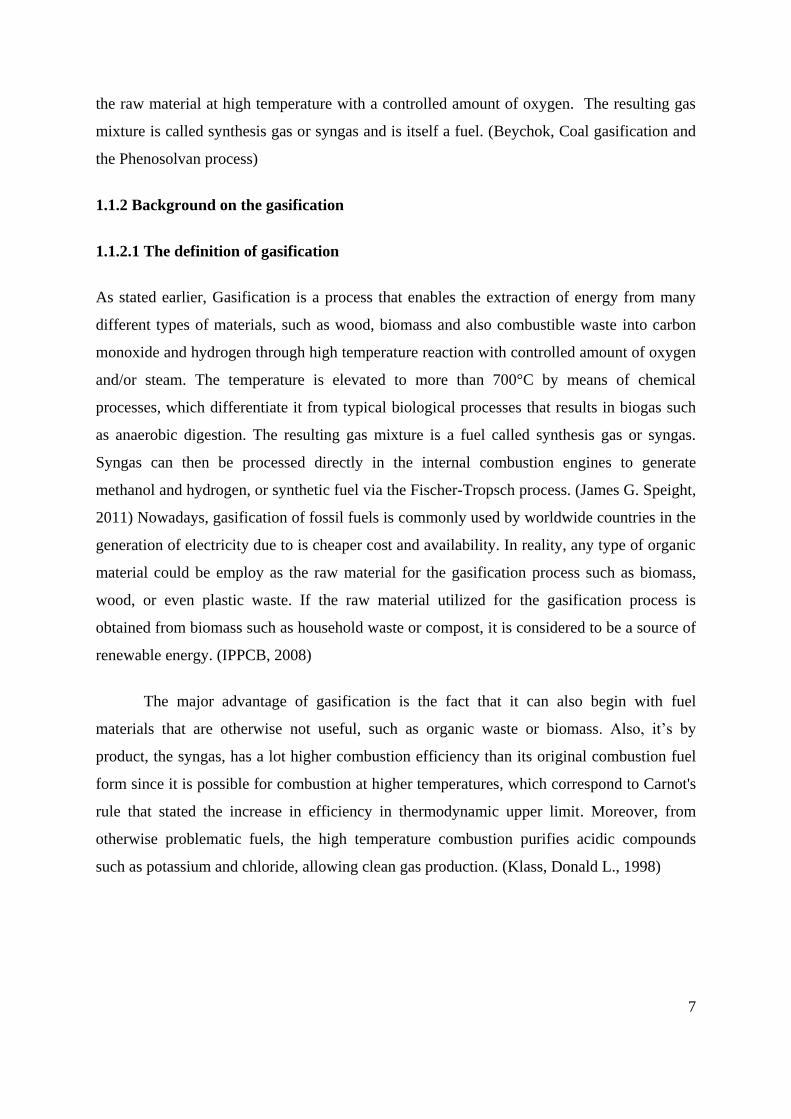
As stated earlier, Gasification is a process that enables the extraction of energy from many
different types of materials, such as wood, biomass and also combustible waste into carbon
monoxide and hydrogen through high temperature reaction with controlled amount of oxygen
and/or steam. The temperature is elevated to more than 700°C by means of chemical
processes, which differentiate it from typical biological processes that results in biogas such
as anaerobic digestion. The resulting gas mixture is a fuel called synthesis gas or syngas.
Syngas can then be processed directly in the internal combustion engines to generate
methanol and hydrogen, or synthetic fuel via the Fischer-Tropsch process. (James G. Speight,
2011) Nowadays, gasification of fossil fuels is commonly used by worldwide countries in the
generation of electricity due to is cheaper cost and availability. In reality, any type of organic
material could be employ as the raw material for the gasification process such as biomass,
wood, or even plastic waste. If the raw material utilized for the gasification process is
obtained from biomass such as household waste or compost, it is considered to be a source of
renewable energy. (IPPCB, 2008)
The major advantage of gasification is the fact that it can also begin with fuel
materials that are otherwise not useful, such as organic waste or biomass. Also, it’s by
product, the syngas, has a lot higher combustion efficiency than its original combustion fuel
form since it is possible for combustion at higher temperatures, which correspond to Carnot's
rule that stated the increase in efficiency in thermodynamic upper limit. Moreover, from
otherwise problematic fuels, the high temperature combustion purifies acidic compounds
such as potassium and chloride, allowing clean gas production. (Klass, Donald L., 1998)
8
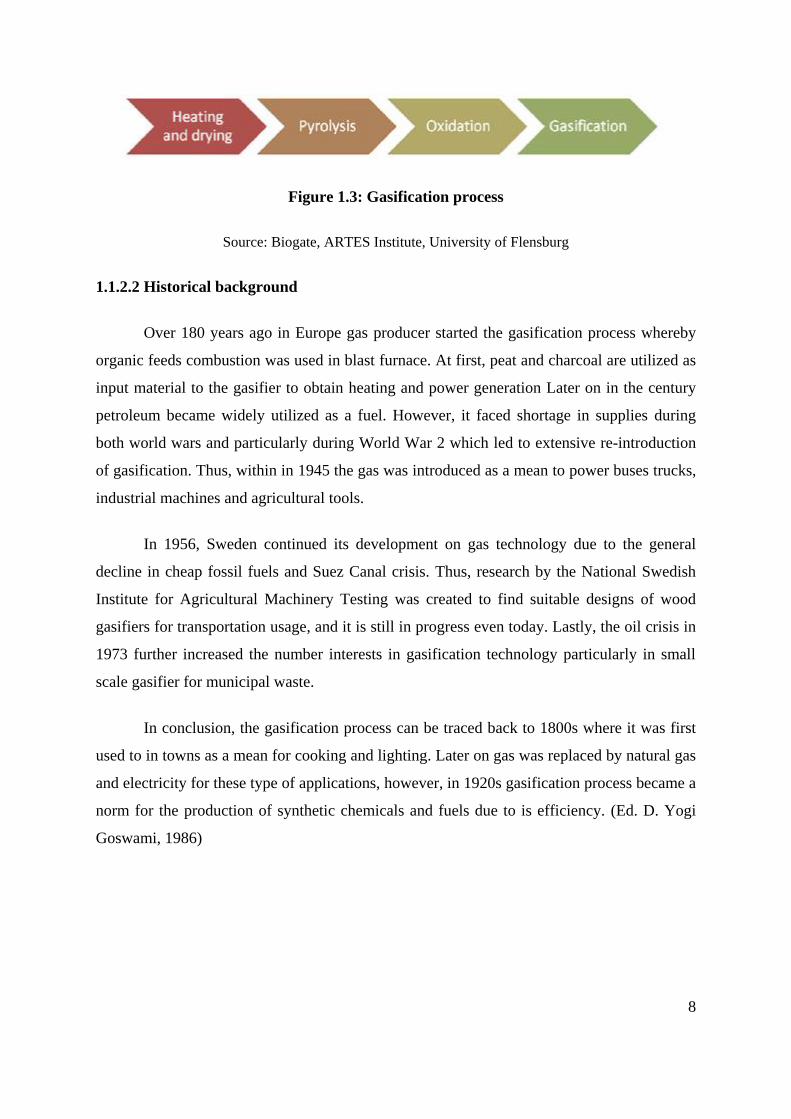
Figure 1.3: Gasification process
Source: Biogate, ARTES Institute, University of Flensburg
1.1.2.2 Historical background
Over 180 years ago in Europe gas producer started the gasification process whereby
organic feeds combustion was used in blast furnace. At first, peat and charcoal are utilized as
input material to the gasifier to obtain heating and power generation Later on in the century
petroleum became widely utilized as a fuel. However, it faced shortage in supplies during
both world wars and particularly during World War 2 which led to extensive re-introduction
of gasification. Thus, within in 1945 the gas was introduced as a mean to power buses trucks,
industrial machines and agricultural tools.
In 1956, Sweden continued its development on gas technology due to the general
decline in cheap fossil fuels and Suez Canal crisis. Thus, research by the National Swedish
Institute for Agricultural Machinery Testing was created to find suitable designs of wood
gasifiers for transportation usage, and it is still in progress even today. Lastly, the oil crisis in
1973 further increased the number interests in gasification technology particularly in small
scale gasifier for municipal waste.
In conclusion, the gasification process can be traced back to 1800s where it was first
used to in towns as a mean for cooking and lighting. Later on gas was replaced by natural gas
and electricity for these type of applications, however, in 1920s gasification process became a
norm for the production of synthetic chemicals and fuels due to is efficiency. (Ed. D. Yogi
Goswami, 1986)
9
1.1.2.3 Gasification process
For commercial usage, there are four possible types of gasifier that are currently
available in today’s market: co-current-fixed-bed, counter-current fixed bed, fluidized bed,
and entrained flow.
1. The counter-current-fixed-bed gasifier is composed of a fixed bed of carbonaceous fuel
such as biomass or coal, through which air, steam, and/or oxygen flows through in a counter-
clockwise direction. The ash is either removed from the dry’s bottom as a slag. The process
of the gasifier denotes that high mechanical strength is needed in the fuel in order for it to
form a permeable bed. Thus, output of this gasification process is small; however, the
efficiency thermal energy is elevated. This means the methane and tar produced is highly
substantial at normal operating temperatures, or in other words, the syngas needed be purified
prior to utilization. (Kamka, Frank; Jochmann, Andreas, 2005)
2. The co-current-fixed-bed gasifier is comparable to the Counter-Current-Fixed-Bed
Gasifier, with the exception that oxygen flows downwards. Heat is added to the upper part of
the bed through form combustion with small amounts of injected fuel and/or external heat
sources. As a result, the produced gas leaves the gasifier at soaring temperature whereby the
excess heat is transferred to the gasification agent and added to top of the bed. This results in
similar energy efficiency to the Counter Current method. However, in this configuration, tars
travels through a hot bed of char; thus, the levels of tar are much lower than Counter Current
gasification. Thus, the overall gasification process has lower overall efficiency since a high
amount of heat content is carried over by the hot gas.(Clarke, 1981; Reed and Das, 1988).
3. In the fluidized-bed reactor, the fuel is fluidized in steam and air or oxygen. The fuels
therefore have to be highly reactive since their operating temperature is much lower. This
means that low-grade coals are particularly suitable. However, the efficiency of conversion
could be rather low due to elutriation of carbonaceous material. The fixed bed gasifiers are
suitable for small-scale applications (<10MWth) and the fluidized bed configurations are cost
effective in large-scale applications that generate over 15 MWe (Barker, 1996; Carlos, 2005;
VTT, 2002 and Rajvanshi, 1986, Sims, 2003).
10
4. As for the entrained-flow gasifier, a liquid fuel and/or a dry-pulverized solid fuel is
gasified with oxygen in co-current flow. The gasification process happens in a dense cloud of
very fine particles. Most coals are suitable for entrained-flow gasifiers because of its particles
are well separated from one another at high operating temperatures. By utilizing high
pressures and temperatures, elevated result of the product can be achieved. Nevertheless
thermal efficiency of this type of process is reduced since the gas has to be cooled before it
can be purified with existing technology. The high temperatures in this gasification process
mean that methane and tar are not present in the produced gas. Still, more oxygen is required
when compared with the other types of gasifiers. (James G. Speight, 2011)
11
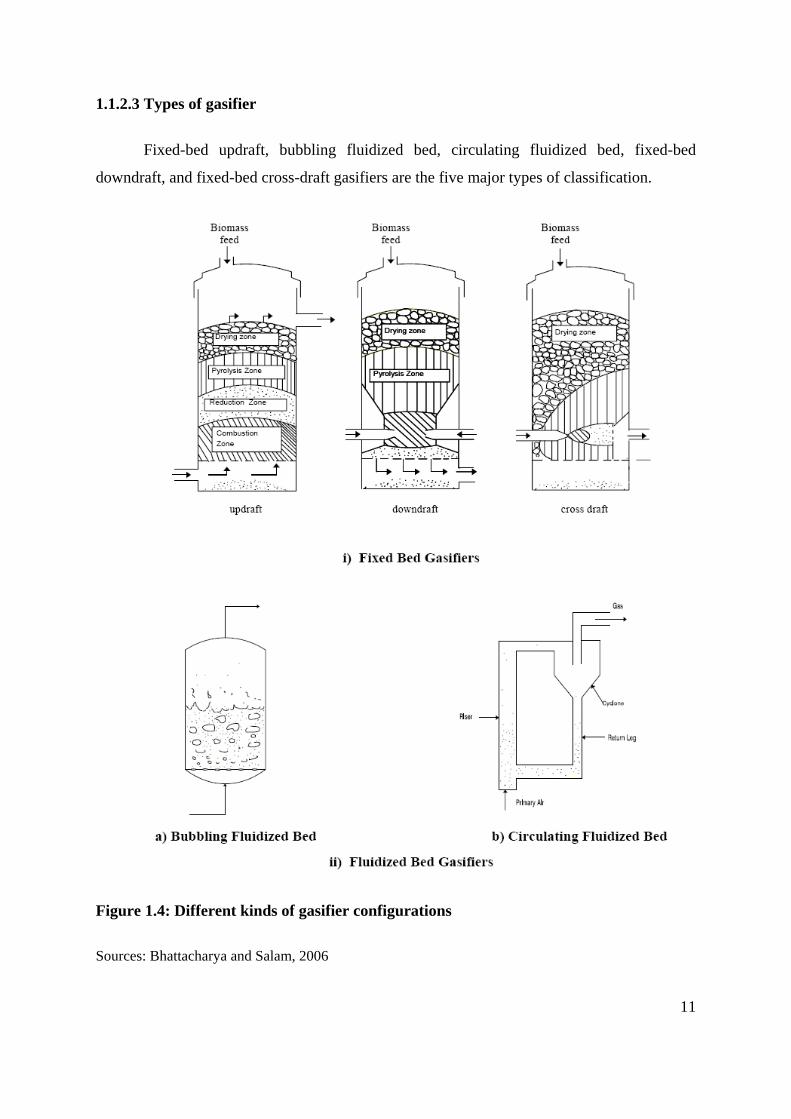
1.1.2.3 Types of gasifier
Fixed-bed updraft, bubbling fluidized bed, circulating fluidized bed, fixed-bed
downdraft, and fixed-bed cross-draft gasifiers are the five major types of classification.
Figure 1.4: Different kinds of gasifier configurations
Sources: Bhattacharya and Salam, 2006
12
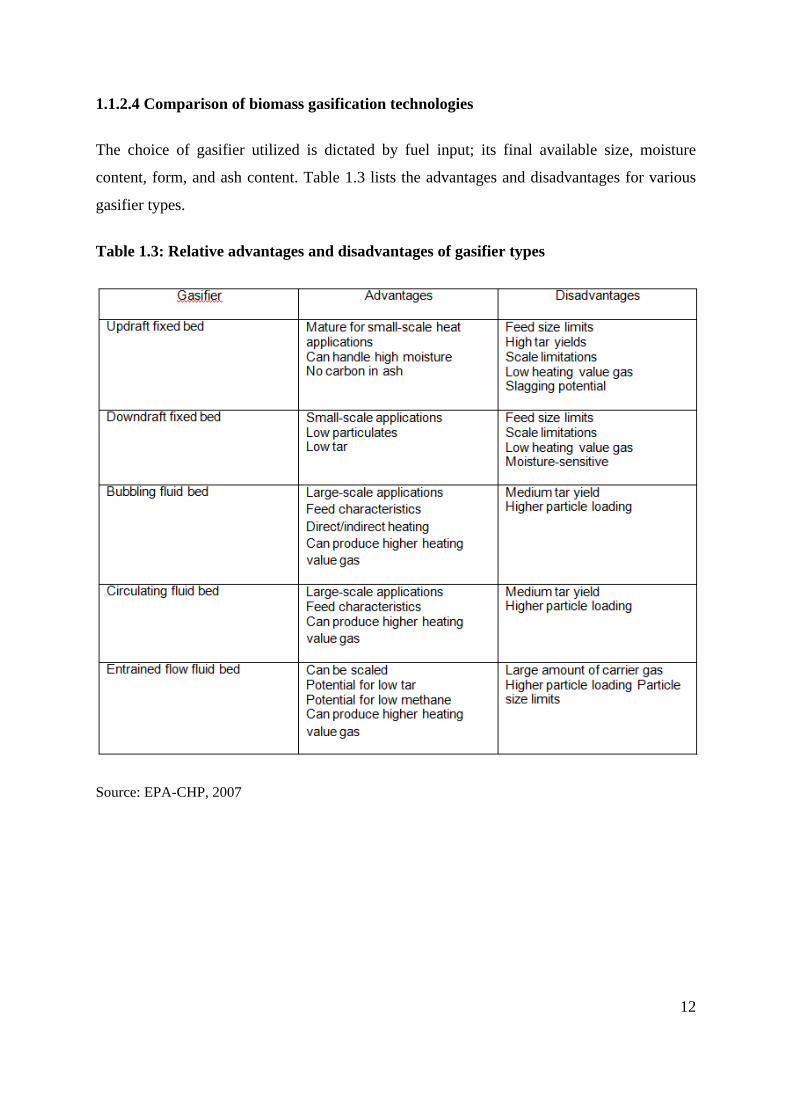
1.1.2.4 Comparison of biomass gasification technologies
The choice of gasifier utilized is dictated by fuel input; its final available size, moisture
content, form, and ash content. Table 1.3 lists the advantages and disadvantages for various
gasifier types.
Table 1.3: Relative advantages and disadvantages of gasifier types
Source: EPA-CHP, 2007
13
1.1.3 Background on energy from waste
1.1.3.1 Waste
Waste is classified into 3 categories as the followings:-
1. Municipal Solid Waste (MSW)
2. Industrial or Hazardous Waste
3. Hospital Waste
Our concern is to deal with MSW only. MSW is composed of the followings, (see Appendix
A3)
- Organics 50 %
- Inerts 10 %
- Recycles 10 %
- Combustibles 30 %
When mention about MSW, we should consider 2 issues:-
1. Fresh MSW
2. Landfilled MSW
Presently the suitable MSW treatment for the oriental people like Chinese or Thai is
conceptually agreed as the diagram below.
14
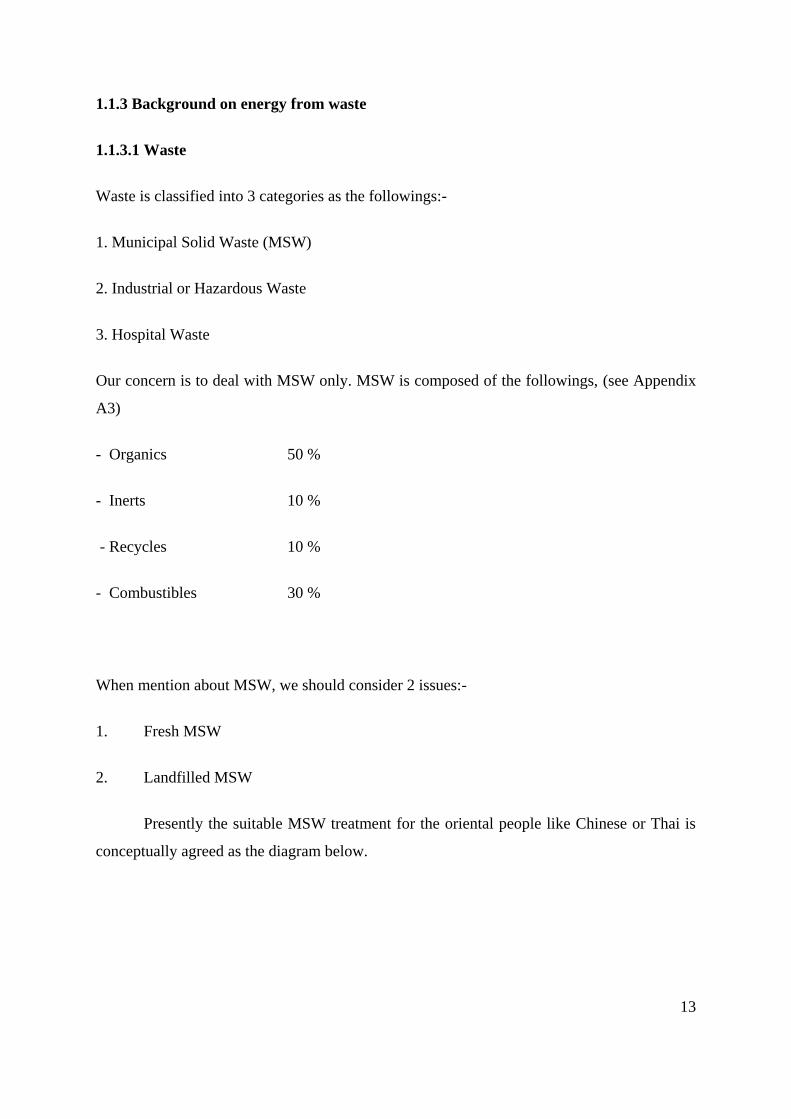
Figure 1.5: The diagram of suitable MSW treatment for Thailand
Source: Waste management, Department of Alternative Energy Development and Efficiency
For the first stage, I will confine myself to tackle the problem of land filled and
composted MSW treatment only.
Major city has encountered problem of garbage and waste management. Landfills and
dump sites are commonly used to solve and manage municipal waste after collection. The use
of landfills and dump sites are now starting to create environmental problems with the people
in the community which strongly started to reject such methods.
The objectives of this proposed waste management system are to recover waste into
useful benefits such as recycles, and refuse derived fuel (RDF). Recycles are utilized in the
proper means accordingly. RDF is processed through our gasification and engine-generator
system. The outcome is electricity.
The system can minimize utilization of landfills and minimize environmental
problems.
Fresh MSW
Composting Composted MSW
Sorting RDF
Gasification &
Engine-Generator
System
Electricity
Landfilled MSW
Recycles
15
1.1.3.2 Energy from Waste
Energy recovering from waste is of my interest. My process technology is to
rehabilitate the existing landfill sites and composted waste to get the combustible residues
which technically called refuse derived fuel (RDF).
The gasification process technology which has been developed by our technical
experts is successfully using RDF to produce syngas or fuel gas.
Syngas from the gasification process contains mainly carbon monoxide, hydrogen and
methane which are theoretically considered as fuel in gaseous phase.
The obtained Syngas could be divided into 2 types of generated energy.
Type 1: Heat or thermal energy of the syngas itself that is obtained directly from burner
systems.
Type 2: Electrical energy is obtained after using the syngas as fuel in the internal combustion
gas engine to generate electricity.
The exhaust emission contains mainly carbon dioxide and water vapor which are not
toxic and meet the emission control standards.
1.1.3.3 Waste to Energy (Electricity) Process
Using combustible waste (RDF) as fuel by processing it through gasification and
engine-generator system, we can get the electricity as the following schematic diagram.
16
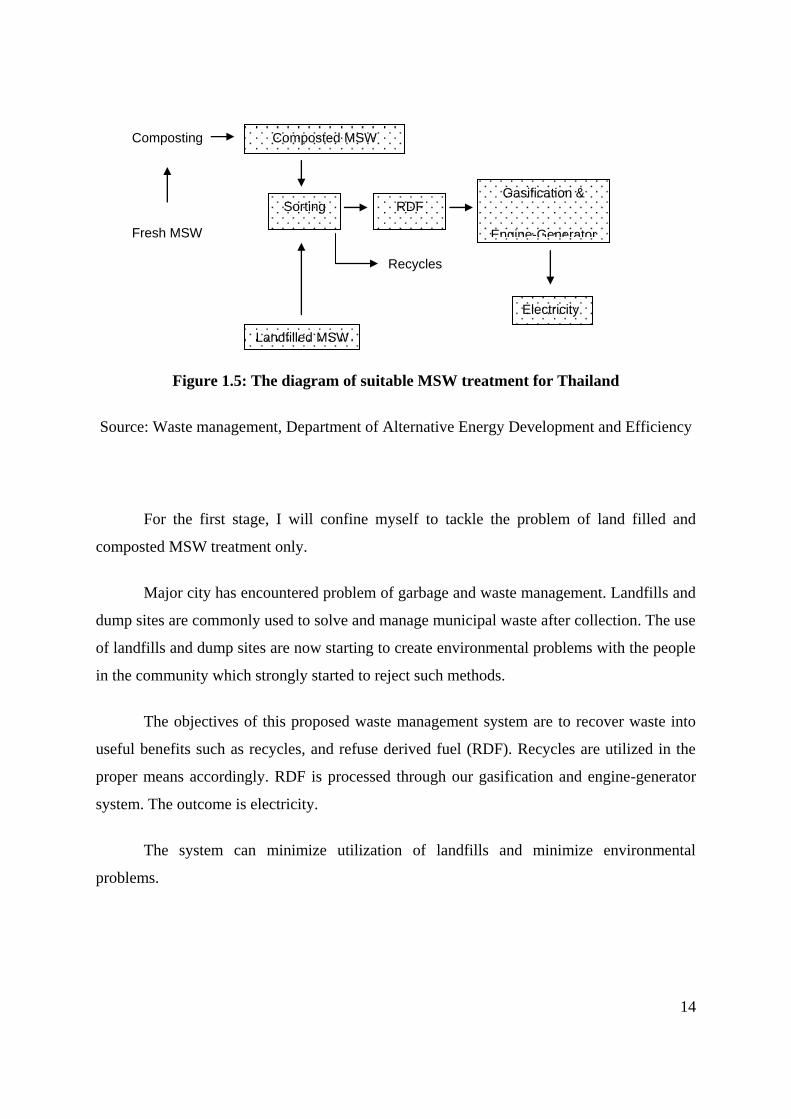
Figure 1.6: The schematic diagram show the process of electricity production
Source: Waste management, Department of Alternative Energy Development and Efficiency
From schematic, there are 3 steps in the process as the following items:-
1. Fuel preparation
Combustible waste (RDF) from the rehabilitation process such as plastic residue,
wood, paper, cloth, polymer and etc. will be shredded to 5-10 mm in size. Moisture content
is controlled less than 20%. Then it is ready for use as fuel.
2. Gasification
Fuel is fed to gasifier and burnt in the shortage of oxygen process which technically
called reduction atmosphere. Burning temperature is 500-750˚C. The combustion product is
syngas which contains mainly carbon monoxide and hydrogen gases.
Tar and dust of syngas are removed in the cyclones and wet scrubbers. The syngas
temperature is also cooling down here. Then the clean and cool syngas is ready for use.
3. Electricity generation
Clean and cool syngas from step 2 is fed to specially design internal combustion gas
engine-generator set for producing electricity. Internal power consumption for the plant is
about 5% the rest could be utilized or sold commercially to the power grid as desired.
RDF (fuel) Gasification Set
Scrubbing Water
Engine&
Generator
Cooling Water
Exhaust
Electricity
17
There are 2 matters to be concerned regarding to the environmental regulations below:
1. Water
1.1 For gas cleaning process
- Tar and fine dust laden gas will be removed in the wet scrubbers as they counter flow
through spray water.
- Colloidals in contaminated water from wet scrubbers are precipitated in the sediment pond.
The clean water after precipitation shall be re-circulated and sprayed in the wet scrubbers
continuously.
- Neutralization in the sediment pond is to be chemically controlled and the sediments need to
be removed periodically.
- A small amount of fresh water is sometimes refilled to replace evaporation.
- The above described process is a closed system. Therefore, no polluted water emits to
surrounding.
1.2 For engine cooling
- To cool down the engine temperature to a normal condition.
- The water is a closed loop circulated in the cooling pond.
2. Exhaust
Exhaust from the gas engine set contains carbon dioxide (CO2) and water (H2O) like
the exhaust coming from vehicles on the road which meets the environmental regulations.
In conclusion, no water is emitted to surrounding. The emitted exhaust from engine is
like from vehicles.
18
1.1.3.4 Process Technology
The process to convert combustible waste to energy by gasification and engine-
generator system can be described below.
RDF (Fuel) is combustible waste which can exist in the forms of organic material
such as rice husk, wood, etc. or inorganic material such as plastic, cloth, etc. Every fuel
contains the same elements as C, H, O, N and S but different in molecular forms. For
examples; C, H, O , N and S in wood has a cellulose form but C, H, O , N and S in plastic has
a polymer or polyolefin form.
RDF (Fuel) with proper size and moisture content is fed through the gasification
process to get synthesis gas. The reaction is incomplete combustion i.e., the supplied amount
of air is only 20-30% of stoichiometry. The out coming is syngas or fuel gas which contains
CO, H2, CH4, CO2, H2O and N2.
The chemical reaction can be derived as the followings
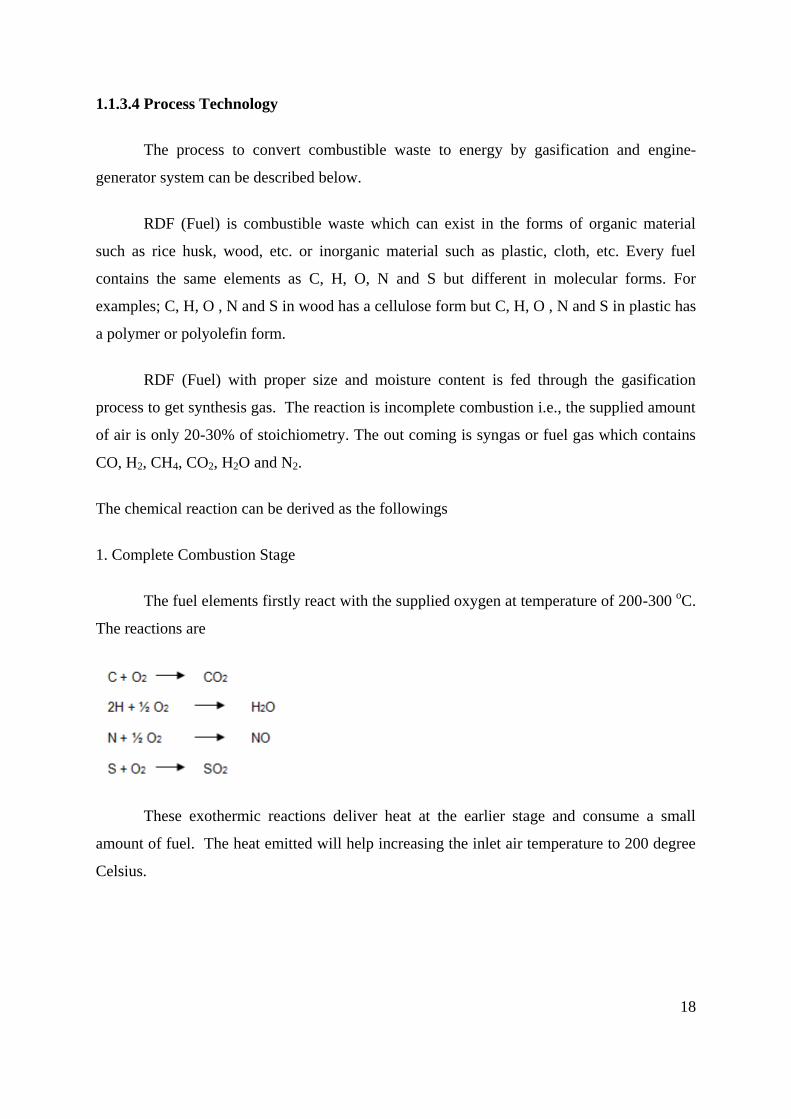
1. Complete Combustion Stage
The fuel elements firstly react with the supplied oxygen at temperature of 200-300 oC.
The reactions are
These exothermic reactions deliver heat at the earlier stage and consume a small
amount of fuel. The heat emitted will help increasing the inlet air temperature to 200 degree
Celsius.
19
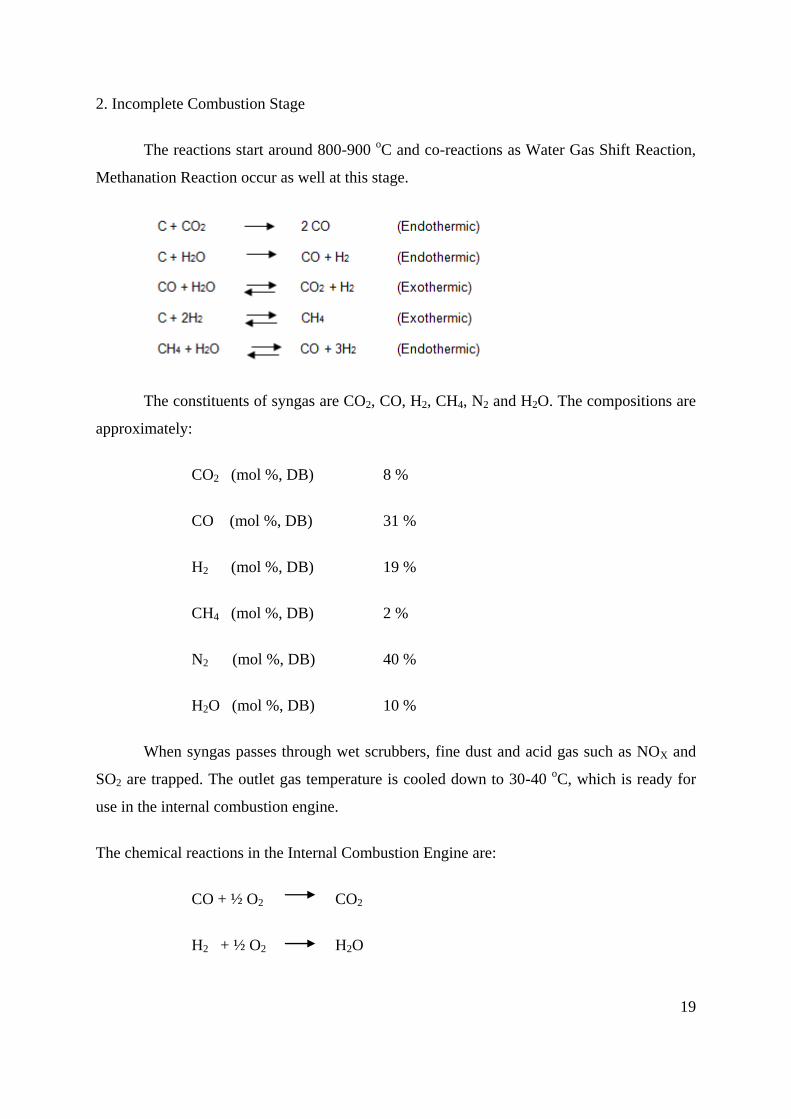
2. Incomplete Combustion Stage
The reactions start around 800-900 oC and co-reactions as Water Gas Shift Reaction,
Methanation Reaction occur as well at this stage.
The constituents of syngas are CO2, CO, H2, CH4, N2 and H2O. The compositions are
approximately:
CO2 (mol %, DB) 8 %
CO (mol %, DB) 31 %
H2 (mol %, DB) 19 %
CH4 (mol %, DB) 2 %
N2 (mol %, DB) 40 %
H2O (mol %, DB) 10 %
When syngas passes through wet scrubbers, fine dust and acid gas such as NOX and
SO2 are trapped. The outlet gas temperature is cooled down to 30-40 oC, which is ready for
use in the internal combustion engine.
The chemical reactions in the Internal Combustion Engine are:
CO + ½ O2 CO2
H2 + ½ O2 H2O
20
CH4 + 2O2 CO2 + 2H2O
They are complete combustion reactions. Fuel reacts with oxygen in the air giving
CO2 and H2O before leaving exhaust stack to environment without toxicants.
The water system for use in the wet scrubbers is a close loop design. No polluted
water goes out to harm the surrounding.
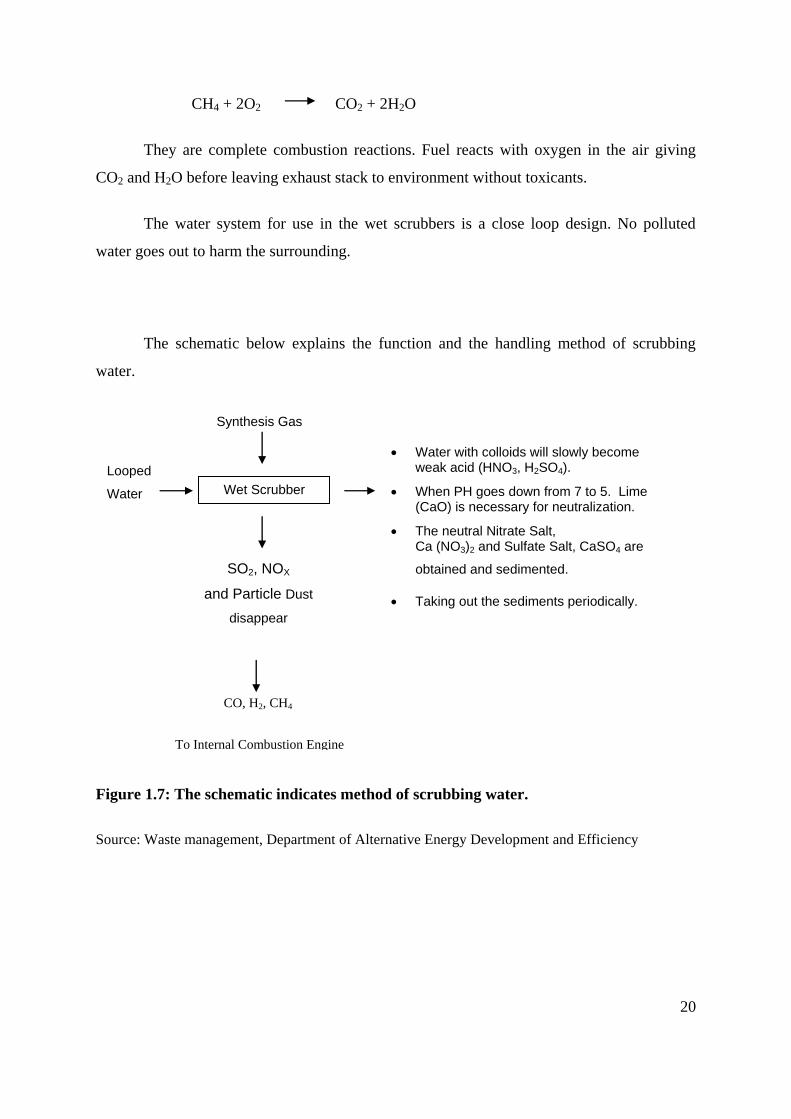
The schematic below explains the function and the handling method of scrubbing
water.
Figure 1.7: The schematic indicates method of scrubbing water.
Source: Waste management, Department of Alternative Energy Development and Efficiency
Synthesis Gas
Looped
Water Wet Scrubber
SO2, NOX
and Particle Dust
disappear
CO, H2, CH4
To Internal Combustion Engine
Water with colloids will slowly become weak acid (HNO3, H2SO4).
When PH goes down from 7 to 5. Lime (CaO) is necessary for neutralization.
The neutral Nitrate Salt, Ca (NO3)2 and Sulfate Salt, CaSO4 are
obtained and sedimented.
Taking out the sediments periodically.
21
1.1.3.5 Conclusion
Waste is the major problem of each community. The above-described gasification and
engine-generator system is accepted to be a proven and realistic technology. This system can
help solving the problems effectively and beneficially.
Syngas, as a fuel can be beneficially utilized by 2 ways:
1. To generate the heat through gasification systems.
2. To generate the electricity through the gasifier and engine-generator system.
My purposes reflect the principles and the implementation procedures of turning
waste to energy (electricity) by the gasification and engine-generator system which is the
profitable solutions.
22
1.2 OBJECTIVE
To design a dryer system that recovers waste heat (hot fuel gas heat) from the internal
gas engine to dry the exiting MSW and reduce their moisture content.
Research Questions: What type of dryer should I use?
- What should be my dryer dimension?
- What is type of material should I use?
- What are the specification of the bower and damper?
How much energy is needed to dry the MSW?
- What is the needed temperature output?
- How much hot fuel gas should I use?
- What is the right mass flow rate of the mixed gas?
- What velocity should mixed gas flow?
What is the total cost of the dryer system?
- What is the operating cost?
- What is the maintenance cost?
- What is the construction cost?
- What is my loan cost?
- When is the breakeven point?
- What is the profit from implementing the dryer system?
23
1.3 EXPECTED OUTCOMES
What type of dryer should I use?
We have been able to find the most suitable type, size and material of dryer to reduce the
moisture of the MSW from 50% to 20%.
How much energy is needed to dry the MSW?
In term of thermal efficiency, we have been able to utilize the correct mixture of air and
recovered waste heat gas to dry the MSW to the expected moisture content and temperature.
Also, the correct mass flow rate and velocity of the mixed gas was found to implement the
safety factor for the dryer.
What is the total cost of the dryer system?
As designed, the new design of the dryer has generated a cost saved for the power plant. The
financial cost saved also took into account the construction cost, operation cost, maintenance
cost, as well as the construction loan cost. Given the total cost and profit per day from
implementing the design, an exact breakeven point could be found.
24
1.4 SCOPE OF WORK
The project emphasizes on the study of feasible improvement on thermal efficiency of
the existing gasifier by design new fuel drying system before being fed into gasifier by
recovered waste heat from internal gas engine. The existing gasifier that we use to do the
project is a part of the power plant located in Samutsakorn province, Thailand. The plant was
designed with the electrical power 400 kW output using combustible waste (RDF) as fuel. So,
this project is to use the plant as a case study. Then, I do the calculations base on the
collected data by using knowledge of thermodynamic and heat transfer. After that, the
feasible improvement will be analyze whether it worth for economic and environmental point
of view.
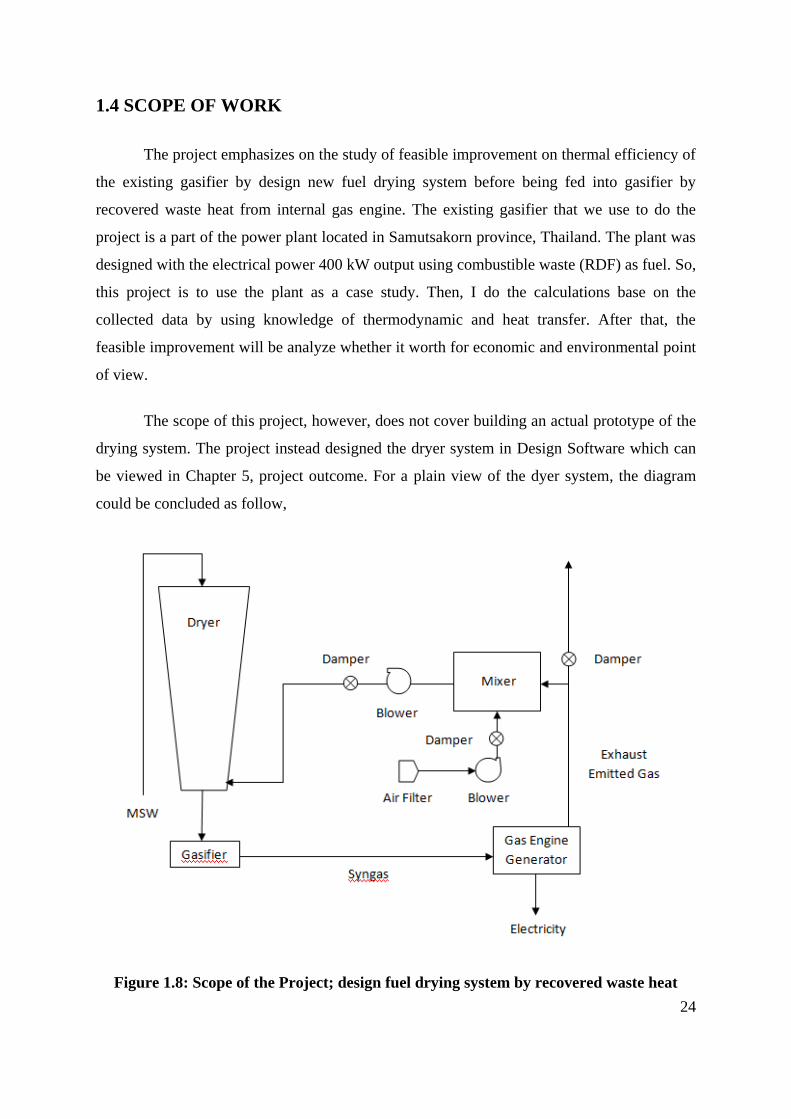
The scope of this project, however, does not cover building an actual prototype of the
drying system. The project instead designed the dryer system in Design Software which can
be viewed in Chapter 5, project outcome. For a plain view of the dyer system, the diagram
could be concluded as follow,
Figure 1.8: Scope of the Project; design fuel drying system by recovered waste heat
25
1.5 METHODOLOGY
There are 7 Steps:
1. Introduction and background on the power plant at Samutsakorn province.
2. Literature review: Find information and study prior researches and articles done on this
topic and speculate which research topics can further be studied and developed. Some
examples of topics are as the followings,
- Design a gasifier and material selection, basic on gasifier information.
- Dryer system with gasifier and other applications.
- Effects of relative humidity on thermal efficiency of gasifier.
- Applications on waste heat recovered system.
3. In literature review, it’s shown that there are many ways to improve the thermal efficiency
such as reduction of length along process, insulated gasifier, useful dryer, etc. Thus, this step
is to select the right type of dryer for our design. The criteria of choosing the dryer type are
done through the decision matrix whose factors and weights are jointly decided by the CEO,
chief operating officers and me.
4. Collect necessary information and data at the power plant: Visit the plant to study the
overall process and equipments, in order to investigate and collect the general information
concerning with the drying system. Also, the information on internal gas engine such as hot
flue gas temperature and flow rate are collected.
- Analyze the obtained data and information to calculate and design the dryer system (i.e. fuel
drying system by using recovered waste heat) to improve the thermal efficiency of the
gasifier by reducing the MSW from 50% to 20%.
- Analyze whether our designed improvement is worth for construction based on economic
and environmental concern.
26
5. Project outcome: After all analysis and calculation, this will show you a real figure of this
project in term of
- Engineering part (including CAD)
- Financial part in which construction cost, operation cost, maintenance cost, as well as the
construction loan cost were calculated. By adding all the cost together we get “Total Cost.”
After that, we calculated the “Cost Saved” from implementing the Dryer System by finding
the reduced amount of MSW needed for the same amount of energy produced. Thus, given
the total cost and profit per day from implementing the design, an exact breakeven point of
the implementation could be found.
6. Discussion: Since the power plant used as the case study is a real pioneer plant, there
normally might be some problems to discuss.
7. Final conclusion
27
CHAPTER 2
LITERATURE REVIEW
2.1 GASIFIER: Gasifier for damp fuel
Fluid fuels such as oil are a lot better-quality than producer gas. However, their
supplies are limited and decreasing every day. Thus, we have to resources ourselves to
producer gas through industry gasifiers for future economic sustainability. Thus, it is in our
best interest to be motivated in the development, research, and, betterment of gasifiers (Rui
Xiao, Mingyao Zhang, Baosheng Jin, and, Yaji Huang, 2006).
2.1.1 Previous attempts with wet wood
Recent development has shown us that gas produced from coal has been substituted
by wooden gas. In this matter, experience has also taught us that it typically more
economically beneficial to use raw and unrefined fuel than its converted quality fuel form
because the efficiency gained from quality fuel normally does not match the costs and
complications associated with the refinement process.
To improve the efficiency of this process, a variety of techniques have been created.
Since the fuel quality is equivalent to the temperature in the combustion/reaction zone, heat
recapturing technology has been developed to recapture lost away heat and utilized to preheat
the fuels.
One such method of removing moisture from the fuel is to condense stream from the
fuels in advance. In such process, the top part of the gasifier is left unheated so that the
moisture could be condensed and transported to separate compartment. In theory, this
methodology to pre-heat the fuel is sound. However, wooden gasifiers is not capable of
working with damp fuels, thus it has always been commonly perceived as impossible
especially with car gasifiers. (Yaji Huang, 2006).
28
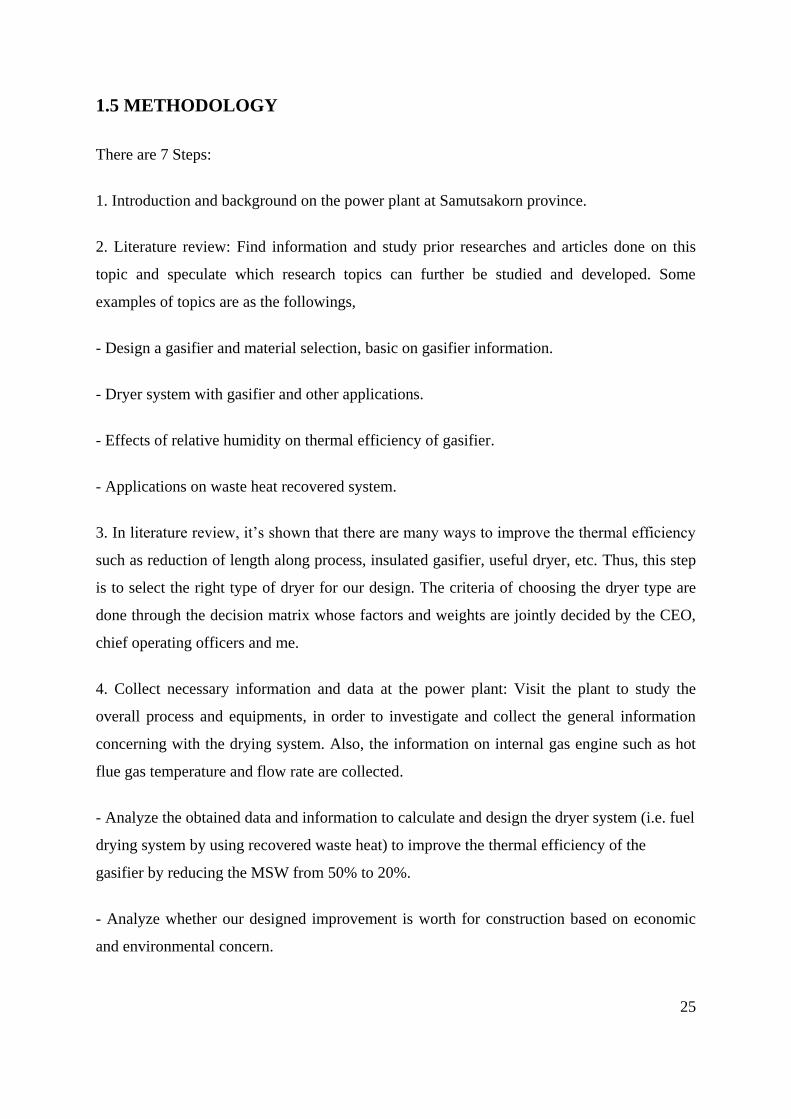
Figure 2.1: Copper Mill Gasifier at Outokumpu.
Source: Prof.Harald Kyrklund, 2000
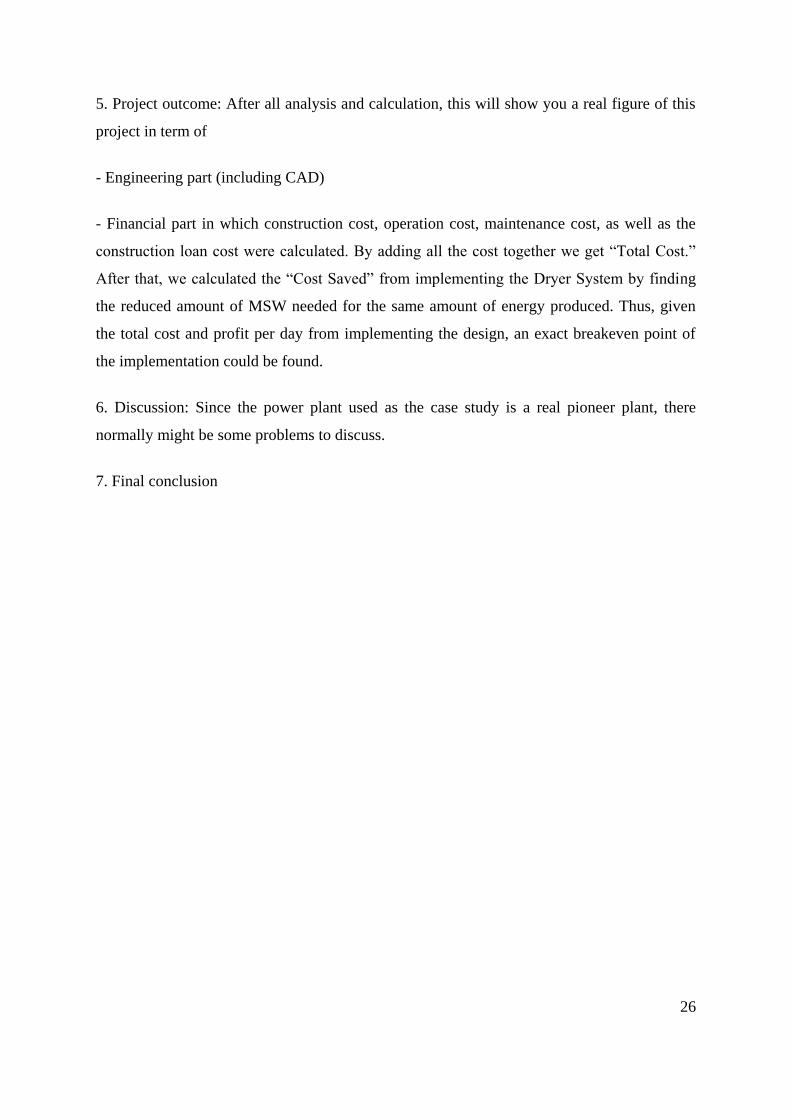
Still research around this problem is conducted all over the world to overcome this
“impossibility.” As a result, a large, stationary, gasifier was built at Outokumpu copper mill
at Vuoksenniska. Its fuel’s container was attached with a spray condenser, which pumped out
the moisture and thus, dryings the fuel in the process. By this method, completely damp wood
could be utilized as fuel; however, the condenser had to have adjustable valve that allows
permanent gases to be expelled. Else, its condensing capabilities would become deficient and
the quality of the gas would become too low.
Source: Prof.Harald Kyrklund, 2000
29
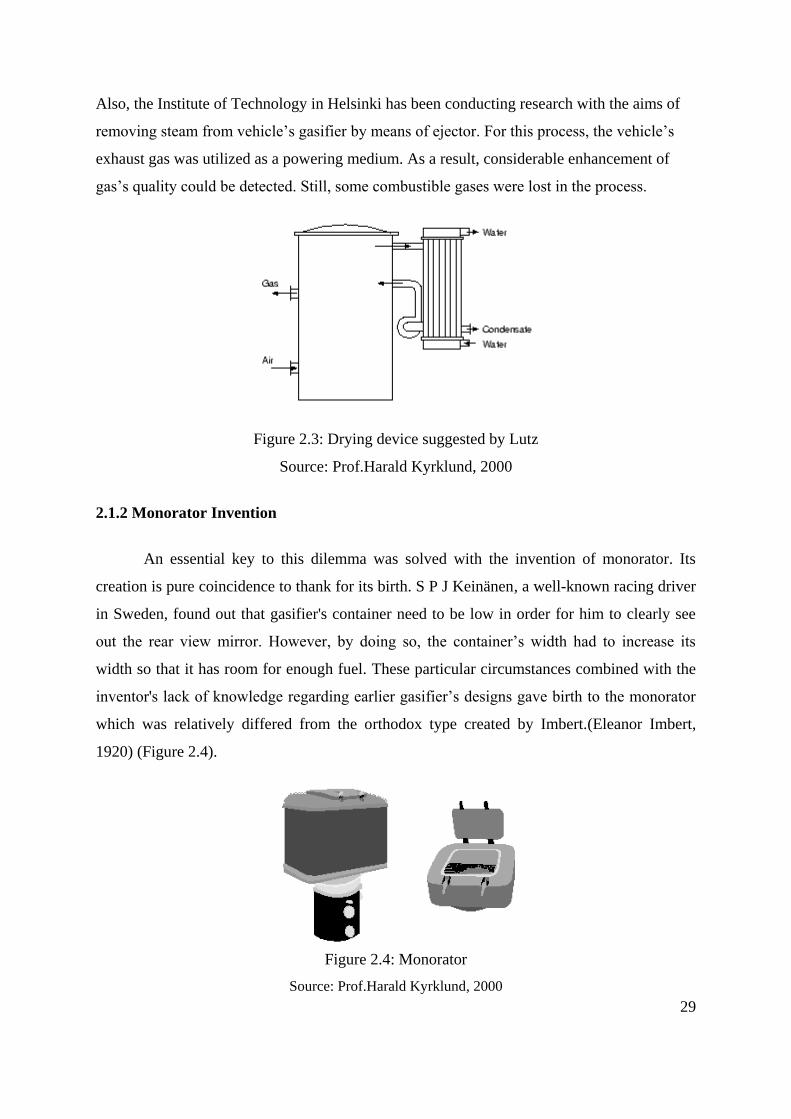
Also, the Institute of Technology in Helsinki has been conducting research with the aims of
removing steam from vehicle’s gasifier by means of ejector. For this process, the vehicle’s
exhaust gas was utilized as a powering medium. As a result, considerable enhancement of
gas’s quality could be detected. Still, some combustible gases were lost in the process.
Figure 2.3: Drying device suggested by Lutz
Source: Prof.Harald Kyrklund, 2000
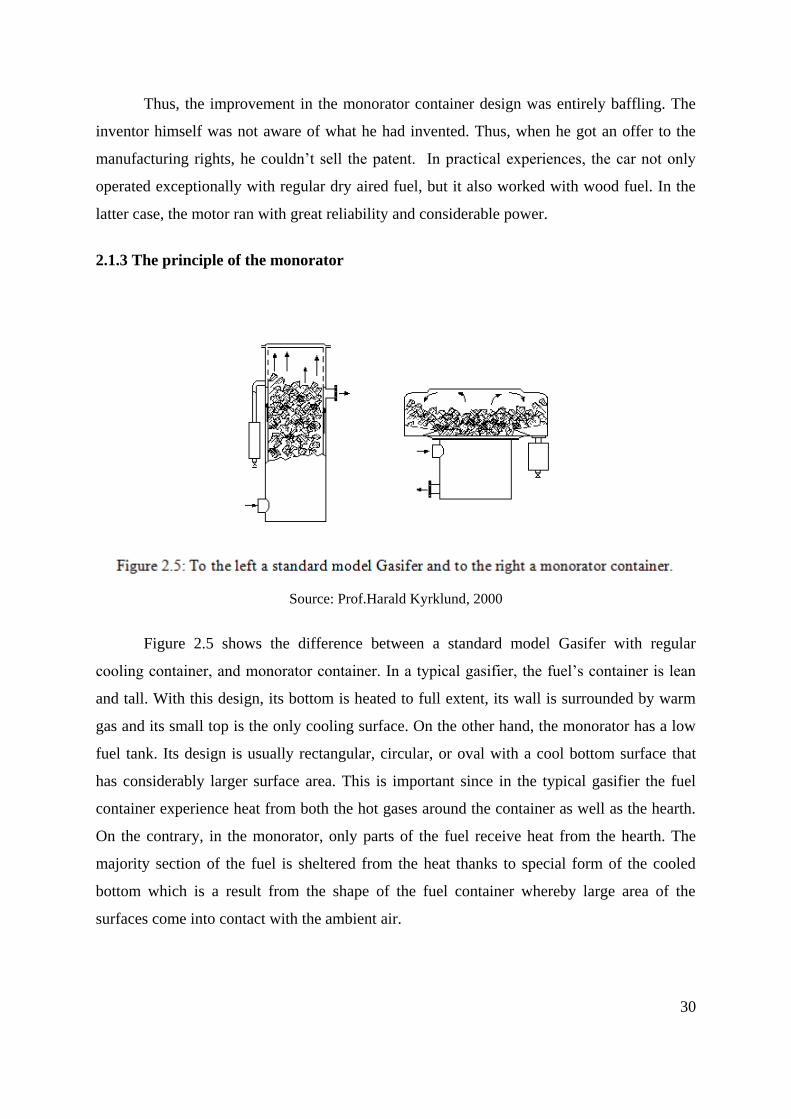
2.1.2 Monorator Invention
An essential key to this dilemma was solved with the invention of monorator. Its
creation is pure coincidence to thank for its birth. S P J Keinänen, a well-known racing driver
in Sweden, found out that gasifier's container need to be low in order for him to clearly see
out the rear view mirror. However, by doing so, the container’s width had to increase its
width so that it has room for enough fuel. These particular circumstances combined with the
inventor's lack of knowledge regarding earlier gasifier’s designs gave birth to the monorator
which was relatively differed from the orthodox type created by Imbert.(Eleanor Imbert,
1920) (Figure 2.4).
Figure 2.4: Monorator
Source: Prof.Harald Kyrklund, 2000
30
Thus, the improvement in the monorator container design was entirely baffling. The
inventor himself was not aware of what he had invented. Thus, when he got an offer to the
manufacturing rights, he couldn’t sell the patent. In practical experiences, the car not only
operated exceptionally with regular dry aired fuel, but it also worked with wood fuel. In the
latter case, the motor ran with great reliability and considerable power.
2.1.3 The principle of the monorator
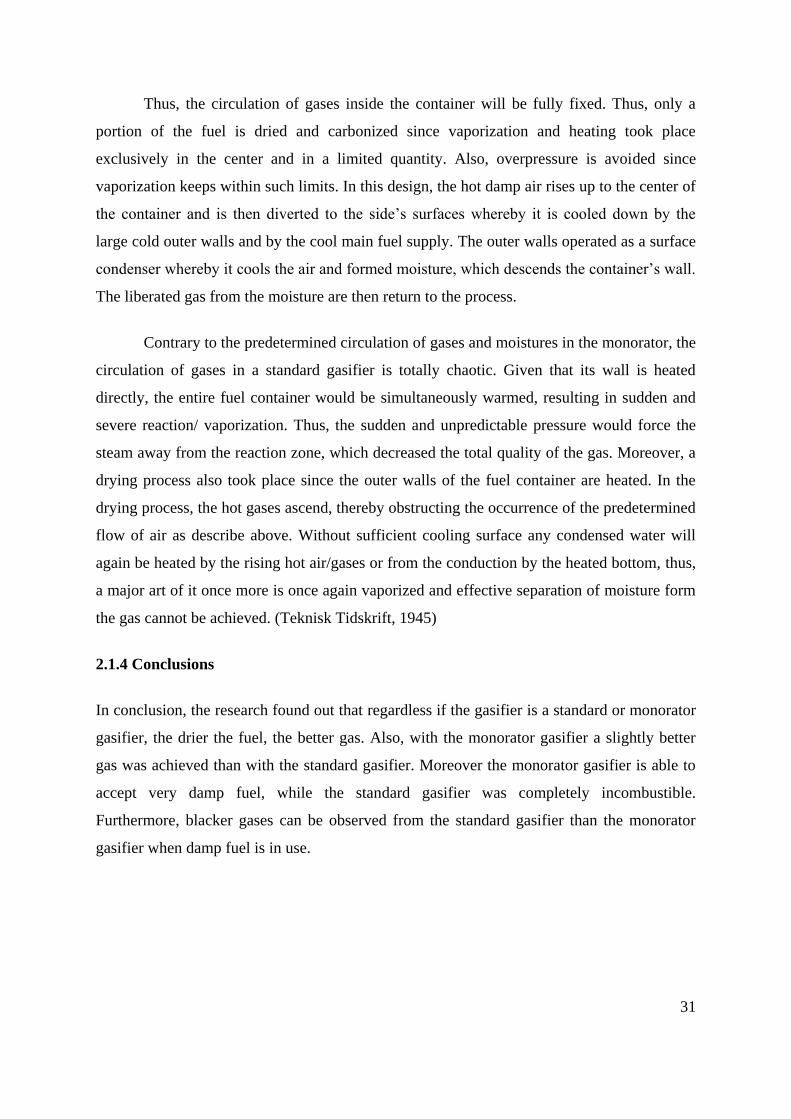
Source: Prof.Harald Kyrklund, 2000
Figure 2.5 shows the difference between a standard model Gasifer with regular
cooling container, and monorator container. In a typical gasifier, the fuel’s container is lean
and tall. With this design, its bottom is heated to full extent, its wall is surrounded by warm
gas and its small top is the only cooling surface. On the other hand, the monorator has a low
fuel tank. Its design is usually rectangular, circular, or oval with a cool bottom surface that
has considerably larger surface area. This is important since in the typical gasifier the fuel
container experience heat from both the hot gases around the container as well as the hearth.
On the contrary, in the monorator, only parts of the fuel receive heat from the hearth. The
majority section of the fuel is sheltered from the heat thanks to special form of the cooled
bottom which is a result from the shape of the fuel container whereby large area of the
surfaces come into contact with the ambient air.
31
Thus, the circulation of gases inside the container will be fully fixed. Thus, only a
portion of the fuel is dried and carbonized since vaporization and heating took place
exclusively in the center and in a limited quantity. Also, overpressure is avoided since
vaporization keeps within such limits. In this design, the hot damp air rises up to the center of
the container and is then diverted to the side’s surfaces whereby it is cooled down by the
large cold outer walls and by the cool main fuel supply. The outer walls operated as a surface
condenser whereby it cools the air and formed moisture, which descends the container’s wall.
The liberated gas from the moisture are then return to the process.
Contrary to the predetermined circulation of gases and moistures in the monorator, the
circulation of gases in a standard gasifier is totally chaotic. Given that its wall is heated
directly, the entire fuel container would be simultaneously warmed, resulting in sudden and
severe reaction/ vaporization. Thus, the sudden and unpredictable pressure would force the
steam away from the reaction zone, which decreased the total quality of the gas. Moreover, a
drying process also took place since the outer walls of the fuel container are heated. In the
drying process, the hot gases ascend, thereby obstructing the occurrence of the predetermined
flow of air as describe above. Without sufficient cooling surface any condensed water will
again be heated by the rising hot air/gases or from the conduction by the heated bottom, thus,
a major art of it once more is once again vaporized and effective separation of moisture form
the gas cannot be achieved. (Teknisk Tidskrift, 1945)
2.1.4 Conclusions
In conclusion, the research found out that regardless if the gasifier is a standard or monorator
gasifier, the drier the fuel, the better gas. Also, with the monorator gasifier a slightly better
gas was achieved than with the standard gasifier. Moreover the monorator gasifier is able to
accept very damp fuel, while the standard gasifier was completely incombustible.
Furthermore, blacker gases can be observed from the standard gasifier than the monorator
gasifier when damp fuel is in use.
32
2.2 DRYER: Application of pulse combustion technology in spray drying
process
2.2.1 Introduction
The investigation on pulse combustion, heat excited acoustic oscillations and its
applications dated back to the 18th century where Higgins observed the so called hydrogen
"singing" flames in tubes. During pulse combustion, high heat transfer and oscillatory
mixing between the fuel gases and chamber’s walls took place, which minimizes NOx
production when compared to traditional combustion systems.
Nowadays pulse combustors are found in many practical devices such as water and air
heaters as well as drying devices where pulse combustors is utilized as a high temperature
and high turbulent drying device. However, there are some disadvantages, the pulse
combustor is noisy operation and can reach up to 130 dB, equitant to a military jet craft
taking off (Zinn, 1992).
There are three main sources of this noise:
1) The intrinsic detonating character of combustion
2) The vibrations of metallic combustor’s wall
3) The difference in velocity flow of gases from the combustor and ambient air.
A number of methods to decrease the noise level have been implemented by Hansen
in 1994. Apart from the apparent methods such as decreasing the combustion intensity and
acoustic insulation, the most popular methodologies are (Hansen, 1994):
(1) Coupling the two combustors so that they work in counter-phase,
(2) Application of ejectors at the inlet and outlet,
(3) Shielding the space between the outlet, inlet, and ejectors.
33
2.2.2 Pulse Combustion Drying Application
Pulse combustion in drying process is found in many Industrial applications such as:
(1) Spray drying,
(2) Fluid bed drying,
(3) Flash drying.
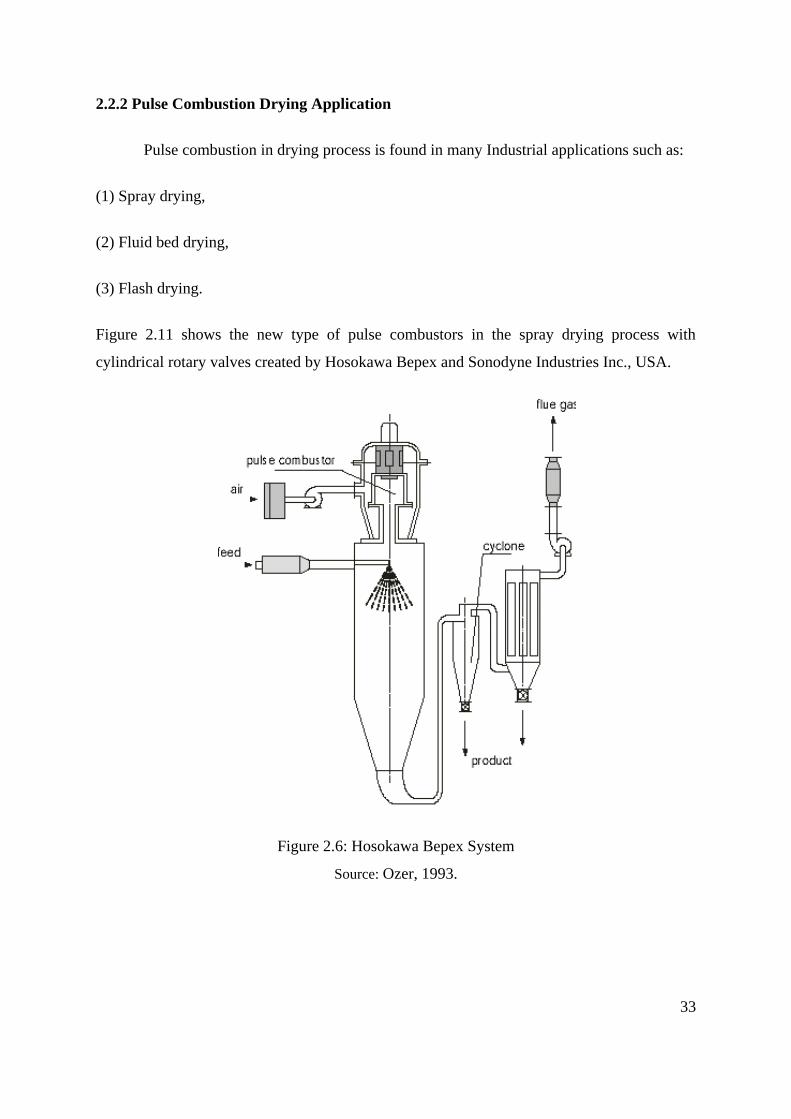
Figure 2.11 shows the new type of pulse combustors in the spray drying process with
cylindrical rotary valves created by Hosokawa Bepex and Sonodyne Industries Inc., USA.
Figure 2.6: Hosokawa Bepex System
Source: Ozer, 1993.
34
This new type of pulse combustors have been used to dry many chemical and
pharmaceutical products, food, and polymers. It also enables and high quality products at low
production costs. However, there problems were problems with the feeding system where
dried material are deposited on walls near the air inlet (Ozer, 1993).
On the other hand, another spray drying developed by Sonodyne Industries, Inc.
(Sonodyne Industries, Inc., 1984) fixed the problem by equipping 2 ton/h of evaporated water
in valueless pulse combustor as a source of a drying agent. This pulse combustion drying has
the advantages of high energy efficiency by utilizing low air consumption and also allows
drying of a wide range of materials.
Today, pulse combustors like the one developed by developed by Sonodyne
Industries, Inc. are often used in drying industrial wastes. An example is the Foundation for
Industrial Research, The Netherlands, which utilized pulse combustion vibro-fluidized bed
dryer called IMPULS which has the capacity to dry 20,000 ton of evaporated water per year.
The dryer can be used to dry dangerous wastes (acid wastes, toxic wastes, and urban
deposits), biological deposits (spent brewery yeast, sawdust, and sludge) and many more
(Kudra and Mujumdar, 1995).
On the other side of the world, Novodyne Ltd, Canada has conducted research to
construct a pulse combustion drying system for sawdust and dry wood waste for the wood
industry. Figure 2-12 shows the flash dryer, which is equipped with the valved pulse
combustor. Since drying of sawdust and dry wood waste are big particles, large energy
parameters are required in the drying process (Buchkowski, 1999).
Still, preliminary results showed that:
(1) the device operation is stable and safe,
(2) thermal efficiency is similar to the efficiency of flash dryers,
(3) electrical energy consumption is 40 – 50 % less than for conventional flash dryers,
(4) capital costs are 10 – 15 % less in comparison to classical flash dryers, because of a
compact design of the system,
(5) emission of toxic substances is low.
35
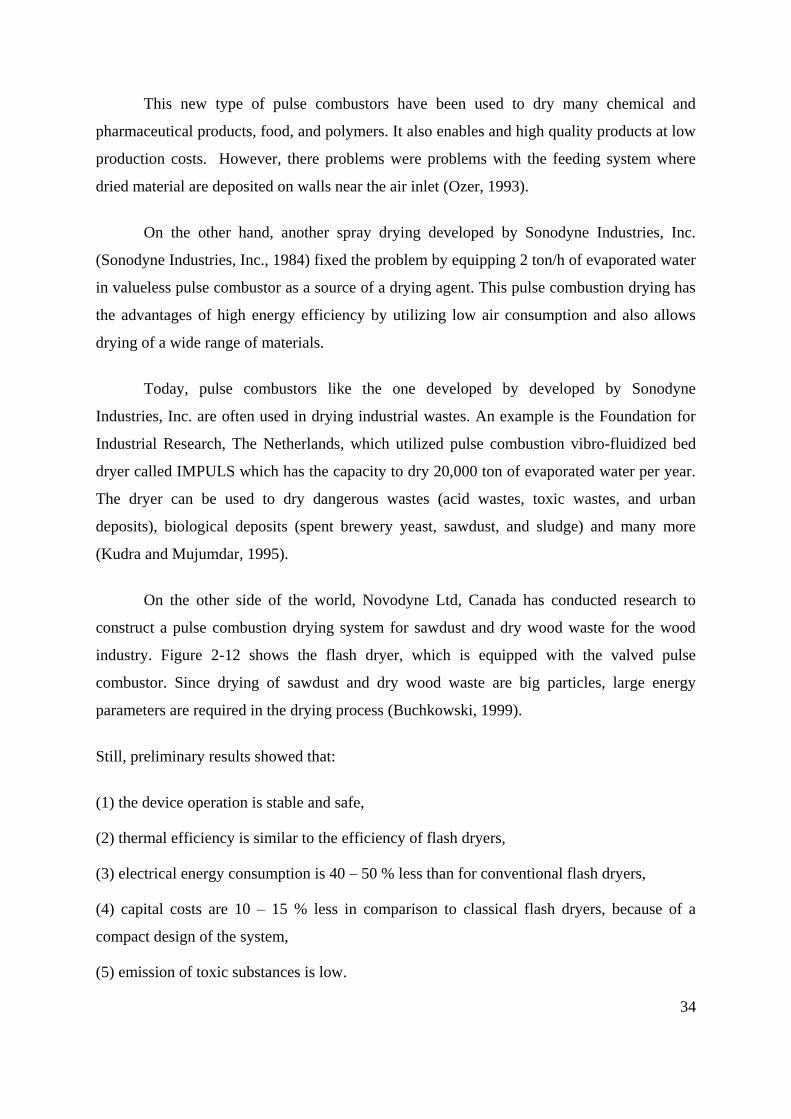
The successful story of the Novodyne flash dryer further stirs the interests of pulse
combustion technique in the drying process.
Figure 2.7: Novodyne Ltd flash dryer
Source: Buchkowski, 1999
2.2.3 Pulse Combustion Spray Drying Unit
Thus, through the development of Hosokawa Bepex and Sonodyne Industries Inc.,
USA and Sonodyne Industries, Inc, the pulse combustion drying system was developed and
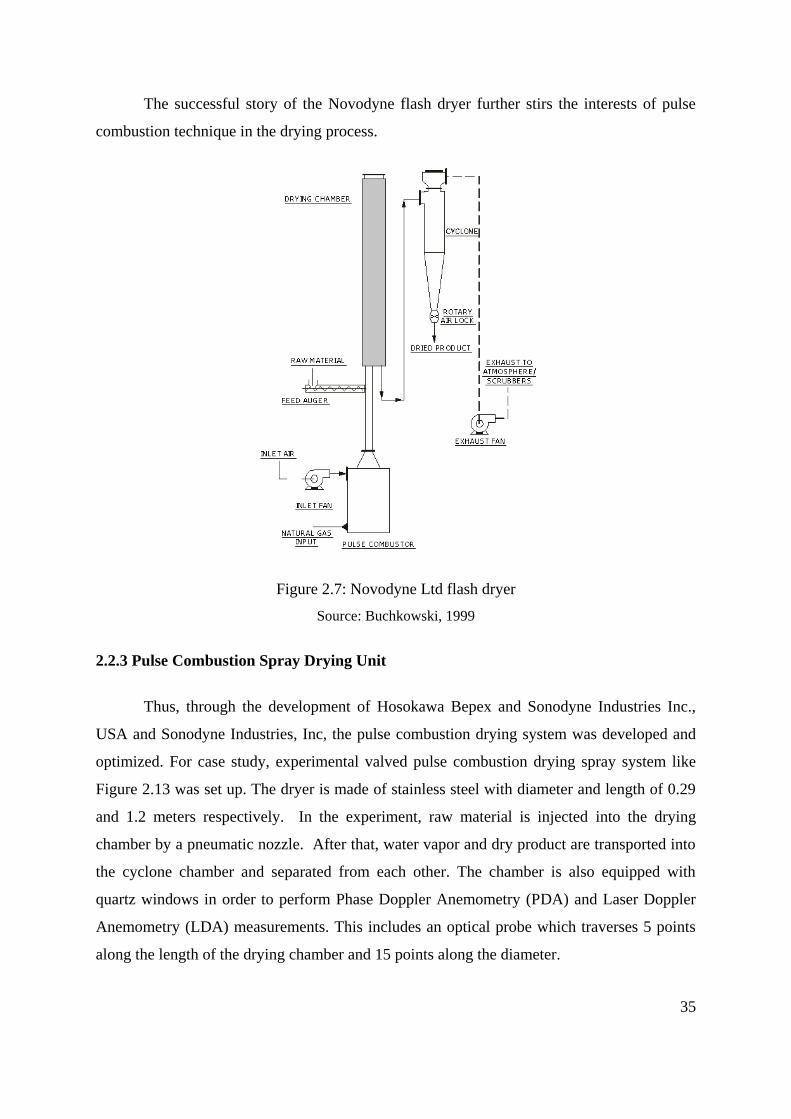
optimized. For case study, experimental valved pulse combustion drying spray system like
Figure 2.13 was set up. The dryer is made of stainless steel with diameter and length of 0.29
and 1.2 meters respectively. In the experiment, raw material is injected into the drying
chamber by a pneumatic nozzle. After that, water vapor and dry product are transported into
the cyclone chamber and separated from each other. The chamber is also equipped with
quartz windows in order to perform Phase Doppler Anemometry (PDA) and Laser Doppler
Anemometry (LDA) measurements. This includes an optical probe which traverses 5 points
along the length of the drying chamber and 15 points along the diameter.
36
Figure 2.8: Valved Pulse Combustor Drying Installation
Source: Keller et al., 1992
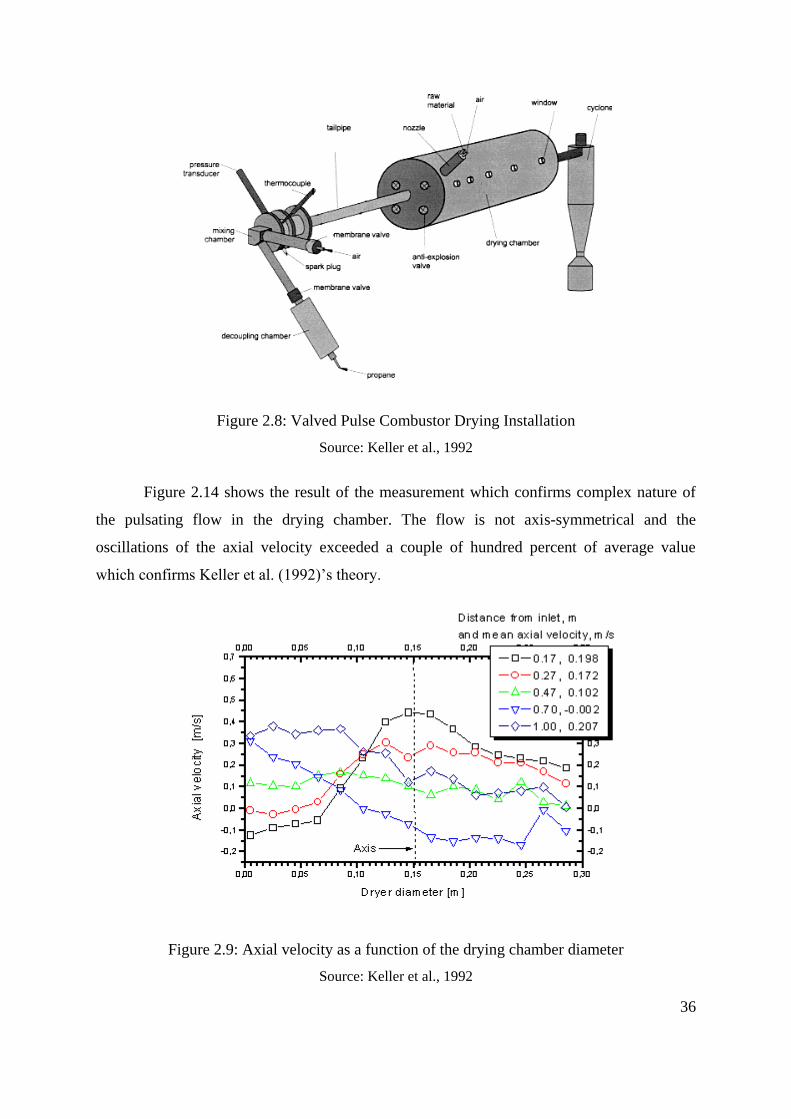
Figure 2.14 shows the result of the measurement which confirms complex nature of
the pulsating flow in the drying chamber. The flow is not axis-symmetrical and the
oscillations of the axial velocity exceeded a couple of hundred percent of average value
which confirms Keller et al. (1992)’s theory.
Figure 2.9: Axial velocity as a function of the drying chamber diameter
Source: Keller et al., 1992
37
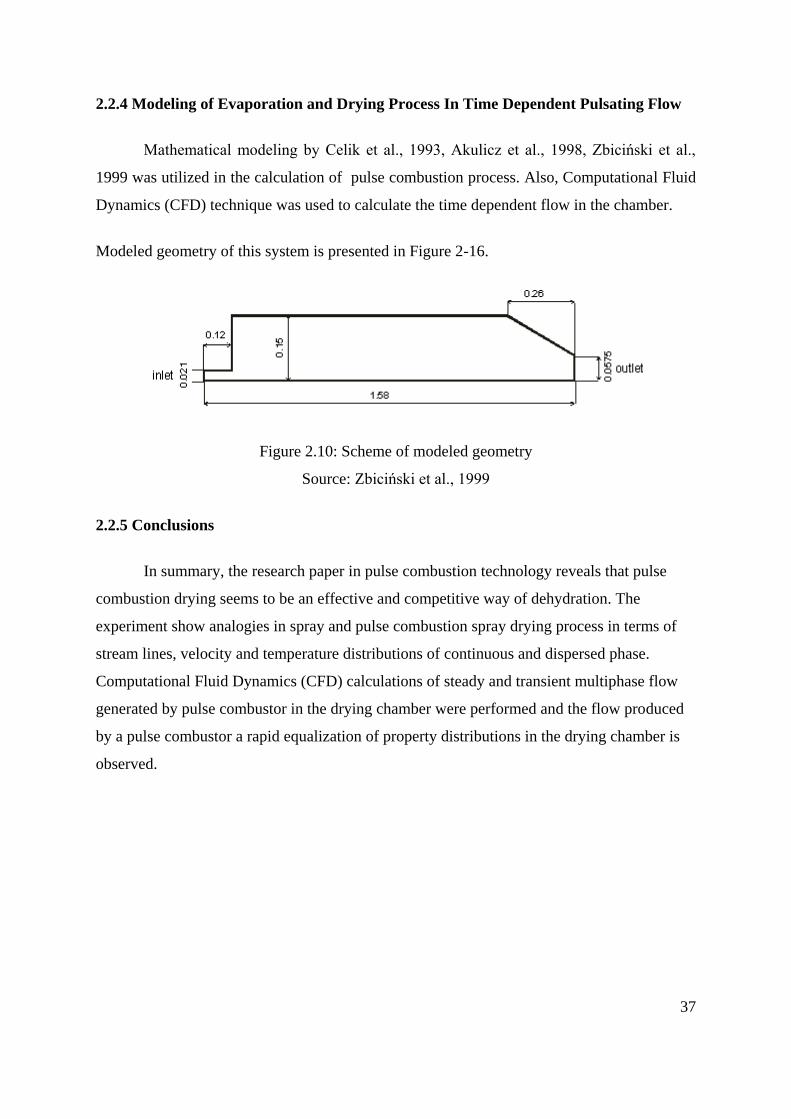
2.2.4 Modeling of Evaporation and Drying Process In Time Dependent Pulsating Flow
Mathematical modeling by Celik et al., 1993, Akulicz et al., 1998, Zbiciński et al.,
1999 was utilized in the calculation of pulse combustion process. Also, Computational Fluid
Dynamics (CFD) technique was used to calculate the time dependent flow in the chamber.
Modeled geometry of this system is presented in Figure 2-16.
Figure 2.10: Scheme of modeled geometry
Source: Zbiciński et al., 1999
2.2.5 Conclusions
In summary, the research paper in pulse combustion technology reveals that pulse
combustion drying seems to be an effective and competitive way of dehydration. The
experiment show analogies in spray and pulse combustion spray drying process in terms of
stream lines, velocity and temperature distributions of continuous and dispersed phase.
Computational Fluid Dynamics (CFD) calculations of steady and transient multiphase flow
generated by pulse combustor in the drying chamber were performed and the flow produced
by a pulse combustor a rapid equalization of property distributions in the drying chamber is
observed.
38
2.3 WASTE HEAT RECOVERY SYSTEM
2.3.1 Case Study Wood Waste Gasification & Thermal Oxidation, Project Location
Little Falls, Minnesota
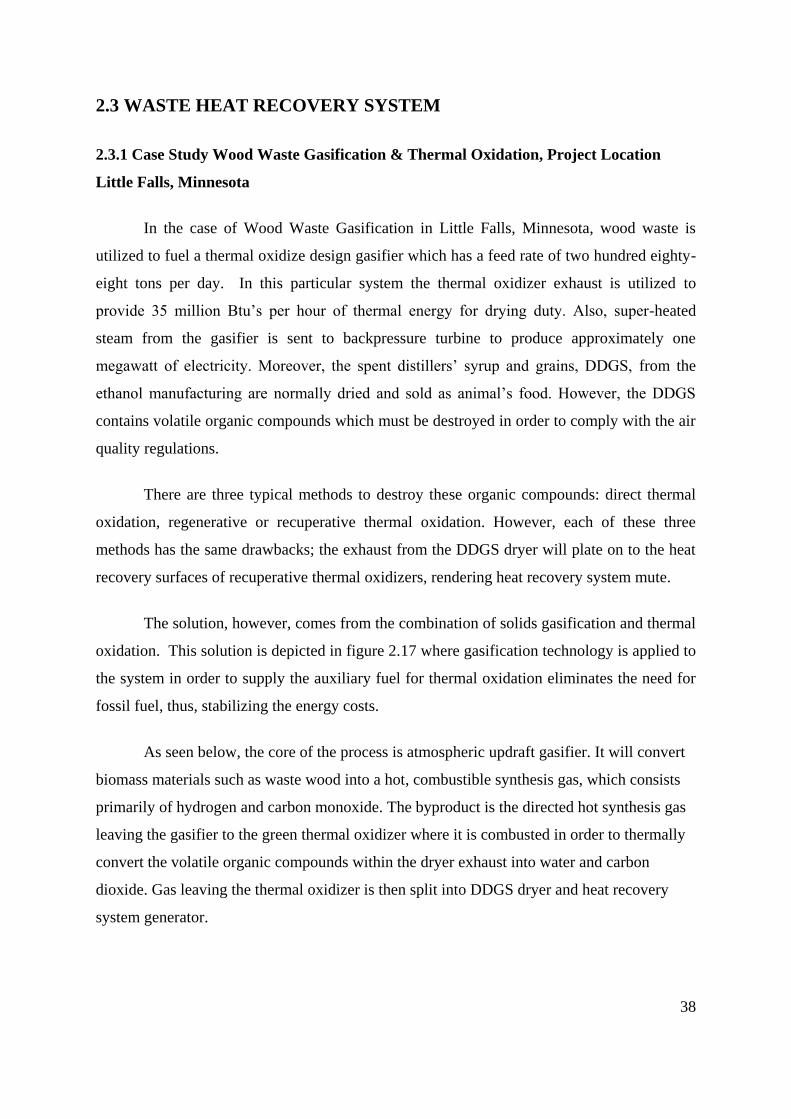
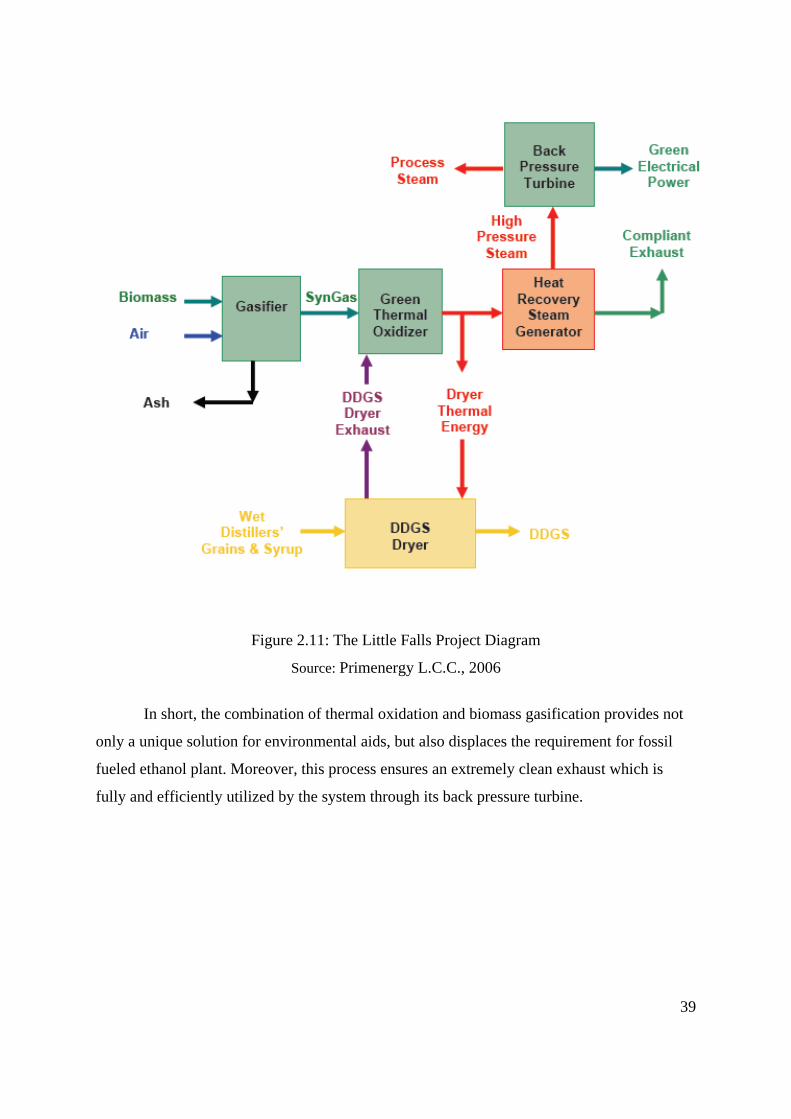
In the case of Wood Waste Gasification in Little Falls, Minnesota, wood waste is
utilized to fuel a thermal oxidize design gasifier which has a feed rate of two hundred eighty-
eight tons per day. In this particular system the thermal oxidizer exhaust is utilized to
provide 35 million Btu’s per hour of thermal energy for drying duty. Also, super-heated
steam from the gasifier is sent to backpressure turbine to produce approximately one
megawatt of electricity. Moreover, the spent distillers’ syrup and grains, DDGS, from the
ethanol manufacturing are normally dried and sold as animal’s food. However, the DDGS
contains volatile organic compounds which must be destroyed in order to comply with the air
quality regulations.
There are three typical methods to destroy these organic compounds: direct thermal
oxidation, regenerative or recuperative thermal oxidation. However, each of these three
methods has the same drawbacks; the exhaust from the DDGS dryer will plate on to the heat
recovery surfaces of recuperative thermal oxidizers, rendering heat recovery system mute.
The solution, however, comes from the combination of solids gasification and thermal
oxidation. This solution is depicted in figure 2.17 where gasification technology is applied to
the system in order to supply the auxiliary fuel for thermal oxidation eliminates the need for
fossil fuel, thus, stabilizing the energy costs.
As seen below, the core of the process is atmospheric updraft gasifier. It will convert
biomass materials such as waste wood into a hot, combustible synthesis gas, which consists
primarily of hydrogen and carbon monoxide. The byproduct is the directed hot synthesis gas
leaving the gasifier to the green thermal oxidizer where it is combusted in order to thermally
convert the volatile organic compounds within the dryer exhaust into water and carbon
dioxide. Gas leaving the thermal oxidizer is then split into DDGS dryer and heat recovery
system generator.
39
Figure 2.11: The Little Falls Project Diagram
Source: Primenergy L.C.C., 2006
In short, the combination of thermal oxidation and biomass gasification provides not
only a unique solution for environmental aids, but also displaces the requirement for fossil
fueled ethanol plant. Moreover, this process ensures an extremely clean exhaust which is
fully and efficiently utilized by the system through its back pressure turbine.
40
2.3.2 Gasification: An Alternative Process for Energy Recovery and Disposal of
Municipal Solid Wastes
Currently, cities around the world are facing the problem of large quantities of
municipal solid waste (MSW). Landfills are the main destination of waste disposal,
accounting for 60% of the total waste. These landfills have major environmental impacts,
thus cleaner and are environmentally friendly method needs to be implemented. One such
alternative is known as waste to energy (WTE); it not only reduces the amount of waste sent
to landfills but also reduces the amount of fossil fuels needed to generate electricity. There
are two commercially viable methods of WTE, gasification and combustion. In today’s
industry, gasification is in maturing phase while wastes combustion is a familiar technique.
This paper will access the possibility of Municipal Solid Waste’s gasification is ZEWTE
process (zero emission waste to energy) as an alternative to today’s typical industrial
combustion process.
In US, 33 million tons of MSW are combusted per year; this takes approximately of
1,600 million gallons of oil. Moreover, through the combustion process, furans/dioxins are
created in exhausts which are harmful to the environment. Over the past 10 years, progress
has been made in effective capturing techniques to reduce these gases from 4 kg per year to
0.4 kg per year.
On the other hand, gasification is a thermo chemical process which converts liquid
and/or solid hydrocarbons into low or medium gas. Today, there are 100 waste gasification
facilities worldwide. A typical gasification process has quite a few advantages over
conventional MSW combustion process; its process takes place in a low-oxygenated
environment thereby limiting the development of toxins such as NOx and SOx. As a result,
the volume of exhaust that needs to be clean is low. Moreover, according to chemical
thermodynamics ΔG= -RTln(P1/P0), the lower volume of exhaust gas equates to higher
pressure of contaminants which enables a better contaminants absorption and capture. Lastly,
the byproduct of gasification is syngas which can be converted to electricity.
Two gasification plants studied in this paper are the design by TPS Termiska and
Battelle-Columbus Laboratories. The TPS Termiska uses partial combustion with air at
41
atmospheric pressure in a bubbling fluidized bed, followed by a circulating fluidized bed
vessel containing dolomite that catalytically “cracks” the tars.
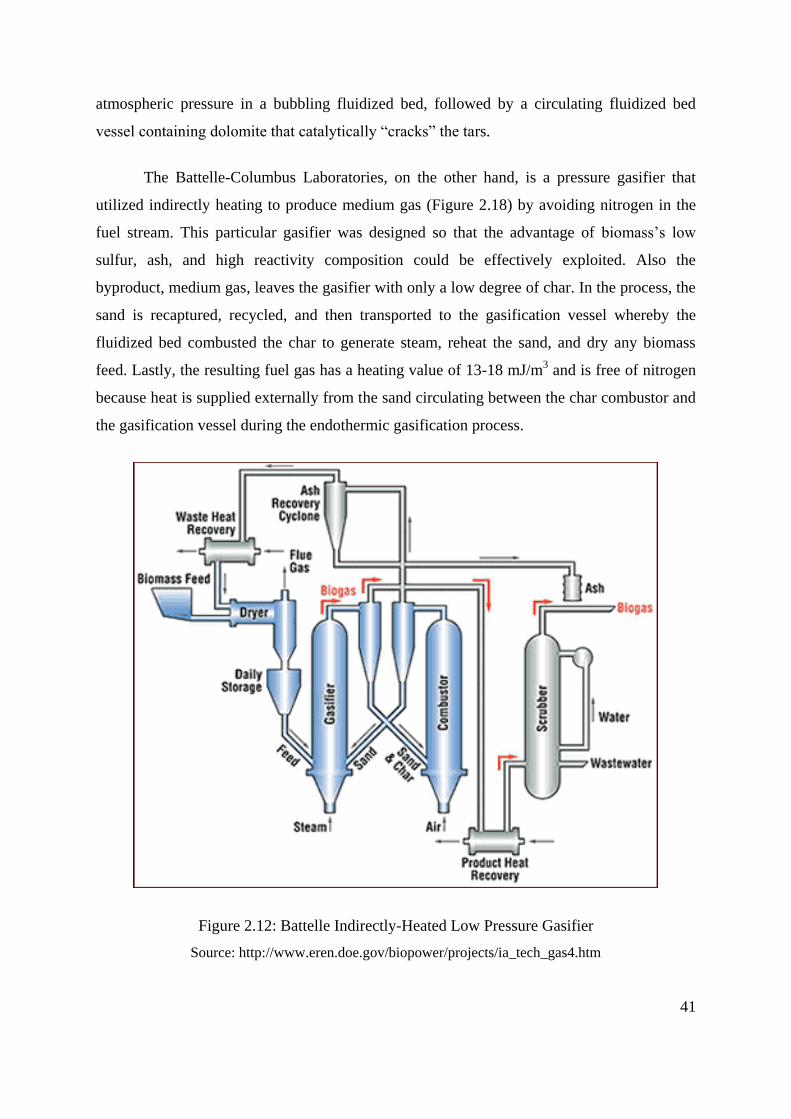
The Battelle-Columbus Laboratories, on the other hand, is a pressure gasifier that
utilized indirectly heating to produce medium gas (Figure 2.18) by avoiding nitrogen in the
fuel stream. This particular gasifier was designed so that the advantage of biomass’s low
sulfur, ash, and high reactivity composition could be effectively exploited. Also the
byproduct, medium gas, leaves the gasifier with only a low degree of char. In the process, the
sand is recaptured, recycled, and then transported to the gasification vessel whereby the
fluidized bed combusted the char to generate steam, reheat the sand, and dry any biomass
feed. Lastly, the resulting fuel gas has a heating value of 13-18 mJ/m3 and is free of nitrogen
because heat is supplied externally from the sand circulating between the char combustor and
the gasification vessel during the endothermic gasification process.
Figure 2.12: Battelle Indirectly-Heated Low Pressure Gasifier
Source: http://www.eren.doe.gov/biopower/projects/ia_tech_gas4.htm

42
Both processes at the plant site are zero emission waste to energy process (ZEWTE),
which have zero atmospheric emissions. Thus, the paper finished by concluding that waste
gasification process is a feasible and cost-competitive solution to the traditional combustion
method. Still, large scale gasification plants’ operation needs to be demonstrated before it is
considered a viable solution to global waste disposal problems.
43
CHAPTER 3
PROJECT WORK PROCEDURES
3.1 SELECTING THE PROCESS OF IMPROVEMENT
After literature review, it’s shown that there are many ways to improve the thermal
efficiency such as reduction of length along process, insulated gasifier, useful dryer, etc.
Because of the time limit and the actual existing gasifier at Samutsakhon powerplant,
which could not be modify since it has already been setup (already brought) and already in
used; the dryer is the properly case to improve the thermal efficiency or in other word
enhance the efficiency of the existing gasifier.
3.2 INFORMATION OF DRYER
Dryer is a machine used in a mass transfer process whereby water moisture is
removed through evaporation. To achieve this, a source of heat and an agent/ solvent is
needed. This process is commonly used in food manufacturing or pharmaceutical industry,
where the most commonly used solvent is water.
In the most dying case, convection is applied to a gas stream which transports the
water vapor away as humidity. Other drying case involves vacuum drying, which utilized
conduction techniques such as microwave and/or radiation. Another indirect dying process is
the drummed process whereby heated surface is used to synthesize the vapors which are
drawn away by aspirators.
Freeze drying/ lyophilization is another special form of drying methodology which
the solvent is first frozen and later warmed in a vacuum so that the ice sublimes. Typically,
Freeze drying process is often done in high vacuum chamber thereby allowing the drying to
take place at reasonable rate. Thus, it avoids the disintegration of the product’s structure,
44
resulting in low density and highly porous solid. In biological or foods industry, freeze drying
is considered as the best method of preserving the initial properties of the product. The
process of removing the moisture also has less effect on the food’s taste than a typical
dehydration process. Moreover, the freeze drying rehydrate quickly and easily because of its
retention of porous structure. The first users of freeze drying in the industry are to produce
dehydrated vaccines for creating dehydrated blood which is utilized for the war’s wounded/
casualties. The dehydrated vaccines keep the Vitamins and protein quality intact.
Types of dryer
Dryers are made in these general types, the type determined by the method used in
transferring heat to the material being dried.
The majority types of dryers use indirectly heating through external heat transfer jacket or
internal exchanger coil. The advantage of these types of external heating allows the
utilization of ater or oil to precisely control temperatures inside the dryer. They can also be
divided into further classification as below (Arun S. Mujumdar, 2000):
Direct dryers - is the most common type utilized by 85% of the industry. However, it has
relatively low thermal efficiency due to the difficulty in recovering the latent heat from the
vaporization that is contained in the exhaust. The direct-heated type may have the flame from
combustion impinging on the material being dried, or the gases of combustion may be mixed
with additional air so that the mixture in contact with the material is reduced in temperature.
Indirect dryers – also known as heat types dryers, the gases of combustion pass through
spaces surrounding, or in the drying chamber, without coming into contact with the material
i.e. heat is usually transported using steam, hot gas, and thermal fluids as heat transfer
medium. Normally, heat transfer surfaces have temperature around -40º C (as in freeze
drying) to about 300º C.
45
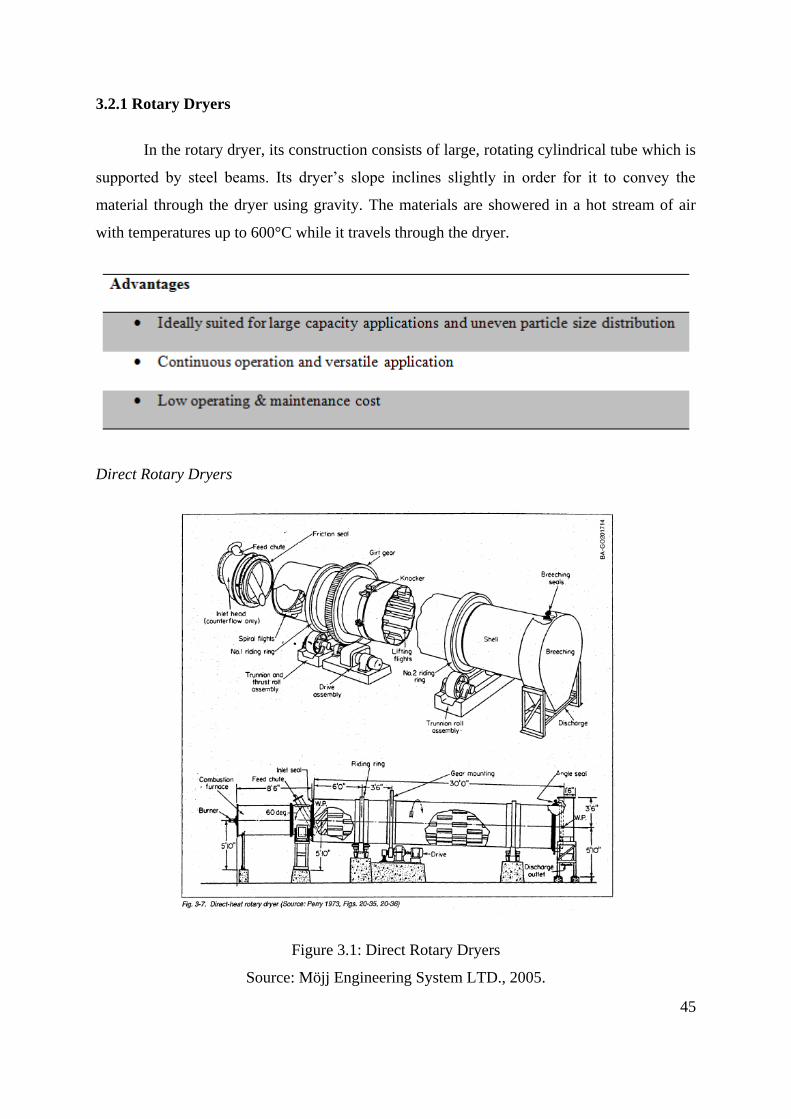
3.2.1 Rotary Dryers
In the rotary dryer, its construction consists of large, rotating cylindrical tube which is
supported by steel beams. Its dryer’s slope inclines slightly in order for it to convey the
material through the dryer using gravity. The materials are showered in a hot stream of air
with temperatures up to 600°C while it travels through the dryer.
Direct Rotary Dryers
Figure 3.1: Direct Rotary Dryers
Source: Möjj Engineering System LTD., 2005.
46
Direct Rotary Dryer composed of inclined rotating shell in which a hot stream of air
flows. The wet material in the rotary shell is carried by spiral configuration while being
showered in hot flowing air. Usually the diameter and length and dryer is customized in
accordance to the characteristics of the product. Also the hot air can be co-current or counter
current depending on the properties of the product. Typically the rotating shell is designed to
create uniform distribution for the material across its surface area. Lastly, its surface is sealed
to reduce air/heat leakage in order to decrease thermal energy loss.
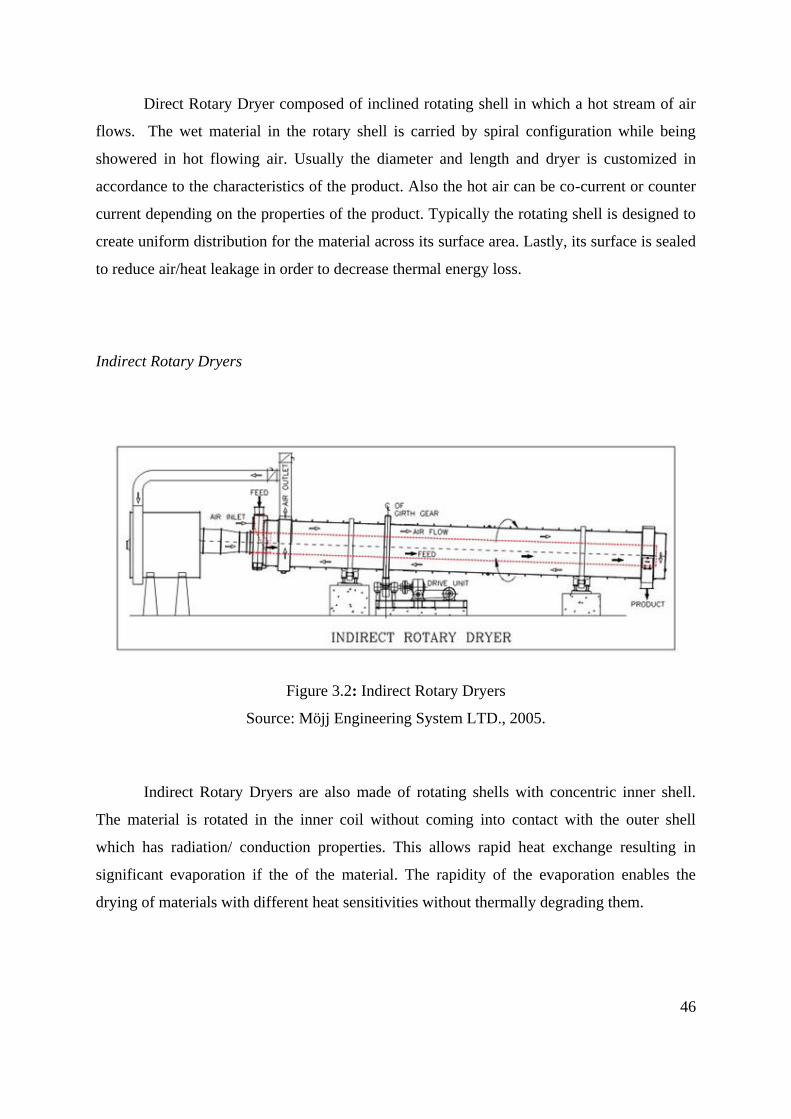
Indirect Rotary Dryers
Figure 3.2: Indirect Rotary Dryers
Source: Möjj Engineering System LTD., 2005.
Indirect Rotary Dryers are also made of rotating shells with concentric inner shell.
The material is rotated in the inner coil without coming into contact with the outer shell
which has radiation/ conduction properties. This allows rapid heat exchange resulting in
significant evaporation if the of the material. The rapidity of the evaporation enables the
drying of materials with different heat sensitivities without thermally degrading them.
47
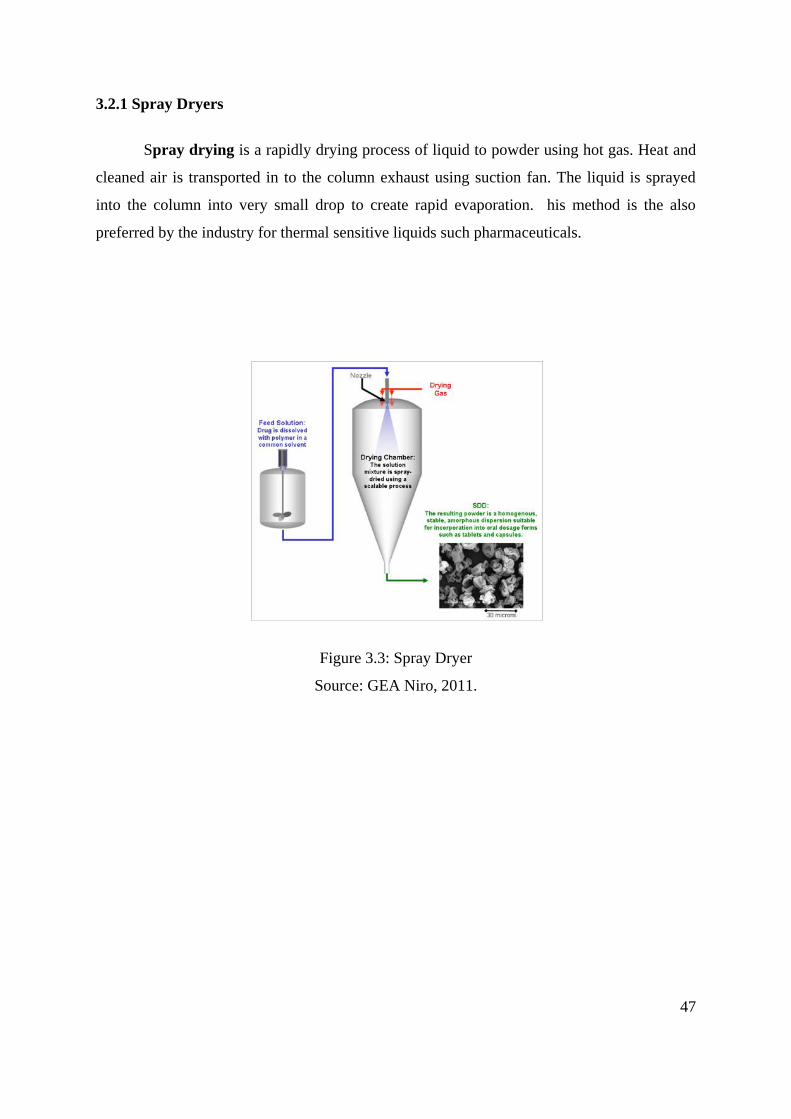
3.2.1 Spray Dryers
Spray drying is a rapidly drying process of liquid to powder using hot gas. Heat and
cleaned air is transported in to the column exhaust using suction fan. The liquid is sprayed
into the column into very small drop to create rapid evaporation. his method is the also
preferred by the industry for thermal sensitive liquids such pharmaceuticals.
Figure 3.3: Spray Dryer
Source: GEA Niro, 2011.
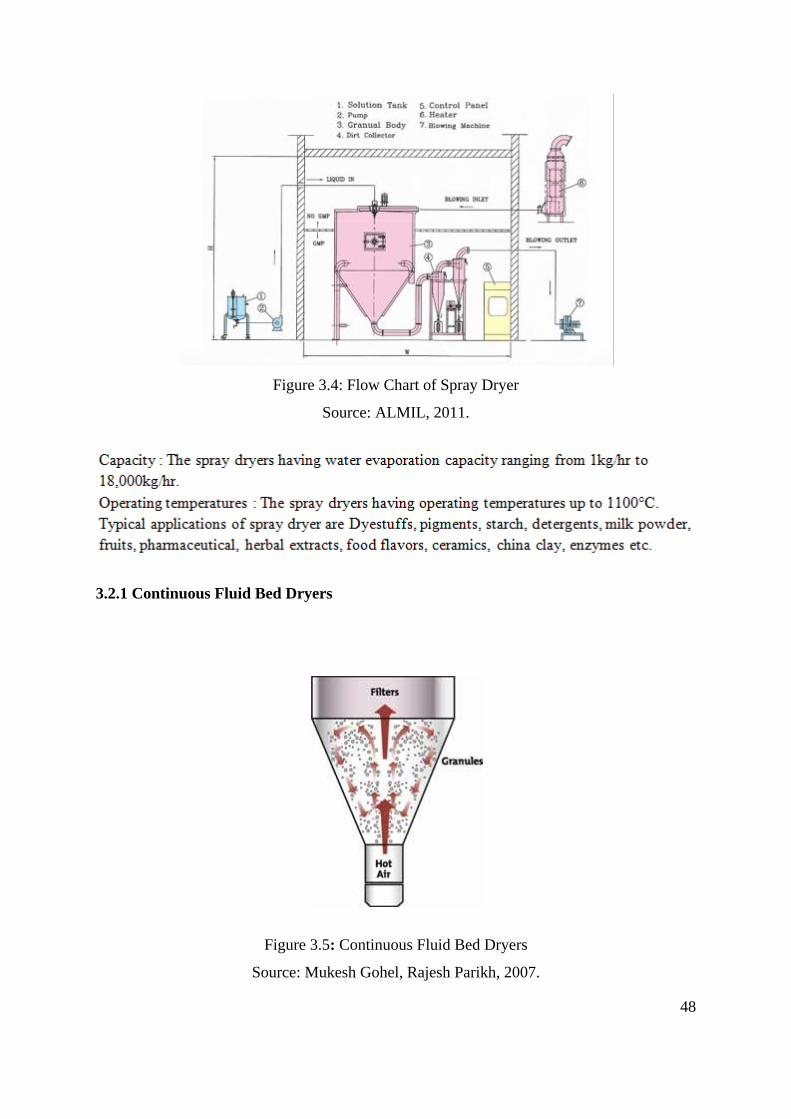
48
Figure 3.4: Flow Chart of Spray Dryer
Source: ALMIL, 2011.
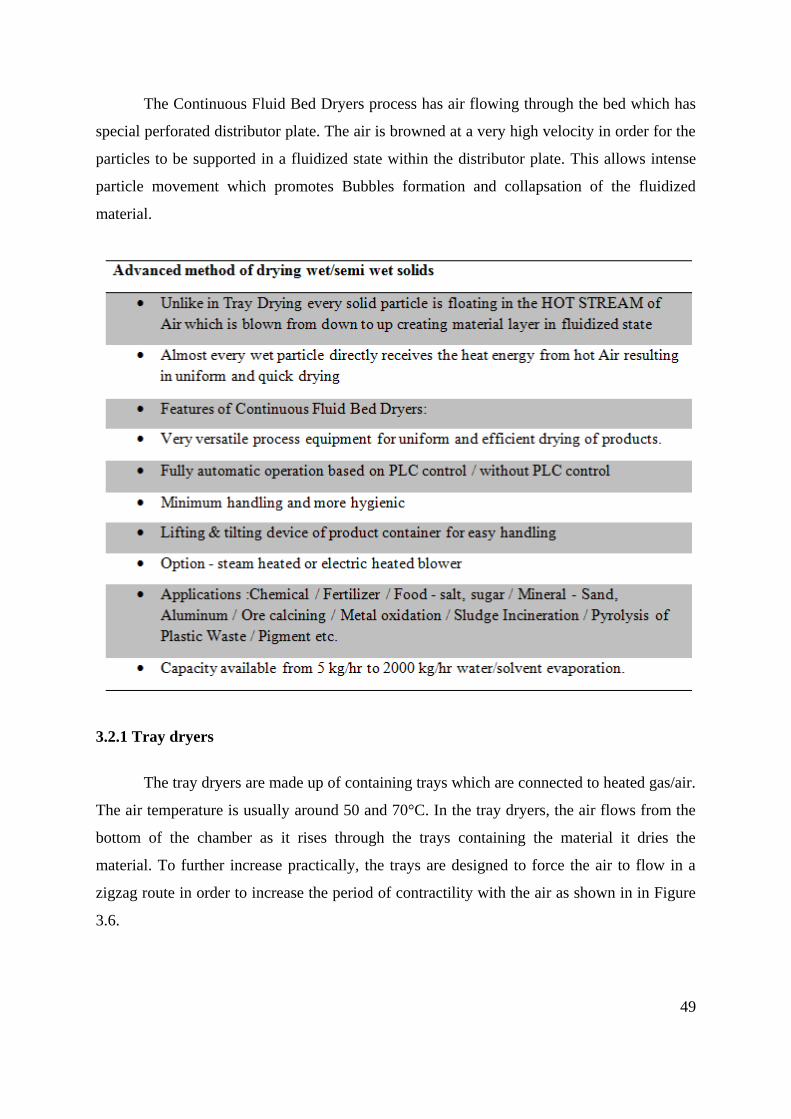
3.2.1 Continuous Fluid Bed Dryers
Figure 3.5: Continuous Fluid Bed Dryers
Source: Mukesh Gohel, Rajesh Parikh, 2007.
49
The Continuous Fluid Bed Dryers process has air flowing through the bed which has
special perforated distributor plate. The air is browned at a very high velocity in order for the
particles to be supported in a fluidized state within the distributor plate. This allows intense
particle movement which promotes Bubbles formation and collapsation of the fluidized
material.
3.2.1 Tray dryers
The tray dryers are made up of containing trays which are connected to heated gas/air.
The air temperature is usually around 50 and 70°C. In the tray dryers, the air flows from the
bottom of the chamber as it rises through the trays containing the material it dries the
material. To further increase practically, the trays are designed to force the air to flow in a
zigzag route in order to increase the period of contractility with the air as shown in in Figure
3.6.
50
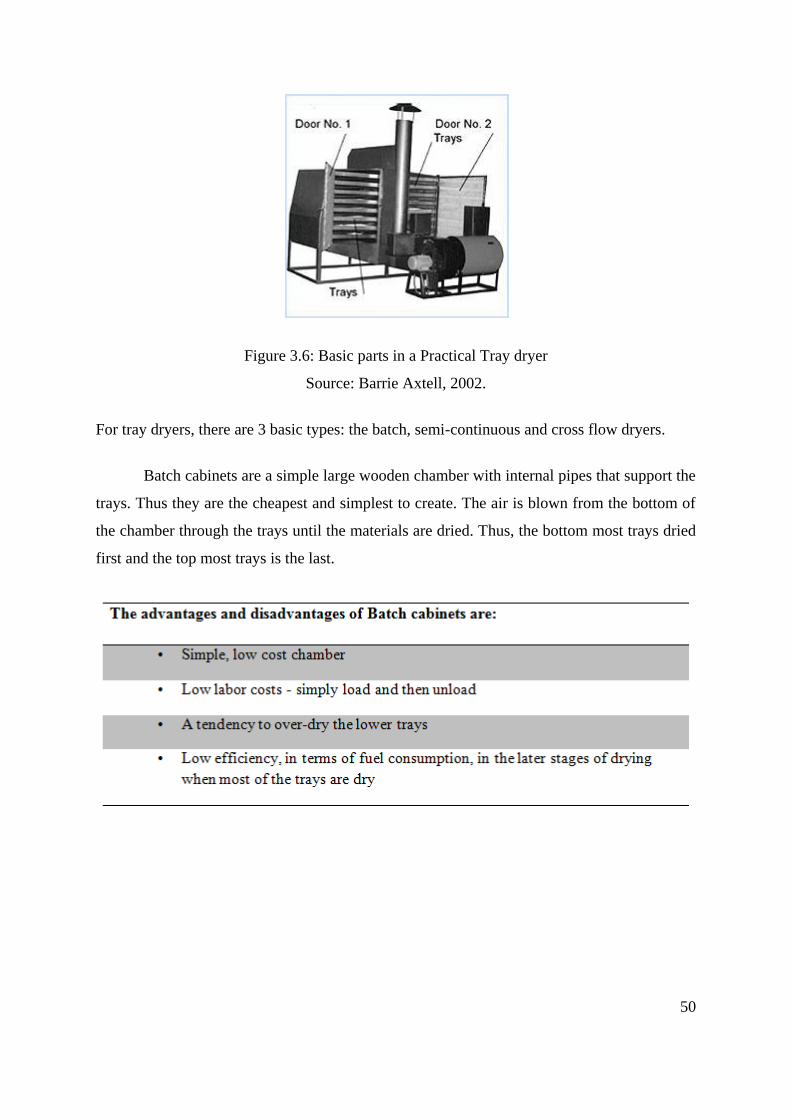
Figure 3.6: Basic parts in a Practical Tray dryer
Source: Barrie Axtell, 2002.
For tray dryers, there are 3 basic types: the batch, semi-continuous and cross flow dryers.
Batch cabinets are a simple large wooden chamber with internal pipes that support the
trays. Thus they are the cheapest and simplest to create. The air is blown from the bottom of
the chamber through the trays until the materials are dried. Thus, the bottom most trays dried
first and the top most trays is the last.
51
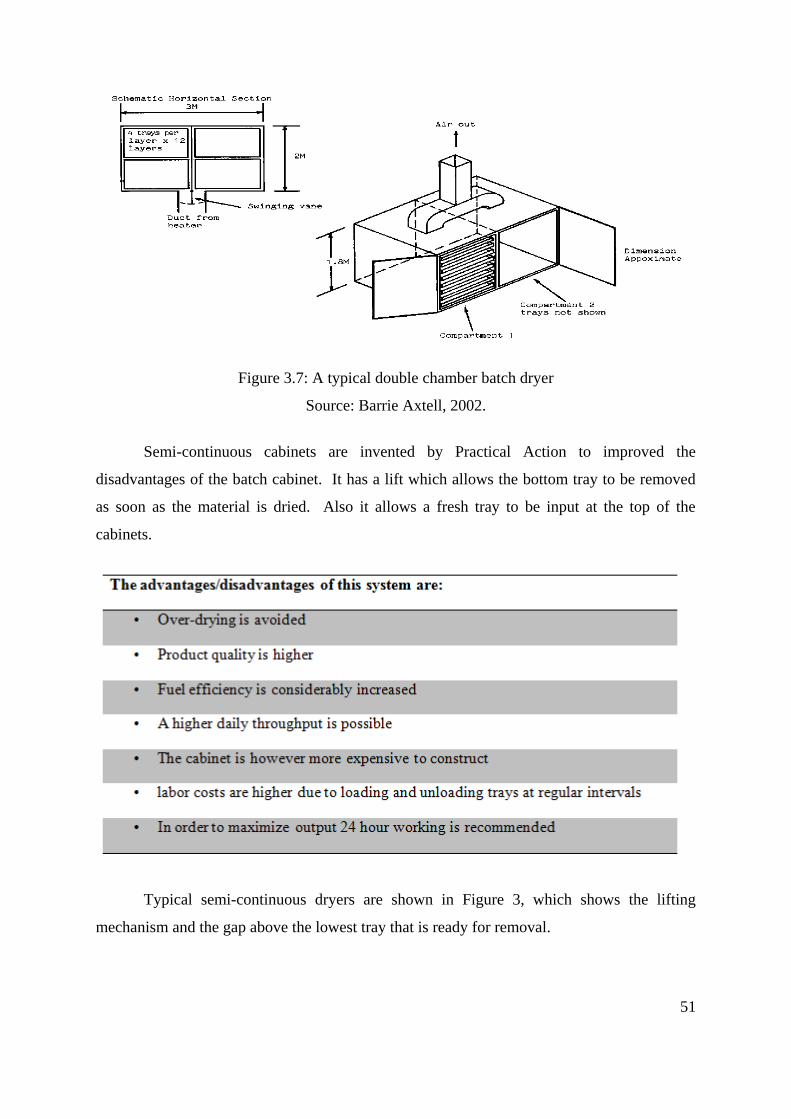
Figure 3.7: A typical double chamber batch dryer
Source: Barrie Axtell, 2002.
Semi-continuous cabinets are invented by Practical Action to improved the
disadvantages of the batch cabinet. It has a lift which allows the bottom tray to be removed
as soon as the material is dried. Also it allows a fresh tray to be input at the top of the
cabinets.
Typical semi-continuous dryers are shown in Figure 3, which shows the lifting
mechanism and the gap above the lowest tray that is ready for removal.
52
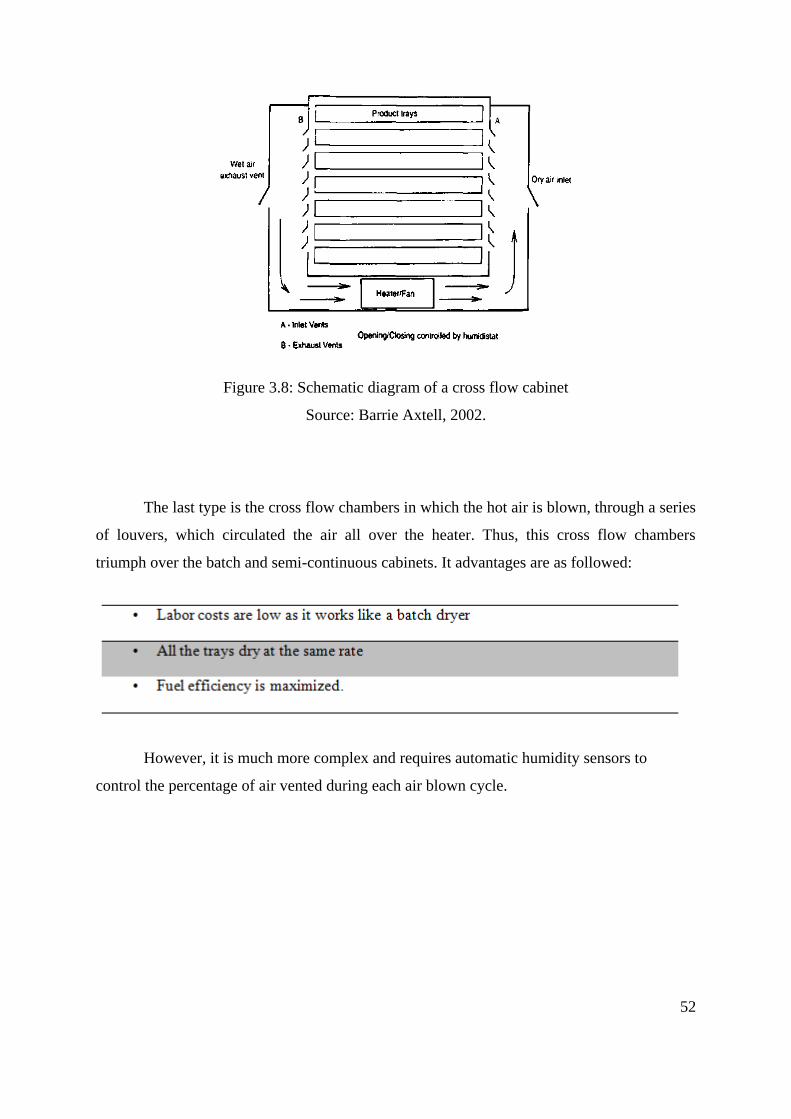
Figure 3.8: Schematic diagram of a cross flow cabinet
Source: Barrie Axtell, 2002.
The last type is the cross flow chambers in which the hot air is blown, through a series
of louvers, which circulated the air all over the heater. Thus, this cross flow chambers
triumph over the batch and semi-continuous cabinets. It advantages are as followed:
However, it is much more complex and requires automatic humidity sensors to
control the percentage of air vented during each air blown cycle.
53
3.3 Selection of Dryer
Today, there is hundreds of drying machine designs. The types, detailed design, and
size of a dryer selected for a specific dryer design must take into consideration the material to
be handled, available sources of fuel or heat and of power, space occupied, operating labor
required, costs of erection and maintenance, and most importantly, whether the type and size
selected will give the desired production at the lowest cost. This cost composes of thermal
efficiency, materials used in construction, interest and depreciation on erected cost, and cost
of maintenance.
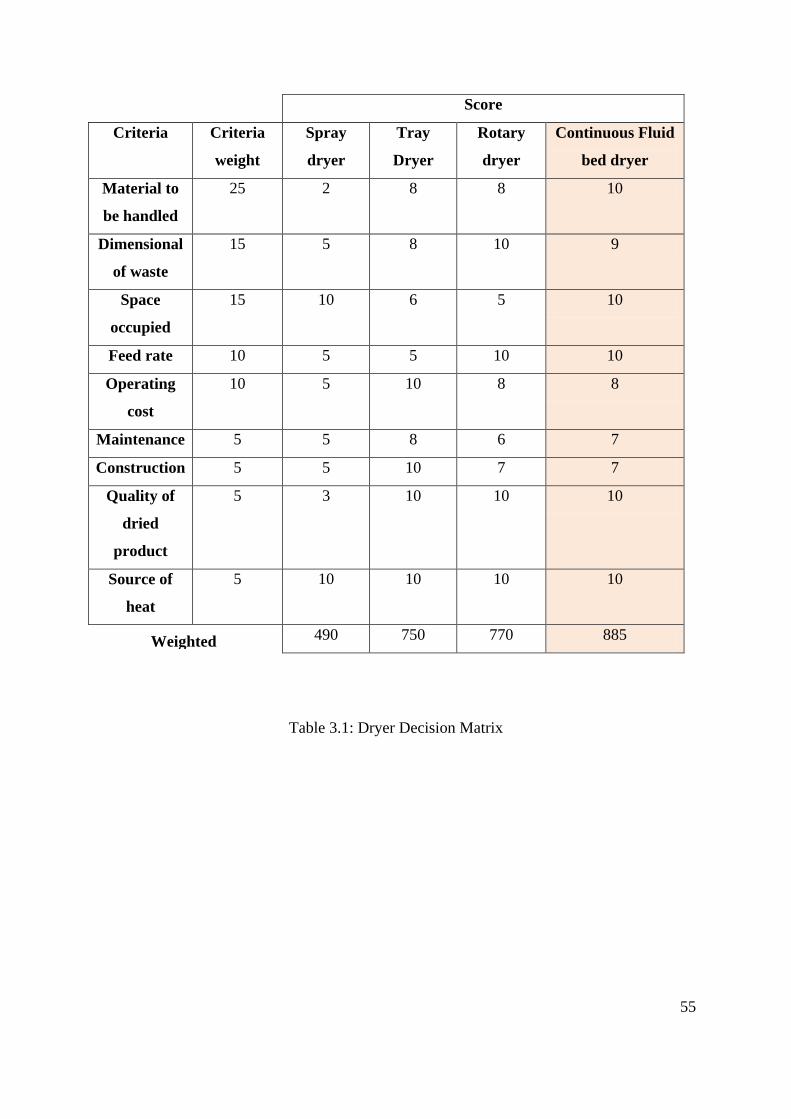
3.3.1: Selection Criteria (see Appendix A7)
The Criteria that help consideration consist of material to be handled, dimension of material,
size of material, space occupied, construction cost, operating cost, maintenance cost, feed
rate, source of heat and quality of dried product. All of the criteria are divided into weight
percentage, which is utilized to find a suitable type of desired dryer for the power plant.
Higher percentage means higher importance within the consideration criteria. (Criteria come
from discussion with the power plant owner, their engineering team and worker including not
only the design aspect, but also the financial, safety of work employee, durable, space etc.)
Material to be handled (25%): In order to select the type of dryer, the most important
that must take into consideration is the Material to be handled, which is fed into dryer.
This criterion is the most important because it compel dryer, whether the operation
can operate or not. The physical properties such as shape, rigidity and weight. The
chemical property such as liquid, rigid, viscosity and melting point. High suitable
material to dry operation means high score.
Dimensional of material (15%): Size of material is also important for dryer type some
design can run with big size such like granular, and some can run with very small size
such like powder. High suitable dimension to dry operation means high score.
Space occupied (15%): Due to the limited space from the plant, the space occupied is
established. High score means smaller space occupied from dryer
54
Feed rate (10%): The difference of feed type should be considered, which are
continuous feed and discontinuous feed (which is called batch) .For capacity to
operate, each dryer type can carry different of capacity at the given time. High
suitable feed rate to dry operation means high score.
Operating cost (10%): Due to the feed motor and blower, operating cost is produced.
Low operating cost means high score.
Maintenance cost (5%): Due to blower lubrication and life time, maintenance cost is
produced. Low maintenance cost means high score.
Construction cost (5%): Differences between dryer types are from the size and
complexity of operation. Low construction cost means high score.
Quality of dried product (5%): The product should not be melted along the dry
operation, otherwise the material could stick or block up the pipe that may increase
the maintenance cost. High quality product means high score.
Source of heat (5%): The input heat to blower should be considered. Whether the heat
is enough for dry operation. High input heat means high score.
55
Score
Criteria Criteria
weight
Spray
dryer
Tray
Dryer
Rotary
dryer
Continuous Fluid
bed dryer
Material to
be handled
25 2 8 8 10
Dimensional
of waste
15 5 8 10 9
Space
occupied
15 10 6 5 10
Feed rate 10 5 5 10 10
Operating
cost
10 5 10 8 8
Maintenance 5 5 8 6 7
Construction 5 5 10 7 7
Quality of
dried
product
5 3 10 10 10
Source of
heat
5 10 10 10 10
490 750 770 885
Table 3.1: Dryer Decision Matrix
Weighted
Score:
56
3.3.3 Conclusion of selection
Material to be handled: According to feed of material to dryer is solid property, with
light weight and slice shape. Thus, rotary dryer, continuous fluid bed dryer and tray dryer can
handle this kind of material. Note that continuous fluid bed dryer is the most suitable because
it’s normally handle on light weight material, which MSW is also light weight. Spray dryer is
not preferable because, normally spray dryer is normally used to handle liquid material and
powder.
Dimensional of material: The capability of drying which respective large-to-small size
of material are Rotary dryer, Continuous fluid bed dryer and Tray dryer. The MSW is 10 mm,
so the mentioned dryers can operate with this MSW. Because spray dryer can operate only
for very small size of material such as powder, so it’s not practical to use this dryer type.
Space occupied: Because of Spray dryer and Continuous fluid bed dryer required less
space than the other dryers.
Feed rate: According to type of feed through gasifier is the continuous feed, so rotary
dryer and Continuous fluid bed dryer are the most suitable to this feed type. But Tray dryer is
conventional used for discontinuous feed (batch). Due to the low capacity of feed if compare
to another types, it is not quite practical.
Operating cost: Due to equipment of drying system, Tray dryer provides the lowest
operating cost. For spray dryer, it has higher operating cost because it contains high pressure
equipments.
Maintenance: Normally maintenance cost of dryers, respectively from low-to-high,
are as follow Tray dryer, Continuous fluid bed dryer, Rotary dryer and Spay dryer.
Construction cost: According to Tray dryer is the most simply design, so the
construction cost is reduced. For spray dryer, it’s the most complex design.
Quality of dried product: For Rotary dryer, continuous fluid bed dryer and Tray dryer
produce same property of product, which is not melted. So it’s more suitable for use. But the
spray dryer can melt the material during operation, thus it is it’s not suitable to use.

57
Source of heat: Source of heat is hot gas that can be suitably used in all type of dryer.
According to the suitable of score that given to each type of dyer, we can conclude
that the most suitable type of dryer is continuous fluid bed dryer. Continuous fluid bed dryer
is close to the criteria. By the way, Rotary dryer and tray dryer come later. But the Spray
dryer is not practical for the criteria.
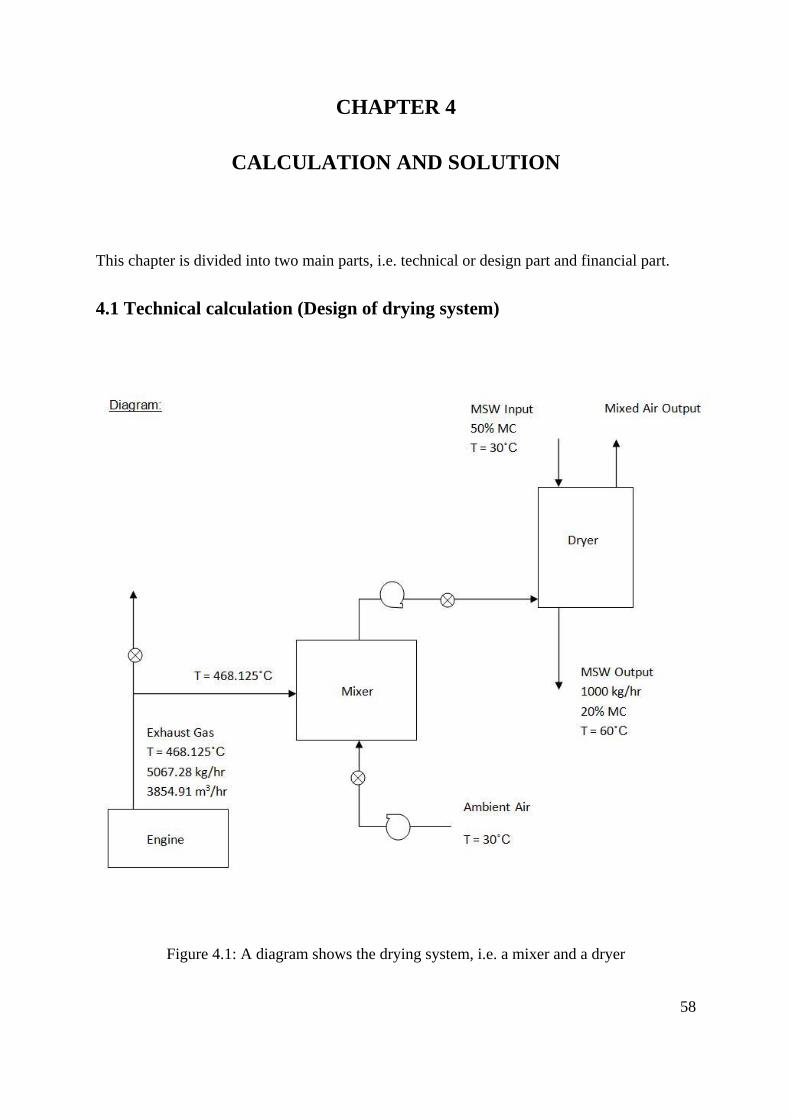
58
CHAPTER 4
CALCULATION AND SOLUTION
This chapter is divided into two main parts, i.e. technical or design part and financial part.
4.1 Technical calculation (Design of drying system)
Figure 4.1: A diagram shows the drying system, i.e. a mixer and a dryer
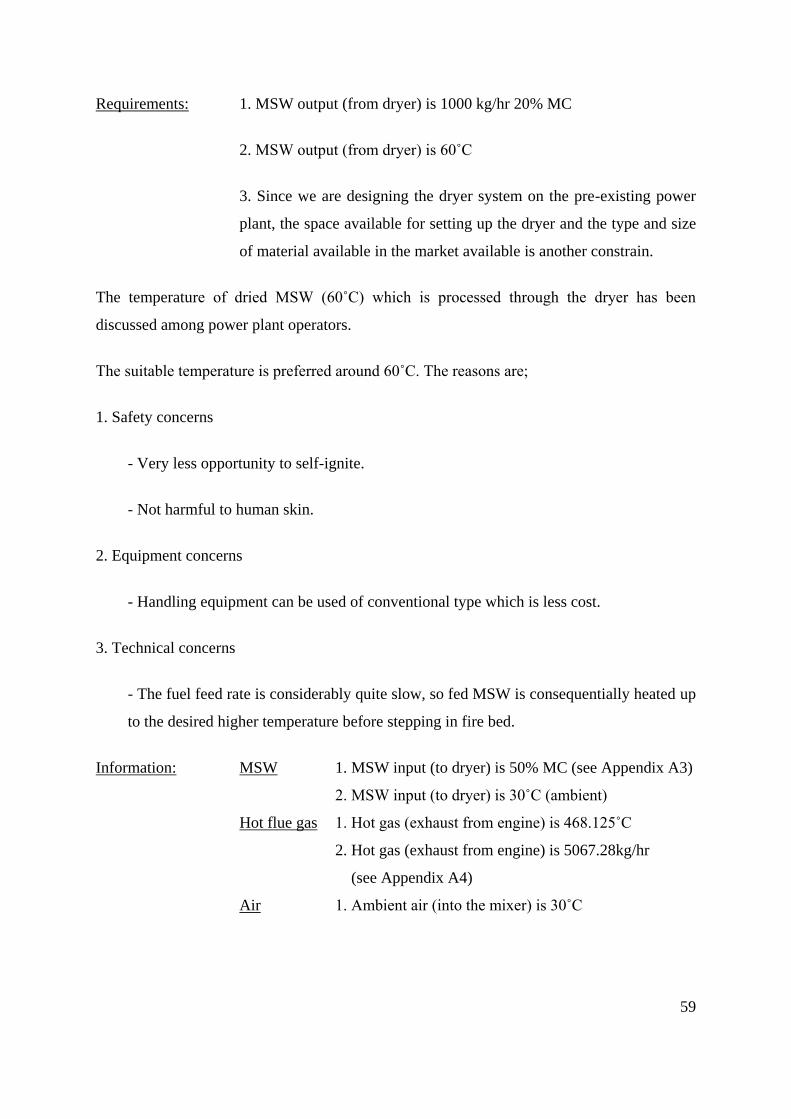
59
Requirements: 1. MSW output (from dryer) is 1000 kg/hr 20% MC
2. MSW output (from dryer) is 60˚C
3. Since we are designing the dryer system on the pre-existing power
plant, the space available for setting up the dryer and the type and size
of material available in the market available is another constrain.
The temperature of dried MSW (60˚C) which is processed through the dryer has been
discussed among power plant operators.
The suitable temperature is preferred around 60˚C. The reasons are;
1. Safety concerns
- Very less opportunity to self-ignite.
- Not harmful to human skin.
2. Equipment concerns
- Handling equipment can be used of conventional type which is less cost.
3. Technical concerns
- The fuel feed rate is considerably quite slow, so fed MSW is consequentially heated up
to the desired higher temperature before stepping in fire bed.
Information: MSW 1. MSW input (to dryer) is 50% MC (see Appendix A3)
2. MSW input (to dryer) is 30˚C (ambient)
Hot flue gas 1. Hot gas (exhaust from engine) is 468.125˚C
2. Hot gas (exhaust from engine) is 5067.28kg/hr
(see Appendix A4)
Air 1. Ambient air (into the mixer) is 30˚C
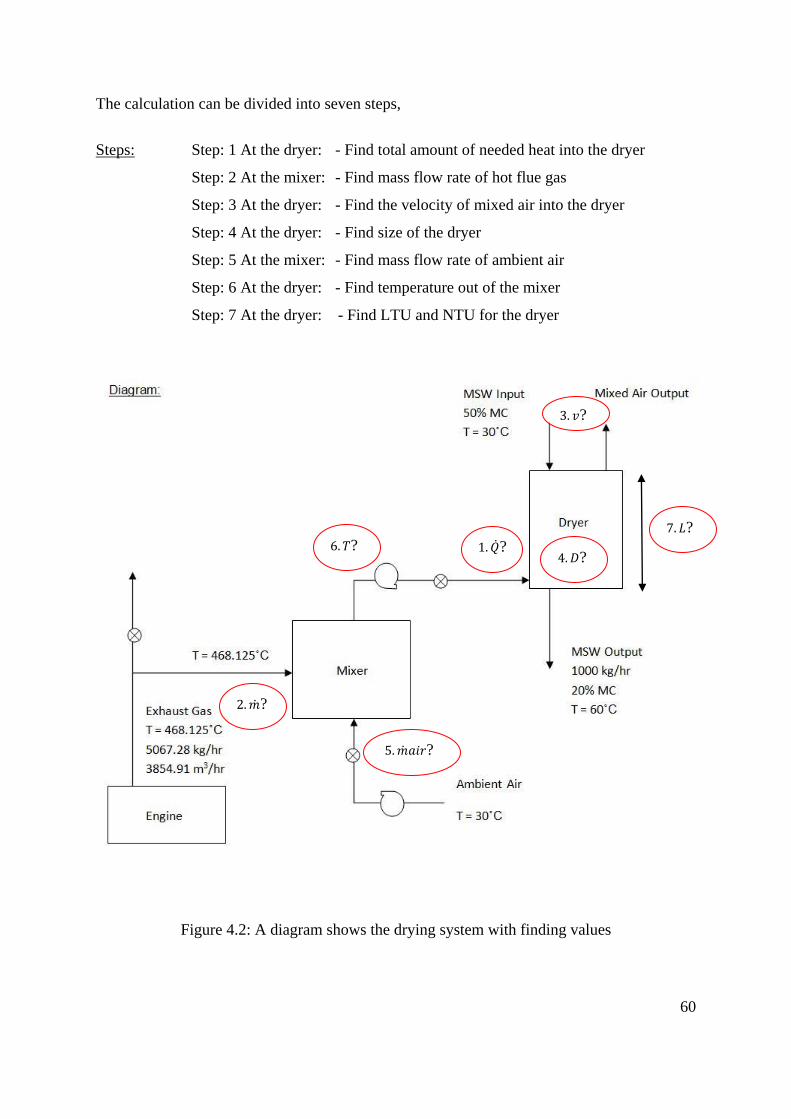
60
The calculation can be divided into seven steps,
Steps: Step: 1 At the dryer: - Find total amount of needed heat into the dryer
Step: 2 At the mixer: - Find mass flow rate of hot flue gas
Step: 3 At the dryer: - Find the velocity of mixed air into the dryer
Step: 4 At the dryer: - Find size of the dryer
Step: 5 At the mixer: - Find mass flow rate of ambient air
Step: 6 At the dryer: - Find temperature out of the mixer
Step: 7 At the dryer: - Find LTU and NTU for the dryer
Figure 4.2: A diagram shows the drying system with finding values
?
?
?
?
?
?
?
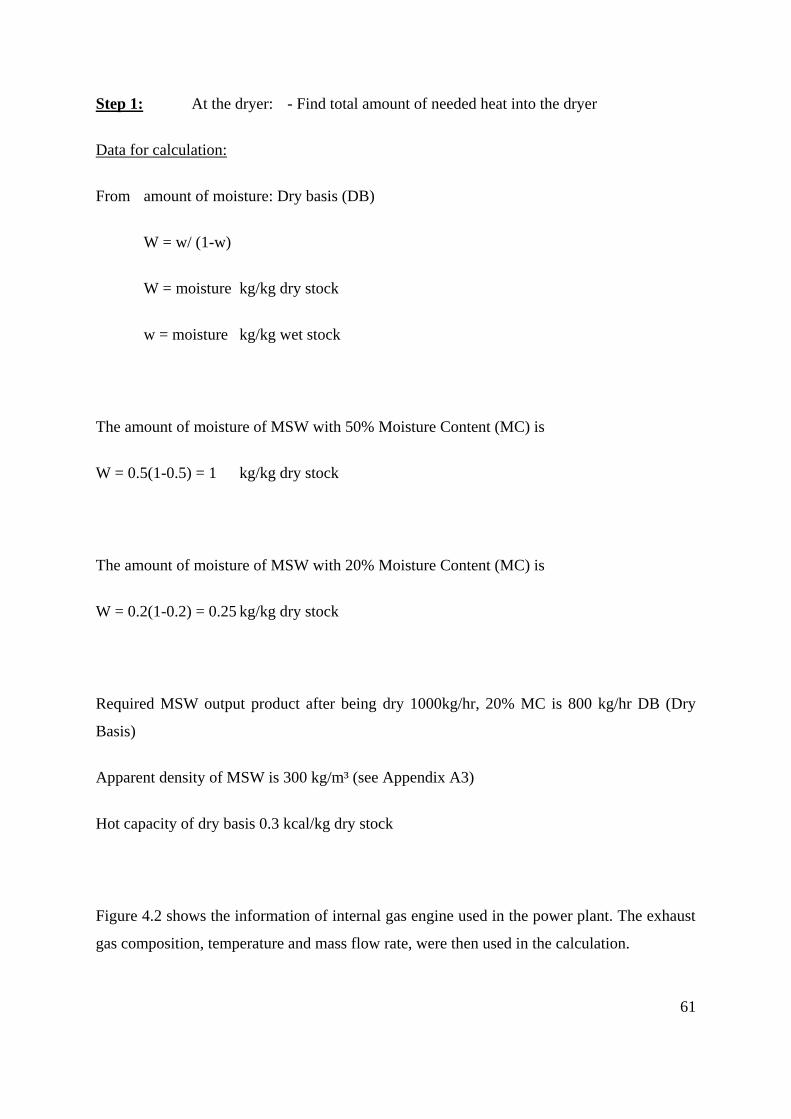
61
Step 1: At the dryer: - Find total amount of needed heat into the dryer
Data for calculation:
From amount of moisture: Dry basis (DB)
W = w/ (1-w)
W = moisture kg/kg dry stock
w = moisture kg/kg wet stock
The amount of moisture of MSW with 50% Moisture Content (MC) is
W = 0.5(1-0.5) = 1 kg/kg dry stock
The amount of moisture of MSW with 20% Moisture Content (MC) is
W = 0.2(1-0.2) = 0.25 kg/kg dry stock
Required MSW output product after being dry 1000kg/hr, 20% MC is 800 kg/hr DB (Dry
Basis)
Apparent density of MSW is 300 kg/m³ (see Appendix A3)
Hot capacity of dry basis 0.3 kcal/kg dry stock
Figure 4.2 shows the information of internal gas engine used in the power plant. The exhaust
gas composition, temperature and mass flow rate, were then used in the calculation.
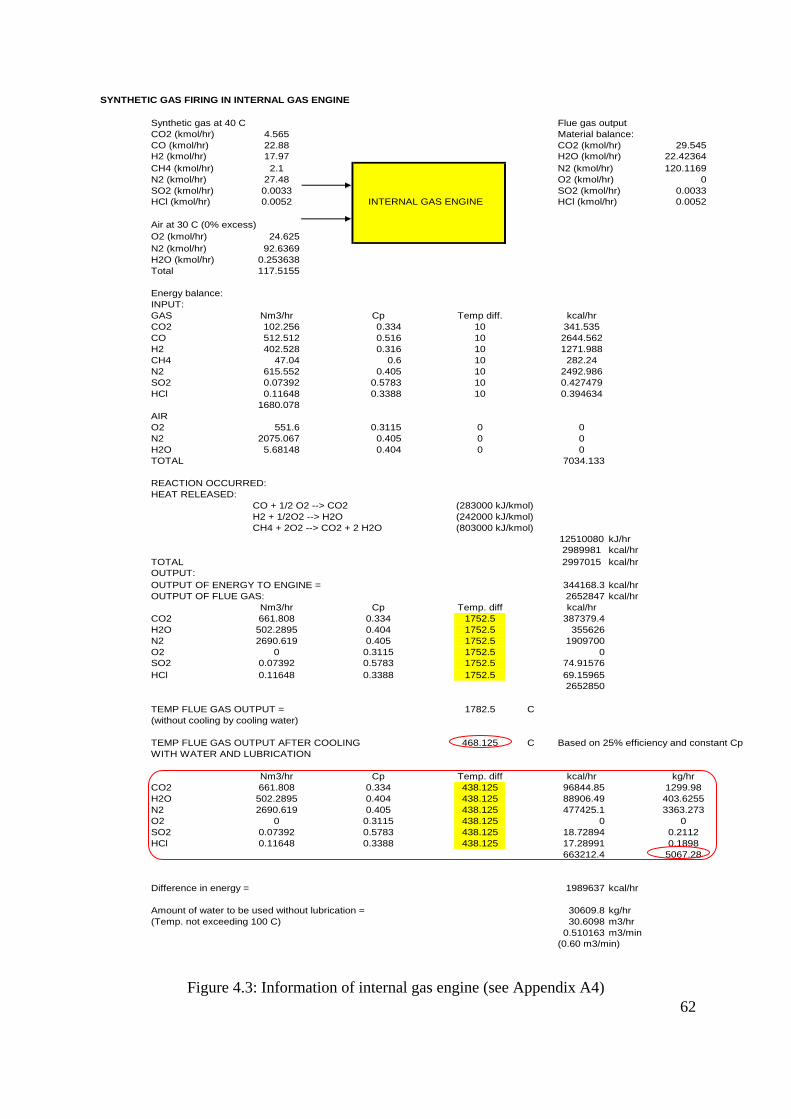
62
Figure 4.3: Information of internal gas engine (see Appendix A4)
SYNTHETIC GAS FIRING IN INTERNAL GAS ENGINE
Synthetic gas at 40 C Flue gas output
CO2 (kmol/hr) 4.565 Material balance:
CO (kmol/hr) 22.88 CO2 (kmol/hr) 29.545
H2 (kmol/hr) 17.97 H2O (kmol/hr) 22.42364
CH4 (kmol/hr) 2.1 N2 (kmol/hr) 120.1169
N2 (kmol/hr) 27.48 O2 (kmol/hr) 0
SO2 (kmol/hr) 0.0033 SO2 (kmol/hr) 0.0033
HCl (kmol/hr) 0.0052 INTERNAL GAS ENGINE HCl (kmol/hr) 0.0052
Air at 30 C (0% excess)
O2 (kmol/hr) 24.625
N2 (kmol/hr) 92.6369
H2O (kmol/hr) 0.253638
Total 117.5155
Energy balance:
INPUT:
GAS Nm3/hr Cp Temp diff. kcal/hr
CO2 102.256 0.334 10 341.535
CO 512.512 0.516 10 2644.562
H2 402.528 0.316 10 1271.988
CH4 47.04 0.6 10 282.24
N2 615.552 0.405 10 2492.986
SO2 0.07392 0.5783 10 0.427479
HCl 0.11648 0.3388 10 0.394634
1680.078
AIR
O2 551.6 0.3115 0 0
N2 2075.067 0.405 0 0
H2O 5.68148 0.404 0 0
TOTAL 7034.133
REACTION OCCURRED:
HEAT RELEASED:
CO + 1/2 O2 --> CO2 (283000 kJ/kmol)
H2 + 1/2O2 --> H2O (242000 kJ/kmol)
CH4 + 2O2 --> CO2 + 2 H2O (803000 kJ/kmol)
12510080 kJ/hr
2989981 kcal/hr
TOTAL 2997015 kcal/hr
OUTPUT:
OUTPUT OF ENERGY TO ENGINE = 344168.3 kcal/hr
OUTPUT OF FLUE GAS: 2652847 kcal/hr
Nm3/hr Cp Temp. diff kcal/hr
CO2 661.808 0.334 1752.5 387379.4
H2O 502.2895 0.404 1752.5 355626
N2 2690.619 0.405 1752.5 1909700
O2 0 0.3115 1752.5 0
SO2 0.07392 0.5783 1752.5 74.91576
HCl 0.11648 0.3388 1752.5 69.15965
2652850
TEMP FLUE GAS OUTPUT = 1782.5 C
(without cooling by cooling water)
TEMP FLUE GAS OUTPUT AFTER COOLING 468.125 C Based on 25% efficiency and constant Cp
WITH WATER AND LUBRICATION
Nm3/hr Cp Temp. diff kcal/hr kg/hr
CO2 661.808 0.334 438.125 96844.85 1299.98
H2O 502.2895 0.404 438.125 88906.49 403.6255
N2 2690.619 0.405 438.125 477425.1 3363.273
O2 0 0.3115 438.125 0 0
SO2 0.07392 0.5783 438.125 18.72894 0.2112
HCl 0.11648 0.3388 438.125 17.28991 0.1898
663212.4 5067.28
Difference in energy = 1989637 kcal/hr
Amount of water to be used without lubrication = 30609.8 kg/hr
(Temp. not exceeding 100 C) 30.6098 m3/hr
0.510163 m3/min
(0.60 m3/min)
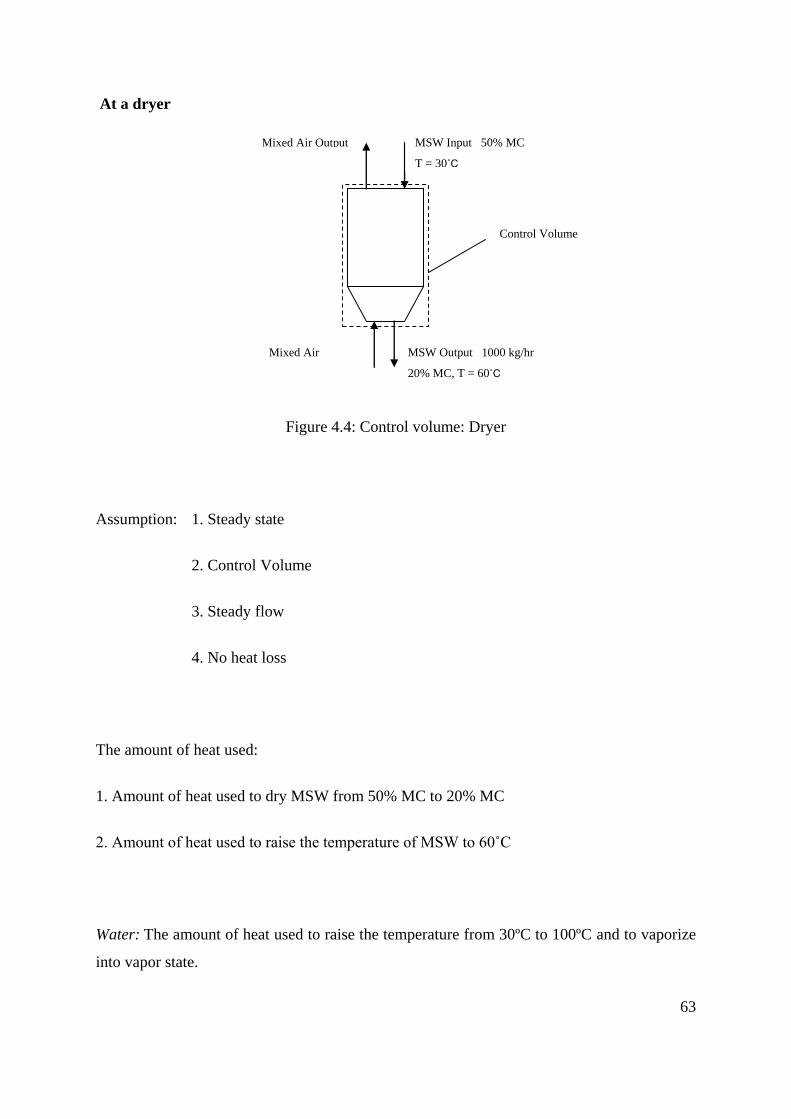
63
At a dryer
Figure 4.4: Control volume: Dryer
Assumption: 1. Steady state
2. Control Volume
3. Steady flow
4. No heat loss
The amount of heat used:
1. Amount of heat used to dry MSW from 50% MC to 20% MC
2. Amount of heat used to raise the temperature of MSW to 60˚C
Water: The amount of heat used to raise the temperature from 30ºC to 100ºC and to vaporize
into vapor state.
MSW Output 1000 kg/hr
20% MC, T = 60˚C
MSW Input 50% MC
T = 30˚C
Mixed Air Output
Mixed Air
Input
Control Volume
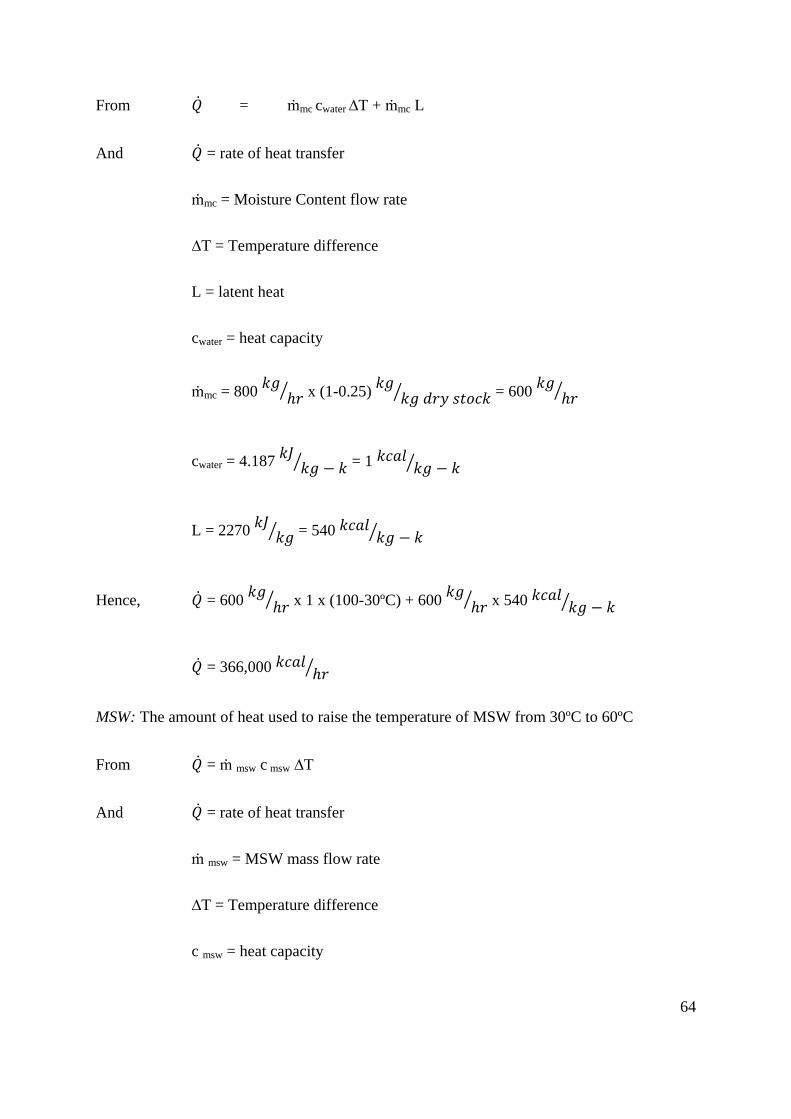
64
From = ṁmc cwater ∆T + ṁmc L
And = rate of heat transfer
ṁmc = Moisture Content flow rate
∆T = Temperature difference
L = latent heat
cwater = heat capacity
ṁmc = 800
x (1-0.25)
= 600
cwater = 4.187
= 1
L = 2270
= 540
Hence, = 600
x 1 x (100-30ºC) + 600
x 540
= 366,000
MSW: The amount of heat used to raise the temperature of MSW from 30ºC to 60ºC
From = ṁ msw c msw ∆T
And = rate of heat transfer
ṁ msw = MSW mass flow rate
∆T = Temperature difference
c msw = heat capacity
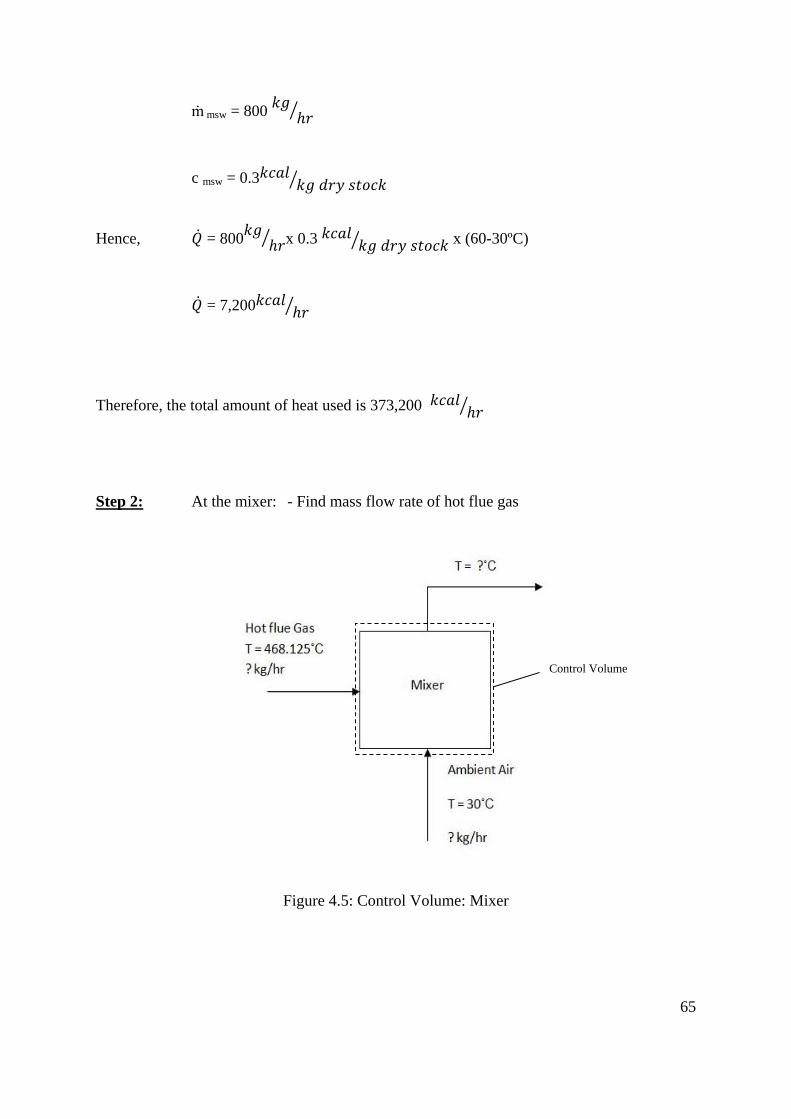
65
ṁ msw = 800
c msw = 0.3
Hence, = 800
x 0.3 x (60-30ºC)
= 7,200
Therefore, the total amount of heat used is 373,200
Step 2: At the mixer: - Find mass flow rate of hot flue gas
Figure 4.5: Control Volume: Mixer
Control Volume
66
Assumption: 1. Steady state
2. Control Volume
3. Steady flow
4. No heat loss
Figure 4.6: The unknown values; hot flue gas mass flow rate, air mass flow rate and mixed
air temperature
Ideal Gas Law
An ideal gas is defined as the equation of state of a hypothetical ideal gas whereby all
collisions are perfectly elastic and do not interact with each other (there aren’t any
intermolecular attractive forces between molecules or atoms).In such gases, any change in
internal energy is accompanied by a change in temperature. One mole of an ideal gas at STP
occupies 22.4 liters.
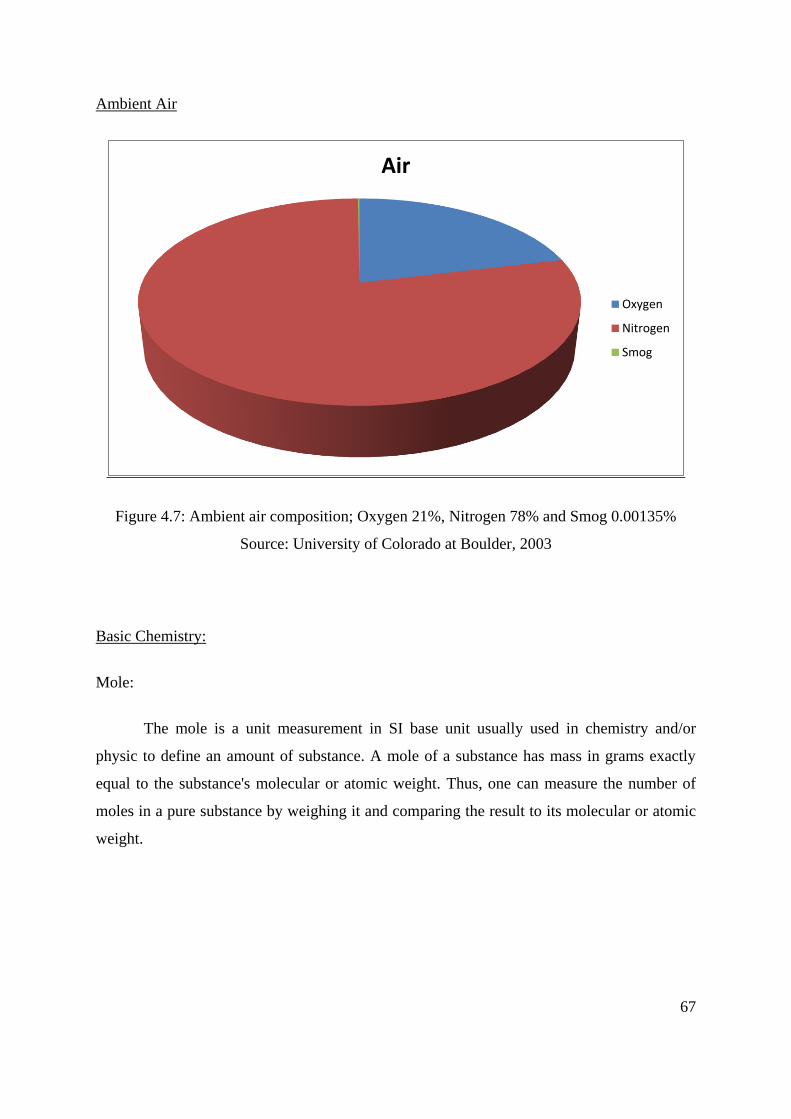
67
Ambient Air
Figure 4.7: Ambient air composition; Oxygen 21%, Nitrogen 78% and Smog 0.00135%
Source: University of Colorado at Boulder, 2003
Basic Chemistry:
Mole:
The mole is a unit measurement in SI base unit usually used in chemistry and/or
physic to define an amount of substance. A mole of a substance has mass in grams exactly
equal to the substance's molecular or atomic weight. Thus, one can measure the number of
moles in a pure substance by weighing it and comparing the result to its molecular or atomic
weight.
Air
Oxygen
Nitrogen
Smog
68
Molecular Mass:
The molecular mass of a substance is the mass of 1 mol (equal to 1/12 the mass of one
isotope of carbon-12). The most common units of molar mass is g/mol because the numerical
value equals the average molecular mass in units of u. It differs from molar mass by taking
into account the isotopic composition of a molecule rather than the average isotopic
distribution of many molecules. As a result, molecular mass is a more precise number. Thus,
it is more accurate to use molar mass on bulk samples. In other words, mass is appropriate
most of the time except when dealing with single molecules.
Energy Balance and Mass Balance Concept
Energy balances states that the law implies that mass can neither be created nor
destroyed. Thus, for any closed system, all transfers of matter and energy, both of which have
mass, must remain constant over time as within the system mass cannot change quantity if it
is not added or removed. By accounting for material entering and leaving a system, mass
flows can be identified which might have been unknown, or difficult to measure without this
technique. The exact conservation law used in the analysis of the system depends on the
context of the problem but all revolve around mass conservation, i.e. that matter cannot
disappear or be created spontaneously.
Energy Balance: Energy input = Energy output (from the first law of thermodynamics)
Hence, the quantity of mass is "conserved" over time and is widely used in many fields such
as chemistry, mechanics, and fluid dynamics.
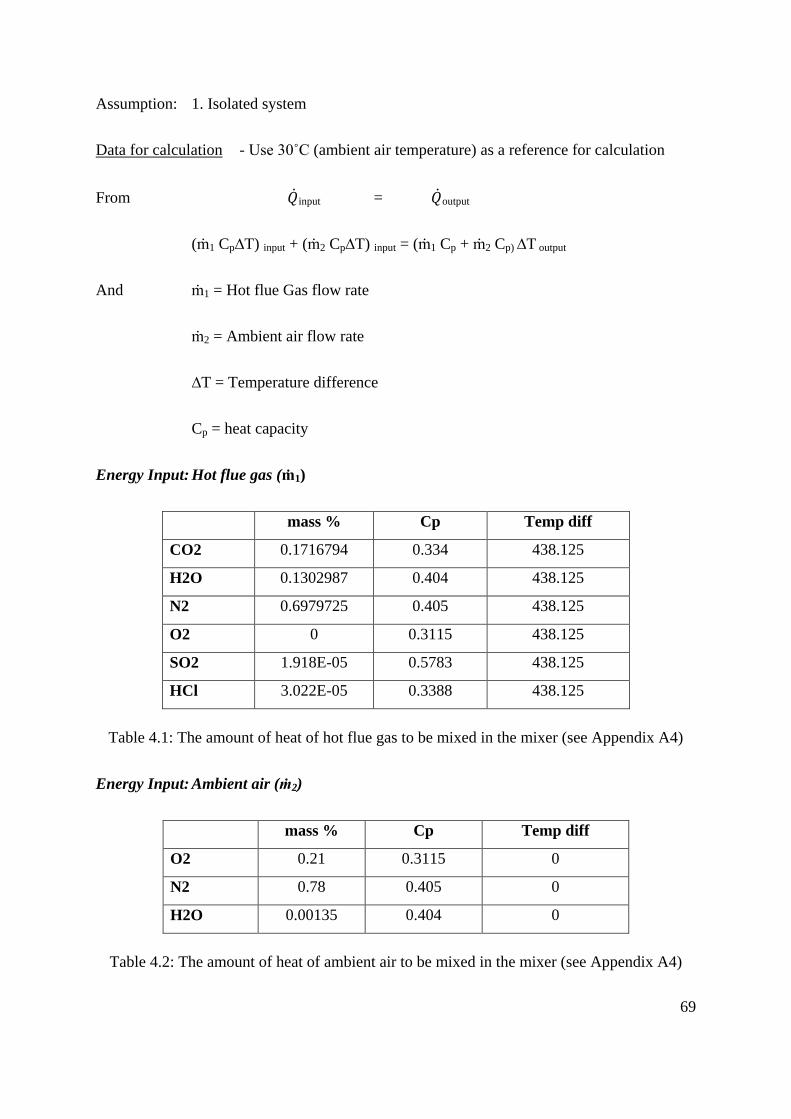
69
Assumption: 1. Isolated system
Data for calculation - Use 30˚C (ambient air temperature) as a reference for calculation
From input = output
(ṁ1 Cp∆T) input + (ṁ2 Cp∆T) input = (ṁ1 Cp + ṁ2 Cp) ∆T output
And ṁ1 = Hot flue Gas flow rate
ṁ2 = Ambient air flow rate
∆T = Temperature difference
Cp = heat capacity
Energy Input: Hot flue gas (ṁ1)
mass % Cp Temp diff
CO2 0.1716794 0.334 438.125
H2O 0.1302987 0.404 438.125
N2 0.6979725 0.405 438.125
O2 0 0.3115 438.125
SO2 1.918E-05 0.5783 438.125
HCl 3.022E-05 0.3388 438.125
Table 4.1: The amount of heat of hot flue gas to be mixed in the mixer (see Appendix A4)
Energy Input: Ambient air (ṁ2)
mass % Cp Temp diff
O2 0.21 0.3115 0
N2 0.78 0.405 0
H2O 0.00135 0.404 0
Table 4.2: The amount of heat of ambient air to be mixed in the mixer (see Appendix A4)
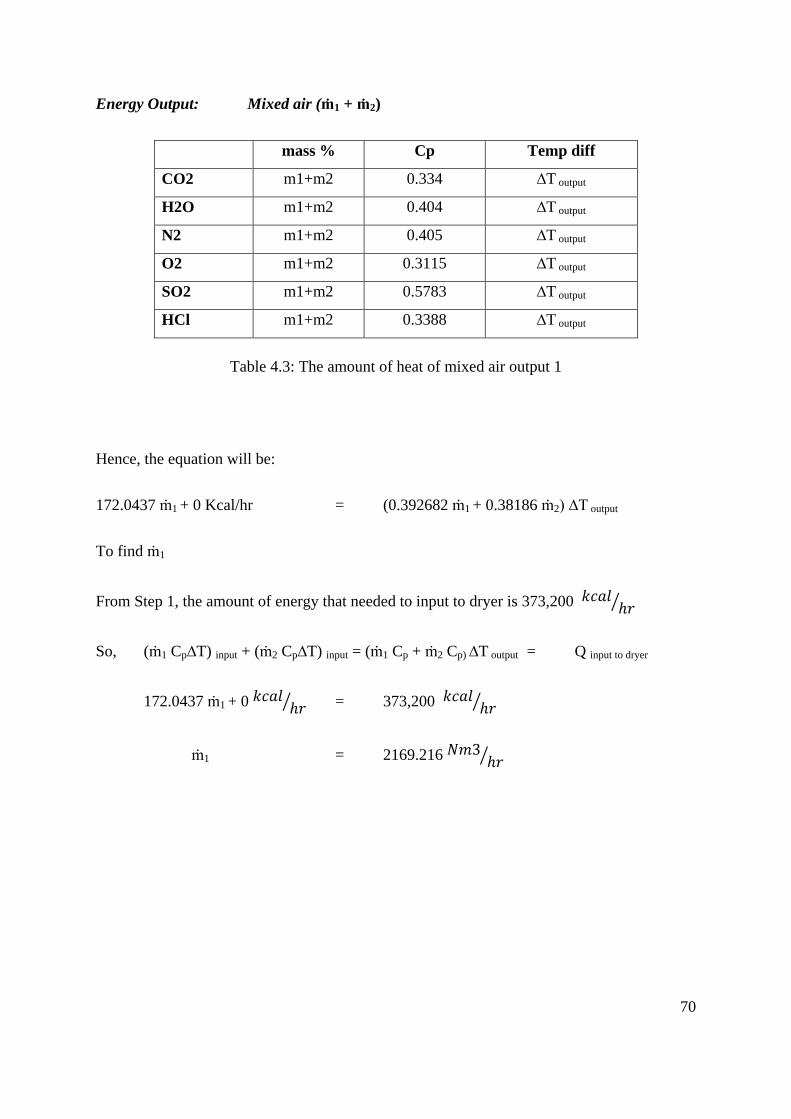
70
Energy Output: Mixed air (ṁ1 + ṁ2)
mass % Cp Temp diff
CO2 m1+m2 0.334 ∆T output
H2O m1+m2 0.404 ∆T output
N2 m1+m2 0.405 ∆T output
O2 m1+m2 0.3115 ∆T output
SO2 m1+m2 0.5783 ∆T output
HCl m1+m2 0.3388 ∆T output
Table 4.3: The amount of heat of mixed air output 1
Hence, the equation will be:
172.0437 ṁ1 + 0 Kcal/hr = (0.392682 ṁ1 + 0.38186 ṁ2) ∆T output
To find ṁ1
From Step 1, the amount of energy that needed to input to dryer is 373,200
So, (ṁ1 Cp∆T) input + (ṁ2 Cp∆T) input = (ṁ1 Cp + ṁ2 Cp) ∆T output = Q input to dryer
172.0437 ṁ1 + 0 = 373,200
ṁ1 = 2169.216
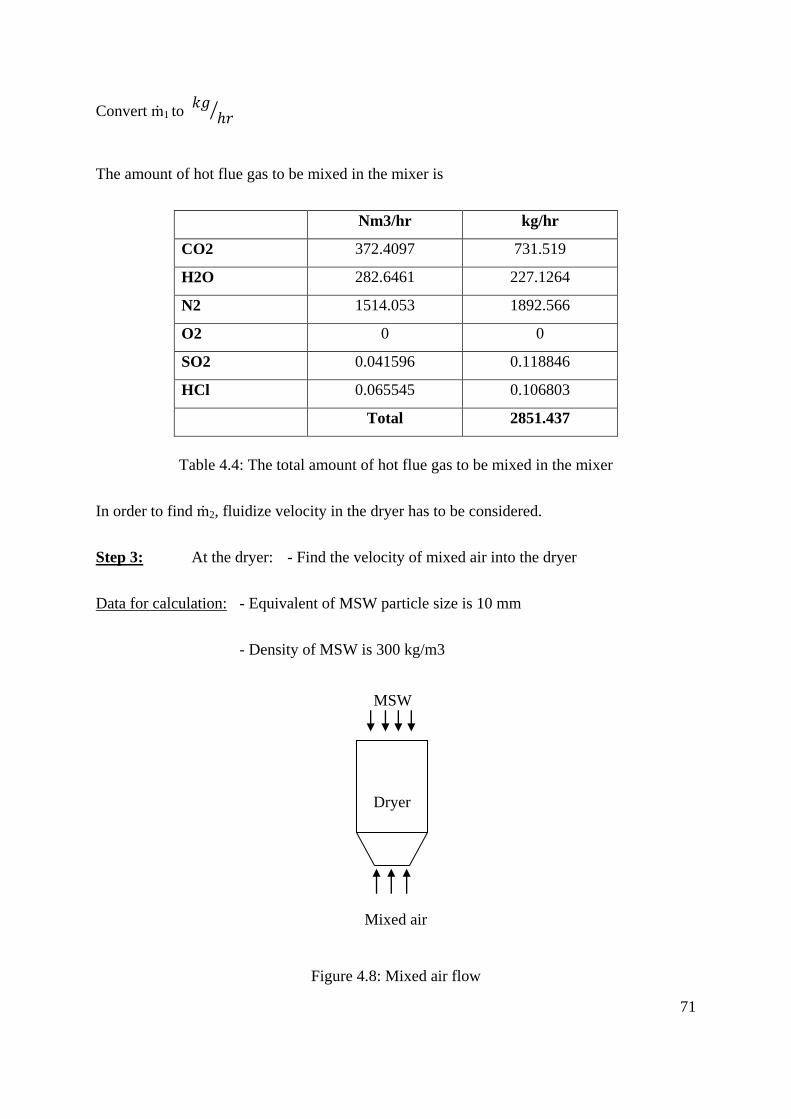
71
Convert ṁ1 to
The amount of hot flue gas to be mixed in the mixer is
Nm3/hr kg/hr
CO2 372.4097 731.519
H2O 282.6461 227.1264
N2 1514.053 1892.566
O2 0 0
SO2 0.041596 0.118846
HCl 0.065545 0.106803
Total 2851.437
Table 4.4: The total amount of hot flue gas to be mixed in the mixer
In order to find ṁ2, fluidize velocity in the dryer has to be considered.
Step 3: At the dryer: - Find the velocity of mixed air into the dryer
Data for calculation: - Equivalent of MSW particle size is 10 mm
- Density of MSW is 300 kg/m3
Figure 4.8: Mixed air flow
Mixed air
flow
Dryer
MSW
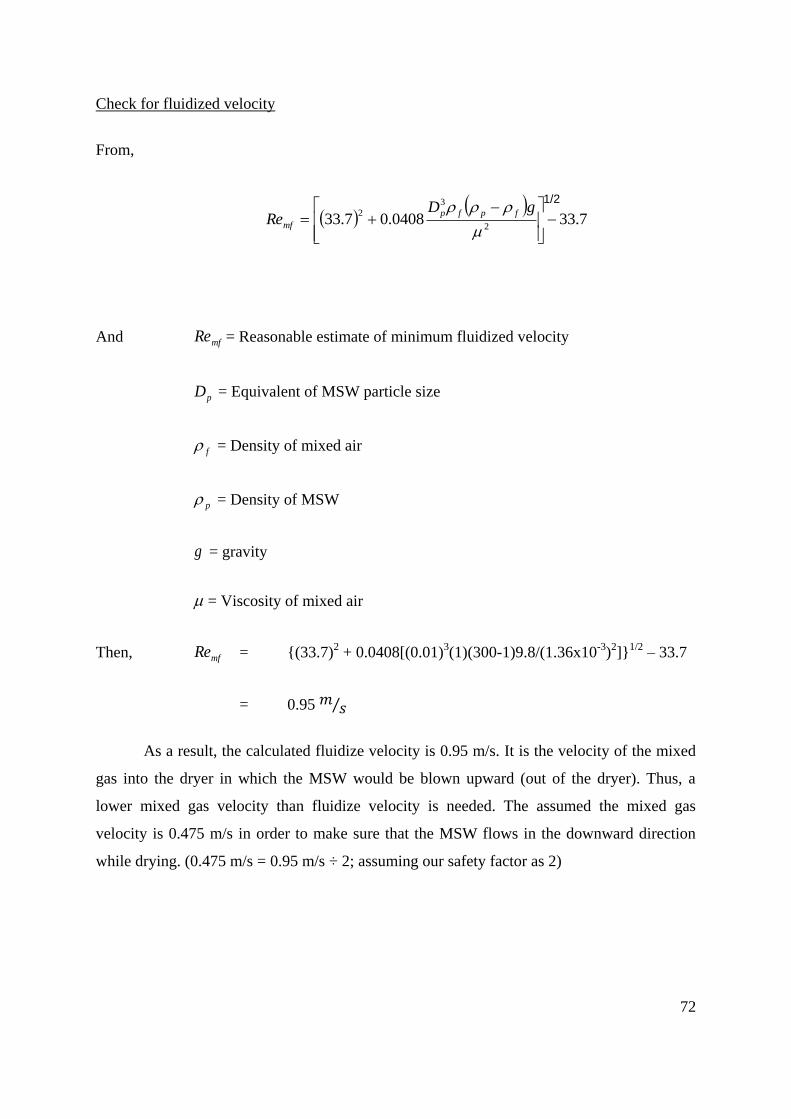
72
Check for fluidized velocity
From,
And mfRe = Reasonable estimate of minimum fluidized velocity
pD = Equivalent of MSW particle size
f = Density of mixed air
p = Density of MSW
g = gravity
= Viscosity of mixed air
Then, mfRe = {(33.7)2 + 0.0408[(0.01)
3(1)(300-1)9.8/(1.36x10
-3)
2]}
1/2 – 33.7
= 0.95
As a result, the calculated fluidize velocity is 0.95 m/s. It is the velocity of the mixed
gas into the dryer in which the MSW would be blown upward (out of the dryer). Thus, a
lower mixed gas velocity than fluidize velocity is needed. The assumed the mixed gas
velocity is 0.475 m/s in order to make sure that the MSW flows in the downward direction
while drying. (0.475 m/s = 0.95 m/s ÷ 2; assuming our safety factor as 2)
7.330408.07.332
3
2
gDRe
fpfp
mf
1/2
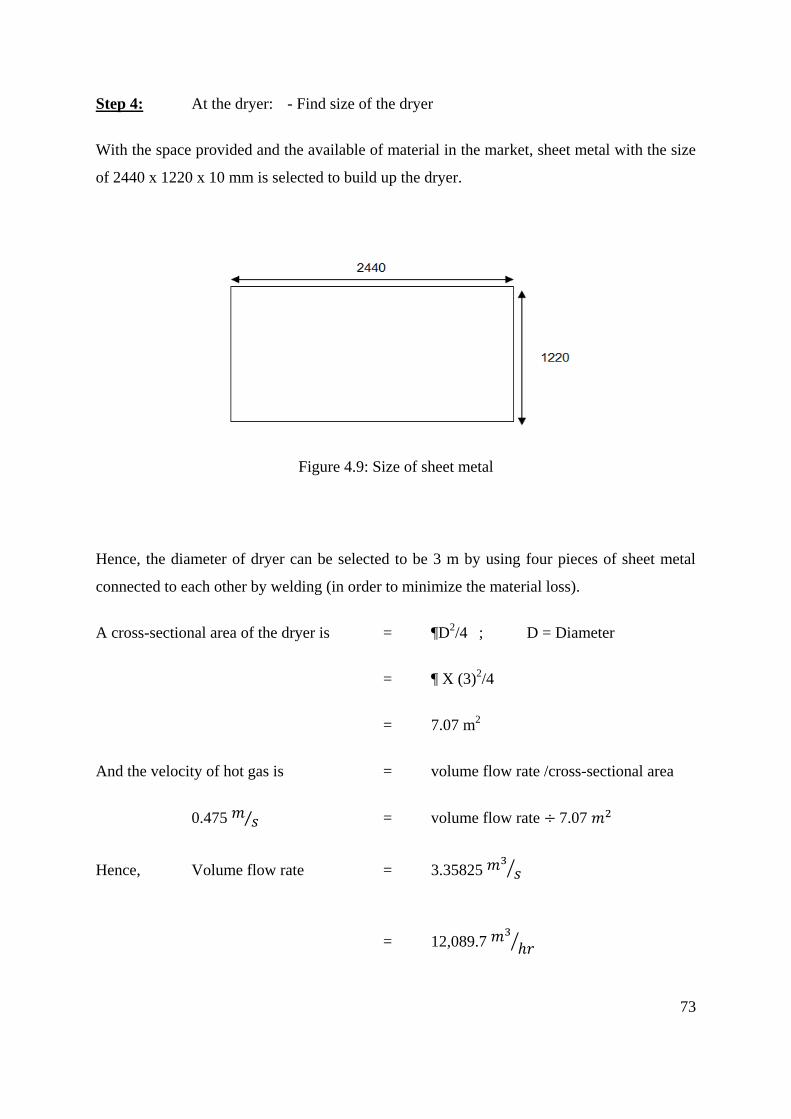
73
Step 4: At the dryer: - Find size of the dryer
With the space provided and the available of material in the market, sheet metal with the size
of 2440 x 1220 x 10 mm is selected to build up the dryer.
Figure 4.9: Size of sheet metal
Hence, the diameter of dryer can be selected to be 3 m by using four pieces of sheet metal
connected to each other by welding (in order to minimize the material loss).
A cross-sectional area of the dryer is = ¶D2/4 ; D = Diameter
= ¶ X (3)2/4
= 7.07 m2
And the velocity of hot gas is = volume flow rate /cross-sectional area
0.475 = volume flow rate 7.07
Hence, Volume flow rate = 3.35825
= 12,089.7
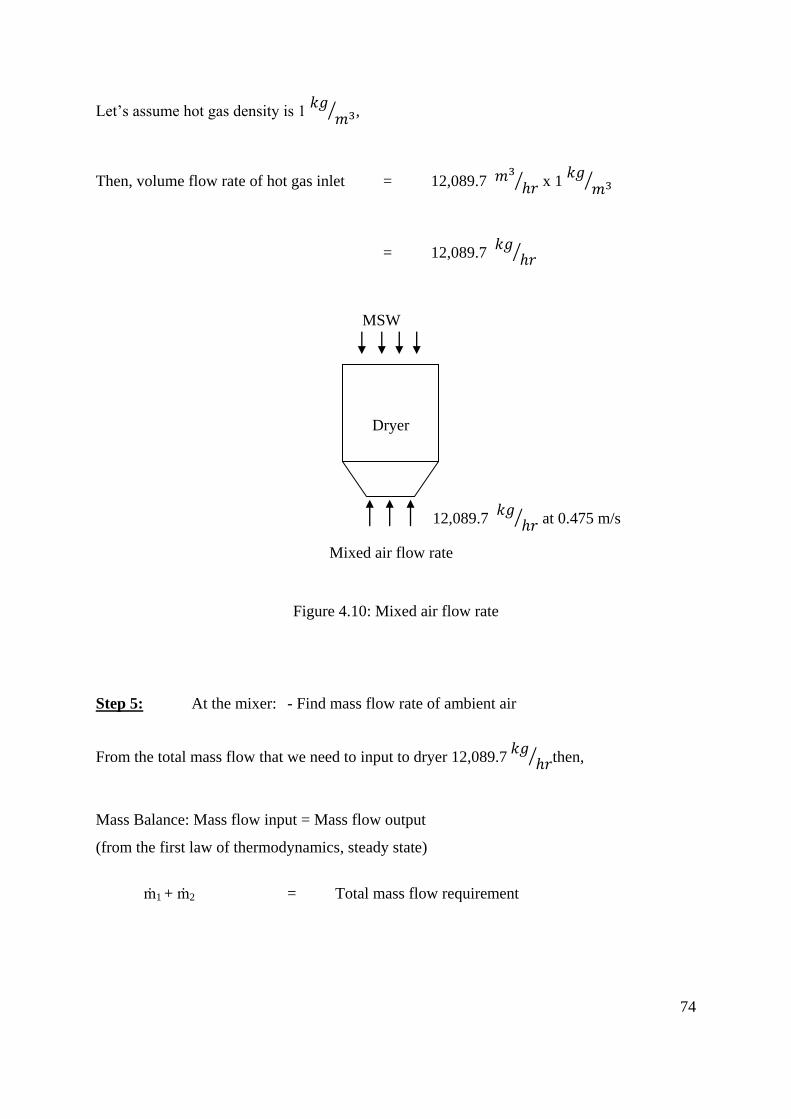
74
Let’s assume hot gas density is 1
,
Then, volume flow rate of hot gas inlet = 12,089.7
x 1
= 12,089.7
Figure 4.10: Mixed air flow rate
Step 5: At the mixer: - Find mass flow rate of ambient air
From the total mass flow that we need to input to dryer 12,089.7
then,
Mass Balance: Mass flow input = Mass flow output
(from the first law of thermodynamics, steady state)
ṁ1 + ṁ2 = Total mass flow requirement
Mixed air flow rate
Dryer
MSW
12,089.7
at 0.475 m/s
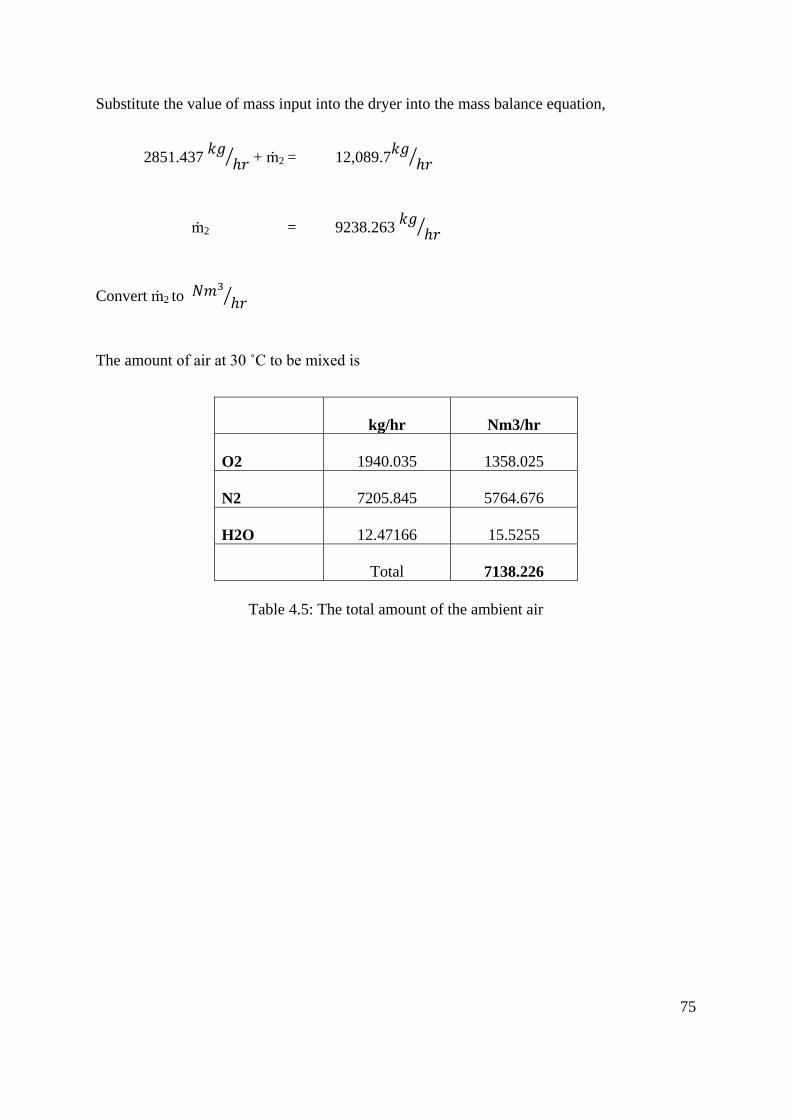
75
Substitute the value of mass input into the dryer into the mass balance equation,
2851.437
+ ṁ2 = 12,089.7
ṁ2 = 9238.263
Convert ṁ2 to
The amount of air at 30 ˚C to be mixed is
kg/hr Nm3/hr
O2 1940.035 1358.025
N2 7205.845 5764.676
H2O 12.47166 15.5255
Total 7138.226
Table 4.5: The total amount of the ambient air
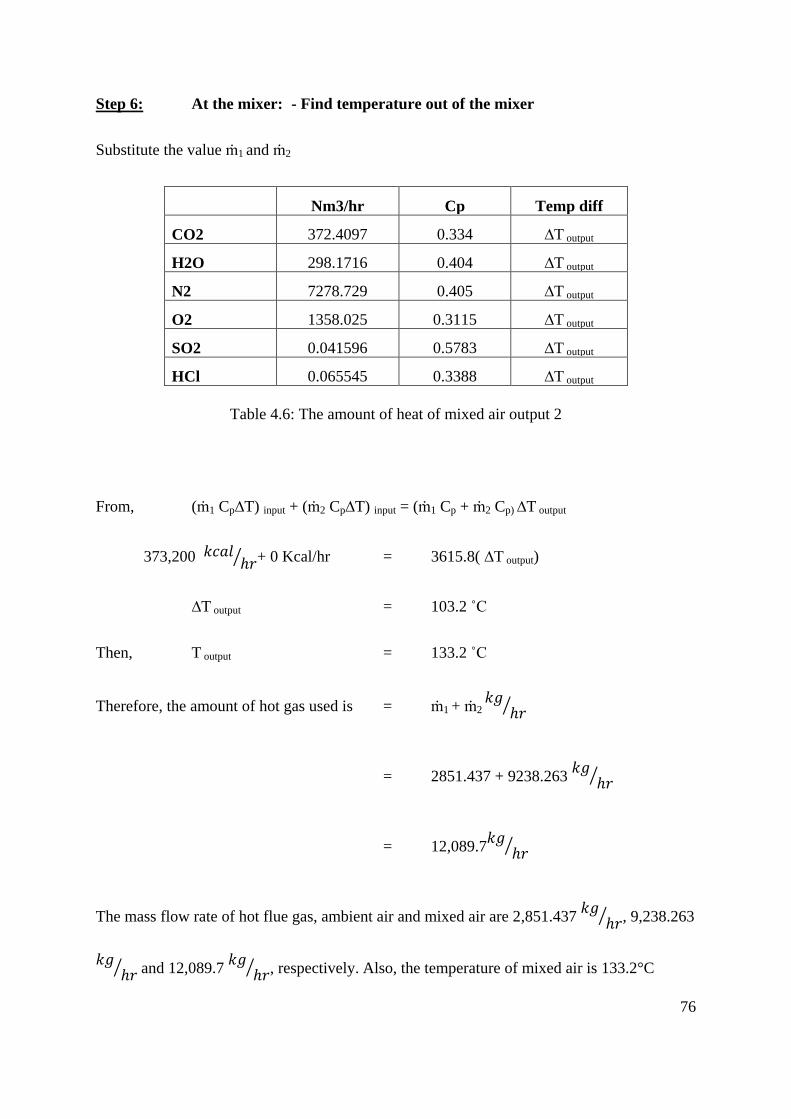
76
Step 6: At the mixer: - Find temperature out of the mixer
Substitute the value ṁ1 and ṁ2
Nm3/hr Cp Temp diff
CO2 372.4097 0.334 ∆T output
H2O 298.1716 0.404 ∆T output
N2 7278.729 0.405 ∆T output
O2 1358.025 0.3115 ∆T output
SO2 0.041596 0.5783 ∆T output
HCl 0.065545 0.3388 ∆T output
Table 4.6: The amount of heat of mixed air output 2
From, (ṁ1 Cp∆T) input + (ṁ2 Cp∆T) input = (ṁ1 Cp + ṁ2 Cp) ∆T output
373,200 + 0 Kcal/hr = 3615.8( ∆T output)
∆T output = 103.2 ˚C
Then, T output = 133.2 ˚C
Therefore, the amount of hot gas used is = ṁ1 + ṁ2
= 2851.437 + 9238.263
= 12,089.7
The mass flow rate of hot flue gas, ambient air and mixed air are 2,851.437
, 9,238.263
and 12,089.7
, respectively. Also, the temperature of mixed air is 133.2°C
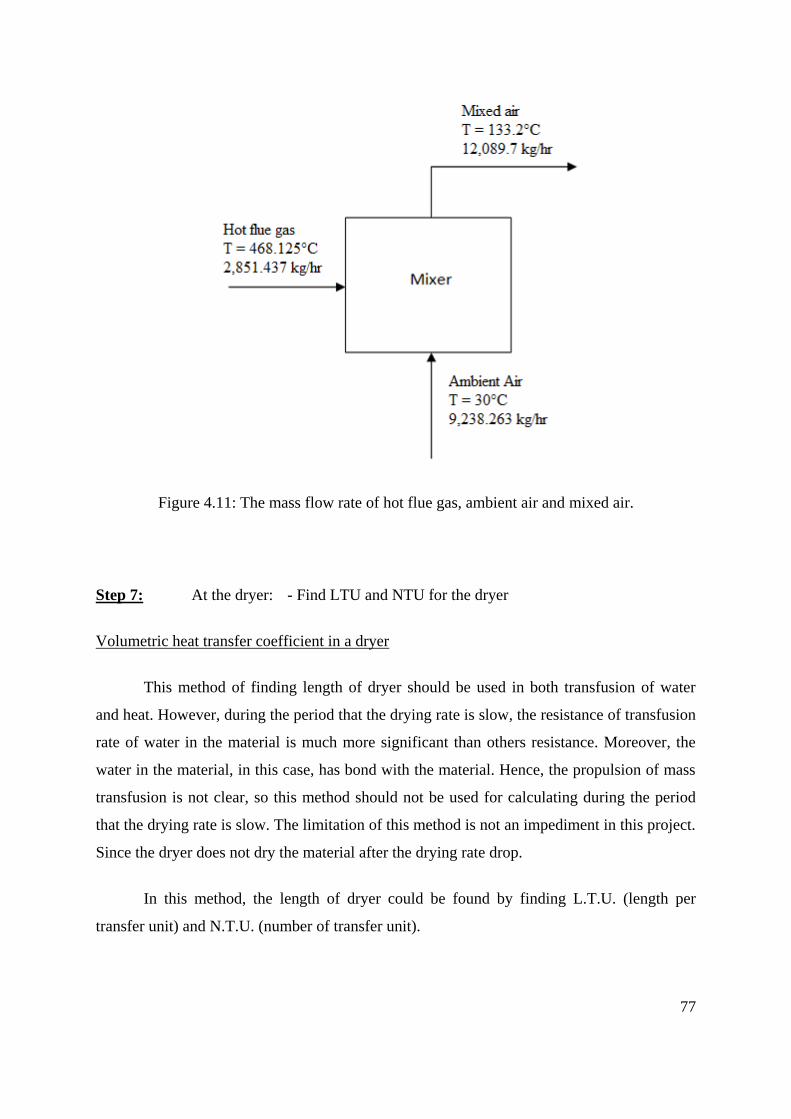
77
Figure 4.11: The mass flow rate of hot flue gas, ambient air and mixed air.
Step 7: At the dryer: - Find LTU and NTU for the dryer
Volumetric heat transfer coefficient in a dryer
This method of finding length of dryer should be used in both transfusion of water
and heat. However, during the period that the drying rate is slow, the resistance of transfusion
rate of water in the material is much more significant than others resistance. Moreover, the
water in the material, in this case, has bond with the material. Hence, the propulsion of mass
transfusion is not clear, so this method should not be used for calculating during the period
that the drying rate is slow. The limitation of this method is not an impediment in this project.
Since the dryer does not dry the material after the drying rate drop.
In this method, the length of dryer could be found by finding L.T.U. (length per
transfer unit) and N.T.U. (number of transfer unit).
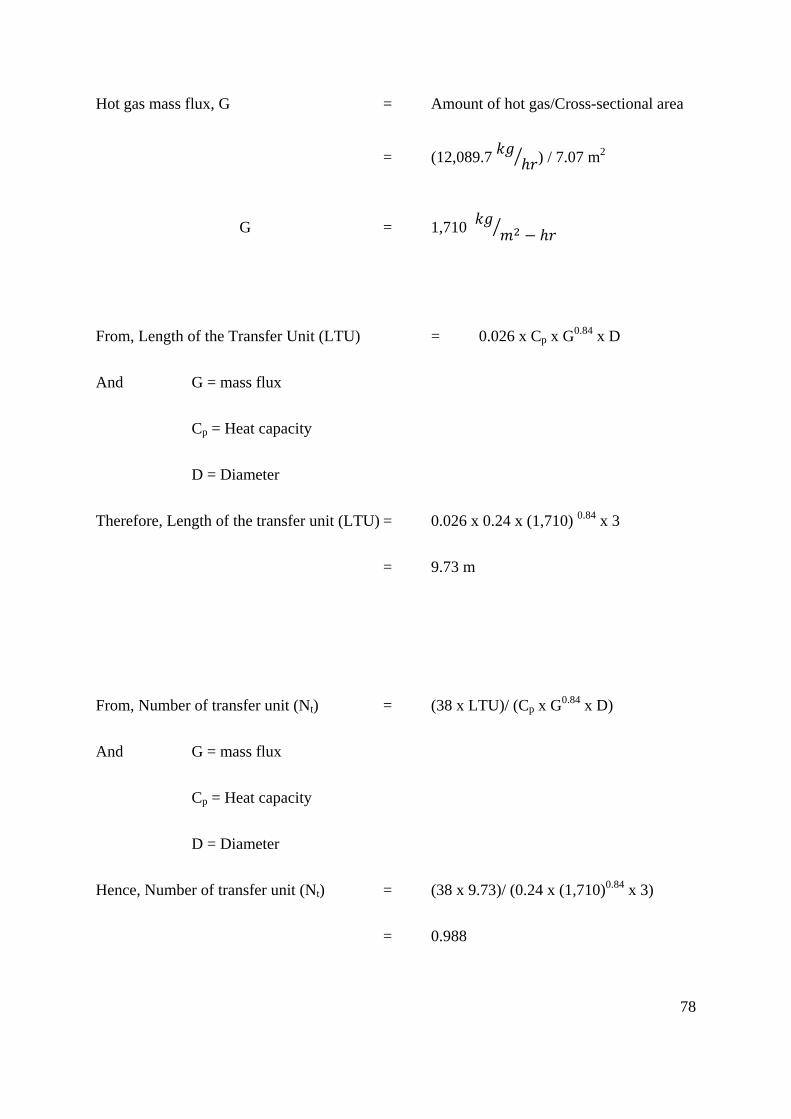
78
Hot gas mass flux, G = Amount of hot gas/Cross-sectional area
= (12,089.7
) / 7.07 m
2
G = 1,710
From, Length of the Transfer Unit (LTU)
= 0.026 x Cp x G0.84
x D
And G = mass flux
Cp = Heat capacity
D = Diameter
Therefore, Length of the transfer unit (LTU) = 0.026 x 0.24 x (1,710) 0.84
x 3
= 9.73 m
From, Number of transfer unit (Nt) = (38 x LTU)/ (Cp x G
0.84 x D)
And G = mass flux
Cp = Heat capacity
D = Diameter
Hence, Number of transfer unit (Nt) = (38 x 9.73)/ (0.24 x (1,710)0.84
x 3)
= 0.988
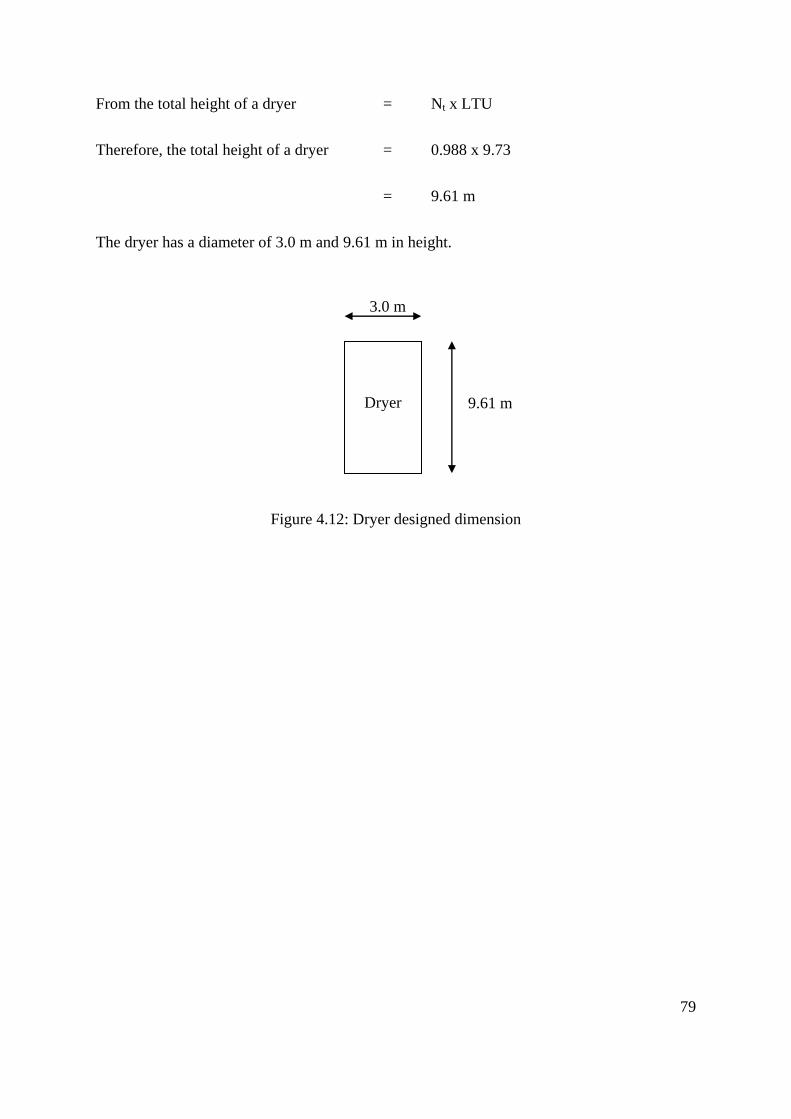
79
From the total height of a dryer = Nt x LTU
Therefore, the total height of a dryer = 0.988 x 9.73
= 9.61 m
The dryer has a diameter of 3.0 m and 9.61 m in height.
Figure 4.12: Dryer designed dimension
3.0 m
9.61 m
Dryer
80
4.2 Financial calculation
4.2.1 Construction Cost
1. Dryer
- Material : sheet metal size 2440 x 1220 x 10 mm (density is 7800 kg/m3)
- Size : height 9.61 m diameter 3 m
- Price of construction ( 120baht/kg ) : 847,755 baht
- Type : Continuous Fluid Bed Dryer
- Insulator : Top insulator and trading 10 Fibertex B40s size 7500X1200
thickness 50 Price: 1,161X 10 = 11,610 baht
- Total: 1,083,697 baht
2. Mixer
- Material : sheet metal size 2440 x 1220 x 10 mm (density is 7800 kg/m3)
- Size : Length 3 m diameter 1 m
- Price of construction ( 120baht/kg ) : 88,216 baht
- Insulator : Top insulator and trading 10 Fibertex B40s size 7500X1200
thickness 50 Price: 1,161X1= 1,161 baht
- Total: 96,387 baht
3. Blower
- Blower 1 : Air control industries EV-BPR451D price = 45,000 baht
- Blower 2 : Air control industries EV-BPR501D price = 50,000 baht
- Total blower cost : 95,000 baht
81
4. Air damper (Butterfly valve)
- Material Ductile Iron
- Diameter 8”
- Price : 8,650 X 3 = 25,950 baht
5. Rotary damper
- 2 Rotary damper
- Price 20,000 x 2 = 40,000 baht
6. Pipe
- Diameter 20cm 20 m
- Price of construction( 60baht/kg ) = 120,562 baht
- Insulator per piece (1.2m) Price : 20X254 = 5,080 baht
- Total 120,562 baht
Total: Construction cost = 1,461,596 baht
4.2.2 Operating Cost
Blower: Consumption of Blower 1&2 = 1.5 kW + 2.2 kW = 3.7 kW
Average of the consumption is 80% of spec = 0.8 x 3.7 = 2.96 kW
Operating cost per hour: 1kW = 3 baht, hence 2.96kW = 8.88 baht/hr
Operating cost per day (10hr/day) = 10 x 8.88 = 88.8 baht/day
82
4.2.3 Maintenance Cost (Depreciation Cost)
1. Blower
Life time of this blower is about 30,000 hr = 30,000/10 = 3,000 days
So maintenance cost per day = cost of blower / working day
= 31.67 baht /day
2. Damper
Life time of this blower is about 30,000 hr = 30,000/10 = 3,000 days
So maintenance cost per day = cost of blower / working day
= 22 baht/day
Total maintenance cost = 31.67 + 22 = 53.67 baht /day
4.2.4 Profit after applying the fuel drying system
According to the reduction of moisture in MSW from 50% to 20% MC, as moisture
content decreases, the lower heating value (LHV) of MSW is increased. At the same amount
of output (400 kWe), it means that the MSW product input is reduced. (The lower the
moisture content, the higher is the heating value)
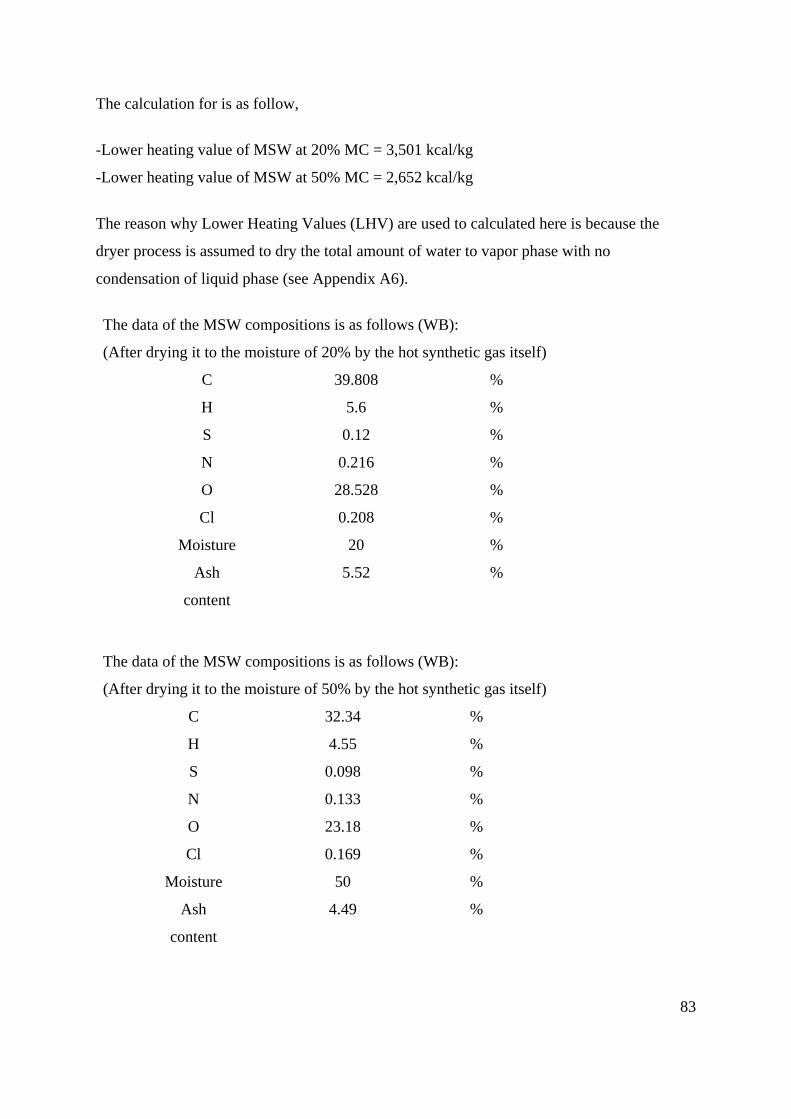
83
The calculation for is as follow,
-Lower heating value of MSW at 20% MC = 3,501 kcal/kg
-Lower heating value of MSW at 50% MC = 2,652 kcal/kg
The reason why Lower Heating Values (LHV) are used to calculated here is because the
dryer process is assumed to dry the total amount of water to vapor phase with no
condensation of liquid phase (see Appendix A6).
The data of the MSW compositions is as follows (WB):
(After drying it to the moisture of 20% by the hot synthetic gas itself)
C 39.808 %
H 5.6 %
S 0.12 %
N 0.216 %
O 28.528 %
Cl 0.208 %
Moisture 20 %
Ash 5.52 %
content
The data of the MSW compositions is as follows (WB):
(After drying it to the moisture of 50% by the hot synthetic gas itself)
C 32.34 %
H 4.55 %
S 0.098 %
N 0.133 %
O 23.18 %
Cl 0.169 %
Moisture 50 %
Ash 4.49 %
content
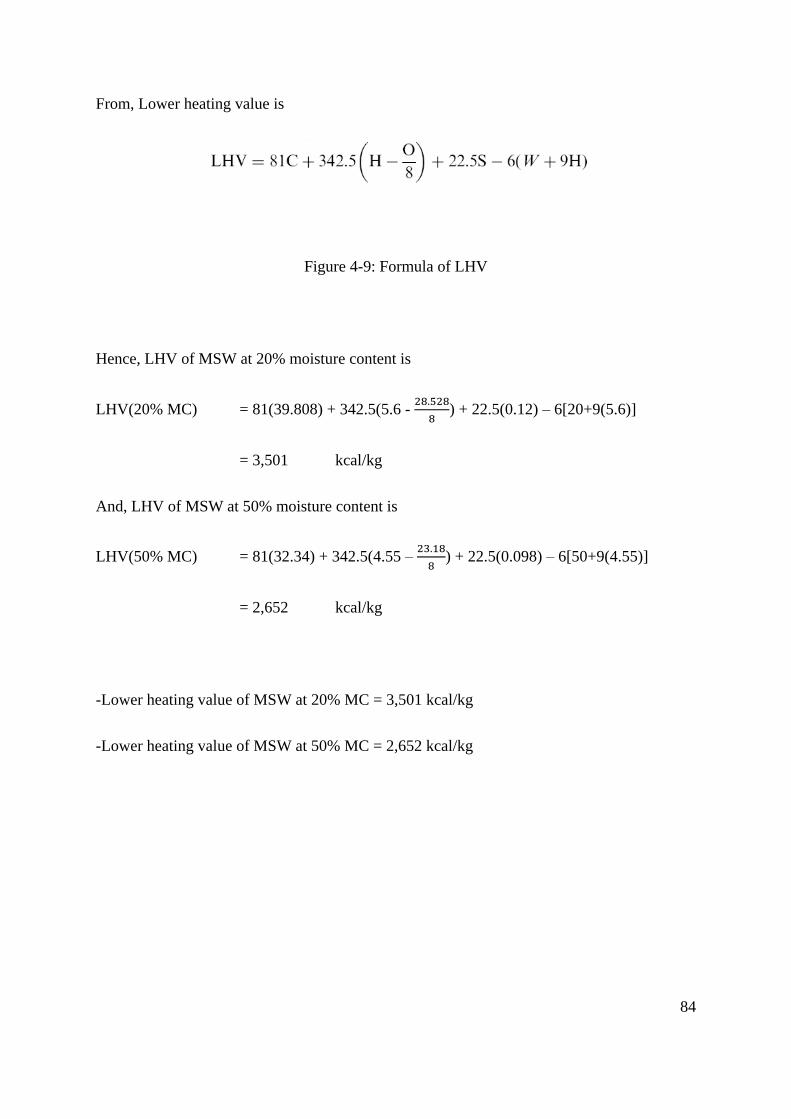
84
From, Lower heating value is
Figure 4-9: Formula of LHV
Hence, LHV of MSW at 20% moisture content is
LHV(20% MC) = 81(39.808) + 342.5(5.6 -
) + 22.5(0.12) – 6[20+9(5.6)]
= 3,501 kcal/kg
And, LHV of MSW at 50% moisture content is
LHV(50% MC) = 81(32.34) + 342.5(4.55 –
) + 22.5(0.098) – 6[50+9(4.55)]
= 2,652 kcal/kg
-Lower heating value of MSW at 20% MC = 3,501 kcal/kg
-Lower heating value of MSW at 50% MC = 2,652 kcal/kg
85
Factory: 400 kWh
1 kWh = 859.8 Kcal (see Appendix A5)
Then, 400 kW = 343,920 kcal/hr
The amount of MSW to be used is:
At 20% MC: (343,920 kcal/hr) / (3501 kcal/kg) = 98.23 kg/hr
Efficiency of engine is 25%
So, (98.23 kg/hr) / 0.25 = 392.94 kg/hr
Efficiency of gasifier is 70%
So, (392.94 kg/hr) / 0.70 = 561.34kg/hr
At 50% MC: (343,920 kcal/hr) / (2,652 kcal/hr) = 129.68 kg/hr
Efficiency of engine is 25%
So, (129.68 kg/hr) / 0.25 = 518.73 kg/hr
Efficiency of gasifier is 70%
So, (518.73 kg/hr) / 0.70 = 741.05 kg/hr
Hence, the difference is 741.05 – 561.34 = 179.71 kg/hr
(The feed rate of MSW is reduced for 179.71 kg/hr)

86
Saved cost per day
The cost of MSW will be reduced for (MSW = 1.5 baht/kg) = 179.71 kg/hr x 1.5 baht /kg
= 269.57 baht /hr
= 269.57 baht /hr x 10 hr/day
= 2,695.7 baht /day
Total: profit after applying the Dryer is 2,695.7 baht /day
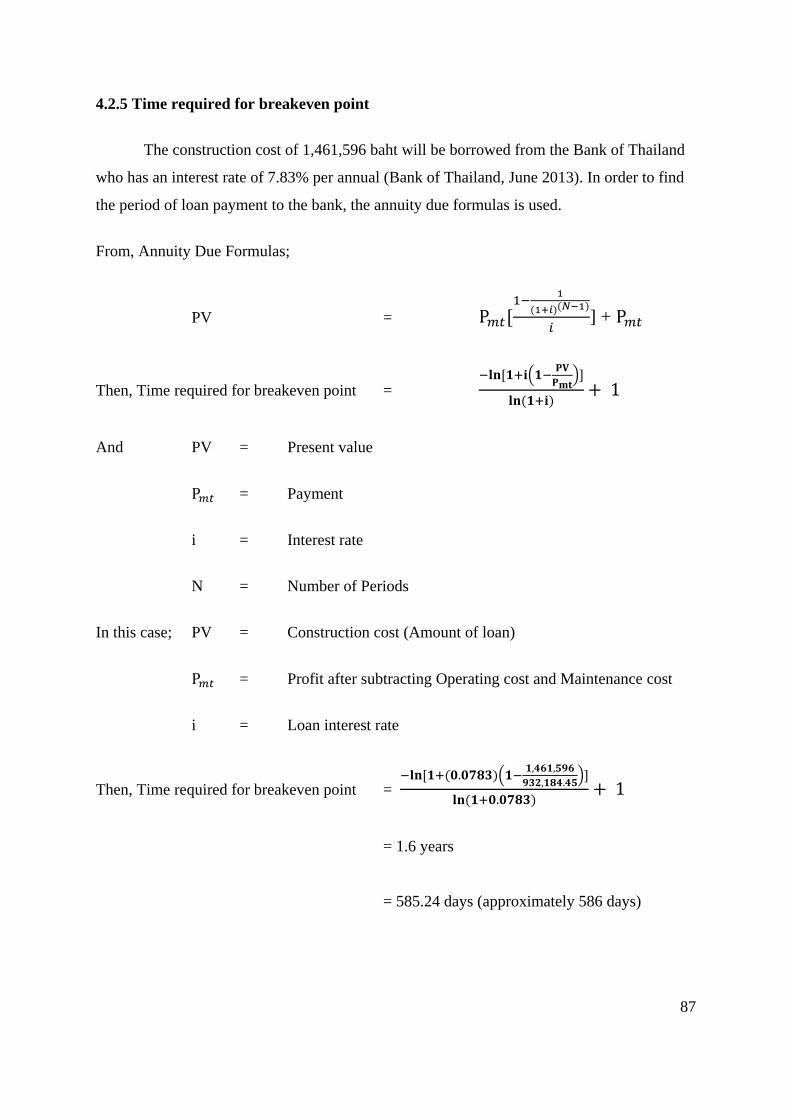
87
4.2.5 Time required for breakeven point
The construction cost of 1,461,596 baht will be borrowed from the Bank of Thailand
who has an interest rate of 7.83% per annual (Bank of Thailand, June 2013). In order to find
the period of loan payment to the bank, the annuity due formulas is used.
From, Annuity Due Formulas;
PV =
] +
Then, Time required for breakeven point =
And PV = Present value
= Payment
i = Interest rate
N = Number of Periods
In this case; PV = Construction cost (Amount of loan)
= Profit after subtracting Operating cost and Maintenance cost
i = Loan interest rate
Then, Time required for breakeven point =
= 1.6 years
= 585.24 days (approximately 586 days)
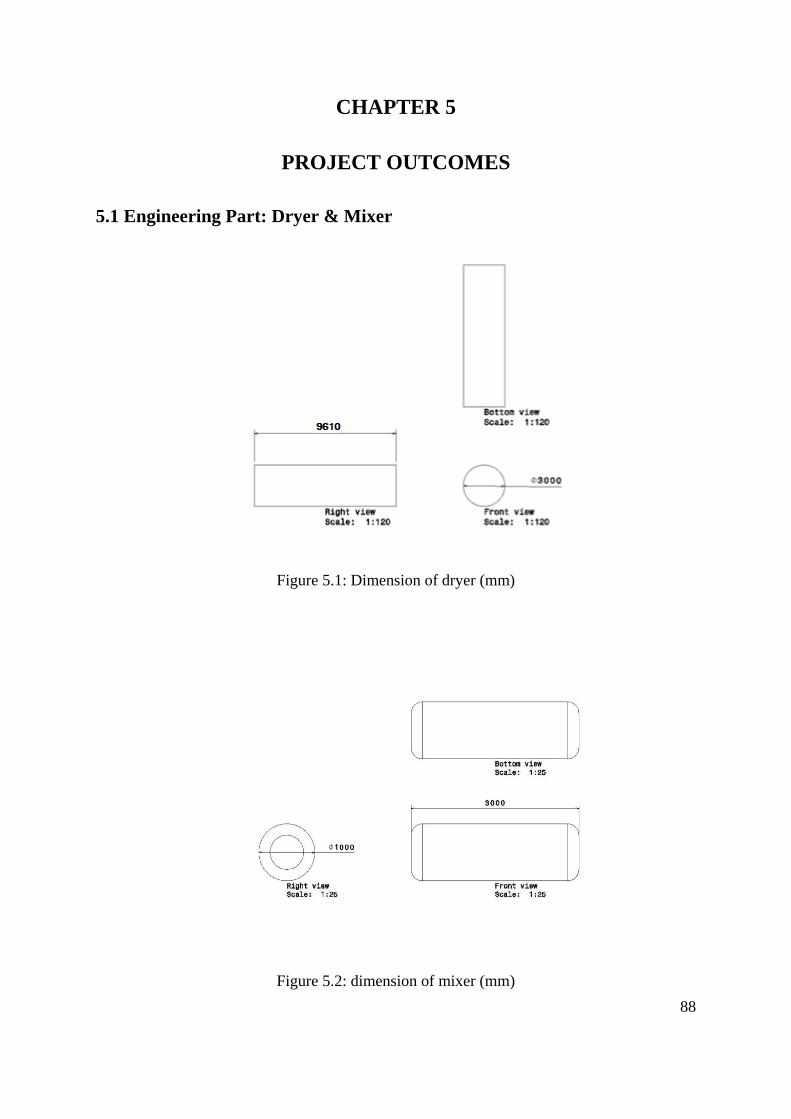
88
CHAPTER 5
PROJECT OUTCOMES
5.1 Engineering Part: Dryer & Mixer
Figure 5.1: Dimension of dryer (mm)
Figure 5.2: dimension of mixer (mm)
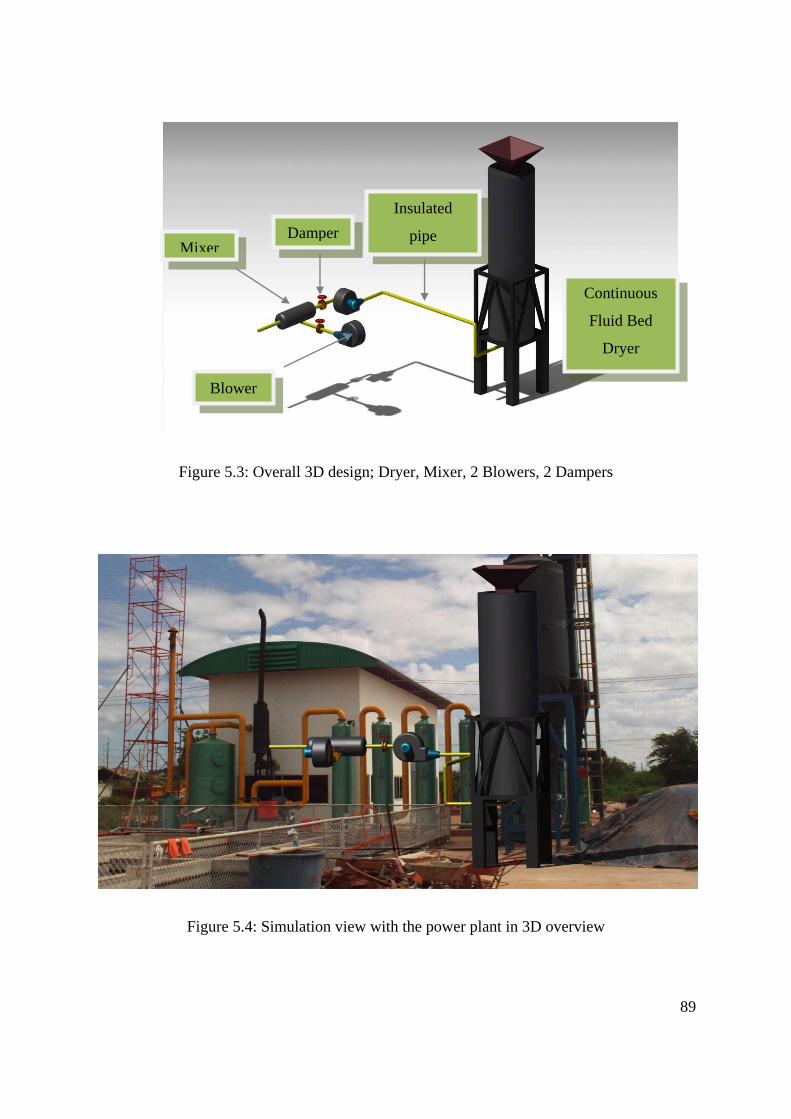
89
Figure 5.3: Overall 3D design; Dryer, Mixer, 2 Blowers, 2 Dampers
Figure 5.4: Simulation view with the power plant in 3D overview
Mixer Damper
Insulated
pipe
Continuous
Fluid Bed
Dryer
Blower
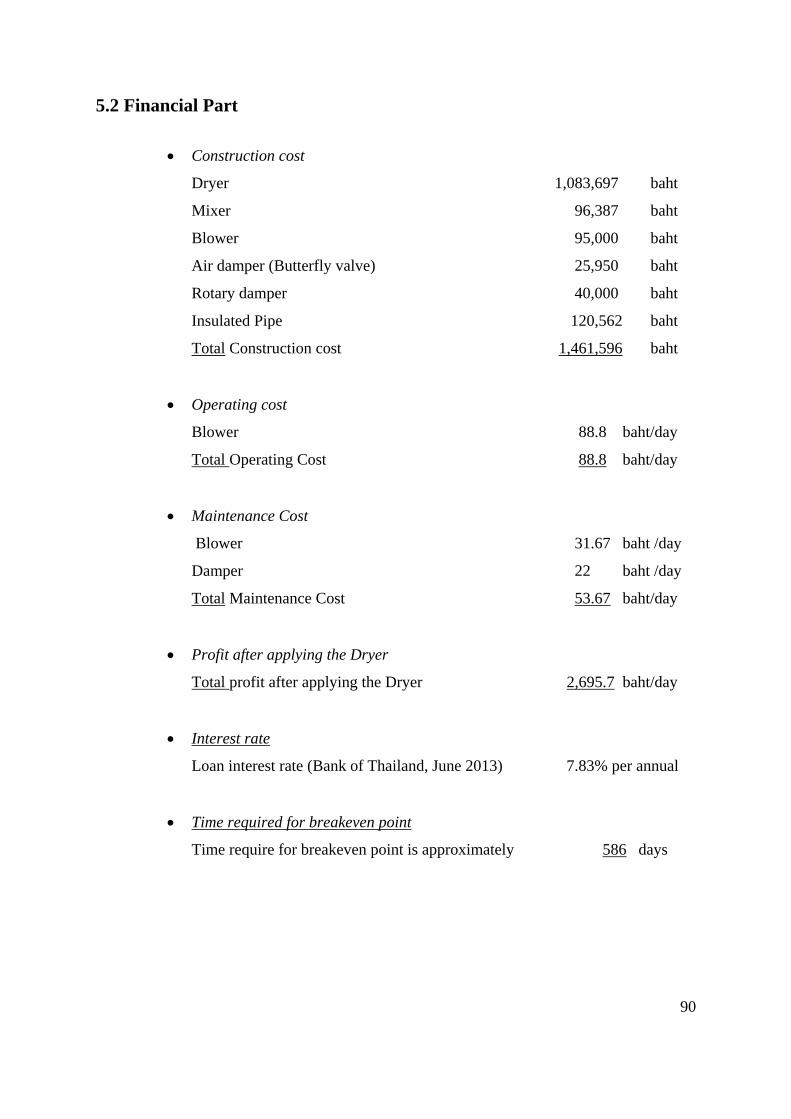
90
5.2 Financial Part
Construction cost
Dryer 1,083,697 baht
Mixer 96,387 baht
Blower 95,000 baht
Air damper (Butterfly valve) 25,950 baht
Rotary damper 40,000 baht
Insulated Pipe 120,562 baht
Total Construction cost 1,461,596 baht
Operating cost
Blower 88.8 baht/day
Total Operating Cost 88.8 baht/day
Maintenance Cost
Blower 31.67 baht /day
Damper 22 baht /day
Total Maintenance Cost 53.67 baht/day
Profit after applying the Dryer
Total profit after applying the Dryer 2,695.7 baht/day
Interest rate
Loan interest rate (Bank of Thailand, June 2013) 7.83% per annual
Time required for breakeven point
Time require for breakeven point is approximately 586 days
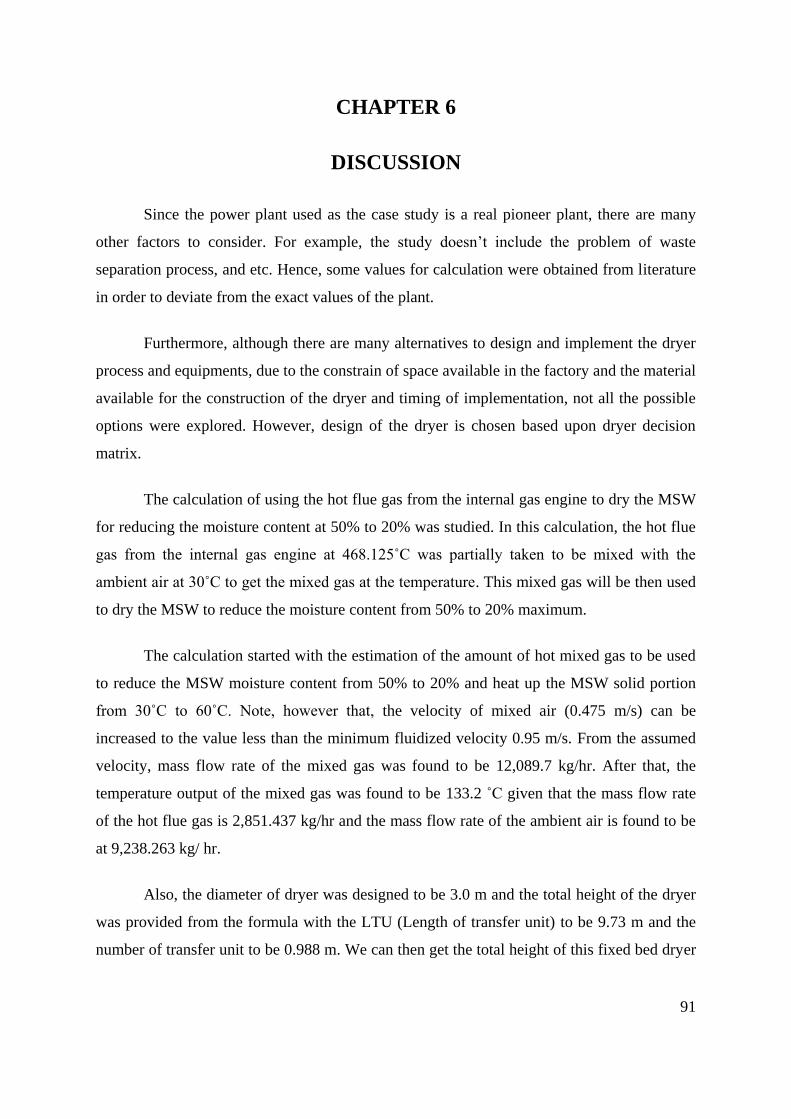
91
CHAPTER 6
DISCUSSION
Since the power plant used as the case study is a real pioneer plant, there are many
other factors to consider. For example, the study doesn’t include the problem of waste
separation process, and etc. Hence, some values for calculation were obtained from literature
in order to deviate from the exact values of the plant.
Furthermore, although there are many alternatives to design and implement the dryer
process and equipments, due to the constrain of space available in the factory and the material
available for the construction of the dryer and timing of implementation, not all the possible
options were explored. However, design of the dryer is chosen based upon dryer decision
matrix.
The calculation of using the hot flue gas from the internal gas engine to dry the MSW
for reducing the moisture content at 50% to 20% was studied. In this calculation, the hot flue
gas from the internal gas engine at 468.125˚C was partially taken to be mixed with the
ambient air at 30˚C to get the mixed gas at the temperature. This mixed gas will be then used
to dry the MSW to reduce the moisture content from 50% to 20% maximum.
The calculation started with the estimation of the amount of hot mixed gas to be used
to reduce the MSW moisture content from 50% to 20% and heat up the MSW solid portion
from 30˚C to 60˚C. Note, however that, the velocity of mixed air (0.475 m/s) can be
increased to the value less than the minimum fluidized velocity 0.95 m/s. From the assumed
velocity, mass flow rate of the mixed gas was found to be 12,089.7 kg/hr. After that, the
temperature output of the mixed gas was found to be 133.2 ˚C given that the mass flow rate
of the hot flue gas is 2,851.437 kg/hr and the mass flow rate of the ambient air is found to be
at 9,238.263 kg/ hr.
Also, the diameter of dryer was designed to be 3.0 m and the total height of the dryer
was provided from the formula with the LTU (Length of transfer unit) to be 9.73 m and the
number of transfer unit to be 0.988 m. We can then get the total height of this fixed bed dryer
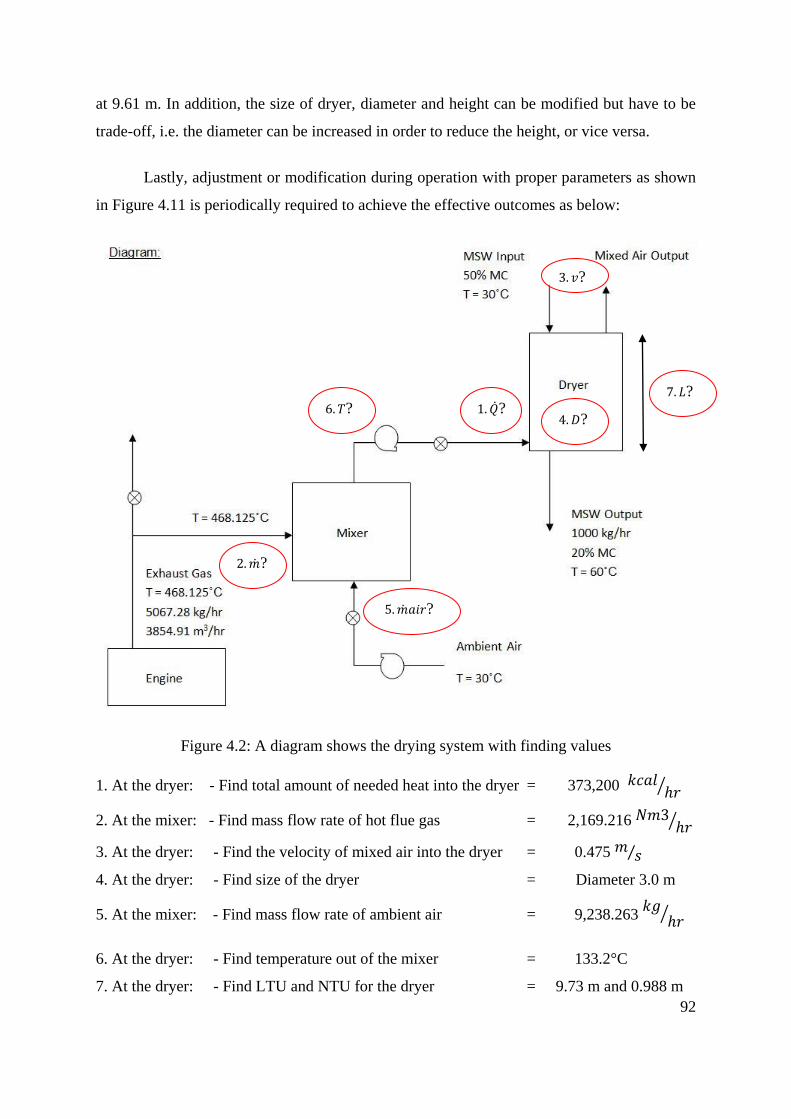
92
at 9.61 m. In addition, the size of dryer, diameter and height can be modified but have to be
trade-off, i.e. the diameter can be increased in order to reduce the height, or vice versa.
Lastly, adjustment or modification during operation with proper parameters as shown
in Figure 4.11 is periodically required to achieve the effective outcomes as below:
Figure 4.2: A diagram shows the drying system with finding values
1. At the dryer: - Find total amount of needed heat into the dryer = 373,200
2. At the mixer: - Find mass flow rate of hot flue gas = 2,169.216
3. At the dryer: - Find the velocity of mixed air into the dryer = 0.475
4. At the dryer: - Find size of the dryer = Diameter 3.0 m
5. At the mixer: - Find mass flow rate of ambient air = 9,238.263
6. At the dryer: - Find temperature out of the mixer = 133.2°C
7. At the dryer: - Find LTU and NTU for the dryer = 9.73 m and 0.988 m
?
?
?
?
?
?
?
93
CHAPTER 7
CONCLUSION
Today, energy is essential necessity and waste is a major problem to society and the
world. As stated earlier the energy consumption of the world has increased from 2011 to
2012 by 2.5% (Statistical Review of World Energy June 2012, BP plc). This means that the
amount of coal, gas, and other fuels needed to produce electricity will need to be increased.
Unless alternative solution such as better usage of existing fuel resources or alternative
energy is found, non-renewable fuels are expected to run out in 2050 (Prof.Hameed Nezhad,
2009). Moreover, waste in the world is increasing at an exponential rate both due to
increasing extravagant of human nature and ever growing population. World Health
Organization (WHO) estimated that by 2050, the world population will be approximately 9
billion people. As for Thailand the energy consumption and waste is expected to increase by
549% and 350% respectively by 2050 (Shrestha et al., 2007). Thus, both energy and waste
need to be properly managed.
Thus, my thesis is a crucial step in helping Samutsakorn power plant to become a part
of the solution the world’s problems. The outcome designed of the improved gasifier which
dry moist MSW by recovered waste heat is not only commercially profitable but also
environmentally friendly since the utilized fuels is biomass.
Also, the improved designed of gasifier with the dryer system will effectively
generate the cost saved 2,695.7 baht per day. Thus, the breakeven point after implementing
the improved designed of gasifier is 586 days with loan interest rate of 7.83% (Bank of
Thailand, June 2013).
Finally, my objectives in designing a drying system which utilizes the hot fuel gas
from the internal gas engine (recovered waste heat) to dry the MSW (reduce the moisture
content) and improve the thermal efficiency of the existing gasifier, as stated in Chapter 1.2,
have been achieved. Moreover, the design and calculation could be used as a guideline in
practical operation of other power plants around the world.
94
REFERENCES
ACI (Air control industries), 2013. Industrial fans and blower specification
information. [online] ACI Available at: <www.aircontrolindustries.com>
[Accessed 1 May 2013].
Alexander Klein, 2002. Gasification: An Alternative Process for Energy Recovery
and Disposal of Municipal Solid Wastes. Department of Earth and Environmental
Engineering, Fu Foundation School of Engineering and Applied Science,
Columbia University
ALMIL, 2011. Solutions mop spray. [online] ALMIL Available at:
<http://www.almil.de/index1.php?page=eng_solutions_mop_spray> [Accessed 25
March 2013].
Barrie Axtell, Published by Practical Action, 2002. Tray dryers. The Schumacher
Centre for Technology & Development, Bourton on Dunsmore, United Kingdom.
Beychok, M.R., 1974. Coal gasification and the Phenosolvan process, American
Chemical Society 168th National Meeting, Atlantic City
Biomass Energy Center, 2008. Biomass System. [online] Available at:
<http://www.Biomassenergycentre.org.uk> [Accessed 28 January 2013]
Build Energy and Environment System Laboratory, 2003. Pore structure
descriptors and measures of moisture storage. Syracuse University. [online]
Available at: <http://beesl.syr.edu/HT_1D-SUTUD-Moist-stor.htm> [Accessed 20
February 2013].
Chongqing Fengyu Electric Equipment Co.,Ltd, 1985. China Biomass
Gasification Power Plant System. [online] Chongqing Fengyu Electric Available
at: <http://www.tradevv.com/chinasuppliers/fengyubiomass_p_8434e/china-
Biomass-Gasification-Power-Plant-System.html> [Accessed 21 February 2013].
Chung Chieh, 1996. Phase – Gas, liquid, and solid. University of Waterloo.
[online] Available at:
<http://science.uwaterloo.ca/~cchieh/cact/c123/phases.html> [Accessed 20
February 2013].
CJTech , 2006. Technical Process Fluid Bed Coating. [online] CJTech Available
at:
<http://www.cjtech.co.kr/Technical%20Process%20Fluid%20Bed%20Coating.ht
m> [Accessed 25 March 2013].
95
Colin Carmichael, J. Kenneth Salisbury, 1970. KENT'S MECHANICAL
ENGINEERs' Handbook.
C. Visvanathan, 2008. Solid Waste Management in Asian Perspectives.
Environmental Engineering and Management Program School of Environment,
Resources and Development Asian Institute of Technology.
Davis and Masten, 2002. Principles of Environmental Engineering and Science,
McGraw-Hill Companies, Inc. New York. ISBN 0-07-235053-9
Energy Alternative, 2009. Gasifers are best for personal power or light industry.
[online] Energy Alternative Available at:
<http://www.energypoweralternatives.com/2009/11/12/gasifiers-are-best-for-
personal-power-or-light-industry/> [Accessed 7 February 2013].
Eric Marz, 2002. Molecular Visualization Resource. [online] Available at:
<http://www.chem.purdue.edu/gchelp/liquids/whatis2.html> [Accessed 25
February 2013].
Food and Agriculture Organization of the United Nations, 1986. Wood gas as
engine fuel. Mechanical Wood Products Branch, FAO Forestry Department. ISSN
0259-2800
Frank P. Incropera, David P. Dewitt, Theodore L. Bergman and Adrienne S.
Lavine, 2007. Introduction to Heat Transfer. Asia: John Wiley & Sons(ASIA) Pte
Ltd.
GEA Niro, 2011. Spray Drying Information. [online] GEA Niro Available at:
<http://www.geaniro.co.kr/geanirokr/cmsdoc.nsf/WebDoc/ndkk5hmc6zSprayDry
ersSprayDryers> [Accessed 25 March 2013].
GTI (GAS TECHNOLOGY INSTITUTE), 2011. Thermal Gasification of
Biomass, International Energy Agency Task 33. [online] Available at:
<http://www.gastechnology.org/webroot/app/xn/xd.aspx?it=enweb&xd=iea/home
page.xml> [Accessed 22 January 2013]
Harald Kyrklund, 2000. Gasifier for damp fuel. Helsinki, Finland
Hill, Nora E. et al. (1969). Dielectric properties and molecular behaviour.
London: Van Nostrand Reinhold. ISBN 0442034113.
I.Zbicinski, I.Smucerowicz, C.Strumillo ,and C.Crowe, 2000. APPLICATION OF
PULSE COMBUSTION TECHNOLOGY IN SPRAY DRYING PROCESS. Faculty
of Process and Environmental, Technical University of Lodz. ISSN 0104-6632
96
John Pichtel, 2005. WASTE MANAGEMENT PRACTICES, MUNICIPAL,
HAZARDOUS, AND INDUSTRIAL. CRC PLACE, TAYLOR AND FRANC
Kagaku Sochi Binran (1953). คมอ อปกรณการผลตในอตสาหกรมมเคม. 4th ed. Thailand: บรษท
ดวงกมลสมย จ ำกด.
Mukesh Gohel, Rajesh Parikh, 2007. Fluidized bed systems. L. M. College of
Pharmacy, Ahmedabad-India.
Möjj Engineering System LTD., 2005. Rotary dryer [online] Möjj Available at:
<http://www.mojjpune.com/Business%20Divisions/Rotary%20Dryers.htm>
[Accessed 20 March 2013].
NNFCC (National Non-Food Crops Centre), 2009. Review of Technologies for
Gasification of Biomass and Wastes, NNFCC 09-008. [pdf] Available at:
<http://www.nnfcc.co.uk/tools/review-of-technologies-for-gasification-of-
biomass-and-wastes-nnfcc-09-008> [Accessed 14 January 2013]
Perry, R.H. and Green, D.W, Chemical Engineers' Handbook (7th Edition),
McGraw-Hill, ISBN 0-07-049841-5
Primenergy, L.L.C., 2006. Case Study Wood Waste Gasification & Thermal
Oxidation. Project Location Little Falls, Minnesota. [pdf] Primenergy, L.L.C.
Available at:
<http://files.harc.edu/Sites/GulfCoastCHP/CaseStudies/LittleFallsMNWoodWaste
Gasification.pdf> [Accessed 11 April 2013]
P. Abdul Salam, S. Kumar, Manjula Siriwardhana, 2010. THE STATUS OF
BIOMASS GASIFICATION in Thailand and Cambodia. Energy Environment
Partnership(EEP), Asian Institute of Technology
REN21 (Renewable Energy Policy Network for the 21st Century), 2011.
Renewables 2011: Global Status Report. [pdf] Available at:
<www.map.ren21.net/GSR/GSR2012.pdf> [Accessed 28 January 2013]
Richard E. Sonntag, Claus Borgnakke, and Gordon J. Van Wylan, 2003.
Fundamentals of Thermodynamics, sixth edition. ISBN 0-471-15232-3
Richard E. Sonntag,Claus Borgnakke and Gordon J. van wylen (2002).
Fundamentals of Thermodynamics. Asia: John Wiley & Sons(ASIA) Pte Ltd.
Roels S, Carmeliet J and Hens H, 2003. Moisture transfer properties and
materials characterisation. K.U.LEUVEN, Belgium.
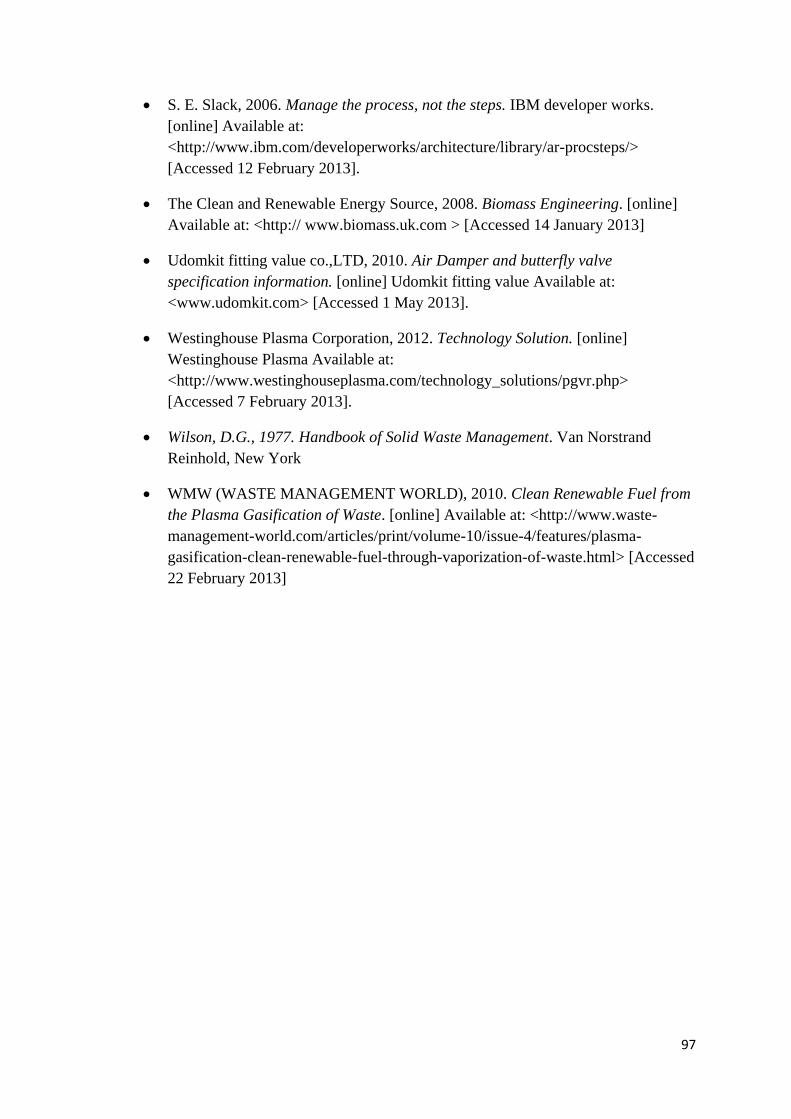
97
S. E. Slack, 2006. Manage the process, not the steps. IBM developer works.
[online] Available at:
<http://www.ibm.com/developerworks/architecture/library/ar-procsteps/>
[Accessed 12 February 2013].
The Clean and Renewable Energy Source, 2008. Biomass Engineering. [online]
Available at: <http:// www.biomass.uk.com > [Accessed 14 January 2013]
Udomkit fitting value co.,LTD, 2010. Air Damper and butterfly valve
specification information. [online] Udomkit fitting value Available at:
<www.udomkit.com> [Accessed 1 May 2013].
Westinghouse Plasma Corporation, 2012. Technology Solution. [online]
Westinghouse Plasma Available at:
<http://www.westinghouseplasma.com/technology_solutions/pgvr.php>
[Accessed 7 February 2013].
Wilson, D.G., 1977. Handbook of Solid Waste Management. Van Norstrand
Reinhold, New York
WMW (WASTE MANAGEMENT WORLD), 2010. Clean Renewable Fuel from
the Plasma Gasification of Waste. [online] Available at: <http://www.waste-
management-world.com/articles/print/volume-10/issue-4/features/plasma-
gasification-clean-renewable-fuel-through-vaporization-of-waste.html> [Accessed
22 February 2013]
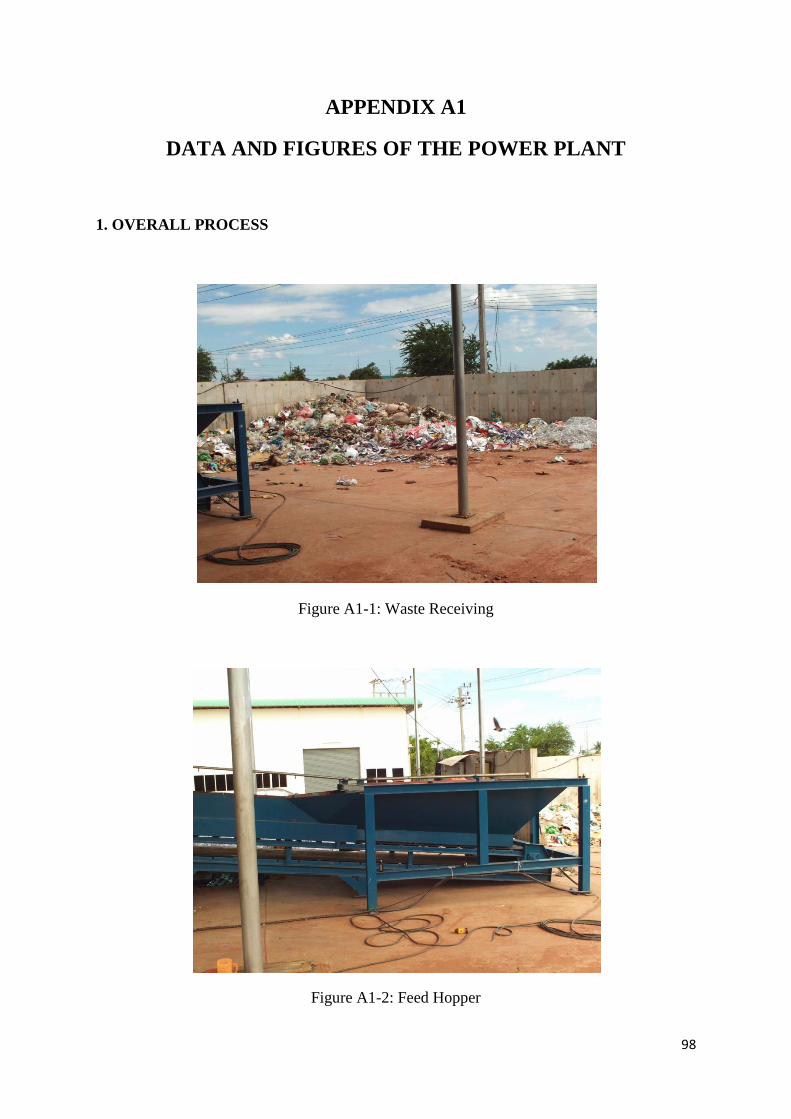
98
APPENDIX A1
DATA AND FIGURES OF THE POWER PLANT
1. OVERALL PROCESS
Figure A1-1: Waste Receiving
Figure A1-2: Feed Hopper
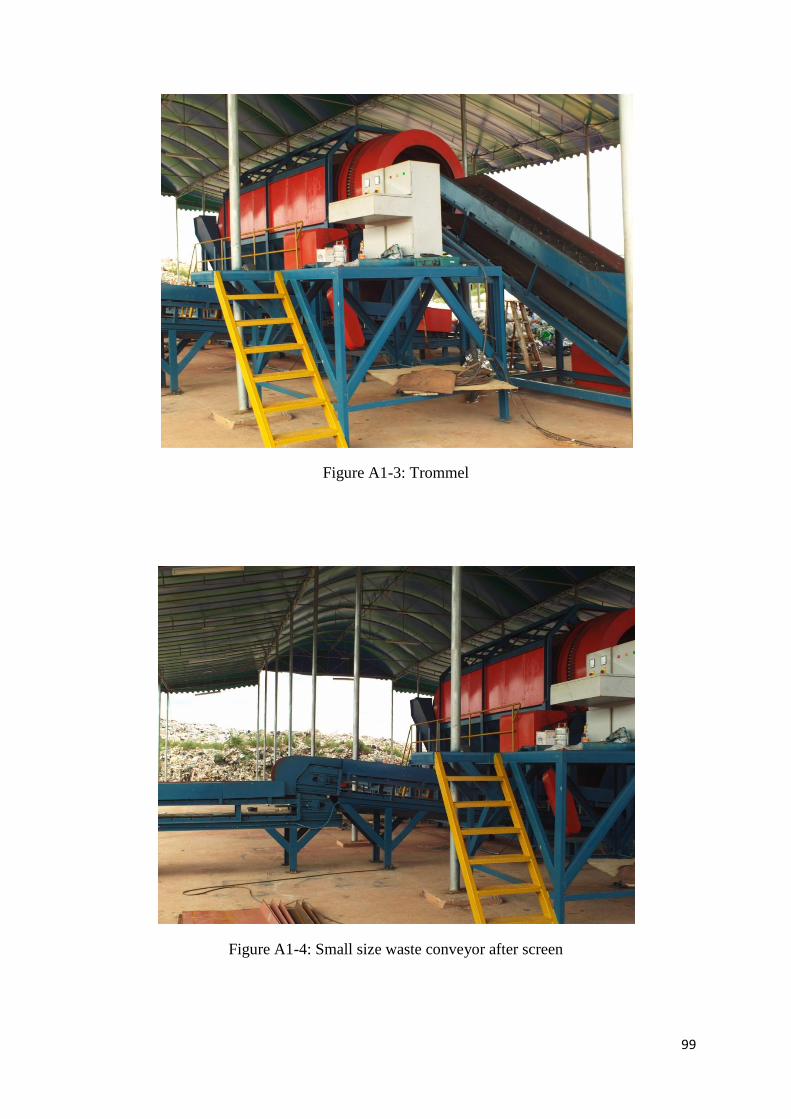
99
Figure A1-3: Trommel
Figure A1-4: Small size waste conveyor after screen
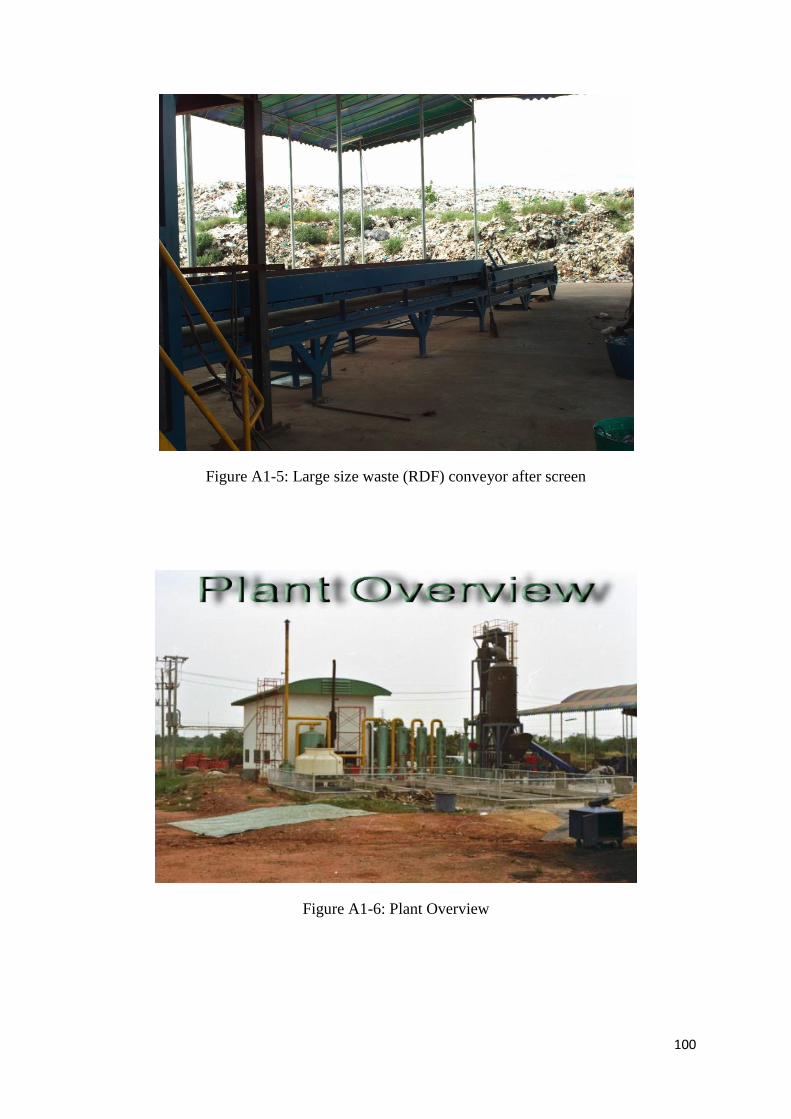
100
Figure A1-5: Large size waste (RDF) conveyor after screen
Figure A1-6: Plant Overview
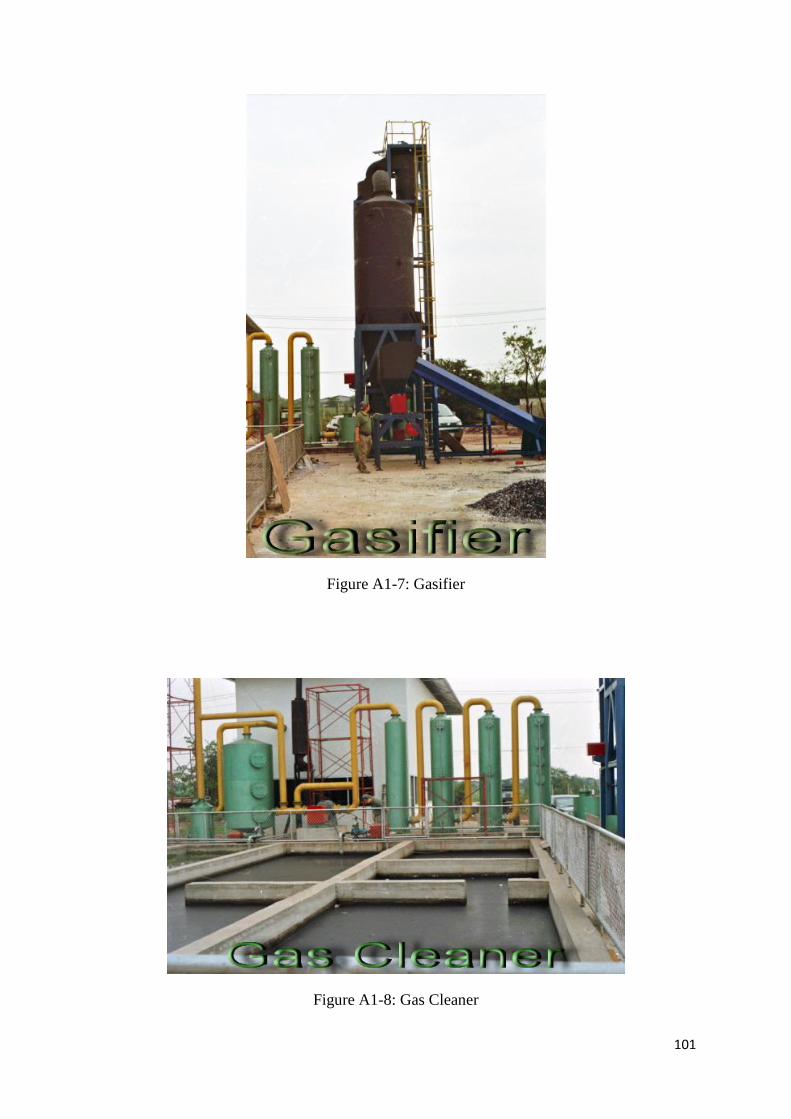
101
Figure A1-7: Gasifier
Figure A1-8: Gas Cleaner
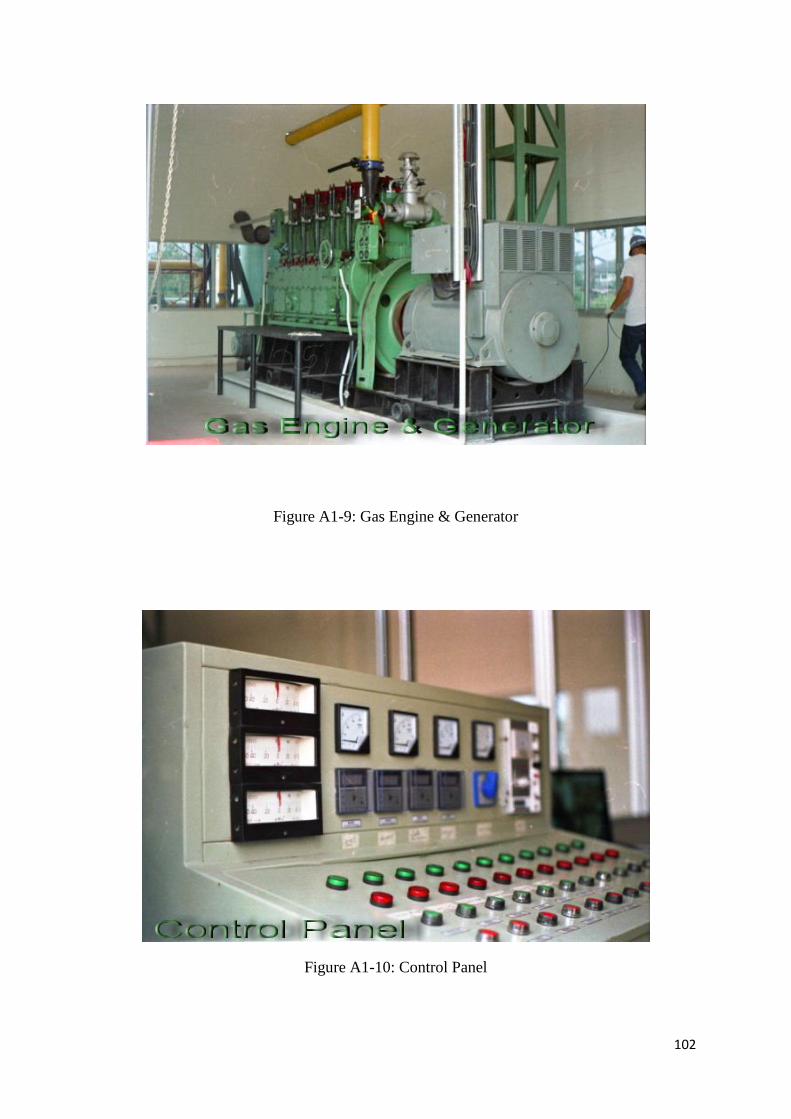
102
Figure A1-9: Gas Engine & Generator
Figure A1-10: Control Panel
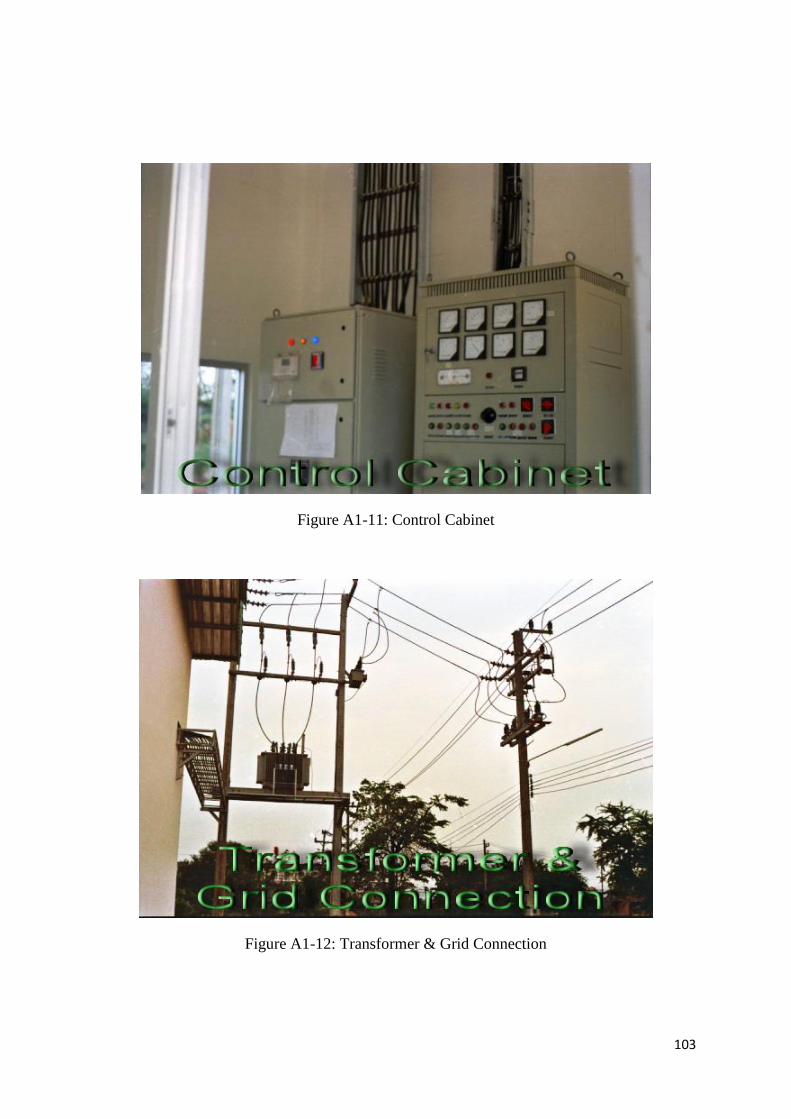
103
Figure A1-11: Control Cabinet
Figure A1-12: Transformer & Grid Connection
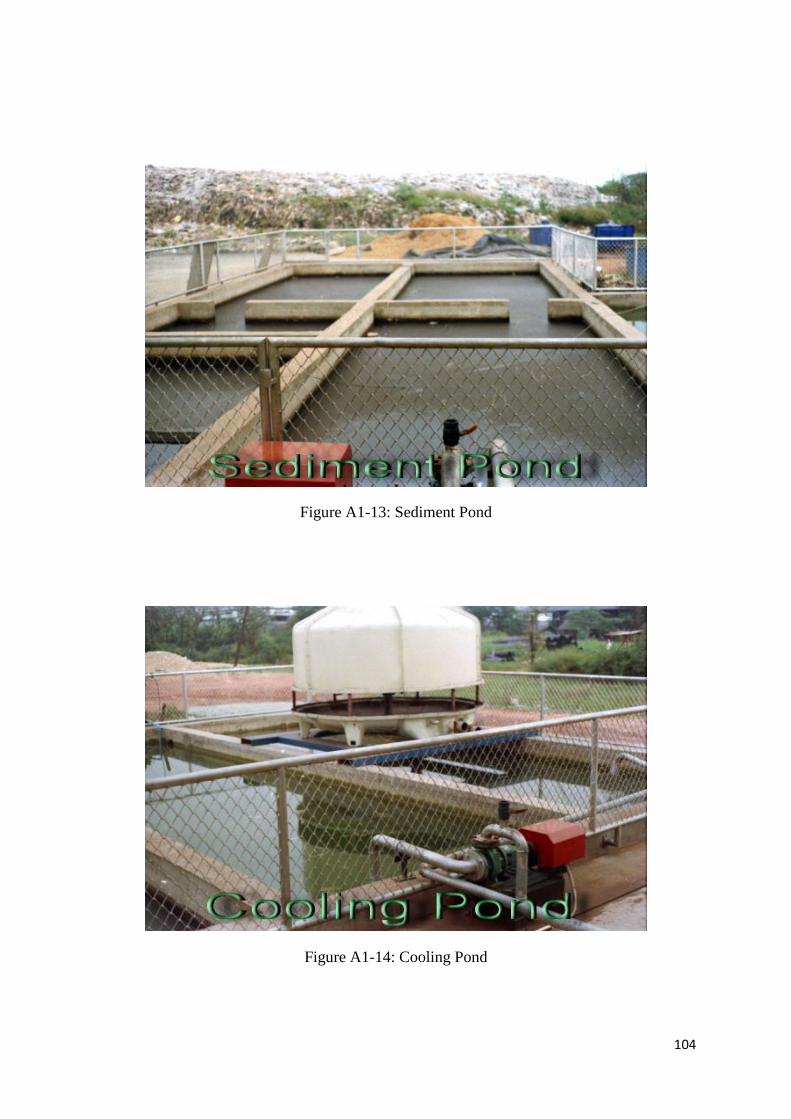
104
Figure A1-13: Sediment Pond
Figure A1-14: Cooling Pond
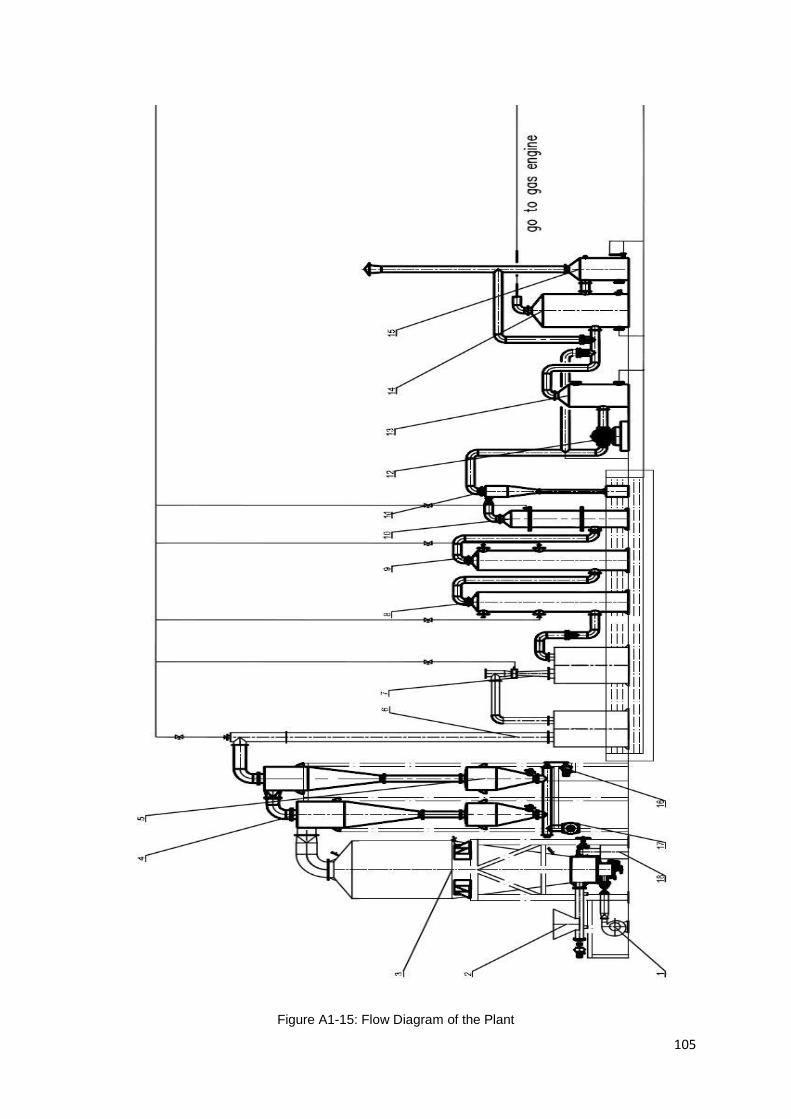
105
Figure A1-15: Flow Diagram of the Plant
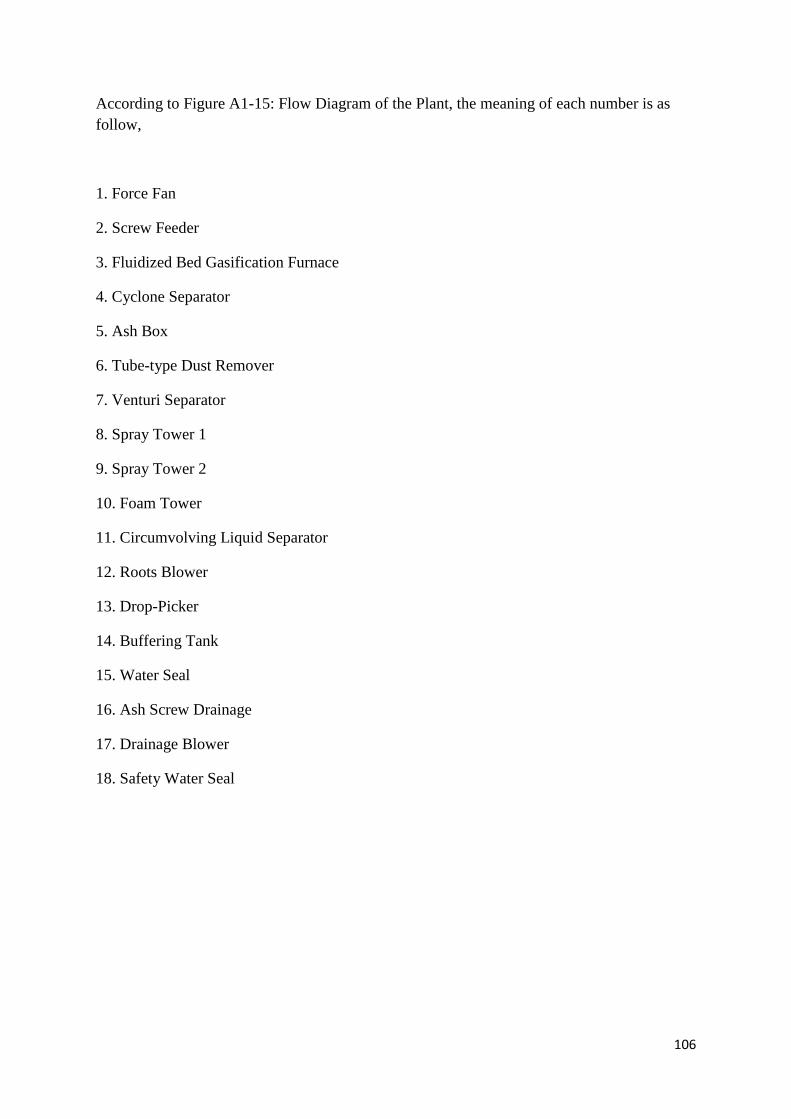
106
According to Figure A1-15: Flow Diagram of the Plant, the meaning of each number is as
follow,
1. Force Fan
2. Screw Feeder
3. Fluidized Bed Gasification Furnace
4. Cyclone Separator
5. Ash Box
6. Tube-type Dust Remover
7. Venturi Separator
8. Spray Tower 1
9. Spray Tower 2
10. Foam Tower
11. Circumvolving Liquid Separator
12. Roots Blower
13. Drop-Picker
14. Buffering Tank
15. Water Seal
16. Ash Screw Drainage
17. Drainage Blower
18. Safety Water Seal
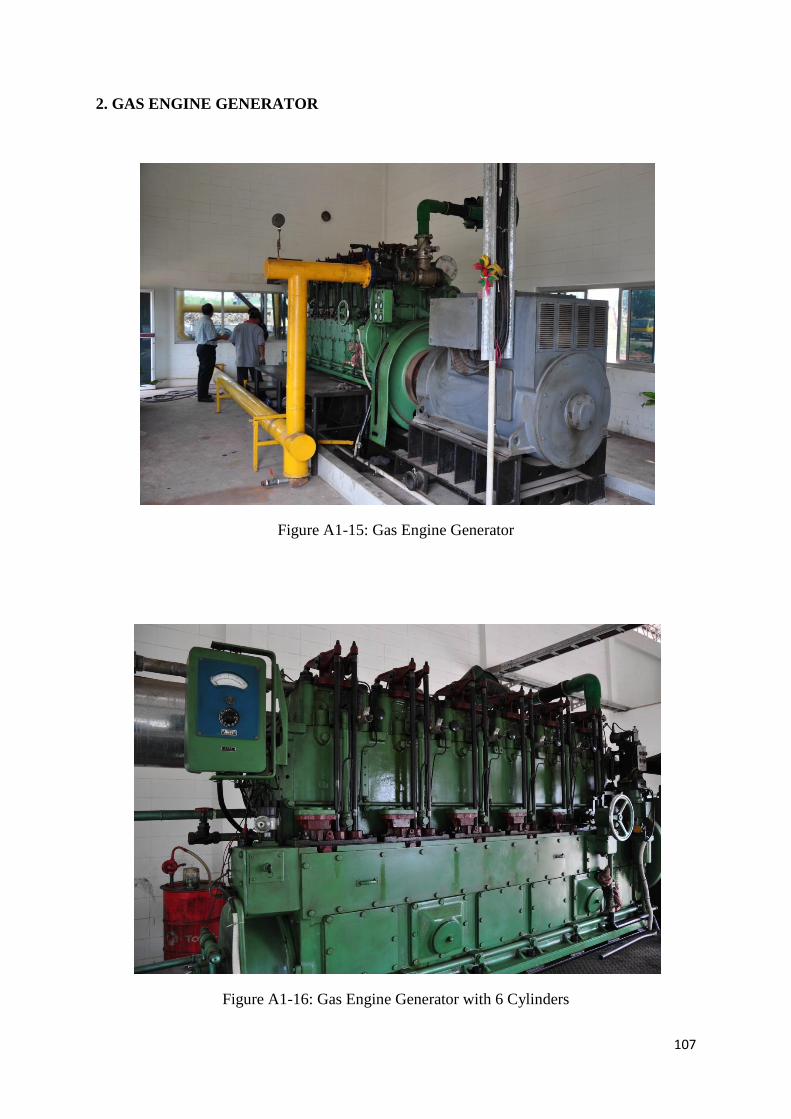
107
2. GAS ENGINE GENERATOR
Figure A1-15: Gas Engine Generator
Figure A1-16: Gas Engine Generator with 6 Cylinders
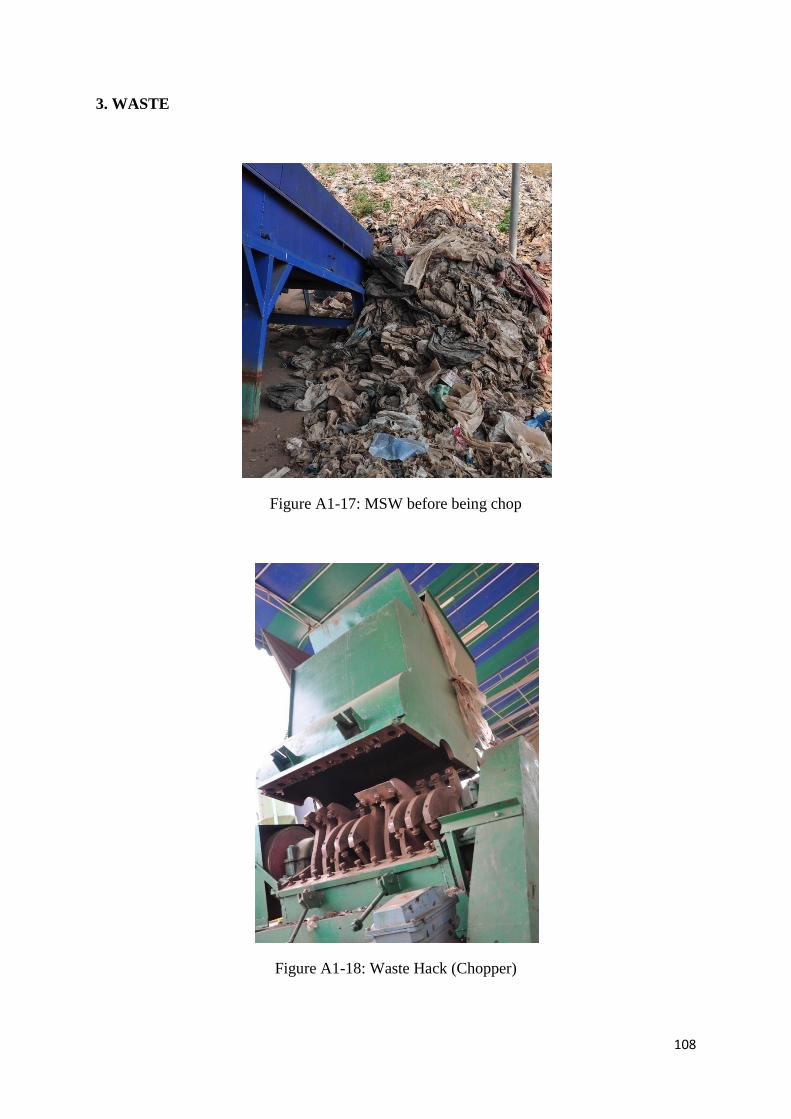
108
3. WASTE
Figure A1-17: MSW before being chop
Figure A1-18: Waste Hack (Chopper)
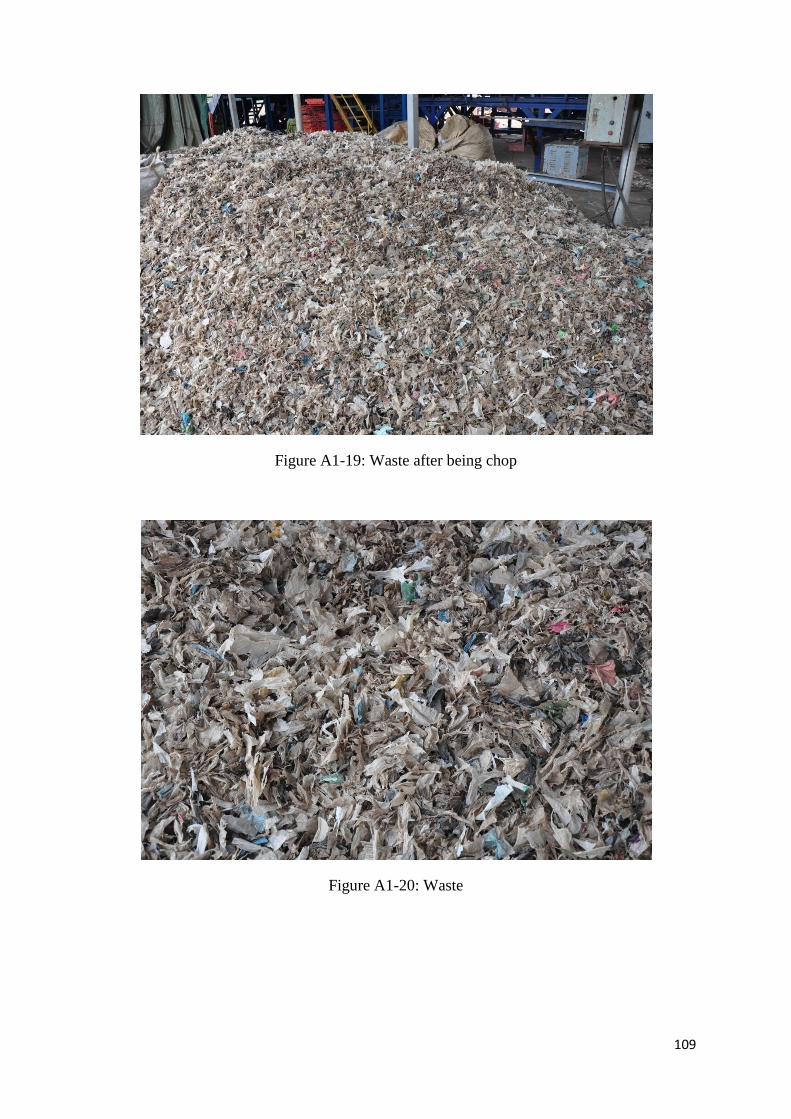
109
Figure A1-19: Waste after being chop
Figure A1-20: Waste
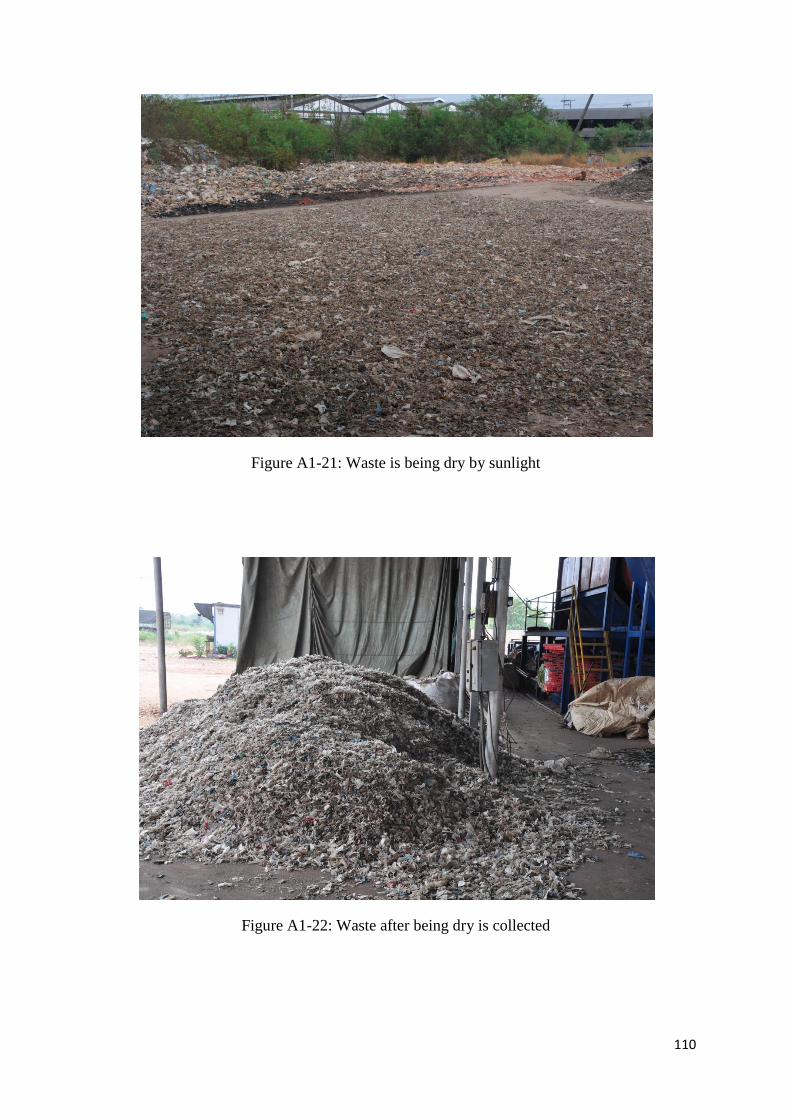
110
Figure A1-21: Waste is being dry by sunlight
Figure A1-22: Waste after being dry is collected
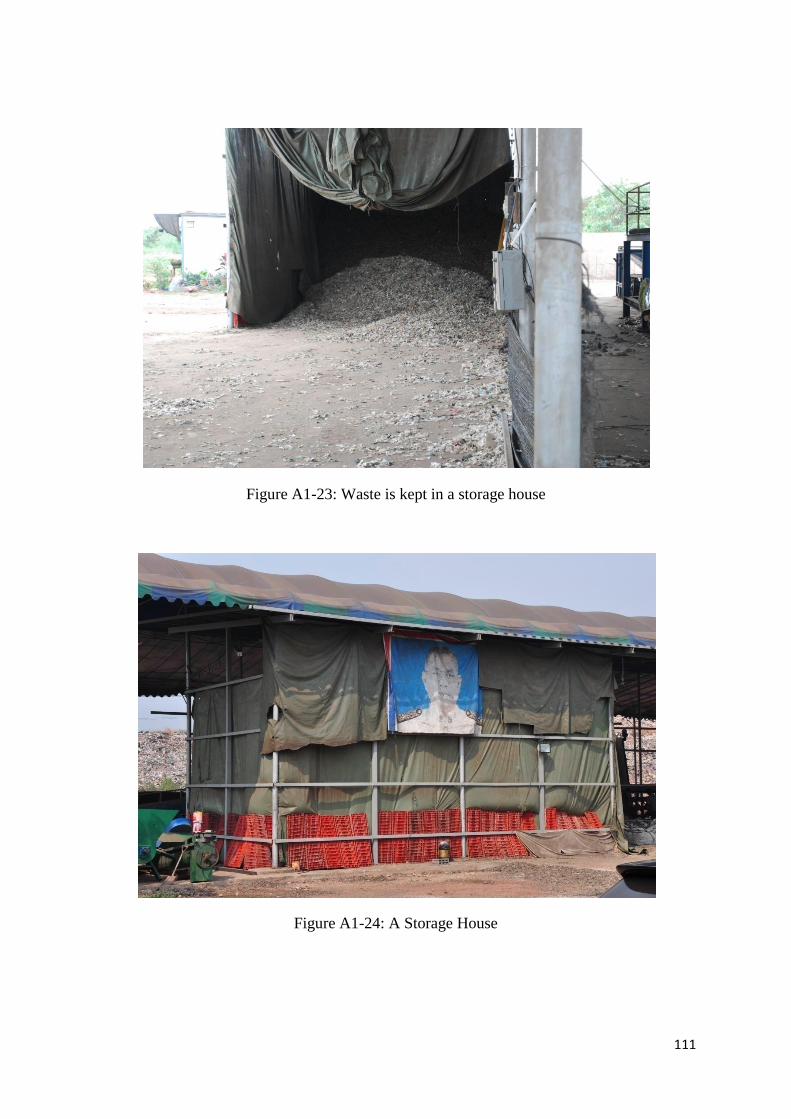
111
Figure A1-23: Waste is kept in a storage house
Figure A1-24: A Storage House
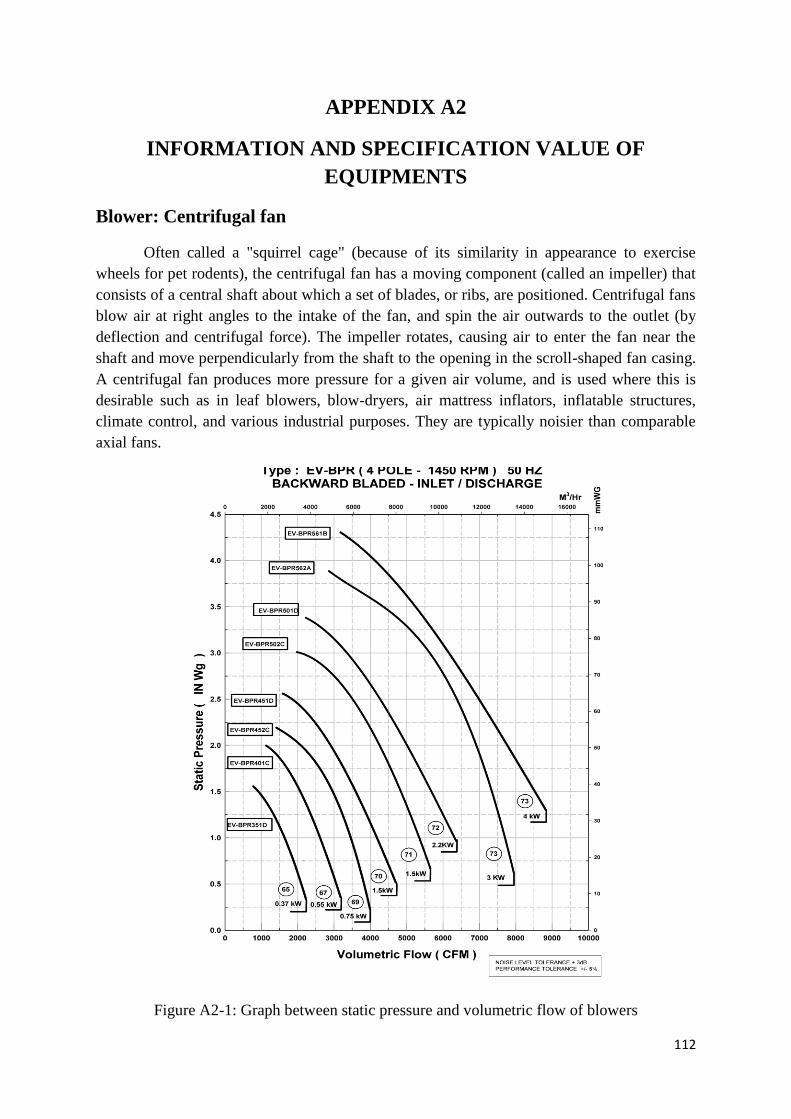
112
APPENDIX A2
INFORMATION AND SPECIFICATION VALUE OF
EQUIPMENTS
Blower: Centrifugal fan
Often called a "squirrel cage" (because of its similarity in appearance to exercise
wheels for pet rodents), the centrifugal fan has a moving component (called an impeller) that
consists of a central shaft about which a set of blades, or ribs, are positioned. Centrifugal fans
blow air at right angles to the intake of the fan, and spin the air outwards to the outlet (by
deflection and centrifugal force). The impeller rotates, causing air to enter the fan near the
shaft and move perpendicularly from the shaft to the opening in the scroll-shaped fan casing.
A centrifugal fan produces more pressure for a given air volume, and is used where this is
desirable such as in leaf blowers, blow-dryers, air mattress inflators, inflatable structures,
climate control, and various industrial purposes. They are typically noisier than comparable
axial fans.
Figure A2-1: Graph between static pressure and volumetric flow of blowers
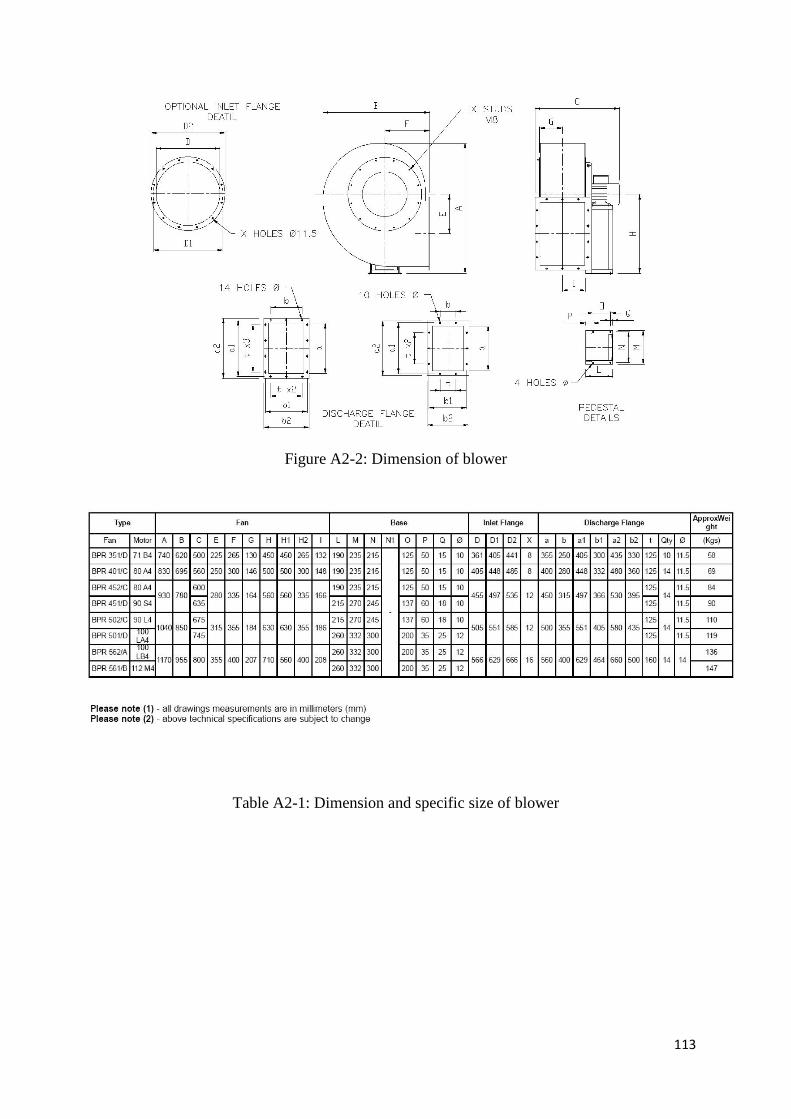
113
Figure A2-2: Dimension of blower
Table A2-1: Dimension and specific size of blower

114
Figure A2-3: Blower
Air Damper
Air damper is a valve or plate that stops or regulates the flow of air inside a duct,
chimney, VAV box, air handler, or other air handling equipment. A damper may be used to
cut off central air conditioning (heating or cooling) to an unused room, or to regulate it for
room-by-room temperature and climate control. Its operation can be manual or automatic.
Manual dampers are turned by a handle on the outside of a duct. Automatic dampers are used
to regulate airflow constantly and are operated by electric or pneumatic motors, in turn
controlled by a thermostat or building automation system.
Figure A2-4: Air Damper, Butterfly valve: Model 10DJ
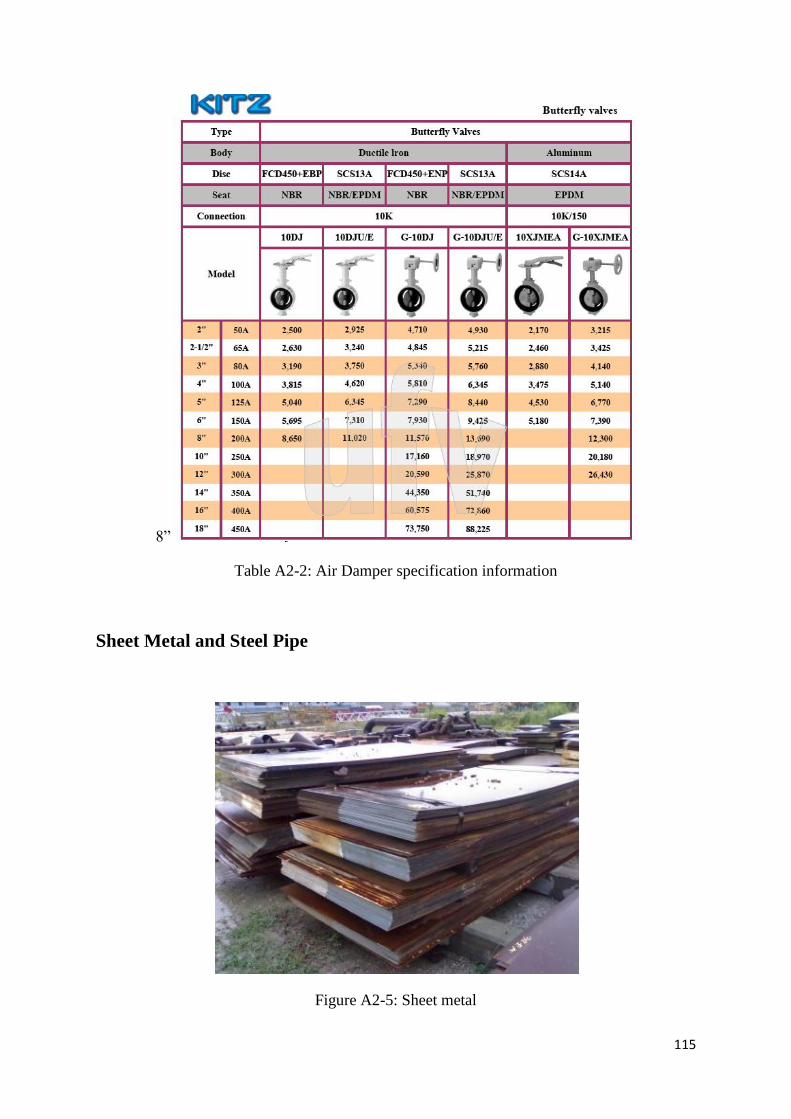
115
8”
Table A2-2: Air Damper specification information
Sheet Metal and Steel Pipe
Figure A2-5: Sheet metal
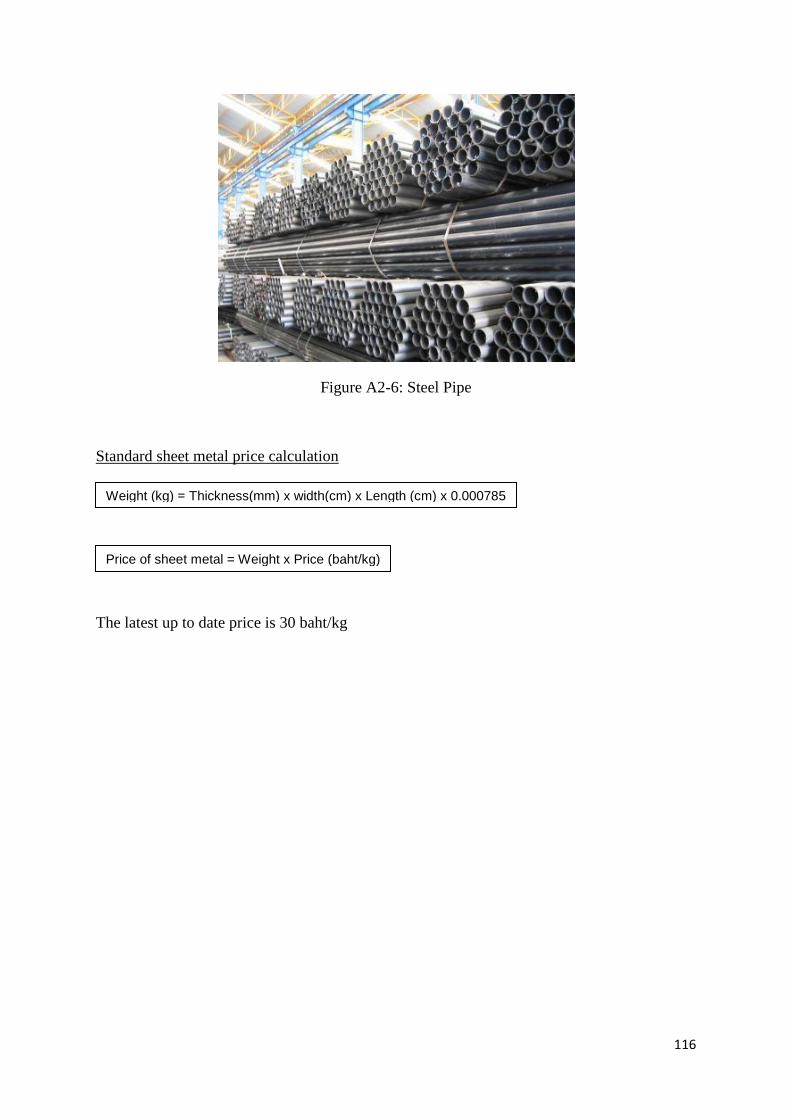
116
Figure A2-6: Steel Pipe
Standard sheet metal price calculation
The latest up to date price is 30 baht/kg
Weight (kg) = Thickness(mm) x width(cm) x Length (cm) x 0.000785
Price of sheet metal = Weight x Price (baht/kg)
117
APPENDIX A3
SPECIFIC INFORMATION OF MUNICIPAL SOLID WASTE
(MSW) FROM LITERATURE
1. “Solid Waste Management in Asian Perspectives” by Prof. C.
Visvanathan, Environmental Engineering and Management Program
School of Environment, Resources and Development Asian Institute of
Technology.
Increasing solid waste management problems and its disposal strikes environment and
health hazards. This training material covers the essential elements of solid waste
management in Asian context. Prevailing scenario of waste handling practices and disposal is
exhibited along with its associated problems. Valuable case studies are also discussed. An
integrated solid waste management in sustainable approach is presented as a response to
necessary waste management strategy needs. Waste minimization in the form of proper waste
segregation and utilization, the importance of pre-treatment of organic waste and combustible
waste fraction does not only manage the waste but also generates products such as compost
and renewable energy. Direct landfilling of commingled waste in Asian countries should be
discouraged due to its high organic waste fraction which causes potential environmental
emissions. The efforts of government to solve this problem from legal aspects through laws
and regulations should be supported by an active participation of community, public and
private agencies.
1.1 Introduction
Enormous amount of waste is generated daily and its management is a huge task. The
prevailing scenario for solid waste final disposal is usually a matter of transporting the
collected waste to the nearest available open space and dumping it. However, only a fraction
of waste were properly collected and transported. Sometimes it is burnt to reduce its volume
and to minimize attraction of animals and vermin and also to retrieve recyclable items. Solid
waste management and disposal is an alarming problem encountered by many of the urban
and industrial areas in developing economies in Asia. Waste generation has witnessed an
increasing trend parallel to the development of industrialization, urbanization, and rapid
growth of population. The problem has become one of the primary urban environmental
issues. Despite the degradation of valuable land resources and creation of long-term
environmental and human health problems, uncontrolled open dumping is still prevalent in
most developing countries (ISWA and UNEP, 2002) which indeed desperately need an
118
immediate action due to the associated harmful impacts. Moreover, in South and Southeast
Asia, more than 90% of all landfills are non-engineered disposal abilities.
Aside of the concern on increasing waste generation, and inefficient collection and
transportation infrastructure system, the composition of waste (high organic matter and high
moisture content) and climatic condition were among the other factors that need to be
considered in solid waste management. Moreover financial constraints and weak
implementation of waste management policy with poor cooperation of government, public
and private sector, educational institutions, and civil society complicates the issues.
1.2 State of Solid Waste Management and Practices in Developing Countries in Asia
In the past, managing solid waste was considered simply transporting waste to distant
places for dumping and for the nature to take care. However, today, the increasing value of
land and inadequate space, limited capacity of nature to handle unwanted emissions and
residues pose alarming threats to human lives. Thus, solid waste management has become a
matter of paramount concern.
1.2.1 Solid waste generation
The trend of solid waste generation in most Asian countries is increasing. The primary
factors affecting waste quantity are population, urbanization, industrialization, and the
changing lifestyle. For example in Thailand, solid waste generation has witnessed an
increasing trend. In 1999, 13.8 million tons/day of waste was generated and increased Urban
areas in Asia generate about 760,000 tones of MSW or approximately 2.7 million m3 per day.
In 2025, this figure will increase to1.8 million tones of waste per day or5.2 million m3 of
waste (World Bank,1999).Moreover, other related issues that affect solid waste generation
are:
• In areas with a large number of tourists, the generation rate is even higher
• In big cities, the waste is more concentrated, and requires expensive removal or collection
• Waste composition is changing with rapid increase in the amount of paper, plastic, metal,
and hazardous waste materials
• Poor urban waste disposal service results in even more litter and pollution of the local
environment.
1.2.2 Solid waste composition
Solid waste composition can be affected by economic status and consumer pattern.
Feedback on waste composition is important in evaluating the requirements or specifications
for equipment need, treatment systems, and management programs and plans. Moreover,
potential emissions (leach ate and landfill gas) from disposed solid waste can be linked with
waste composition, specifically the amount of organic fraction present in waste. The
composition of municipal solid waste (MSW) differs for different countries and regions.
Moreover major portion of MSW generated in most developing Asian countries was
119
dominated by biodegradable organic fractions composed of food wastes, yard wastes, and
mixed paper. Food wastes dominate over the major portion of the waste generated in most
developing countries in Asia like China, India, Sri Lakeland Thailand. In this regard, waste
can be characterized as highly biodegrable with high moisture content in which the disposal
management should consider this factor.
1.2.3 Solid waste collection and transport
Commonly, most poor cities in developing countries are deprived of proper waste
collection services and only a fraction of generated waste is actually collected. Financial
constraints and lack of technical expertise severely limit the effectiveness of solid waste
collection and transportation. Inefficiency in collection system creates a main constraint on
solid waste management capacity.
Typical scheme often observed in urban areas in Asia is the presence of primary
collection service (house to house waste collection and transport to an intermediate collection
point).Such primary collection often managed by community-based organizations and is
often initiated by residents which desperately need a service wherein the residents are also
willing to pay monthly collection fees.
In Thailand, the Bangkok Metropolis Administration (BMA) is responsible for the
collection of solid waste and it operates the biggest single solid waste management system in
Bangkok. The BMA primary solid waste collection system is consist of collection at
households in various areas at accessible time to avoid traffic congestion to transfer station.
The application of transfer stations is not widely practiced, but in some transfer points, the
wastes collected by smaller vehicles are being transferred to larger trucks and from the
compactor truck to a high density transport vehicles which improves transportation
performance. The secondary or indirect waste transport collection places the waste into a
large hauling truck, weigh, and transport in landfills.
Countless efforts in solid waste management has been undertaken in many countries
in Asia but until now, the country still struggling on its collection and transportation schemes.
Improving infrastructure and services establishment with the aim to improve waste collection
and services needs to be focused. The problems that can be associated to insufficient and
inefficient collection and transport are:
• Inappropriate collection techniques. Some systems are expensive to buy and maintain; some
collection vehicles are too bulky to enter all parts of the town
• Inadequate planning on waste transport system and lack of vehicle/equipment and its
maintenance that lead to complete breakdown of collection system
• Most municipalities do not have enough waste bins. In some municipalities, weak public
cooperation on waste management system
• Ignorance on solid waste management leads to dumping in open spaces, along the
roadsides, or in canals and rivers
120
• Dumping waste on vacant lots, canals or river could cause water pollution and would
blocked drainage and cause flood when it rains
• Uncollected wastes often end up in drains, causing blockages which result in flooding.
Plastic bags litter along the road is a particular aesthetic nuisance and they cause the death of
grazing animals which eat them
• Heavy refuse collection trucks can cause significant damage to the surfaces of roads that
were not designed for such weights.
1.2.4 Solid waste disposal
In developing economies in Asia, the status of solid waste management is
characterized by unsafe practices of open dumping and inefficient administration due to
heavy governmental subsidies. However, economic and regulatory pressures are slowly
driving towards the adaptation of timely and efficient solid waste management technique
income Asian countries.
It appears that in most low-income countries, and many medium income countries in
Asia, very little progress has been made in upgrading waste disposal operations, and open
dumping remained as the dominant solid waste disposal system. For example in Sri Lanka,
more than 80% of municipal solid waste is end up into open dumps.
Open dumps, where the waste is unloaded in piles, make very uneconomical use of
the available space, allow free access to waste pickers, animals, and insects and often produce
unpleasant odor and aesthetic nuisance. Such inadequate waste disposal creates severe
environmental problems that affect health of humans and animals and cause serious economic
and other welfare losses. The environmental degradation caused by common inadequate
disposal of waste in Asia (open dumping and non-engineered landfill) can be expressed by:
• Contamination of surface and ground water through leach ate (water draining from beneath
waste disposal sites) from inappropriately located or badly prepared landfill sites. The
generation of lactates by percolating rainwater contain run-off of organic and inorganic
compounds resulting in the contamination of soil, surface, and groundwater. Groundwater
pollution originating from landfills may be at risk even after several centuries.
• Air pollution due to the presence of foul odor associated with open dumping and by burning
of waste. Also, a poorly managed landfill sites produce methane gas which is both polluting
and explosive and are nuisance for the people who live in surrounding area.
• Soil contamination through direct waste contact or leach ate and spreading of diseases by
different vectors like birds, insects and rodents, or uncontrolled release of methane by
anaerobic decomposition of waste.
• Insect infestation. Flies breed in some constituents of solid wastes, and flies are very
effective vectors that spread disease. Mosquitoes breed in blocked drains and in rainwater
that is retained in discarded cans, tires and other objects. Mosquitoes spread disease,
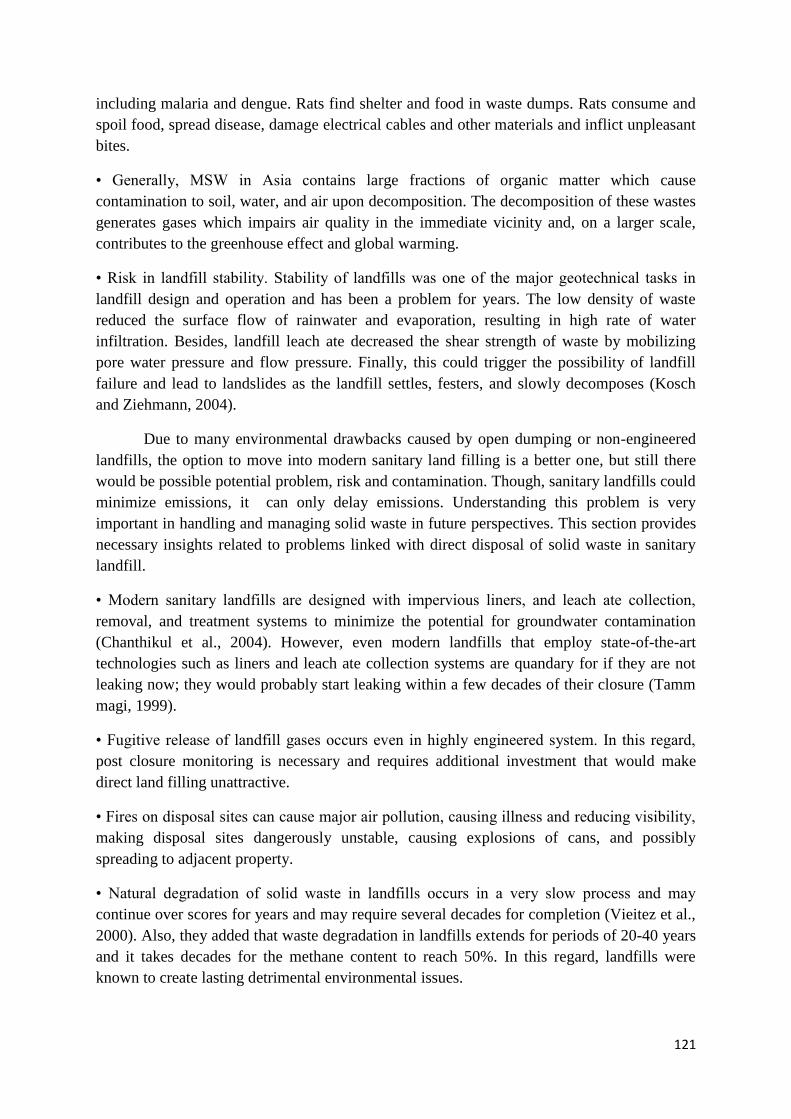
121
including malaria and dengue. Rats find shelter and food in waste dumps. Rats consume and
spoil food, spread disease, damage electrical cables and other materials and inflict unpleasant
bites.
• Generally, MSW in Asia contains large fractions of organic matter which cause
contamination to soil, water, and air upon decomposition. The decomposition of these wastes
generates gases which impairs air quality in the immediate vicinity and, on a larger scale,
contributes to the greenhouse effect and global warming.
• Risk in landfill stability. Stability of landfills was one of the major geotechnical tasks in
landfill design and operation and has been a problem for years. The low density of waste
reduced the surface flow of rainwater and evaporation, resulting in high rate of water
infiltration. Besides, landfill leach ate decreased the shear strength of waste by mobilizing
pore water pressure and flow pressure. Finally, this could trigger the possibility of landfill
failure and lead to landslides as the landfill settles, festers, and slowly decomposes (Kosch
and Ziehmann, 2004).
Due to many environmental drawbacks caused by open dumping or non-engineered
landfills, the option to move into modern sanitary land filling is a better one, but still there
would be possible potential problem, risk and contamination. Though, sanitary landfills could
minimize emissions, it can only delay emissions. Understanding this problem is very
important in handling and managing solid waste in future perspectives. This section provides
necessary insights related to problems linked with direct disposal of solid waste in sanitary
landfill.
• Modern sanitary landfills are designed with impervious liners, and leach ate collection,
removal, and treatment systems to minimize the potential for groundwater contamination
(Chanthikul et al., 2004). However, even modern landfills that employ state-of-the-art
technologies such as liners and leach ate collection systems are quandary for if they are not
leaking now; they would probably start leaking within a few decades of their closure (Tamm
magi, 1999).
• Fugitive release of landfill gases occurs even in highly engineered system. In this regard,
post closure monitoring is necessary and requires additional investment that would make
direct land filling unattractive.
• Fires on disposal sites can cause major air pollution, causing illness and reducing visibility,
making disposal sites dangerously unstable, causing explosions of cans, and possibly
spreading to adjacent property.
• Natural degradation of solid waste in landfills occurs in a very slow process and may
continue over scores for years and may require several decades for completion (Vieitez et al.,
2000). Also, they added that waste degradation in landfills extends for periods of 20-40 years
and it takes decades for the methane content to reach 50%. In this regard, landfills were
known to create lasting detrimental environmental issues.

122
• Unreasonable standard of disposal site is due to the lack of training of workers on landfill
site and insufficient financial and physical resources. As a result, some sites quickly
degenerate into open dumps. It is crucial to maintain good operations behaving motivated and
trained labors.
1.3 Conclusion
Proper solid waste management in developing economies in Asia is an important
aspect to consider in minimizing further environmental contamination. Awareness on the
problems and impacts associated with solid waste generation, collection and transport, and
disposal must be promoted through campaign and education. The government should take an
initiative to improve or modify the solid waste management system and create good
monitoring system. Also, the public and private participation plays an important aspect for
the success of the government solid waste management program. A community based solid
waste management system could deliver positive impact towards proper waste collection in
certain municipality and should be encouraged. Waste minimization through proper waste
segregation of valuable items could not only help in reducing waste generation but also could
generate extra income. Direct disposal of solid waste into open dumps or landfills should be
discouraged. As already learned, the organic material contained in waste is the primary cause
of potential emissions (leach ate and landfill gas) and aesthetic nuisance. Processing of
organic fraction of waste (kitchen waste and yard waste) by composting or anaerobic
digestion is sustainable options that produce reusable material such as compost or biogas.
Inert fractions of waste can be therefore managed by sanitary landfill. Plastic and other
combustible fraction in waste can be processed for RDF production which promotes “waste
to energy” option. Waste should not be treated as a waste for it is able to sustain part of living
needs. Also, should be managed appropriately in order to preserve the environment and
resources.
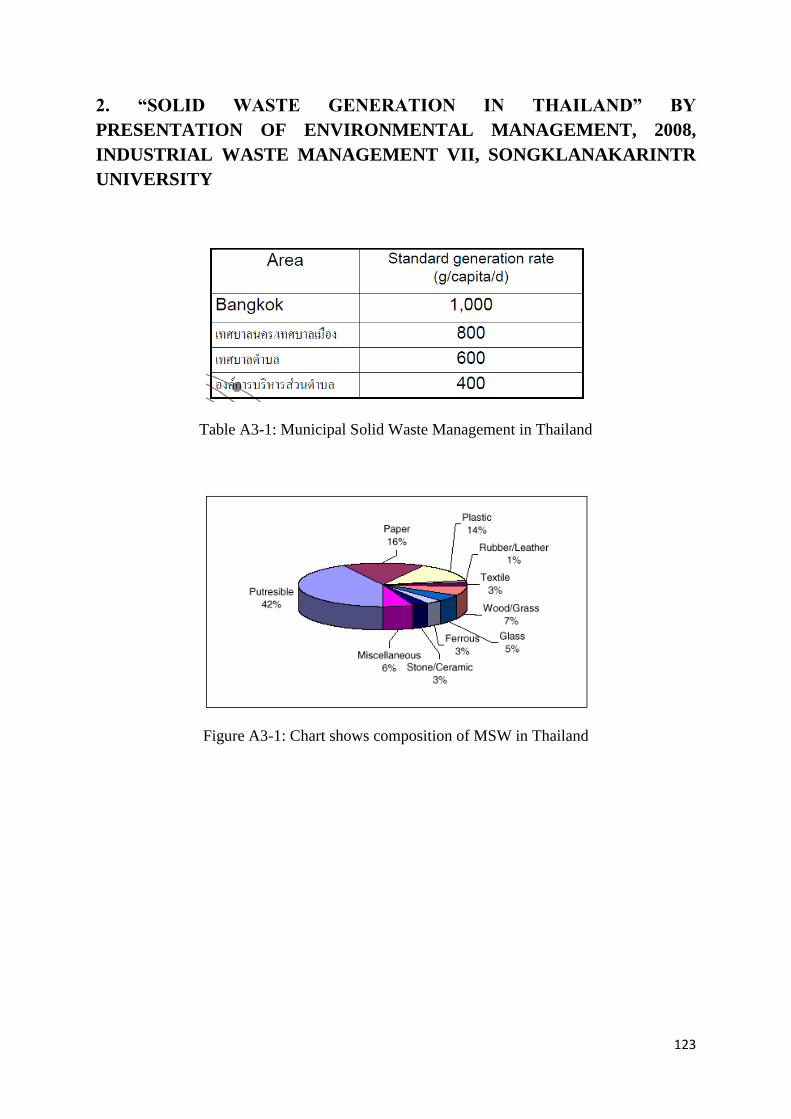
123
2. “SOLID WASTE GENERATION IN THAILAND” BY
PRESENTATION OF ENVIRONMENTAL MANAGEMENT, 2008,
INDUSTRIAL WASTE MANAGEMENT VII, SONGKLANAKARINTR
UNIVERSITY
Table A3-1: Municipal Solid Waste Management in Thailand
Figure A3-1: Chart shows composition of MSW in Thailand
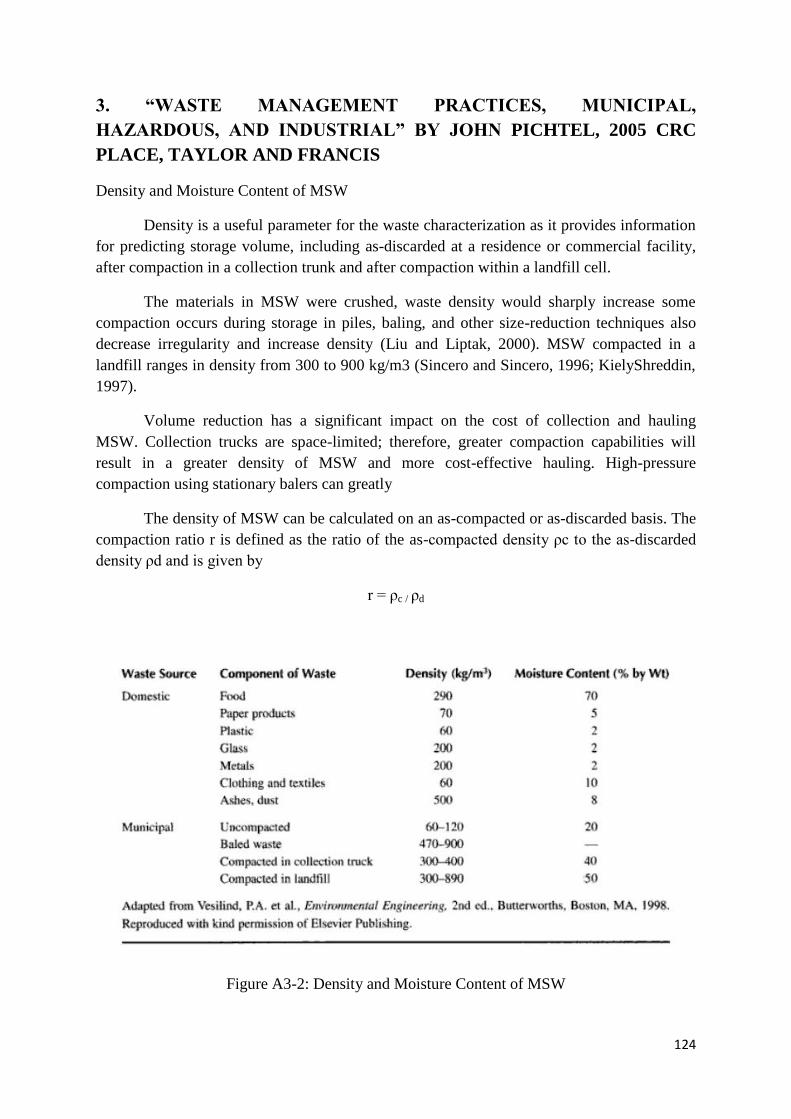
124
3. “WASTE MANAGEMENT PRACTICES, MUNICIPAL,
HAZARDOUS, AND INDUSTRIAL” BY JOHN PICHTEL, 2005 CRC
PLACE, TAYLOR AND FRANCIS
Density and Moisture Content of MSW
Density is a useful parameter for the waste characterization as it provides information
for predicting storage volume, including as-discarded at a residence or commercial facility,
after compaction in a collection trunk and after compaction within a landfill cell.
The materials in MSW were crushed, waste density would sharply increase some
compaction occurs during storage in piles, baling, and other size-reduction techniques also
decrease irregularity and increase density (Liu and Liptak, 2000). MSW compacted in a
landfill ranges in density from 300 to 900 kg/m3 (Sincero and Sincero, 1996; KielyShreddin,
1997).
Volume reduction has a significant impact on the cost of collection and hauling
MSW. Collection trucks are space-limited; therefore, greater compaction capabilities will
result in a greater density of MSW and more cost-effective hauling. High-pressure
compaction using stationary balers can greatly
The density of MSW can be calculated on an as-compacted or as-discarded basis. The
compaction ratio r is defined as the ratio of the as-compacted density ρc to the as-discarded
density ρd and is given by
r = ρc / ρd
Figure A3-2: Density and Moisture Content of MSW
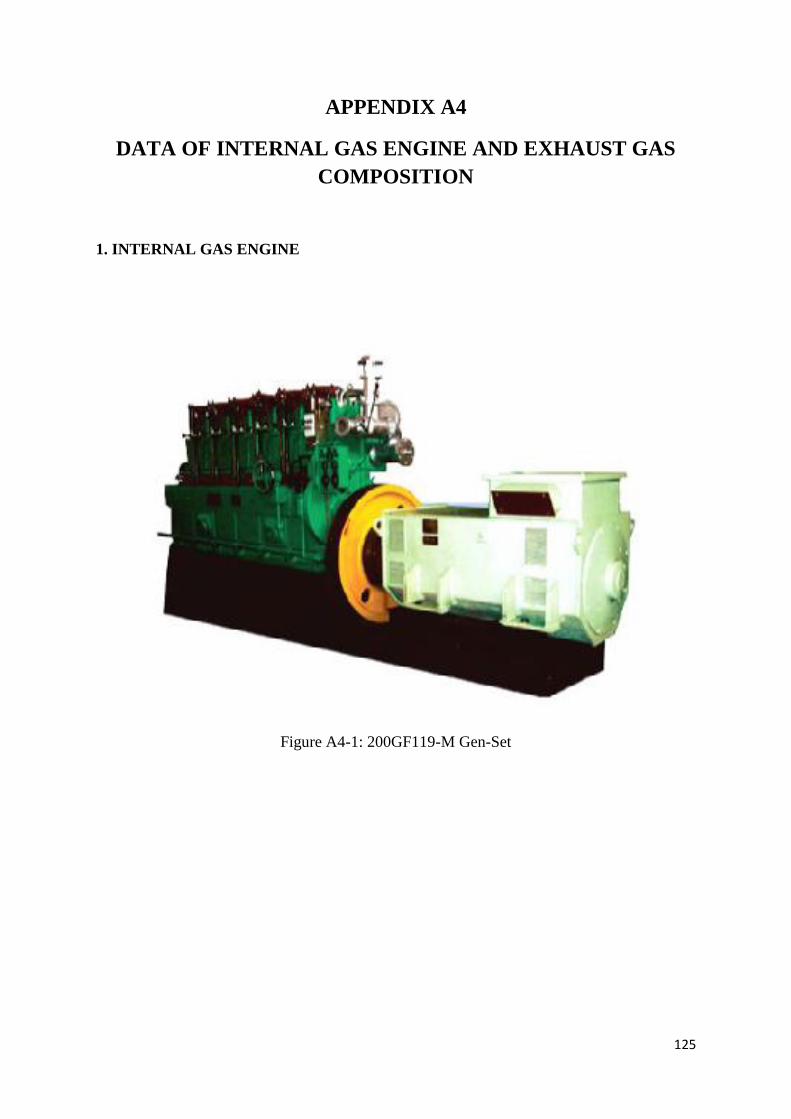
125
APPENDIX A4
DATA OF INTERNAL GAS ENGINE AND EXHAUST GAS
COMPOSITION
1. INTERNAL GAS ENGINE
Figure A4-1: 200GF119-M Gen-Set
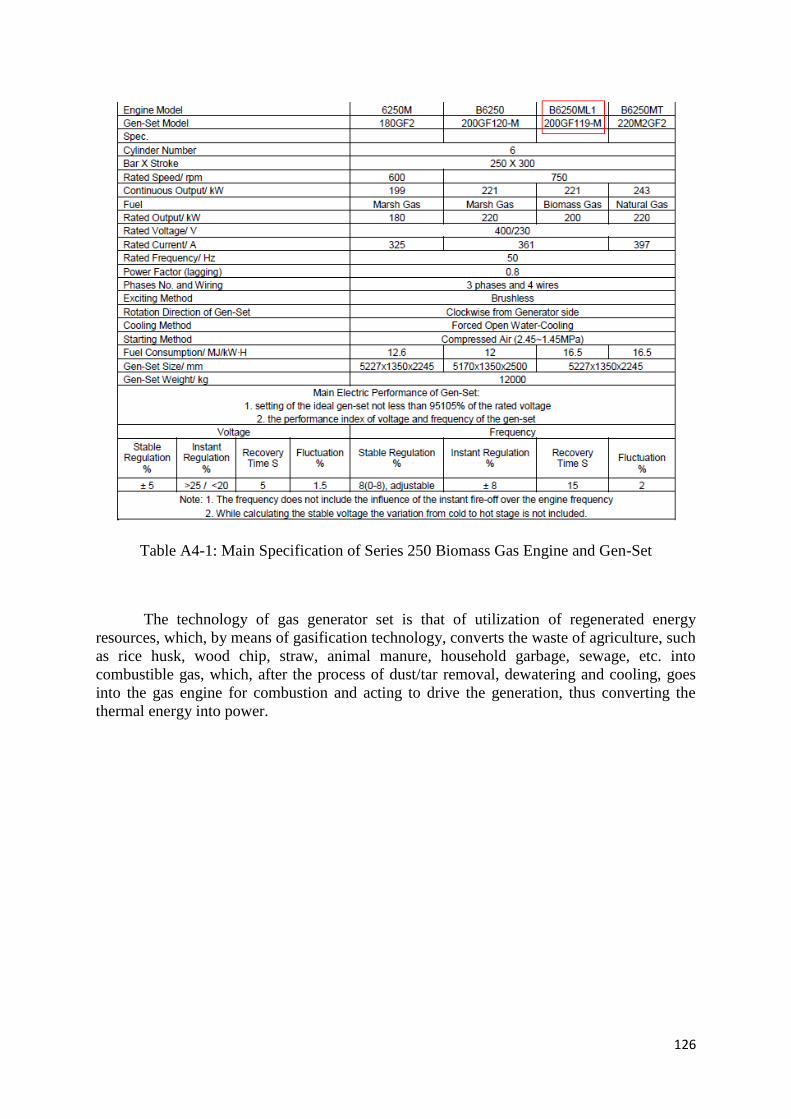
126
Table A4-1: Main Specification of Series 250 Biomass Gas Engine and Gen-Set
The technology of gas generator set is that of utilization of regenerated energy
resources, which, by means of gasification technology, converts the waste of agriculture, such
as rice husk, wood chip, straw, animal manure, household garbage, sewage, etc. into
combustible gas, which, after the process of dust/tar removal, dewatering and cooling, goes
into the gas engine for combustion and acting to drive the generation, thus converting the
thermal energy into power.
127
2. SYNTHESIS GAS COMPOSITION
Refer to the give data from the plant as follow,
Figure A4-2: Gasifier of MSW fuel Calculation
Gasifier of MSW fuel calculation
A basic model
Purpose: 1) To demonstrate the calculation of gasifier calculation for MSW solid waste as an example
2) To illustrate the material and energy balance of the gasifier
Information needed:
1) The characteristic of gasification process or gasifier to be used and also the purpose of
synthetic gas to be used such as the feedstocks for production of other chemicals, the
combustion for flue gas to produce steam from BFW, or the combustion of flue gas to
produce electricity (IGCC) etc.
2) From the specified gasification process, we need to state the synthetic gas reference
composition from the stated fuel used (in this case MSW) for
drawing the process flow chart for the downstream process
3) The ultimate analysis, proximate analysis, heating value of fuel used for the calculation of
the material and energy balance of the gasification process. This will need the heat flow
requirement of the synthetic gas as well if we want to use it as an alternative fuel.
Criteria:
1) In case of no equilibrium constant of water gas shift reaction, methanation reaction and
the methane reforming reaction, we will use the straight reaction (complete) instead
assuming the hydrogen gas produced is enough for the synthetic gas component.
Calculation:
1) The material and energy balance of the gasifier
Picture:
1) Gasifier
2) The Internal Gas Engine
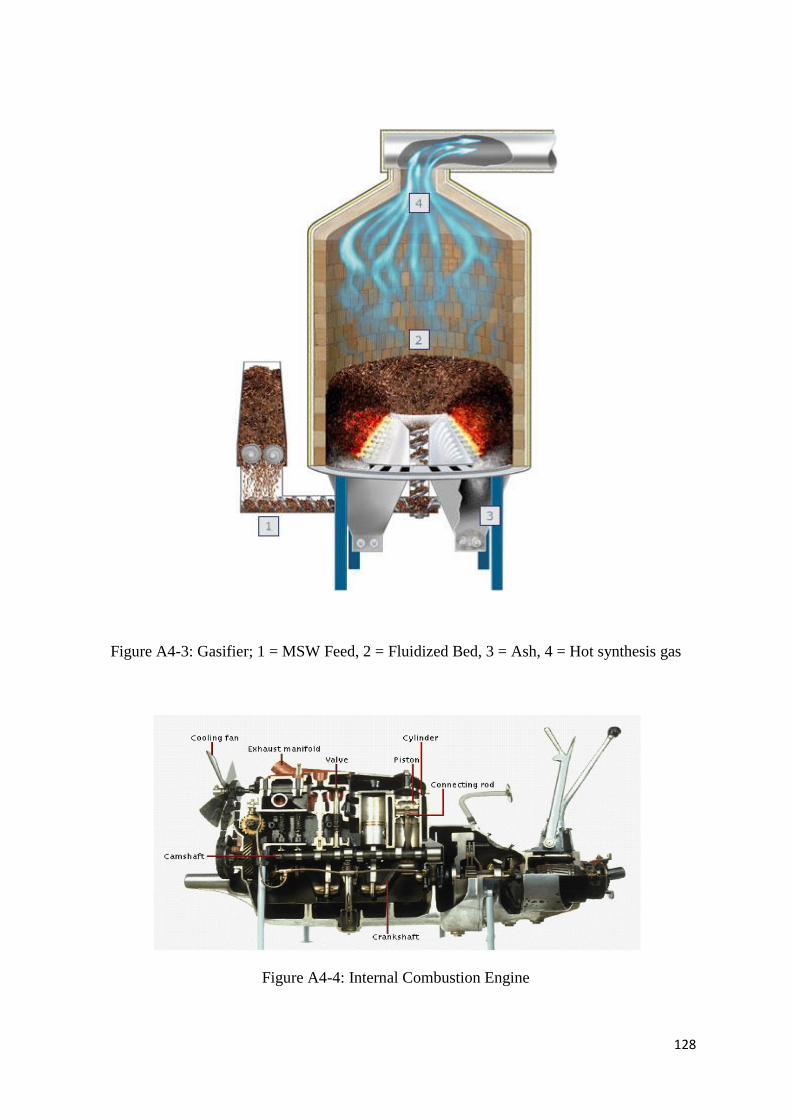
128
Figure A4-3: Gasifier; 1 = MSW Feed, 2 = Fluidized Bed, 3 = Ash, 4 = Hot synthesis gas
Figure A4-4: Internal Combustion Engine
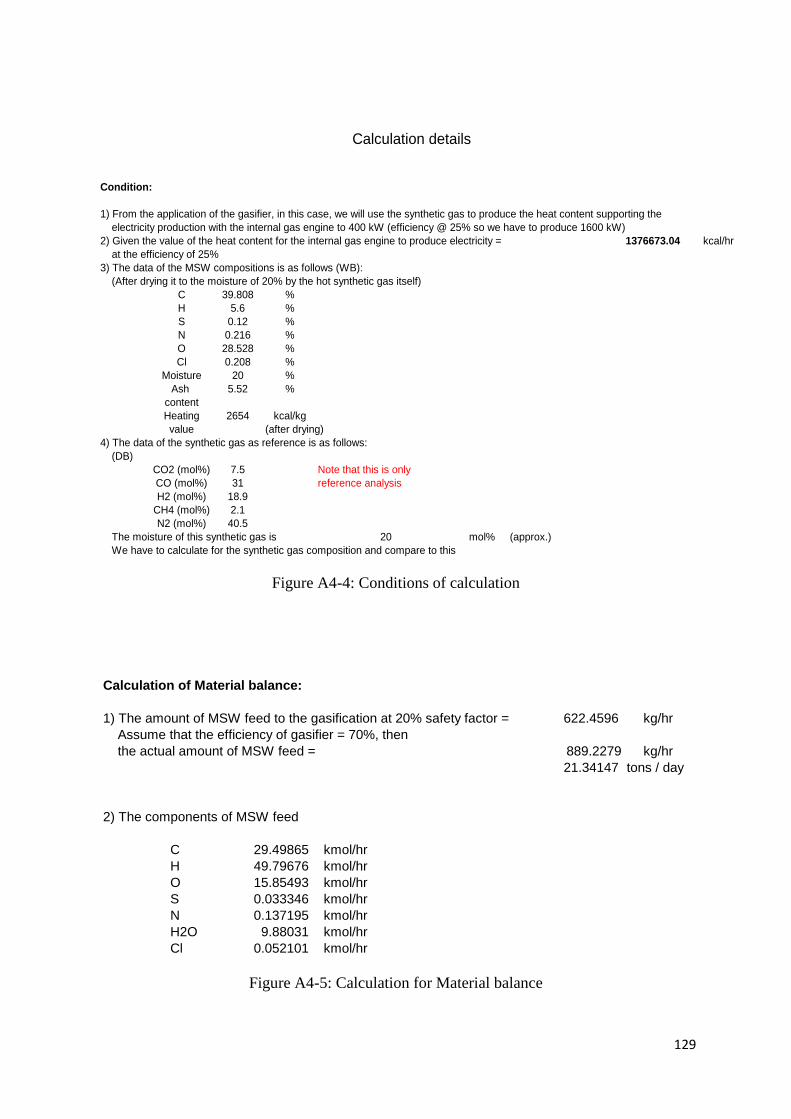
129
Figure A4-4: Conditions of calculation
Figure A4-5: Calculation for Material balance
Calculation details
Condition:
1) From the application of the gasifier, in this case, we will use the synthetic gas to produce the heat content supporting the
electricity production with the internal gas engine to 400 kW (efficiency @ 25% so we have to produce 1600 kW)
2) Given the value of the heat content for the internal gas engine to produce electricity = 1376673.04 kcal/hr
at the efficiency of 25%
3) The data of the MSW compositions is as follows (WB):
(After drying it to the moisture of 20% by the hot synthetic gas itself)
C 39.808 %
H 5.6 %
S 0.12 %
N 0.216 %
O 28.528 %
Cl 0.208 %
Moisture 20 %
Ash 5.52 %
content
Heating 2654 kcal/kg
value (after drying)
4) The data of the synthetic gas as reference is as follows:
(DB)
CO2 (mol%) 7.5 Note that this is only
CO (mol%) 31 reference analysis
H2 (mol%) 18.9
CH4 (mol%) 2.1
N2 (mol%) 40.5
The moisture of this synthetic gas is 20 mol% (approx.)
We have to calculate for the synthetic gas composition and compare to this
Calculation of Material balance:
1) The amount of MSW feed to the gasification at 20% safety factor = 622.4596 kg/hr
Assume that the efficiency of gasifier = 70%, then
the actual amount of MSW feed = 889.2279 kg/hr
21.34147 tons / day
2) The components of MSW feed
C 29.49865 kmol/hr
H 49.79676 kmol/hr
O 15.85493 kmol/hr
S 0.033346 kmol/hr
N 0.137195 kmol/hr
H2O 9.88031 kmol/hr
Cl 0.052101 kmol/hr
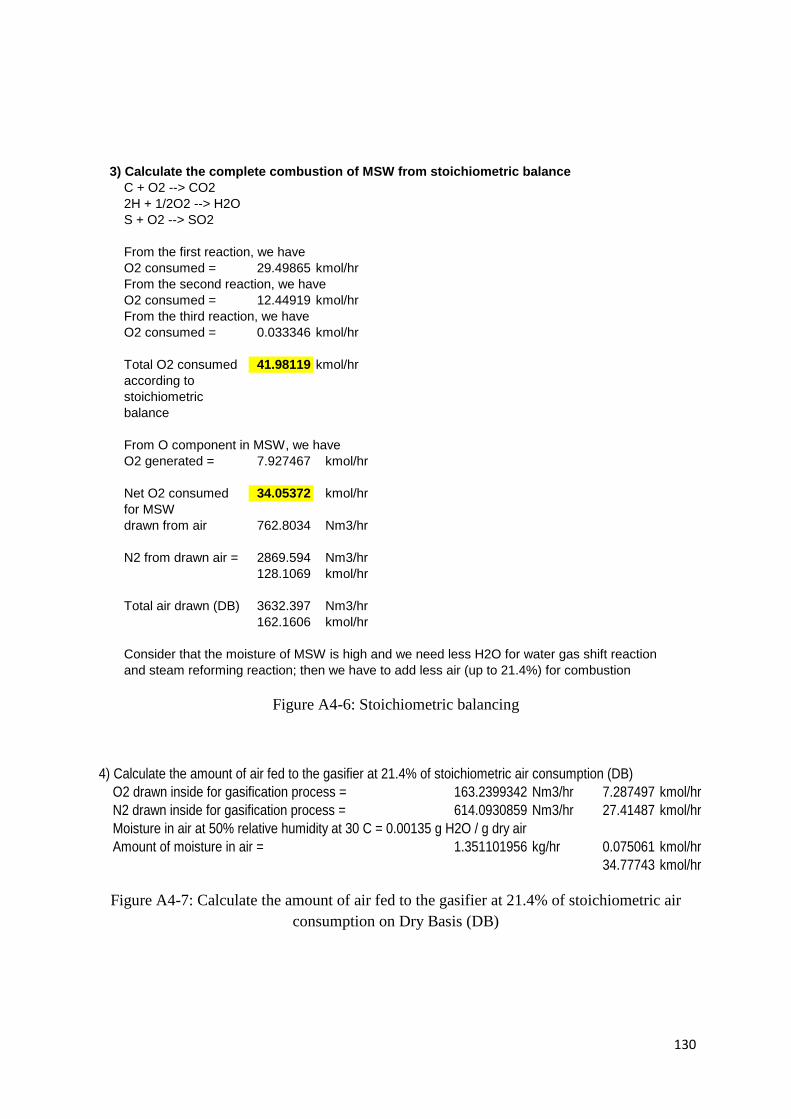
130
Figure A4-6: Stoichiometric balancing
Figure A4-7: Calculate the amount of air fed to the gasifier at 21.4% of stoichiometric air
consumption on Dry Basis (DB)
3) Calculate the complete combustion of MSW from stoichiometric balance
C + O2 --> CO2
2H + 1/2O2 --> H2O
S + O2 --> SO2
From the first reaction, we have
O2 consumed = 29.49865 kmol/hr
From the second reaction, we have
O2 consumed = 12.44919 kmol/hr
From the third reaction, we have
O2 consumed = 0.033346 kmol/hr
Total O2 consumed 41.98119 kmol/hr
according to
stoichiometric
balance
From O component in MSW, we have
O2 generated = 7.927467 kmol/hr
Net O2 consumed 34.05372 kmol/hr
for MSW
drawn from air 762.8034 Nm3/hr
N2 from drawn air = 2869.594 Nm3/hr
128.1069 kmol/hr
Total air drawn (DB) 3632.397 Nm3/hr
162.1606 kmol/hr
Consider that the moisture of MSW is high and we need less H2O for water gas shift reaction
and steam reforming reaction; then we have to add less air (up to 21.4%) for combustion
4) Calculate the amount of air fed to the gasifier at 21.4% of stoichiometric air consumption (DB)
O2 drawn inside for gasification process = 163.2399342 Nm3/hr 7.287497 kmol/hr
N2 drawn inside for gasification process = 614.0930859 Nm3/hr 27.41487 kmol/hr
Moisture in air at 50% relative humidity at 30 C = 0.00135 g H2O / g dry air
Amount of moisture in air = 1.351101956 kg/hr 0.075061 kmol/hr
34.77743 kmol/hr
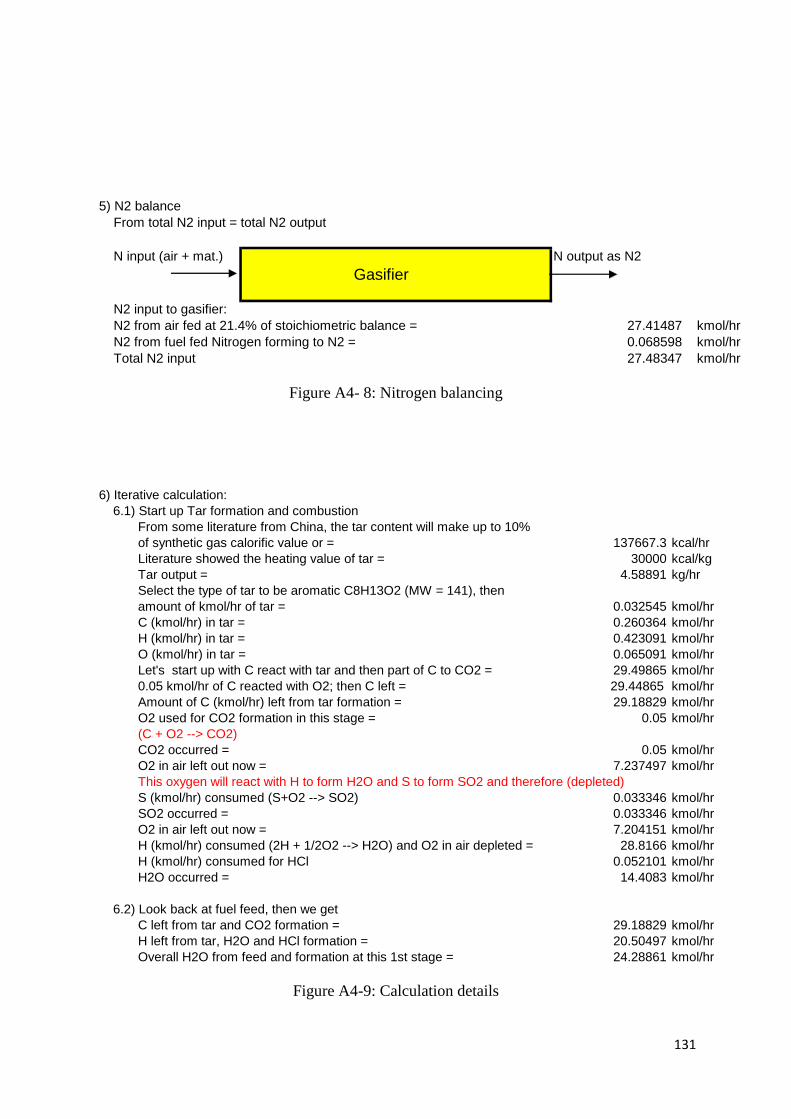
131
Figure A4- 8: Nitrogen balancing
Figure A4-9: Calculation details
5) N2 balance
From total N2 input = total N2 output
N input (air + mat.) N output as N2
Gasifier
N2 input to gasifier:
N2 from air fed at 21.4% of stoichiometric balance = 27.41487 kmol/hr
N2 from fuel fed Nitrogen forming to N2 = 0.068598 kmol/hr
Total N2 input 27.48347 kmol/hr
6) Iterative calculation:
6.1) Start up Tar formation and combustion
From some literature from China, the tar content will make up to 10%
of synthetic gas calorific value or = 137667.3 kcal/hr
Literature showed the heating value of tar = 30000 kcal/kg
Tar output = 4.58891 kg/hr
Select the type of tar to be aromatic C8H13O2 (MW = 141), then
amount of kmol/hr of tar = 0.032545 kmol/hr
C (kmol/hr) in tar = 0.260364 kmol/hr
H (kmol/hr) in tar = 0.423091 kmol/hr
O (kmol/hr) in tar = 0.065091 kmol/hr
Let's start up with C react with tar and then part of C to CO2 = 29.49865 kmol/hr
0.05 kmol/hr of C reacted with O2; then C left = 29.44865 kmol/hr
Amount of C (kmol/hr) left from tar formation = 29.18829 kmol/hr
O2 used for CO2 formation in this stage = 0.05 kmol/hr
(C + O2 --> CO2)
CO2 occurred = 0.05 kmol/hr
O2 in air left out now = 7.237497 kmol/hr
This oxygen will react with H to form H2O and S to form SO2 and therefore (depleted)
S (kmol/hr) consumed (S+O2 --> SO2) 0.033346 kmol/hr
SO2 occurred = 0.033346 kmol/hr
O2 in air left out now = 7.204151 kmol/hr
H (kmol/hr) consumed (2H + 1/2O2 --> H2O) and O2 in air depleted = 28.8166 kmol/hr
H (kmol/hr) consumed for HCl 0.052101 kmol/hr
H2O occurred = 14.4083 kmol/hr
6.2) Look back at fuel feed, then we get
C left from tar and CO2 formation = 29.18829 kmol/hr
H left from tar, H2O and HCl formation = 20.50497 kmol/hr
Overall H2O from feed and formation at this 1st stage = 24.28861 kmol/hr
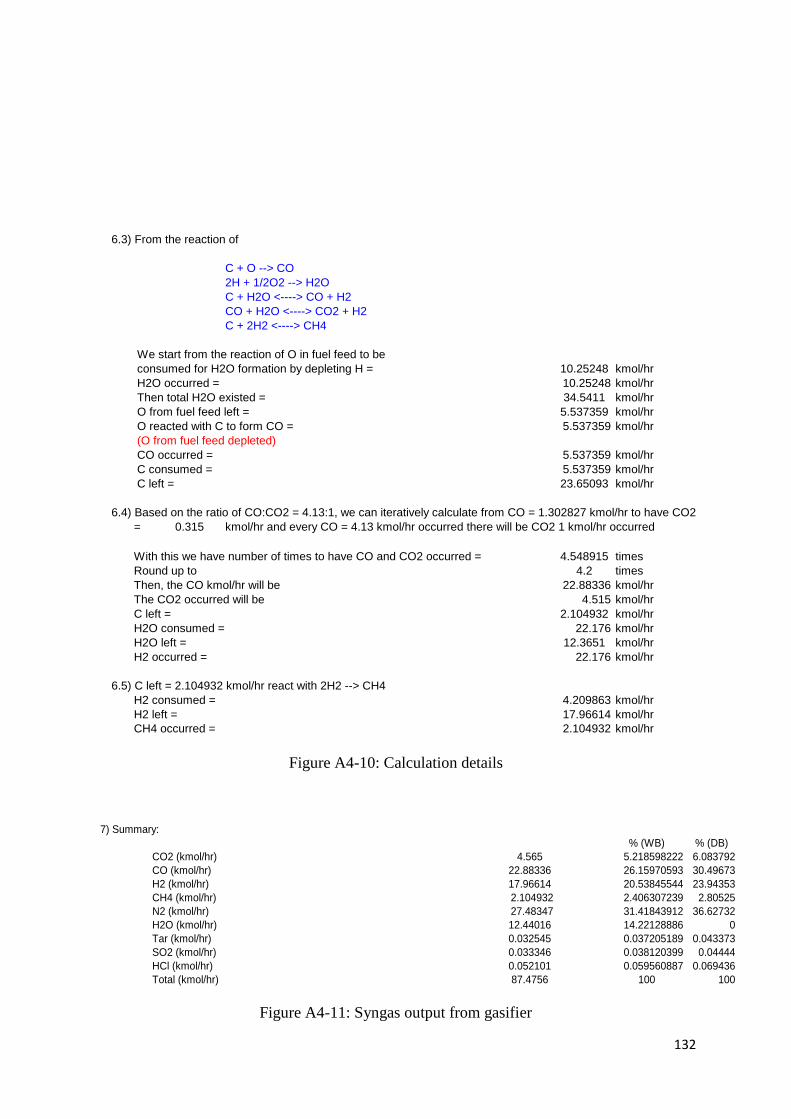
132
Figure A4-10: Calculation details
Figure A4-11: Syngas output from gasifier
6.3) From the reaction of
C + O --> CO
2H + 1/2O2 --> H2O
C + H2O <----> CO + H2
CO + H2O <----> CO2 + H2
C + 2H2 <----> CH4
We start from the reaction of O in fuel feed to be
consumed for H2O formation by depleting H = 10.25248 kmol/hr
H2O occurred = 10.25248 kmol/hr
Then total H2O existed = 34.5411 kmol/hr
O from fuel feed left = 5.537359 kmol/hr
O reacted with C to form CO = 5.537359 kmol/hr
(O from fuel feed depleted)
CO occurred = 5.537359 kmol/hr
C consumed = 5.537359 kmol/hr
C left = 23.65093 kmol/hr
6.4) Based on the ratio of CO:CO2 = 4.13:1, we can iteratively calculate from CO = 1.302827 kmol/hr to have CO2
= 0.315 kmol/hr and every CO = 4.13 kmol/hr occurred there will be CO2 1 kmol/hr occurred
With this we have number of times to have CO and CO2 occurred = 4.548915 times
Round up to 4.2 times
Then, the CO kmol/hr will be 22.88336 kmol/hr
The CO2 occurred will be 4.515 kmol/hr
C left = 2.104932 kmol/hr
H2O consumed = 22.176 kmol/hr
H2O left = 12.3651 kmol/hr
H2 occurred = 22.176 kmol/hr
6.5) C left = 2.104932 kmol/hr react with 2H2 --> CH4
H2 consumed = 4.209863 kmol/hr
H2 left = 17.96614 kmol/hr
CH4 occurred = 2.104932 kmol/hr
7) Summary:
% (WB) % (DB)
CO2 (kmol/hr) 4.565 5.218598222 6.083792
CO (kmol/hr) 22.88336 26.15970593 30.49673
H2 (kmol/hr) 17.96614 20.53845544 23.94353
CH4 (kmol/hr) 2.104932 2.406307239 2.80525
N2 (kmol/hr) 27.48347 31.41843912 36.62732
H2O (kmol/hr) 12.44016 14.22128886 0
Tar (kmol/hr) 0.032545 0.037205189 0.043373
SO2 (kmol/hr) 0.033346 0.038120399 0.04444
HCl (kmol/hr) 0.052101 0.059560887 0.069436
Total (kmol/hr) 87.4756 100 100
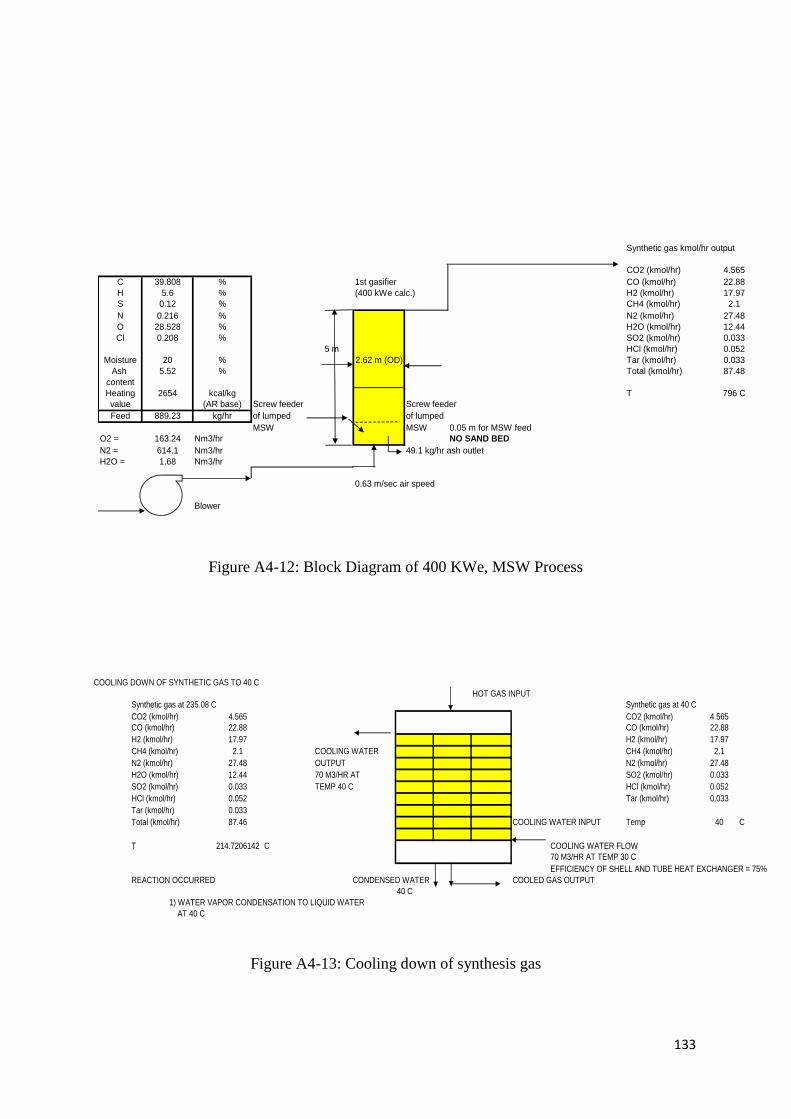
133
Figure A4-12: Block Diagram of 400 KWe, MSW Process
Figure A4-13: Cooling down of synthesis gas
BLOCK DIAGRAM OF 400 kWe MSW PROCESS
Synthetic gas kmol/hr output
CO2 (kmol/hr) 4.565
C 39.808 % 1st gasifier CO (kmol/hr) 22.88
H 5.6 % (400 kWe calc.) H2 (kmol/hr) 17.97
S 0.12 % CH4 (kmol/hr) 2.1
N 0.216 % N2 (kmol/hr) 27.48
O 28.528 % H2O (kmol/hr) 12.44
Cl 0.208 % SO2 (kmol/hr) 0.033
5 m HCl (kmol/hr) 0.052
Moisture 20 % 2.62 m (OD) Tar (kmol/hr) 0.033
Ash 5.52 % Total (kmol/hr) 87.48
content
Heating 2654 kcal/kg T 796 C
value (AR base) Screw feeder Screw feeder
Feed 889.23 kg/hr of lumped of lumped
MSW MSW 0.05 m for MSW feed
O2 = 163.24 Nm3/hr NO SAND BED
N2 = 614.1 Nm3/hr 49.1 kg/hr ash outlet
H2O = 1.68 Nm3/hr
0.63 m/sec air speed
Blower
COOLING DOWN OF SYNTHETIC GAS TO 40 C
HOT GAS INPUT
Synthetic gas at 235.08 C Synthetic gas at 40 C
CO2 (kmol/hr) 4.565 CO2 (kmol/hr) 4.565
CO (kmol/hr) 22.88 CO (kmol/hr) 22.88
H2 (kmol/hr) 17.97 H2 (kmol/hr) 17.97
CH4 (kmol/hr) 2.1 COOLING WATER CH4 (kmol/hr) 2.1
N2 (kmol/hr) 27.48 OUTPUT N2 (kmol/hr) 27.48
H2O (kmol/hr) 12.44 70 M3/HR AT SO2 (kmol/hr) 0.033
SO2 (kmol/hr) 0.033 TEMP 40 C HCl (kmol/hr) 0.052
HCl (kmol/hr) 0.052 Tar (kmol/hr) 0.033
Tar (kmol/hr) 0.033
Total (kmol/hr) 87.46 COOLING WATER INPUT Temp 40 C
T 214.7206142 C COOLING WATER FLOW
70 M3/HR AT TEMP 30 C
EFFICIENCY OF SHELL AND TUBE HEAT EXCHANGER = 75%
REACTION OCCURRED CONDENSED WATER COOLED GAS OUTPUT
40 C
1) WATER VAPOR CONDENSATION TO LIQUID WATER
AT 40 C
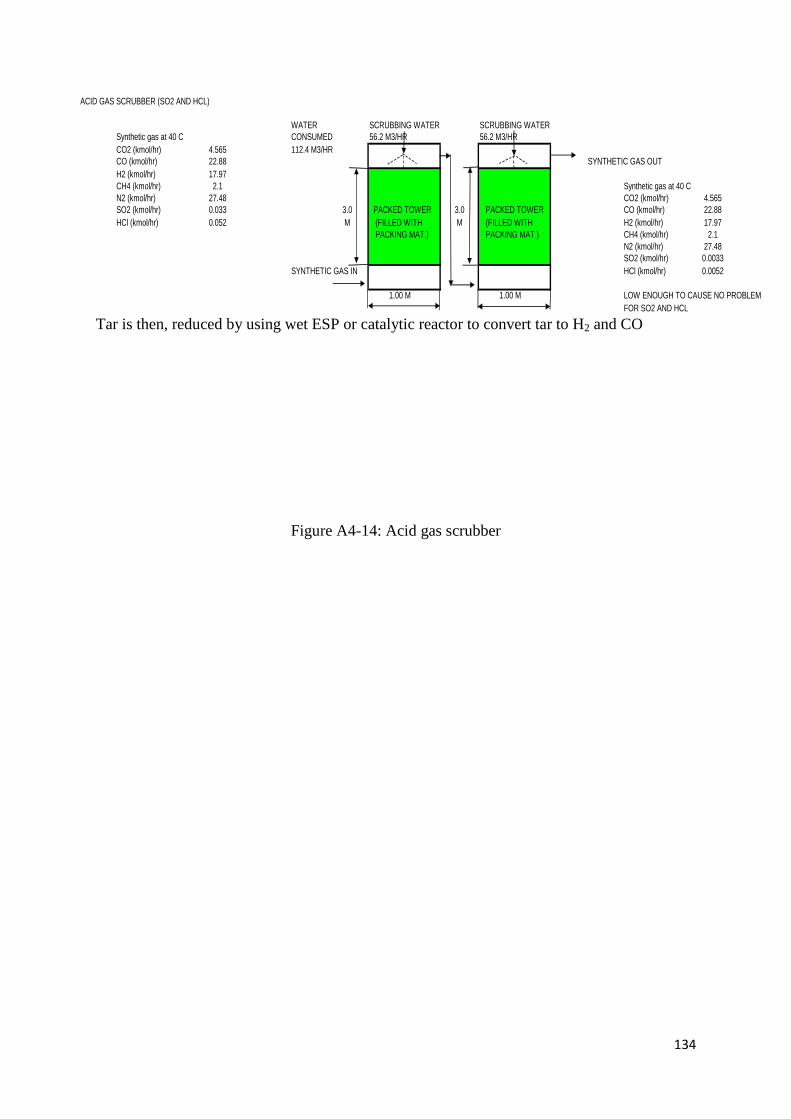
134
Tar is then, reduced by using wet ESP or catalytic reactor to convert tar to H2 and CO
Figure A4-14: Acid gas scrubber
ACID GAS SCRUBBER (SO2 AND HCL)
WATER SCRUBBING WATER SCRUBBING WATER
Synthetic gas at 40 C CONSUMED 56.2 M3/HR 56.2 M3/HR
CO2 (kmol/hr) 4.565 112.4 M3/HR
CO (kmol/hr) 22.88 SYNTHETIC GAS OUT
H2 (kmol/hr) 17.97
CH4 (kmol/hr) 2.1 Synthetic gas at 40 C
N2 (kmol/hr) 27.48 CO2 (kmol/hr) 4.565
SO2 (kmol/hr) 0.033 3.0 PACKED TOWER 3.0 PACKED TOWER CO (kmol/hr) 22.88
HCl (kmol/hr) 0.052 M (FILLED WITH M (FILLED WITH H2 (kmol/hr) 17.97
PACKING MAT.) PACKING MAT.) CH4 (kmol/hr) 2.1
N2 (kmol/hr) 27.48
SO2 (kmol/hr) 0.0033
SYNTHETIC GAS IN HCl (kmol/hr) 0.0052
1.00 M 1.00 M LOW ENOUGH TO CAUSE NO PROBLEM
FOR SO2 AND HCL
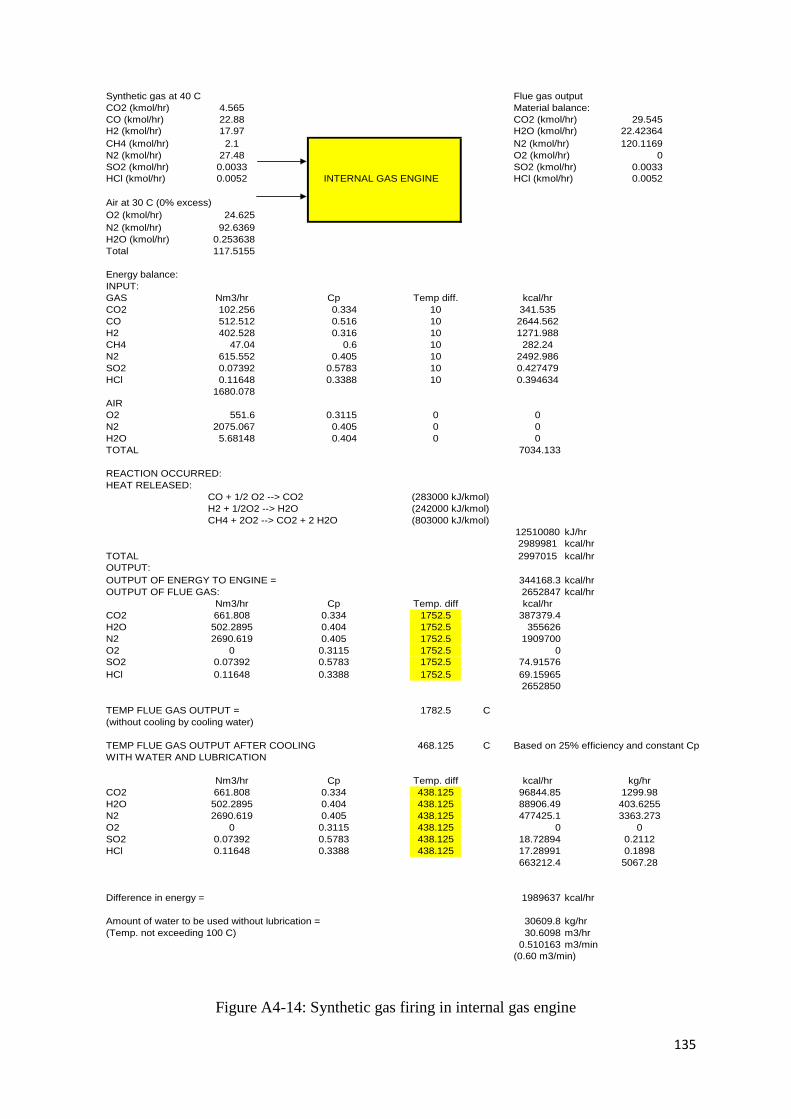
135
Figure A4-14: Synthetic gas firing in internal gas engine
Synthetic gas at 40 C Flue gas output
CO2 (kmol/hr) 4.565 Material balance:
CO (kmol/hr) 22.88 CO2 (kmol/hr) 29.545
H2 (kmol/hr) 17.97 H2O (kmol/hr) 22.42364
CH4 (kmol/hr) 2.1 N2 (kmol/hr) 120.1169
N2 (kmol/hr) 27.48 O2 (kmol/hr) 0
SO2 (kmol/hr) 0.0033 SO2 (kmol/hr) 0.0033
HCl (kmol/hr) 0.0052 INTERNAL GAS ENGINE HCl (kmol/hr) 0.0052
Air at 30 C (0% excess)
O2 (kmol/hr) 24.625
N2 (kmol/hr) 92.6369
H2O (kmol/hr) 0.253638
Total 117.5155
Energy balance:
INPUT:
GAS Nm3/hr Cp Temp diff. kcal/hr
CO2 102.256 0.334 10 341.535
CO 512.512 0.516 10 2644.562
H2 402.528 0.316 10 1271.988
CH4 47.04 0.6 10 282.24
N2 615.552 0.405 10 2492.986
SO2 0.07392 0.5783 10 0.427479
HCl 0.11648 0.3388 10 0.394634
1680.078
AIR
O2 551.6 0.3115 0 0
N2 2075.067 0.405 0 0
H2O 5.68148 0.404 0 0
TOTAL 7034.133
REACTION OCCURRED:
HEAT RELEASED:
CO + 1/2 O2 --> CO2 (283000 kJ/kmol)
H2 + 1/2O2 --> H2O (242000 kJ/kmol)
CH4 + 2O2 --> CO2 + 2 H2O (803000 kJ/kmol)
12510080 kJ/hr
2989981 kcal/hr
TOTAL 2997015 kcal/hr
OUTPUT:
OUTPUT OF ENERGY TO ENGINE = 344168.3 kcal/hr
OUTPUT OF FLUE GAS: 2652847 kcal/hr
Nm3/hr Cp Temp. diff kcal/hr
CO2 661.808 0.334 1752.5 387379.4
H2O 502.2895 0.404 1752.5 355626
N2 2690.619 0.405 1752.5 1909700
O2 0 0.3115 1752.5 0
SO2 0.07392 0.5783 1752.5 74.91576
HCl 0.11648 0.3388 1752.5 69.15965
2652850
TEMP FLUE GAS OUTPUT = 1782.5 C
(without cooling by cooling water)
TEMP FLUE GAS OUTPUT AFTER COOLING 468.125 C Based on 25% efficiency and constant Cp
WITH WATER AND LUBRICATION
Nm3/hr Cp Temp. diff kcal/hr kg/hr
CO2 661.808 0.334 438.125 96844.85 1299.98
H2O 502.2895 0.404 438.125 88906.49 403.6255
N2 2690.619 0.405 438.125 477425.1 3363.273
O2 0 0.3115 438.125 0 0
SO2 0.07392 0.5783 438.125 18.72894 0.2112
HCl 0.11648 0.3388 438.125 17.28991 0.1898
663212.4 5067.28
Difference in energy = 1989637 kcal/hr
Amount of water to be used without lubrication = 30609.8 kg/hr
(Temp. not exceeding 100 C) 30.6098 m3/hr
0.510163 m3/min
(0.60 m3/min)
136
APPENDIX A5
ENERGY UNIT CONVERSION
CONVERSION US · UK · METRIC · SI UNITS
FOR THERMAL ENGINEERS
BASICS | GRUNDLÆGGENDE
Heat Content & Energy
1 kJ | kN·m = 0,9478 Btu
1 kJ | kN·m = 0,2388 Kcal
1 Btu = 1,055 kJ
1 Btu = 0,2520 Kcal
1 kcal = 4,187 kJ
1 kcal = 3,968 Btu
1 kWh = 3600 kJ
1 kWh = 859,8 Kcal
Heat Load | Power
1 kW = 3412 Btu/h
1 kW = 859,8 Kcal/h
1 Btu/h = 2,931·10-4 kW
1 Btu/h = 0,2520 Kcal/h
1 kcal/h = 1,163·10-3 kW
1 kcal/h = 3,968 Btu/h
1 Boiler HP = 9,81 kW
1 Joule (J) is the MKS unit of energy, equal to the force of one Newton acting through one
meter.
1 Watt is the power of a Joule of energy per second
Power = Current x Voltage (P = I V)
1 Watt is the power from a current of 1 Ampere flowing through 1 Volt.
1 kilowatt is a thousand Watts.
1 kilowatt-hour is the energy of one kilowatt power flowing for one hour. (E = P t).
1 kilowatt-hour (kWh) = 3.6 x 10⁶ J = 3.6 million Joules
137
1 calorie of heat is the amount needed to raise 1 gram of water 1 degree Centigrade.
1 calorie (cal) = 4.184 J
(The Calories in food ratings are actually kilocalories.)
A BTU (British thermal unit) is the amount of heat necessary to raise one pound of water by
1 degree Fahrenheit (F).
1 British Thermal Unit (BTU) = 1055 J (The Mechanical Equivalent of Heat Relation)
1 BTU = 252 cal = 1.055 kJ
1 Quad = 1015 BTU (World energy usage is about 300 Quads/year, US is about 100
Quads/year in 1996.)
1 therm = 100,000 BTU
1,000 kWh = 3.41 million BTU
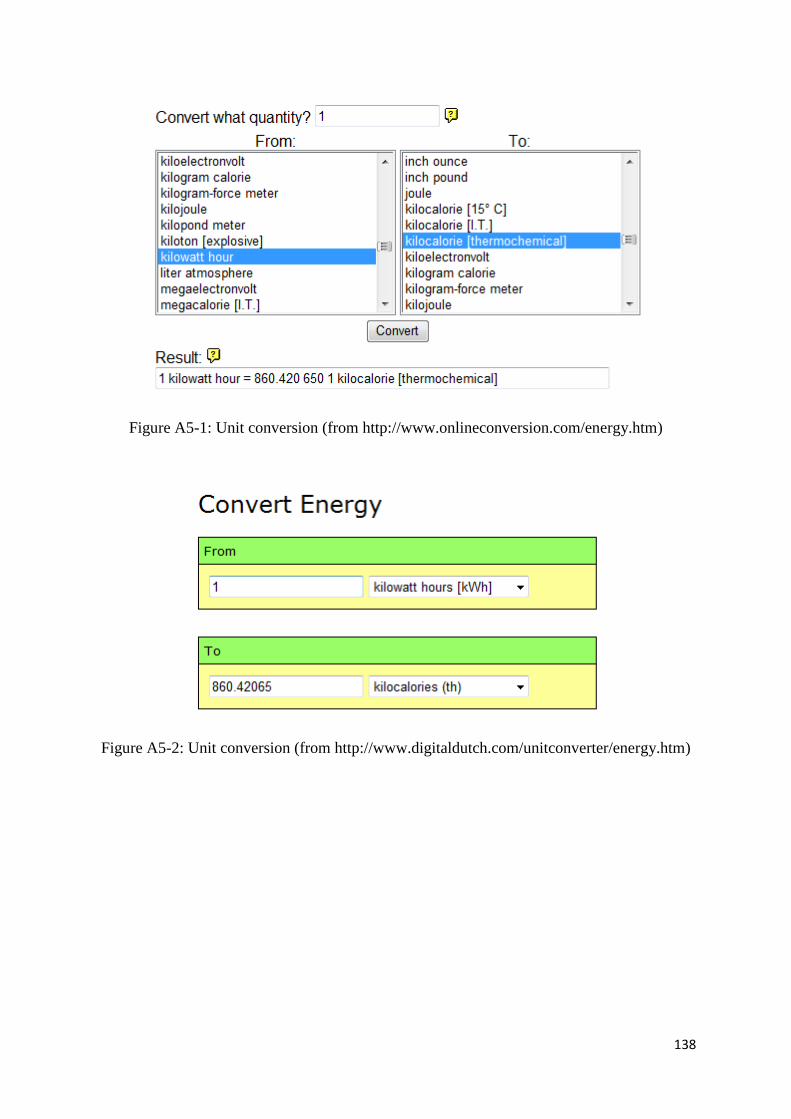
138
Figure A5-1: Unit conversion (from http://www.onlineconversion.com/energy.htm)
Figure A5-2: Unit conversion (from http://www.digitaldutch.com/unitconverter/energy.htm)
139
APPENDIX A6
HEATING VALUE
1. INTRODUCTION
For fuels where the precise fuel composition is not known, the enthalpy of the
reactants cannot be determined from the enthalpies of formation of the reactant species. The
heating value of the fuel is then measured directly
The heating value QHV or calorific value of a fuel is the magnitude of the heat of
reaction at constant pressure or at constant volume at standard temperature [usually 25ºC] for
the complete combustion of unit mass of fuel
The complete combustion means that all carbon is converted to CO2,, all hydrogen is
converted to H2O, and any sulfur present is converted to SO2
In term of higher heating value QHHV is used when the H2O formed is all condensed
to the liquid phase; in term of lower heating value QLHV is used when the H2O formed is all
in the vapor phase
2. HOW TO MEASURE QUANTITIES AND HEATING VALUES
Fuels are measured for trading purposes and to monitor processes which produce or
use them. The units of measurement employed at the point of measurement of the fuel flow
are those which are the best suited to its physical state (solid, liquid or gas) and require the
simplest measuring instruments. These units are termed the natural units for the fuel (the term
physical unit is also used). Typical examples are mass units for solid fuels (kilograms or
tones) and volume units for liquids and gases (liters or cubic meters). There are some
exceptions, of course; fuel wood, for instance, is often measured in cubic meters or in a
volume unit employed locally.
Electrical energy is measured in an energy unit, kilowatt-hour (kWh). Quantities of
heat in steam flows are calculated from measurements of the pressure and temperature of the
steam and may be expressed in calories or joules. Apart from the measurements to derive the
heat content of steam, heat flows are rarely measured but inferred from the fuel used to
produce them.
It is also common to convert liquids measured in liters or gallons to tones. This
enables the total quantity of different liquid products to be calculated. Conversion from
volume to mass requires the densities of the liquids.
Once it is expressed in its natural unit, a fuel quantity may be converted into another
unit. There are several reasons for doing so: comparing fuel quantities, estimating efficiency,
140
etc. The most usual unit is an energy unit because the heat-raising potential of the fuel is
often the reason for its purchase or use. Use of energy units also permits the summing of the
energy content of different fuels in different physical states.
The conversion of a fuel quantity from natural units or some intermediate unit (such
as mass) into energy units requires a conversion factor which expresses the heat obtained
from one unit of the fuel. This conversion factor is termed the calorific value or heating value
of the fuel. Typical expression of the values would be 26gigajoule/tone (GJ/t) for a coal or
35.6 mega joule/cubic meter (MJ/m3) for a gas. In this Manual the term” calorific value” will
be used although “heating value” is also in widespread use.
The calorific value of a fuel is obtained by measurement in a laboratory specializing
in fuel quality determination. Major fuel producers (mining companies, refineries, etc.) will
measure the calorific value and other qualities of the fuels they produce. The actual methods
used to measure calorific values are not important for this Manual but the presence of water
in fuel combustion will influence calorific value and this is discussed below.
3. THE DIFFERENCE BETWEEN GROSS AND NET CALORIFIC VALUE
Most fuels are mixtures of carbon and hydrogen and these are the main heating
agents. There may be other elements which do not contribute, or contribute only slightly, to
the calorific value of the fuel. Both the carbon and the hydrogen combine with oxygen during
combustion and the reactions provide the heat. When the hydrogen combines with oxygen, it
forms water in a gaseous or vapor state at the high temperature of the combustion. The water
is therefore almost always carried away with the other products of combustion in the exhaust
gases from the apparatus in which the combustion takes place (boiler, engine, furnace, etc.).
When the exhaust gases cool, the water will condense into a liquid state and release
heat, known as latent heat, which is wasted in the atmosphere. The heating value of a fuel
may, therefore, be expressed as a gross value or a net value. The gross value includes all of
the heat released from the fuel, including any carried away in the water formed during
combustion. The net value excludes the latent heat of the water formed during combustion. It
is important when obtaining a calorific value to check whether it is net or gross. The
differences between net and gross are typically about 5% to 6% of the gross value for solid
and liquid fuels, and about 10% for natural gas.
There are a few fuels which contain no, or very little, hydrogen (for example blast
furnace gas, high-temperature cokes and some petroleum cokes). In these cases there will be
negligible differences between net and gross calorific values.
The derivation of net calorific values for solid fuels is further complicated because
they often contain water trapped within the fuel in addition to the water which will be formed
from the hydrogen they contain. The reduction in net calorific value as a result of the

141
additional water is uncertain because the dampness of the fuel may vary according to weather
and storage conditions.
In summary, the net calorific value of a fuel is the total heat produced by burning it,
minus the heat needed to evaporate the water present in the fuel or produced during its
combustion. Major users of solid fuels, such as power stations, should be able to provide net
calorific values based on the monitoring of the electricity generation.
142
APPENDIX A7
MATRIX DECISION
1. Making Difficult Decisions: The Weighted Criteria Decision Matrix
As business professionals, we are constantly being asked to make decisions. How
much staffing will be required to meet our needs next year? What is the best investment for
improving capacity? What new products or services should we be developing to best serve
our customers? Some of these decisions are considered “no brainers” and can be quickly
made. Others, however, are more complex and need careful review before a final decision
can be made. One tool that can be used to help in the decision-making process is called the
Weighted Criteria Decision Matrix (or Decision Matrix for short).
2. How it works
Suppose you and your spouse have decided to go on a vacation. You have narrowed
your options down to four destinations – Hawaii, Las Vegas, Niagara Falls, and a Caribbean
Cruise. You both agree that all of your options are good. So how do you select the best one?
Using the Decision Matrix, you would:
1. List each of the options/alternatives to consider along the columns of your matrix.
2. Brainstorm and identify the top criteria for your evaluation and list them along the rows of
your matrix. What are the important factors to consider when making the decision?
3. Assign a “Criteria Weight” to each criterion that you have listed. The most important
criteria would get the higher “weighting” as jointly determined, in this case, by you and your
wife.
4. For each alternative, assign a “score” based upon how well it satisfies the criteria (high
score = highly satisfies criteria).
5. Multiply each score by its criteria weight and total the values for each alternative. This
would be your “Weighted Score.”
6. The option with the highest weighted score would be considered the “best” alternative
based upon your criteria weighting and scores. In our example, the Caribbean Cruise would
be the best option.
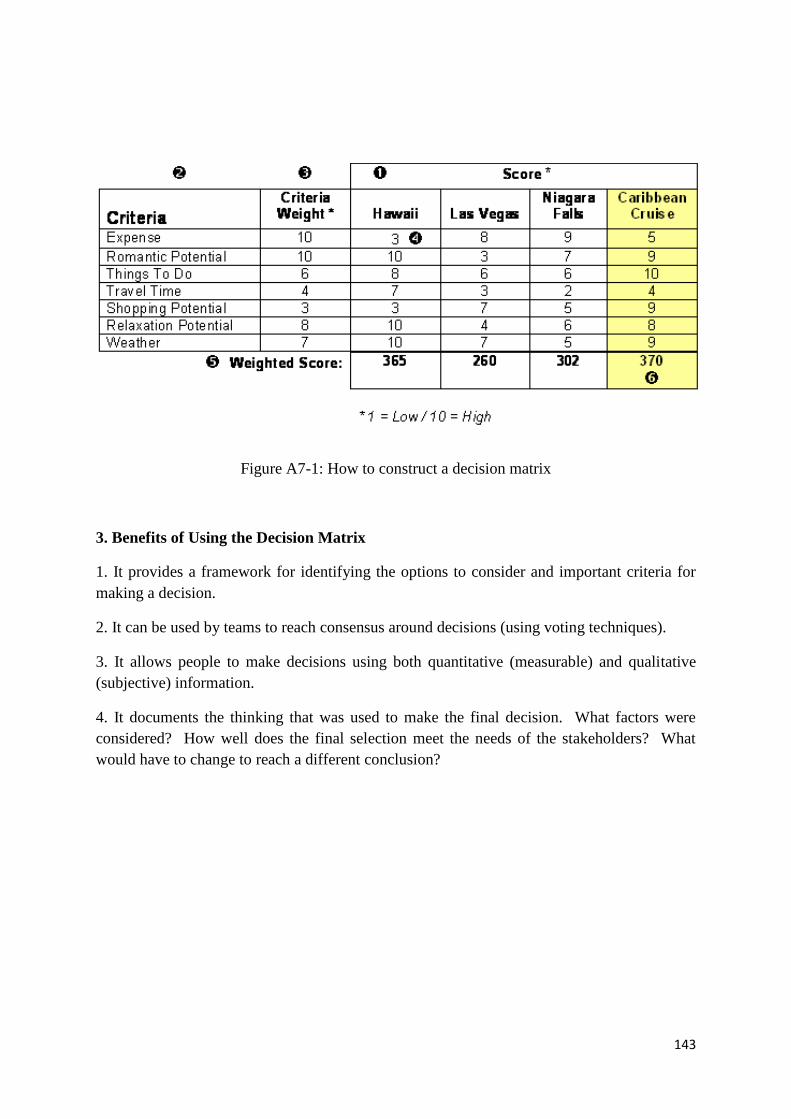
143
Figure A7-1: How to construct a decision matrix
3. Benefits of Using the Decision Matrix
1. It provides a framework for identifying the options to consider and important criteria for
making a decision.
2. It can be used by teams to reach consensus around decisions (using voting techniques).
3. It allows people to make decisions using both quantitative (measurable) and qualitative
(subjective) information.
4. It documents the thinking that was used to make the final decision. What factors were
considered? How well does the final selection meet the needs of the stakeholders? What
would have to change to reach a different conclusion?
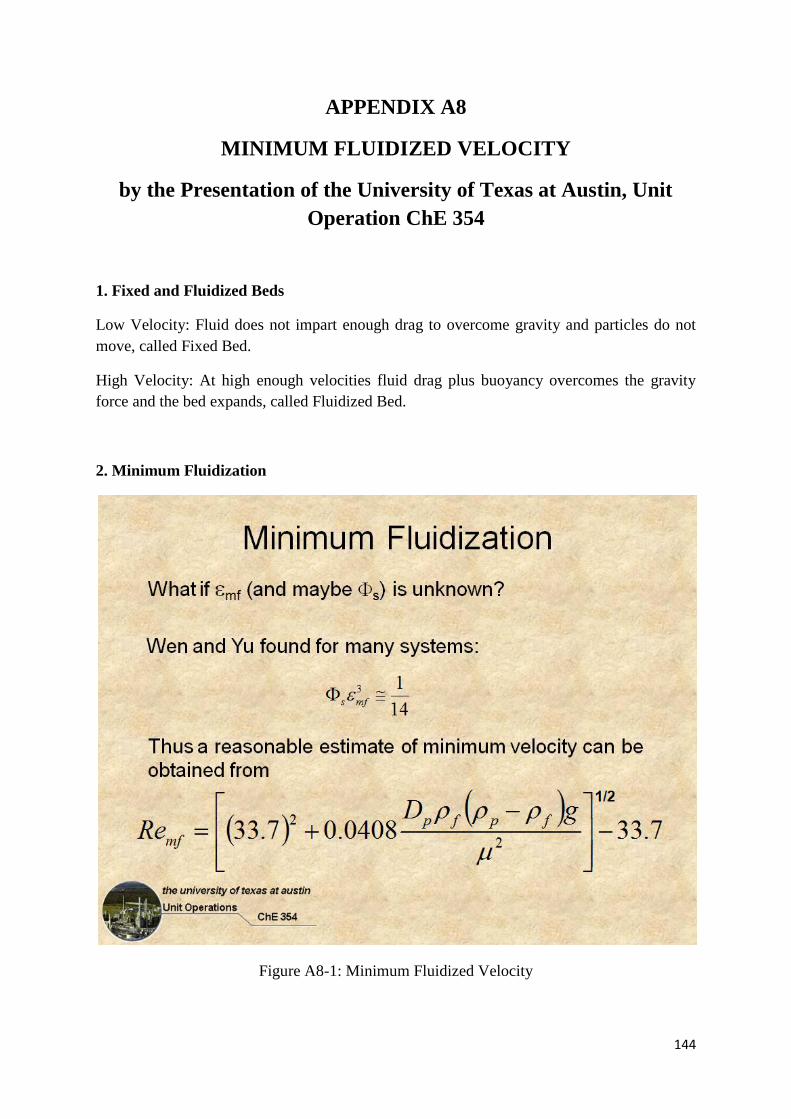
144
APPENDIX A8
MINIMUM FLUIDIZED VELOCITY
by the Presentation of the University of Texas at Austin, Unit
Operation ChE 354
1. Fixed and Fluidized Beds
Low Velocity: Fluid does not impart enough drag to overcome gravity and particles do not
move, called Fixed Bed.
High Velocity: At high enough velocities fluid drag plus buoyancy overcomes the gravity
force and the bed expands, called Fluidized Bed.
2. Minimum Fluidization
Figure A8-1: Minimum Fluidized Velocity
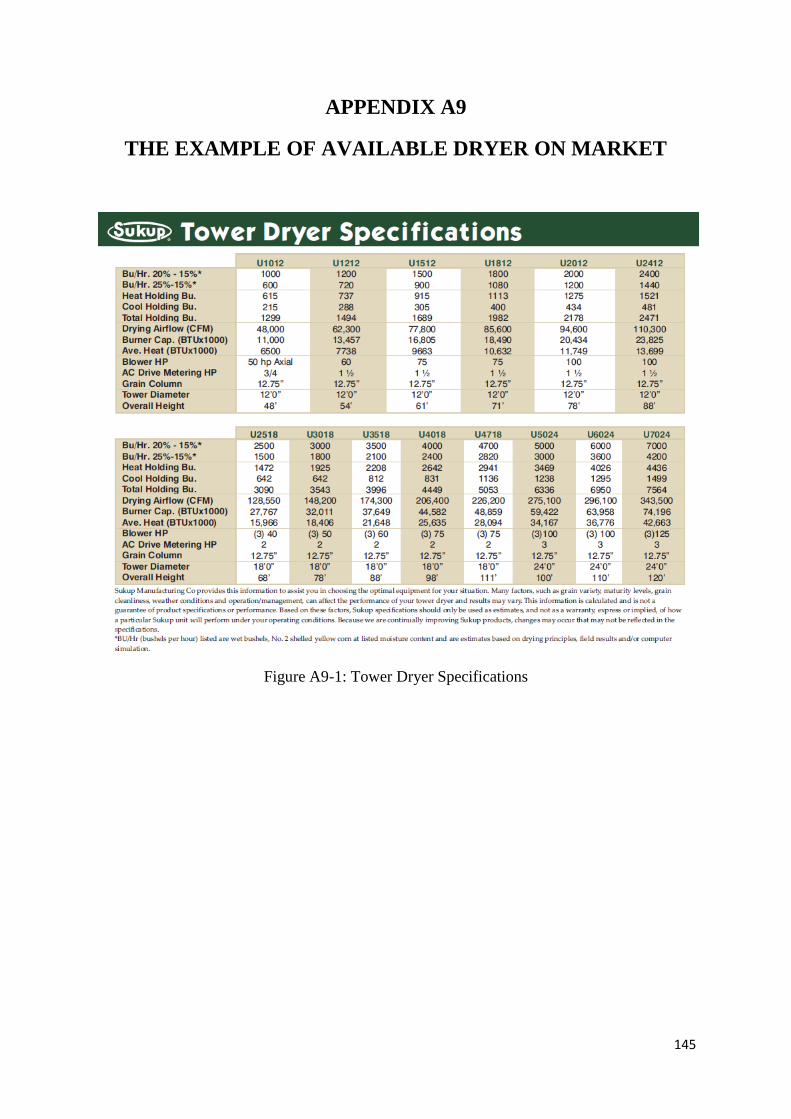
145
APPENDIX A9
THE EXAMPLE OF AVAILABLE DRYER ON MARKET
Figure A9-1: Tower Dryer Specifications
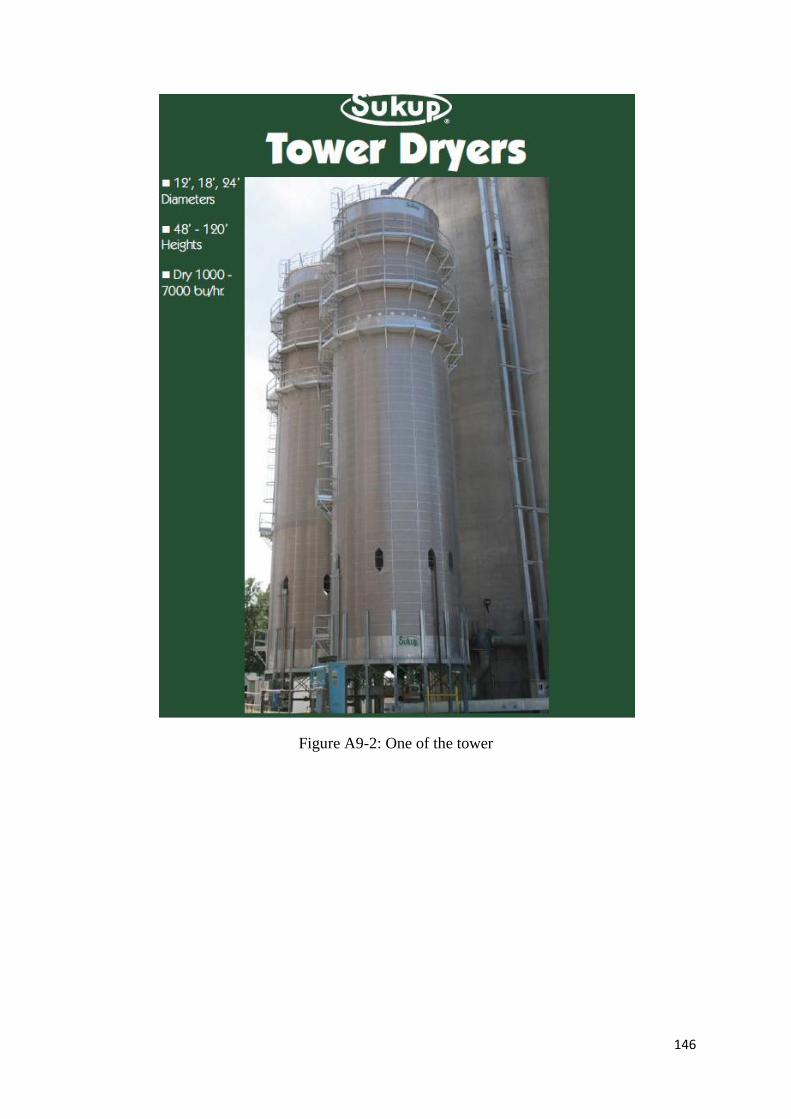
146
Figure A9-2: One of the tower