munich personal repec archive - uni-muenchen.de · ever since the launch, mbnqa has received...
TRANSCRIPT
MPRAMunich Personal RePEc Archive
MBNQA criteria in education: Assigningweights from a Malaysian perspectiveand proposition of an alternativeevaluation scheme
Rafikul Islam
International Islamic University Malaysia (IIUM)
2005
Online at http://mpra.ub.uni-muenchen.de/10810/MPRA Paper No. 10810, posted 29. September 2008 03:19 UTC
MBNQA criteria in education: assigning weights from aMalaysian perspective and proposition for an alternative
evaluation scheme
Rafikul Islam
Department of Business Administration, Kulliyyah of Economics and Management Sciences, International Islamic
University Malaysia, Jalan Gombak, 53100 Kuala Lumpur, Malaysia
E-mail: [email protected]
Received 29 June 2005; received in revised form 25 November 2005; accepted 11 January 2006
Abstract
In order to improve quality and productivity among American companies, the Malcolm Baldrige NationalQuality Award (MBNQA) was launched by the National Institute of Standards and Technology (NIST) underthe US Department of Commerce in 1987. Over the years, the award has proved to be effective in improvingcompanies’ market share, customer satisfaction, employee morale, and also profitability. MBNQA has been a‘role model’ in developing a national quality award for many other countries in the world. Furthermore, fororganizational self-assessment, the criteria framework of MBNQA has been in use throughout the world.Presently, the award is offered in three categories: Business, Education, and Health care. The present paper isconcerned with MBNQA in Education. NIST has developed a comprehensive set of criteria to be fulfilled inorder to be eligible to win the award. However, in the existing literature, it is not clear how the weights areassigned to the criteria and subcriteria. The present paper uses the analytic hierarchy process (AHP) to reassigncriteria weights from a Malaysian perspective. Furthermore, the paper points out the fallacy of the presentevaluation scheme and proposes an alternative one based upon the absolute measurement procedure of AHP.Themodified scheme is expected to enhance the fairness of the evaluation of the award aspirants. The paper alsoshares the experiences gathered in data collection using AHP.
Keywords: Malcolm Baldrige National Quality Award; total quality management; analytic hierarchy process;
evaluation
1. Introduction
The Malcolm Baldrige National Quality Award (MBNQA) was launched by the US Departmentof Commerce to enhance competitiveness among American companies. The objectives oflaunching the award are as follows: (1) to recognize the companies who are doing an excellent job
Intl. Trans. in Op. Res. 14 (2007) 373–394
INTERNATIONAL TRANSACTIONS
IN OPERATIONALRESEARCH
r 2007 The Authors.Journal compilation r 2007 International Federation of Operational Research SocietiesPublished by Blackwell Publishing, 9600 Garsington Road, Oxford, OX4 2DQ, UK and 350 Main St, Malden, MA 02148, USA.
in quality management, (2) to increase awareness of quality as an important element incompetitiveness, (3) to share information on successful quality strategies and on the benefitsderived from implementation of these strategies, and (4) to promote understanding of therequirements for quality excellence. The National Institute of Standard and Technology (NIST), anagency of the US Department of Commerce, manages the program and the American Society forQuality (ASQ) assists NIST. The board of examiners consists of noted quality experts who areselected from across the United States. For 2005, the board has about 540 members of which 10serve as Judges and approximately 110 serve as Senior Examiners and the remainder serve asExaminers. During the period 1988–1998, MBNQA was awarded to only three types of businesscompanies, namely Manufacturing, Service, and Small Business. In 1999, the Health Care andEducation sectors were added to the categories of award. Up to three awards may be given annuallyin each of the five areas. However, if the performance is not up to the desired level, it may be thecase that no award is given to any one or multiple areas (Babicz, 2002).The present paper pertains toMBNQA in the Education sector. Two major components of MBNQA in all the three categoriesare the criteria framework and the selection procedure. We address both components in this paper.The criteria set for Education (henceforth referred to as criteria) are built upon a set of core valuesand concepts: visionary leadership, learning-centered education, organizational and personallearning, valuing faculty, staff, and partners, agility, focus on the future, managing for innovation,management by facts, social responsibility, focus on results and creating value, and systemsperspective (Baldrige National Quality Program, 2005a). The core values and concepts areembodied in seven categories of criteria: leadership, strategic planning, student, stakeholder andmarket focus, measurement, analysis and knowledge management, faculty and staff focus, processmanagement, and organizational performance results. Each of these categories is subdivided into anumber of items. At present, altogether, there are 19 items, each focusing on a major requirement.Items consist of one or more areas to address. Organizations applying for the Baldrige award arerequired to address their responses to the specific requirements in those areas. For completeness, abrief description of the criteria is provided in the next section.
2. MBNQA criteria in Education
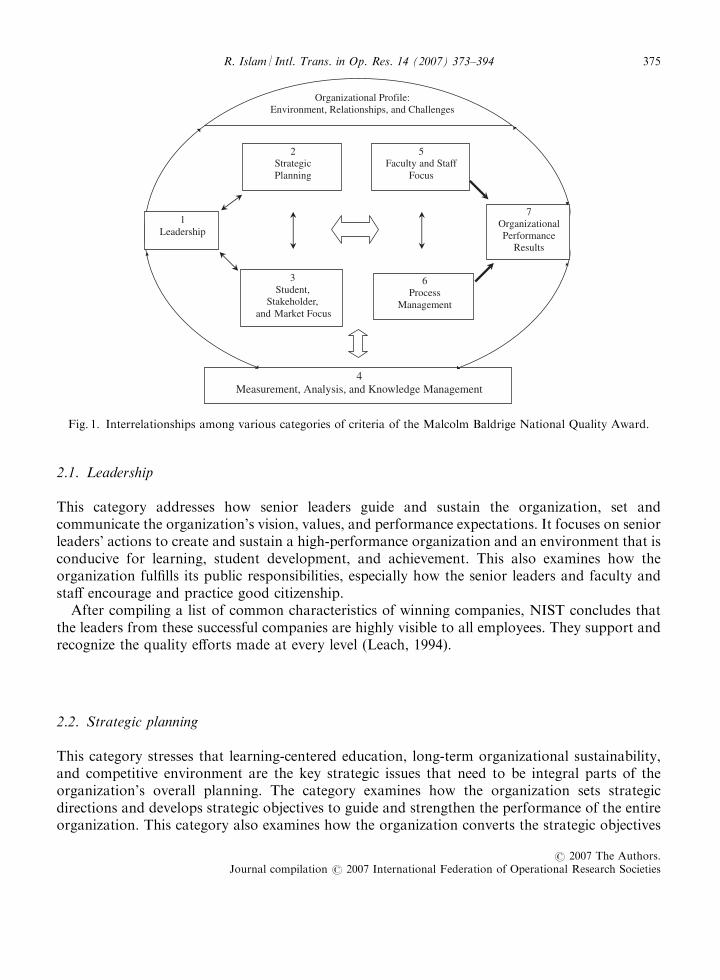
The Baldrige criteria provide a system perspective (shown in Fig. 1) to manage organizationsleading to performance excellence. The system perspective includes leaders’ focus on strategicdirections and students and other various stakeholders. Furthermore, senior leaders monitor,respond to, and manage performance based on organizational performance results. Systemperspective also includes various linkages among key processes and aligning the resources toimprove overall performance and satisfy students and stakeholders’ needs. MBNQA criteria arerevised periodically. The initial set of criteria in 1988 had 62 items with 278 areas to address. By1991 the criteria set had only 32 items and 99 areas to address. The 1995 criteria were revised to 24items and 54 areas to address. The revision carried out in 1997 has produced a reasonable stabilityto the criteria set by having 20 items with 30 areas to address that are necessary to compete intoday’s marketplace, improve the linkage between process and results. In 2005, the criteria set has19 items with 32 areas to address. In the following, we discuss the seven major categories ofcriteria adopted in 2005.
R. Islam / Intl. Trans. in Op. Res. 14 (2007) 373–394374
r 2007 The Authors.Journal compilation r 2007 International Federation of Operational Research Societies
2.1. Leadership
This category addresses how senior leaders guide and sustain the organization, set andcommunicate the organization’s vision, values, and performance expectations. It focuses on seniorleaders’ actions to create and sustain a high-performance organization and an environment that isconducive for learning, student development, and achievement. This also examines how theorganization fulfills its public responsibilities, especially how the senior leaders and faculty andstaff encourage and practice good citizenship.After compiling a list of common characteristics of winning companies, NIST concludes that
the leaders from these successful companies are highly visible to all employees. They support andrecognize the quality efforts made at every level (Leach, 1994).
2.2. Strategic planning
This category stresses that learning-centered education, long-term organizational sustainability,and competitive environment are the key strategic issues that need to be integral parts of theorganization’s overall planning. The category examines how the organization sets strategicdirections and develops strategic objectives to guide and strengthen the performance of the entireorganization. This category also examines how the organization converts the strategic objectives
Organizational Profile:Environment, Relationships, and Challenges
1Leadership
7OrganizationalPerformance
Results
2StrategicPlanning
5Faculty and Staff
Focus
3Student,
Stakeholder, and Market Focus
6Process
Management
4Measurement, Analysis, and Knowledge Management
Fig. 1. Interrelationships among various categories of criteria of the Malcolm Baldrige National Quality Award.
R. Islam / Intl. Trans. in Op. Res. 14 (2007) 373–394 375
r 2007 The Authors.Journal compilation r 2007 International Federation of Operational Research Societies
into action plans and how the organization deploys the whole set of strategic objectives and actionplans to all levels of the organization.
2.3. Student, stakeholder, and market focus
This category addresses how the organization determines the requirements, expectations, andpreferences of the students and stakeholders with the focus on meeting their needs, delightingstudents and stakeholders, and building loyalty. This category stresses relationships as animportant part of an overall listening, learning, and performance excellence strategy. Therefore,the category examines how the organization builds relationships with students and stakeholdersand determines the key factors that attract students and lead to student and stakeholdersatisfaction.
2.4. Measurement, analysis, and knowledge management
The aim of measurement and analysis is to guide the organization’s process management towardthe achievement of key organizational performance results and strategic objectives. The categoryexamines how the organization selects, gathers, analyzes, manages, and improves its data,information, and knowledge assets. This category also addresses knowledge management and allbasic performance-related information and comparative information, as well as how suchinformation is analyzed and used to optimize organizational performance.
2.5. Faculty and staff focus
This addresses key human resource practices – those directed toward creating and maintaining ahigh-performance workplace with a strong focus on students’ learning through faculty andstaff’s well-being and their satisfaction. In particular, the category examines the organization’scompensation package, career progression, faculty and staff performance management, recognition,faculty and staff’s continuing education and training. The category also examines the organization’sworking environment, faculty and staff support climate, and how the organization determinesfaculty and staff satisfaction, with the aim of fostering the well-being, satisfaction, and motivationof all faculty and staff while recognizing their diverse needs.
2.6. Process management
This category examines the organization’s learning-centered processes for educational programsand offerings and students’ services, with the aim of creating value for students and other keystakeholders. This category also examines the organization’s support processes and operationalplanning with respect to financial management and planning for the continuity of operations, withthe aim of improving overall operational performance.
R. Islam / Intl. Trans. in Op. Res. 14 (2007) 373–394376
r 2007 The Authors.Journal compilation r 2007 International Federation of Operational Research Societies
2.7. Organizational performance results
This category examines the organization’s actual performance in key areas: students’ learning,student and stakeholder satisfaction, overall budgetary, financial, and market performance,faculty and staff performance, leadership, and social responsibility results. In other words, thiscategory seeks real-time information on the organization’s performance in the above areas.However, the MBNQA does not prescribe any specific quality tools, techniques, technology, orsystems to achieve the results in the above areas. It is the organizations which need to identify/develop the required tools and techniques.
Despite the lack of any work on determining weights for the above categories of criteria, asubstantial amount of the work has already been done on various other aspects of the MBNQA.We provide a brief account of some of the previous work in the next section.
3. Literature review
Ever since the launch, MBNQA has received considerable support from many sectors and theprogram started on a positive note. This has been encapsulated by Garvin’s (1991, p. 80) comment:
In just 4 years, Malcolm Baldrige National Quality Award has become the most important catalyst fortransforming American business. More than any other initiative, public or private, it has reshapedmanagers’ ‘thinking and behavior’. The Baldrige Award not only codifies the principles of qualitymanagement in clear and accessible language, it also goes further: it provides companies with acomprehensive framework for assessing their progress toward the new paradigm of management andsuch commonly acknowledged goals as customer satisfaction and increased employee involvement.
Numerous organizations across the world have been applying the MBNQA criteria framework asa self-assessment tool (Steeples, 1993). According to the MBNQA official website (www.bal-drige.nist.gov), approximately 2 million copies of the criteria booklet have been distributed all overthe world since the publication of the first edition in 1988. Using the 1997 Baldrige criteriaframework, Brown (1997) developed an instrument for use as a self-assessment tool. Thisinstrument was designed to give the organization a rough idea of where the organization stands inthe pursuit of excellence. BNQP (2005b, p. 17) states:
Using the Baldrige Criteria for self-assessment and action planning makes you a winner even if younever apply for the Award. You win because you learn. You learn about what you do well and whatyou can do better. You win by using that learning to drive improvement and continuously achievehigher levels of performance.
Prybutok and Stafford (1997) have described a case study where MBNQA criteria were used forself-assessment at Baylor Health Care System (BHCS). The survey findings have helped BHCS todevelop a few action plans to achieve its long-term objectives. One such action was to develop a$50 million information system to manage the organization.
R. Islam / Intl. Trans. in Op. Res. 14 (2007) 373–394 377
r 2007 The Authors.Journal compilation r 2007 International Federation of Operational Research Societies
For many companies, the major objective behind applying for MBNQA is to obtain feedbackfrom the examiners. The feedback, which is frequently 30 or more pages long, is very helpful tothe companies for further improvement. Kay Kendall, vice president of Corporate Qualityat Brooks-PRI Automation Inc. (Chelmsford, MA) and judge of MBNQA, says (Babicz, 2002,p. 38):
I really do encourage companies that are looking for that independent, holistic evaluation to considerapplying. I just don’t think that there’s any other way of getting that kind of independent, in-depthassessment like the process. The caliber of the folks that you get at the national level as examiners andthe business experience that they have is so strong that it’s amazing how insightful that feedback is.
Mr Peterson, the former CEO of Ford Motor Company, a Baldrige Award applicant in 1989, saysthat, ‘Participating in the Baldrige process was good for Ford, because the evaluation processoffered opportunities for improvement, despite the fact that Ford did not win the prize’(Ghobadian and Woo, 1996, p. 43)About 40 national-level quality programs worldwide have root in MBNQA. Perhaps it will be
no exaggeration to say that the above fact alone suggests that the MBNQA criteria frameworkcomprehensively captures the major dimensions of total quality management (TQM). In fact,Curkovic et al. (2000) have empirically investigated the correspondence between MBNQA criteriaand TQM dimensions and the authors conclude that the MBNQA criteria framework doescapture the core concepts of TQM.In order to investigate whether quality management systems are related to organization results
and customer satisfaction in hospitals, Goldstein and Schweikhart (2002) have examined therelationship among constructs in the Baldrige award for a health care organization. Theyconclude that by focusing on the content of the award criteria, hospitals can improve their overallperformance. In a related study, Handfield and Ghosh (1995) find that leadership influences eachof the first six criteria while process management and strategic planning significantly influencecustomer satisfaction.Economic growth of a country or a state is a function of physical capital, human capital, natural
resources, and state of technology. Economic development also depends on educationalinfrastructure, competitive business environment, and the degree of governmental support. It isexpected that state-supported programs including quality awards will contribute positively to thestate’s economy. In this context, Fisher et al. (2001) empirically investigated the relationship betweenquality awards and economic development and they found a positive correlation between the two.After the launch of MBNQA in the United States and having seen its impressive success, many
other nations have started launching national quality awards. Puay et al. (1998) have compared ninesuch awards (three European, two North American, three Asia-Pacific, and one South American)on nine major criteria: leadership, impact on society, resource management, strategy and policy,human resource management, process quality, results, customer management and satisfaction,supplier/partner management and performance. Along the same lines, Ghobadian and Woo (1996)have discussed the characteristics, benefits, and shortcomings of four major quality awards: DemingPrize, MBNQA, European Quality Award, and Australian Quality Award.Reimann and Herz (1996) have compared the MBNQA and the ISO 9000 quality management
system. The authors are of the opinion that they differ fundamentally in focus, purpose, and
R. Islam / Intl. Trans. in Op. Res. 14 (2007) 373–394378
r 2007 The Authors.Journal compilation r 2007 International Federation of Operational Research Societies
content. According to them, the focus of MBNQA is to enhance competitiveness, whereas thefocus of ISO 9000 registration is conformity to practices specified in the registrant’s own qualitysystem. Most of the ISO 9000 requirements fall under the process management category ofMBNQA. Overall, ISO 9000 registration requirements cover less than 10% of the Baldrige Awardcriteria (BNQP, 2005a).Wilson and Collier (2000) used a survey instrument consisting of 101 questions to test the
theory and causal performance linkages implied by the MBNQA. They concluded the following:(1) MBNQA theory supports that leadership drives the systems that produce results; (2)leadership is the most important driver of system performance; (3) leadership has no direct effecton financial results but influences overall performance; (4) information and analysis is statisticallythe second-most important category in MBNQA criteria; (5) process management is twice asimportant when predicting customer satisfaction than when predicting financial results. Prybutoket al. (2001) have investigated the relationships between leadership and other MBNQA criteriapaying special attention to the information and analysis component.Seymour (1996), in his two-volume book, detailed why and howUS schools can use theMBNQA
criteria framework to improve the overall quality of education. Johnson (1996) investigated theanswer to the following questions on the application of Baldrige and State quality awards in theeducation sector: what is the purpose of those awards?What criteria are used to judge the applicants?What has been the impact to date on the educational community?Despite all the above positive notes, criticisms of the MBNQA are also not rare. Collier (1992)
has responded to several criticisms: MBNQA emphasizes process more than results orachievements, high cost of application, ‘product mentality examiners don’t know how to evaluateservice firms’, etc. The author concludes by saying (p. 94):
The Malcolm Baldrige National Quality Award has raised the consciousness of the United States aboutquality performance. It helps explain the vital role quality performance plays in creating the world’sstandard of living and quality of life. Despite its critics, the MBNQA was established to achieve long-term national goals, and it is indeed achieving those goals.
Regarding the assignment of points to the criteria, Prybutok and Stafford (1997, p. 45) mention:
A point allocation scheme emphasizes various categories and sub categories according to their relativecontribution to the overall quality level of an organization’s current quality practices and award pointsthat reflect the organization’s quality strengths and weaknesses in each of the seven categories.
Apart from the above reference, in the wide range of literature on MBNQA, we did not find anyother work (even passing mention) regarding how the MBNQA criteria and subcriteria points areallocated. It seems that nobody has questioned the legitimacy of the allocated points. Details arealso not available regarding the point allocation of other national quality awards. To the best ofthe author’s knowledge, this is the first attempt to determine MBNQA criteria weights using someanalytical technique on the basis of public opinion.
R. Islam / Intl. Trans. in Op. Res. 14 (2007) 373–394 379
r 2007 The Authors.Journal compilation r 2007 International Federation of Operational Research Societies
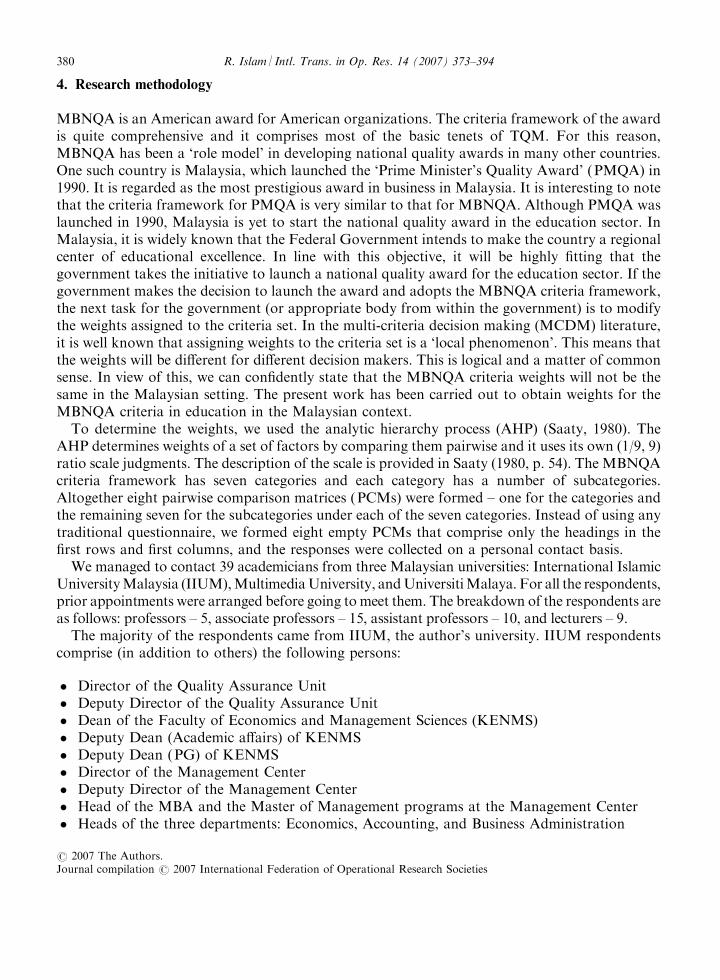
4. Research methodology
MBNQA is an American award for American organizations. The criteria framework of the awardis quite comprehensive and it comprises most of the basic tenets of TQM. For this reason,MBNQA has been a ‘role model’ in developing national quality awards in many other countries.One such country is Malaysia, which launched the ‘Prime Minister’s Quality Award’ (PMQA) in1990. It is regarded as the most prestigious award in business in Malaysia. It is interesting to notethat the criteria framework for PMQA is very similar to that for MBNQA. Although PMQA waslaunched in 1990, Malaysia is yet to start the national quality award in the education sector. InMalaysia, it is widely known that the Federal Government intends to make the country a regionalcenter of educational excellence. In line with this objective, it will be highly fitting that thegovernment takes the initiative to launch a national quality award for the education sector. If thegovernment makes the decision to launch the award and adopts the MBNQA criteria framework,the next task for the government (or appropriate body from within the government) is to modifythe weights assigned to the criteria set. In the multi-criteria decision making (MCDM) literature,it is well known that assigning weights to the criteria set is a ‘local phenomenon’. This means thatthe weights will be different for different decision makers. This is logical and a matter of commonsense. In view of this, we can confidently state that the MBNQA criteria weights will not be thesame in the Malaysian setting. The present work has been carried out to obtain weights for theMBNQA criteria in education in the Malaysian context.To determine the weights, we used the analytic hierarchy process (AHP) (Saaty, 1980). The
AHP determines weights of a set of factors by comparing them pairwise and it uses its own (1/9, 9)ratio scale judgments. The description of the scale is provided in Saaty (1980, p. 54). The MBNQAcriteria framework has seven categories and each category has a number of subcategories.Altogether eight pairwise comparison matrices (PCMs) were formed – one for the categories andthe remaining seven for the subcategories under each of the seven categories. Instead of using anytraditional questionnaire, we formed eight empty PCMs that comprise only the headings in thefirst rows and first columns, and the responses were collected on a personal contact basis.We managed to contact 39 academicians from three Malaysian universities: International Islamic
UniversityMalaysia (IIUM),MultimediaUniversity, andUniversitiMalaya. For all the respondents,prior appointments were arranged before going to meet them. The breakdown of the respondents areas follows: professors – 5, associate professors – 15, assistant professors – 10, and lecturers – 9.The majority of the respondents came from IIUM, the author’s university. IIUM respondents
comprise (in addition to others) the following persons:
� Director of the Quality Assurance Unit� Deputy Director of the Quality Assurance Unit� Dean of the Faculty of Economics and Management Sciences (KENMS)� Deputy Dean (Academic affairs) of KENMS� Deputy Dean (PG) of KENMS� Director of the Management Center� Deputy Director of the Management Center� Head of the MBA and the Master of Management programs at the Management Center� Heads of the three departments: Economics, Accounting, and Business Administration
R. Islam / Intl. Trans. in Op. Res. 14 (2007) 373–394380
r 2007 The Authors.Journal compilation r 2007 International Federation of Operational Research Societies
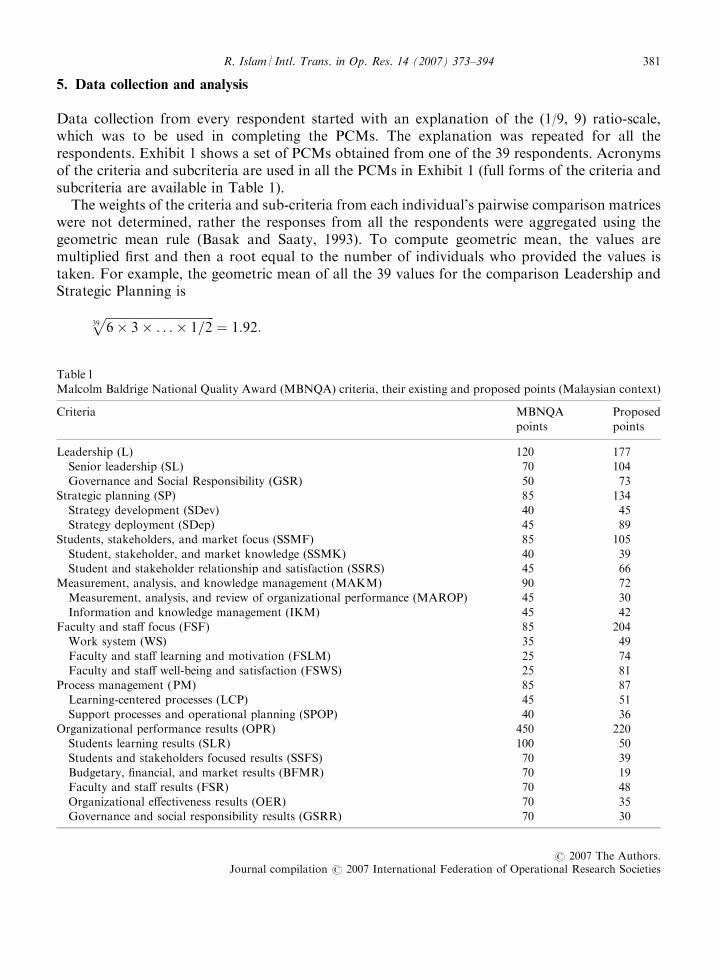
5. Data collection and analysis
Data collection from every respondent started with an explanation of the (1/9, 9) ratio-scale,which was to be used in completing the PCMs. The explanation was repeated for all therespondents. Exhibit 1 shows a set of PCMs obtained from one of the 39 respondents. Acronymsof the criteria and subcriteria are used in all the PCMs in Exhibit 1 (full forms of the criteria andsubcriteria are available in Table 1).The weights of the criteria and sub-criteria from each individual’s pairwise comparison matrices
were not determined, rather the responses from all the respondents were aggregated using thegeometric mean rule (Basak and Saaty, 1993). To compute geometric mean, the values aremultiplied first and then a root equal to the number of individuals who provided the values istaken. For example, the geometric mean of all the 39 values for the comparison Leadership andStrategic Planning is
ffiffiffiffiffiffiffiffiffiffiffiffiffiffiffiffiffiffiffiffiffiffiffiffiffiffiffiffiffiffiffiffiffiffiffiffi6� 3� . . .� 1=239
p¼ 1:92:
Table 1
Malcolm Baldrige National Quality Award (MBNQA) criteria, their existing and proposed points (Malaysian context)
Criteria MBNQA
points
Proposed
points
Leadership (L) 120 177
Senior leadership (SL) 70 104
Governance and Social Responsibility (GSR) 50 73
Strategic planning (SP) 85 134
Strategy development (SDev) 40 45
Strategy deployment (SDep) 45 89
Students, stakeholders, and market focus (SSMF) 85 105
Student, stakeholder, and market knowledge (SSMK) 40 39
Student and stakeholder relationship and satisfaction (SSRS) 45 66
Measurement, analysis, and knowledge management (MAKM) 90 72
Measurement, analysis, and review of organizational performance (MAROP) 45 30
Information and knowledge management (IKM) 45 42
Faculty and staff focus (FSF) 85 204
Work system (WS) 35 49
Faculty and staff learning and motivation (FSLM) 25 74
Faculty and staff well-being and satisfaction (FSWS) 25 81
Process management (PM) 85 87
Learning-centered processes (LCP) 45 51
Support processes and operational planning (SPOP) 40 36
Organizational performance results (OPR) 450 220
Students learning results (SLR) 100 50
Students and stakeholders focused results (SSFS) 70 39
Budgetary, financial, and market results (BFMR) 70 19
Faculty and staff results (FSR) 70 48
Organizational effectiveness results (OER) 70 35
Governance and social responsibility results (GSRR) 70 30
R. Islam / Intl. Trans. in Op. Res. 14 (2007) 373–394 381
r 2007 The Authors.Journal compilation r 2007 International Federation of Operational Research Societies
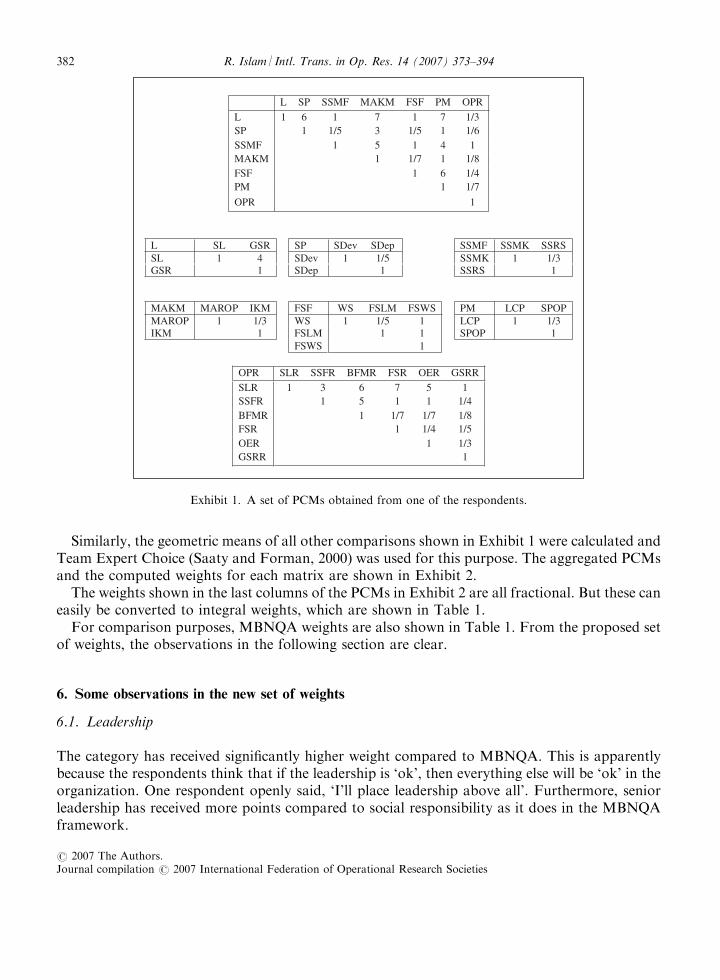
Similarly, the geometric means of all other comparisons shown in Exhibit 1 were calculated andTeam Expert Choice (Saaty and Forman, 2000) was used for this purpose. The aggregated PCMsand the computed weights for each matrix are shown in Exhibit 2.The weights shown in the last columns of the PCMs in Exhibit 2 are all fractional. But these can
easily be converted to integral weights, which are shown in Table 1.For comparison purposes, MBNQA weights are also shown in Table 1. From the proposed set
of weights, the observations in the following section are clear.
6. Some observations in the new set of weights
6.1. Leadership
The category has received significantly higher weight compared to MBNQA. This is apparentlybecause the respondents think that if the leadership is ‘ok’, then everything else will be ‘ok’ in theorganization. One respondent openly said, ‘I’ll place leadership above all’. Furthermore, seniorleadership has received more points compared to social responsibility as it does in the MBNQAframework.
L SP SSMF MAKM FSF PM OPR
L 1 6 1 7 1 7 1/3 SP 1 1/5 3 1/5 1 1/6 SSMF 1 5 1 4 1 MAKM 1 1/7 1 1/8 FSF 1 6 1/4 PM 1 1/7
OPR 1
L SL GSR SP SDev SDep SSMF SSMK SSRS SL 1 4 SDev 1 1/5 SSMK 1 1/3 GSR 1 SDep 1 SSRS 1
MAKM MAROP IKM FSF WS FSLM FSWS PM LCP SPOP MAROP 1 1/3 WS 1 1/5 1 LCP 1 1/3 IKM 1 FSLM 1 1 SPOP 1
FSWS 1
OPR SLR SSFR BFMR FSR OER GSRR
SLR 1 3 6 7 5 1 SSFR 1 5 1 1 1/4 BFMR 1 1/7 1/7 1/8 FSR 1 1/4 1/5 OER 1 1/3 GSRR 1
Exhibit 1. A set of PCMs obtained from one of the respondents.
R. Islam / Intl. Trans. in Op. Res. 14 (2007) 373–394382
r 2007 The Authors.Journal compilation r 2007 International Federation of Operational Research Societies
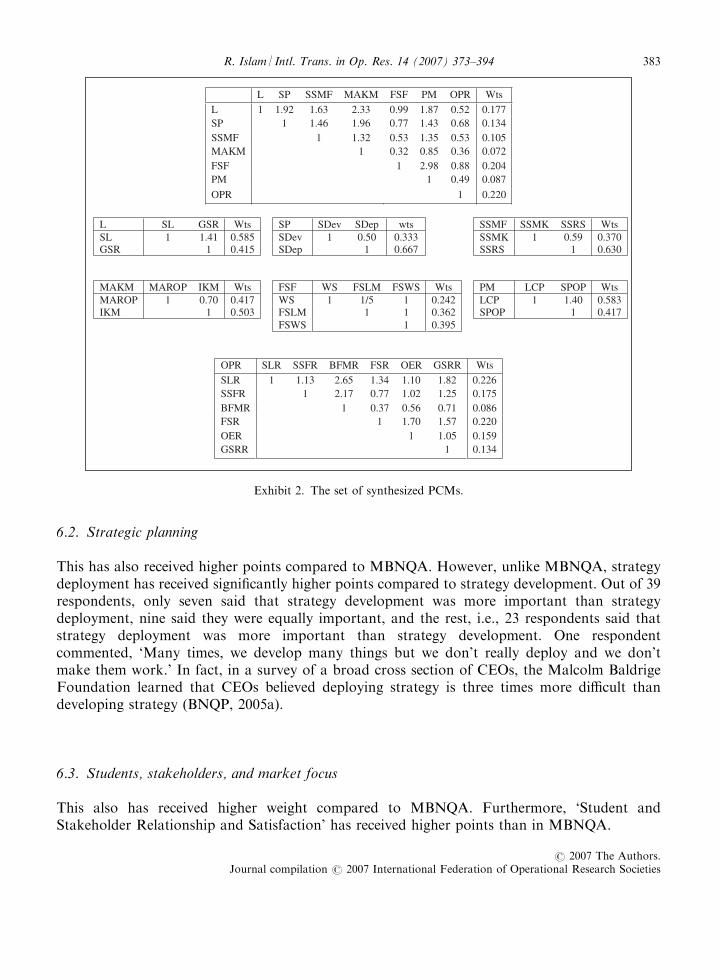
6.2. Strategic planning
This has also received higher points compared to MBNQA. However, unlike MBNQA, strategydeployment has received significantly higher points compared to strategy development. Out of 39respondents, only seven said that strategy development was more important than strategydeployment, nine said they were equally important, and the rest, i.e., 23 respondents said thatstrategy deployment was more important than strategy development. One respondentcommented, ‘Many times, we develop many things but we don’t really deploy and we don’tmake them work.’ In fact, in a survey of a broad cross section of CEOs, the Malcolm BaldrigeFoundation learned that CEOs believed deploying strategy is three times more difficult thandeveloping strategy (BNQP, 2005a).
6.3. Students, stakeholders, and market focus
This also has received higher weight compared to MBNQA. Furthermore, ‘Student andStakeholder Relationship and Satisfaction’ has received higher points than in MBNQA.
L SP SSMF MAKM FSF PM OPR Wts
L 1 1.92 1.63 2.33 0.99 1.87 0.52 0.177 SP 1 1.46 1.96 0.77 1.43 0.68 0.134 SSMF 1 1.32 0.53 1.35 0.53 0.105 MAKM 1 0.32 0.85 0.36 0.072 FSF 1 2.98 0.88 0.204 PM 1 0.49 0.087
OPR 1 0.220
L SL GSR Wts SP SDev SDep wts SSMF SSMK SSRS Wts SL 1 1.41 0.585 SDev 1 0.50 0.333 SSMK 1 0.59 0.370 GSR 1 0.415 SDep 1 0.667 SSRS 1 0.630
MAKM MAROP IKM Wts FSF WS FSLM FSWS Wts PM LCP SPOP Wts MAROP 1 0.70 0.417 WS 1 1/5 1 0.242 LCP 1 1.40 0.583 IKM 1 0.503 FSLM 1 1 0.362 SPOP 1 0.417
FSWS 1 0.395
OPR SLR SSFR BFMR FSR OER GSRR Wts
SLR 1 1.13 2.65 1.34 1.10 1.82 0.226 SSFR 1 2.17 0.77 1.02 1.25 0.175 BFMR 1 0.37 0.56 0.71 0.086 FSR 1 1.70 1.57 0.220 OER 1 1.05 0.159 GSRR 1 0.134
Exhibit 2. The set of synthesized PCMs.
R. Islam / Intl. Trans. in Op. Res. 14 (2007) 373–394 383
r 2007 The Authors.Journal compilation r 2007 International Federation of Operational Research Societies
6.4. Measurement, analysis, and knowledge management
This has received lesser weightage here compared to MBNQA. This is because the respondents haveassigned higher weights to all the previous three categories. Hence, as the total points are constant,some category is expected to receive lesser weight. However, it is to be noted that the differencebetween the two sets of points (proposed and MBNQA) is not significantly large.
6.5. Faculty and staff focus
This has received the highest amount of increase in terms of points. An organization’s successdepends upon the diverse backgrounds, knowledge, skills, creativity, and motivation of all itsfaculty and staff. Overall, the respondents strongly felt that if the staff’s well-being andsatisfaction were taken care of then it would be easier to achieve organizational performanceresults, especially student learning results.
6.6. Process management
This category along with its subcategories, namely, ‘learning centered processes’ and ‘supportprocesses and operational planning’, have received almost the same weight as in MBNQA.
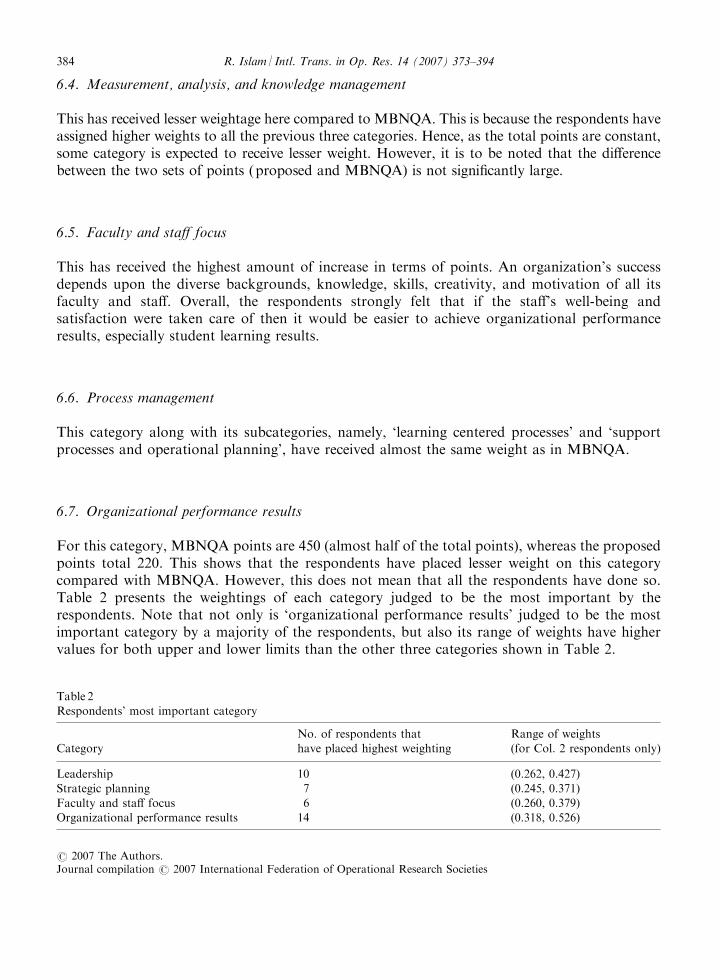
6.7. Organizational performance results
For this category, MBNQA points are 450 (almost half of the total points), whereas the proposedpoints total 220. This shows that the respondents have placed lesser weight on this categorycompared with MBNQA. However, this does not mean that all the respondents have done so.Table 2 presents the weightings of each category judged to be the most important by therespondents. Note that not only is ‘organizational performance results’ judged to be the mostimportant category by a majority of the respondents, but also its range of weights have highervalues for both upper and lower limits than the other three categories shown in Table 2.
Table 2
Respondents’ most important category
Category
No. of respondents that
have placed highest weighting
Range of weights
(for Col. 2 respondents only)
Leadership 10 (0.262, 0.427)
Strategic planning 7 (0.245, 0.371)
Faculty and staff focus 6 (0.260, 0.379)
Organizational performance results 14 (0.318, 0.526)
R. Islam / Intl. Trans. in Op. Res. 14 (2007) 373–394384
r 2007 The Authors.Journal compilation r 2007 International Federation of Operational Research Societies
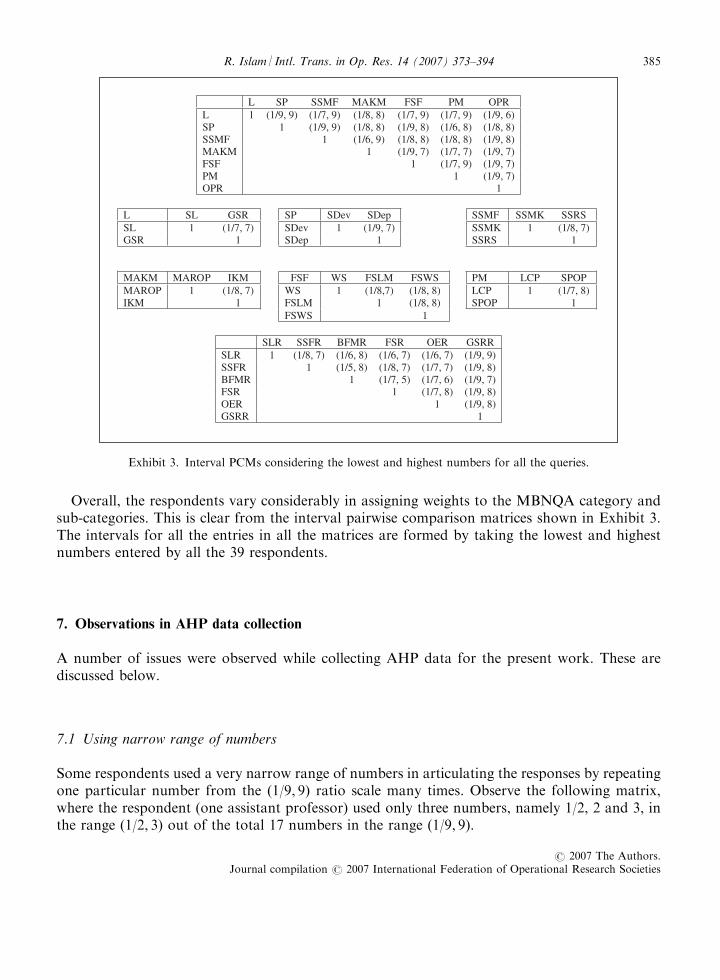
Overall, the respondents vary considerably in assigning weights to the MBNQA category andsub-categories. This is clear from the interval pairwise comparison matrices shown in Exhibit 3.The intervals for all the entries in all the matrices are formed by taking the lowest and highestnumbers entered by all the 39 respondents.
7. Observations in AHP data collection
A number of issues were observed while collecting AHP data for the present work. These arediscussed below.
7.1 Using narrow range of numbers
Some respondents used a very narrow range of numbers in articulating the responses by repeatingone particular number from the (1/9, 9) ratio scale many times. Observe the following matrix,where the respondent (one assistant professor) used only three numbers, namely 1/2, 2 and 3, inthe range (1/2, 3) out of the total 17 numbers in the range (1/9, 9).
L SP SSMF MAKM FSF PM OPR L 1 (1/9, 9) (1/7, 9) (1/8, 8) (1/7, 9) (1/7, 9) (1/9, 6)SP 1 (1/9, 9) (1/8, 8) (1/9, 8) (1/6, 8) (1/8, 8)SSMF 1 (1/6, 9) (1/8, 8) (1/8, 8) (1/9, 8)MAKM 1 (1/9, 7) (1/7, 7) (1/9, 7)FSF 1 (1/7, 9) (1/9, 7)PM 1 (1/9, 7)OPR 1
L SL GSR SP SDev SDep SSMF SSMK SSRS SL 1 (1/7, 7) SDev 1 (1/9, 7) SSMK 1 (1/8, 7)GSR 1 SDep 1 SSRS 1
MAKM MAROP IKM FSF WS FSLM FSWS PM LCP SPOP MAROP 1 (1/8, 7) WS 1 (1/8,7) (1/8, 8) LCP 1 (1/7, 8)IKM 1 FSLM 1 (1/8, 8) SPOP 1
FSWS 1
SLR SSFR BFMR FSR OER GSRR SLR 1 (1/8, 7) (1/6, 8) (1/6, 7) (1/6, 7) (1/9, 9)SSFR 1 (1/5, 8) (1/8, 7) (1/7, 7) (1/9, 8) BFMR 1 (1/7, 5) (1/7, 6) (1/9, 7)FSR 1 (1/7, 8) (1/9, 8)OER 1 (1/9, 8)GSRR 1
Exhibit 3. Interval PCMs considering the lowest and highest numbers for all the queries.
R. Islam / Intl. Trans. in Op. Res. 14 (2007) 373–394 385
r 2007 The Authors.Journal compilation r 2007 International Federation of Operational Research Societies
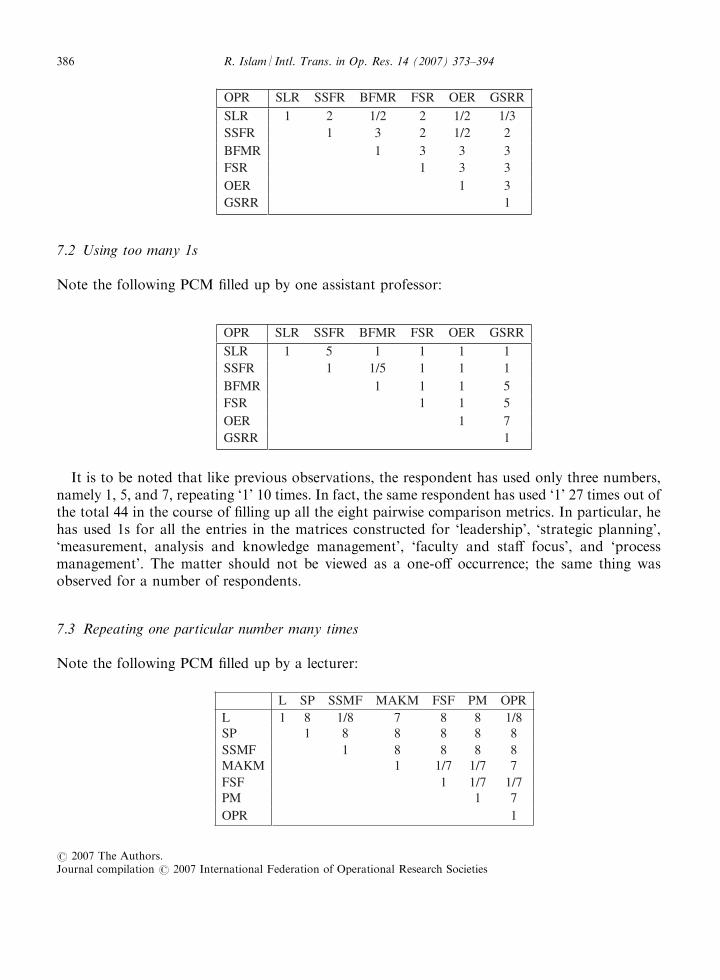
7.2 Using too many 1s
Note the following PCM filled up by one assistant professor:
It is to be noted that like previous observations, the respondent has used only three numbers,namely 1, 5, and 7, repeating ‘1’ 10 times. In fact, the same respondent has used ‘1’ 27 times out ofthe total 44 in the course of filling up all the eight pairwise comparison metrics. In particular, hehas used 1s for all the entries in the matrices constructed for ‘leadership’, ‘strategic planning’,‘measurement, analysis and knowledge management’, ‘faculty and staff focus’, and ‘processmanagement’. The matter should not be viewed as a one-off occurrence; the same thing wasobserved for a number of respondents.
7.3 Repeating one particular number many times
Note the following PCM filled up by a lecturer:
OPR SLR SSFR BFMR FSR OER GSRR
SLR 1 2 1/2 2 1/2 1/3SSFR 1 3 2 1/2 2BFMR 1 3 3 3FSR 1 3 3OER 1 3GSRR 1
OPR SLR SSFR BFMR FSR OER GSRR
SLR 1 5 1 1 1 1SSFR 1 1/5 1 1 1BFMR 1 1 1 5FSR 1 1 5OER 1 7GSRR 1
L SP SSMF MAKM FSF PM OPR L 1 8 1/8 7 8 8 1/8SP 1 8 8 8 8 8SSMF 1 8 8 8 8MAKM 1 1/7 1/7 7FSF 1 1/7 1/7PM 1 7OPR 1
R. Islam / Intl. Trans. in Op. Res. 14 (2007) 373–394386
r 2007 The Authors.Journal compilation r 2007 International Federation of Operational Research Societies
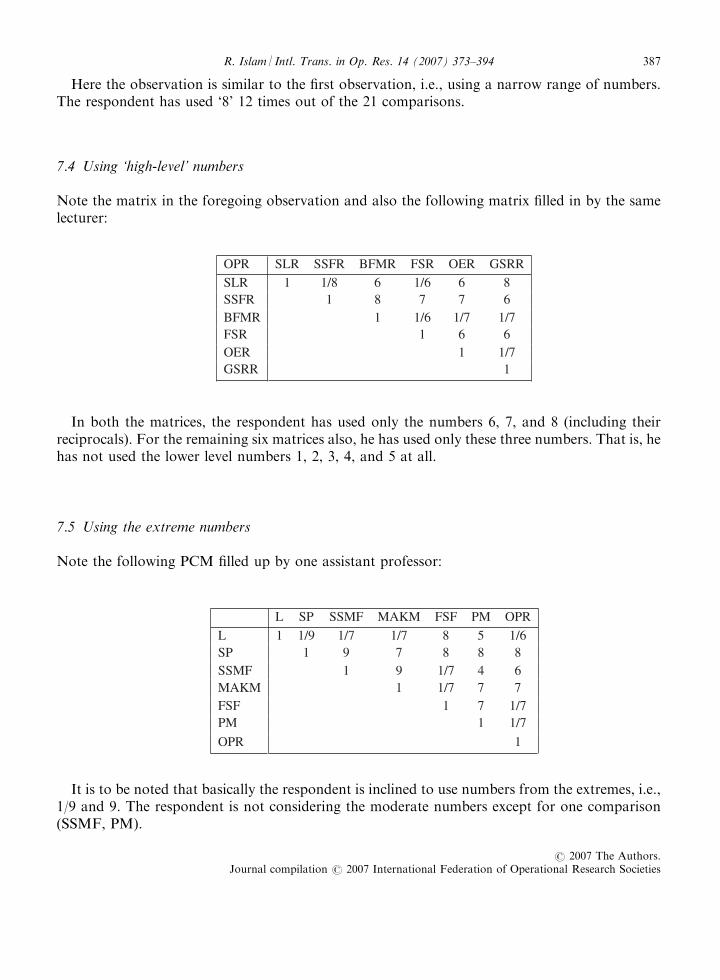
Here the observation is similar to the first observation, i.e., using a narrow range of numbers.The respondent has used ‘8’ 12 times out of the 21 comparisons.
7.4 Using ‘high-level’ numbers
Note the matrix in the foregoing observation and also the following matrix filled in by the samelecturer:
In both the matrices, the respondent has used only the numbers 6, 7, and 8 (including theirreciprocals). For the remaining six matrices also, he has used only these three numbers. That is, hehas not used the lower level numbers 1, 2, 3, 4, and 5 at all.
7.5 Using the extreme numbers
Note the following PCM filled up by one assistant professor:
It is to be noted that basically the respondent is inclined to use numbers from the extremes, i.e.,1/9 and 9. The respondent is not considering the moderate numbers except for one comparison(SSMF, PM).
OPR SLR SSFR BFMR FSR OER GSRR
SLR 1 1/8 6 1/6 6 8SSFR 1 8 7 7 6BFMR 1 1/6 1/7 1/7FSR 1 6 6OER 1 1/7GSRR 1
L SP SSMF MAKM FSF PM OPR
L 1 1/9 1/7 1/7 8 5 1/6SP 1 9 7 8 8 8SSMF 1 9 1/7 4 6MAKM 1 1/7 7 7FSF 1 7 1/7PM 1 1/7
OPR 1
R. Islam / Intl. Trans. in Op. Res. 14 (2007) 373–394 387
r 2007 The Authors.Journal compilation r 2007 International Federation of Operational Research Societies

7.6 Revising elements in a PCM
The following PCM from one lecturer may be noted:
Initially, the respondent stated ‘8’ as the importance level for ‘leadership’ (L) over ‘student,stakeholder and market focus’ (SSMF). This means that ‘L’ is ‘very strongly more’ importantcompared to ‘SSMF’. On the other hand, from the comparison (L, SP), we see that ‘SP’ is moreimportant than ‘L’. From the above two comparisons, we can conclude that SP is ‘extremelymore’ important compared to ‘SSMF’. However, the respondent specified ‘1/5’ for thecomparison, signifying gross inconsistency in the judgments. Although inconsistency is allowedin AHP, gross inconsistency like this is not at all desired. The matter was pointed out tothe respondent and then she changed the comparison for (L, SSMF) from 8 to 1/6; apparently, therespondent made a ‘mistake’ in her previous judgment. This revision was possible because datawere collected personally. If the AHP data are collected through normal questionnaire, thenperhaps the inconsistency will remain. But it can be minimized by requesting the respondents totake extra care about the consistency matter. The author has also seen that some respondentsrevise their previous judgments themselves (without pointing out the matter). It happened to atleast one professor who initially rated leadership as 5 over strategic planning. But later whenshe started rating strategic planning higher over some others, she herself revised the comparison(L, SP) from 5 to just 1.
7.7 Using 1s
It has been mentioned above that the data were collected personally. Initially, we explained the(1/9, 9) scale and how to use it. When we saw that one of the respondents was not using 1s(apparently, because the respondent thought that ‘1’ could not be used), we reminded them thatthe factors could also be equally important and in the AHP scale, there was a scope to enter 1.After this reminder, we observed that the same respondent was using 1s for many latercomparisons. However, this should not be viewed as an instance of influencing the respondent, asall respondents were totally free to articulate their responses.
L SP SSMF MAKM FSF PM OPR
L 1 1/2 1/6 2 1/2 1/5 1/8SP 1 1/5 1/2 1/3 1/3 1/8SSMF 1 2 2 1/2 1/5MAKM 1 1/2 1/5 1/7FSF 1 1/2 1/5PM 1 1/7
OPR 1
R. Islam / Intl. Trans. in Op. Res. 14 (2007) 373–394388
r 2007 The Authors.Journal compilation r 2007 International Federation of Operational Research Societies
7.8 Time taken to fill in all the eight PCMs
As expected, we noted that the respondents were taking different amounts of time to fill in thePCMs. Some respondents were very prompt in articulating their responses; they responded almostimmediately after asking the AHP pairwise comparison question. On the other hand, others weremore thoughtful in their judgments. Some respondents completed all the matrices in less than15min, while some others took more than 30min. It was also observed that the respondents whotake more time to fill in the matrices were more consistent in their judgments compared to therespondents who took less time.
7.9 Articulating the judgments using verbal phrases
Some respondents were found to be more comfortable in using verbal phrases like ‘moderatelymore’ or ‘strongly more’ compared to using numerical ratings like 3 or 5.
8. Proposing a new evaluation procedure for MBNQA
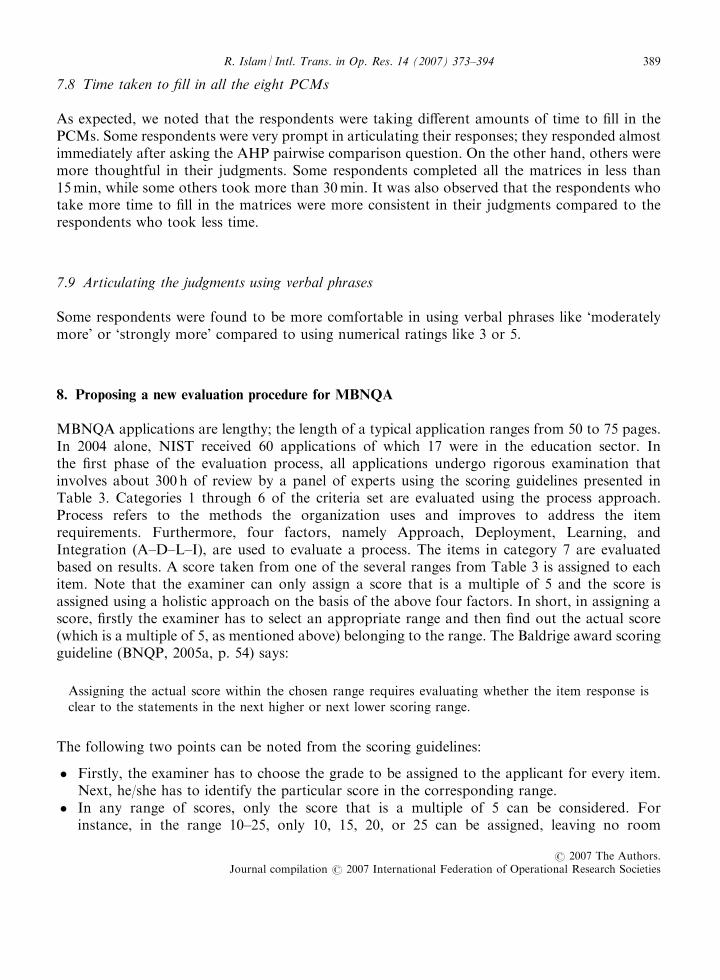
MBNQA applications are lengthy; the length of a typical application ranges from 50 to 75 pages.In 2004 alone, NIST received 60 applications of which 17 were in the education sector. Inthe first phase of the evaluation process, all applications undergo rigorous examination thatinvolves about 300 h of review by a panel of experts using the scoring guidelines presented inTable 3. Categories 1 through 6 of the criteria set are evaluated using the process approach.Process refers to the methods the organization uses and improves to address the itemrequirements. Furthermore, four factors, namely Approach, Deployment, Learning, andIntegration (A–D–L–I), are used to evaluate a process. The items in category 7 are evaluatedbased on results. A score taken from one of the several ranges from Table 3 is assigned to eachitem. Note that the examiner can only assign a score that is a multiple of 5 and the score isassigned using a holistic approach on the basis of the above four factors. In short, in assigning ascore, firstly the examiner has to select an appropriate range and then find out the actual score(which is a multiple of 5, as mentioned above) belonging to the range. The Baldrige award scoringguideline (BNQP, 2005a, p. 54) says:
Assigning the actual score within the chosen range requires evaluating whether the item response isclear to the statements in the next higher or next lower scoring range.
The following two points can be noted from the scoring guidelines:
� Firstly, the examiner has to choose the grade to be assigned to the applicant for every item.Next, he/she has to identify the particular score in the corresponding range.
� In any range of scores, only the score that is a multiple of 5 can be considered. Forinstance, in the range 10–25, only 10, 15, 20, or 25 can be assigned, leaving no room
R. Islam / Intl. Trans. in Op. Res. 14 (2007) 373–394 389
r 2007 The Authors.Journal compilation r 2007 International Federation of Operational Research Societies
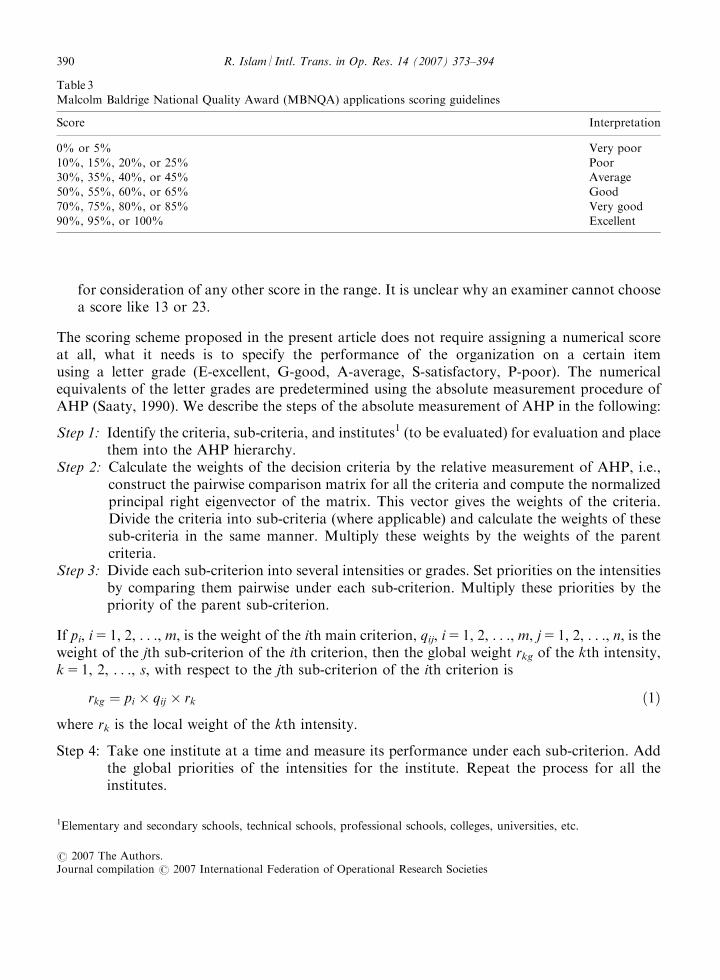
for consideration of any other score in the range. It is unclear why an examiner cannot choosea score like 13 or 23.
The scoring scheme proposed in the present article does not require assigning a numerical scoreat all, what it needs is to specify the performance of the organization on a certain itemusing a letter grade (E-excellent, G-good, A-average, S-satisfactory, P-poor). The numericalequivalents of the letter grades are predetermined using the absolute measurement procedure ofAHP (Saaty, 1990). We describe the steps of the absolute measurement of AHP in the following:
Step 1: Identify the criteria, sub-criteria, and institutes1 (to be evaluated) for evaluation and placethem into the AHP hierarchy.
Step 2: Calculate the weights of the decision criteria by the relative measurement of AHP, i.e.,construct the pairwise comparison matrix for all the criteria and compute the normalizedprincipal right eigenvector of the matrix. This vector gives the weights of the criteria.Divide the criteria into sub-criteria (where applicable) and calculate the weights of thesesub-criteria in the same manner. Multiply these weights by the weights of the parentcriteria.
Step 3: Divide each sub-criterion into several intensities or grades. Set priorities on the intensitiesby comparing them pairwise under each sub-criterion. Multiply these priorities by thepriority of the parent sub-criterion.
If pi, i5 1, 2, . . ., m, is the weight of the ith main criterion, qij, i5 1, 2, . . ., m, j5 1, 2, . . ., n, is theweight of the jth sub-criterion of the ith criterion, then the global weight rkg of the kth intensity,k5 1, 2, . . ., s, with respect to the jth sub-criterion of the ith criterion is
rkg ¼ pi � qij � rk ð1Þ
where rk is the local weight of the kth intensity.
Step 4: Take one institute at a time and measure its performance under each sub-criterion. Addthe global priorities of the intensities for the institute. Repeat the process for all theinstitutes.
Table 3
Malcolm Baldrige National Quality Award (MBNQA) applications scoring guidelines
Score Interpretation
0% or 5% Very poor
10%, 15%, 20%, or 25% Poor
30%, 35%, 40%, or 45% Average
50%, 55%, 60%, or 65% Good
70%, 75%, 80%, or 85% Very good
90%, 95%, or 100% Excellent
1Elementary and secondary schools, technical schools, professional schools, colleges, universities, etc.
R. Islam / Intl. Trans. in Op. Res. 14 (2007) 373–394390
r 2007 The Authors.Journal compilation r 2007 International Federation of Operational Research Societies
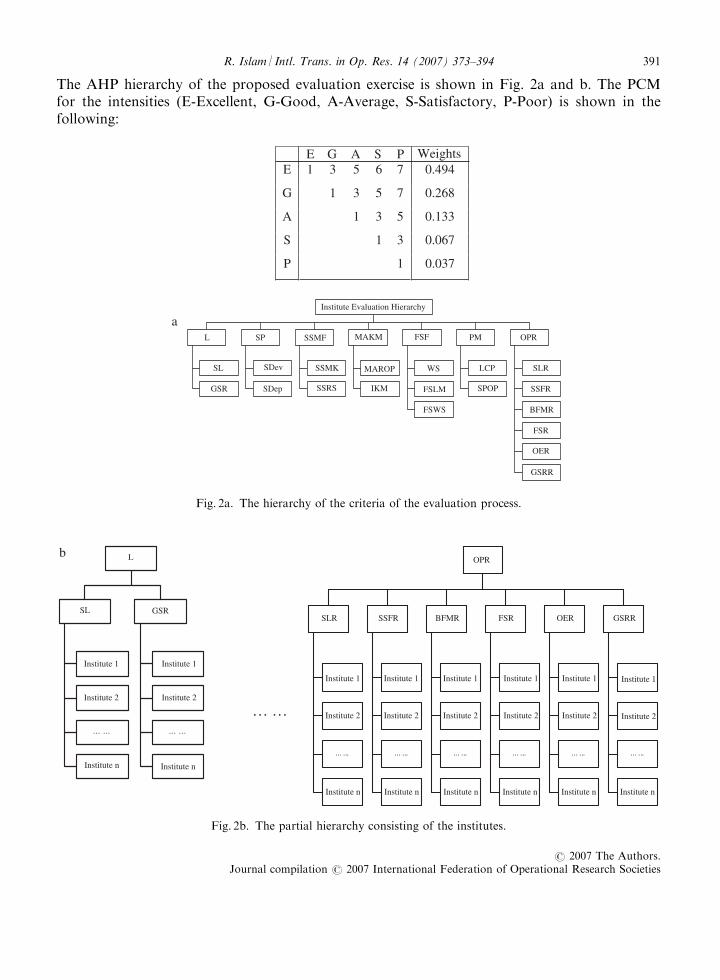
The AHP hierarchy of the proposed evaluation exercise is shown in Fig. 2a and b. The PCMfor the intensities (E-Excellent, G-Good, A-Average, S-Satisfactory, P-Poor) is shown in thefollowing:
EE G A S P Weights1 3 5 6 7 0.494
G 1 3 5 7 0.268
A 1 3 5 0.133
S 1 3 0.067
P 1 0.037
SL
GSR
L
SDev
SDep
SP
SSMK
SSRS
SSMF
MAROP
IKM
MAKM
WS
FSLM
FSWS
FSF
LCP
SPOP
PM
SLR
SSFR
BFMR
FSR
OER
GSRR
OPR
Institute Evaluation Hierarchy
a
Fig. 2a. The hierarchy of the criteria of the evaluation process.
Institute 1
Institute 2
... ...
Institute n
SL
... ...
Institute n
GSR
L
… …
... ...
SLR
... ...
SSFR
... ...
BFMR
... ...
FSR
... ...
OER
... ...
GSRR
OPRb
Institute 1
Institute 2
Institute 1
Institute 2
Institute 1
Institute 2
Institute 1
Institute 2
Institute 1
Institute 2
Institute 1
Institute 2
Institute 1
Institute 2
Institute n Institute n Institute n Institute n Institute n Institute n
Fig. 2b. The partial hierarchy consisting of the institutes.
R. Islam / Intl. Trans. in Op. Res. 14 (2007) 373–394 391
r 2007 The Authors.Journal compilation r 2007 International Federation of Operational Research Societies
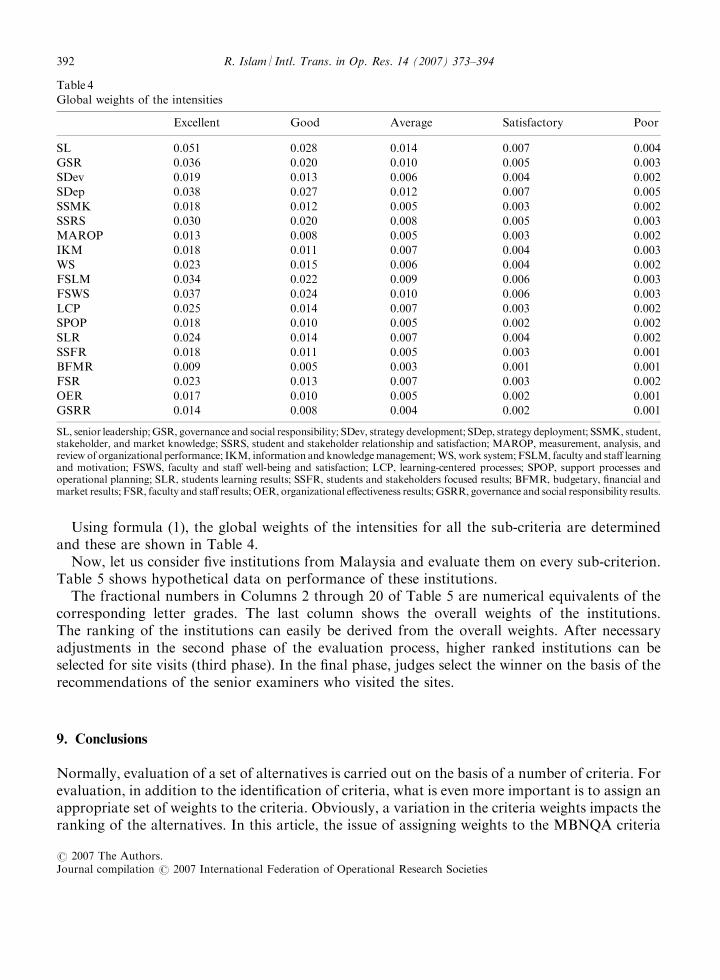
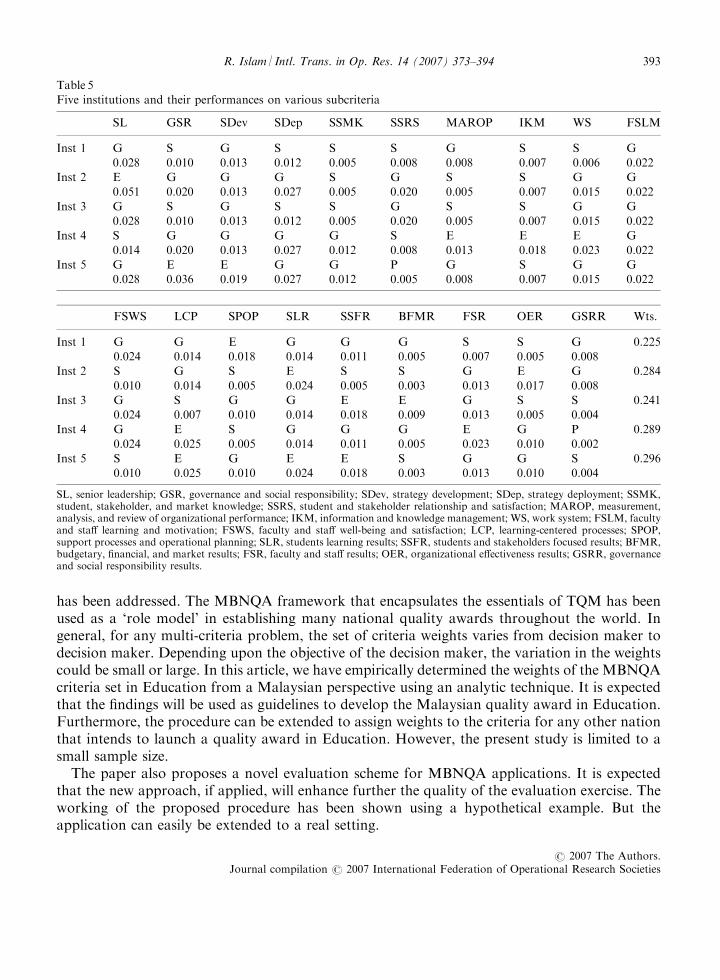
Using formula (1), the global weights of the intensities for all the sub-criteria are determinedand these are shown in Table 4.Now, let us consider five institutions from Malaysia and evaluate them on every sub-criterion.
Table 5 shows hypothetical data on performance of these institutions.The fractional numbers in Columns 2 through 20 of Table 5 are numerical equivalents of the
corresponding letter grades. The last column shows the overall weights of the institutions.The ranking of the institutions can easily be derived from the overall weights. After necessaryadjustments in the second phase of the evaluation process, higher ranked institutions can beselected for site visits (third phase). In the final phase, judges select the winner on the basis of therecommendations of the senior examiners who visited the sites.
9. Conclusions
Normally, evaluation of a set of alternatives is carried out on the basis of a number of criteria. Forevaluation, in addition to the identification of criteria, what is even more important is to assign anappropriate set of weights to the criteria. Obviously, a variation in the criteria weights impacts theranking of the alternatives. In this article, the issue of assigning weights to the MBNQA criteria
Table 4
Global weights of the intensities
Excellent Good Average Satisfactory Poor
SL 0.051 0.028 0.014 0.007 0.004
GSR 0.036 0.020 0.010 0.005 0.003
SDev 0.019 0.013 0.006 0.004 0.002
SDep 0.038 0.027 0.012 0.007 0.005
SSMK 0.018 0.012 0.005 0.003 0.002
SSRS 0.030 0.020 0.008 0.005 0.003
MAROP 0.013 0.008 0.005 0.003 0.002
IKM 0.018 0.011 0.007 0.004 0.003
WS 0.023 0.015 0.006 0.004 0.002
FSLM 0.034 0.022 0.009 0.006 0.003
FSWS 0.037 0.024 0.010 0.006 0.003
LCP 0.025 0.014 0.007 0.003 0.002
SPOP 0.018 0.010 0.005 0.002 0.002
SLR 0.024 0.014 0.007 0.004 0.002
SSFR 0.018 0.011 0.005 0.003 0.001
BFMR 0.009 0.005 0.003 0.001 0.001
FSR 0.023 0.013 0.007 0.003 0.002
OER 0.017 0.010 0.005 0.002 0.001
GSRR 0.014 0.008 0.004 0.002 0.001
SL, senior leadership;GSR, governance and social responsibility; SDev, strategy development; SDep, strategy deployment; SSMK, student,stakeholder, and market knowledge; SSRS, student and stakeholder relationship and satisfaction; MAROP, measurement, analysis, andreview of organizational performance; IKM, information and knowledgemanagement;WS, work system; FSLM, faculty and staff learningand motivation; FSWS, faculty and staff well-being and satisfaction; LCP, learning-centered processes; SPOP, support processes andoperational planning; SLR, students learning results; SSFR, students and stakeholders focused results; BFMR, budgetary, financial andmarket results; FSR, faculty and staff results; OER, organizational effectiveness results; GSRR, governance and social responsibility results.
R. Islam / Intl. Trans. in Op. Res. 14 (2007) 373–394392
r 2007 The Authors.Journal compilation r 2007 International Federation of Operational Research Societies
has been addressed. The MBNQA framework that encapsulates the essentials of TQM has beenused as a ‘role model’ in establishing many national quality awards throughout the world. Ingeneral, for any multi-criteria problem, the set of criteria weights varies from decision maker todecision maker. Depending upon the objective of the decision maker, the variation in the weightscould be small or large. In this article, we have empirically determined the weights of the MBNQAcriteria set in Education from a Malaysian perspective using an analytic technique. It is expectedthat the findings will be used as guidelines to develop the Malaysian quality award in Education.Furthermore, the procedure can be extended to assign weights to the criteria for any other nationthat intends to launch a quality award in Education. However, the present study is limited to asmall sample size.The paper also proposes a novel evaluation scheme for MBNQA applications. It is expected
that the new approach, if applied, will enhance further the quality of the evaluation exercise. Theworking of the proposed procedure has been shown using a hypothetical example. But theapplication can easily be extended to a real setting.
Table 5
Five institutions and their performances on various subcriteria
SL GSR SDev SDep SSMK SSRS MAROP IKM WS FSLM
Inst 1 G S G S S S G S S G
0.028 0.010 0.013 0.012 0.005 0.008 0.008 0.007 0.006 0.022
Inst 2 E G G G S G S S G G
0.051 0.020 0.013 0.027 0.005 0.020 0.005 0.007 0.015 0.022
Inst 3 G S G S S G S S G G
0.028 0.010 0.013 0.012 0.005 0.020 0.005 0.007 0.015 0.022
Inst 4 S G G G G S E E E G
0.014 0.020 0.013 0.027 0.012 0.008 0.013 0.018 0.023 0.022
Inst 5 G E E G G P G S G G
0.028 0.036 0.019 0.027 0.012 0.005 0.008 0.007 0.015 0.022
FSWS LCP SPOP SLR SSFR BFMR FSR OER GSRR Wts.
Inst 1 G G E G G G S S G 0.225
0.024 0.014 0.018 0.014 0.011 0.005 0.007 0.005 0.008
Inst 2 S G S E S S G E G 0.284
0.010 0.014 0.005 0.024 0.005 0.003 0.013 0.017 0.008
Inst 3 G S G G E E G S S 0.241
0.024 0.007 0.010 0.014 0.018 0.009 0.013 0.005 0.004
Inst 4 G E S G G G E G P 0.289
0.024 0.025 0.005 0.014 0.011 0.005 0.023 0.010 0.002
Inst 5 S E G E E S G G S 0.296
0.010 0.025 0.010 0.024 0.018 0.003 0.013 0.010 0.004
SL, senior leadership; GSR, governance and social responsibility; SDev, strategy development; SDep, strategy deployment; SSMK,student, stakeholder, and market knowledge; SSRS, student and stakeholder relationship and satisfaction; MAROP, measurement,analysis, and review of organizational performance; IKM, information and knowledge management; WS, work system; FSLM, facultyand staff learning and motivation; FSWS, faculty and staff well-being and satisfaction; LCP, learning-centered processes; SPOP,support processes and operational planning; SLR, students learning results; SSFR, students and stakeholders focused results; BFMR,budgetary, financial, and market results; FSR, faculty and staff results; OER, organizational effectiveness results; GSRR, governanceand social responsibility results.
R. Islam / Intl. Trans. in Op. Res. 14 (2007) 373–394 393
r 2007 The Authors.Journal compilation r 2007 International Federation of Operational Research Societies
Acknowledgement
The author is grateful to the anonymous referees for their insightful comments. The author alsowishes to thank all the respondents for their feedback in the data collection exercise.
References
Babicz, G., 2002. Assessing the Baldrige award. Quality, November, 36–39.
Baldrige National Quality Program 2005a. Education Criteria for Performance Excellence. National Institute of
Standards and Technology, US Department of Commerce. Available at www.baldrige.nist.gov.
Baldrige National Quality Program 2005b. Getting started. National Institute of Standards and Technology, US
Department of Commerce. Available at www.baldrige.nist.gov.
Basak, I., Saaty, T.L., 1993. Group decision making using the analytic hierarchy process. Mathematical and Computer
Modelling 17, 101–109.
Brown, M.G., 1997. Measuring up against the 1997 Baldrige criteria. Journal of Quality and Participation 20, 4, 22–28.
Collier, D.A., 1992. Service, please: theMalcolmBaldrigeNational Quality Award.Business Horizons, July–August, 88–95.
Curkovic, S., Melnyk, S., Calantone, R., Handfield, R., 2000. Validating the Malcolm Baldrige National Quality Award
framework through structural equation modeling. International Journal of Production Research 38, 4, 765–791.
Fisher, C., Dauterive, J., Barfield, J., 2001. Economic impacts of quality awards: Does offering an award bring returns
to the state? Total Quality Management 12, 7&8, 981–987.
Garvin, D.A., 1991. How the Baldrige award really works. Harvard Business Review, November–December, 80–93.
Ghobadian, A., Woo, H.S., 1996. Characteristics, benefits and shortcomings of four major quality awards. International
Journal of Quality and Reliability Management 13, 2, 10–44.
Goldstein, S.M., Schweikhart, S.B., 2002. Empirical support for the Baldrige award framework in US hospitals. Health
Care Management Review 27, 1, 62–75.
Handfield, R.B., Ghosh, S., 1995. An empirical test of linkages between the Baldrige criteria and financial performance.
Proceedings of the Decision Sciences Institute Annual Meetings, 1713–1715.
Johnson, H.H., 1996. The Baldrige and state quality awards for education. The Journal for Quality and Participation 19,
1, 88–92.
Leach, K.E., 1994. Lessons from the Baldrige. Industry Week, September 19, 42.
Prybutok, V.R., Stafford, M.R., 1997. Using Baldrige criteria for self-assessment. Marketing Health Services, 45–48.
Prybutok, V.R., Richards, R.M., Cutshall, R., 2001. The significance of information and analysis as a component of a
leadership model based on Malcolm Baldrige National Quality Award criteria. Journal of Computer Information
Systems 41, 4, 52–56.
Puay, S.H., Tan, K.C., Xic, M., Goh, T.N., 1998. A comparative study of nine national quality awards. The TQM
Magazine 10, 1, 30–39.
Reimann, C.W., Herz, H.S., 1996. The Baldrige award and ISO 9000 registration compared. Journal of Quality and
Participation 19, 1, 12–19.
Saaty, T.L., 1980. The Analytic Hierarchy Process. McGraw-Hill, New York.
Saaty, T.L., 1990. How to make a decision: The analytic hierarchy process. European Journal of Operational Research
48, 9–26.
Saaty, T.L., Forman, E.H., 2000. Expert Choice–Advanced Decision Support Systems Software. Expert Choice Inc.,
Pittsburgh.
Seymour, D., 1996. High Performing Colleges: The Malcolm Baldrige National Quality Award as a Framework for
Improving Higher Education. Prescott Publishing, Marvills, OH.
Steeples, M.M., 1993. The Corporate Guide to the Malcolm Baldrige National Quality Award. Business one-Irwin,
Homewood, IL.
Wilson, D.D., Collier, D.A., 2000. An empirical investigation of the Malcolm Baldrige National Quality Award causal
model. Decision Science 32, 2, 361–390.
R. Islam / Intl. Trans. in Op. Res. 14 (2007) 373–394394
r 2007 The Authors.Journal compilation r 2007 International Federation of Operational Research Societies