multiscale reconstruction for computational spectral...
TRANSCRIPT

Multiscale reconstruction for computational spectral imaging
R. M. Willetta, M. E. Gehmb, and D. J. Bradyc
aDepartment of Electrical and Computer Engineering, Duke University, Durham, NC 27708bDepartment of Electrical and Computer Engineering, University of Arizona, Tucson AZ, 85721
cFitzpatrick Institute for Photonics, Duke University, Durham, NC 27708
ABSTRACT
In this work we develop a spectral imaging system and associated reconstruction methods that have been de-
signed to exploit the theory of compressive sensing. Recent work in this emerging field indicates that when the
signal of interest is very sparse (i.e. zero-valued at most locations) or highly compressible in some basis, rela-
tively few incoherent observations are necessary to reconstruct the most significant non-zero signal components.
Conventionally, spectral imaging systems measure complete data cubes and are subject to performance limiting
tradeoffs between spectral and spatial resolution. We achieve single-shot full 3D data cube estimates by using
compressed sensing reconstruction methods to process observations collected using an innovative, real-time,
dual-disperser spectral imager. The physical system contains a transmissive coding element located between
a pair of matched dispersers, so that each pixel measurement is the coded projection of the spectrum in the
corresponding spatial location in the spectral data cube. Using a novel multiscale representation of the spectral
image data cube, we are able to accurately reconstruct 256×256×15 spectral image cubes using just 256×256measurements.
Keywords: wavelets, compressed sensing, hyperspectral imaging
1. COMPRESSIVE SPECTRAL IMAGING
Spectral imaging is a highly effective tool in a variety of scientific and engineering contexts because of the in-
formation it implicitly encodes about the nature of the materials being imaged. While traditional digital imaging
techniques produce images with scalar values associated with each spatial pixel location, in spectral images
these scalar values are replaced with a vector containing the spectral information from that spatial location.
The resulting data is therefore three-dimensional (two spatial dimensions and one spectral dimension). Spec-
tral information can be vital for tasks such as monitoring the health of a forest ecosystem [1, 2], increasing our
understanding of solar physics [3], or examining tissue and organisms used to study cellular dynamics [4, 5].
Despite its potential, however, many modern spectral imagers face a limiting tradeoff between spatial and
spectral resolution, with the total number of voxels measured constrained by the size of the detector array.
This constraint limits the utility and cost-effectiveness of spectral imaging for many applications. Further-
more, straightforward application of traditional spectroscopic techniques to spectral imaging proves problematic.
The simplest spectral imager forms combine either a pushbroom (linear scanning) or tomographic (rotational
scanning) front-end with a traditional slit-based dispersive spectrometer. Unfortunately, in many of the most
interesting applications (most notably biophotonics) the sources are often both spatially-incoherent and weak.
Spatially-incoherent sources present a significant challenge to slit-based dispersive spectrometers, and extremely
poor photon collection efficiency is the result. When the source is also weak, the absolute number of collected
Send correspondence to [email protected]. R. Willett was supported by Defense Advanced Research Projects Agency
grants HR0011-06-1-0026 and N00014-06-1-0610. D. Brady and M. Gehm were supported by Defense Advanced Re-
search Projects Agency grant N00014-06-1-0610.

photons can be very small. Because the small number of photons must then be apportioned between the large
number of voxels in the data cube, a given spatio-spectral element tends to contain very few photons and hence
has a poor signal-to-noise ratio (SNR).
This paper addresses these challenges by presenting a novel spectral imaging system and associated recon-
struction framework. The imager is a completely static, single-shot design, resulting in a mechanically robust
and inexpensive system. One critical design element is that the imager does not directly measure each voxel in
the desired three-dimensional spectral image. Instead, it collects a small number (relative to the size of the data
cube) of coded measurements, and then a novel reconstruction method is used to estimate the spectral image
from the noisy projections.
As indicated by recent work in the emerging field of compressed sensing [6–8], when feasible, judicious
selection of the type of distortion induced by measurement systems may dramatically improve our ability to
extract high-quality signals from a limited number of measurements. The basic idea of this theory is that when
the signal of interest is very sparse (i.e. zero-valued at most locations) or highly compressible in some basis,
relatively few incoherent observations are necessary to reconstruct the most significant non-zero signal com-
ponents. This paper presents a practical application of these ideas to spectral imaging, and demonstrates that
accurate spectroscopic images can be estimated from the noisy projections collected by the proposed system.
In Section 2, we present our spectral imaging system design and its advantages over conventional systems.
We then describe the computational methods used to estimate the spectral image from noisy measurements
collected by the proposed system. First we focus on noise removal from spatio-spectral data cubes in Section 3,
and then we describe how this denoising framework can be used to solve the highly ill-posed inverse problem
associated with our imaging system in Section 4. Results are presented in Section 5, and discussed in Section 6.
2. IMAGING SYSTEM DESIGN
2.1. Design motivation
Over the years, many groups have addressed the light collection problem associated with spectral imaging,
and have produced a number of creative solutions. Two very advanced methods are the scanning-Michelson
Fourier-transform spectrometers, and multiplexed pushbroom designs based on digital micro-mirror (DMM)
technology [9, 10]. Both approaches have proven highly successful in simulation and experiment, however they
rely on mechanical systems that are simultaneously expensive and fragile.
Other groups have focused on simpler schemes that are more robust and inexpensive, most notably several
direct-view designs that maximize the light gathering efficiency of the systems [11–13]. These systems do away
with the spectrometer slit altogether and simply view the source through a rotating dispersive element. In this
approach, the measurements taken at different rotation angles of the dispersive element are projective measure-
ments through the data cube and can be tomographically reconstructed. This technique has a very high photon
collection efficiency. However, the range of angles over which projections are made is limited by the geometry
of the system aperture and the distance to the object. The limited range of angles produces an unsampled region
of Fourier space, and an estimate of the data cube that is necessarily inexact. In the tomographic community
this Fourier undersampling is known as the missing cone problem, because the unsampled region is a conical
volume in Fourier space. There has been significant work on algorithmic approaches for “filling in” this missing
information. The most successful has been the method of projection onto convex sets (POCS) [14].
This manuscript considers a completely static, single-shot approach that relies on no complicated optical
elements. As a result it is extremely mechanically robust and inexpensive. Like the direct-view methods, our
approach does not measure all of the information in the data cube. However, unlike those methods, the lack of
information measurement is intentional and has a specifically-designed structure. Our approach draws on the

recent success of compressive sensing [6–8,15–21]. The ability to solve such an underdetermined problem relies
on the properties of “natural” signals—specifically that they tend to be sparse in some basis other than the naıve
Dirac sampling basis.
The sensor design considered in this manuscript derives from our previous work on coded aperture spectrom-
eters [22] and spectral imagers [23]. The basic design for a compressive imaging spectrometer was presented
in [24], which considered least gradient and related diffusion algorithms for decompressive spectral image infer-
ence. The present manuscript focuses on multiscale decompressive inference algorithms using the dual disperser
optical design of [24]. Prior to describing the algorithms, we briefly review the optical design with particular
attention to recent advances in physical layer code design.
2.2. Prototype system and system model
As described above, the goal is to produce a system with arbitrary wavelength filters on each spatial pixel. In
this way, the system can be viewed as a generalization of the Bayer filter pattern that is used in digital color
imaging. For hyperspectral imaging, however, interference-based filters, such as those used in the Bayer system
are not practical. The large number of spectral channels in a hyperspectral imager requires very narrow spectral
features, while the need for high photon collection requires a large number of active channels in any given
filter function. Producing filter functions with large numbers of narrow transmission/rejections bands would be
cost-prohibitive via interference filters.
In our approach, which we dub the dual-disperser system, the filter functions are produced by a simple
aperture code placed between two dispersive elements with equal and opposite effect. A schematic of the system
is shown in Fig. 1.
i,j,k
p,ql,mg
Figure 1. A schematic of the notional imaging system.
In developing a system model, we assume all physical scales are matched to the sampling size of the detec-
tor and work in a completely discrete representation. As shown in Fig. 1, the source is taken to have a spectral
density fi,j,k, where the first, second, and third indices indicate the two spatial and one spectral coordinates,
respectively. The light from the source is imaged through the first dispersive element onto an aperture mask with
a binary-valued transmission given by tl,m. This mask modulates the intensity of the light and the resulting dis-
tribution is imaged through a second dispersive element onto a two-dimensional detector array which measures
the incident intensity profile gp,q.

To determine the relationship between the detector measurements and the source spectral density, we begin
following the propagation of the source through the system. The first dispersive element produces a wavelength-
dependent shift of the image on the aperture mask. As a result, the first index of the source (representing the
vertical spatial index) becomes a mixture of the spatial and wavelength indices. We can write the spectral density
just prior to the aperture mask as f(i+k),j,k.
Passage through the aperture mask is represented as multiplication by tl,m. The coding plane is then imaged
through another dispersive element (with a dispersion equal and opposite to the first dispersive element) onto a
two-dimensional detector plane. This undoes the index mixing in f but introduces a similar index mixing in t.
The intensity pattern recorded (without noise) on the detector can be written as
gp,q =∑
k,l,m,p,q
fi,j,k t(l−k),m δ[l − i] δ[m− j] δ[p− i] δ[q − j]
=∑
k
fp,q,k t(p−k),q , (1)
where δ[a] ={
1, a = 00, else . The Kronecker-deltas represent the imaging properties of the optical system, while
the sum in k results from that fact that the detector is wavelength insensitive. This measurement can be viewed
as the imposition of the mth row-code along the wavelength direction of f . However, we have the added
complication that the code is circularly shifted by an amount that depends on the value of the p-index.
Thus we have succeeded in our goal of producing highly-structured spectral filter functions on a pixel-by-
pixel basis, subject only to the circular-shift relationship described above. The next section describes our choice
of aperture code (and hence spectral filters).
2.3. Code design
To create a system with M spectral channels requires a 1-D code of length M . The physical nature of the
system produces spectral filters that are all M possible cyclic shifts of the fundamental code. Thus we are led to
consider well-conditioned codes that consist of cyclic permutations of a single master codeword. The canonical
example of these types of codes are those based on the cyclic S-matrices [25]. For our initial system (and earliest
simulations), we drew upon the order-15 cyclic S-matrix with the fundamental codeword “100100011110101”.
This code provides an overall transmission efficiency of 8/15.
If the coding plane were directly tiled with this pattern, the various filter functions would be implemented
on the detector plane in the manner depicted in Figure 2. In this image, the number k denotes the kth spectral
filter function, which corresponds to the fundamental codeword circularly shifted by k − 1 bits; thus 1 refers to
the fundamental codeword “100100011110101”, 2 refers to the shifted codeword “001000111101011”, etc. The
difficulty with this arrangement is that there are no compact regions that contain all of the filter functions.
Figure 2. Distribution of filter functions that arises from simple tiling of the fundamental codeword. No compact region
contains all 15 filters.

If we instead tile the aperture plane with a unit cell of the form
100100011110101001111010110010101011001000111
(three copies of the fundamental codeword, but with circular shifts of five elements between rows) then the filter
functions are arrayed on the detector plane as displayed in Figure 3. In this scheme, any 3 × 5 region on the
detector contains all 15 spectral filters.
1 2 3 4 5 615
1 2 3 4 5 615
11 12 13 14 15 110
11 12 13 14 15 110
6 7 8 9 10 115
Figure 3. Distribution of filter functions that arises from the more complicated unit cell. Any 3×5 region contains all 15
filters.
3. MULTISCALE SPATIO-SPECTRAL INTENSITY ESTIMATION
Before presenting our approach to reconstructing the three-dimensional spatio-spectral data cube using the coded
measurements described in Section 2, we describe a novel method for removing noise from spatio-spectral data;
the solution of the inverse problem described above will then build upon this intensity estimation method.
Assume that we measure noisy observations of a spatially- and spectrally-varying intensity, where the noise
is obeys a Poisson distribution associated with photons hitting the detector array. Let f denote the N ×N ×Mtrue three-dimensional intensity, where the first two dimensions correspond to the spatial locations, and the third
dimension corresponds to the spectral wavelengths. Our observations (in this section) are thus assumed to be of
the form
y ∼ Poisson(f).
Our goal is to infer f from the measurements y as accurately as possible, effectively utilizing the spectral
information contained in the third dimension.
3.1. Limitations of existing approaches
The spectral information contained in the third dimension of this data cube conveys important information about
color, and, in many applications, important material properties. However, it does not directly lead to improved
denoising capabilities. One common mechanism for improving the signal-to-noise ratio is to simply aggregate
the observations into spatial bins regardless of their wavelengths. This has two key disadvantages. First, after
binning the spectral information is lost and can no longer be used to further the scientific objectives of im-
agers. Second, while the signal-to-noise ratio in each spatial bin is relatively large, the contrast between spatial
locations can be dramatically reduced. This occurs when, for example, two spatial locations have distinctly dif-
ferent spectra, but the total amount of luminosity, aggregated across spectral bands, is similar for the two spatial
locations.

A second approach might involve denoising the image in each spectral band independently. While there
exist several effective tools for image denoising and analysis under Poisson noise, this approach ignores the key
prior knowledge that the same spatial features (e.g. boundaries between two different material types) exist at
every spectral band, even if they are difficult to detect in a given band.
Third, we might consider treating the spectral information as additional dimensions of the data and then
perform multidimensional intensity estimation (such as thresholding multidimensional wavelets based on tensor
products or pruning a multidimensional tree-based partition of the data hypercube). However, such approaches
implicitly assume similar degrees of intensity smoothness in all dimensions, while in fact (a) the structures
prevalent in spatial dimensions are rarely the same as structures prevalent in spectral dimensions, and (b) in
some cases we may not be able to assume any smoothness between spectral bands.
The different natures of spatial and spectral dimensions were addressed in [26] by using a discrete wavelet
transform in the spatial domain and the discrete Fourier transform in the spectral domain. While this is an
effective tool in some contexts, it has limited utility for very photon-limited data because the statistical behavior
of the coefficients under Poisson noise are difficult to characterize and hence many coefficient denoising rules
are subject to inaccuracies.
3.2. Proposed approach
Taking advantage of correlations in the data between both wavelengths and spatial locations, the proposed
method entails performing hereditary Haar intensity estimation via tree pruning in the spatial dimensions, with
each leaf of the resulting unbalanced quad-tree decomposition corresponding to a region of spatially homoge-
neous spectra.
In particular, we determine the ideal partition of the spatial domain of observations (assumed to be [0, 1]2)
and use maximum penalized likelihood estimation to fit a single spectrum to each square in the optimal spatial
partition. The space of possible partitions is a nested hierarchy defined through a recursive dyadic partition
(RDP) of [0, 1]2. The optimal partition is selected by merging neighboring squares of (i.e. pruning) a quad-tree
representation of the observed data to form a data-adaptive RDP P . Each of the terminal squares in the pruned
spatial RDP could correspond to a region of intensity which is spatially homogeneous or smoothly varying
(regardless of the regularity or irregularity between the spectral bands). This gives our estimators the capability
of spatially varying the resolution to automatically increase the smoothing in very regular regions of the intensity
and to preserve detailed structure in less regular regions.
Given a partition P , f(P) can be calculated by finding the “best” spectrum fit to the observations over each
cell in P . In the case where the intensity is not expected to vary smoothly from one spectral band to the next, this
can be accomplished by simply computing the mean observed spectrum in each cell of P . However, in many
cases we may accurately assume that the intensities in neighboring spectral bands are similar, and so the spectral
estimate for a given cell can be computed using penalized likelihood intensity estimation methods. In particular,
we sum the observations in each cell for each spectral band, yielding Poisson observations of the aggregate
spectrum in each partition cell (denoted y(c) for cell c ∈ P). We then prune an RDP representation of this
observed spectrum for each partition cell independently. This procedure, detailed in [27], is highly analogous to
the spatial tree pruning described above. Thus for each cell c in partition P , we build and prune a complete RDP
of the spectrum. In this case, the spectral RDP takes the form of a binary tree representation, and the model fit
to each terminal cell in the spectral RDP is simply the empirical mean of the spectrum across the corresponding
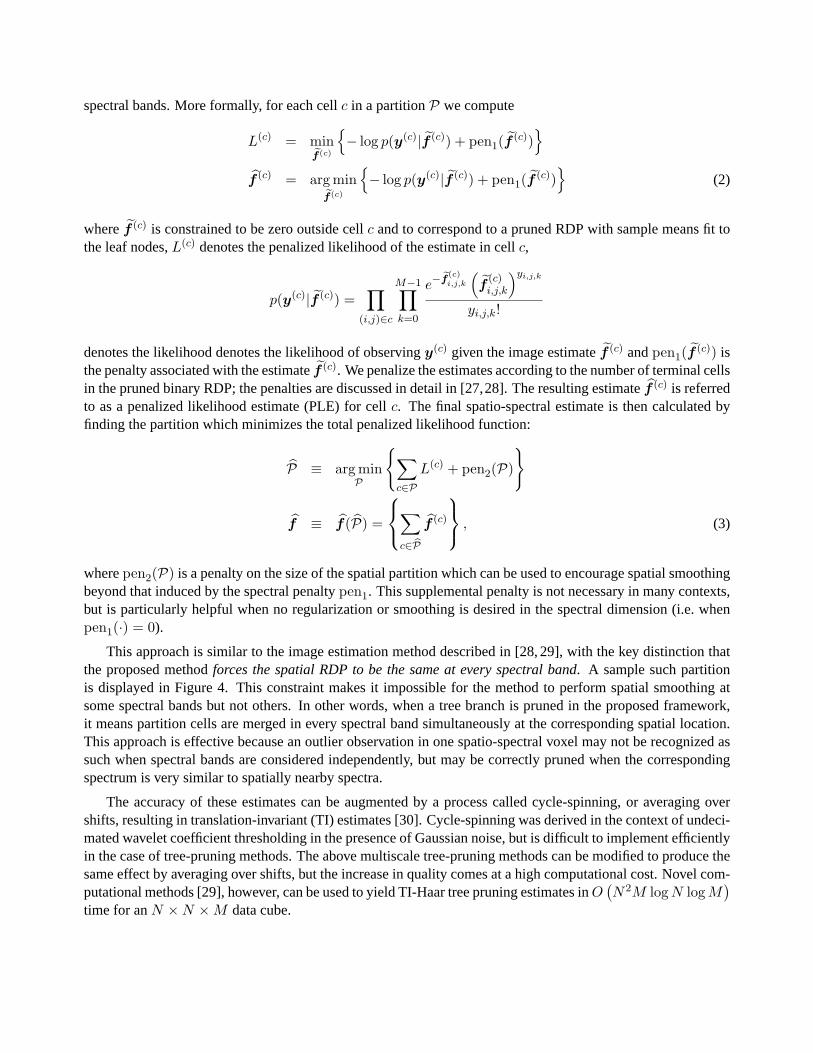
spectral bands. More formally, for each cell c in a partition P we compute
L(c) = minef (c)
{− log p(y(c)|f (c)) + pen1(f
(c))}
f (c) = arg minef (c)
{− log p(y(c)|f (c)) + pen1(f
(c))}
(2)
where f (c) is constrained to be zero outside cell c and to correspond to a pruned RDP with sample means fit to
the leaf nodes, L(c) denotes the penalized likelihood of the estimate in cell c,
p(y(c)|f (c)) =∏
(i,j)∈c
M−1∏k=0
e−ef (c)i,j,k
(f
(c)i,j,k
)yi,j,k
yi,j,k!
denotes the likelihood denotes the likelihood of observing y(c) given the image estimate f (c) and pen1(f (c)) is
the penalty associated with the estimate f (c). We penalize the estimates according to the number of terminal cells
in the pruned binary RDP; the penalties are discussed in detail in [27,28]. The resulting estimate f (c) is referred
to as a penalized likelihood estimate (PLE) for cell c. The final spatio-spectral estimate is then calculated by
finding the partition which minimizes the total penalized likelihood function:
P ≡ arg minP
{∑c∈P
L(c) + pen2(P)
}
f ≡ f(P) =
∑c∈ bP
f (c)
, (3)
where pen2(P) is a penalty on the size of the spatial partition which can be used to encourage spatial smoothing
beyond that induced by the spectral penalty pen1. This supplemental penalty is not necessary in many contexts,
but is particularly helpful when no regularization or smoothing is desired in the spectral dimension (i.e. when
pen1(·) = 0).
This approach is similar to the image estimation method described in [28, 29], with the key distinction that
the proposed method forces the spatial RDP to be the same at every spectral band. A sample such partition
is displayed in Figure 4. This constraint makes it impossible for the method to perform spatial smoothing at
some spectral bands but not others. In other words, when a tree branch is pruned in the proposed framework,
it means partition cells are merged in every spectral band simultaneously at the corresponding spatial location.
This approach is effective because an outlier observation in one spatio-spectral voxel may not be recognized as
such when spectral bands are considered independently, but may be correctly pruned when the corresponding
spectrum is very similar to spatially nearby spectra.
The accuracy of these estimates can be augmented by a process called cycle-spinning, or averaging over
shifts, resulting in translation-invariant (TI) estimates [30]. Cycle-spinning was derived in the context of undeci-
mated wavelet coefficient thresholding in the presence of Gaussian noise, but is difficult to implement efficiently
in the case of tree-pruning methods. The above multiscale tree-pruning methods can be modified to produce the
same effect by averaging over shifts, but the increase in quality comes at a high computational cost. Novel com-
putational methods [29], however, can be used to yield TI-Haar tree pruning estimates inO(N2M logN logM
)time for an N ×N ×M data cube.

Spat
ial D
imen
sio
n 2
Spatial Dimension 1
Spectral D
imensio
n
Figure 4. Sample partition of a spatio-spectral data cube. The spatial partition is the same at each spectral band, making it
impossible for the estimation method to perform spatial smoothing at some spectral bands but not others.
3.3. Denoising experimental results
As described above, the proposed method exploits spatial homogeneities while simultaneously taking advantage
of correlations between neighboring spectral bands. This significantly reduces over-smoothing across spatial
boundaries and edges while improving the reconstruction of each spectrum. To test the effectiveness of the
proposed method, we develop a phantom using a color image of peppers, as displayed in Figure 5. For each
pixel in this image, we define a spectrum in our phantom data cube which corresponds to the color in the image.
This results in a 256× 256× 64 data cube, with a mean intensity (photon count) of 7.04 per voxel.
10 20 30 40 50 600
5
10
15
20
25
30
Wavelength
Inte
nsity
yellow pepperpurple backgroundgreen pepperred pepper
(a) (b)
Figure 5. Test data set. (a) Image used to generate 256× 256× 16 spatio-spectral data cube. (b) Representative selection
of generated spectra in different image regions. Wavelength units are normalized so each spectral band corresponds to one
wavelength unit.
The spatially-varying intensities for three representative spectral bands (one from the red portion of the
simulated spectrum (16th spectral band), one green (24th spectral band), and one blue (53rd spectral band)) are
displayed in Figure 6(a), (f), and (k). Note the faint contrast between some of the features. Noisy observations in
the same three spectral bands are displayed in Figure 6(b), (g), and (l). Several faint or low-contrast features are
not easily discernible by the eye due to the low photon counts. In this simulation study, the penalty term in (2)
was multiplied by a scalar weight to improve empirical performance. The weight was not selected to minimize
any particular error metric, but rather to yield generally accurate reconstructions.

If we were to reconstruct this data cube by performing hereditary TI-Haar image estimation [29] on each
spectral band, we would achieve the results displayed in Figure 6(c), (h), and (m); the mean squared error
associated with this imaging-based data cube estimate, denoted fI , is ‖f−fI‖2/‖f‖2 = 5.22 · 10−3. (While the
images may appear oversmoothed, decreasing the weight on the penalty term results in strong noisy artifacts and
increases the MSE significantly.) Spatio-spectral analysis offers dramatic advantages over processing individual
spectral bands independently, as shown in Figure 6(d), (i), and (n). These results were generated by setting
pen1 proportional to the number of leaves in the full spatio-spectral RDP P and pen2 to zero (i.e. the total
penalty depends on both the smoothness in the spectral dimension and in the spatial dimensions). The mean
squared error associated with this spatio-spectral data cube estimate, denoted fS1, is ‖f − fS1‖2/‖f‖2 =3.26 · 10−3, significantly lower than the MSE for fI . This simulation result shows several spatial features,
including faint boundaries and small-scale inhomogeneities, which are present in the true and spatio-spectrally
estimated intensities but which are difficult or impossible to extract from the noisy observations or independently
processed spectral bands. Similarly encouraging results are possible even without smoothing in the spectral
dimension, which is accomplished by setting pen1 to zero and pen2 proportional to the number of leaves in
the spatial RDP (i.e. the total penalty is independent of the degree of smoothness in the spectral dimension).
These results are displayed in Figure 6(e), (j), and (o), and the mean squared error associated with this data cube
estimate, denoted fS1, is ‖f − fS2‖2/‖f‖2 = 4.02 · 10−3. Finally, Figure 7 shows four representative spectra
and their estimates, further demonstrating the strength of the proposed method.
4. SPECTRAL IMAGE RECONSTRUCTION
The above multiscale method for spatio-spectral denoising can now be used to help reconstruct the spectral
image indirectly measured by the camera described in Section 2. In particular, we can model our observations
as
x ∼ Poisson(g) = Poisson(Hf),
where f is the vectorized 256 × 256 × 15 spatio-spectral data cube we wish to reconstruct, H is the operator
induced by the spectral imaging system as in (1), and x is the vectorized 256× 256 collection of measurements.
Note that H has many more columns (983, 040) than rows (65, 536), making this a very underdetermined
problem.
To solve this challenging inverse problem, we seek a solution (f ) which is both a good match to the data (x)
and sparse. In particular, we solve the following optimization problem:
f = arg minef∈F{− log p(x|Hf) + pen(f)
}, (4)
where F is the collection of estimators corresponding to a pruned spatio-spectral tree (denoted P) as described
in Section 3, and pen(f) =∑
c∈ eP pen1(f (c)) + pen2(P); this penalty is proportional to the number of cells in
the pruned RDP and hence the penalty term encourages solutions with small numbers of leaves (i.e. sparse).
The use of sparsity to solve challenging and ill-posed inverse problems has received widespread attention
recently [6–8,19,20]. The objective function proposed in (4) in particular is similar to those proposed in [19,20],
in that we seek a solution accurately represented by a small number of cells in an RDP (i.e. sparse). We compute
the solution to this problem using an Expectation-Maximization algorithm, which in this case is a regularized
version of the Richardson-Lucy algorithm [31–33]. The method consists of two alternating steps:
Step 1:
y(t) = f (t).×HT (x./Hf (t)),
where .× and ./ denote element-wise multiplication and division, respectively.

(a) (b) (c) (d) (e)
(f) (g) (h) (i) (j)
(k) (l) (m) (n) (o)
Figure 6. Spatio-spectral denoising results. (a) Spatial variation of intensity in 16th spectral band (red). (b) Noisy obser-
vations, with an average of 7.04 photon count per voxel. (c) Result after using tree-pruning to denoise the image in each
spectral band independently; MSE = 5.22 · 10−3. (d) Result after proposed reconstruction with pen1 proportional to
the number of leaves in the full spatio-spectral partition and pen2 = 0; MSE = 3.26 · 10−3. (e) Result after proposed
reconstruction with pen1 = 0 (i.e. no smoothing in the spectral direction) and pen2 proportional to the number of leaves in
the partition P; MSE = 4.02 · 10−3. (f) Spatial variation of intensity in 24th spectral band (red). (g) Noisy observations.
(h) Result after using tree-pruning to denoise the image in each spectral band independently. (i) Result after proposed
reconstruction with pen1 proportional to the number of leaves in the full spatio-spectral partition and pen2 = 0. (j) Result
after proposed reconstruction with pen1 = 0 and pen2 proportional to the number of leaves in the partition P . (k) Spatial
variation of intensity in 53rd spectral band (red). (l) Noisy observations. (m) Result after using tree-pruning to denoise the
image in each spectral band independently. (n) Result after proposed reconstruction with pen1 proportional to the number
of leaves in the full spatio-spectral partition and pen2 = 0. (o) Result after proposed reconstruction with pen1 = 0 and
pen2 proportional to the number of leaves in the partition P .
Step 2: Compute f (t+1) by denoising y(t) according to (3) as described in Section 3.
In the experiments below, the method is initialized with f (0) = HT x and terminated when ‖f (t+1) −f (t)‖22/‖f (t)‖22 < 3 · 10−6.
5. SPECTRAL IMAGE RECONSTRUCTION RESULTS
This method is used to reconstruct a spatio-spectral data cube from simulated measurements modeled after the
camera described in Section 2. For this experiment, we generated a phantom spatio-spectral data cube similar

10 20 30 40 50 600
5
10
15
20
25
30
Wavelength
Inte
nsity
yellow pepperpurple backgroundgreen pepperred pepper
10 20 30 40 50 600
5
10
15
20
25
30
Wavelength
Inte
nsity
yellow pepperpurple backgroundgreen pepperred pepper
(a) (b)
10 20 30 40 50 600
5
10
15
20
25
30
Wavelength
Inte
nsity
yellow pepperpurple backgroundgreen pepperred pepper
10 20 30 40 50 600
5
10
15
20
25
30
Wavelength
Inte
nsity
yellow pepperpurple backgroundgreen pepperred pepper
10 20 30 40 50 600
5
10
15
20
25
30
Wavelength
Inte
nsity
yellow pepperpurple backgroundgreen pepperred pepper
(c) (d) (e)
Figure 7. Spatio-spectral analysis results. (a) True spectra at five different spatial locations. (b) Observed spectra at
same locations. (c) Estimated spectra at same locations after performing intensity estimation on each spectral band in-
dependently, resulting in fI . (d) Estimated spectra at same locations after performing proposed spatio-spectral intensity
estimation, resulting in fS1. (e) Estimated spectral at same locations after performing two-stage approximate estimation,
resulting in fS2.
to the one used in Section 3, but with only 15 (instead of 64) spectral bands. The intensities in several spectral
bands, the color projection of the data cube, and several representative spectra for this phantom are displayed
in the first row of Figure 9. The 256 × 256 noisy simulated observations are displayed in Figure 8; in this
experiment, the mean photon count per pixel in x is 1, 534.
The result of the proposed reconstruction method is displayed in the second row of Figure 9. For this
reconstruction, we do not perform smoothing in the spectral dimension (i.e. pen1 = 0 and pen2 is proportional
to the number of leaves in the partition P) because of the small number of spectral bands and the potential
for significant spectral inhomogeneities at this spectral resolution. The reconstructed spectral image computed
using the multiscale denoising method described in Section 3 has an MSE of 3.42 · 10−2, while the reconstructed
spectral image computed without any regularization (i.e. the conventional Richardson-Lucy reconstruction) has
an MSE of 4.64 · 10−2 and significantly more artifacts.
6. DISCUSSION
This paper demonstrates that compressive spectroscopic imaging measurements combined with reconstruction
methods based on efficient representations of spatio-spectral data cubes can yield accurate reconstructions in the
presence of noise, despite the limited number of measurements collected. To our knowledge, this work is the
first application of compressive sensing ideas to spectroscopic imaging, and demonstrates the potential of that
framework to ease conventional limitations on spatial and spectral resolution imposed by the size of the system’s
detector array.

Figure 8. Simulated noisy observations of peppers spatio-spectral data cube collected by proposed coded spectral imaging
system.
The proposed imaging system, unlike conventional systems, does not collect a unique measurement for each
voxel in the desired spectral image. Rather, it uses a transmissive mask to encode spectral information into a
relatively small number of projections of the spectral image. The spectral information is then extracted from
these compressive, noisy measurements using a computation method which seeks a “sparse” spectral image
which is a good match (in a log likelihood sense) to the measured data. Sparsity is measured using a novel
tree-based representation of spatio-spectral data cubes.
In the proposed method, we build a quad-tree decomposition of the data cube in the spatial dimension, so that
each leaf node of the tree corresponds to a spectrum. We then prune back this tree using a penalized likelihood
criterion. In contrast to processing the “image” at each spectral band independently, this method imposes the
constraint that spatial smoothing be the same across all spectral bands.
In the context of image estimation, multiscale methods based on hereditary Haar wavelets are near minimax
optimal reconstruction techniques for piecewise smooth images [27]. This suggests that the proposed method
potentially has similar optimality characteristics for some classes of marked Poisson processes. Theoretical
analysis of the proposed method is an important component of our ongoing work. In addition, the masks used
to encode spectral information in the proposed system are cyclic S-matrices [25], which have high transmission
efficiency and yield the encouraging results presented in Section 5. However, it may be possible to design
alternative masks or spectral encoding strategies, subject to the constraints imposed by the spectral imaging
system design, which increase the potential accuracy of the reconstructed data cubes. Investigation of efficient
code design strategies for compressive spectral imaging is an additional important area of ongoing work.
7. ACKNOWLEDGEMENTS
The authors would like to thank Nikos Pitsianis and Timothy Schultz for valuable discussions and suggestions.
REFERENCES
1. P. A. Townsend, J. R. Foster, J. R. A. Chastain, and W. S. Currie, “Application of imaging spectroscopy to mapping
canopy nitrogen in the forests of the central appalachian mountains using hyperion and aviris,” Geoscience and
Remote Sensing, IEEE Transactions on 41(6), pp. 1347–1354, 2003.
2. W. Smith, D. Zhou, F. Harrison, H. Revercomb, A. Larar, A. Huang, and B. Huang, “Hyperspectral remote sensing
of atmospheric profiles from satellites and aircraft,” in Proc. SPIE, 4151, pp. 94 – 102, 2001.
3. R. P. Lin, B. R. Dennis, and A. O. B. (Eds.), The Reuven Ramaty High-Energy Solar Spectrscopic Imager (RHESSI)
- Mission Description and Early Results, Kluwer Academic Publishers, Dordrecht, 2003.

2 4 6 8 10 12 140
1000
2000
3000
4000
5000
6000
7000
Wavelength
Inte
nsity
True spectrum, yellow pepperTrue spectrum, purple backgroundTrue spectrum, green pepperTrue spectrum, red pepper
(a) (b) (c) (d)
2 4 6 8 10 12 140
1000
2000
3000
4000
5000
6000
7000
Wavelength
Inte
nsity
Estimate, yellow pepperEstimate, purple backgroundEstimate, green pepperEstimate, red pepper
(e) (f) (g) (h)
2 4 6 8 10 12 140
1000
2000
3000
4000
5000
6000
7000
WavelengthIn
tens
ity
Estimate, yellow pepperEstimate, purple backgroundEstimate, green pepperEstimate, red pepper
(i) (j) (k) (l)
Figure 9. Spatio-spectral reconstruction results. (a) True intensity in 4th spectral band. (b) True intensity in 8th spectral
band. (c) True intensity in 12th spectral band. (d) Representative spectra from true spatio-spectral data cube. (e) Estimated
intensity in 4th spectral band, computed using reconstruction method described above with multiscale spatio-spectral reg-
ularization; MSE = 3.42 · 10−2. (f) Estimated intensity in 8th spectral band, computed using reconstruction method
described above with multiscale spatio-spectral regularization. (g) Estimated intensity in 12th spectral band, computed
using reconstruction method described above with multiscale spatio-spectral regularization. (h) Representative spectra
from estimated spatio-spectral data cube, computed using reconstruction method described above with multiscale spatio-
spectral regularization. (i) Estimated intensity in 4th spectral band, computed using reconstruction method described above
with no regularization; MSE = 4.64 · 10e−2. (j) Estimated intensity in 8th spectral band, computed using reconstruction
method described above with no regularization. (k) Estimated intensity in 12th spectral band, computed using reconstruc-
tion method described above with no regularization. (l) Representative spectra from estimated spatio-spectral data cube,
computed using reconstruction method described above with no regularization.
4. W. Denk, J. Strickler, and W. Webb, “Two-photon laser scanning fluorescence microscopy,” Science 248(4951),
pp. 73–76, 1990.
5. R. Schultz, T. Nielsen, J. Zavaleta, R. Ruch, R. Wyatt, and H. Garner, “Hyperspectral imaging: A novel approach for
microscopic analysis,” Cytometry 43, pp. 239 – 247, 2001.
6. E. Candes, J. Romberg, and T. Tao, “Robust uncertainty principles: Exact signal reconstruction from highly incom-
plete frequency information,” IEEE Transactions on Information Theory 52(2), pp. 489 – 509, 2006.

(a) (b) (c)
Figure 10. Spatio-spectral reconstruction results, color projections. (a) Color projection of true spatio-spectral data cube.
(b) Color projection of estimated spatio-spectral data cube, computed using reconstruction method described above with
multiscale spatio-spectral regularization. (c) Color projection of estimated spatio-spectral data cube, computed using
reconstruction method described above with no regularization.
7. E. Candes and T. Tao, “Near optimal signal recovery from random projections: Universal encoding
strategies.” To be published in IEEE Transactions on Information Theory. http://www.acm.caltech.edu/ em-
manuel/papers/OptimalRecovery.pdf, 2006.
8. D. Donoho, “Compressed sensing,” IEEE Transactions on Information Theory 52(4), pp. 1289–1306, 2006.
9. C. Snively, G. Katzenberger, and J. Lauterbach, “Fourier-transform infrared imaging using a rapid-scan spectrome-
ter,” Opt. Lett. 24, pp. 1841–1843, 1999.
10. A. Wuttig and R. Riesenberg, “Sensitive Hadamard transform imaging spectrometer with a simple MEMS,” Proc.
SPIE 4881, pp. 167–178, 2003.
11. M. Descour and E. Dereniak, “Computed-tomography imaging spectrometer: experimental calibration and recon-
struction results,” Appl. Opt. 34, pp. 4817–4826, 1995.
12. P. Bernhardt, “Direct reconstruction methods for hyperspectral imaging with rotational spectrotomography,” J. Opt.
Soc. Am. A 12, pp. 1884–1901, 1995.
13. J. Mooney, V. Vickers, M. An, and A. Brodzik, “High-throughput hyperspectral infrared camera,” J. Opt. Soc. Am.
A 14, pp. 2951–2961, 1997.
14. A. Brodzik and J. Mooney, “Convex porjections algorithm for resotration of limited-angle chromotomographic im-
ages,” J. Opt. Soc. Am. A 16, pp. 246–257, 1999.
15. M. A. Neifeld and P. Shankar, “Feature-specific imaging,” Applied Optics 42(17), pp. 3379–3389, 2003.
16. H. S. Pal and M. A. Neifeld, “Multispectral principal component imaging,” Optics Express 11(18), pp. 2118–2125,
2003.
17. Y. Tsaig and D. Donoho, “Extensions of compressed sensing,” tech. rep., Stanford University, 2004.
18. N. Pitsianis, D. Brady, and X. Sun, “Sensor-layer image compression based on the quantized cosing transform,” Proc.
SPIE 5817, pp. 250–257, 2005.
19. J. Haupt and R. Nowak, “Signal reconstruction from noisy random projections.” To be published in IEEE Transac-
tions in Information Theory. http://www.ece.wisc.edu/ nowak/infth.pdf, 2006.
20. E. Candes, J. Romberg, and T. Tao, “Stable signal recovery from incomplete and inaccurate measurements,” Com-
munications on Pure and Applied Mathematics 59(8), pp. 1207–1223, 2006.
21. D. Brady, M. Gehm, N. Pitsianis, X. Sun, and P. Potuluri, “Compressive sampling strategies for integrated microspec-
trometers,” Proc. SPIE , 2006.
22. M. Gehm, S. McCain, N. Pitsianis, D. Brady, P. Potuluri, and M. Sullivan, “Static 2D aperture coding for multimodal
multiplex spectroscopy,” Appl. Opt. 45, pp. 2965–2974, 2006.

23. M. E. Gehm and D. J. Brady, “High-throughput hyperspectral microscopy,” Three-Dimensional and Multidimen-
sional Microscopy: Image Acquisition and Processing XIII 6090(1), SPIE, 2006.
24. D. J. Brady and M. E. Gehm, “Compressive imaging spectrometers using coded apertures,” Visual Information
Processing XV 6246(1), SPIE, 2006.
25. M. O. Harwitt and N. J. A. Sloane, Hadamard Transform Optics, Academic Press, 1979.
26. I. Atkinson, F. Kamalabadi, and D. L. Jones, “Wavelet-based hyperspectral image estimation,” 2, pp. 743–745, 2003.
27. R. Willett and R. Nowak, “Multiscale poisson intensity and density estimation.” Submitted to IEEE Trans. Info. Th.,
2005.
28. E. Kolaczyk and R. Nowak, “Multiscale likelihood analysis and complexity penalized estimation,” Annals of Stat. 32,
pp. 500–527, 2004.
29. R. Willett and R. Nowak, “Fast multiresolution photon-limited image reconstruction,” in Proc. IEEE Int. Sym.
Biomedical Imaging — ISBI ’04, (15-18 April, Arlington, VA, USA), 2004.
30. M. Lang, H. Guo, J. E. Odegard, C. S. Burrus, and R. O. Wells, “Noise reduction using an undecimated discrete
wavelet transform,” IEEE Signal Processing Letters 3(1), pp. 10–12, 1996.
31. W. Richardson, “Bayesian-based iterative method of image restoration,” J. Opt. Soc. of Am. 62, pp. 55–59, 1972.
32. L. B. Lucy, “An iterative technique for the rectification of observed distributions,” Astron. J. 79, pp. 745–754, 1974.
33. R. Willett and R. Nowak, “Platelets: a multiscale approach for recovering edges and surfaces in photon-limited
medical imaging,” IEEE Transactions on Medical Imaging 22(3), pp. 332–350, 2003.