multimode nonlinear fibre optics: theory and applications · multimode nonlinear fibre optics:...
TRANSCRIPT

0
Multimode Nonlinear Fibre Optics: Theory andApplications
Peter Horak and Francesco PolettiUniversity of Southampton
United Kingdom
1. Introduction
Optical fibres have been developed as an ideal medium for the delivery of optical pulses eversince their inception (Kao & Hockham, 1966). Much of that development has been focusedon the transmission of low-energy pulses for communication purposes and thus fibres havebeen optimised for singlemode guidance with minimum propagation losses only limited bythe intrinsic material absorption of silica glass of about 0.2dB/km in the near infrared partof the spectrum (Miya et al., 1979). The corresponding increase in accessible transmissionlength simultaneously started the interest in nonlinear fibre optics, for example with earlywork on the stimulated Raman effect (Stolen et al., 1972) and on optical solitons (Hasegawa& Tappert, 1973). Since the advent of fibre amplifiers (Mears et al., 1987), available fibre-coupled laser powers have been increasing dramatically and, in particular, fibre lasers nowexceed kW levels in continuous wave (cw) operation (Jeong et al., 2004) and MW peak powersfor pulses (Galvanauskas et al., 2007) in all-fibre systems. These developments are pushingthe limits of current fibre technology, demanding fibres with larger mode areas and higherdamage threshold. However, it is increasingly difficult to meet these requirements with fibressupporting one single optical mode and therefore often multiple modes are guided.Non-fibre-based laser systems are capable of delivering even larger peak powers, for examplecommercial Ti:sapphire fs lasers now reach the GW regime. Such extreme powers cannot betransmitted in conventional glass fibres at all without destroying them (Gaeta, 2000), but thereis a range of applications for such pulses coupled into hollow-core capillaries, such as pulsecompression (Sartania et al., 1997) and high-harmonic generation (Rundquist et al., 1998). Fortypical experimental parameters, these capillaries act as optical waveguides for a large num-ber of spatial modes and modal interactions contribute significantly to the system dynamics.In order to design ever more efficient fibre lasers, to optimise pulse delivery and to controlnonlinear applications in the high power regime, a thorough understanding of pulse propa-gation and nonlinear interactions in multimode fibres and waveguides is required. The con-ventional tools for modelling and investigating such systems are based on beam propagationmethods (Okamoto, 2006). However, these are numerically expensive and provide little in-sight into the dependence of fundamental nonlinear processes on specific fibre properties,e.g., on transverse mode functions, dispersion and nonlinear mode coupling. For such an in-terpretation a multimode equivalent of the nonlinear Schrödinger equation, the standard andhighly accurate method for describing singlemode nonlinear pulse propagation (Agrawal,2001; Blow & Wood, 1989), is desirable.

In this chapter, we discuss the basics of such a multimode generalised nonlinear Schrödingerequation (Poletti & Horak, 2008), its simplification to experimentally relevant situations anda few select applications. We start by introducing and discussing the theoretical frameworkfor fibres with χ(3) nonlinearity in Sec. 2. The following sections are devoted to multimodenonlinear applications, presented in the order of increasing laser peak powers. A sample ap-plication in the multi-kW regime is supercontinuum generation, discussed in Sec. 3. Here wedemonstrate how fibre mode symmetries and launching conditions affect intermodal powertransfer and spectral broadening. For peak powers in the MW regime, self-focusing effects be-come significant and lead to strong mode coupling. The spatio-temporal evolution of pulsesin this limit is the topic of Sec. 4. Finally, at GW peak power levels, optical pulses can onlybe delivered by propagation in gases. Still, intensities become so high that nonlinear effectsrelated to ionisation must be taken into account. An extension of the multimode theory toinclude these extreme high power effects is presented in Sec. 5 and the significance of modeinteraction is demonstrated by numerical examples pertaining to a recent experiment. Finally,we end this chapter with conclusions in Sec. 6.
2. The multimode generalised nonlinear Schrödinger equation
Pulse propagation in singlemode fibres is frequently modelled by a generalised nonlinearSchrödinger equation (NLSE) which describes the evolution of the electric field amplitude en-velope of an optical pulse as it propagates along the fibre (Agrawal, 2001; Blow & Wood, 1989).This framework has been extremely successful in incorporating all linear and nonlinear effectsusually encountered in fibres, such as second and higher order dispersion, Kerr and Ramannonlinearities and self-steepening, and its predictions have been corroborated by numerousexperiments using conventional fibres, photonic crystal fibres and fibre tapers of different ma-terials, as well as laser sources from the continuous wave regime down to few cycle pulses.Perhaps the most prominent application of the NLSE is in the description of supercontinuumgeneration where all the linear and nonlinear dispersion effects come together to induce spec-tacular spectral broadening of light, often over very short propagation distances (Dudley etal., 2006).For very high power applications, as motivated above, a further extension of the NLSE isrequired to deal with the multimode aspects of large-mode area fibres. A very general mul-timode framework has been presented recently allowing for arbitrary mode numbers, polar-isations, tight mode confinements and ultrashort pulses (Poletti & Horak, 2008). Here wedescribe a slightly simplified version that is more easily tractable and still is applicable tomany realistic situations, e.g., for the description of high power applications as discussed inthe later sections.We start by considering a laser pulse propagating in a multimode fibre. The pulse can be
written as the product of a carrier wave exp[i(β(0)0 z − ω0t)], where ω0 is the carrier angular
frequency and β(0)0 is its propagation constant in the fundamental fibre mode, and an envelope
function E(x, t) in space and time. Note that throughout this chapter we adopt the notationthat vectorial quantities are written in bold face and x = (x, y, z). For convenience, we assumeE(x, t) to be complex-valued, so that it includes the envelope phase as well as the amplitude,and we consider the pulse evolution in a reference frame moving with the group velocity ofthe fundamental mode, so that in the absence of dispersion a pulse would stay centred at timet = 0 throughout its propagation. Finally, we use units such that |E(x, t)|2 is the field intensityin W/m2. The envelope function can then be expanded into a superposition of individual

modes p = 0, 1, 2, ..., each represented by a discrete transverse fibre mode profile Fp(x, y) anda modal envelope Ap(z, t), as
E(x, t) = ∑p
Fp(x, y)[∫dx dy |Fp|2
]1/2 Ap(z, t). (1)
Note that |Ap(z, t)|2 gives the instantaneous power propagating in mode p in units of W,and that a simplified normalisation has been used compared to a more rigorous previousformulation (Poletti & Horak, 2008). The accuracy of this approximation improves as the fibrecore size is increased and the core-cladding index contrast is decreased, leading to guidedmodes with an increasingly negligible longitudinal component of polarisation.The multimode generalised nonlinear Schrödinger equation (MM-NLSE) is then given by thefollowing set of coupled equations to describe the dynamics of the mode envelopes,
∂Ap
∂z= D{Ap}
+in2ω0
c
(1 +
iω0
∂
∂t
)∑
l,m,n
{(1 − fR)SK
plmn Al Am A∗n + fRSR
plmn Al [h ∗ (Am A∗n)]
}.(2)
The following approximations have been applied here: (i) we have assumed that the Ramanresponse and the pulse envelope functions vary slowly on the time scale of a single cycle ofthe carrier wave, so that we can neglect a rapidly oscillating term, and (ii) an additional termrelated to the frequency dependence of the mode functions has been omitted, assuming thevariation of SK,R
plmn is slow compared to the 1/ω0 self-steepening term. In Eq. (2),
D{Ap} = i(β(p)0 −ℜ[β(0)0 ])Ap − (β
(p)1 −ℜ[β(0)1 ])
∂Ap
∂t+ i ∑
n≥2
β(p)nn!
(i
∂
∂t
)nAp (3)
yields the effects of dispersion of mode p with coefficients β(p)n = ∂nβ(p)/∂ωn. Here we al-
low for complex values of the modal propagation constants β(p) where the imaginary partdescribes mode and wavelength dependent losses; ℜ[..] denotes the real part only. The sec-ond line of (2) represents the effects of optical nonlinearity with a nonlinear refractive indexn2. The term ∝ ∂/∂t describes self-steepening and the two terms within the sum describeKerr and Raman nonlinearities. The Raman term contributes with a fraction fR to the overallnonlinearity ( fR = 0.18 for silica glass fibres) and contains the Raman mode overlap factors
SRplmn =
∫dx dy
[F∗
p · Fl][
Fm · F∗n][∫
dx dy |Fp|2∫
dx dy |Fl |2∫
dx dy |Fm|2∫
dx dy |Fn|2]1/2 (4)
as well as a convolution of the time dependent Raman response function h(t) with two modeamplitudes
[h ∗ (Am A∗n)](z, t) =
∫dτ h(τ)Am(z, t − τ)A∗
n(z, t − τ). (5)
The mode overlap factors responsible for the instantaneous Kerr effect are given by
SKplmn =
23
SRplmn +
13
∫dx dy
[F∗
p · F∗n][
Fm · Fl][∫
dx dy |Fp|2∫
dx dy |Fl |2∫
dx dy |Fm|2∫
dx dy |Fn|2]1/2 . (6)

Numerically, the mode functions of all the modes involved in the nonlinear effects under con-sideration are first evaluated at ω0 and a table of overlap integrals is calculated. The numberof modes and overlap integrals can be greatly reduced based on mode symmetry arguments(Poletti & Horak, 2008); all the applications discussed in the following will employ such re-duced sets of modes. Next, the dispersion curves for these modes are calculated. Finally,the system of equations (2) is integrated numerically using a standard symmetrised split-stepFourier method (Agrawal, 2001), where adaptive step size control is implemented by prop-agating the nonlinear operator using a Runge-Kutta-Fehlberg method (Press et al., 2006). Inorder to avoid numerical artifacts, we also found it necessary to further limit the maximumstep size to a fraction of the shortest beat length between all the modes considered. The accu-racy and convergence of the results is further checked by running multiple simulations withincreasingly small longitudinal step sizes.The framework presented above still allows for modes of arbitrary polarisation. In most prac-tical situations, however, one is interested in a subset of modes representing only a specificpolarisation state which is determined by the pump laser. The two most common cases arebriefly discussed in the following.
2.1 Circular polarisationUnder the weak guiding condition, modes fall into groups of LPmn modes containing eithertwo (m = 0) or four (m > 0) degenerate modes. Within each group, the modes can be com-bined into modes that are either σ+ or σ− circularly polarised at every point in the fibre. If thelight launched into the fibre is, for example, σ+ polarised, the form of the overlap integrals (4)and (6) guarantees that no light is coupled into the σ− polarised modes during propagationand those modes can therefore be eliminated entirely from the model. It is worth emphasis-ing that this is an exact result within the weak guiding limit. Using the properties of circularpolarisation vectors, the overlap integrals are then simplified to
SRplmn =
∫dx dy FpFl FmFn[∫
dx dy F2p∫
dx dy F2l∫
dx dy F2m∫
dx dy F2n]1/2 ,
SKplmn =
23
SRplmn, (7)
where the mode functions have been written as Fp = e+Fp for σ+ polarised modes with real-valued scalar mode functions Fp.
2.2 Linear polarisationThe situation is slightly more complicated in the case of linearly polarised pump light. In thiscase, nonlinear coupling between orthogonal polarisation modes is in principle allowed, lead-ing to, for example, birefringent phase matching and vector modulation instability (Agrawal,2001; Dupriez et al., 2007). However, for many practical situations where modes can be de-scribed as LPmn modes, if linearly polarised light is launched into the fibre, nonlinear couplingto orthogonal polarisation states is effectively so small that most of the pulse energy remainsin its original polarisation throughout the entire pulse propagation. This allows halving thenumber of modes to be considered in the model with significant computational advantage,and a simpler definition of the overlap factors (4) and (6). There are several important practi-cal situations where this approximation can be acceptable:

(i) For degenerate modes (no birefringence), the overlap factor (6) for four-wave mixing (FWM)between modes of parallel polarisation is three times larger than that for orthogonal polari-sation. Since the dispersion properties, and therefore the phase matching conditions, are thesame, nonlinear gain is much higher for the same polarisation and thus will dominate thedynamics.(ii) For few-moded fibres power transfer to orthogonal modes by FWM can be negligible ifeither the phase matching condition cannot be fulfilled at all, or if the phase matching condi-tion is achieved only for widely separated wavelength bands where the difference in groupvelocities limits the effective interaction length due to walk-off effects.In these situations one can therefore use an approximate theoretical description of pulse prop-agation by restricting the MM-NLSE to the LPmn modes of the fibre with the same linearpolarisation everywhere. Assuming real-valued x-polarised mode functions Fp = exFp, theoverlap integrals then reduce to
SRplmn = SK
plmn =
∫dx dy FpFl FmFn[∫
dx dy F2p∫
dx dy F2l∫
dx dy F2m∫
dx dy F2n]1/2 . (8)
A further simplification is also sometimes possible. If linearly polarised light is predominantlylaunched in an LP0n mode, power transfer into LPmn modes with m > 0 can only be initiatedby spontaneous FWM processes. By contrast, other LP0n modes of the same polarisation canbe excited by stimulated processes, see Sec. 3.1. Thus, if the dominant processes within thepulse propagation are stimulated ones, e.g., in the regime of high powers and relatively shortpropagation distances, the study can be effectively restricted to LP0n modes with the samepolarisation.
3. Supercontinuum generation in multimode fibres
One of the first applications where the MM-NLSE presented in the previous section can pro-vide deep insights is that of supercontinuum (SC) generation in multimode fibres. As alreadymentioned, the complex dynamic underlying SC generation in singlemode fibres is by now wellunderstood. Octave spanning SC in suitably designed fibres arises as a combination of vari-ous nonlinear phenomena, including soliton compression and fission, modulation instability,parametric processes, intrapulse Raman scattering, self phase modulation (SPM) and crossphase modulation (XPM) (Dudley et al., 2006). As the fibre diameter is increased though, asrequired for example to increase the SC power spectral density without destroying the fibre,the fibre starts to support multiple modes. Previous theoretical models were usually restrictedto two polarisation modes of a birefringent fibre (Agrawal, 2001; Coen et al., 2002; Lehtonen etal., 2003; Martins et al., 2007) or included a maximum of two spatially distinct modes (Dudleyet al., 2002; Lesvigne et al., 2007; Tonello et al., 2006). Using the full MM-NLSE, however, fibreswith arbitrary modal contents can be studied, for which a rich new list of intermodal nonlinearphenomena emerges, causing the transfer of nonlinear phase and/or power between selectedcombinations of modes (Poletti & Horak, 2009).In this section, using simulations of a specific few-moded fibre as an illustrative example, wewill discuss how modal symmetries and launch conditions can have a drastic influence onintermodal power transfer dynamics. For pump peak powers in the range of tens to hundredsof kW, if the nonlinear length of the pump pulses is shorter than the walk-off length betweenthe modes involved, significant power transfer into high-order modes with the appropriatesymmetry can occur, which can be beneficial, for example, to further extend the SC spectrum

to shorter wavelengths. Even if conditions for significant intermodal power transfer are notmet, it is found that intermodal XPM can still play a significant role in the SC dynamics bybroadening the spectrum of modes which would not otherwise present a significant spectralbroadening if pumped on their own.
400 800 1200 1600 2000-600
-400
-200
0
200
400
600
Wavelength (nm)
D (
ps/n
m/k
m)
M1 M2 M3 M4
M5 M6 M7
M1
M2
M3
M4
M5M6
M7
Fig. 1. GVD curves and transverse mode functions, calculated at 850nm, of the 7 circularlypolarised modes guided in a HF with Λ = 2.7µm and d = 2.5µm .
To discuss the intermodal nonlinear dynamics leading to SC generation we focus on a moder-ately multimoded holey fibre (HF) consisting of two rings of large circular air holes with pitchΛ = 2.7µm and relative hole size d/Λ = 0.93, surrounding a solid core with a diameter ofa few optical wavelengths (D = 2Λ − d = 2.9µm ), see Fig. 1. From 400nm to 2000nm thefibre supports 14 modes with effective areas ranging between 3.6 and 6.1µm2. To reduce thecomputational time it is possible to combine these modes into 7 pairs of circularly polarisedmodes and to exploit the forbidden power exchange between modes with opposite circularpolarisation (see Sec. 2.1), only to focus on the 7 right-handed circularly polarised modes M1,M2,..., M7 shown in Fig. 1. The group velocity dispersion (GVD) curves of these modes aresignificantly different from each other, with a first zero dispersion wavelength (ZDW) rangingfrom λ7 = 550nm for M7 to λ1 = 860nm for M1.
3.1 Effect of modal symmetries and launch conditions on intermodal power transferEquation (2) shows that the transfer of power between modes is mediated by FWM terms ofthe form SK
plmn Al Am A∗n, with l, m ̸= n. If only a single mode l is initially excited with a narrow
spectral line, the strongest power transfer to mode p and therefore the first to be observed inthe nonlinear process is the one controlled by degenerate FWM terms of the form SK
qlln Al Al A∗n.
If both modes p and n are initially empty, power transfer starts with a spontaneous FWM pro-cess and is therefore slow. If one of the generated photons is however returned into the pumpl by stimulated emission, the process becomes much faster and tends to dominate the nonlineardynamics in the limit of high-power pulse propagation over short distances. Interestingly,these SK
plll Al Al A∗l processes produce automatic phase-locking of mode p to the pump mode l,
similarly to what happens in non-phase matched second and third harmonic generation pro-cesses (Roppo et al., 2007). However, processes SK
plll require (i) that modes p and l belong tothe same symmetry class, and (ii) that they present a large overlap. For the HF under inves-tigation these conditions are only fulfilled for the two LP0n modes M1 and M6, and thereforeone would expect significant power transfer only between them.

(a)z =
7.5
mm
-80
-40
0
(b)
500 1050 1600
Wavelength (nm)
z =
30 m
m
500 1050 1600
-80
-40
0
Wavelength (nm)
M1
M6
M1
M6
M1M1
M2
M2
M3
M4
M3M4
M6
Fig. 2. Simulations of multimode nonlinear propagation in the HF of Fig. 1 after 7.5mm (toprow) and 30mm (bottom row), for a 100fs sech-shaped pump centred at 850nm. (a) Only M1is excited and (b) both M1 and M2 are excited with a 50kW peak power pulse.
This expected behaviour is indeed confirmed by the numerical simulation shown in Fig. 2(a),where a hyperbolic secant pump pulse with temporal profile Ap(0, t) =
√P0 sech(t/T0) with
T0 = 100fs (full width at half maximum 176fs) and centred at λp = 850nm is launched intoM1 only and propagated through 30mm of the HF. Here the pulse peak power P0 is set to50kW, corresponding to a 10nJ pulse and, for mode M1, to a soliton of order N = 166. As onewould expect from single mode SC theory (Dudley et al., 2006), besides SPM-induced spec-tral broadening, such a high-N pulse develops sidebands which grow spontaneously fromnoise, through an initial modulation instability (MI) process. The characteristic distance ofthis phenomenon LMI ∼ 16LNL = 16λ/(3πn2SK
1111P0) = 6.9mm correlates well with thesimulation results. As expected, of all the other 6 modes only M6 is significantly amplifiedat wavelengths around λp, and subsequently develops a wide spectral expansion and an iso-lated peak at 360nm. Further analysis of spectrograms and phase matching conditions indi-cates that this peak is a dispersive wave in M6, phase matched to a soliton in M1 and slowlyshifting to shorter wavelengths as the soliton red-shifts due to the effect of intrapulse Ramannonlinearity. Under these launching conditions the study can thus be restricted to the LP0nmodes of the fibre without loss of accuracy. Simulations also show that if either M2, M3, M4,M5 or M7 are selectively launched, no power is transferred to any of the other modes, andeach of them evolves as in the single mode case.When two or more modes contain a significant amount of power, they can all act as pumpsfor weaker modes. Moreover, if these modes belong to different symmetry classes, additionalFWM terms come into play, giving rise to a much richer phenomenology. As an example,Fig. 2(b) shows what happens when both M1 and M2 are simultaneously excited with a P0 =
50kW sech pulse. This pulse corresponds to an N = 27 soliton for M2, due to its much
larger value of β(2)2 at the pump wavelength. As a result, the SC generated in M2 has a more
temporally coherent nature, as it originates from soliton compression and fission mechanisms(the fission length Lfiss = N · LNL is around 16mm). Due to a shorter ZDW than M1, the finalSC in M2 also extends to much shorter wavelengths than the one in M1 (400nm versus 550nm,respectively), which can be one of the benefits of using multimode fibres for SC generation.Moreover, in addition to M6, also M3 and M4 are amplified from noise, generating a complexoutput spectrum, where the final relative magnitude of different modes is a strong function ofwavelength. This is reminiscent of early experimental results (Delmonte et al., 2006; Price etal., 2003).
3.2 Non-phase matched permanent intermodal power transferTo understand the complex dynamics of intermodal power transfer it is useful to refer to theapproximate analytical theory of cw pumped parametric processes, which neglects the effectsof GVD and pulse walk-off but still provides a valid reference (Stolen & Bjorkholm, 1982).Within this framework, parametric gain leading to exponential signal amplification requiresthe propagation constant mismatch ∆βplmn = β(l)(ωl) + β(m)(ωm)− β(p)(ωp)− β(n)(ωn) tobe smaller than a few times the average inverse nonlinear length 1/LNL = γP0.
0 0.1 0.2 0.3 0.4
100
101
102
103
104
105
Distance (mm)
Gai
n
0 1 2 3 40
100000
200000
Distance (mm)
Gai
n
M4
(a) (b)M4
M3M6
M7
M5M1/ M2
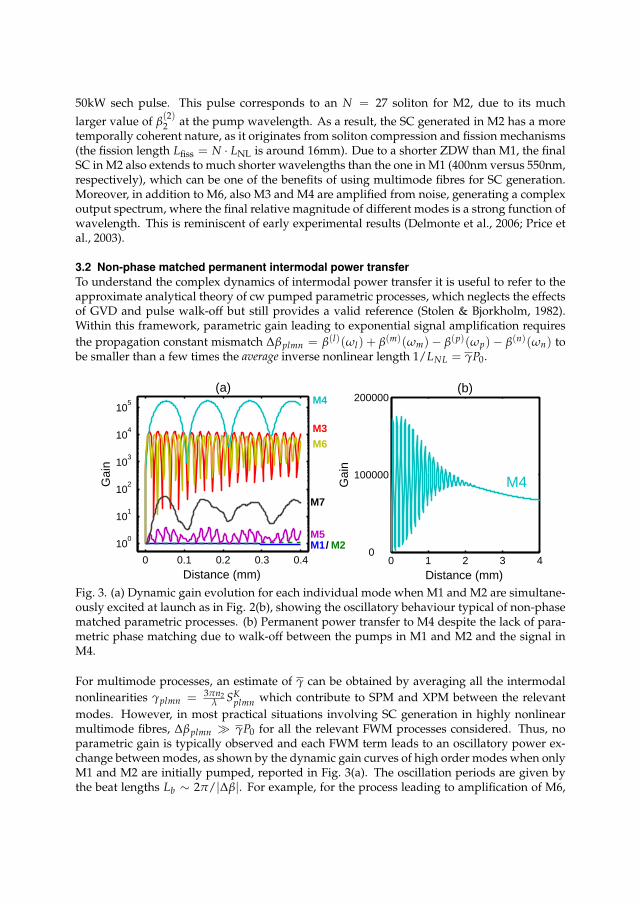
Fig. 3. (a) Dynamic gain evolution for each individual mode when M1 and M2 are simultane-ously excited at launch as in Fig. 2(b), showing the oscillatory behaviour typical of non-phasematched parametric processes. (b) Permanent power transfer to M4 despite the lack of para-metric phase matching due to walk-off between the pumps in M1 and M2 and the signal inM4.
For multimode processes, an estimate of γ can be obtained by averaging all the intermodalnonlinearities γplmn = 3πn2
λ SKplmn which contribute to SPM and XPM between the relevant
modes. However, in most practical situations involving SC generation in highly nonlinearmultimode fibres, ∆βplmn ≫ γP0 for all the relevant FWM processes considered. Thus, noparametric gain is typically observed and each FWM term leads to an oscillatory power ex-change between modes, as shown by the dynamic gain curves of high order modes when onlyM1 and M2 are initially pumped, reported in Fig. 3(a). The oscillation periods are given bythe beat lengths Lb ∼ 2π/|∆β|. For example, for the process leading to amplification of M6,

∆β6111 = 4.1 · 105 m−1, corresponding to a value of Lb = 15.3µm in agreement with the sim-ulation. For modes amplified by a cascade of intermodal FWM processes, such as M5 and M7in the example, the signature of multiple beating frequencies can be clearly observed.Despite the non-phase matched nature of most FWM processes, simulations show that afterlong enough propagation some power is permanently transferred into the weaker modes. Thisis shown, for example, in Fig. 3(b) extending the propagation distance of M4 from 0.4mm to4mm. A more detailed analysis excluding XPM and Raman effects found this behaviour tobe uniquely caused by the temporal walk-off between the pulses involved. The typical lengthscale of this permanent power transfer is therefore of the order of the walk-off length of all the
pulses involved, given by LpqW = T0/|1/v(p)
g − 1/v(q)g | = T0/|β(p)1 − β
(q)1 | for modes p and q.
For the example in Fig. 3(b), L12W = 3mm, L24
W = 2.4mm and L14W = 1.3mm, which correlate
well with the simulation.In conclusion, nonlinear intermodal power transfer is governed by two length scales, a beatlength leading to fast initial power oscillations and a walk-off length leading to permanentpower transfer. In order to observe in practice intermodal nonlinear effects, the nonlinearlength of the pump pulses must be shorter than the walk-off length, i.e., high peak powers arerequired. Otherwise, nominally multimode fibres can exhibit the same nonlinear behaviouras singlemode ones. Scaling a fixed fibre structure to larger core sizes allows for larger powerthroughput, but at the same time longer beat and walk-off lengths lead to much stronger modecoupling, and significant amounts of power can be transferred into higher order modes. Inthis case, as shown in Fig. 2, higher order modes may also serve to extend the SC spectralextension to much shorter wavelengths.
3.3 Effect of intermodal cross phase modulationIntermodal power transfer mediated by FWM terms, which can permanently exchange powerbetween modes even in the absence of proper phase matching, is not the only intermodalnonlinear effect which can occur in a multimode fibre. Intermodal XPM can also play a rolein significantly broadening the spectrum of a mode which would not undergo a significantspectral expansion if propagated on its own (Chaipiboonwong et al., 2007; Schreiber et al.,2005).To illustrate this phenomenon, we simulate the propagation of a pulse launched in M1 and/orM2 at 725nm, where M1 is in the normal dispersion region and M2 is in the anomalous region.In order to observe significant spectral expansion and intermodal effects within the distancewhere the pulses are temporally overlapped, we increase the input power up to a value ofP0 = 500kW, close to the estimated fibre damage threshold.Figs. 4(a) and (b) show that when M1 is individually launched, only some SPM-based spectralexpansion is visible, whereas if only M2 is launched, a wide MI-based SC develops. On theother hand, if the same input pulse is launched simultaneously in both modes as in Fig. 4(c),a much wider output spectrum is developed also in M1. Under these operating conditionsthe intermodal power transfer is negligible, as confirmed by nearly identical spectral resultsobtained when all SK
plmn and SRplmn coefficients responsible for intermodal FWM are set to
zero. Therefore, the increased spectral expansion in M1 must be generated by intermodalXPM effects alone. This is indeed confirmed by the simulation in Fig. 4(d), showing that whenall intermodal XPM effects are artificially switched off, M1 and M2 produce a very similarspectrum to that of their individual propagation.

−100
−50
0
Spe
ctru
m (
dB)
500 1200 1900−100
−50
0
Wavelength (nm)
Spe
ctru
m (
dB)
500 1200 1900Wavelength (nm)
(a) (b)
(d)(c)
Fig. 4. Spectral output after 2mm propagation in the HF of Fig. 1 of a T0 = 100fs and P0 =500kW sech pulse centred at 725nm and launched in: (a) M1 only (blue, solid line); (b) M2 only(green, dashed-dot line); (c) both M1 and M2, and (d) both M1 and M2 when all intermodalXPM coefficients are artificially set to zero. The input pulse is shown as a black dotted line.
4. Self-focusing in optical fibres in a modal picture
For laser powers larger than discussed in the previous section and into the MW regime, thenonlinear refractive index induced in the glass by the laser may become strong enough tointroduce significant spatial reshaping of the beam in the transverse direction. The refractiveindex of a material is given by n0 + n2 I, including both the linear, n0, and nonlinear term, n2,and where I is the position-dependent intensity of the laser. Thus, if the beam has a Gaussian-like transverse profile and the optical Kerr nonlinearity n2 is positive, as is the case in most ofthe commonly used transparent materials, the induced nonlinear refractive index is maximumat the centre of the beam and decreases towards the pulse edges. Therefore, the induced indexprofile forms a focusing lens, acting back on the laser beam itself. This effect is known asself-focusing and has been studied extensively in bulk materials for nearly 50 years (Askaryan,1962; Chiao et al., 1964). For input powers P below a critical power Pcrit, self-focusing is finallyovercome by the beam divergence. In the case of P > Pcrit, however, the pulse undergoescatastrophic collapse leading to permanent damage of the material (Gaeta, 2000). The criticalpower is given by
Pcrit = 1.86λ2
4πn0n2, (9)
where the numerical factor slightly depends on the beam profile in a bulk material (Fibich& Gaeta, 2000). Numerically, self-focusing in bulk media is most commonly modelled byslowly-varying envelope models or, more accurately, by a nonlinear envelope equation (NEE)describing the dynamics of the transverse beam profile Φ(x, t) (Brabec & Krausz, 1997; Ranka& Gaeta, 1999),
∂
∂zΦ = Dmat{Φ}+ i
2β0
(1 +
iω0
∂
∂t
)−1∇2
⊥Φ + in2n0ω0
2π
(1 +
iω0
∂
∂t
)|Φ|2Φ, (10)

where Dmat{Φ} is a dispersion term similar to (3) describing the effect of material dispersionand ∇2
⊥ is the transverse Laplace operator. The NEE incorporates many features similar tothe MM-NLSE (2), e.g., higher order dispersion, Kerr nonlinearity and self-steepening terms.However, even in the presence of rotational symmetry, the envelope function Φ is a two-dimensional object (radial and temporal coordinate), in contrast to the MM-NLSE which onlyuses a finite number of one-dimensional (temporal) envelope functions to describe the samesituation. If the number of modes is small, the MM-NLSE is thus computationally signifi-cantly more efficient, both in terms of reduced memory requirements and faster dynamicssimulation.It is now well established that the same process of self-focusing occurs in optical waveguidesand fibres and that the same power threshold for catastrophic collapse applies (Farrow et al.,2006; Gaeta, 2000). However, for powers below Pcrit the observed light propagation behaviouris qualitatively different from that observed in bulk media, since here the light is additionallybound by total internal reflection at the core-cladding interface, which can lead to additionalspatial and temporal interference and dispersion effects, such as periodic oscillations of thebeam profile or catastrophic pulse collapse even when the launched peak power is belowthe critical value. In this section we will discuss these effects within the framework of theMM-NLSE, which leads to an easy understanding of fibre-based self-focusing within a modalpicture (Horak & Poletti, 2009; Milosevic et al., 2000). Such an interpretation is particularlyuseful in the context of high-power fibre lasers, which now achieve peak powers close to thecritical power with pulse lengths approaching the nanosecond regime (Galvanauskas et al.,2007).
4.1 Continuous wave limitWe start our discussion with the case of cw propagation, which in practice is also a goodapproximation to the behaviour of long pulses (ps to ns regime) near the pulse peak, and usethe MM-NLSE restricted to the linearly polarised LP0n modes, as discussed in Sec. 2.2. TheMM-NLSE thus reduces to
∂Ap
∂z= i(β
(p)0 − β
(0)0 )Ap + i
n2ω0c ∑
l,m,nSK
plmn Al Am A∗n (11)
with SKplmn given by (8). Specifically, we assume propagation in a short piece of a step-index
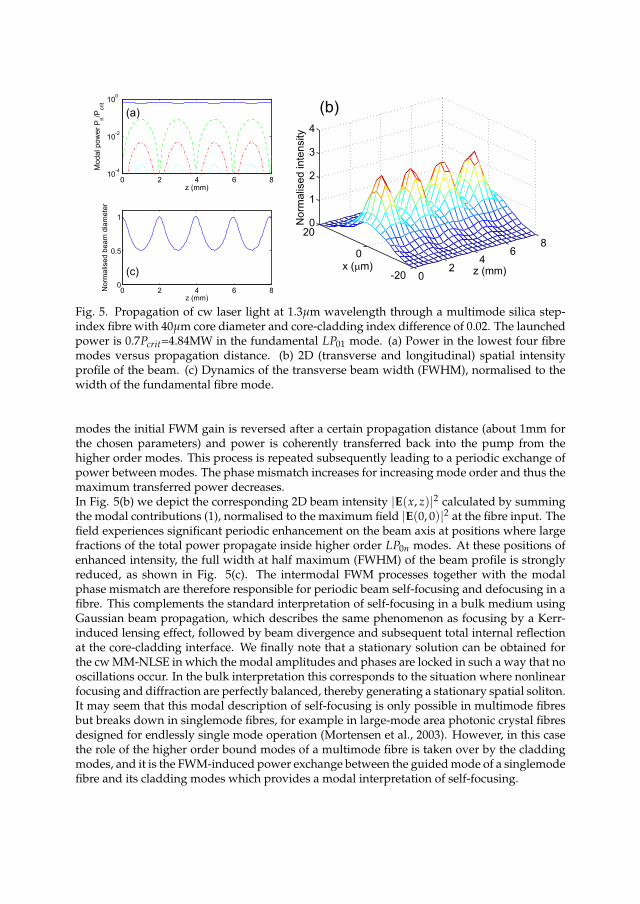
fibre with a pure silica core of 40µm diameter and a refractive index step of 0.02 betweencore and cladding. This fibre is similar to photonic crystal large-mode area fibres which arecommercially available, where the index step has been increased such that the fibre supportseight LP0n modes. The zero-dispersion wavelength of this fibre is at 1.26µm, and we assumea pump laser operating at 1300nm wavelength. The critical power (9) for silica at this wave-length is Pcrit = 5.9MW. Note that at this power level pulses up to approximately 100ps lengthcan be transmitted through the fibre without fibre damage (Stuart et al., 1996).Figure 5 shows the dynamics of light propagation along this fibre when cw light is launchedinto the fundamental LP01 mode with a power of 0.7Pcrit=4.84MW. The curves in Fig. 5(a)show the power |Ap|2 in the lowest order modes obtained by solving Eq. (11). Power fromthe fundamental mode is quickly transferred over sub-mm propagation distances into higherorder modes by FWM processes, most prominently by induced FWM involving three pumpphotons as described by terms of the form ∂Ap/∂z ∝ iA2
0 A∗0 , see Sec. 3.1. However, be-
cause of the phase mismatch β(p)0 − β
(0)0 between the fundamental mode and the higher order
02
46
8
-20
0
200
1
2
3
4
z (mm)x (mm)
(b)
No
rma
lise
d in
ten
sity
0 2 4 6 80
0.5
1
z (mm)
Norm
alis
ed b
eam
dia
mete
r
(c)
0 2 4 6 810
-4
10-2
100
z (mm)
Mo
da
l p
ow
er
Pn/P
crit
(a)
Fig. 5. Propagation of cw laser light at 1.3µm wavelength through a multimode silica step-index fibre with 40µm core diameter and core-cladding index difference of 0.02. The launchedpower is 0.7Pcrit=4.84MW in the fundamental LP01 mode. (a) Power in the lowest four fibremodes versus propagation distance. (b) 2D (transverse and longitudinal) spatial intensityprofile of the beam. (c) Dynamics of the transverse beam width (FWHM), normalised to thewidth of the fundamental fibre mode.
modes the initial FWM gain is reversed after a certain propagation distance (about 1mm forthe chosen parameters) and power is coherently transferred back into the pump from thehigher order modes. This process is repeated subsequently leading to a periodic exchange ofpower between modes. The phase mismatch increases for increasing mode order and thus themaximum transferred power decreases.In Fig. 5(b) we depict the corresponding 2D beam intensity |E(x, z)|2 calculated by summingthe modal contributions (1), normalised to the maximum field |E(0, 0)|2 at the fibre input. Thefield experiences significant periodic enhancement on the beam axis at positions where largefractions of the total power propagate inside higher order LP0n modes. At these positions ofenhanced intensity, the full width at half maximum (FWHM) of the beam profile is stronglyreduced, as shown in Fig. 5(c). The intermodal FWM processes together with the modalphase mismatch are therefore responsible for periodic beam self-focusing and defocusing in afibre. This complements the standard interpretation of self-focusing in a bulk medium usingGaussian beam propagation, which describes the same phenomenon as focusing by a Kerr-induced lensing effect, followed by beam divergence and subsequent total internal reflectionat the core-cladding interface. We finally note that a stationary solution can be obtained forthe cw MM-NLSE in which the modal amplitudes and phases are locked in such a way that nooscillations occur. In the bulk interpretation this corresponds to the situation where nonlinearfocusing and diffraction are perfectly balanced, thereby generating a stationary spatial soliton.It may seem that this modal description of self-focusing is only possible in multimode fibresbut breaks down in singlemode fibres, for example in large-mode area photonic crystal fibresdesigned for endlessly single mode operation (Mortensen et al., 2003). However, in this casethe role of the higher order bound modes of a multimode fibre is taken over by the claddingmodes, and it is the FWM-induced power exchange between the guided mode of a singlemodefibre and its cladding modes which provides a modal interpretation of self-focusing.

0 0.2 0.4 0.6 0.8 10
0.2
0.4
0.6
0.8
1
Launched power P/Pcrit
Nor
mal
ised
min
imum
bea
m d
iam
eter
8 modes6 modes3 modes2 modesNEE
Fig. 6. Minimum beam diameter during the first period of self-focusing oscillation under cwpumping vs pump power for the same fibre parameters as in Fig. 5. The curves correspondto MM-NLSE simulations involving the lowest 2, 3, 6 modes only, and all 8 LP0n modes (fromtop to bottom). The crosses indicate simulation results using the nonlinear envelope equation.
Using only a finite number of modes in the simulation of the MM-NLSE necessarily limitsthe transverse spatial resolution that can be achieved by this method. For example, the LP0nmode function exhibits n maxima and n − 1 zeros along the radial direction within the fibrecore region. With simulations using n different modes one can therefore expect a maximumresolution of the order of R/n where R is the core radius. Simulations with pump powersapproaching the critical power Pcrit will thus require a larger number of modes in order tocorrectly describe the increasingly small minimum beam diameter. We investigate this be-haviour in Fig. 6. Here we show the minimum beam diameter achieved during the first periodof self-focusing and diffraction, i.e., at approximately 1mm of propagation for the parametersof Fig. 5, when the MM-NLSE is restricted to different numbers of modes. For clarity, thebeam diameter is normalised to the diameter of the launched beam (LP01 mode). We observethat simulations with 2, 3, and 6 modes are accurate up to pump powers of approximately0.2Pcrit, 0.4Pcrit, and 0.8Pcrit, respectively, compared to simulations involving all 8 bound fibremodes of this sample fibre. For comparison, we also show the results of the NEE beam propa-gation method (10). This confirms the accuracy of the MM-NLSE with 8 modes up to 0.95Pcritcorresponding to a nearly five-fold spatial compression of the beam.For the simulations shown in Fig. 6 we used the same 4th-5th order Runge-Kutta integra-tion method with adaptive step size control (MATLAB R2010b by MathWorks, Inc.) for boththe MM-NLSE and the NEE. Each data point required approximately 0.9s of CPU time on astandard desktop computer with the 8-mode MM-NLSE and <0.2s with 6 modes. In contrast,the corresponding NEE simulations with 1024 radial grid points required 101s, that is, two tothree orders of magnitude slower than the MM-NLSE.
4.2 Short pulse propagationNext, we consider the propagation of short pulses in the regime of peak powers close to thecritical power, where in addition to transverse spatial effects the pulse may exhibit complextemporal dynamics related to intermodal and intramodal dispersion, self-steepening and non-linear effects. As an example we consider sech-shaped pulses with a temporal FWHM of 100fs

launched with a peak power of 0.8Pcrit into the fundamental mode of the multimode fibre con-sidered above. The pump wavelength is again set to 1.3µm. The simulations discussed in thefollowing used a 6-mode MM-NLSE with 2048 temporal grid points solved with a split-stepFourier method (Poletti & Horak, 2008; 2009).
−0.1 −0.05 0 0.05 0.1 0.150
0.2
0.4
0.6
0.8
1
0.5
1
1.5
Time t (ps)
Pow
er P
/Pcr
it
FW
HM
(a)
z=1mm
−0.1 −0.05 0 0.05 0.1 0.150
0.2
0.4
0.6
0.8
1
0.5
1
1.5
Time t (ps)P
ower
P/P
crit
F
WH
M
(b)
z=2mm
Fig. 7. Propagation of a 100fs sech-shaped pulse with 0.8Pcrit peak power at 1.3µm wave-length with the same fibre parameters as in Fig. 5 after (a) 1mm and (b) 2mm of propagation.The bottom part of the figure shows the overall temporal pulse profile (thick solid line) aswell as its contributions from the fundamental mode (thin solid), first (dashed) and second(dash-dotted) higher order modes. The top part of the figure shows the spatial FWHM beamdiameter along the pulse, normalised to the FWHM of the fundamental mode.
The initial dynamics of the pulse propagation are shown in Fig. 7. After 1mm of propagation,Fig. 7(a), a significant amount of power has been transferred from the fundamental mode intothe higher order modes, leading to a transverse beam focusing to approximately 40% of theinput beam width. The transverse beam size depends on the pulse power and thus variesalong the pulse shape: the beam diameter is smallest near the temporal peak of the pulse, butremains unchanged in the trailing and leading edges where the power is low. Propagatingfurther to 2mm, Fig. 7(b), most of the power has been converted back into the fundamentalmode, similar to the cw case of Fig. 5. However, the transfer is not complete and is notuniform along the pulse. This is related to the walk-off of the higher order modes because ofintermodal dispersion as well as a slight dependence of the beam oscillation period on power.Therefore, the spatial FWHM of the beam at 2mm propagation length is below that of thefundamental mode in some parts of the pulse while it exceeds it in other parts.Continuing the propagation of Fig. 7, the spatial beam variations persist, but the deviationsfrom a simple oscillation become more prominent. This is shown clearly in Fig. 8(a) in thebeam properties after 7mm of propagation. At this point the initial sech-shaped temporalprofile has steepened on the trailing edge and an ultrashort pulse peak is forming due to theinterference of the modal contributions. In particular, the first high order mode exhibits asimilar power level as the fundamental mode. Simultaneously, the beam diameter is stronglyreduced. At 7.4mm of propagation, Fig. 8(b), this peak has narrowed further and reachesthe critical power for catastrophic collapse while the beam diameter has reduced to 20% ofthe fundamental mode. For even longer propagation lengths the simulations show the pulsebreaking up into many ultrashort high-intensity parts around this initial instability, howeverthe MM-NLSE with 6 modes becomes invalid at this point due to its limited spatial and tem-poral resolution. Simulations with the MM-NLSE restricted to the fundamental mode reveal

−0.1 −0.05 0 0.05 0.1 0.150
0.2
0.4
0.6
0.8
1
0.5
1
1.5
Time t (ps)
Pow
er P
/Pcr
it
FW
HM
(a)
z=7mm
−0.1 −0.05 0 0.05 0.1 0.150
0.2
0.4
0.6
0.8
1
0.5
1
1.5
Time t (ps)
Pow
er P
/Pcr
it
FW
HM
(b)
z=7.4mm
Fig. 8. Continuation of the pulse propagation of Fig. 7 to (a) 7mm and (b) 7.4mm of fibrelength exhibiting simultaneous spatial and temporal collapse.
only a very small amount of pulse reshaping due to self-steepening over this propagationdistance (a shift of the pulse peak by about 10fs) and exhibit none of the complex dynamicsseen in Fig. 8. We therefore conclude that the simultaneous spatial and temporal collapse ofthe pulse observed here is a pure multimode effect, driven by FWM-based power exchangetogether with modal dispersion and self-steepening, in agreement with investigations basedon beam propagation methods (Zharova et al., 2006).
5. Multimode effects in gas-filled waveguides
As discussed above, the peak power that can be transmitted in optical fibres is limited by thecritical power for self-focusing and catastrophic collapse to levels of a few MW. According toEq. (9), for a fixed laser wavelength Pcrit only depends on the material linear and nonlinearrefractive index. In general, the linear refractive index does not vary much across transparentmedia, between 1 for vacuum and ∼4 for some non-silica glasses (Price et al., 2007) and semi-conductors, whereas the nonlinear index n2 can span many orders of magnitude. A commonmethod for guiding extremely high power pulses is thus in hollow-core capillaries or fibres,where most of the light propagates in a gas. For example, n2 ≈ 5 × 10⁻²³ m2/W in air, com-pared to 2.5× 10⁻²⁰ m2/W in silica glass, thus pushing Pcrit into the GW regime. In contrast tosolid-core fibres, gas-filled capillaries do not support strictly bound modes, but all modes areintrinsically leaky with losses scaling proportional to λ2/R3 where λ is the light wavelengthand R is the radius of the capillary hole (Marcatili & Schmeltzer, 1964). Hence, the capillaryhole must be sufficiently large in order to allow for transmission of light over long distances.For example, 800nm wavelength light propagating in the fundamental LP01 mode of a sil-ica glass capillary with a 75µm radius hole experiences losses of ∼3dB/m. For such a largehole compared to the laser wavelength, the capillary is multimoded, and this is the situationwe will consider in the following. It should be noted, however, that single-mode guidancein hollow-core fibres is in principle possible using bandgap effects in photonic crystal fibres(Knight et al., 1998; Petrovich et al., 2008).Using fs pulses at 800nm wavelength from commercial Ti:sapphire laser systems it is possibleto reach peak powers large enough to observe nonlinear effects, and even self-focusing, ingases. Capillary guidance is used in this context for several high-power applications. One ofthese is pulse compression, where the nonlinearity of the gas in the capillary is exploited to

spectrally broaden a pulse by self-phase modulation, which allows the pulse to be compressedafter the capillary by purely dispersive means such as gratings or dispersive mirrors (Sartaniaet al., 1997). For intensities above ∼1013W/cm2, the electric field of the laser is large enough tostart ionising the gaseous medium. The generated plasma exhibits a negative refractive index,which can counteract the self-focusing effect of the neutral gas and lead to pulse filamentation(Couairon & Mysyrowicz, 2007). In another application, ionisation and recombination effectsare used for high harmonic generation of XUV and soft X-ray radiation, processes whose effi-ciencies can be enhanced significantly by phase matching techniques in capillaries (Rundquistet al., 1998).In the following we will therefore discuss how the MM-NLSE can be extended to includethese important effects and demonstrate a few sample effects related to the multimode natureof hollow capillaries typically used for such high-power applications.
5.1 Ionisation and plasma effects in the multimode nonlinear Schrödinger equationThe starting point for this derivation is the capability of high-intensity light to ionise the gasinside the capillary. Two effects contribute to the ionisation: (i) direct multiphoton ionisation,where several photons are absorbed simultaneously to eject one electron from its orbit, and(ii) tunneling ionisation, where the electric field of the laser is so strong that it deforms theelectric potential of the nucleus and allows an electron to tunnel through the potential barrier.Tunneling ionisation occurs at higher field strengths than multiphoton ionisation, and is thedominant process for the effects we want to discuss here. The rate of tunneling ionisation Wcan be calculated using Keldysh theory (Popov, 2004) as
W(x, t) = W0κ2√
3π
C2κl2
2n∗F(x, t)1.5−2n∗
exp(− 2
3F(x, t)
), (12)
where κ2 = Ip/IH is the ratio of the ionisation potential Ip of the gas species over the ionisationpotential for hydrogen IH = 13.6eV, W0 = mee4/h̄3 = 4.13× 10¹⁶s−1, F(x, t) = E′(x, t)/(κ3Ea)is the reduced electric field of the laser with Ea = 5.14 × 10¹¹V/m the atomic unit of fieldintensity and E′(x, t) the real-valued electric field in units of V/m corresponding to E(x, t),Eq. (1). The dimensionless parameters Cκl and n∗ are specific for the gas and can be lookedup in tables (Popov, 2004). For the case of argon, which we will use as our example here, wehave Ip = 15.76eV, Cκl = 0.95, and n∗ = 0.929.Given the modal amplitudes Ap(z, t) we can calculate the electric field E(x, t) and thus theionisation rate W(x, t) at every point and time in the capillary. From this we obtain the fractionof neutral atoms r0(x, t) and the fraction of ionised atoms r1(x, t) = 1 − r0(x, t) by solving
∂r0(x, t)∂t
= −W(x, t)r0(x, t). (13)
The generated plasma modifies the refractive index of the gas to
n(x, t) =
√1 −
ωpl(x, t)2
ω2 , (14)
where the plasma frequency is given by
ωpl(x, t) =
√ρr1(x, t)e2
meϵ0. (15)

Here ρ is the gas density and e and me are the electron charge and mass, respectively. TheMM-NLSE thus aquires a new nonlinear term ∂Ap(z, t)/∂z ∝ Npl{Ap} with
Npl{Ap} = −(
1 − iω0
∂
∂t
)i2
k0
∫dxdy
Fp(x, y)∗ · E(x, t)[∫dx dy |Fp|2
]1/2
ωpl(x, t)2
ω20
, (16)
which includes a self-steepening correction term and the projection of the modified laser fieldonto mode p via a spatial overlap integral.In addition to the effect of the plasma induced refractive index, we also have to consider theloss of energy from the propagating laser pulse due the ionisation process itself (Courtois etal., 2001). In the modal decomposition, this leads to a nonlinear loss term in the propagationof the mode envelope Ap of the form
Lion{Ap} = −12
∫dxdy
Fp(x, y)∗ · E(x, t)[∫dx dy |Fp|2
]1/2
ρr0(x, t)W(x, t)Ip
|E(x, t)|2 . (17)
The full MM-NLSE in the presence of gas ionisation by tunneling in the strong-field limit thusbecomes (Chapman et al., 2010)
∂Ap
∂z= D{Ap}+N{Ap}+Npl{Ap}+ Lion{Ap} (18)
where the individual terms are given by (2), (3), (16) and (17).
5.2 Ultrashort pulse propagation in capillariesIn the following we present simulation results of the extended MM-NLSE (18) for a specificexperimental situation (Froud et al., 2009). In particular, we consider a 7cm long capillary witha 75µm radius hole filled with argon at a pressure of 80mbar in the central 3cm of the capillary;the Ar pressure tapers down over 2cm to 0mbar at the input and output. Laser pulses of 40fslength at 780nm wavelength are launched with a Gaussian waist of 40µm centred into thecapillary. For the simulations, 20 linearly polarised LP0n modes are considered, as discussedin Sec. 2.2.Results from two sets of simulations with different launched pulse energies, 0.5mJ and 0.7mJ,respectively, are presented in Fig. 9. The distribution of Ar+ ions in the capillary is shownin Figs. 9(a) and (b). As expected, ionisation mainly occurs on axis where the laser intensityis maximum. Moreover, because the transverse beam size of the launched laser pulses is notideally matched to the fundamental mode of the capillary, power is also coupled into the firsthigher order mode, which leads to mode beating and thus to the periodic ionisation patternalong the capillary length with a periodicity of ∼2cm, observed most clearly at lower powers,Fig. 9(a). At higher powers, the nonlinear ionisation processes become much stronger and aspate of additional radial and longitudinal structures are found in the ionisation pattern, Fig.9(b). In Fig. 9(c) the partial Ar+ pressures of (a) and (b) are averaged over the transverse crosssection of the capillary. The distribution shown in this figure can be easily verified experi-mentally as it is proportional to the intensity of the Ar+ ion fluorescence observed at 488nm(Chapman et al., 2010; Froud et al., 2009). Finally, in Fig. 9(d) the pulse energy summed overall modes is presented versus the propagation distance for these two simulations. The effectof propagation losses due to ionisation, described by the term Lion{Ap} in Eq. (17), is clearlyvisible with strong losses associated with the peaks of large ionisation in Fig. 9(c). Because

0 1 2 3 4 5 6 70
25
50
75R
adiu
s (
mm
)
Propagation distance z (cm)
20
0
-20
(a)
0 1 2 3 4 5 6 70
25
50
75
Radiu
s (
mm
)
Propagation distance z (cm)
20
0
-20
(a)(b)
0 1 2 3 4 5 6 70
0.5
1
1.5
2
Propagation distance z (cm)
Avera
ged ion p
ressure
(m
bar) (c)
0.7mJ pump
0.5mJ pump
0 1 2 3 4 5 6 70.4
0.5
0.6
0.7
Propagation distance z (cm)
Puls
e e
nerg
y (
mJ)
(d)0.7mJ pump
0.5mJ pump
Fig. 9. Propagation of 40fs pulses at 780nm wavelength in a hollow-core capillary (length 7cm,hole radius 75µm) filled with argon with partial ionisation. (a), (b) Partial pressure of Ar+ ions(in dB of mbar) vs position z and radius r inside the capillary for launched pulse energies of0.5mJ and 0.7mJ, respectively. (c) Ar+ pressure averaged over the capillary cross section vs z.(d) Corresponding integrated pulse energy vs z. The total gas pressure in the capillary centreis 80mbar.
of the highly nonlinear nature of tunneling ionisation, losses at slightly higher input energies(0.7mJ instead of 0.5mJ) are several times larger.The spatial and temporal distribution of ions generated by the propagating laser pulse actsback on the pulse through its (negative) refractive index, according to the term Npl{Ap} givenin Eq. (16). Because of the strong localisation of the regions with high ionisation, differentcapillary modes are affected differently resulting in strong intermodal scattering and mode-specific spectral broadening, as is demonstrated in Fig. 10. At a relatively low pulse energyof 0.3mJ where ionisation is weak, a slight blue-shift of the spectral contribution of the excitedLP02 mode is observed, but no higher order mode excitation. Increasing the pulse energy to0.5-0.7mJ, more and more light is scattered into higher order modes. Moreover, the spectrumfirst develops a small peak at the long-wavelength side of the pump (790-800nm) and then avery broad and high-intensity shoulder at short wavelengths. It is interesting to note that theseshort wavelength parts of the spectrum are more pronounced in the higher order modes LP02and LP03 of the capillary, in fact they contain more power than the fundamental mode at thesewavelengths for launched pulse energies above 0.6mJ. This finding has again been confirmedby experiments, where a strong position-dependence of the spectrum was observed in the farfield beyond the capillary (Chapman et al., 2010).These selected results demonstrate clearly that mode interference and mode coupling, i.e.,transverse spatial effects, play a significant role in the propagation of high-intensity laserpulses in regimes where ionisation becomes important. This also impacts other applicationsof such systems, for example the angular dependence of high harmonic generation as recentlyobserved in a capillary-based XUV source (Praeger et al., 2007).

0
5
10
15S
pe
ctr
um
(m
J/n
m)
0.3mJAll modes
LP01
LP02
LP03
0.5mJ
650 700 750 8000
5
10
Wavelength (nm)
Sp
ectr
um
(m
J/n
m)
0.6mJ
650 700 750 800Wavelength (nm)
0.7mJ
Fig. 10. Pulse spectra and modal contributions at the capillary output for launched pulseenergies in the range 0.3mJ to 0.7mJ. Other parameters as in Fig. 9.
6. Conclusions and outlook
To summarise, we presented an analysis of nonlinear effects of short laser pulses propagatingin multimode optical fibres. We developed a general theoretical framework which is basedon the modal decomposition of the propagating light and takes the form of a multimodegeneralised nonlinear Schrödinger equation. This approach provides new insights into thesignificance of fibre properties, e.g., modal dispersion and mode overlaps, for nonlinear pulsepropagation, and for moderately multimode fibres and waveguides it has been shown to benumerically significantly more efficient than beam propagation methods. We subsequentlydiscussed several applications of the model covering laser peak powers in the kW (super-continuum generation), MW (self-focusing effects) and GW regime (ionisation and plasmanonlinearities) highlighting the importance of multimode effects throughout.While we focused our discussion here on the high-power regime, we emphasise that thereis also rapidly growing interest in the application of multimode fibres at low, W-level peakpowers. A fast emerging area of interest comes, for example, from optical telecommunica-tions, where in an attempt to increase the fibre capacity researchers are now considering theuse of several fibre modes, or several cores within a single fibre, as independent channels.Intermodal nonlinear effects are expected to pose an ultimate limit to the maximum infor-mation capacity of the link, which we believe could be estimated by simulations using ourmodel. Various sensing and imaging applications can also benefit from multimode fibres.Moreover, new sources in the mid-IR spectral region are currently being developed for spec-troscopy and sensing applications that require novel waveguides such as soft glass fibres orsemiconductor-based waveguides and fibres, some of which are intrinsically multimoded atnear-IR pump wavelengths. We therefore expect that the multimode nonlinear Schrödingerequation discussed in this work will provide a valuable tool in the analysis and investigationof many future photonics applications.
7. Acknowledgements
The authors acknowledge financial support by the U.K. Engineering and Physical SciencesResearch Council (EPSRC) and the Royal Society. We thank Prof. D. J. Richardson, Dr. W. S.Brocklesby, and Prof. J. G. Frey for valuable discussions.

8. References
Agrawal, G. P. (2001). Nonlinear Fiber Optics, 3rd ed., Academic Press, San Diego, USA.Askaryan, G. A. (1962). Effects of the gradient of strong electromagnetic beam on electrons
and atoms, Sov. Phys. JETP, Vol. 15, 1088–1090.Blow, K. J., & Wood, D. (1989). Theoretical description of transient stimulated Raman scatter-
ing in optical fibers. IEEE J. Quantum Electron., Vol. 25, No. 12, 2665–2673.Brabec, T., & Krausz, F. (1997). Nonlinear optical pulse propagation in the single-cycle regime.
Phys. Rev. Lett., Vol. 78, No. 17, 3282–3285.Chaipiboonwong, T., Horak, P., Mills, J. D., & Brocklesby, W. S. (2007). Numerical study of
nonlinear interactions in a multimode waveguide. Opt. Expr. Vol. 15, 9040–9047.Chapman, R. T., Butcher, T. J., Horak, P., Poletti, F., Frey, J. G., & Brocklesby, W. S. (2010). Modal
effects on pump-pulse propagation in an Ar-filled capillary. Opt. Expr., Vol. 18, No.12, 13279–13284.
Chiao, R. Y., Garmire, E., & Townes, C. H. (1964). Self-trapping of optical beams. Phys. Rev.Lett., Vol. 13, No. 15, 479–482.
Coen, S., Chau, A. H. L., Leonhardt, R., Harvey, J. D., Knight, J. C., Wadsworth, W. J., &Russell, P. St. J. (2002). Supercontinuum generation by stimulated Raman scatteringand parametric four-wave mixing in photonic crystal fibers. J. Opt. Soc. Am. B, Vol.19, No. 4, 753–764.
Couairon, A., & Mysyrowicz, A. (2007). Femtosecond filamentation in transparent media.Phys. Rep., Vol. 441, 47–189.
Courtois, C., Couairon, A., Cros, B., Marquès, J. R., & Matthieussent, G. (2001). Propagationof intense ultrashort laser pulses in a plasma filled capillary tube: Simulations andexperiments. Phys. Plas., Vol. 8, No. 7, 3445–3456.
Delmonte, T., Watson, M. A., O’Driscoll, E. J., Feng, X., Monro, T. M., Finazzi, V., Petropoulos,P., Price, J. H. V., Baggett, J. C., Loh, W., Richardson, D. J., & Hand, D. P. (2006).Generation of mid-IR continuum using tellurite microstructured fiber. Conference onLasers and Electro-Optics, paper CTuA4, Long Beach, USA.
Dudley, J. M., Provino, L., Grossard, N., Maillotte, H., Windeler, R. S., Eggleton, B. J., &Coen, S. (2002). Supercontinuum generation in air-silica microstructured fibers withnanosecond and femtosecond pulse pumping. J. Opt. Soc. Am. B, Vol. 19, No. 4, 765–771.
Dudley, J. M., Genty, G., & Coen, S. (2006). Supercontinuum generation in photonic crystalfiber. Rev. Mod. Phys., Vol. 78, No. 4, 1135–1184.
Dupriez, P., Poletti, F., Horak, P., Petrovich, M. N., Jeong, Y., Nilsson, J., Richardson, D. J.,& Payne, D. N. (2007). Efficient white light generation in secondary cores of holeyfibers. Opt. Expr., Vol. 15, No. 7, 3729–3736.
Farrow, R. L., Kliner, D. A. V., Hadley, G. R., & Smith, A. V. (2006). Peak-power limits on fiberamplifiers imposed by self-focusing. Opt. Lett., Vol. 31, No. 23, 3423–3425.
Fibich, G., & Gaeta, A. (2000). Critical power for self-focusing in bulk media and in hollowwaveguides. Opt. Lett., Vol. 25, No. 5, 335–337.
Froud, C. A., Chapman, R. T., Rogers, E. T. F., Praeger, M., Mills, B., Grant-Jacob, J., Butcher,T. J. , Stebbings, S. L., de Paula, A. M., Frey, J. G., & Brocklesby, W. S. (2009). Spatiallyresolved Ar∗ and Ar+∗ imaging as a diagnostic for capillary-based high harmonicgeneration. J. Opt. A, Vol. 11, 054011.
Gaeta, A. (2000). Catastrophic collapse of ultrashort pulses. Phys. Rev. Lett., Vol. 84, No. 16,3582–3585.

Galvanauskas, A., Cheng, M.-Y., Hou, K.-C., Liao, K.-H. (2007). High peak power pulse am-plification in large-core Yb-doped fiber amplifiers. IEEE J. Sel. Top. Quantum Electron.,Vol. 13, No. 3, 559–566.
Hasegawa, A., & Tappert, F. (1973). Transmission of stationary nonlinear optical pulses indispersive dielectric fibers. I. Anomalous dispersion. Appl. Phys. Lett., Vol. 23, No. 3,142–144.
Horak, P., & Poletti, F. (2009). Effects of pulse self-focusing on supercontinuum generationin multimode optical fibers. International Conference on Transparent Optical Networks,Ponta Delgada, Portugal, 28 June - 2 July 2009.
Jeong, Y., Sahu, J. K., Payne, D. N., & Nilsson, J. (2004). Ytterbium-doped large-core fiber laserwith 1.36 kW continuous-wave output power. Opt. Expr., Vol. 12, No. 25, 6088–6092.
Kao, K. C., & Hockham, G. A. (1966). Dielectric-fibre surface waveguides for optical frequen-cies. Proc. IEE, Vol. 113, No. 7, 1151–1158.
Knight, J. C., Broeng, J., Birks, T. A., & Russell, P. St. J. (1998). Photonic band gap guidance inoptical fibers. Science, Vol. 282, 1476–1478.
Lehtonen, M., Genty, G., Ludvigsen, H., & Kaivola, M. (2003). Supercontinuum generation in ahighly birefringent microstructured fiber. Appl. Phys. Lett., Vol. 82, No. 14, 2197–2199.
Lesvigne, C., Couderc, V., Tonello, A., Leproux, P., Barthelemy, A., Lacroix, S., Druon, F.,Blandin, P., Hanna, M., & Georges, P. (2007). Visible supercontinuum generation con-trolled by intermodal four-wave mixing in microstructured fiber. Opt. Lett., Vol. 32,No. 15, 2173–2175.
Marcatili, E. A. J., & Schmeltzer, R. A. (1964). Hollow metallic and dielectric waveguides forlong distance optical transmission and lasers. Bell Tech. Syst. J., Vol. 43, 1783–1809.
Martins, E. R., Spadoti, D. H., Romero, M. A., & Borges, B.-H. V. (2007). Theoretical analy-sis of supercontinuum generation in a highly birefringent D-shaped microstructuredoptical fiber. Opt. Expr., Vol. 15, No. 22, 14335–14347.
Mears, R. J., Reekie, L., Jauncey, I. M., & Payne, D. N. (1987). Low-noise Erbium-doped fiberamplifier at 1.54µm. Electron. Lett., Vol. 23, No. 19, 1026–1028.
Milosevic, N., Tempea, G., & Brabec, T. (2000). Optical pulse compression: bulk media versushollow waveguides. Opt. Lett., Vol. 25, No. 9, 672–674.
Miya, T., Terunuma, Y., Hosaka, T., & Miyashita, T. (1979). Ultimate low-loss single-mode fibreat 1.55µm. Electron. Lett., Vol. 15, No. 4, 106–108.
Mortensen, N. A., Nielsen, M. D., Folkenberg, J. R., Petersson, A., & Simonsen, H. R. (2003).Improved large-mode-area endlessly single-mode photonic crystal fibers. Opt. Lett.,Vol. 28, No. 6, 393–395.
Okamoto, K. (2006). Fundamentals of Optical Waveguides, 2nd ed., Academic Press, San Diego,USA.
Petrovich, M. N., Poletti, F., van Brakel, A., & Richardson, D. J. (2008). Robustly single modehollow core photonic bandgap fiber. Opt. Expr., Vol. 16, No. 6, 4337–4346.
Poletti, F., & Horak, P. (2008). Description of ultrashort pulse propagation in multimode opti-cal fibers. J. Opt. Soc. Am. B, Vol. 25, No. 10, 1645–1654.
Poletti, F., & Horak, P. (2009). Dynamics of femtosecond supercontinuum generation in multi-mode fibers. Opt. Expr., Vol. 17, No. 8, 6134–6147.
Popov, V. S. (2004). Tunnel and multiphoton ionization of atoms and ions in a strong laser field(Keldysh theory). Physics-Uspekhi, Vol. 47, No. 9, 855–885.

Praeger, M., de Paula, A. M., Froud, C. A., Rogers, E. T. F., Stebbings, S. L., Brocklesby, W.S., Baumberg, J. J., Hanna, D. C., & Frey, J. G. (2007). Spatially resolved soft X-rayspectrometry from single-image diffraction. Nat. Phys., Vol. 3, 176–179.
Press, W. H., Teukolsky, S. A., Vetterling, W. T., & Flannery, B. P. Numerical recipes: the art ofscientific computing, 3rd ed. (Cambridge University Press, New York, USA, 2007).
Price, J. H. V., Monro, T. M., Furusawa, K., Belardi, W., Baggett, J. C., Coyle, S., Netti, C.,Baumberg, J. J., Paschotta, R., & Richardson, D. J. (2003). UV generation in a pure-silica holey fiber. Appl. Phys. B, Vol. 77, 291–298.
Price, J. H. V., Monro, T. M., Ebendorff-Heidepriem, H., Poletti, F., Horak, P., Finazzi, V., Leong,J. Y. Y., Petropoulos, P., Flanagan, J. C., Brambilla, G., Feng, X., & Richardson, D. J.(2007). Mid-IR supercontinuum generation from nonsilica microstructured opticalfibers. J. Sel. Top. Quantum Electron., Vol. 13, No. 3, 738–749.
Ranka, J. K., & Gaeta, A. L. (2009). Breakdown of the slowly varying envelope approximationin the self-focusing of ultrashort pulses. Opt. Lett., Vol. 23, No. 7, 534–536.
Roppo, V., Centini, M., Sibilia, C., Bertolotti, M., de Ceglia, D., Scalora, M., Akozbek, N.,Bloemer, M. J., Haus, J. W., Kosareva, O. G., & Kandidov, V. P. (2007). Role of phasematching in pulsed second-harmonic generation: Walk-off and phase-locked twinpulses in negative-index media. Phys. Rev. A, Vol. 76, 033829.
Rundquist, A., Durfee, C. G., Chang, Z., Herne, C., Backus, S., Murnane, M. M., & Kapteyn, H.C. (1998). Phase-matched generation of coherent soft X-rays. Science, Vol. 280, 1412–1415.
Sartania, S., Cheng, Z., Lenzner, M., Tempea, G., Spielmann, Ch., Krausz, F., and Ferencz, K.(1997). Generation of 0.1-TW 5-fs optical pulses at a 1-kHz repetition rate. Opt. Lett.,Vol. 22, No. 20, 1562–1564.
Schreiber, T., Andersen, T., Schimpf, D., Limpert, J., & Tünnermann, A. (2005). Supercontin-uum generation by femtosecond single and dual wavelength pumping in photoniccrystal fibers with two zero dispersion wavelengths. Opt. Expr. Vol. 13, 9556–9569.
Stolen, R. H., Ippen, E. P., & Tynes, A. R. (1972). Raman oscillation in glass optical waveguide.Appl. Phys. Lett., Vol.20, No. 2, 62–64.
Stolen, R. H., & Bjorkholm, J. B. (1982). Parametric amplification and frequency conversion inoptical fibers. IEEE J. Sel. Top. Quantum Electron, Vol. 18, 1062–1072.
Stuart, B. C., Feit, M. D., Herman, S., Rubenchik, A. M., Shore, B. W., & Perry, M. D. (1996).Nanosecond-to-femtosectond laser-induced breakdown in dielectrics. Phys. Rev. B,Vol. 53, No. 4, 1749–1761.
Tonello, A., Pitois, S., Wabnitz, S., Millot, G., Martynkien, T., Urbanczyk, W., Wojcik, J., Lo-catelli, A., Conforti, M., & De Angelis, C. (2006). Frequency tunable polarization andintermodal modulation instability in high birefringence holey fiber. Opt. Expr., Vol.14, No. 1, 397–404.
Zharova, N. A., Litvak, A. G., & Mironov, V. A. (2006). Self-focusing of wave packets andenvelope shock formation in nonlinear dispersive media. J. Exp. Theor. Phys., Vol.103, No. 1, 15–22.