multimodal emotion recognition in response to videos ...€¦ · multimodal emotion recognition in...
TRANSCRIPT
Multimodal Emotion Recognition in Response to
Videos (Extended Abstract)
Mohammad Soleymani
Swiss Center for Affective Sciences
University of Geneva
Switzerland
Maja Pantic
Department of Computing/ EEMCS Dept.
Imperial College London/University of Twente
UK/Netherlands
Thierry Pun
Department of Compter Science
University of Geneva
Switzerland
Abstract—We present a user-independent emotion recognitionmethod with the goal of detecting expected emotions or affectivetags for videos using electroencephalogram (EEG), pupillaryresponse and gaze distance. We first selected 20 video clips withextrinsic emotional content from movies and online resources.Then EEG responses and eye gaze data were recorded from 24participants while watching emotional video clips. Ground truthwas defined based on the median arousal and valence scoresgiven to clips in a preliminary study. The arousal classes werecalm, medium aroused and activated and the valence classes wereunpleasant, neutral and pleasant. A one-participant-out crossvalidation was employed to evaluate the classification perfor-mance in a user-independent approach. The best classificationaccuracy of 68.5% for three labels of valence and 76.4% for threelabels of arousal were obtained using a modality fusion strategyand a support vector machine. The results over a populationof 24 participants demonstrate that user-independent emotionrecognition can outperform individual self-reports for arousalassessments and do not underperform for valence assessments.
Keywords—emotions; EEG signals; implicit tagging
I. INTRODUCTION
Emotions play an important role in viewers’ content se-
lection and consumption. With the rapid expansion of digital
multimedia content, alternative methods to the existing explicit
tagging are needed to enrich the pool of tagged content. When
a user watches video clips or listens to music, he/she may
experience certain feelings and emotions [1], [2], [3] which
manifest through bodily and physiological cues, e.g., pupil
dilation and contraction, facial expressions, e.g., frowning, and
changes in vocal features, e.g., laughter.
In order to translate user’s bodily and behavioral reactions to
emotions, reliable emotion assessment techniques are required.
Emotion assessment is a challenging task; even users are not
always able to express their emotion with words and the
emotion self-reporting error is not negligible. This makes it
difficult to define a ground truth. Affective self-reports might
be held in doubt because users cannot always remember
all the different emotions they had felt during watching a
video, and/or might misrepresent their feelings due to self
presentation, e.g., a user wants to show he is courageous
whereas in reality he was scared [4]. The emotion recognition
system provides us with an alternative that reduces the effort of
deciding on the right label and on defining the right questions
or methods to assess emotions explicitly.
Scherer [5] categorized emotions into utilitarian and aes-
thetic emotions. Emotional responses to videos are a mixture
of both utilitarian and aesthetic emotions with an emphasis
on the later one. Existence of aesthetic emotional responses
discourages from simply using six well-known basic emotions
in the context of emotion understanding of videos.
A. Background
Emotional responses to multimedia content have been stud-
ied from different perspectives. There has been a research
trend towards predicting emotions that multimedia content
elicits from their content [6], [7], [8]. On the other hand,
recognizing emotions induced by videos has been studied in
the affective computing community [9], [10], [11], [3], [12].
The emotion recognition has been also used in applications
such as detecting topical relevance, or summarizing videos
[13], [9], [14]. This paper presents a user-independent emotion
recognition method using EEG signals and eye gaze data in
response to videos using users’ bodily responses.
Emotional characteristics of videos have also improved mu-
sic and image recommendation. Shan et al. [8] used affective
characterization using content analysis to improve film music
recommendation. Tkalcic et al. showed how affective informa-
tion can improve image recommendation [7]. In their image
recommendation scenario, affective scores of images from
the international affective picture system (IAPS) [15] were
used as features for an image recommender. They conducted
an experiment with 52 participants to study the effect of
using affective scores. The image recommender using affective
scores showed a significant improvement in the performance
of their image recommendation system.
There is a large body of research on emotion assessment
from physiological signals [1], [16], [17], [18], [10], [19].
Amongst these studies, few of them achieved notable results
using video stimuli. Lisetti and Nasoz used physiological
response to recognize emotion in response to movie scenes
[10]. The movie scenes elicited six emotions, namely sadness,
amusement, fear, anger, frustration and surprise. They achieved
a high recognition rate of 84% for the recognition of these six
emotions. However the classification was based on the analysis
of the signals in response to pre-selected segments in the
shown video known to be related to highly emotional events.
978-1-4799-9953-8/15/$31.00 ©2015 IEEE 491
2015 International Conference on Affective Computing and Intelligent Interaction (ACII)
Takahashi [11] recorded EEG and peripheral physiological
signals from 12 participants. He then classified the responses
to emotional videos into five classes namely, joy, sadness, dis-
gust, fear, and relax. He achieved the accuracy of 41.7% using
EEG signals. However the feature level fusion of EEG signals
and peripheral physiological signals failed to improve the
classification accuracy. In a more recent study, Kolodyazhniy
et al. [20] used peripheral physiological signals to recognize
neutral, fear and sadness responses to movie excerpts. During
the presentation of videos to the participants, they introduced
startle stimuli using randomly generated white noise sounds
to boost physiological responses. Their system was able to
recognize three emotional states with the recognition rate of
77.5% in a participant-independent approach.
Eye gaze and pupillary responses have been used to measure
attention. However, to the best of our knowledge, the gaze
pattern does not vary by emotions and was not used. Pupil can
dilate or constrict in response to light, cognitive, attentional
and emotional stimuli [21], [22]. Gao et al. [23] presented
an emotion assessment method using pupillary response after
reducing the light effect using a real-time feedback.
B. Potential application
Characterizing multimedia content with relevant, reliable
and discriminating tags is vital for multimedia information
retrieval. Affective characteristics of multimedia are important
features for describing multimedia content and can be pre-
sented by such emotional tags. Implicit affective tagging refers
to the effortless generation of subjective and/or emotional
tags. Implicit tagging of videos using affective information
can help recommendation and retrieval systems to improve
their performance [8], [7], [24]. The goal of implicit affective
tagging is to translate users spontaneous responses to multime-
dia and automatically recognize the corresponding tag. These
responses can be used to reliably generate affective tags.
C. Major contributions
Although individual differences are always present in emo-
tional reactions, there is an expected emotional response
to a multimedia content. For example the scenes from a
drama movie induce sadness in most of the people. In this
paper, we investigate and show the feasibility and comparable
performance of a user-independent emotion recognition to
detect the dominant or commonly selected affective tags. The
implicit tagging application limited our choices for modalities
to cues which are measurable while participants are sitting
and are mostly in passive mode. The major contributions are
this work are (i) a multimodal emotion recognition study
to detect the expected emotion in response to videos, and
(ii) presenting an emotion recognition method from pupilarry
reflex compensating for the pupillary light reflex.
II. MATERIAL AND METHODS
A. Emotional Model
Although the most straightforward way to represent an emo-
tion is to use emotional words such as fear and joy, label-based
representations have some disadvantages. The main one being
that labels are not cross-lingual: emotions do not have exact
translations in different languages, e.g., “disgust” did not have
an exact translation in Polish [25]. Psychologists therefore
often represent emotions or feelings in an n-dimensional space
(generally 2- or 3-dimensional). The most famous such space,
which is used in the present study, is the 2D valence-arousal
or pleasure-arousal space [26]. The valence scale ranges from
unpleasant to pleasant. The arousal scale ranges from passive
to active or excited.
B. Preliminary Study
In the preliminary study 21 commercially produced movies
were first segmented at scene-level. Scenes longer than two
minutes were divided into shorter two minutes long excerpts.
From these excerpts, 155 emotional video clips containing
full or part of movie scenes were manually selected. The
155 selected videos were shown to more than 50 participants;
each video clip received 10 annotations in average [27]. The
preliminary study was conducted utilizing an online affective
annotation system in which the participants were able to use a
web interface to report their emotions in response to the videos
played by a web-based video player. In the preliminary study
the participants were thus asked to self-assess their emotion
by reporting the felt arousal and valence on nine-point scale
and choosing an emotional keyword. 14 videos were selected
to cover different emotional responses.
We selected three additional videos based on our judgment
to elicit joy and disgust. Three past weather forecast reports
(retrieved from youtube.com) were also used as neutral emo-
tion clips. These six additional video clips were annotated
similarly to the movie scenes.
Ultimately, 20 videos were selected to be shown which were
between 34.9s to 117s long (M = 81.4s, SD = 22.5s).
Psychologists recommended videos from one to ten minutes
long for elicitation of a single emotion [28], [2]. Here, the
video clips were kept as short as possible to avoid multiple
emotions or habituation to the stimuli while keeping them long
enough to observe the effect. The median arousal and valence
scores was used to determine ground truth labels for expected
emotion recognition.
C. Experiment Protocol and Setup
A multimodal recording setup was arranged to record facial
videos, audio and vocal expressions, eye gaze, and physio-
logical signals simultaneously. The synchronization method
and hardware setup details are given in Lichtenauer et al.
[29]. Participants were asked to report their felt emotions by
indicating their felt arousal and valence on a nine-point scale.
To simplify the interface a keyboard was provided with only
nine numerical keys and the participant could answer each
question by pressing one of the nine. 30 participants with
different cultural and education backgrounds volunteered to
participate in response to a campus wide call for volunteers at
Imperial College, London. Out of the 30 young healthy adult
participants, 17 were female and 13 were male; ages varied
between 19 to 40 years old (M = 26.06, SD = 4.39).The
978-1-4799-9953-8/15/$31.00 ©2015 IEEE 492
data recorded from six participants were not analyzed due to
technical problems, poor signal quality and unfinished data
collection. Hence, the analysis results of this paper are only
based on the responses recorded from 24 participants. This
database is freely available for academic research1.
The participants were informed about the experiment and
their rights with a verbal introduction, by email and through a
consent form. In emotion inducing experiments the bias from
the emotional state needs to be removed. For this purpose
before each emotional video a short neutral clip randomly
selected from the clips provided by the Stanford psychophys-
iology laboratory [2] was shown to the participants.
Each trial started with a short neutral clip. After watching
the short neutral clip, one of the 20 video clips was played.
Video clips were played from the dataset in random order.
After watching the video clip, the participant filled in the self-
assessment form which appeared automatically. In total, the
time interval between the start of a trial and the end of the
self-reporting phase was approximately two and half minutes.
This interval included playing the neutral clip, playing the
emotional clip, performing the self-assessment. Running of
the whole protocol took in average 50 minutes in addition to
30 minutes setup time.
D. Preprocessing and Feature Extraction
1) EEG signals: Psychological studies regarding the rela-
tions between emotions and the brain are uncovering the strong
implication of cognitive processes in emotions [30], [31]. As
a result, the EEG signals carry valuable information about the
participants’ felt emotions.
The Biosemi active II system2 with active electrodes was
used for EEG signals acquisition. Electroencephalogram sig-
nals were recorded with a 1024Hz sampling rate and later
downsampled to 256Hz to reduce the memory and processing
costs. EEG signals were recorded using active AgCl electrodes
placed according to the international 10-20 system. EEG sig-
nals were re-references to the average reference. The unwanted
artifacts, trend and noise were reduced prior to extracting the
features from EEG data by pre-processing the signals. Drift
and noise reduction were done by applying a 4-45Hz band-
pass filter. Other artifacts such as muscular activity was kept
at minimum level by instructing the participants to minimize
their movements while videos were playing.
The spectral power of EEG signals in different bands was
found to be correlated with emotions [32], [33], [19]. Power
spectral density (PSD) from different bands were computed
using fast Fourier transform (FFT) and Welch algorithm [34].
The logarithms of the PSD from theta (4Hz < f < 8Hz),
slow alpha (8Hz < f < 10Hz), alpha (8Hz < f < 12Hz),
beta (12Hz < f < 30Hz) and gamma (30Hz < f ) bands
were extracted from all 32 electrodes as features. In addition
to power spectral features, the difference between the spectral
power of all the 14 symmetrical pairs on the right and left
1http://mahnob-db.eu2http://www.biosemi.com
TABLE IFEATURES EXTRACTED FROM EYE GAZE DATA AND EEG SIGNALS.
Eye gaze dataExtracted features
Pupil diameter standard deviation, spectral power in the followingbands: ]0, 0.2]Hz, ]0.2, 0.4]Hz, ]0.4, 0,6]Hz and ]0.6,1]Hz
Gaze distance approach time ratio, avoidance time ratio, approachrate
Eye blinking blink length, blinking rate, length of the longestblink, time spent with eyes closed
EEG theta, slow alpha, alpha, beta, and gamma PSDfor each electrode. The spectral power asymmetrybetween 14 pairs of electrodes in the four bands ofalpha, beta, theta and gamma.
hemisphere was extracted to measure the possible asymmetry
in the brain activities due to the valence of an emotional stimuli
[35], [32]. The asymmetry features were extracted from all
mentioned bands except slow alpha. The total number of EEG
features of a trial for 32 electrodes is 14× 4 + 32× 5 = 216features. A list of extracted EEG features is given in Table I.
2) Eye gaze data: The X120 Tobii3 eye gaze tracker
provides the position of the projected eye gaze on the screen,
the pupil diameter, the moments when the eyes were closed
and the instantaneous distance of the participant’s eyes to the
gaze tracker device positioned below the screen. The eye gaze
data was sampled at 60Hz. The blinking moments are also
extractable from eye gaze data. The eye gaze itself is highly
dependent on the content and therefore it was not used directly
for emotion recognition. However, pupil diameter has been
shown to change in different emotional states [21], [22].
A linear interpolation was used to replace the missing
pupil diameter samples due to eye blinking. Then the average
diameter of right and left eye pupil was used as the pupil
diameter time series. The major cause of pupil diameter vari-
ation comes from light; therefore the participants’ responses
to the same video (stimuli) in the controlled illumination
environment follow similar patterns. There are different para-
metric models for pupillary light reflex [36], [37]. However,
these parametric models are not error free and calculating
their numerous parameters is rather difficult without specific
light reflex experiment. It has been shown that the pupillary
light reflex magnitude changes with age and between different
people [36]. Most of the participants in our experiment were
young, in their twenties; therefore the aging effect assumed to
be negligible. The difference between the magnitudes can be
reduced by normalizing the pupil diameter time series. Con-
sequently we extracted the light reflex using a non-parametric
estimation from the data. This common light reflex pattern was
estimated for each video using principal component analysis
(PCA).
If Y is the M ×Np matrix of the centered and normalized
pupillary responses to a given video from Np participants and
M samples, then Y consists of three components:
Y = X + Z + E (1)
3http://www.tobii.com
978-1-4799-9953-8/15/$31.00 ©2015 IEEE 493
X is the light response which is the strongest effect in the
signal. Z is the parasympathetic emotional and attentional re-
sponse and E is the noise originated from measurement. These
three components are originated from independent sources
and the decorrelating characteristic of principal component
analysis (PCA) is able to separate these three; we assumed
the distributions to be Gaussian. First, Y was decomposed
using PCA into Np components. The first principal component
is assumed to be a close estimation of the light reflex. The
normalized principal component was then removed from nor-
malized time series. Then the remaining residual part includes
Z + E.
After removing the linear trend, the power spectrum of the
pupil diameter variation was computed. Standard deviation and
spectral features were extracted from the pupil diameter. The
Hippus effect is the small oscillations of eye pupil diameter
between 0.05 to 0.3Hz and with the amplitude of 1 mm [36],
[38]. Hippus effect has been shown to be present when one
is relaxed or passive. In the presence of mental activity the
effect will disappear. The Hippus effect is extracted by the
first two power spectral features up to 0.4 Hz. The rate of eye
blinking is shown to be correlated with anxiety [39]. From the
eye blinks, the eye blinking rate, the average and maximum
blink duration were extracted as features. In addition to the
eye blinking features, the amount of time with eyes closed
was also used as a feature to detect possible eye closing due
to unpleasant emotions.
Although the participants were asked not to move during
the experiment, there were small head movements which
manifested themselves in the distance between participants’
eyes and the eye gaze tracker. The distance of the participant to
the screen and its changes provide valuable information about
the participants’ posture. The total change in the distance of
the user to the gaze tracker, gaze distance, was calculated to
measure the possible approach and avoidance phenomena. The
amount of time the participants spent per trial getting close
or far from the screen was computed as well. These features
were named approach and avoidance ratio to represent the
amount of time participant spent getting close or going far
from the screen. The frequency of the participants’ movement
towards the screen during each trial, “approach rate”, was also
extracted. Ultimately 12 features were extracted from the eye
gaze data. A summary of all extracted features is given in
Table I.
E. Emotion Classification
With the proposed inter-participant expected emotion recog-
nition, the goal is to find the emotional class with the highest
agreement within a population. The expected emotion or
affective tag can satisfy a larger population of viewers in a
video retrieval scenario. For each video from the dataset, the
ground truth was thus defined by computing the median of
arousal and valence scores given on a nine point scale. The
median values were then categorized into three classes with
equal intervals. According to this definition, we can name
these classes calm, medium aroused, and activated for arousal
and unpleasant, neutral, and pleasant for valence.
We used a SVM classifier with RBF kernel. A feature
selection was performed using an ANOVA test. First, a one
way ANOVA test was performed on the training set for each
feature predicting the class. Then any feature for which the
ANOVA test was not significant (p > 0.05) was rejected.
This feature selection criterion was hence re-calculated for
each cross validation’s iteration. A leave-one-participant-out
cross validation was used to evaluate the user-independent
classification performance.
1) Modality fusion strategy: Classification in different
modalities can be fused at both feature level and decision
level. We applied these two fusion strategies and reported their
results. With the feature level fusion (FLF), the feature vectors
from different modalities were concatenated to form a larger
feature vector. The feature selection and classification methods
were then applied to the new feature set. However with the
decision level fusion (DLF), classification was performed on
each modality separately and the classification outcomes were
fused to generate the fusion results. In [11] feature level fusion
of EEG and peripheral physiological signals did not improve
the single modality results.
In addition to the superior classification performance ob-
tained by multi-modal strategy, in the absence of one of
the modalities due to temporary problems or artifacts, the
system can still continue working as single modality emotion
detection. The adaptability of the system to remove and
add new modalities can be achieved without re-training the
classifiers using the DLF. The adaptability and scalability of
the DLF strategy gives it another advantage over FLF.
III. EXPERIMENTAL RESULTS
The experiments were performed in a laboratory environ-
ment with controlled temperature and illumination; 24 partici-
pants viewed 20 video clips each. 467 samples were gathered
over a potential dataset of 24 × 20 = 480 samples; the 13
missing ones were unavailable due to technical difficulties.
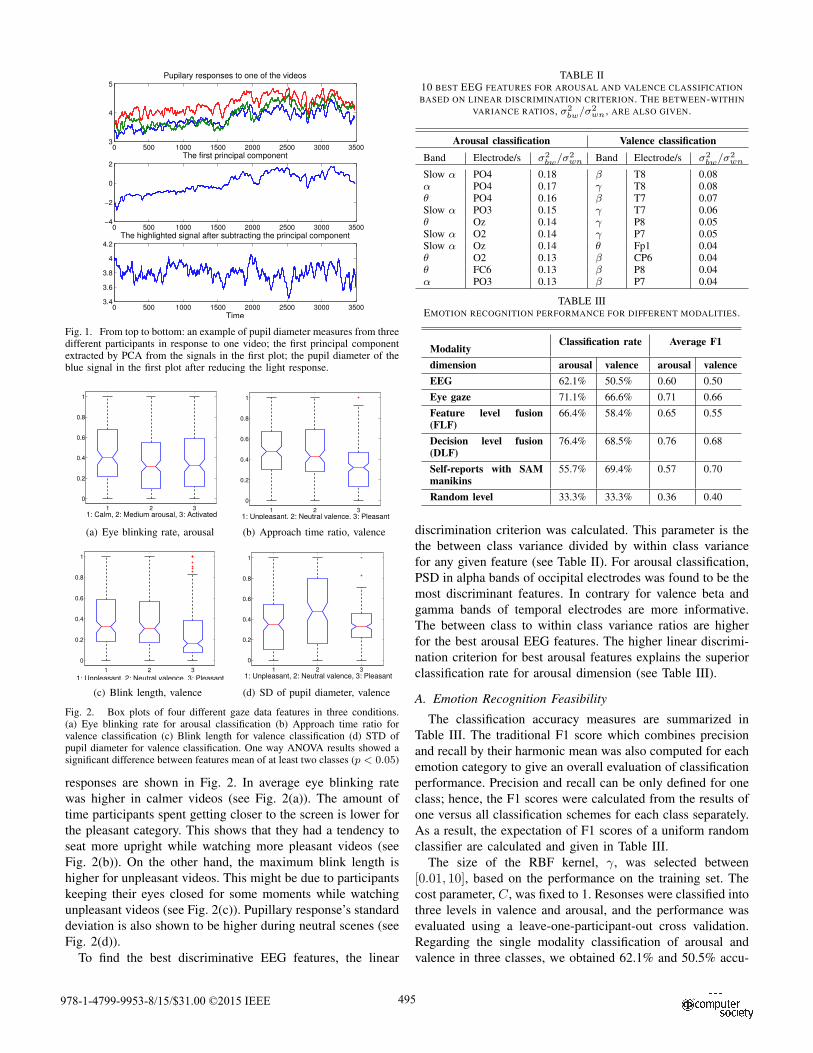
For the pupillary responses to each video the most signifi-
cant component was extracted using PCA and then removed
from them. In the example given in Fig. 1, examples of the
pupillary responses, extracted pupillary light reflex and the
residual component after removing the light reflex are given.
The normalized variance or eigen-values of the first component
were found to be significantly larger than the rest of the
components. The first principal component carried in average
more than 50% of the variance in the data.
In order to study the discrimination abilities of the eye
gaze data features, a one way analysis of variance test was
performed on the features. The difference between the mean
of features in different arousal or valence categories was found
significant (p < 0.05). The significance of one way ANOVA
shows that there is at least a significant difference between the
means of the samples from two classes out of three. The box
plots of four features namely, eye blinking rate, approach rate,
maximum blink length, and standard deviation of pupillary
978-1-4799-9953-8/15/$31.00 ©2015 IEEE 494
0 500 1000 1500 2000 2500 3000 35003
4
5Pupilary responses to one of the videos
0 500 1000 1500 2000 2500 3000 3500−4
−2
0
2The first principal component
0 500 1000 1500 2000 2500 3000 35003.4
3.6
3.8
4
4.2
Time
The highlighted signal after subtracting the principal component
Fig. 1. From top to bottom: an example of pupil diameter measures from threedifferent participants in response to one video; the first principal componentextracted by PCA from the signals in the first plot; the pupil diameter of theblue signal in the first plot after reducing the light response.
1 2 3
0
0.2
0.4
0.6
0.8
1
1: Calm, 2: Medium arousal, 3: Activated
(a) Eye blinking rate, arousal
1 2 3
0
0.2
0.4
0.6
0.8
1
1: Unpleasant, 2: Neutral valence, 3: Pleasant
(b) Approach time ratio, valence
1 2 3
0
0.2
0.4
0.6
0.8
1
1: Unpleasant, 2: Neutral valence, 3: Pleasant
(c) Blink length, valence
1 2 3
0
0.2
0.4
0.6
0.8
1
1: Unpleasant, 2: Neutral valence, 3: Pleasant
(d) SD of pupil diameter, valence
Fig. 2. Box plots of four different gaze data features in three conditions.(a) Eye blinking rate for arousal classification (b) Approach time ratio forvalence classification (c) Blink length for valence classification (d) STD ofpupil diameter for valence classification. One way ANOVA results showed asignificant difference between features mean of at least two classes (p < 0.05)
responses are shown in Fig. 2. In average eye blinking rate
was higher in calmer videos (see Fig. 2(a)). The amount of
time participants spent getting closer to the screen is lower for
the pleasant category. This shows that they had a tendency to
seat more upright while watching more pleasant videos (see
Fig. 2(b)). On the other hand, the maximum blink length is
higher for unpleasant videos. This might be due to participants
keeping their eyes closed for some moments while watching
unpleasant videos (see Fig. 2(c)). Pupillary response’s standard
deviation is also shown to be higher during neutral scenes (see
Fig. 2(d)).
To find the best discriminative EEG features, the linear
TABLE II10 BEST EEG FEATURES FOR AROUSAL AND VALENCE CLASSIFICATION
BASED ON LINEAR DISCRIMINATION CRITERION. THE BETWEEN-WITHIN
VARIANCE RATIOS, σ2
bw/σ2
wn , ARE ALSO GIVEN.
Arousal classification Valence classification
Band Electrode/s σ2
bw/σ2
wn Band Electrode/s σ2
bw/σ2
wn
Slow α PO4 0.18 β T8 0.08α PO4 0.17 γ T8 0.08θ PO4 0.16 β T7 0.07Slow α PO3 0.15 γ T7 0.06θ Oz 0.14 γ P8 0.05Slow α O2 0.14 γ P7 0.05Slow α Oz 0.14 θ Fp1 0.04θ O2 0.13 β CP6 0.04θ FC6 0.13 β P8 0.04α PO3 0.13 β P7 0.04
TABLE IIIEMOTION RECOGNITION PERFORMANCE FOR DIFFERENT MODALITIES.
ModalityClassification rate Average F1
dimension arousal valence arousal valence
EEG 62.1% 50.5% 0.60 0.50
Eye gaze 71.1% 66.6% 0.71 0.66
Feature level fusion(FLF)
66.4% 58.4% 0.65 0.55
Decision level fusion(DLF)
76.4% 68.5% 0.76 0.68
Self-reports with SAMmanikins
55.7% 69.4% 0.57 0.70
Random level 33.3% 33.3% 0.36 0.40
discrimination criterion was calculated. This parameter is the
the between class variance divided by within class variance
for any given feature (see Table II). For arousal classification,
PSD in alpha bands of occipital electrodes was found to be the
most discriminant features. In contrary for valence beta and
gamma bands of temporal electrodes are more informative.
The between class to within class variance ratios are higher
for the best arousal EEG features. The higher linear discrimi-
nation criterion for best arousal features explains the superior
classification rate for arousal dimension (see Table III).
A. Emotion Recognition Feasibility
The classification accuracy measures are summarized in
Table III. The traditional F1 score which combines precision
and recall by their harmonic mean was also computed for each
emotion category to give an overall evaluation of classification
performance. Precision and recall can be only defined for one
class; hence, the F1 scores were calculated from the results of
one versus all classification schemes for each class separately.
As a result, the expectation of F1 scores of a uniform random
classifier are calculated and given in Table III.
The size of the RBF kernel, γ, was selected between
[0.01, 10], based on the performance on the training set. The
cost parameter, C, was fixed to 1. Resonses were classified into
three levels in valence and arousal, and the performance was
evaluated using a leave-one-participant-out cross validation.
Regarding the single modality classification of arousal and
valence in three classes, we obtained 62.1% and 50.5% accu-
978-1-4799-9953-8/15/$31.00 ©2015 IEEE 495
racy from EEG signals and 71.1% and 66.6% accuracy from
eye gaze data (see Table III). Although EEG classification
results are inferior to the eye gaze data, they are comparable
to the state of the art classification rates considering the inter-
participant classification scheme [40], [19].
The FLF did not improve the best single modality, gaze
data, results. However, the modality fusion strategy using the
DLF improved the best SVM classification rate for arousal
up to 76.4%. The DLF did not underperform for valence
classification. To test the statistical significance of the clas-
sification performance, a paired t-test was used to compare
F1 scores of the DLF on one side and the self reports and
the best single modality, eye gaze data, on the other side.
The F1 scores from each participant’s samples were compared
and the improvement over arousal classification comparing
to eye gaze data and self reports were found significant
(p < 0.01). However, the difference between the eye gaze,
DLF, and self reports F1 scores on valence classification was
not found statistically significant. The confidence levels of the
classification results from the two modalities were added to
find the class with the highest summed confidence.
B. Emotion recognition and self-reports
The agreement between participants’ self-reports and
ground truth is given in Table III. In order to measure the
agreement between individual self-reports and the ground
truth, the self-reported arousal and valence scores on nine
point scale were translated into three levels. These levels
were then treated like estimated labels and the agreement rate
was computed. This was done by considering that the goal
of each participant is to label a video clip by the correct
label or expected emotion. The agreement rate for individually
self-reported labels was 55.7% for arousal which is inferior
to the worst classifier’s result. Therefore, the accuracy of
obtained tags via classification is comparable to the individ-
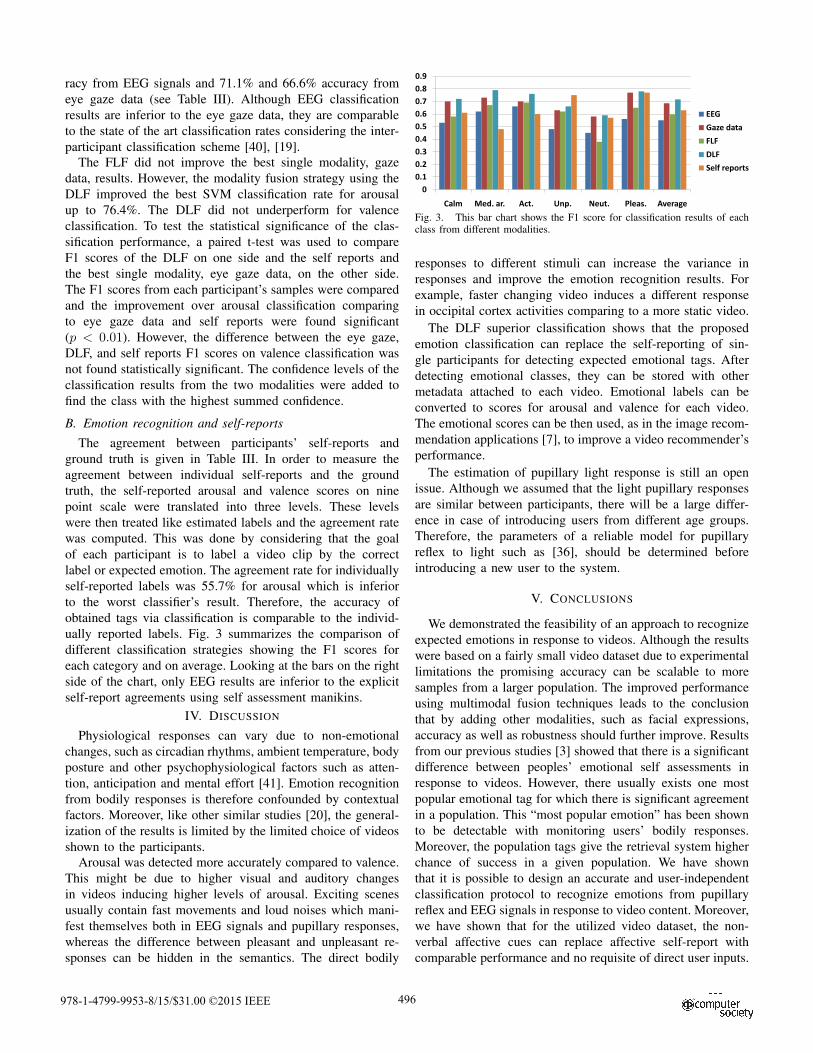
ually reported labels. Fig. 3 summarizes the comparison of
different classification strategies showing the F1 scores for
each category and on average. Looking at the bars on the right
side of the chart, only EEG results are inferior to the explicit
self-report agreements using self assessment manikins.
IV. DISCUSSION
Physiological responses can vary due to non-emotional
changes, such as circadian rhythms, ambient temperature, body
posture and other psychophysiological factors such as atten-
tion, anticipation and mental effort [41]. Emotion recognition
from bodily responses is therefore confounded by contextual
factors. Moreover, like other similar studies [20], the general-
ization of the results is limited by the limited choice of videos
shown to the participants.
Arousal was detected more accurately compared to valence.
This might be due to higher visual and auditory changes
in videos inducing higher levels of arousal. Exciting scenes
usually contain fast movements and loud noises which mani-
fest themselves both in EEG signals and pupillary responses,
whereas the difference between pleasant and unpleasant re-
sponses can be hidden in the semantics. The direct bodily
0
0.1
0.2
0.3
0.4
0.5
0.6
0.7
0.8
0.9
Calm Med. ar. Act. Unp. Neut. Pleas. Average
EEG
Gaze data
FLF
DLF
Self reports
Fig. 3. This bar chart shows the F1 score for classification results of eachclass from different modalities.
responses to different stimuli can increase the variance in
responses and improve the emotion recognition results. For
example, faster changing video induces a different response
in occipital cortex activities comparing to a more static video.
The DLF superior classification shows that the proposed
emotion classification can replace the self-reporting of sin-
gle participants for detecting expected emotional tags. After
detecting emotional classes, they can be stored with other
metadata attached to each video. Emotional labels can be
converted to scores for arousal and valence for each video.
The emotional scores can be then used, as in the image recom-
mendation applications [7], to improve a video recommender’s
performance.
The estimation of pupillary light response is still an open
issue. Although we assumed that the light pupillary responses
are similar between participants, there will be a large differ-
ence in case of introducing users from different age groups.
Therefore, the parameters of a reliable model for pupillary
reflex to light such as [36], should be determined before
introducing a new user to the system.
V. CONCLUSIONS
We demonstrated the feasibility of an approach to recognize
expected emotions in response to videos. Although the results
were based on a fairly small video dataset due to experimental
limitations the promising accuracy can be scalable to more
samples from a larger population. The improved performance
using multimodal fusion techniques leads to the conclusion
that by adding other modalities, such as facial expressions,
accuracy as well as robustness should further improve. Results
from our previous studies [3] showed that there is a significant
difference between peoples’ emotional self assessments in
response to videos. However, there usually exists one most
popular emotional tag for which there is significant agreement
in a population. This “most popular emotion” has been shown
to be detectable with monitoring users’ bodily responses.
Moreover, the population tags give the retrieval system higher
chance of success in a given population. We have shown
that it is possible to design an accurate and user-independent
classification protocol to recognize emotions from pupillary
reflex and EEG signals in response to video content. Moreover,
we have shown that for the utilized video dataset, the non-
verbal affective cues can replace affective self-report with
comparable performance and no requisite of direct user inputs.
978-1-4799-9953-8/15/$31.00 ©2015 IEEE 496
REFERENCES
[1] J. Kim and E. Andre, “Emotion Recognition Based on PhysiologicalChanges in Music Listening,” Pattern Analysis and Machine Intelligence,
IEEE Transactions on, vol. 30, no. 12, pp. 2067–2083, 2008.
[2] J. Rottenberg, R. D. Ray, and J. J. Gross, Emotion elicitation using
films, ser. Series in affective science. Oxford University Press, 2007,pp. 9–28.
[3] M. Soleymani, G. Chanel, J. J. M. Kierkels, and T. Pun, “AffectiveCharacterization of Movie Scenes Based on Content Analysis andPhysiological Changes,” International Journal of Semantic Computing,vol. 3, no. 2, pp. 235–254, June 2009.
[4] R. W. Picard and S. B. Daily, “Evaluating Affective Interactions: Alter-natives to Asking What Users Feel,” in CHI Workshop on Evaluating
Affective Interfaces: Innovative Approaches, 2005.
[5] K. R. Scherer, “What are emotions? And how can they be measured?”Social Science Information, vol. 44, no. 4, pp. 695–729, December 2005.
[6] A. Hanjalic and L.-Q. Xu, “Affective video content representation andmodeling,” Multimedia, IEEE Transactions on, vol. 7, no. 1, pp. 143–154, 2005.
[7] M. Tkalcic, U. Burnik, and A. Kosir, “Using affective parameters ina content-based recommender system for images,” User Modeling and
User-Adapted Interaction, pp. 1–33–33, September 2010.
[8] M. K. Shan, F. F. Kuo, M. F. Chiang, and S. Y. Lee, “Emotion-basedmusic recommendation by affinity discovery from film music,” Expert
Syst. Appl., vol. 36, no. 4, pp. 7666–7674, September 2009.
[9] H. Joho, J. M. Jose, R. Valenti, and N. Sebe, “Exploiting facialexpressions for affective video summarisation,” in Proceeding of the
ACM International Conference on Image and Video Retrieval, ser. CIVR’09. New York, NY, USA: ACM, 2009.
[10] C. L. Lisetti and F. Nasoz, “Using noninvasive wearable computers torecognize human emotions from physiological signals,” EURASIP J.
Appl. Signal Process., vol. 2004, no. 1, pp. 1672–1687, January 2004.
[11] K. Takahashi, “Remarks on Emotion Recognition from BioPotentialSignals,” in in 2nd Int. Conf. on Autonomous Robots and Agents, 2004,2005.
[12] S. Koelstra, A. Yazdani, M. Soleymani, C. Muhl, J.-S. Lee, A. Nijholt,T. Pun, T. Ebrahimi, and I. Patras, “Single Trial Classification ofEEG and Peripheral Physiological Signals for Recognition of EmotionsInduced by Music Videos,” in Brain Informatics, ser. Lecture Notes inComputer Science, Y. Yao, R. Sun, T. Poggio, J. Liu, N. Zhong, andJ. Huang, Eds. Berlin, Heidelberg: Springer, 2010, vol. 6334, ch. 9,pp. 89–100.
[13] H. Joho, J. Staiano, N. Sebe, and J. Jose, “Looking at the viewer:analysing facial activity to detect personal highlights of multimediacontents,” Multimedia Tools and Applications, pp. 1–19, October 2010.
[14] I. Arapakis, I. Konstas, and J. M. Jose, “Using facial expressions andperipheral physiological signals as implicit indicators of topical rele-vance,” in Proceedings of the seventeen ACM international conference
on Multimedia, ser. MM ’09. New York, NY, USA: ACM, 2009, pp.461–470.
[15] P. Lang, M. Bradley, and B. Cuthbert, “International affective picturesystem (IAPS): Affective ratings of pictures and instruction manual,”University of Florida, Gainesville, Florida, US, Tech. Rep. A-8, 2008.
[16] P. J. Lang, M. K. Greenwald, M. M. Bradley, and A. O. Hamm, “Lookingat pictures: Affective, facial, visceral, and behavioral reactions,” Psy-
chophysiology, vol. 30, no. 3, pp. 261–273, 1993.
[17] J. Wang and Y. Gong, “Recognition of multiple drivers’ emotionalstate,” in In ICPR’08: The 19th International Conference on Pattern
Recognition, 2008.
[18] J. A. Healey, “Wearable and automotive systems for affect recognitionfrom physiology,” Ph.D. dissertation, MIT, 2000.
[19] G. Chanel, J. J. M. Kierkels, M. Soleymani, and T. Pun, “Short-termemotion assessment in a recall paradigm,” International Journal of
Human-Computer Studies, vol. 67, no. 8, pp. 607–627, August 2009.
[20] V. Kolodyazhniy, S. D. Kreibig, J. J. Gross, W. T. Roth, and F. H.Wilhelm, “An affective computing approach to physiological emotionspecificity: Toward subject-independent and stimulus-independent clas-sification of film-induced emotions,” Psychophysiology, vol. 7, no. 48,pp. 908–922, 2011.
[21] Bradley, M. Margaret, Miccoli, Laura, Escrig, A. Miguel, Lang, andJ. Peter, “The pupil as a measure of emotional arousal and autonomicactivation,” Psychophysiology, vol. 45, no. 4, pp. 602–607, July 2008.
[22] T. Partala and V. Surakka, “Pupil size variation as an indication of af-fective processing,” International Journal of Human-Computer Studies,vol. 59, no. 1-2, 2003.
[23] Y. Gao, A. Barreto, and M. Adjouadi, “Monitoring and processing ofthe pupil diameter signal for affective assessment of a computer user,” inProceedings of the 13th International Conference on Human-Computer
Interaction. Part I: New Trends. Berlin, Heidelberg: Springer-Verlag,2009, pp. 49–58.
[24] J. J. M. Kierkels, M. Soleymani, and T. Pun, “Queries and tags in affect-based multimedia retrieval,” in ICME’09: Proceedings of the 2009 IEEE
international conference on Multimedia and Expo. Piscataway, NJ,USA: IEEE Press, 2009, pp. 1436–1439.
[25] J. A. Russell, “Culture and the Categorization of Emotions,” Psycholog-
ical Bulletin, vol. 110, no. 3, pp. 426–450, 1991.[26] J. A. Russell and A. Mehrabian, “Evidence for a three-factor theory
of emotions,” Journal of Research in Personality, vol. 11, no. 3, pp.273–294, September 1977.
[27] M. Soleymani, J. Davis, and T. Pun, “A collaborative personalizedaffective video retrieval system,” in Affective Computing and Intelligent
Interaction and Workshops, 2009. ACII 2009. 3rd International Confer-
ence on, sep 2009.[28] A. Schaefer, F. Nils, X. Sanchez, and P. Philippot, “Assessing the
effectiveness of a large database of emotion-eliciting films: A new toolfor emotion researchers,” Cognition & Emotion, vol. 24, no. 7, pp. 1153–1172, 2010.
[29] J. Lichtenauer, M. Valstar, J. Shen, and M. Pantic, “Cost-Effective Solu-tion to Synchronized Audio-Visual Capture Using Multiple Sensors,” inAVSS ’09: Proceedings of the 2009 Sixth IEEE International Conference
on Advanced Video and Signal Based Surveillance. Washington, DC,USA: IEEE Computer Society, 2009, pp. 324–329.
[30] R. Adolphs, D. Tranel, and A. R. Damasio, “Dissociable neural systemsfor recognizing emotions,” Brain and Cognition, vol. 52, no. 1, pp. 61–69, June 2003.
[31] A. R. Damasio, T. J. Grabowski, A. Bechara, H. Damasio, L. L. B.Ponto, J. Parvizi, and R. D. Hichwa, “Subcortical and cortical brainactivity during the feeling of self-generated emotions,” Nature Neuro-
science, vol. 3, no. 10, pp. 1049–1056, October 2000.[32] R. J. Davidson, “Affective neuroscience and psychophysiology: toward
a synthesis.” Psychophysiology, vol. 40, no. 5, pp. 655–665, September2003.
[33] L. I. Aftanas, N. V. Reva, A. A. Varlamov, S. V. Pavlov, and V. P.Makhnev, “Analysis of evoked EEG synchronization and desynchro-nization in conditions of emotional activation in humans: temporal andtopographic characteristics.” Neuroscience and behavioral physiology,vol. 34, no. 8, pp. 859–867, October 2004.
[34] P. D. Welch, “The Use of Fast Fourier Transform for the Estimation ofPower Spectra: A Method Based on Time Averaging Over Short, Mod-ified Periodograms,” IEEE Transactions on Audio and Electroacoustics,vol. 15, pp. 70–73, 1967.
[35] S. K. Sutton and R. J. Davidson, “Prefrontal Brain Asymmetry: A Bio-logical Substrate of the Behavioral Approach and Inhibition Systems,”Psychological Science, vol. 8, no. 3, pp. 204–210, 1997.
[36] V. F. Pamplona, M. M. Oliveira, and G. V. G. Baranoski, “Photorealisticmodels for pupil light reflex and iridal pattern deformation,” ACM Trans.
Graph., vol. 28, no. 4, pp. 1–12, 2009.[37] A. Longtin and J. Milton, “Modelling autonomous oscillations in the
human pupil light reflex using non-linear delay-differential equations,”Bulletin of Mathematical Biology, vol. 51, no. 5, pp. 605–624, September1989.
[38] H. Bouma and L. C. J. Baghuis, “Hippus of the pupil: Periods of slowoscillations of unknown origin,” Vision Research, vol. 11, no. 11, 1971.
[39] F. H. Kanfer, “Verbal rate, eyeblink, and content in structured psychiatricinterviews,” Journal of Abnormal and Social Psychology, vol. 61, no. 3,pp. 341–347, 1960.
[40] G. Chanel, C. Rebetez, M. Betrancourt, and T. Pun, “Emotion as-sessment from physiological signals for adaptation of game difficulty,”Systems, Man and Cybernetics, Part A: Systems and Humans, IEEE
Transactions on, vol. PP, no. PP, p. In Press, 2011.[41] S. D. Kreibig, G. Schaefer, and T. Brosch, Psychophysiological response
patterning in emotion: Implications for affective computing. Oxford,UK: Oxford University Press, 2010, ch. 2.4, pp. 105–130.
978-1-4799-9953-8/15/$31.00 ©2015 IEEE 497