multidimensional child poverty measurement and …...multidimensional child poverty measurement and...
TRANSCRIPT

Papers and Proceedings
pp. 727–744
Multidimensional Child Poverty Measurement and Its
Mapping: Case of Balochistan, Pakistan
ABDUL HAMEED and IHTSHAM UL HAQ PADDA*
The progress of Pakistan remained poor in human development indicators, especially health,
education, stunting, living standard, food security, malnutrition and unemployment. It is a very
alarming condition for the Pakistan future that 44 percent of children under five years old are facing
stunting. It is notable that poverty levels in Balochistan province of Pakistan are comparatively high.
This study uses Multiple Indicator Cluster Survey (2010) data of Balochistan, for estimation of
multidimensional child poverty and deprivation with multiple dimensions using Multiple
Overlapping Deprivation Analysis (MODA). The results show that 71 percent children under five
years of age are deprived in nutrition, health, child development, housing and sanitation. A
significant difference exists between the rural and urban multidimensional deprivation as 75 percent
of rural children are deprived as compared to the 57 percent of urban. The study results call for more
investment in child poverty reduction sectors by provencial and central governments. The focus
should be on provision of economic opportunities, health, education, nutrition to enhance the
regional and area level living standards.
Keywords: Child Poverty, MODA, Balochistan, Deprivation
1. BACKGROUND
Child poverty is an imperative problem for developing countries. The child’s
depreviation level vary greatly, ranging from meterial depreviation to access to better
socioeconomic status. Children grown up in poverty are assumed to be poor in their
adulthood as poverty itself is considered a vicious cycle [Roelen, Gassmann, and de
Neubourg (2011); Minujin (2012)]. However, investment in under-five children can lead
to permanent effects in reduction of poverty and adult outcomes [Porter (2013)].
Children are deprived if they face severe deprivation of basic human needs,
including food, safe drinking water, sanitation facilities, health, shelter, education and
information. Overall, the literature on child poverty emphasises that household’s income
alone, although a good predictor of child poverty, but children’s rights are not well
expressed [Minujin (2012); Roelen, Gassmann, and de Neubourg (2011)]. The current
practice points towards a need to apply a child-centered multidimensional approach when
measuring child poverty, recognising that children’s needs are age specific and
multidimensional. Dimensions of multidimensional child poverty are different from
overall multidimensional poverty. Child poverty indicators are proper nutrition, adequate
health, child development and basic concepts, availability of proper housing, safe
drinking water and hygienic proper sanitation facilities. The children of the today will be
the wealth of tomorrow. It is the basic responsibility of government to provide facilities
regarding education, healthcare, food and nutrition security and poverty reduction.
Abdul Hameed <[email protected]> is PhD student, Federal Urdu University of Arts, Science
and Technology, Islamabad and Senior Economic Analyst, Innovative Development Strategies (Pvt.) Ltd,
Islamabad. Ihtsham ul Haq Padda <[email protected]> is Chairperson, Economic Development, Federal
Urdu University of Arts, Science and Technology, Islamabad.
728 Hameed and Padda
Pakistan is facing sustainable development deprivation and wellbeing issues. The
official statistics show material poverty in Pakistan’s 29.5 percent [ADB (2017)]. A study by
the government of Pakistan in 2016 coordinated by Oxford Poverty and Human Development
Initiative and United Nations Development Programme, depicts that 19.7 percent population
of Pakistan is multidimensional poor while in Punjab, Sindh, Khyber Pakhtunkhwa (KP) and
Balochistan 15.2 percent, 23.1 percent, 25 percent, 39 percent population is poor, respectively
[Pakistan (2016)]. It is notable that poverty levels in Balochistan are comparatively high. No
doubt overall poverty affects the child poverty. As per the economic condition of Pakistan, the
province Balochistan is also facing the same challenges in health, education, stunting, living
standard, food security, malnutrition and unemployment. It is the largest by area and smallest
by population province in Pakistan. The Balochistan’s economy is based on agriculture,
livestock, fisheries and mineral resources like production of gas, coal, iron, sulphur, marble,
limestone, etc. But lowest in the social welfare, education, health and living standard [Haq and
Farooq (2016)].
Keeping in view the socioeconomic conditions of Pakistan, the main objective of
this study is estimated and map multidimensional deprivation under the five years
children at divisional and aggregate levels. Finally to link expected returns with
socioeconomic of the society and children. On the basis of robust analysis the results will
be used to develop policies at the local and sub-regional (Divisional) level for the
marginalised people of Balochistan.
2. DATA AND METHODOLOGY
2.1. Data
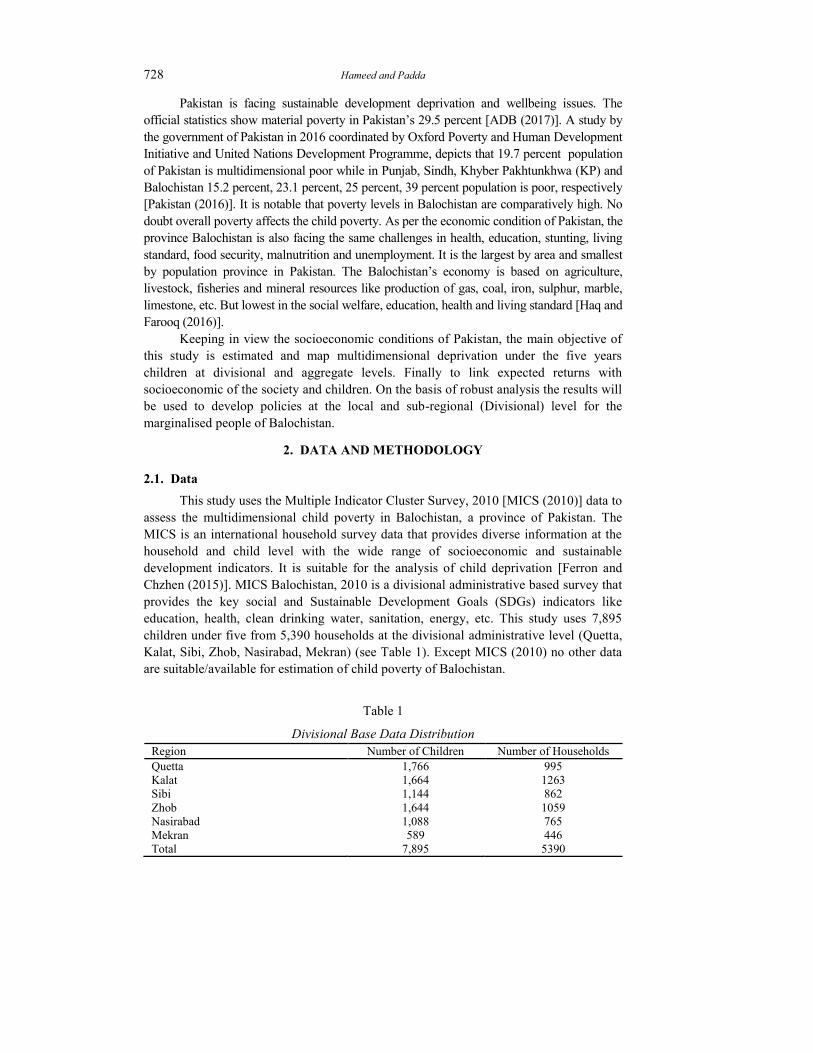
This study uses the Multiple Indicator Cluster Survey, 2010 [MICS (2010)] data to
assess the multidimensional child poverty in Balochistan, a province of Pakistan. The
MICS is an international household survey data that provides diverse information at the
household and child level with the wide range of socioeconomic and sustainable
development indicators. It is suitable for the analysis of child deprivation [Ferron and
Chzhen (2015)]. MICS Balochistan, 2010 is a divisional administrative based survey that
provides the key social and Sustainable Development Goals (SDGs) indicators like
education, health, clean drinking water, sanitation, energy, etc. This study uses 7,895
children under five from 5,390 households at the divisional administrative level (Quetta,
Kalat, Sibi, Zhob, Nasirabad, Mekran) (see Table 1). Except MICS (2010) no other data
are suitable/available for estimation of child poverty of Balochistan.
Table 1
Divisional Base Data Distribution
Region Number of Children Number of Households
Quetta 1,766 995
Kalat 1,664 1263
Sibi 1,144 862
Zhob 1,644 1059
Nasirabad 1,088 765
Mekran 589 446
Total 7,895 5390
Multidimensional Child Poverty Measurement and Its Mapping 729
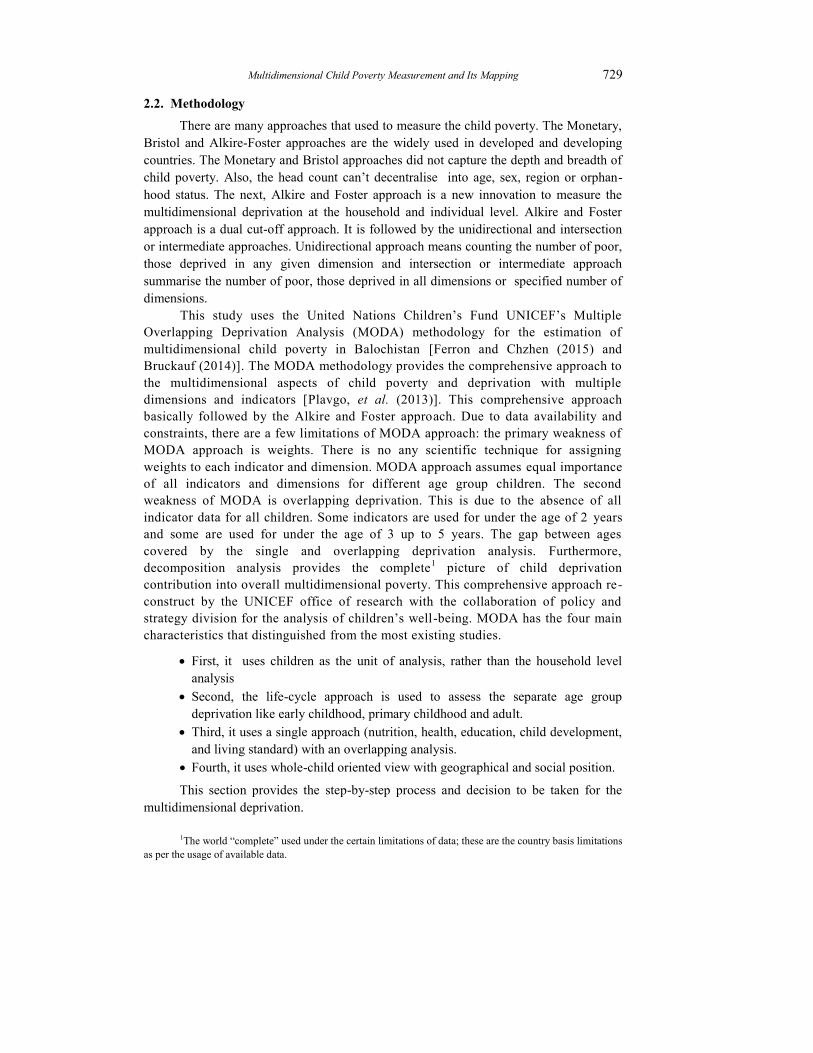
2.2. Methodology
There are many approaches that used to measure the child poverty. The Monetary,
Bristol and Alkire-Foster approaches are the widely used in developed and developing
countries. The Monetary and Bristol approaches did not capture the depth and breadth of
child poverty. Also, the head count can’t decentralise into age, sex, region or orphan-
hood status. The next, Alkire and Foster approach is a new innovation to measure the
multidimensional deprivation at the household and individual level. Alkire and Foster
approach is a dual cut-off approach. It is followed by the unidirectional and intersection
or intermediate approaches. Unidirectional approach means counting the number of poor,
those deprived in any given dimension and intersection or intermediate approach
summarise the number of poor, those deprived in all dimensions or specified number of
dimensions.
This study uses the United Nations Children’s Fund UNICEF’s Multiple
Overlapping Deprivation Analysis (MODA) methodology for the estimation of
multidimensional child poverty in Balochistan [Ferron and Chzhen (2015) and
Bruckauf (2014)]. The MODA methodology provides the comprehensive approach to
the multidimensional aspects of child poverty and deprivation with multiple
dimensions and indicators [Plavgo, et al. (2013)]. This comprehensive approach
basically followed by the Alkire and Foster approach. Due to data availability and
constraints, there are a few limitations of MODA approach: the primary weakness of
MODA approach is weights. There is no any scientific technique for assigning
weights to each indicator and dimension. MODA approach assumes equal importance
of all indicators and dimensions for different age group children. The second
weakness of MODA is overlapping deprivation. This is due to the absence of all
indicator data for all children. Some indicators are used for under the age of 2 years
and some are used for under the age of 3 up to 5 years. The gap between ages
covered by the single and overlapping deprivation analysis. Furthermore,
decomposition analysis provides the complete1 picture of child deprivation
contribution into overall multidimensional poverty. This comprehensive approach re-
construct by the UNICEF office of research with the collaboration of policy and
strategy division for the analysis of children’s well-being. MODA has the four main
characteristics that distinguished from the most existing studies.
First, it uses children as the unit of analysis, rather than the household level
analysis
Second, the life-cycle approach is used to assess the separate age group
deprivation like early childhood, primary childhood and adult.
Third, it uses a single approach (nutrition, health, education, child development,
and living standard) with an overlapping analysis.
Fourth, it uses whole-child oriented view with geographical and social position.
This section provides the step-by-step process and decision to be taken for the
multidimensional deprivation.
1The world “complete” used under the certain limitations of data; these are the country basis limitations
as per the usage of available data.
730 Hameed and Padda
2.2.1. Step 1-Choose Field, Domains and Indicators of Child Well-being
MODA is child deprivation analysis based method, meaning that any filed,
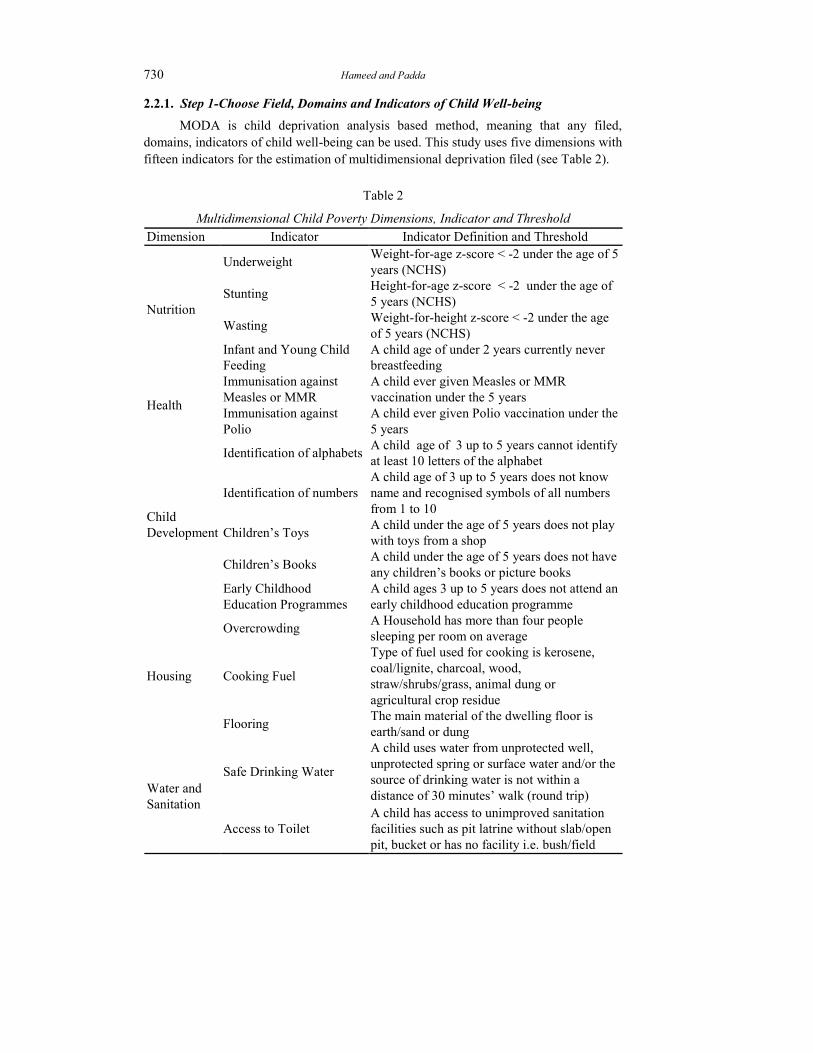
domains, indicators of child well-being can be used. This study uses five dimensions with
fifteen indicators for the estimation of multidimensional deprivation filed (see Table 2).
Table 2
Multidimensional Child Poverty Dimensions, Indicator and Threshold
Dimension Indicator Indicator Definition and Threshold
Nutrition
Underweight Weight-for-age z-score < -2 under the age of 5
years (NCHS)
Stunting Height-for-age z-score < -2 under the age of
5 years (NCHS)
Wasting Weight-for-height z-score < -2 under the age
of 5 years (NCHS)
Infant and Young Child
Feeding
A child age of under 2 years currently never
breastfeeding
Health
Immunisation against
Measles or MMR
A child ever given Measles or MMR
vaccination under the 5 years
Immunisation against
Polio
A child ever given Polio vaccination under the
5 years
Child
Development
Identification of alphabets A child age of 3 up to 5 years cannot identify
at least 10 letters of the alphabet
Identification of numbers
A child age of 3 up to 5 years does not know
name and recognised symbols of all numbers
from 1 to 10
Children’s Toys A child under the age of 5 years does not play
with toys from a shop
Children’s Books A child under the age of 5 years does not have
any children’s books or picture books
Early Childhood
Education Programmes
A child ages 3 up to 5 years does not attend an
early childhood education programme
Housing
Overcrowding A Household has more than four people
sleeping per room on average
Cooking Fuel
Type of fuel used for cooking is kerosene,
coal/lignite, charcoal, wood,
straw/shrubs/grass, animal dung or
agricultural crop residue
Flooring The main material of the dwelling floor is
earth/sand or dung
Water and
Sanitation
Safe Drinking Water
A child uses water from unprotected well,
unprotected spring or surface water and/or the
source of drinking water is not within a
distance of 30 minutes’ walk (round trip)
Access to Toilet
A child has access to unimproved sanitation
facilities such as pit latrine without slab/open
pit, bucket or has no facility i.e. bush/field
Multidimensional Child Poverty Measurement and Its Mapping 731
2.2.2. Step 2-Define Deprivation and Specify its Dimensions
Nutrition
Nutritional well-being is not just a basic human right. It is more important for the
human capital development. Children under five years of age in the developing country are
facing malnutrition, due to the lack of adequate food and poor health [Reinhard and
Wijayaratne (2002)]. There are different indicators (Underweight, Stunting and Wasting) used
to assess the malnutrition in children under five [Maken and Varte (2012)]. This study uses
anthropometric measurements, underweight (weight-for-age), stunting (height-for-age),
wasting (weight-for-height) and infant and young child feeding for the evaluation of
insufficient nutrition in children under five. The infant and young child feeding are also the
most important role in the growth and development of children under five. This study uses the
given Z-score of MICS under the United Stated National Centre for Health Statistics (NCHS)
threshold guideline for the deprivation of underweight, stunting and wasting [Wang and Chen
(2012); Maken and Varte (2012); Reinhard and Wijayaratne (2002)]. A child is considered to
be deprived in underweight, stunting, wasting and young child feeding as follow;
Underweight = Weight-for-age z-score < -2 under the age of 5 years (NCHS)
Stunting = Height-for-age z-score < -2 under the age of 5 years (NCHS)
Wasting = Weight-for-height z-score < -2 under the age of 5 years (NCHS)
I &YCF = A child under 2 years of age currently never breastfeeding (WHO).
Health
The 3rd important goal of sustainable development is health “Ensure healthy lives
and promote well-being for all at all ages” [UNDP (2016)]. This study uses immunisation
against Measles or MMR and polio indicator for the estimation of health dimension. A
child is deprived in the immunisation against measles or MMR and polio if s/he not ever
given measles or MMR and polio vaccination under the 5 years.
Child Development
Child development dimension includes child education and development activities.
A child (3 up to 5 years) is deprived in the child development if se/he cannot identify at
least 10 letters of the alphabet or does not know name and recognised symbols of all
numbers from 1 to 10 or does not attend an early childhood education programme and
child (under 5 years) does not play with toys from a shop or does not have any children’s
books or picture books [UNICEF (2015)].
Housing
Housing dimension includes overcrowding, cooking fuel and flooring to assess the
living stander of children under five. A child is deprived in the housing if s/he lives in a
household where more than four people sleeping per room on average or household used
for cooking is kerosene, coal/lignite, charcoal, wood, straw/shrubs/grass, animal dung or
agricultural crop residue or main material of the dwelling floor is earth/sand or dung.
732 Hameed and Padda
Water and Sanitation
A child is deprived in water and sanitation dimension if s/he uses water from
unprotected well, unprotected spring or surface water and/or the source of drinking water
is not within a distance of 30 minutes’ walk (round trip) or has access to unimproved
sanitation facilities such as pit latrine without slab/open pit, bucket or has no facility i.e.
bush/field [UNICEF (2015)].
2.2.3. Step 3- Choose a Unit of Analysis
This study uses child as a unit of analysis with the combination of household and
the child level datasets of MICS. The dimension nutrition, health and child development
are used from the child level dataset and dimension housing, water and sanitation are
used from the household level dataset.
2.2.4. Step 4- Define Weights
According to the MODA methodology, all the deprivation is equally important. It
means that this study no explicit weighting assign, it should be noted that implicitly equal
weighting assign to the each dimension (see Table 2).
2.2.5. Step 5-Define Cut-Offs
MODA also followed by the dual cut off approach that explained above. The
selection of any of these approaches stipulated well-known information or judgment taking
into consideration. To avoid this decision, MODA presents results at all possible cut-off
points. This study followed by the union and intermediate cut-off approaches for the
identification of single and multidimensional deprivation. This study uses a union approach at
the single dimension level analysis: A child s/he will be considered multidimensionally
deprived in the specific dimension if s/he experiences at least one deprivation in the specific
domain indicator and intermediate approach uses at the aggregate level analysis: A child s/he
will be considered multidimensionally poor at overall if s/he experiences more than three
dimensions deprived. mostly, multidimensional studies used 1/3 (.33) score as a cut-off at the
overall estimation of multidimensional poverty and some developing coutries suggest fexible
cut-off at ½ (.50) or ½.5 (0.40). This sudty suggest soft cut-off point at K>3 out of 5
dimensions (0.60) to assess the overall multidimensional poverty in Balochistan beucause
Balochistan is more deprive in household income, employment, health, education and
infrastuecture as compared to the other provinces of Pakistan.
2.2.6. Step 6-Single Deprivation by Indicators and Dimensions
This study uses the deprivation status headcount ratio for the each indicator and
dimension according to the threshold definition (see Table 2). The headcount ratio means
that the number of children deprived in the respective indicator or dimension as a share of
the total number of children in the respective indicator or dimension. The following
formula uses to estimate the headcount ratio:
,
, (1)j r
j r
r
qh
n … … … … … … … (1)
Multidimensional Child Poverty Measurement and Its Mapping 733
,
1
(2)rn
j r j
i
q y
… … … … … … … (2)
Where
,j rh -Headcount ratio of deprived children in indicator j.
jq -Number of deprived children in indicator j.
rn -A number of the total children in the reference population r.
jy -Status of deprivation, according to the threshold (yes=1, otherwise zero), jy
=1 (deprived) if jx < jz and jy =0 (no deprived) if jx > jz .
jx -Value of indicator j.
jz -Threshold of indicator j.
Here noted that after the estimation of single indicator level than the similar
formula used for the dimension level, after the assigning of threshold (yes=1, otherwise
zero) as per the indicator status.
2.2.7. Step 7-Overlaping Deprivation
After the single deprivation analysis, each dimension deprivation status count into
the single variable like one child has deprived in nutrition, health and housing, it means
that the counting total of child one is 1+1+1=3 and the second child has deprived into
nutrition, health, child development, housing and water and sanitation than the counting
total of second child is 1+1+1+1+1=5. The following formula is used for the deprivation
counting:
1
(3)d
i j
j
D y
… … … … … … … (3)
Where
iD -Total number of dimensions, where a child i is deprived with jy =1 if a child
is deprived in the dimension j ; jy =0 if a child is not deprived in dimension
j .
2.2.8. Step 8-Multidimensional Child Poverty at Different Cutoff Points
The multidimensional headcount deprivation measures the number of children
deprived in the respective cutoff point. The multidimensional deprivation measures as:
Assign deprivation status of each indicator according to threshold (see Table 2).
After assigning deprivation each indicator, if s/he deprived in any indicator also
consider deprived in the respective dimension.
734 Hameed and Padda
In the second stage, summation of all the dimensional deprivation status into
iD as per the overlapping.
This study uses K>3 is the cutoff point for the multidimensional deprivation. It
means that if a child deprived in more than 3 dimensions that will be considered
multidimensionally deprived child.
This can be defined as follows:
1 (4)k iy if D K … … … … … … (4)
0 (5)k iy if D K … … … … … … (5)
For the estimation of multidimensional child headcount deprivation, the following
formula can be applied:
(6)k
a
qH
n … … … … … … … (6)
1
(7)n
k k
i
q y
… … … … … … … (7)
Where
H -Multidimensional child deprivation headcount.
kq -Total number multidimensional deprived children.
an -Total number of children.
ky -Deprivation status of children on the cutoff base.
K -Cutoff point.
To calculate the average intensity of multidimensional deprivation A measures the
breath of child poverty.2
1 (8)*
kq
k
k
c
Aq d
… … … … … … … (8)
Where
A -Average intensity of multidimensional deprivation.
kq -Number of children affected by at least k.
d -Total number of dimensions.
2A is what Alkire and Foster (2007) defines as “intensity of poverty (A)”. Noted that A similar to
Alkire’s and Foster’s but differs in one important way in MODA; instead of measuring the average intensity of
deprivation among the multidimensional poverty, A measure for the whole population.
Multidimensional Child Poverty Measurement and Its Mapping 735
kc -Number of deprivation each multidimensional deprived child, with
*k i kc D y
The third component of multidimensional deprivation is adjusted headcount ratio or
multidimensional child poverty. Multidimensional child poverty is the combination of
headcount and average intensity of deprivation. This measure of poverty satisfies the property
of “dimensional monotonicity”.3 The multidimensional poverty measure as follows:
0 * (9)M H A … … … … … … … (9)
Where
0M -Multidimensional child poverty (Adjusted headcount ratio).
H -Headcount of deprived children as per cut-off point.
A -Average intensity of deprivation.
2.2.9. Step 9-Decomposition of Multidimensional Poverty by Dimensions
Decomposition is the important step to understand the depth and the contribution
of dimensions into multidimensionally deprivation or adjusted headcount ratio (Mo). To
understand the each dimension contribution into adjusted head count ratio as follows:
*
1
( )
(10)* *
n
j k
ij
a o
y y
Pn d M
… … … … … … (10)
Where
jP -Contribution of each dimension into the adjusted head count.
1
( * )n
j k
i
y y
-Total number of children deprived in the respective dimension
while also deprived multidimensionally.
an -Total number of children.
d -Total number of dimensions.
OM -Adjusted head count ratio.
3. RESULTS
This section presents the comprehensive empirical results to understand the depth
of multidimensional deprivation under the five years old children in the Balochistan
province of Pakistan. The empirical results describe into four subsections;
3Dimensional monotonicity suggests that in a situation where a multidimensional poor person increase
his or her poverty by becoming deprived in a dimension on which (s) he was previously not deprived, overall
poverty level increase.
736 Hameed and Padda
Single deprivation analysis
Overlapping deprivation analysis
Multidimensional deprivation analysis
Decomposition by dimensions
3.1. Single Deprivation Analysis
The single deprivation analysis presents the empirical results by indicators and
dimensions under the regional, area and gender level.
Deprivation Incidence by Indicators at a Balochistan, Regional,
Gender and Area Level
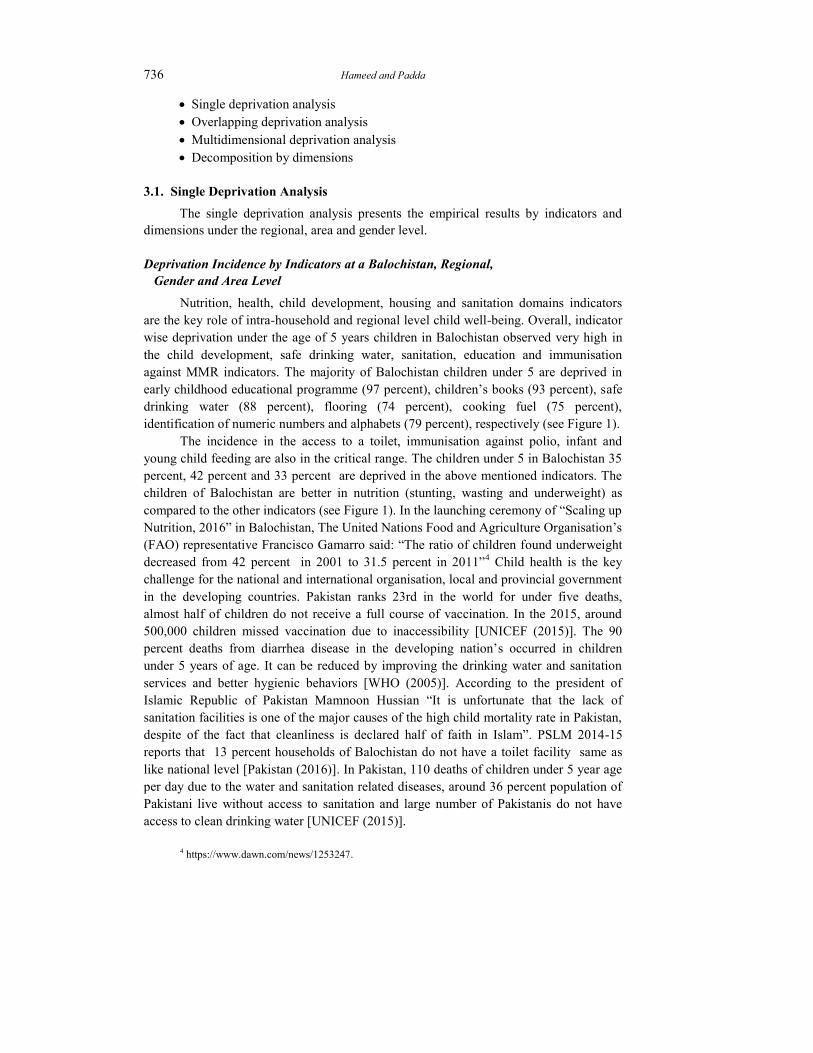
Nutrition, health, child development, housing and sanitation domains indicators
are the key role of intra-household and regional level child well-being. Overall, indicator
wise deprivation under the age of 5 years children in Balochistan observed very high in
the child development, safe drinking water, sanitation, education and immunisation
against MMR indicators. The majority of Balochistan children under 5 are deprived in
early childhood educational programme (97 percent), children’s books (93 percent), safe
drinking water (88 percent), flooring (74 percent), cooking fuel (75 percent),
identification of numeric numbers and alphabets (79 percent), respectively (see Figure 1).
The incidence in the access to a toilet, immunisation against polio, infant and
young child feeding are also in the critical range. The children under 5 in Balochistan 35
percent, 42 percent and 33 percent are deprived in the above mentioned indicators. The
children of Balochistan are better in nutrition (stunting, wasting and underweight) as
compared to the other indicators (see Figure 1). In the launching ceremony of “Scaling up
Nutrition, 2016” in Balochistan, The United Nations Food and Agriculture Organisation’s
(FAO) representative Francisco Gamarro said: “The ratio of children found underweight
decreased from 42 percent in 2001 to 31.5 percent in 2011”4 Child health is the key
challenge for the national and international organisation, local and provincial government
in the developing countries. Pakistan ranks 23rd in the world for under five deaths,
almost half of children do not receive a full course of vaccination. In the 2015, around
500,000 children missed vaccination due to inaccessibility [UNICEF (2015)]. The 90
percent deaths from diarrhea disease in the developing nation’s occurred in children
under 5 years of age. It can be reduced by improving the drinking water and sanitation
services and better hygienic behaviors [WHO (2005)]. According to the president of
Islamic Republic of Pakistan Mamnoon Hussian “It is unfortunate that the lack of
sanitation facilities is one of the major causes of the high child mortality rate in Pakistan,
despite of the fact that cleanliness is declared half of faith in Islam”. PSLM 2014-15
reports that 13 percent households of Balochistan do not have a toilet facility same as
like national level [Pakistan (2016)]. In Pakistan, 110 deaths of children under 5 year age
per day due to the water and sanitation related diseases, around 36 percent population of
Pakistani live without access to sanitation and large number of Pakistanis do not have
access to clean drinking water [UNICEF (2015)].
4 https://www.dawn.com/news/1253247.

Multidimensional Child Poverty Measurement and Its Mapping 737
The intra-regional deprivation results show that the children under-five in the
Sibi division are more deprived in underweight (38 percent) indicator as compared to
the other divisions. The stunting situation has more worsened in the Mekran division,
where 50 percent children under-five are facing stunting. The infant and young child
feeding deprivation (38 percent) in Quetta division and followed by Sibi and Zhob
divisions 36 percent and 37 percent, respectively (see Table 3). At a regional level, as
a whole in Balochistan more than 50 percent children under-five are deprived in
immunisation against MMR and polio, identification of numeric numbers and
alphabets, children’s books, early childhood education, cooking fuel, safe drinking
water and sanitation indicators. Almost a third of the South Asian children who are
out of school at the school going age live in Pakistan, where 38.9 percent are girls
and 30.2 percent are boys. Education is the 4th important goal of sustainable
development “Ensure inclusive and equitable quality education and promote lifelong
learning opportunities for the all” [UNDP (2016)]. The indicators wasting, access to
a toilet and overcrowding are better in the Mekran division as compared to the other
divisions (see Table 3).
Table 3
Indicators Wise Deprivation by Divisional under the Age of
5 Years Children in Balochistan (%)
Quetta Kalat Sibi Zhob Nasirabad Mekran
% % % % % %
Underweight 17 21 38 13 28 14
Stunting 24 21 33 12 30 50
Wasting 13 12 15 7 11 3
Infant and Young Child Feeding 38 27 36 37 23 28
Immunisation against MMR 80 79 89 88 77 55
Immunisation against Polio 42 51 48 30 41 46
Identification of Alphabets 85 78 82 83 77 57
Identification of Numbers 85 80 79 84 71 69
Children’s Toys 48 56 61 71 53 39
Children’s Books 96 93 97 96 94 65
Early Childhood Education
Programmes
98 98 98 97 97 96
Overcrowding 22 7 15 13 6 2
Cooking Fuel 58 84 55 92 75 89
Flooring 61 76 70 87 81 66
Safe Drinking Water 91 88 83 81 93 95
Access to Toilet 30 28 41 51 41 15
N 1766 1664 1144 1644 1088 589
The indicator wise deprivation range among female gender is 41 percent to 47
percent and among male gender is 53 percent to 59 percent (see Figure 2). There is a
significant gap exist between the urban and rural Balochistan. Overall, the children living
in the rural areas are more deprived than urban areas.
738 Hameed and Padda
The difference between children living in the rural and urban areas in access to a
toilet, safe drinking water, early childhood education, immunisation, infant and young
child feeding and malnutrition (84 percent, 50 percent, 56 percent, 60 percent, 56 percent,
and 54 percent respectively). It means that the child well-being problems are the serious
concern for the rural areas of Balochistan (see Figure 3).
Deprivation Incidence by Dimension at a Balochistan, Regional,
Gender and Area Level
The single dimensional level analysis is the combination of indicator wise
deprivation. A child considered to be deprived in each dimension if s/he deprived in
respective any indicator. Overall, dimensional wise deprivation shows the pathetic
situation at the Balochistan level, 46 percent children deprive in nutrition, 81 percent in
health, 99 percent in child development, 89 percent in housing and 93 percent in
sanitation dimension (see Table 4).
Table 4
Overall Dimension Wise Deprivation under the Age of 5 Years Children in Balochistan
% N
Nutrition 46 3620
Health 81 6405
Child Development 99 7804
Housing 89 7063
Sanitation 93 7368
Multidimensional Child Poverty Measurement and Its Mapping 739
The dimensional deprivation results show that the children under-five in the Mekran
division are more deprived in nutrition (58 percent) followed by Sibi division in nutrition (56
percent) dimension as compared to the other divisions. The health situation is better in the
Mekran division as compared to other divisions, where 58 percent children under–five are
facing health deprivation. Apart from Mekran, all other divisions’ health situations are very
bad. In these all other divisions, more than 77 percent children are deprived in health. At the
regional level, the children under-five facing a very underprivileged situation in child
development, housing and sanitation dimension (see Table 5).
Table 5
Dimension Wise Deprivation by Region under the Age of
5 Years Children in Balochistan
Quetta Kalat Sibi Zhob Nasirabad Mekran
% % % % % %
Nutrition 49 41 56 34 47 58
Health 81 80 90 88 77 58
Child Development 99 99 100 99 99 96
Housing 80 94 85 97 89 92 Sanitation 95 91 94 91 96 96
N 1766 1664 1144 1644 1088 589
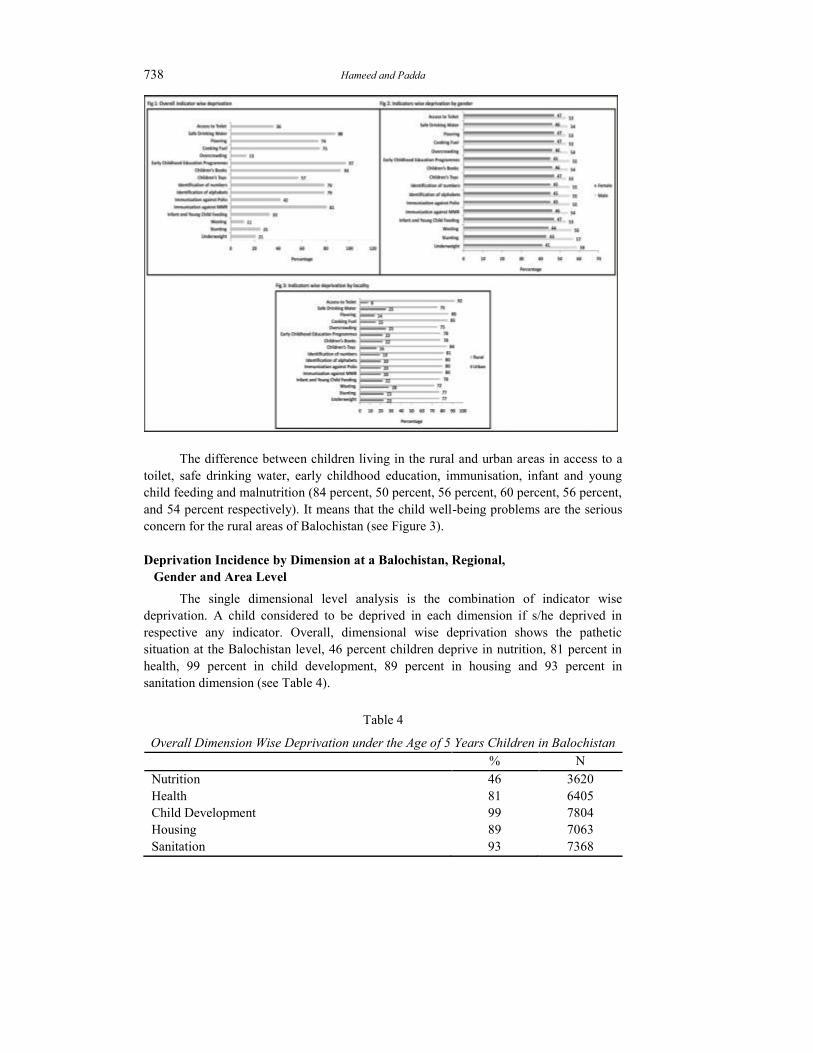
The deprivation analysis of dimensional level among male and female children is same
as like the above mentioned indicator wise analysis. There is very little gap between the male
and female distribution (see Figure 4). As per the indicator wise results, the dimensional
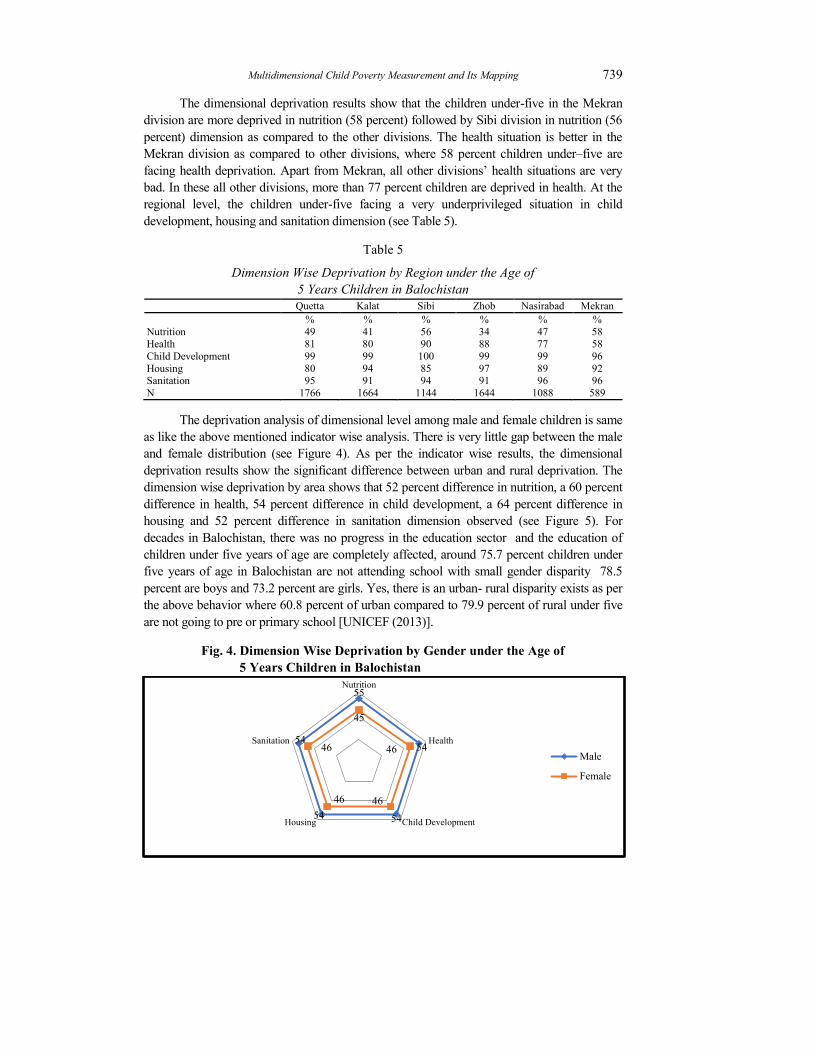
deprivation results show the significant difference between urban and rural deprivation. The
dimension wise deprivation by area shows that 52 percent difference in nutrition, a 60 percent
difference in health, 54 percent difference in child development, a 64 percent difference in
housing and 52 percent difference in sanitation dimension observed (see Figure 5). For
decades in Balochistan, there was no progress in the education sector and the education of
children under five years of age are completely affected, around 75.7 percent children under
five years of age in Balochistan are not attending school with small gender disparity 78.5
percent are boys and 73.2 percent are girls. Yes, there is an urban- rural disparity exists as per
the above behavior where 60.8 percent of urban compared to 79.9 percent of rural under five
are not going to pre or primary school [UNICEF (2013)].
Fig. 4. Dimension Wise Deprivation by Gender under the Age of
5 Years Children in Balochistan
55
54
54 54
54
45
46
46 46
46
Nutrition
Health
Child DevelopmentHousing
Sanitation
Male
Female
740 Hameed and Padda
Fig. 5. Dimension Wise Deprivation by Locality Under the Age of 5 Years
Children in Balochistan
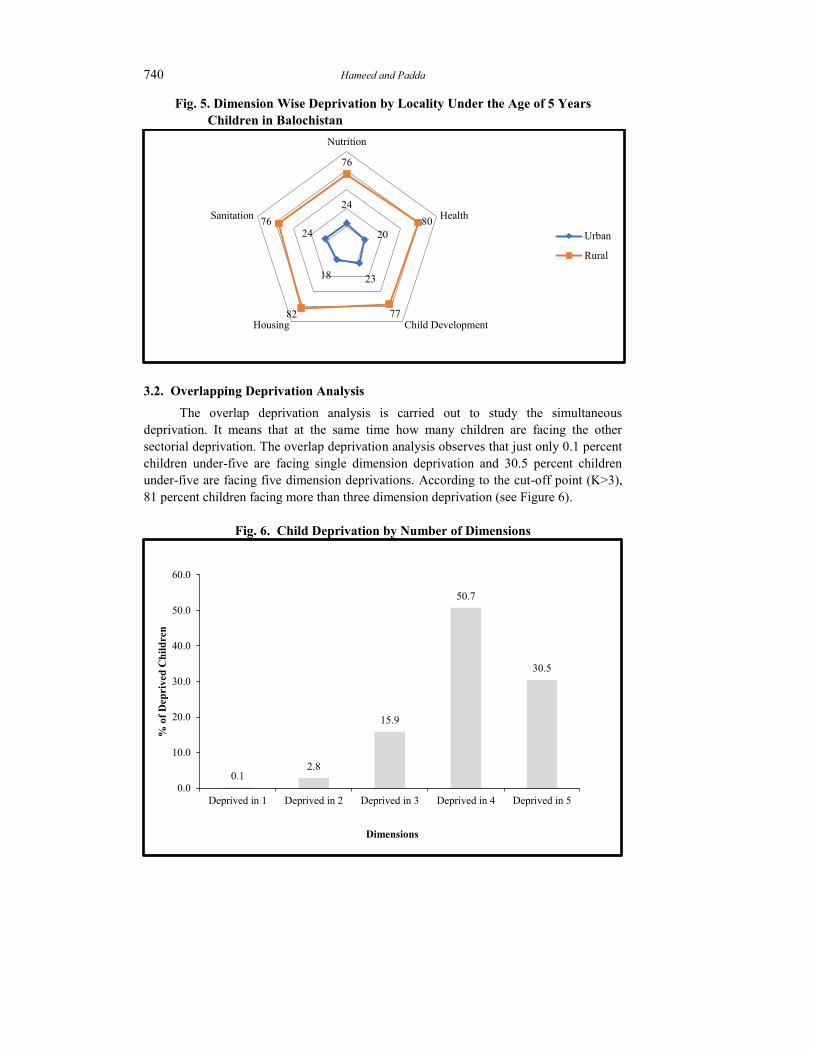
3.2. Overlapping Deprivation Analysis
The overlap deprivation analysis is carried out to study the simultaneous
deprivation. It means that at the same time how many children are facing the other
sectorial deprivation. The overlap deprivation analysis observes that just only 0.1 percent
children under-five are facing single dimension deprivation and 30.5 percent children
under-five are facing five dimension deprivations. According to the cut-off point (K>3),
81 percent children facing more than three dimension deprivation (see Figure 6).
Fig. 6. Child Deprivation by Number of Dimensions
24
20
23 18
24
76
80
77 82
76
Nutrition
Health
Child DevelopmentHousing
Sanitation
Urban
Rural
0.1 2.8
15.9
50.7
30.5
0.0
10.0
20.0
30.0
40.0
50.0
60.0
Deprived in 1 Deprived in 2 Deprived in 3 Deprived in 4 Deprived in 5
% o
f D
ep
riv
ed
Ch
ild
ren
Dimensions
Multidimensional Child Poverty Measurement and Its Mapping 741
3.3. Multidimensional Deprivation Analysis
In the previous sections, study presented the single deprivation analysis by the
indicator and dimension wise identification of number of deprived children. The multiple
deprivation analysis gives detail understanding at the respective cut-off point. The following
three deprivation ratios used to understand the aggregate situation of multidimensional
deprivation: the deprivation headcount ratio (H) showing the percentage of multidimensional
deprived children; the average intensity of multidimensional deprivation (A) showing the
average breadth of child deprivation; and adjusted headcount ratio (Mo) which is the calculate
with headcount ratio (H) adjusted by the average intensity (A) of deprivation.
Table 6
Deprivation Headcount, Intensity and Multidimensional Child
Poverty by Gender and Locality
Headcount Average Intensity Adjusted head count (M0)
(%) (%) (%)
Balochistan 81.2 87.5 71.1
Male 81.2 87.7 71.2
Female 81.2 87.3 70.9 Urban 65.8 86.4 56.9
Rural 85.9 87.8 75.3
As per the selected cut-off, 71 percent children are facing multidimensional
poverty/deprivation at the Balochistan level and followed by the gender male (71.2
percent) and female (70.9 percent) deprivation. At the area level, the average intensity of
deprivation almost same (87 percent), however, varies across urban (59.9 percent) and
rural (75.3 percent). It means that the average breadth of multidimensional deprivation
same across the area and gender (see Table 6).
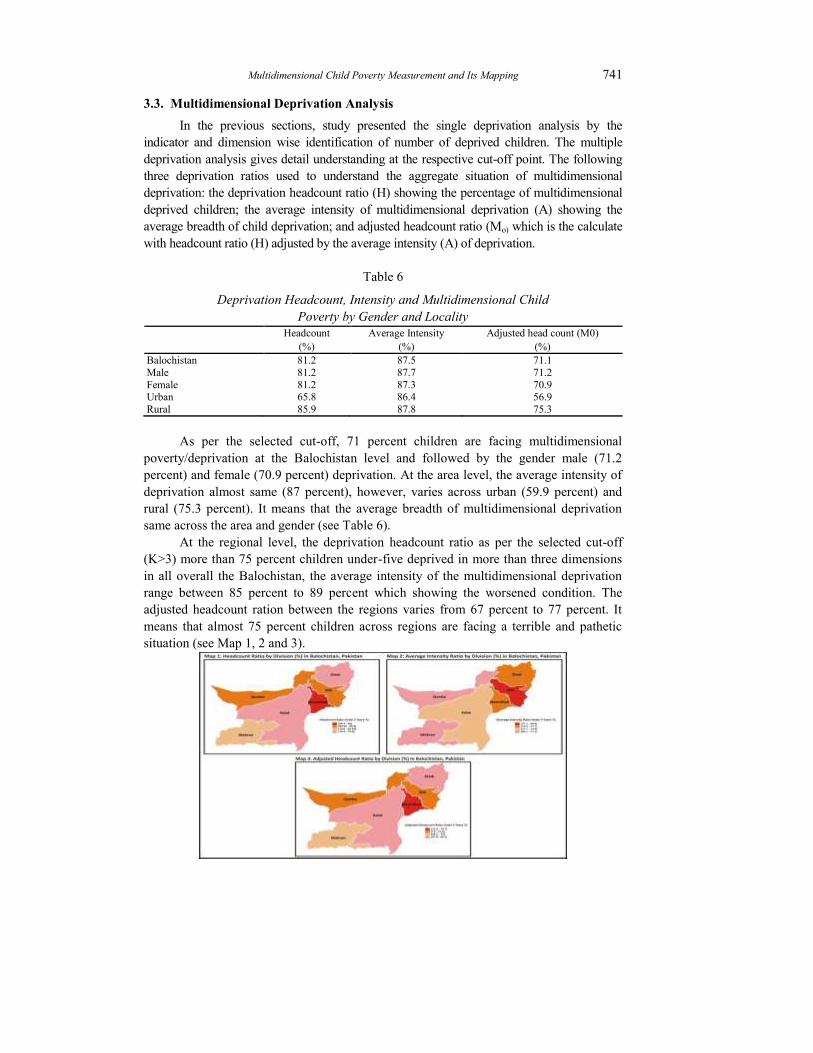
At the regional level, the deprivation headcount ratio as per the selected cut-off
(K>3) more than 75 percent children under-five deprived in more than three dimensions
in all overall the Balochistan, the average intensity of the multidimensional deprivation
range between 85 percent to 89 percent which showing the worsened condition. The
adjusted headcount ration between the regions varies from 67 percent to 77 percent. It
means that almost 75 percent children across regions are facing a terrible and pathetic
situation (see Map 1, 2 and 3).
742 Hameed and Padda
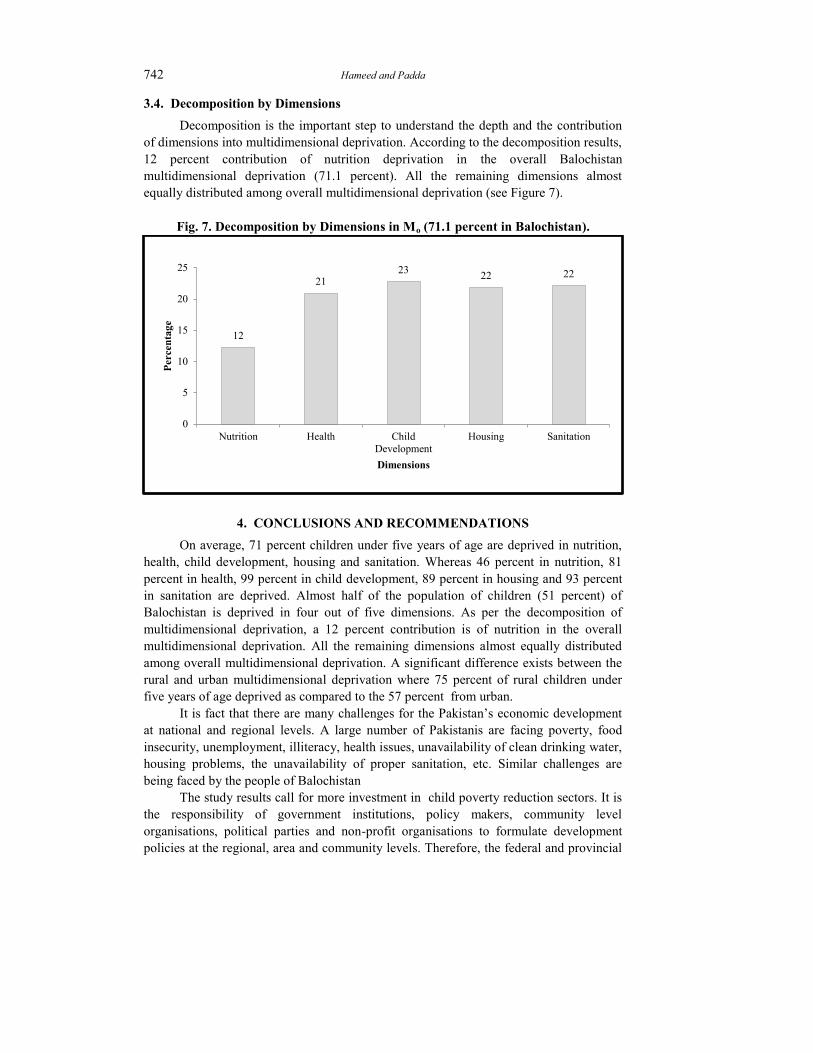
3.4. Decomposition by Dimensions
Decomposition is the important step to understand the depth and the contribution
of dimensions into multidimensional deprivation. According to the decomposition results,
12 percent contribution of nutrition deprivation in the overall Balochistan
multidimensional deprivation (71.1 percent). All the remaining dimensions almost
equally distributed among overall multidimensional deprivation (see Figure 7).
Fig. 7. Decomposition by Dimensions in Mo (71.1 percent in Balochistan).
4. CONCLUSIONS AND RECOMMENDATIONS
On average, 71 percent children under five years of age are deprived in nutrition,
health, child development, housing and sanitation. Whereas 46 percent in nutrition, 81
percent in health, 99 percent in child development, 89 percent in housing and 93 percent
in sanitation are deprived. Almost half of the population of children (51 percent) of
Balochistan is deprived in four out of five dimensions. As per the decomposition of
multidimensional deprivation, a 12 percent contribution is of nutrition in the overall
multidimensional deprivation. All the remaining dimensions almost equally distributed
among overall multidimensional deprivation. A significant difference exists between the
rural and urban multidimensional deprivation where 75 percent of rural children under
five years of age deprived as compared to the 57 percent from urban.
It is fact that there are many challenges for the Pakistan’s economic development
at national and regional levels. A large number of Pakistanis are facing poverty, food
insecurity, unemployment, illiteracy, health issues, unavailability of clean drinking water,
housing problems, the unavailability of proper sanitation, etc. Similar challenges are
being faced by the people of Balochistan
The study results call for more investment in child poverty reduction sectors. It is
the responsibility of government institutions, policy makers, community level
organisations, political parties and non-profit organisations to formulate development
policies at the regional, area and community levels. Therefore, the federal and provincial
12
21 23
22 22
0
5
10
15
20
25
Nutrition Health Child
Development
Housing Sanitation
Percen
tag
e
Dimensions
Multidimensional Child Poverty Measurement and Its Mapping 743
governments, should focus on the provision of economic opportunities, health, education,
nutrition to enhance the regional and area level living standards. However, rural areas
need more focus than urban. The CPEC is one of the beacons from which it is expected
that more trade, employment, health and education opportunities will be available for
local population. Small business men and farm owners can promote their businesses and
farm products. If the benefits are transferred towards local population, it will directlly
have an impact on living standards of local population and reduction in child poverty as
well.
REFERENCES
ADB (2017) Basic Statistics, 2017. Manila: Asian Development Bank.
Alkire, S. and J. Foster (2007) Counting and Multidimensional Poverty Measurements.
University of Oxford. (OPHI Working Paper No.7).
Bruckauf, Z. (2014) Child Poverty and Deprivation in Bosnia and Herzegovina.
Florence: UNICEF Office of Research .
Ferron, L. and Y. Chzhen (2015) Child Poverty and Deprivation in Bosnia and
Herzegovina: National Multiple Overlapping Deprivation Analysis (N-MODA).
Florence: UNICEF Office of Research. (Innocenti Working Paper No. 2015-02).
Haq, R. and N. Farooq (2016) Impact of CPEC on Social Welfare in Pakistan: A District
Level Analysis. 32nd Annual General Meeting and Conference. Islamabad: Pakistan
Institute of Development Economics.
Khan, H. and H. J. Khan (2016) Socio-economic Analysis of China-Pak Economic
Corridor: A Case Study of Gwadar Balochistan. International Journal of Social
Science and Humanities Research 4:3, 409–415.
Maken, T. and L. R. Varte (2012) Nutritional Status of Children as Indicated by z-scores
of the Hmars: A Tribe of N. E. India. Physical Anthropology 8:1, 213–227.
MICS (2010) Multiple Indicator Cluster Survey. Planning and Development Department,
Government of Balochistan collaboration with United Nations Children's Fund.
Minujin, A. (2012) Making the Case for Measuring Child Poverty. In I. Ortiz, L.
Moreira-Daniels, and S. Engilbertsdóttir Child Poverty and Inequality: New
Perspectives. NewYork: UNICEF.
Oxford Poverty and Human Development Initiative (2014) Multidimensional Poverty
Index. University of Oxford: OPHI.
Pakistan, Government of (2016) Economic Survey of Pakistan. Islamabad: Finance
Division.
Pakistan, Government of (2016) Multidimensional Poverty in Pakistan. Islamabad:
Planning Commission of Pakistan.
Pakistan, Government of (2016) Pakistan Social and Living Standards Measurement
Survey 2014-15. Islamabad: Pakistan Bureau of Statistics.
Plavgo, I., M. Kibur, M. Bitew, T. Gebreselassie, Y. Matsuda, and R. Pearson (2013)
Multidimensional Child Deprivation Trend Analysis in Ethiopia: Further Analysis of
the 2000, 2005 and 2011 Demographic and Health Surveys. Calverton, MD: ICF
International. (DHS Further Analysis Reports No. 83).
Porter, C. (2013) Nutrition in Early Childhood: Insights from Rural Ethiopia, Child
Poverty Insights from Rural Ethopia. UNICEF.
744 Hameed and Padda
Reinhard, I. and K. Wijayaratne (2002) The Use of Stunting and Wasting as Indicator for
the Food Security and Poverty. Trincomalee: IFSP. (Working Paper No. 27).
Roelen, K. (2014) Multidimensional Child Poverty in Vietnam from a Longitudinal
Perspective–Improved Lives or Impoverished Conditions? Child Indicators Research
7:3, 487–516.
Roelen, K., F. Gassmann, and C. de Neubourg (2011) False Positives or Hidden
Dimensions: What can Monetary and Multidimensional Measurement Tell us about
Child Poverty in Vietnam? International Journal of Social Welfare 21:4, 393–407.
Snieska, V. and I. Simkunaite (2009) Socio-economic Impact of Infrastructure
Investments. Economics of Engineering Decisions 3, 16–25.
UNDP (2016) Pakistan Annual Report 2015. Islamabad: United Nations Development
Programme, Pakistan.
UNICEF (2013) Out-of-School Children in the Balochistan, Khyber Pakhtunkhwa,
Punjab and Sindh Provinces of Pakistan. Islamabad: United Nations Children’s Fund
(UNICEF) Pakistan.
UNICEF (2015) Pakistan Annual Report 2015. Islamabad: UNICEF Pakistan.
Wang, Y. and H.-J. Chen (2012) Use of Percentiles and Z -Scores in Anthropometry. In
Handbook of Anthropometry Physical Measures of Human form in Health and
Disease (pp. 29-47). Springer.
WHO (2005) Water for Life. Geneva: World Health Organization and UNICEF