multi-parameter troll 9500 operator's manual · multi-parameter troll 9500 wqp-100...
TRANSCRIPT
Multi-Parameter TROLL 9500WQP-100
OPERATOR’S MANUAL
November 2006
Multi-ParameterWater Quality TROLL®
Copyright © 2001 – 2006 by In-Situ Inc. All rights reserved.
Revision history Beta draft September 23, 2005Initial release, October 28, 2005
Rev. 001, April 6, 2006Rev. 002, November 2006
This document contains proprietary information which is protected by copyright. No part of this document may be photocopied, reproduced, or translated to
another language without the prior written consent of In-Situ Inc.
Mailing & Shipping Address: Phone: 970 498 1500In-Situ Inc. Fax: 970 498 1598221 E. Lincoln Ave. Internet: www.in-situ.comFort Collins, CO 80524 Support Line: 800 446 7488USA (US & Canada)
The information in this document is subject to change without notice. In-Situ Inc. has made a reasonable effort to be sure that the information contained herein iscurrent and accurate as of the date of publication.
In-Situ Inc. makes no warranty of any kind with regard to this material, including, but not limited to, its fitness for a particular application. In-Situ will not be liable
for errors contained herein or for incidental or consequential damages in connection with the furnishing, performance, or use of this material.
In no event shall In-Situ Inc. be liable for any claim for direct, incidental, or consequential damages arising out of, or in connection with, the sale, manufacture,delivery, or use of any product.
Images in this manual have been selected for illustration; actual images may vary from those shown.
In-Situ and the In-Situ logo, Win-Situ, TROLL, BaroTROLL, HERMIT, RuggedReader, RuggedCable, and RDO are trademarks or registered trademarks of In-Situ Inc. Microsoft, Windows, Internet Explorer, Excel, and ActiveSync are trademarks or registered trademarks of Microsoft Corporation. Teflon and Delrin areregistered trademarks of E. I. DuPont de Nemours and Company. Viton is a registered trademark of DuPont Dow Elastomers. Kellems is a registered trademark
of Hubbell Inc. NIST is a registered trademark of the National Institute of Standards and Technology. Alconox is a registered trademark of Alconox Inc. Otherbrand names and trademarks are the property of their respective owners.
0095110 rev. 002 11/06
Multi-ParameterWater Quality TROLL®
Contents
1 INTRODUCTION ................................................ 1General Description of the MP TROLL 9500 ...................................... 1How to Use This Manual .................................................................... 1
Conventions ............................................................................... 2Unpacking and Inspection .................................................................. 2
Serial Number ............................................................................ 2To Our Customers . . . ........................................................................ 2What We Provide ............................................................................... 3
Warranty Provisions ................................................................... 3Firmware & Software Upgrades ................................................. 3
How to Contact Us ............................................................................. 3To Obtain Repair Service (U.S.) ................................................ 3
Outside the U.S. ............................................................... 3Certification ........................................................................................ 3Cleaning Guidelines ........................................................................... 4
2 COMPONENTS & FEATURES ............................... 5System Description ............................................................................ 5Standard Features .............................................................................. 5Optional Features ............................................................................... 5Cables ................................................................................................ 6
RuggedCable™ ......................................................................... 6Cable Desiccants ....................................................................... 7Communication Cables ............................................................. 7
Power Components ............................................................................ 7Internal Power ........................................................................... 7External Power .......................................................................... 7
Water Quality Accessories .................................................................. 8Installation Accessories ...................................................................... 9Control Software ................................................................................. 9Product Specifications ...................................................................... 10
3 GETTING STARTED .......................................... 12Power ............................................................................................... 12Sensors ............................................................................................ 13Cable ................................................................................................ 14
Connect the RuggedCable to the TROLL 9500 ....................... 14Connect the TROLL Com to the RuggedCable ........................ 14
PC Connection ................................................................................. 15Software Setup ................................................................................. 15
Install the Software .................................................................. 15Establish Communication with the MP TROLL 9500 ............... 15Set the Real-Time Clock .......................................................... 16
Quick-Cal the Basic Water-Quality Sensors ..................................... 17Quick-Cal Tips ................................................................ 17
Calibrate the Extended Sensors .............................................. 20Set Up Custom Pressure/Level Measurements ................................ 20Set Up to Log Data (Set Up a Test) .................................................. 21Complete the Setup .......................................................................... 21
4 CONTROL SOFTWARE...................................... 22System Requirements ...................................................................... 22
Win-Situ 4 ................................................................................ 22Pocket-Situ 4 ........................................................................... 22
Installation ........................................................................................ 22Win-Situ 4 (Desktop or Laptop PC) ......................................... 22Pocket-Situ 4 (PDA) ................................................................ 22
Launching the Software .................................................................... 23Win-Situ 4 ................................................................................ 23Pocket-Situ 4 ........................................................................... 23
The User Interface ............................................................................ 23The Navigation Tree ................................................................ 23
Software Functions ........................................................................... 24Configuring the Port ................................................................. 24Establishing Communication with the MP TROLL 9500 .......... 24
New Connection .............................................................. 24Existing Connection ........................................................ 24
Displaying Device Information ................................................. 24Upgrading Firmware and Features .......................................... 25
Firmware Upgrade .......................................................... 25Features Upgrade ........................................................... 25
Editing the Device Properties .................................................. 26Setting the Real-Time Clock ........................................... 26Setting a Device Name ................................................... 26Setting Battery Information ............................................. 26
Choosing Measurement Units and Other Preferences ............ 27Units ............................................................................... 27Other Preferences ........................................................... 27
Choosing Pressure Display & Conversion Options .................. 28Performing Water-Quality Calibrations .................................... 28Logging Data (Adding a Test) .................................................. 29Taking “Manual” Readings ....................................................... 29Extracting and Viewing Data .................................................... 30Deleting Data from Instrument Memory ................................... 30
Exiting the Software ......................................................................... 30Win-Situ ................................................................................... 30Pocket-Situ .............................................................................. 30
0095110 rev. 002 11/06
MP TROLL 9500 Operator’s Manual
5 PROFILING .................................................... 31Profiler Features ............................................................................... 31Starting the Profiler ........................................................................... 31Graphing Profiler Data ...................................................................... 32Profiling Dissolved Oxygen .............................................................. 32Profiling Pressure or Depth .............................................................. 32Profiling Turbidity .............................................................................. 32Customizing the Profiler ................................................................... 34
Changing the Channels Displayed .................................. 34Changing Measurement Units ........................................ 34Changing the Sample Rate ............................................. 34Starting in Profiler Mode ................................................. 34
Logging Profiler Data ........................................................................ 34To Stop Logging ....................................................................... 34Retrieving Logged Profiler Data ............................................... 34
Exiting the Profiler ............................................................................ 346 LOGGING DATA ............................................. 35
Adding a Test to a Device: The Test Wizard ..................................... 35Test Setup Parameters ............................................................ 36
1. Test Name (Optional) .................................................. 362. Parameters to Include ................................................. 363. Measurement Schedule .............................................. 364. Measurement Interval ................................................. 375. Start Mode .................................................................. 37
Ending Setup ........................................................................... 37More on Measurement Schedules .................................................... 37
Linear ....................................................................................... 37Event ....................................................................................... 37
Delta ............................................................................... 37Minimum Delta Values .................................................... 38Default Storage ............................................................... 38
Linear Average ......................................................................... 38Other Test Operations ...................................................................... 39Starting a Manual Start Test ............................................................. 40Stopping a Test ................................................................................. 40Retrieving Logged Data .................................................................... 40Deleting Tests ................................................................................... 41Cloning a Test ................................................................................... 41Transferring Files from a PDA to a Desktop PC ............................... 42Viewing Logged Data ....................................................................... 43Selecting Data in the Data Folder ..................................................... 43Graphing Data .................................................................................. 44
Changing the Data Display ...................................................... 45Transferring Data to Excel from Win-Situ ................................ 45Printing Data in Win-Situ ......................................................... 45Saving Text Files from Win-Situ ............................................... 45
7 MONITORING PRESSURE (WATER LEVEL) .......... 46Why Monitor Pressure? .................................................................... 46The Pressure Sensor ....................................................................... 46
Factory Calibration .................................................................. 46Operating Principle .................................................................. 47Non-Vented (Absolute) vs. Vented (Gauged) Sensors ............. 47Pressure vs. Depth vs. Level ................................................... 47
Zeroing the Pressure Sensor ............................................................ 47Setting up Pressure Measurements: The Parameter Wizard ........... 48
Pressure Setup Choices .......................................................... 48
1. Name (Optional) .................................................................. 482. Display Mode ....................................................................... 483. Converting Pressure to Depth or Level ................................ 49
Conversion Using Specific Gravity ................................. 49Conversion Using Density, Latitude, and Elevation ........ 49
4. Level Reference .................................................................. 49Reference Time .............................................................. 49
Liquid Density ................................................................................... 49Quick Summary of Pressure Setup .................................................. 50Installation for Pressure/Level Measurement ................................... 51
Securing the Cable .................................................................. 51Stabilization Time .................................................................... 51Twist-Lock Hanger Installations ............................................... 51
Installation Tips for Level/Depth/Pressure Monitoring ..... 51Correcting Absolute Pressure Readings for Barometric Pressure .... 52
Manual Barometric Pressure Compensation ........................... 52Using the MP TROLL’s Barometric Pressure Sensor ...... 52Using a Second Unit and a Spreadsheet ........................ 52
Automatic Barometric Pressure Compensation ....................... 52Collecting Barometric Pressure Data for Reference ....... 52Collecting PSIA Data ...................................................... 52Using the Baro Wizard .................................................... 52
Recalibration Recommendations ...................................................... 538 MONITORING TEMPERATURE ........................... 54
Why Monitor Temperature? .............................................................. 54The Temperature Sensor .................................................................. 54
Role of the Sensor in Calibration ............................................. 55Software Functions ........................................................................... 55
Units ........................................................................................ 55References ....................................................................................... 55
9 MONITORING BAROMETRIC PRESSURE ............. 56What is Barometric Pressure? .......................................................... 56Why Monitor Barometric Pressure? .................................................. 56The Barometric Pressure Sensor ..................................................... 56Units ................................................................................................. 56Collecting Accurate Measurements without Vented Cable ............... 56
Pressure vs. Elevation ............................................................. 5710 MONITORING WATER QUALITY: OVERVIEW ..... 58
Why Monitor Water Quality? ............................................................. 58The Sensors ..................................................................................... 58
Basic Sensor Set ..................................................................... 58Extended Sensor Set ............................................................... 59Installing Sensors .................................................................... 59Removing Sensors .................................................................. 60
Sensor O-Rings .............................................................. 60Calibration Overview ........................................................................ 60
Traditional Calibration .............................................................. 60Quick Calibration ..................................................................... 61Out of the Box .......................................................................... 61Default Coefficients ................................................................. 61Custom Sensor Preparation .................................................... 61
Preparing to Calibrate ....................................................................... 61Calibration Kits ........................................................................ 61The Calibration Cup ................................................................. 61Effect of Temperature on Calibration ....................................... 62Rinsing .................................................................................... 62
0095110 rev. 002 11/06
MP TROLL 9500 Operator’s Manual
Stirring ..................................................................................... 62When to Stir? .................................................................. 62Attaching the Stirrer for Calibration ................................. 62Starting the Stirrer ........................................................... 62
Calibration Procedures ..................................................................... 62After Calibration ................................................................................ 62
Sensor Storage ........................................................................ 63Calibration History ................................................................... 63How Often to Calibrate ............................................................ 64How to Check if a Sensor is Still in Calibration ........................ 64When to Replace a Sensor ...................................................... 65
Using a Stirrer .................................................................................. 65Attaching the Stirrer for Field Use ................................... 65
References ....................................................................................... 6511 PH .............................................................. 66
What Is pH? ...................................................................................... 66Why Measure pH? ................................................................... 66
The pH Sensor ................................................................................. 66Sensor Installation ............................................................................ 67Calibration ........................................................................................ 67
Overview .................................................................................. 67Nominal vs. Stable .......................................................... 68
Calibration Solutions ................................................................ 68Calibrating with Other Solutions ...................................... 68
Recommended Calibration Frequency .................................... 68pH Quick Cal ........................................................................... 68Traditional pH Calibration Procedure ....................................... 68Resetting Default Coefficients ................................................. 70Sensor Slope and Offset .......................................................... 70
Units and Calculated Measurements ................................................ 70Usage Recommendations and Cautions .......................................... 70Sensor Care and Handling ............................................................... 71
Sensor Removal ...................................................................... 71Maintenance/Inspection/Cleaning ............................................ 71Storage .................................................................................... 71
References ....................................................................................... 7112 CONDUCTIVITY ............................................. 72
What Is Conductivity? ....................................................................... 72Why Measure Conductivity? .................................................... 72How is Conductivity Measured? .............................................. 72
The Conductivity Sensors ................................................................ 72Sensor Installation ............................................................................ 73Calibration ........................................................................................ 73
Overview .................................................................................. 73Nominal vs. Stable .......................................................... 73
Calibration Solutions (Primary Standards) ............................... 73Calibrating with Other Solutions ...................................... 73
Recommended Calibration Frequency .................................... 73Conductivity Quick Cal ............................................................ 74Traditional Conductivity Calibration Procedure ........................ 74Using a Conductivity Meter as a Secondary Standard ............ 76Entering a Cell Constant Manually .......................................... 76
Units and Calculated Measurements ................................................ 76Basic Unit: AC ................................................................. 76Specific Conductance (SC) ............................................. 76Total Dissolved Solids (TDS) .......................................... 77
Resistivity ....................................................................... 77Salinity ............................................................................ 77
Usage Recommendations and Cautions .......................................... 77Conductivity and Temperature ................................................. 77
Sensor Care and Handling ............................................................... 77Sensor Removal ...................................................................... 77Maintenance/Inspection/Cleaning ............................................ 77Storage .................................................................................... 77
References ....................................................................................... 7713 DISSOLVED OXYGEN ..................................... 78
What is Dissolved Oxygen? ............................................................. 78Why Measure Dissolved Oxygen? ........................................... 78
Polarographic Measurement of Dissolved Oxygen .................... 79The Polarographic Dissolved Oxygen Sensor .................................. 79
Theory of Operation ................................................................. 79Sensor Conditioning ................................................................ 79
Sensor Installation ............................................................................ 79Fill the Membrane Module ....................................................... 79Install the Sensor in the MP TROLL 9500 ................................ 80Condition a Newly Installed Sensor ......................................... 80
Calibration ........................................................................................ 80Overview .................................................................................. 80
Nominal vs. Stable .......................................................... 81Calibration Solutions & Equipment .......................................... 81Recommended Calibration Frequency .................................... 81Dissolved Oxygen Calibration Tips .......................................... 81Dissolved Oxygen Quick Cal ................................................... 81Traditional Dissolved Oxygen Calibration Procedure .............. 81Sensor Slope and Offset .......................................................... 85
Units and Calculated Measurements ................................................ 85Usage Recommendations and Cautions .......................................... 86
Stirring ..................................................................................... 86Attaching the Stirrer ........................................................ 86Starting the Stirrer ........................................................... 86
Sensor Care and Handling ............................................................... 87Sensor Removal ...................................................................... 87Maintenance/Inspection ........................................................... 87Cleaning the Electrodes .......................................................... 87Replacing the Membrane Module ............................................ 87Sensor Life .............................................................................. 87Storage .................................................................................... 87
References ....................................................................................... 88Optical Measurement of Dissolved Oxygen ................................. 89The RDO® Optical Dissolved Oxygen Sensor ................................. 89
Theory of Operation ................................................................. 89Comparison to Polarographic D.O. Sensor .............................. 89
The RDO Sensor and Salinity ......................................... 89Sensor Installation ............................................................................ 89
Unpack the RDO Sensor ......................................................... 90Prepare the MP TROLL 9500 .................................................. 90Attach the RDO Sensor to the TROLL 9500 ............................ 90
Calibration ........................................................................................ 91Overview .................................................................................. 91
Nominal vs. Stable .......................................................... 91Calibration Solutions ................................................................ 91
0095110 rev. 002 11/06
MP TROLL 9500 Operator’s Manual
Recommended Calibration Frequency .................................... 91Traditional Two-Point Calibration ............................................. 92Oxygen Saturation Point .......................................................... 92Zero Oxygen Point ................................................................... 94Finalize the Calibration ............................................................ 94Degrees of Phase Angle .......................................................... 95
Units and Calculated Measurements ................................................ 95Usage Recommendations and Cautions .......................................... 95
Salinity ............................................................................ 95Sensor Care and Handling ............................................................... 96
Biofouling ................................................................................. 96Cleaning .................................................................................. 96Foil Check ............................................................................... 96Replacing the Foil .................................................................... 96Updating the Foil Coefficients .................................................. 97
14 OXIDATION-REDUCTION POTENTIAL ................ 99What is ORP? ................................................................................... 99
Why Measure ORP? ................................................................ 99The ORP Sensor .............................................................................. 99Sensor Installation .......................................................................... 100Calibration ...................................................................................... 100
Overview ................................................................................ 100Nominal vs. Stable ........................................................ 101
Calibration Solutions .............................................................. 101Calibrating with Other Solutions .................................... 101
Recommended Calibration Frequency .................................. 101ORP Quick Cal ...................................................................... 101Traditional ORP Calibration Procedure .................................. 101Resetting Default Coefficients ............................................... 103
Units and Calculated Measurements .............................................. 103Normalization to Standard Hydrogen Electrode Values 103
Usage Recommendations and Cautions ........................................ 103Sensor Care and Handling ............................................................. 104
Sensor Removal .................................................................... 104Maintenance/Inspection/Cleaning .......................................... 104Storage .................................................................................. 104
References ..................................................................................... 10415 AMMONIUM .............................................. 105
What is Ammonium ? ..................................................................... 105Why Measure Ammonium? .................................................... 105
The Ammonium Sensor .................................................................. 105Sensor Preparation ................................................................ 105Sensor Installation ................................................................. 106
Calibration ...................................................................................... 106Overview ................................................................................ 106Calibration Solutions .............................................................. 106Recommended Calibration Frequency .................................. 107Preparing to Calibrate ............................................................ 107Ammonium Calibration Procedure ......................................... 107Sensor Slope and Offset ........................................................ 109
Units and Calculated Measurements .............................................. 109Usage Recommendations and Cautions ........................................ 109
pH .......................................................................................... 109Temperature ........................................................................... 109Conductivity ........................................................................... 109Potential Interferences ........................................................... 109
Sensor Care and Handling ............................................................. 110
Sensor Removal .................................................................... 110Maintenance/Inspection/Cleaning .......................................... 110Storage .................................................................................. 110
References ..................................................................................... 11016 CHLORIDE ................................................... 111
What Is Chloride? ........................................................................... 111Why Measure Chloride? ........................................................ 111
The Chloride Sensor ...................................................................... 111Sensor Preparation ................................................................ 111Sensor Installation ................................................................. 111
Calibration ...................................................................................... 112Overview ................................................................................ 112Calibration Solutions .............................................................. 112Recommended Calibration Frequency .................................. 112Preparing to Calibrate ............................................................ 112Chloride Calibration Procedure .............................................. 113Sensor Slope and Offset ........................................................ 115
Units and Calculated Measurements .............................................. 115Usage Recommendations and Cautions ........................................ 115
pH Effects .............................................................................. 115Potential Interferences ........................................................... 115
Sensor Care and Handling ............................................................. 115Sensor Removal .................................................................... 115Maintenance/Inspection/Cleaning .......................................... 115Storage .................................................................................. 115
17 NITRATE ..................................................... 116What Is Nitrate ? ............................................................................. 116
Why Measure Nitrate? ........................................................... 116The Nitrate Sensor ......................................................................... 116
Sensor Preparation ................................................................ 117Sensor Installation ................................................................. 117
Calibration ...................................................................................... 117Overview ................................................................................ 117Calibration Solutions .............................................................. 118Recommended Calibration Frequency .................................. 118Preparing to Calibrate ............................................................ 118Nitrate Calibration Procedure ................................................ 118Sensor Slope and Offset ........................................................ 120
Units and Calculated Measurements .............................................. 120Usage Recommendations and Cautions ........................................ 120
Temperature ........................................................................... 120Potential Interferences ........................................................... 121
Sensor Care and Handling ............................................................. 121Sensor Removal .................................................................... 121Maintenance/Inspection/Cleaning .......................................... 121Storage .................................................................................. 121
References ..................................................................................... 12118 TURBIDITY ................................................. 122
What Is Turbidity? ........................................................................... 122Why Measure Turbidity? ........................................................ 122How Is Turbidity Measured? .................................................. 122
The Turbidity Sensor ...................................................................... 123The Turbidity Wiper ........................................................................ 123
Wiper Installation ................................................................... 124Wiper Movement ................................................................... 124Manual Wipe .......................................................................... 125
0095110 rev. 002 11/06
MP TROLL 9500 Operator’s Manual
Wiper Guidelines and Precautions ........................................ 125Calibration ...................................................................................... 125
Factory Calibration ................................................................ 125Field Calibration ..................................................................... 125Calibration Solutions .............................................................. 125
Calibrating with Other Solutions .................................... 126Recommended Calibration Frequency .................................. 126Turbidity Calibration Procedure ............................................. 126Resetting Default Coefficients ............................................... 129Sensor Slope and Offset ........................................................ 129
Units and Calculated Measurements .............................................. 129Usage Recommendations and Cautions ........................................ 129
Common Interferences .......................................................... 129Profiling Turbidity ............................................................................ 129Logging Turbidity Data ................................................................... 129Sensor Care ................................................................................... 129
Inspection/Maintenance/Cleaning .......................................... 129Wiper Maintenance ........................................................................ 130
Removing the Wiper Head ............................................ 130Replacing the Wiper Pad .............................................. 130Adjusting Wiper Pressure ............................................. 130
References ..................................................................................... 13019 SDI-12 OPERATION ...................................... 131
SDI-12 Requirements ..................................................................... 131Wiring ............................................................................................. 131Connections ................................................................................... 131SDI-12 Support ............................................................................... 131
Sensor Identification .............................................................. 132Sensor Verification ................................................................. 132
Making SDI-12 Measurements ....................................................... 132Redundant Logging (Win-Situ and SDI-12) .................................... 133Extended (ISCO) Commands ......................................................... 133Reference ....................................................................................... 133
SDI-12 V 1.3 Command Set .................................................. 13420 LOW-FLOW MONITORING ........................... 136
Preparation ..................................................................................... 136RDO Sensor Preparation ....................................................... 136Priming the Flow-Sense Wizard in the Office ........................ 138
Prepare the Flow Cell ..................................................................... 139Start the Software ........................................................................... 139Launch the Flow-Sense Wizard ...................................................... 139
Verify Unit Preferences .......................................................... 139Flow-Sense Wizard Input ...................................................... 139Stabilization Readings—Meter and Graph ............................. 141
Saving the Low-Flow Data or Template .......................................... 142Output ............................................................................................ 142Export to Excel Option .................................................................... 142
Using a Custom Excel Template ............................................ 14221 CARE & MAINTENANCE ............................... 144
Replacing Batteries ........................................................................ 144O-Ring Seals .................................................................................. 144
Lubrication ............................................................................. 144Replacement ......................................................................... 145
General Cleaning ........................................................................... 145
Storage ........................................................................................... 145Sensor Storage ...................................................................... 145Twist-Lock Connectors .......................................................... 145
22 TROUBLESHOOTING ................................... 146Troubleshooring Connections ......................................................... 146Troubleshooting Data Collection (Tests) ......................................... 146Troubleshooting Sensors ................................................................ 147Troubleshooting Calibration ............................................................ 147
APPENDIX ...................................................... 148Electronic Drift and Device Recalibration ....................................... 148Determining Density ....................................................................... 148
GLOSSARY ...................................................... 150Index ............................................................. 156DECLARATION OF CONFORMITY ........................ 161
1 0095110 rev. 002 11/06
Multi-ParameterWater Quality TROLL®
GENERAL DESCRIPTION OF THE MP TROLL9500
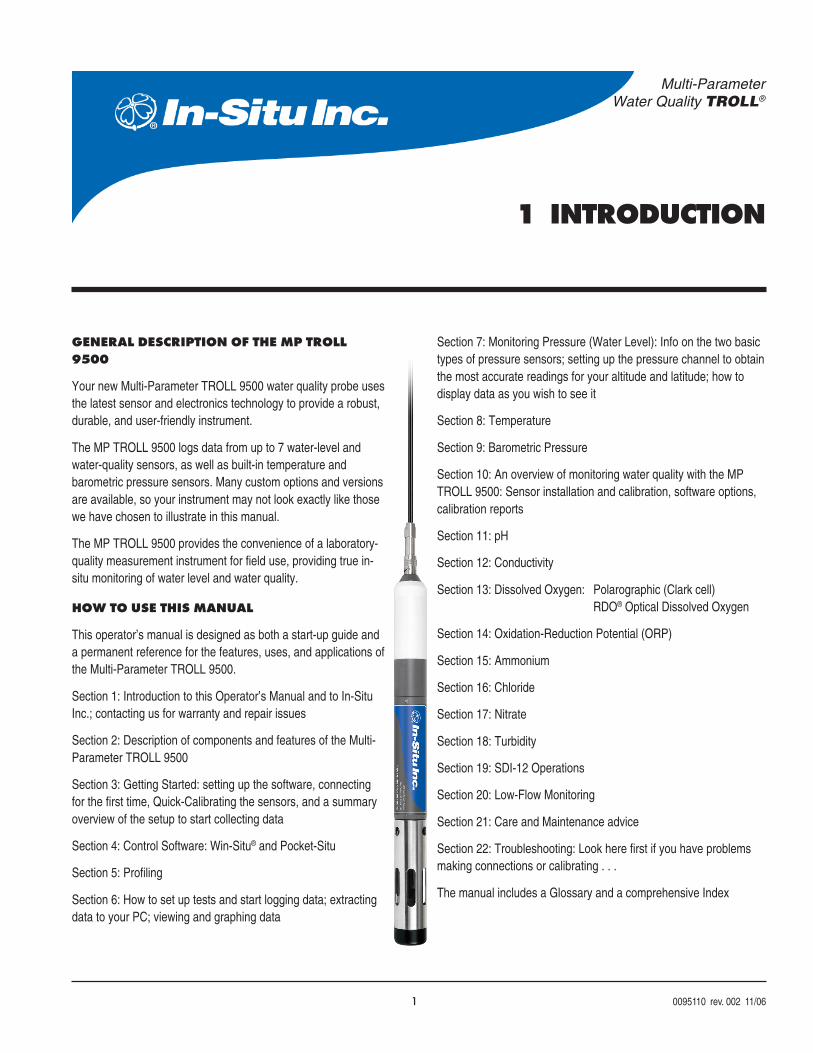
Your new Multi-Parameter TROLL 9500 water quality probe usesthe latest sensor and electronics technology to provide a robust,durable, and user-friendly instrument.
The MP TROLL 9500 logs data from up to 7 water-level andwater-quality sensors, as well as built-in temperature andbarometric pressure sensors. Many custom options and versionsare available, so your instrument may not look exactly like thosewe have chosen to illustrate in this manual.
The MP TROLL 9500 provides the convenience of a laboratory-quality measurement instrument for field use, providing true in-situ monitoring of water level and water quality.
HOW TO USE THIS MANUAL
This operator’s manual is designed as both a start-up guide anda permanent reference for the features, uses, and applications ofthe Multi-Parameter TROLL 9500.
Section 1: Introduction to this Operator’s Manual and to In-SituInc.; contacting us for warranty and repair issues
Section 2: Description of components and features of the Multi-Parameter TROLL 9500
Section 3: Getting Started: setting up the software, connectingfor the first time, Quick-Calibrating the sensors, and a summaryoverview of the setup to start collecting data
Section 4: Control Software: Win-Situ® and Pocket-Situ
Section 5: Profiling
Section 6: How to set up tests and start logging data; extractingdata to your PC; viewing and graphing data
1 INTRODUCTION
Section 7: Monitoring Pressure (Water Level): Info on the two basictypes of pressure sensors; setting up the pressure channel to obtainthe most accurate readings for your altitude and latitude; how todisplay data as you wish to see it
Section 8: Temperature
Section 9: Barometric Pressure
Section 10: An overview of monitoring water quality with the MPTROLL 9500: Sensor installation and calibration, software options,calibration reports
Section 11: pH
Section 12: Conductivity
Section 13: Dissolved Oxygen: Polarographic (Clark cell)RDO® Optical Dissolved Oxygen
Section 14: Oxidation-Reduction Potential (ORP)
Section 15: Ammonium
Section 16: Chloride
Section 17: Nitrate
Section 18: Turbidity
Section 19: SDI-12 Operations
Section 20: Low-Flow Monitoring
Section 21: Care and Maintenance advice
Section 22: Troubleshooting: Look here first if you have problemsmaking connections or calibrating . . .
The manual includes a Glossary and a comprehensive Index
2 0095110 rev. 002 11/06
CONVENTIONS
Throughout this operator’s manual you will see the following symbols.
UNPACKING AND INSPECTION
Your MP TROLL 9500 was carefully inspected before shipping. Checkthe instrument for any physical damage sustained during shipment.Notify In-Situ and file a claim with the carrier if there is any suchdamage; do not attempt to operate the instrument.
Accessories may be shipped separately and should also be inspectedfor physical damage and the fulfillment of your order.
SERIAL NUMBER
The serial number is located on the large label on the Multi-ParameterTROLL 9500 body, and also on a small label inside the batterycompartment. The serial number is programmed into the instrumentand displayed when the instrument is connected to a PC running Win-Situ 4 or Pocket-Situ 4. We recommend that owners keep a separaterecord of this number. Should your Multi-Parameter TROLL 9500 belost or stolen, the serial number is often necessary for tracing andrecovery, as well as any insurance claims. If necessary, In-Situmaintains complete records of original owner’s names and serialnumbers.
Serial numbers of the water-quality sensors are stored in sensormemory and displayed in the software when sensors are installed.
TO OUR CUSTOMERS . . .
Thank you for your purchase of an In-Situ product. We are glad youchose us and our products to help you with your environmentalmonitoring needs. In-Situ Inc. has been designing and manufacturingworld-class environmental monitoring instrumentation for over 25years in the Rocky Mountains of the United States. As it was in thebeginning, our expectation is that this product will provide you withmany trouble-free years of use. To that end, we pride ourselves ondelivering the best customer service and support possible—24 hours aday, 7 days a week. We believe that this level of commitment to you,our customer, is imperative in helping you ensure clean, safegroundwater and surface water resources across the globe. We alsounderstand the need for accurate, reliable assessments and wecontinue to make significant investments in Research and Develop-ment to ensure that we deliver the latest product and technologicalinnovations to support your needs.
Whether you are gathering information about your body of water for afew moments, or over a period of years, you can rely upon us toprovide you with a quality product and outstanding customer supportat a fair price and have that product delivered to you when and whereyou need it.
We want your experience with In-Situ Inc. to be pleasant andprofessional, whether you are renting from us, or purchasing from us.We would be pleased to hear from you and learn more about yourneeds, and your experiences with our products. Again, we thank youfor choosing In-Situ Inc. and we look forward to serving your needsnow, and in the future.
Please save packing materials for future storage andshipping of your MP TROLL 9500. The shipping boxeshave been performance-tested and provide protection forthe instrument and its accessories.
Bob Blythe, President and CEOIn-Situ [email protected]
The check mark highlights a tip about a convenient featureof the MP TROLL 9500
The exclamation point calls your attention to a requirementor important action that should not be overlooked
Q:
A:
Typical usage questions and answers that we hope willhelp you gain a better understanding of your new Multi-Parameter TROLL 9500 and simplify its setup andoperation
SECTION 1: INTRODUCTION
3 0095110 rev. 002 11/06
WHAT WE PROVIDE
WARRANTY PROVISIONS
In-Situ Inc. warrants the Multi-Parameter TROLL 9500 for one year,RDO sensors for three years, and other sensors for 90 days from dateof purchase by the end user against defects in materials and work-manship under normal operating conditions. To exercise this warrantycontact Technical Support at the phone or e-mail address listed belowfor a return material authorization (RMA) and instructions. Completewarranty provisions are posted on our website at www.In-Situ.com.
Maintenance & calibration plans as well as extended warranties areavailable. Contact your In-Situ representative for complete informa-tion.
FIRMWARE & SOFTWARE UPGRADES
From time to time In-Situ may make available enhanced versions offirmware and software to its customers over the Internet.
Visit our website at www.in-situ.com to download the latest firmwareand software.
HOW TO CONTACT US
Technical Support: 800 446 7488Toll-free 24 hours a day in the U.S. and Canada
Address: In-Situ Inc.221 East Lincoln Ave.Fort Collins, CO 80524USA
Phone: 970 498 1500Fax: 970 498 1598Internet: www.in-situ.come-mail: [email protected]
TO OBTAIN REPAIR SERVICE (U.S.)
If you suspect that your Multi-Parameter TROLL 9500 is malfunction-ing and repair is required, you can help assure efficient servicing byfollowing these guidelines:
1. Call or e-mail In-Situ Technical Support ([email protected]).Have the product model and serial number handy.
2. Be prepared to describe the problem, including how the instrumentwas being used and the conditions noted at the time of themalfunction.
3. If Tech Support determines that service is needed, they will ask thatyour company pre-approve a specified dollar amount for repair
charges. When the pre-approval is received, Tech Support willassign an RMA (Return Material Authorization) number.
4. Clean the Multi-Parameter TROLL 9500 and cable. Decontaminatethoroughly if it has been used in a toxic or hazardous environment.See the cleaning guidelines and form on the following page.
5. Carefully pack your Multi-Parameter TROLL 9500 in its originalshipping box, if possible. Include a statement certifying that theinstrument and cable have been decontaminated, and anysupporting information.
6. Mark the RMA number clearly on the outside of the box with amarker or label.
7. Send the package, shipping prepaid, to
In-Situ Inc.ATTN: Repairs221 East Lincoln Ave.Fort Collins, CO 80524USA
The warranty does not cover damage during transit. We recommendthe customer insure all shipments. Warranty repairs will be shippedback prepaid.
Outside the U.S.
Contact your international In-Situ distributor for repair and serviceinformation.
CERTIFICATION
The MP TROLL 9500 complies with all applicable directives per theCE and FCC and was tested to the EN 61326 / FCC specifications
If an instrument returned for servicing shows evidence ofhaving been used in a toxic or hazardous environment,Customer Service personnel will require written proof ofdecontamination before they can service the unit.
SECTION 1: INTRODUCTION
TIP: Please keep your RMAnumber for future reference.
4 0095110 rev. 002 11/06
CLEANING GUIDELINES
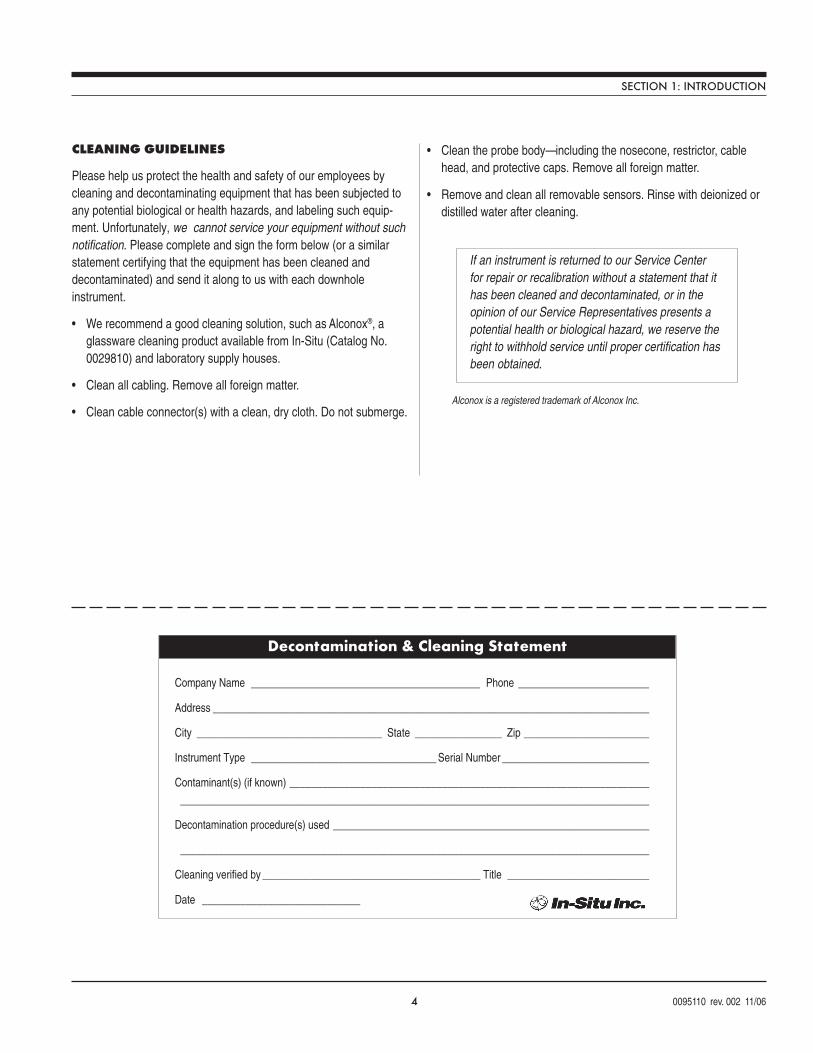
Please help us protect the health and safety of our employees bycleaning and decontaminating equipment that has been subjected toany potential biological or health hazards, and labeling such equip-ment. Unfortunately, we cannot service your equipment without suchnotification. Please complete and sign the form below (or a similarstatement certifying that the equipment has been cleaned anddecontaminated) and send it along to us with each downholeinstrument.
• We recommend a good cleaning solution, such as Alconox®, aglassware cleaning product available from In-Situ (Catalog No.0029810) and laboratory supply houses.
• Clean all cabling. Remove all foreign matter.
• Clean cable connector(s) with a clean, dry cloth. Do not submerge.
If an instrument is returned to our Service Centerfor repair or recalibration without a statement that ithas been cleaned and decontaminated, or in theopinion of our Service Representatives presents apotential health or biological hazard, we reserve theright to withhold service until proper certification hasbeen obtained.
Alconox is a registered trademark of Alconox Inc.
Company Name __________________________________________ Phone ________________________
Address ________________________________________________________________________________
City __________________________________ State ________________ Zip _______________________
Instrument Type __________________________________ Serial Number ___________________________
Contaminant(s) (if known) __________________________________________________________________
______________________________________________________________________________________
Decontamination procedure(s) used __________________________________________________________
______________________________________________________________________________________
Cleaning verified by ________________________________________ Title __________________________
Date _____________________________
Decontamination & Cleaning Statement
SECTION 1: INTRODUCTION
• Clean the probe body—including the nosecone, restrictor, cablehead, and protective caps. Remove all foreign matter.
• Remove and clean all removable sensors. Rinse with deionized ordistilled water after cleaning.
5 0095110 rev. 002 11/06
Multi-ParameterWater Quality TROLL®
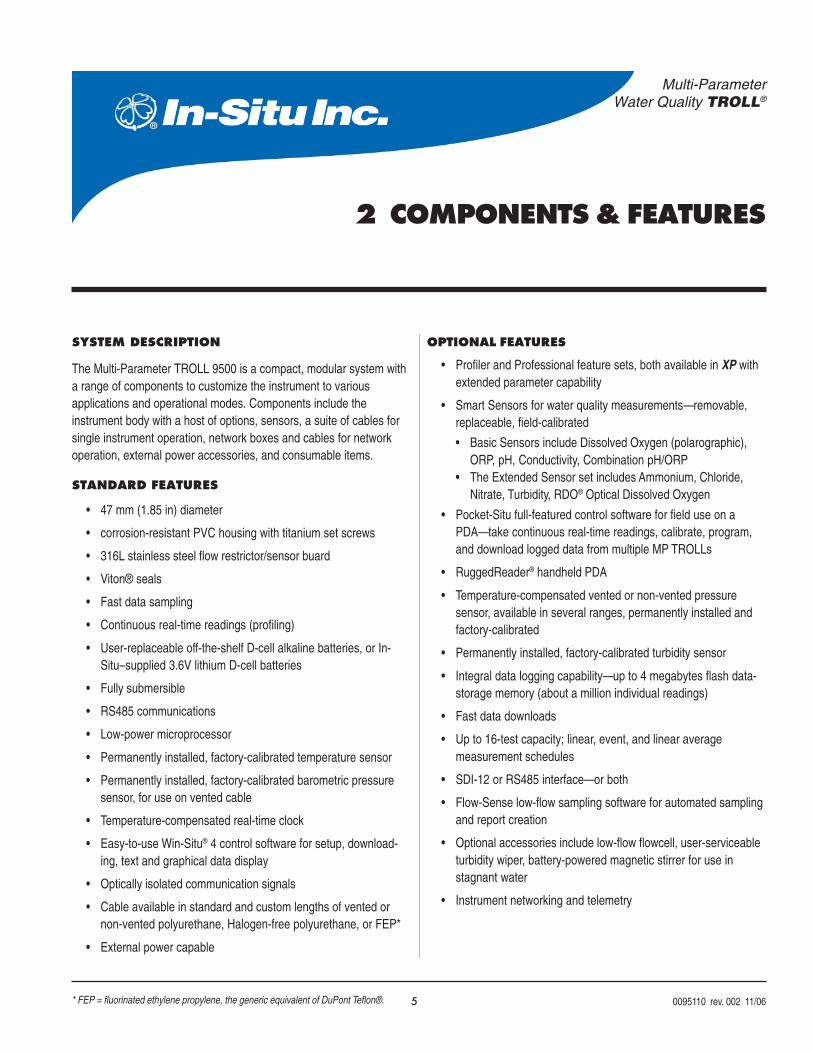
SYSTEM DESCRIPTION
The Multi-Parameter TROLL 9500 is a compact, modular system witha range of components to customize the instrument to variousapplications and operational modes. Components include theinstrument body with a host of options, sensors, a suite of cables forsingle instrument operation, network boxes and cables for networkoperation, external power accessories, and consumable items.
STANDARD FEATURES
• 47 mm (1.85 in) diameter
• corrosion-resistant PVC housing with titanium set screws
• 316L stainless steel flow restrictor/sensor buard
• Viton® seals
• Fast data sampling
• Continuous real-time readings (profiling)
• User-replaceable off-the-shelf D-cell alkaline batteries, or In-Situ–supplied 3.6V lithium D-cell batteries
• Fully submersible
• RS485 communications
• Low-power microprocessor
• Permanently installed, factory-calibrated temperature sensor
• Permanently installed, factory-calibrated barometric pressuresensor, for use on vented cable
• Temperature-compensated real-time clock
• Easy-to-use Win-Situ® 4 control software for setup, download-ing, text and graphical data display
• Optically isolated communication signals
• Cable available in standard and custom lengths of vented ornon-vented polyurethane, Halogen-free polyurethane, or FEP*
• External power capable
OPTIONAL FEATURES
• Profiler and Professional feature sets, both available in XP withextended parameter capability
• Smart Sensors for water quality measurements—removable,replaceable, field-calibrated
• Basic Sensors include Dissolved Oxygen (polarographic),ORP, pH, Conductivity, Combination pH/ORP
• The Extended Sensor set includes Ammonium, Chloride,Nitrate, Turbidity, RDO® Optical Dissolved Oxygen
• Pocket-Situ full-featured control software for field use on aPDA—take continuous real-time readings, calibrate, program,and download logged data from multiple MP TROLLs
• RuggedReader® handheld PDA
• Temperature-compensated vented or non-vented pressuresensor, available in several ranges, permanently installed andfactory-calibrated
• Permanently installed, factory-calibrated turbidity sensor
• Integral data logging capability—up to 4 megabytes flash data-storage memory (about a million individual readings)
• Fast data downloads
• Up to 16-test capacity; linear, event, and linear averagemeasurement schedules
• SDI-12 or RS485 interface—or both
• Flow-Sense low-flow sampling software for automated samplingand report creation
• Optional accessories include low-flow flowcell, user-serviceableturbidity wiper, battery-powered magnetic stirrer for use instagnant water
• Instrument networking and telemetry
2 COMPONENTS & FEATURES
* FEP = fluorinated ethylene propylene, the generic equivalent of DuPont Teflon®.
6 0095110 rev. 002 11/06
CABLES
Several basic cable types are used in the MP TROLL 9500 system:
• RuggedCable™, TPU-jacketed (Thermoplastic PolyUrethane)
• vented or non-vented• Halogen-Free vented or non-vented (LSZH-rated, low
smoke zero halide)
• Vented FEP* cable
• Stainless steel suspension wire for use when cable venting is notrequired (e.g., with an absolute pressure sensor)
• Communication cables for programming the device/downloadingthe logged data
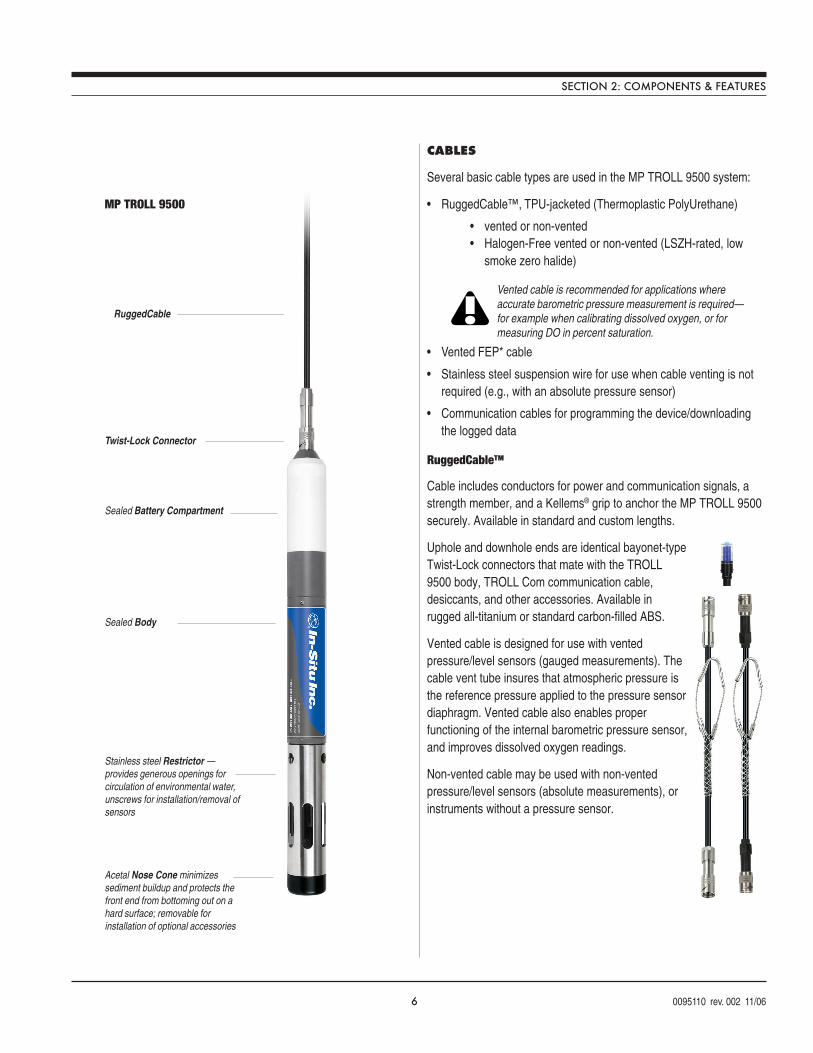
RuggedCable™
Cable includes conductors for power and communication signals, astrength member, and a Kellems® grip to anchor the MP TROLL 9500securely. Available in standard and custom lengths.
Uphole and downhole ends are identical bayonet-typeTwist-Lock connectors that mate with the TROLL9500 body, TROLL Com communication cable,desiccants, and other accessories. Available inrugged all-titanium or standard carbon-filled ABS.
Vented cable is designed for use with ventedpressure/level sensors (gauged measurements). Thecable vent tube insures that atmospheric pressure isthe reference pressure applied to the pressure sensordiaphragm. Vented cable also enables properfunctioning of the internal barometric pressure sensor,and improves dissolved oxygen readings.
Non-vented cable may be used with non-ventedpressure/level sensors (absolute measurements), orinstruments without a pressure sensor.
SECTION 2: COMPONENTS & FEATURES
MP TROLL 9500
Vented cable is recommended for applications whereaccurate barometric pressure measurement is required—for example when calibrating dissolved oxygen, or formeasuring DO in percent saturation.
Sealed Body
Sealed Battery Compartment
Twist-Lock Connector
Stainless steel Restrictor —provides generous openings forcirculation of environmental water,unscrews for installation/removal ofsensors
Acetal Nose Cone minimizessediment buildup and protects thefront end from bottoming out on ahard surface; removable forinstallation of optional accessories
RuggedCable
7 0095110 rev. 002 11/06
CABLE DESICCANTS
Small Desiccant
Clear cap of indicating silica gel desiccant seals the upholeend of the RuggedCable during use; protects the cable venttube and device electronics from condensation. The desiccantis blue when active. It will absorb moisture from the top downand for best results should be replaced before the entirevolume has turned pink. Replacements are available from In-Situ Inc.or your distributor.
Large Desiccant
The high-volume desiccant pack may last up to 20 timeslonger than the small desiccant in humid environments. Itattaches to the RuggedCable in the same way. Refill kits areavailable from In-Situ Inc. or your distributor.
Accessory Catalog No.Small desiccant (replacement) ................................................... 52230Large desiccant .......................................................................... 51810Large desiccant refill kit .............................................................. 29140
COMMUNICATION CABLES
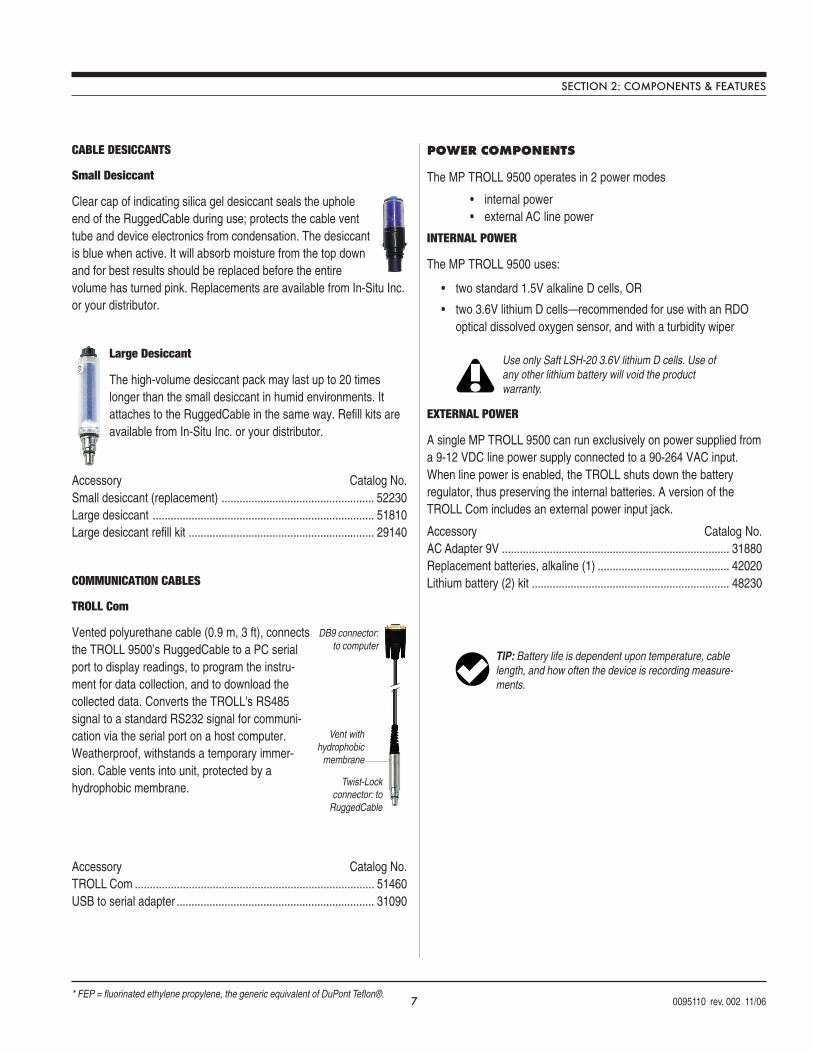
TROLL Com
Vented polyurethane cable (0.9 m, 3 ft), connectsthe TROLL 9500’s RuggedCable to a PC serialport to display readings, to program the instru-ment for data collection, and to download thecollected data. Converts the TROLL's RS485signal to a standard RS232 signal for communi-cation via the serial port on a host computer.Weatherproof, withstands a temporary immer-sion. Cable vents into unit, protected by ahydrophobic membrane.
Accessory Catalog No.TROLL Com ................................................................................ 51460USB to serial adapter .................................................................. 31090
POWER COMPONENTS
The MP TROLL 9500 operates in 2 power modes
• internal power• external AC line power
INTERNAL POWER
The MP TROLL 9500 uses:
• two standard 1.5V alkaline D cells, OR
• two 3.6V lithium D cells—recommended for use with an RDOoptical dissolved oxygen sensor, and with a turbidity wiper
EXTERNAL POWER
A single MP TROLL 9500 can run exclusively on power supplied froma 9-12 VDC line power supply connected to a 90-264 VAC input.When line power is enabled, the TROLL shuts down the batteryregulator, thus preserving the internal batteries. A version of theTROLL Com includes an external power input jack.
Accessory Catalog No.AC Adapter 9V ............................................................................ 31880Replacement batteries, alkaline (1) ............................................ 42020Lithium battery (2) kit .................................................................. 48230
* FEP = fluorinated ethylene propylene, the generic equivalent of DuPont Teflon®.
SECTION 2: COMPONENTS & FEATURES
DB9 connector:to computer
Twist-Lockconnector: to
RuggedCable
Vent withhydrophobic
membrane
Use only Saft LSH-20 3.6V lithium D cells. Use ofany other lithium battery will void the productwarranty.
TIP: Battery life is dependent upon temperature, cablelength, and how often the device is recording measure-ments.
8 0095110 rev. 002 11/06
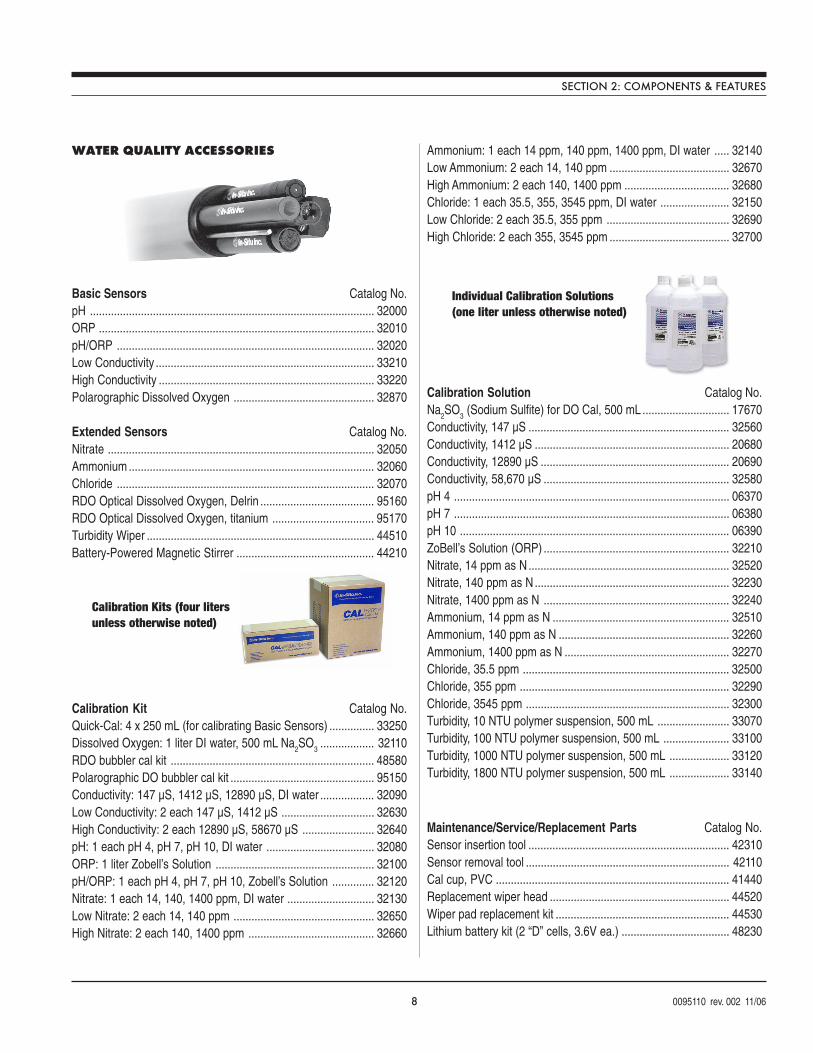
WATER QUALITY ACCESSORIES
Basic Sensors Catalog No.pH ............................................................................................... 32000ORP ............................................................................................ 32010pH/ORP ...................................................................................... 32020Low Conductivity ......................................................................... 33210High Conductivity ........................................................................ 33220Polarographic Dissolved Oxygen ............................................... 32870
Extended Sensors Catalog No.Nitrate ......................................................................................... 32050Ammonium .................................................................................. 32060Chloride ...................................................................................... 32070RDO Optical Dissolved Oxygen, Delrin ...................................... 95160RDO Optical Dissolved Oxygen, titanium .................................. 95170Turbidity Wiper ............................................................................ 44510Battery-Powered Magnetic Stirrer .............................................. 44210
Calibration Kit Catalog No.Quick-Cal: 4 x 250 mL (for calibrating Basic Sensors) ............... 33250Dissolved Oxygen: 1 liter DI water, 500 mL Na
2SO
3.................. 32110
RDO bubbler cal kit .................................................................... 48580Polarographic DO bubbler cal kit ................................................ 95150Conductivity: 147 µS, 1412 µS, 12890 µS, DI water .................. 32090Low Conductivity: 2 each 147 µS, 1412 µS ............................... 32630High Conductivity: 2 each 12890 µS, 58670 µS ........................ 32640pH: 1 each pH 4, pH 7, pH 10, DI water .................................... 32080ORP: 1 liter Zobell’s Solution ..................................................... 32100pH/ORP: 1 each pH 4, pH 7, pH 10, Zobell’s Solution .............. 32120Nitrate: 1 each 14, 140, 1400 ppm, DI water ............................. 32130Low Nitrate: 2 each 14, 140 ppm ............................................... 32650High Nitrate: 2 each 140, 1400 ppm .......................................... 32660
Ammonium: 1 each 14 ppm, 140 ppm, 1400 ppm, DI water ..... 32140Low Ammonium: 2 each 14, 140 ppm ........................................ 32670High Ammonium: 2 each 140, 1400 ppm ................................... 32680Chloride: 1 each 35.5, 355, 3545 ppm, DI water ....................... 32150Low Chloride: 2 each 35.5, 355 ppm ......................................... 32690High Chloride: 2 each 355, 3545 ppm ........................................ 32700
Calibration Solution Catalog No.Na
2SO
3 (Sodium Sulfite) for DO Cal, 500 mL ............................. 17670
Conductivity, 147 µS ................................................................... 32560Conductivity, 1412 µS ................................................................. 20680Conductivity, 12890 µS ............................................................... 20690Conductivity, 58,670 µS .............................................................. 32580pH 4 ............................................................................................ 06370pH 7 ............................................................................................ 06380pH 10 .......................................................................................... 06390ZoBell’s Solution (ORP) .............................................................. 32210Nitrate, 14 ppm as N ................................................................... 32520Nitrate, 140 ppm as N ................................................................. 32230Nitrate, 1400 ppm as N .............................................................. 32240Ammonium, 14 ppm as N ........................................................... 32510Ammonium, 140 ppm as N ......................................................... 32260Ammonium, 1400 ppm as N ....................................................... 32270Chloride, 35.5 ppm ..................................................................... 32500Chloride, 355 ppm ...................................................................... 32290Chloride, 3545 ppm .................................................................... 32300Turbidity, 10 NTU polymer suspension, 500 mL ........................ 33070Turbidity, 100 NTU polymer suspension, 500 mL ...................... 33100Turbidity, 1000 NTU polymer suspension, 500 mL .................... 33120Turbidity, 1800 NTU polymer suspension, 500 mL .................... 33140
Maintenance/Service/Replacement Parts Catalog No.Sensor insertion tool ................................................................... 42310Sensor removal tool .................................................................... 42110Cal cup, PVC .............................................................................. 41440Replacement wiper head ............................................................ 44520Wiper pad replacement kit .......................................................... 44530Lithium battery kit (2 “D” cells, 3.6V ea.) .................................... 48230
Calibration Kits (four litersunless otherwise noted)
Individual Calibration Solutions(one liter unless otherwise noted)
SECTION 2: COMPONENTS & FEATURES
9 0095110 rev. 002 11/06
SECTION 2: COMPONENTS & FEATURES
MP TROLL 9500 Maintenance kit (o-rings, lubricant, dust caps, sensor port plugs) .................................................................. 95100DO sensor service kit, 1-mil membranes ................................... 33200DO sensor service kit, 2-mil membranes ................................... 33440RDO Maintenance kit ................................................................. 48250RDO Foil Replacement kit .......................................................... 48500
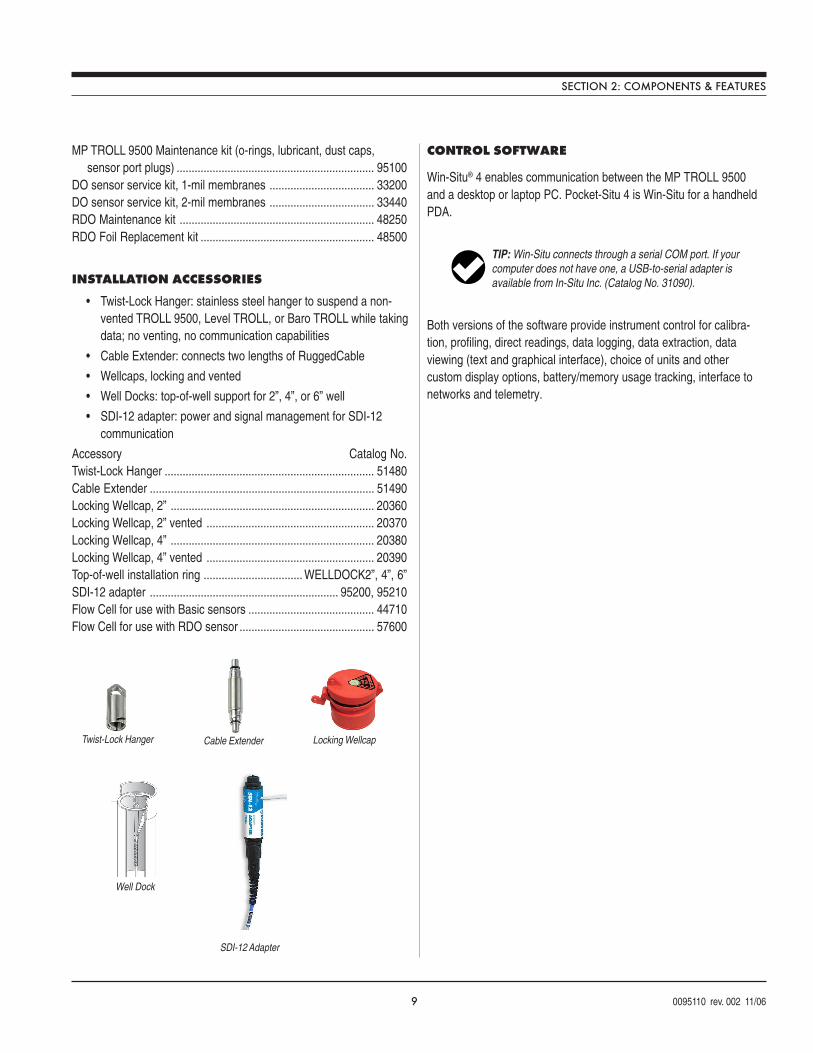
INSTALLATION ACCESSORIES
• Twist-Lock Hanger: stainless steel hanger to suspend a non-vented TROLL 9500, Level TROLL, or Baro TROLL while takingdata; no venting, no communication capabilities
• Cable Extender: connects two lengths of RuggedCable
• Wellcaps, locking and vented
• Well Docks: top-of-well support for 2”, 4”, or 6” well
• SDI-12 adapter: power and signal management for SDI-12communication
Accessory Catalog No.Twist-Lock Hanger ...................................................................... 51480Cable Extender ........................................................................... 51490Locking Wellcap, 2” .................................................................... 20360Locking Wellcap, 2” vented ........................................................ 20370Locking Wellcap, 4” .................................................................... 20380Locking Wellcap, 4” vented ........................................................ 20390Top-of-well installation ring ................................. WELLDOCK2”, 4”, 6”SDI-12 adapter ............................................................... 95200, 95210Flow Cell for use with Basic sensors .......................................... 44710Flow Cell for use with RDO sensor ............................................. 57600
Twist-Lock Hanger Cable Extender Locking Wellcap
Well Dock
SDI-12 Adapter
CONTROL SOFTWARE
Win-Situ® 4 enables communication between the MP TROLL 9500and a desktop or laptop PC. Pocket-Situ 4 is Win-Situ for a handheldPDA.
Both versions of the software provide instrument control for calibra-tion, profiling, direct readings, data logging, data extraction, dataviewing (text and graphical interface), choice of units and othercustom display options, battery/memory usage tracking, interface tonetworks and telemetry.
TIP: Win-Situ connects through a serial COM port. If yourcomputer does not have one, a USB-to-serial adapter isavailable from In-Situ Inc. (Catalog No. 31090).
10 0095110 rev. 002 11/06
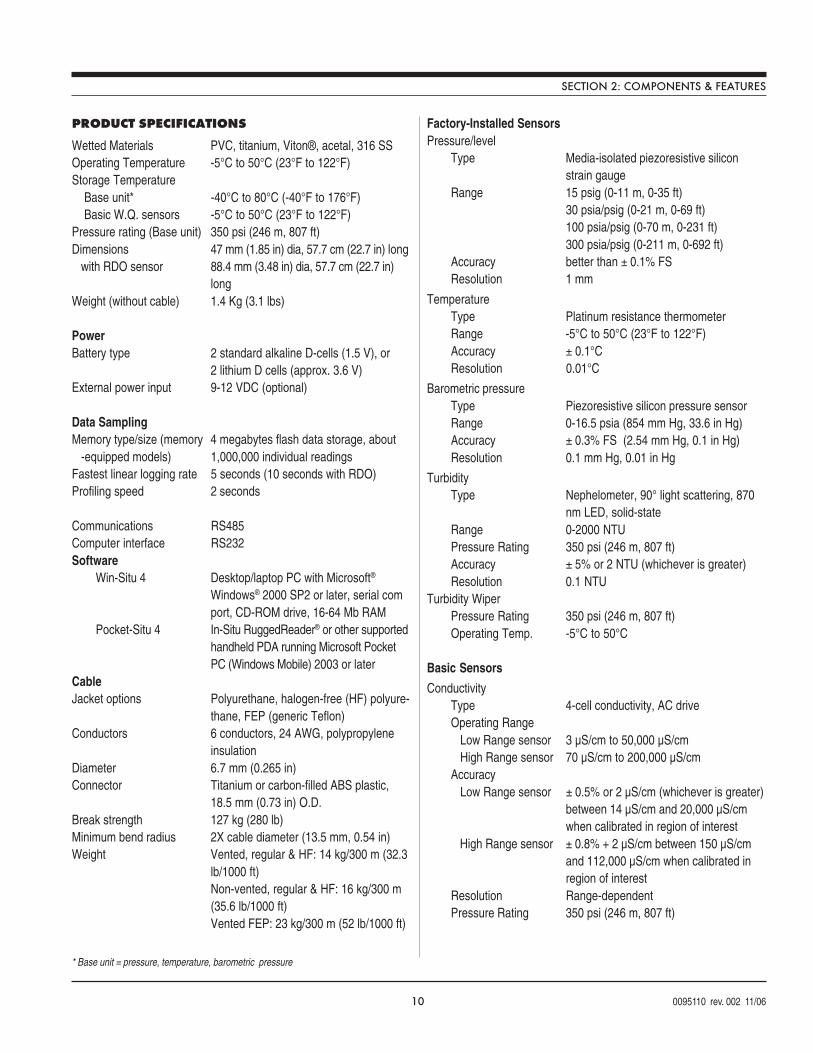
PRODUCT SPECIFICATIONS
Wetted Materials PVC, titanium, Viton®, acetal, 316 SSOperating Temperature -5°C to 50°C (23°F to 122°F)Storage Temperature Base unit* -40°C to 80°C (-40°F to 176°F) Basic W.Q. sensors -5°C to 50°C (23°F to 122°F)Pressure rating (Base unit) 350 psi (246 m, 807 ft)Dimensions 47 mm (1.85 in) dia, 57.7 cm (22.7 in) long with RDO sensor 88.4 mm (3.48 in) dia, 57.7 cm (22.7 in)
longWeight (without cable) 1.4 Kg (3.1 lbs)
PowerBattery type 2 standard alkaline D-cells (1.5 V), or
2 lithium D cells (approx. 3.6 V)External power input 9-12 VDC (optional)
Data SamplingMemory type/size (memory 4 megabytes flash data storage, about -equipped models) 1,000,000 individual readingsFastest linear logging rate 5 seconds (10 seconds with RDO)Profiling speed 2 seconds
Communications RS485Computer interface RS232Software
Win-Situ 4 Desktop/laptop PC with Microsoft®
Windows® 2000 SP2 or later, serial comport, CD-ROM drive, 16-64 Mb RAM
Pocket-Situ 4 In-Situ RuggedReader® or other supportedhandheld PDA running Microsoft PocketPC (Windows Mobile) 2003 or later
CableJacket options Polyurethane, halogen-free (HF) polyure-
thane, FEP (generic Teflon)Conductors 6 conductors, 24 AWG, polypropylene
insulationDiameter 6.7 mm (0.265 in)Connector Titanium or carbon-filled ABS plastic,
18.5 mm (0.73 in) O.D.Break strength 127 kg (280 lb)Minimum bend radius 2X cable diameter (13.5 mm, 0.54 in)Weight Vented, regular & HF: 14 kg/300 m (32.3
lb/1000 ft)Non-vented, regular & HF: 16 kg/300 m(35.6 lb/1000 ft)Vented FEP: 23 kg/300 m (52 lb/1000 ft)
Factory-Installed SensorsPressure/level
Type Media-isolated piezoresistive siliconstrain gauge
Range 15 psig (0-11 m, 0-35 ft)30 psia/psig (0-21 m, 0-69 ft)100 psia/psig (0-70 m, 0-231 ft)300 psia/psig (0-211 m, 0-692 ft)
Accuracy better than ± 0.1% FSResolution 1 mm
TemperatureType Platinum resistance thermometerRange -5°C to 50°C (23°F to 122°F)Accuracy ± 0.1°CResolution 0.01°C
Barometric pressureType Piezoresistive silicon pressure sensorRange 0-16.5 psia (854 mm Hg, 33.6 in Hg)Accuracy ± 0.3% FS (2.54 mm Hg, 0.1 in Hg)Resolution 0.1 mm Hg, 0.01 in Hg
TurbidityType Nephelometer, 90° light scattering, 870
nm LED, solid-stateRange 0-2000 NTUPressure Rating 350 psi (246 m, 807 ft)Accuracy ± 5% or 2 NTU (whichever is greater)Resolution 0.1 NTU
Turbidity WiperPressure Rating 350 psi (246 m, 807 ft)Operating Temp. -5°C to 50°C
Basic Sensors
ConductivityType 4-cell conductivity, AC driveOperating Range Low Range sensor 3 µS/cm to 50,000 µS/cm High Range sensor 70 µS/cm to 200,000 µS/cmAccuracy Low Range sensor ± 0.5% or 2 µS/cm (whichever is greater)
between 14 µS/cm and 20,000 µS/cmwhen calibrated in region of interest
High Range sensor ± 0.8% + 2 µS/cm between 150 µS/cmand 112,000 µS/cm when calibrated inregion of interest
Resolution Range-dependentPressure Rating 350 psi (246 m, 807 ft)
SECTION 2: COMPONENTS & FEATURES
* Base unit = pressure, temperature, barometric pressure
11 0095110 rev. 002 11/06
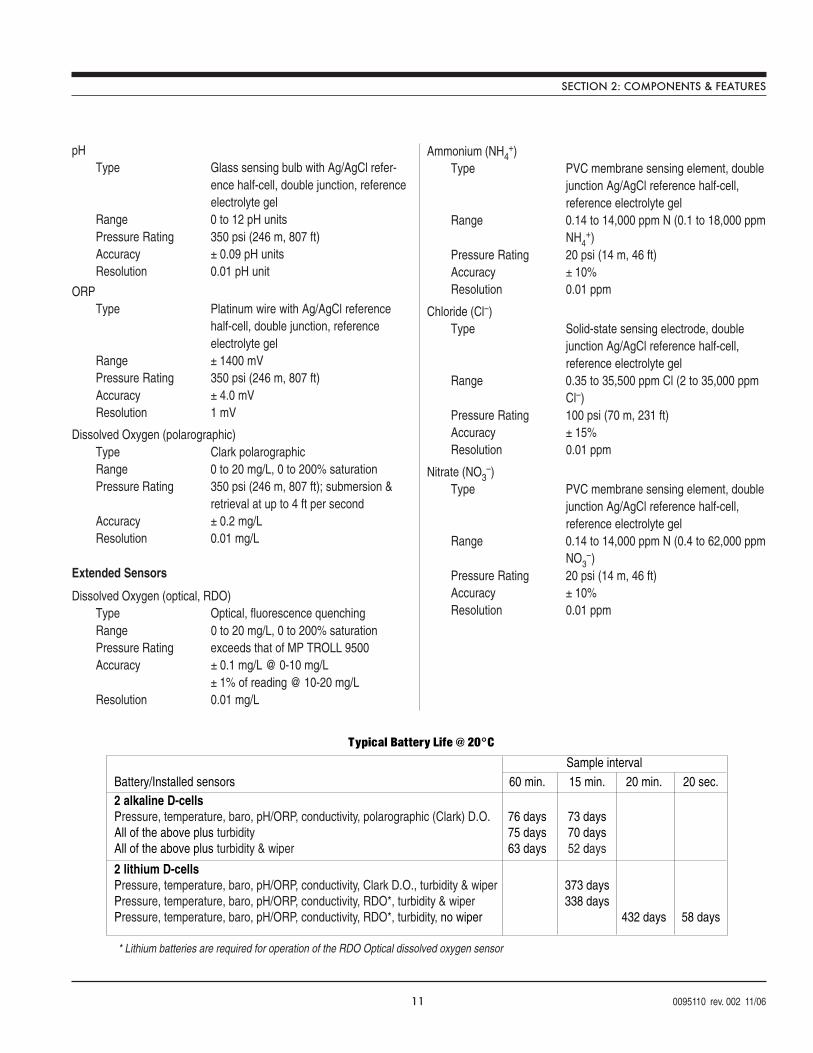
pHType Glass sensing bulb with Ag/AgCl refer-
ence half-cell, double junction, referenceelectrolyte gel
Range 0 to 12 pH unitsPressure Rating 350 psi (246 m, 807 ft)Accuracy ± 0.09 pH unitsResolution 0.01 pH unit
ORPType Platinum wire with Ag/AgCl reference
half-cell, double junction, referenceelectrolyte gel
Range ± 1400 mVPressure Rating 350 psi (246 m, 807 ft)Accuracy ± 4.0 mVResolution 1 mV
Dissolved Oxygen (polarographic)Type Clark polarographicRange 0 to 20 mg/L, 0 to 200% saturationPressure Rating 350 psi (246 m, 807 ft); submersion &
retrieval at up to 4 ft per secondAccuracy ± 0.2 mg/LResolution 0.01 mg/L
Extended Sensors
Dissolved Oxygen (optical, RDO)Type Optical, fluorescence quenchingRange 0 to 20 mg/L, 0 to 200% saturationPressure Rating exceeds that of MP TROLL 9500Accuracy ± 0.1 mg/L @ 0-10 mg/L
± 1% of reading @ 10-20 mg/LResolution 0.01 mg/L
SECTION 2: COMPONENTS & FEATURES
Ammonium (NH4+)
Type PVC membrane sensing element, doublejunction Ag/AgCl reference half-cell,reference electrolyte gel
Range 0.14 to 14,000 ppm N (0.1 to 18,000 ppmNH4
+)Pressure Rating 20 psi (14 m, 46 ft)Accuracy ± 10%Resolution 0.01 ppm
Chloride (Cl–)Type Solid-state sensing electrode, double
junction Ag/AgCl reference half-cell,reference electrolyte gel
Range 0.35 to 35,500 ppm Cl (2 to 35,000 ppmCl–)
Pressure Rating 100 psi (70 m, 231 ft)Accuracy ± 15%Resolution 0.01 ppm
Nitrate (NO3–)
Type PVC membrane sensing element, doublejunction Ag/AgCl reference half-cell,reference electrolyte gel
Range 0.14 to 14,000 ppm N (0.4 to 62,000 ppmNO3
–)Pressure Rating 20 psi (14 m, 46 ft)Accuracy ± 10%Resolution 0.01 ppm
Battery/Installed sensors 60 min. 15 min. 20 min. 20 sec.2 alkaline D-cellsPressure, temperature, baro, pH/ORP, conductivity, polarographic (Clark) D.O. 76 days 73 daysAll of the above plus turbidity 75 days 70 daysAll of the above plus turbidity & wiper 63 days 52 days
2 lithium D-cellsPressure, temperature, baro, pH/ORP, conductivity, Clark D.O., turbidity & wiper 373 daysPressure, temperature, baro, pH/ORP, conductivity, RDO*, turbidity & wiper 338 daysPressure, temperature, baro, pH/ORP, conductivity, RDO*, turbidity, no wiper 432 days 58 days
* Lithium batteries are required for operation of the RDO Optical dissolved oxygen sensor
Typical Battery Life @ 20°C
Sample interval
12 0095110 rev. 002 11/06
Multi-ParameterWater Quality TROLL®
This section provides a quick overview of the initial steps necessary toget the Multi-Parameter TROLL 9500 ready to take measurements.
You will need—
• Power
• Sensors
• Cable
• Software (Win-Situ 4 or Pocket-Situ 4) and a desktop or laptopPC, or a supported PDA
• Calibration Kit—one for each sensor to be calibrated, or theQuickCal Kit for the Basic Sensor set (pH, ORP, polarographicD.O., Conductivity)
POWER
Install batteries in the Multi-Parameter TROLL 9500 as follows:
1. Unscrew and remove the battery compartmentcover. Slide it up over the cable (if attached).
3 GETTING STARTED
TIP: When the unit ships with a PolarographicDissolved Oxygen sensor installed, alkaline batteriesare pre-installed in the device to power the D.O.sensor and keep it conditioned.
TIP: The MP TROLL 9500 uses standard off-the-shelf 1.5Valkaline D-cells. For best performance with an RDO opticaldissolved oxygen sensor, and with a turbidity wiper, werecommend 3.6V lithium D cells. Lithium batteries areshipped separately for customer installation in the device.
2. Insert two D-size batteries negative side first, positive side up.
3. Replace the battery compartment cover and tighten to compressthe o-ring seals.
↓ ↓
Use only Saft LSH-20 3.6V lithium D cells. Use of anyother lithium battery will void the product warranty.
Screw the cover down firmly to compress the o-ringsand create a waterproof seal. When properlyassembled, the o-rings will not be vsible.
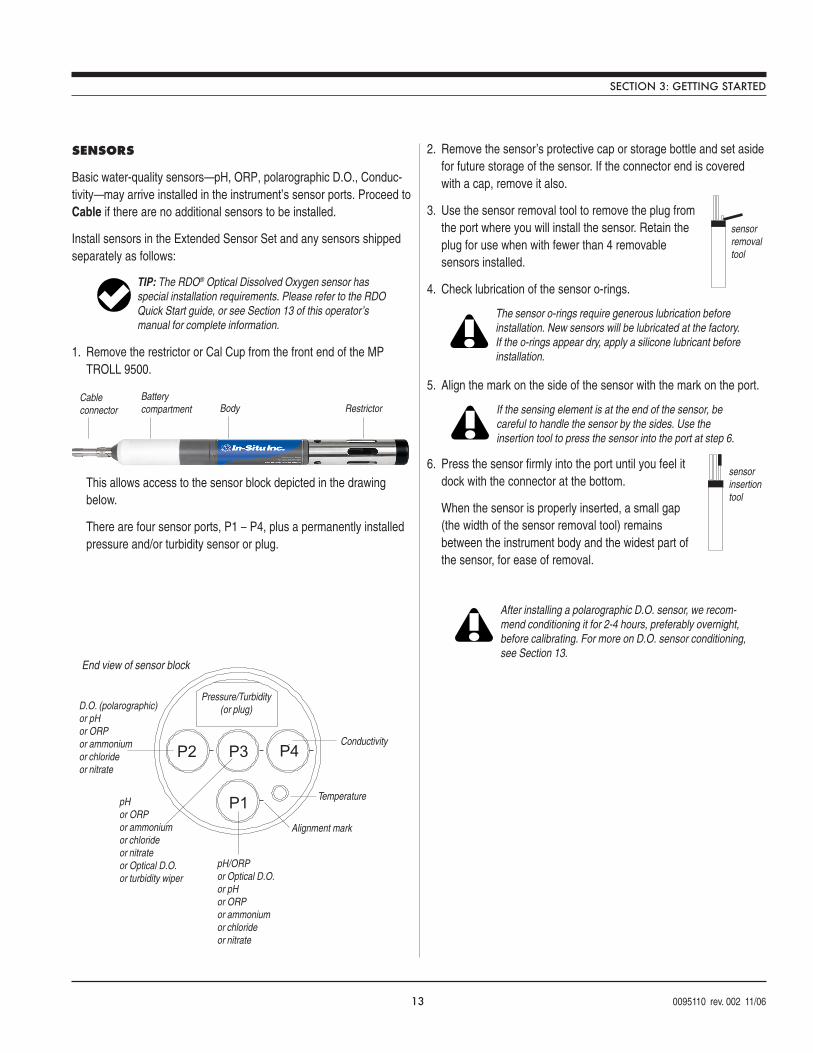
13 0095110 rev. 002 11/06
P1
P2 P3 P4 Conductivity
1
2 3 4
Pressure/Turbidity(or plug)
Temperature
D.O. (polarographic)or pHor ORPor ammoniumor chlorideor nitrate
pH/ORPor Optical D.O.or pHor ORPor ammoniumor chlorideor nitrate
pHor ORPor ammoniumor chlorideor nitrateor Optical D.O.or turbidity wiper
End view of sensor block
P1
P2 P3 P4
Alignment mark
The sensor o-rings require generous lubrication beforeinstallation. New sensors will be lubricated at the factory.If the o-rings appear dry, apply a silicone lubricant beforeinstallation.
SENSORS
Basic water-quality sensors—pH, ORP, polarographic D.O., Conduc-tivity—may arrive installed in the instrument’s sensor ports. Proceed toCable if there are no additional sensors to be installed.
Install sensors in the Extended Sensor Set and any sensors shippedseparately as follows:
1. Remove the restrictor or Cal Cup from the front end of the MPTROLL 9500.
This allows access to the sensor block depicted in the drawingbelow.
There are four sensor ports, P1 – P4, plus a permanently installedpressure and/or turbidity sensor or plug.
sensorremovaltool
TIP: The RDO® Optical Dissolved Oxygen sensor hasspecial installation requirements. Please refer to the RDOQuick Start guide, or see Section 13 of this operator’smanual for complete information.
2. Remove the sensor’s protective cap or storage bottle and set asidefor future storage of the sensor. If the connector end is coveredwith a cap, remove it also.
3. Use the sensor removal tool to remove the plug fromthe port where you will install the sensor. Retain theplug for use when with fewer than 4 removablesensors installed.
4. Check lubrication of the sensor o-rings.
5. Align the mark on the side of the sensor with the mark on the port.
6. Press the sensor firmly into the port until you feel itdock with the connector at the bottom.
When the sensor is properly inserted, a small gap(the width of the sensor removal tool) remainsbetween the instrument body and the widest part ofthe sensor, for ease of removal.
sensorinsertiontool
If the sensing element is at the end of the sensor, becareful to handle the sensor by the sides. Use theinsertion tool to press the sensor into the port at step 6.
After installing a polarographic D.O. sensor, we recom-mend conditioning it for 2-4 hours, preferably overnight,before calibrating. For more on D.O. sensor conditioning,see Section 13.
SECTION 3: GETTING STARTED
Cableconnector Body Restrictor
Batterycompartment
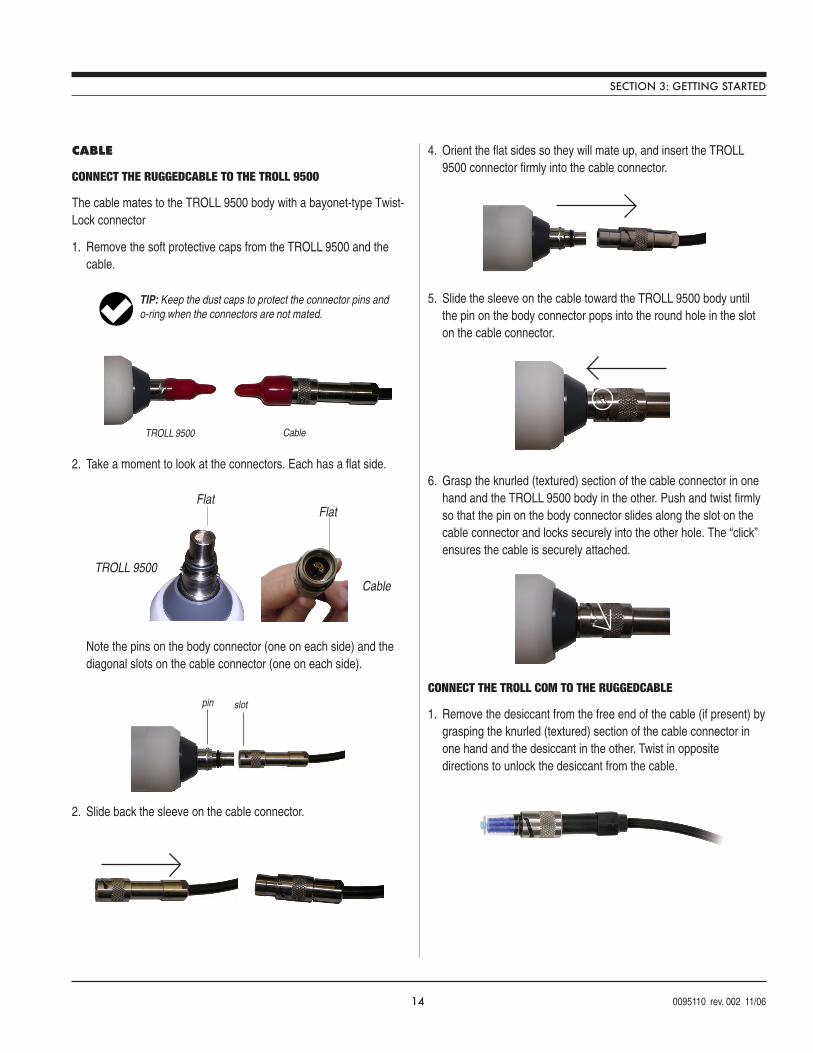
14 0095110 rev. 002 11/06
CABLE
CONNECT THE RUGGEDCABLE TO THE TROLL 9500
The cable mates to the TROLL 9500 body with a bayonet-type Twist-Lock connector
1. Remove the soft protective caps from the TROLL 9500 and thecable.
2. Take a moment to look at the connectors. Each has a flat side.
Note the pins on the body connector (one on each side) and thediagonal slots on the cable connector (one on each side).
2. Slide back the sleeve on the cable connector.
TIP: Keep the dust caps to protect the connector pins ando-ring when the connectors are not mated.
SECTION 3: GETTING STARTED
4. Orient the flat sides so they will mate up, and insert the TROLL9500 connector firmly into the cable connector.
5. Slide the sleeve on the cable toward the TROLL 9500 body untilthe pin on the body connector pops into the round hole in the sloton the cable connector.
6. Grasp the knurled (textured) section of the cable connector in onehand and the TROLL 9500 body in the other. Push and twist firmlyso that the pin on the body connector slides along the slot on thecable connector and locks securely into the other hole. The “click”ensures the cable is securely attached.
CONNECT THE TROLL COM TO THE RUGGEDCABLE
1. Remove the desiccant from the free end of the cable (if present) bygrasping the knurled (textured) section of the cable connector inone hand and the desiccant in the other. Twist in oppositedirections to unlock the desiccant from the cable.
TROLL 9500 Cable
FlatFlat
TROLL 9500Cable
pin slot
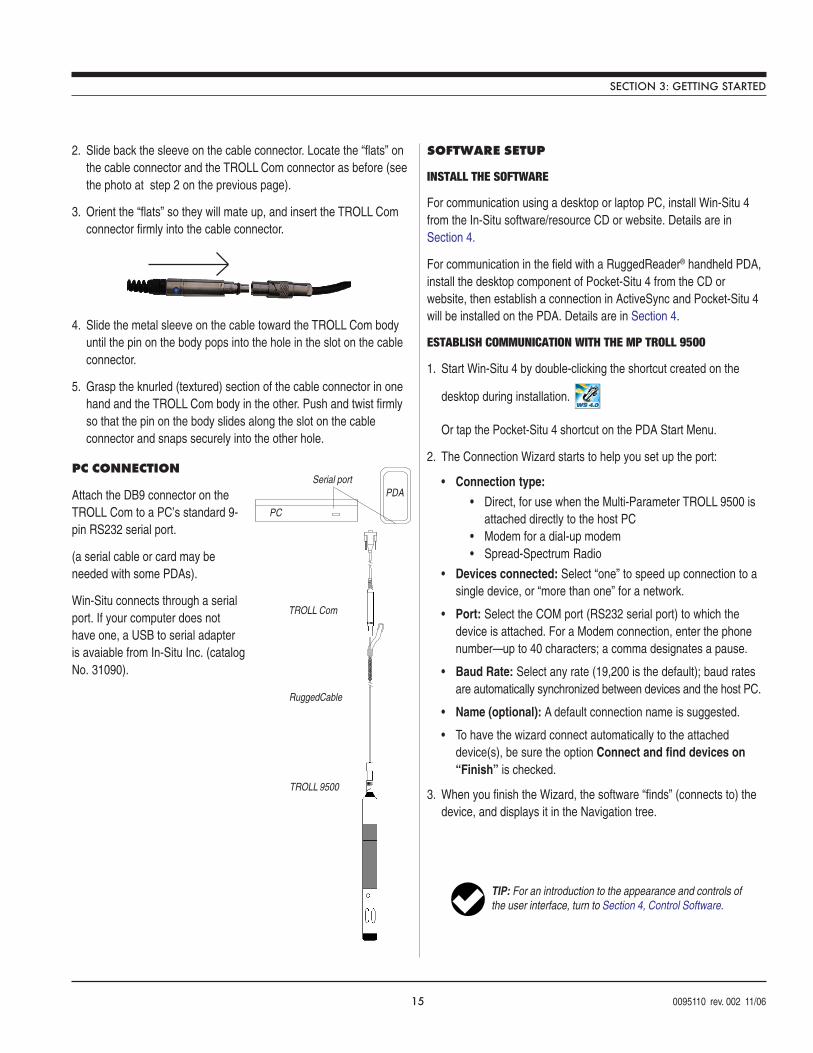
15 0095110 rev. 002 11/06
SECTION 3: GETTING STARTED
2. Slide back the sleeve on the cable connector. Locate the “flats” onthe cable connector and the TROLL Com connector as before (seethe photo at step 2 on the previous page).
3. Orient the “flats” so they will mate up, and insert the TROLL Comconnector firmly into the cable connector.
4. Slide the metal sleeve on the cable toward the TROLL Com bodyuntil the pin on the body pops into the hole in the slot on the cableconnector.
5. Grasp the knurled (textured) section of the cable connector in onehand and the TROLL Com body in the other. Push and twist firmlyso that the pin on the body slides along the slot on the cableconnector and snaps securely into the other hole.
PC CONNECTION
Attach the DB9 connector on theTROLL Com to a PC’s standard 9-pin RS232 serial port.
(a serial cable or card may beneeded with some PDAs).
Win-Situ connects through a serialport. If your computer does nothave one, a USB to serial adapteris avaiable from In-Situ Inc. (catalogNo. 31090).
SOFTWARE SETUP
INSTALL THE SOFTWARE
For communication using a desktop or laptop PC, install Win-Situ 4from the In-Situ software/resource CD or website. Details are inSection 4.
For communication in the field with a RuggedReader® handheld PDA,install the desktop component of Pocket-Situ 4 from the CD orwebsite, then establish a connection in ActiveSync and Pocket-Situ 4will be installed on the PDA. Details are in Section 4.
ESTABLISH COMMUNICATION WITH THE MP TROLL 9500
1. Start Win-Situ 4 by double-clicking the shortcut created on the
desktop during installation.
Or tap the Pocket-Situ 4 shortcut on the PDA Start Menu.
2. The Connection Wizard starts to help you set up the port:
• Connection type:
• Direct, for use when the Multi-Parameter TROLL 9500 isattached directly to the host PC
• Modem for a dial-up modem• Spread-Spectrum Radio
• Devices connected: Select “one” to speed up connection to asingle device, or “more than one” for a network.
• Port: Select the COM port (RS232 serial port) to which thedevice is attached. For a Modem connection, enter the phonenumber—up to 40 characters; a comma designates a pause.
• Baud Rate: Select any rate (19,200 is the default); baud ratesare automatically synchronized between devices and the host PC.
• Name (optional): A default connection name is suggested.
• To have the wizard connect automatically to the attacheddevice(s), be sure the option Connect and find devices on“Finish” is checked.
3. When you finish the Wizard, the software “finds” (connects to) thedevice, and displays it in the Navigation tree.
TIP: For an introduction to the appearance and controls ofthe user interface, turn to Section 4, Control Software.
Serial portPDA
PC
RuggedCable
TROLL 9500
TROLL Com
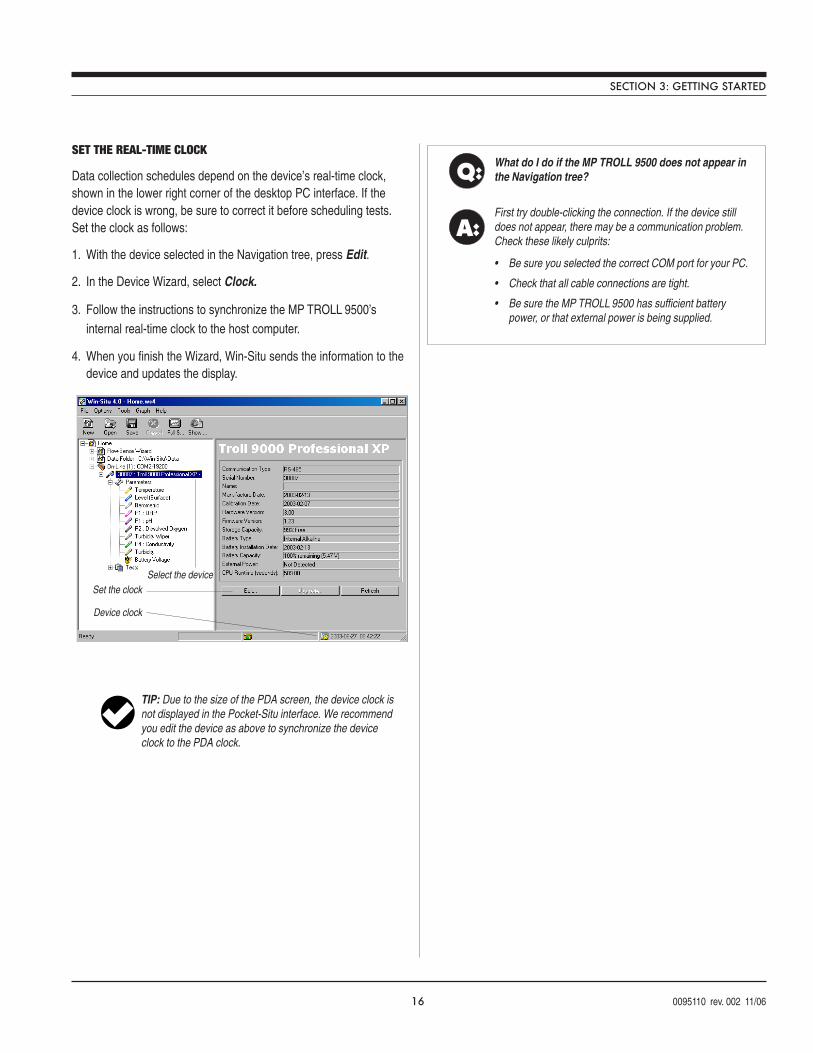
16 0095110 rev. 002 11/06
SET THE REAL-TIME CLOCK
Data collection schedules depend on the device’s real-time clock,shown in the lower right corner of the desktop PC interface. If thedevice clock is wrong, be sure to correct it before scheduling tests.Set the clock as follows:
1. With the device selected in the Navigation tree, press Edit.
2. In the Device Wizard, select Clock.
3. Follow the instructions to synchronize the MP TROLL 9500’sinternal real-time clock to the host computer.
4. When you finish the Wizard, Win-Situ sends the information to thedevice and updates the display.
Q:
A:
What do I do if the MP TROLL 9500 does not appear inthe Navigation tree?
First try double-clicking the connection. If the device stilldoes not appear, there may be a communication problem.Check these likely culprits:
• Be sure you selected the correct COM port for your PC.
• Check that all cable connections are tight.
• Be sure the MP TROLL 9500 has sufficient batterypower, or that external power is being supplied.
Select the device
Device clock
Set the clock
TIP: Due to the size of the PDA screen, the device clock isnot displayed in the Pocket-Situ interface. We recommendyou edit the device as above to synchronize the deviceclock to the PDA clock.
SECTION 3: GETTING STARTED
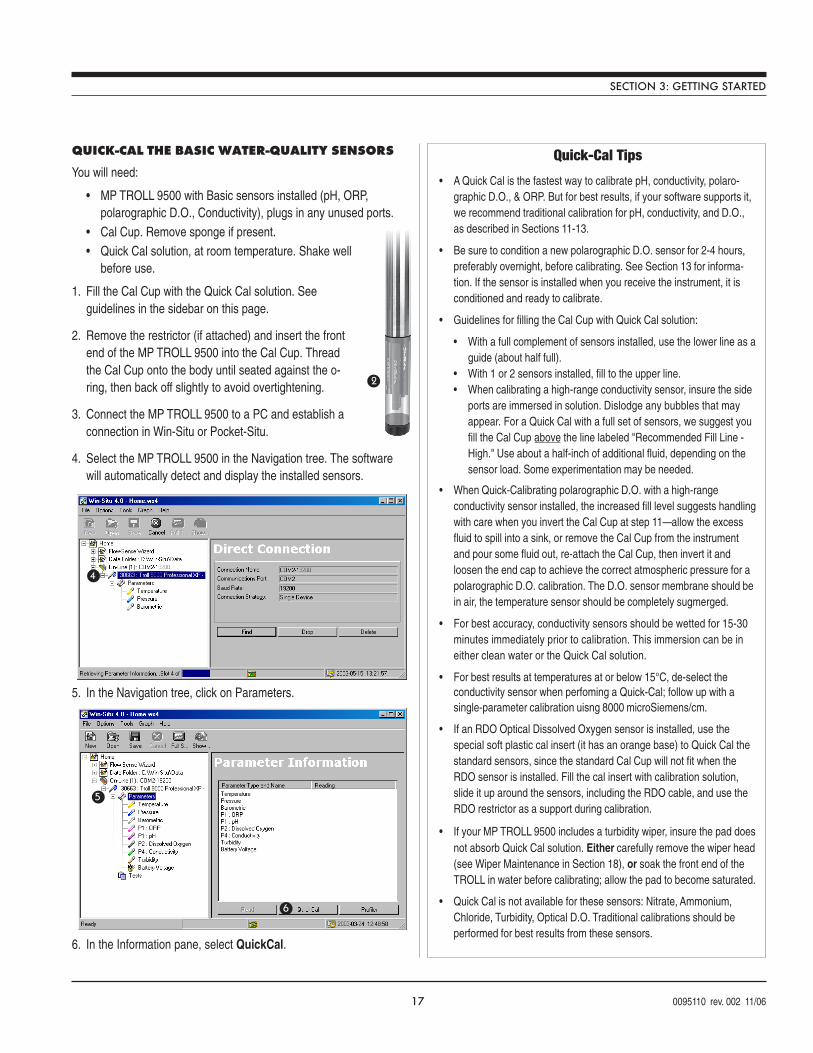
17 0095110 rev. 002 11/06
QUICK-CAL THE BASIC WATER-QUALITY SENSORS
You will need:
• MP TROLL 9500 with Basic sensors installed (pH, ORP,polarographic D.O., Conductivity), plugs in any unused ports.
• Cal Cup. Remove sponge if present.• Quick Cal solution, at room temperature. Shake well
before use.
1. Fill the Cal Cup with the Quick Cal solution. Seeguidelines in the sidebar on this page.
2. Remove the restrictor (if attached) and insert the frontend of the MP TROLL 9500 into the Cal Cup. Threadthe Cal Cup onto the body until seated against the o-ring, then back off slightly to avoid overtightening.
3. Connect the MP TROLL 9500 to a PC and establish aconnection in Win-Situ or Pocket-Situ.
4. Select the MP TROLL 9500 in the Navigation tree. The softwarewill automatically detect and display the installed sensors.
5. In the Navigation tree, click on Parameters.
6. In the Information pane, select QuickCal.
SECTION 3: GETTING STARTED
4
5
6
Quick-Cal Tips
• A Quick Cal is the fastest way to calibrate pH, conductivity, polaro-graphic D.O., & ORP. But for best results, if your software supports it,we recommend traditional calibration for pH, conductivity, and D.O.,as described in Sections 11-13.
• Be sure to condition a new polarographic D.O. sensor for 2-4 hours,preferably overnight, before calibrating. See Section 13 for informa-tion. If the sensor is installed when you receive the instrument, it isconditioned and ready to calibrate.
• Guidelines for filling the Cal Cup with Quick Cal solution:
• With a full complement of sensors installed, use the lower line as aguide (about half full).
• With 1 or 2 sensors installed, fill to the upper line.• When calibrating a high-range conductivity sensor, insure the side
ports are immersed in solution. Dislodge any bubbles that mayappear. For a Quick Cal with a full set of sensors, we suggest youfill the Cal Cup above the line labeled "Recommended Fill Line -High." Use about a half-inch of additional fluid, depending on thesensor load. Some experimentation may be needed.
• When Quick-Calibrating polarographic D.O. with a high-rangeconductivity sensor installed, the increased fill level suggests handlingwith care when you invert the Cal Cup at step 11—allow the excessfluid to spill into a sink, or remove the Cal Cup from the instrumentand pour some fluid out, re-attach the Cal Cup, then invert it andloosen the end cap to achieve the correct atmospheric pressure for apolarographic D.O. calibration. The D.O. sensor membrane should bein air, the temperature sensor should be completely sugmerged.
• For best accuracy, conductivity sensors should be wetted for 15-30minutes immediately prior to calibration. This immersion can be ineither clean water or the Quick Cal solution.
• For best results at temperatures at or below 15°C, de-select theconductivity sensor when perfoming a Quick-Cal; follow up with asingle-parameter calibration uisng 8000 microSiemens/cm.
• If an RDO Optical Dissolved Oxygen sensor is installed, use thespecial soft plastic cal insert (it has an orange base) to Quick Cal thestandard sensors, since the standard Cal Cup will not fit when theRDO sensor is installed. Fill the cal insert with calibration solution,slide it up around the sensors, including the RDO cable, and use theRDO restrictor as a support during calibration.
• If your MP TROLL 9500 includes a turbidity wiper, insure the pad doesnot absorb Quick Cal solution. Either carefully remove the wiper head(see Wiper Maintenance in Section 18), or soak the front end of theTROLL in water before calibrating; allow the pad to become saturated.
• Quick Cal is not available for these sensors: Nitrate, Ammonium,Chloride, Turbidity, Optical D.O. Traditional calibrations should beperformed for best results from these sensors.
2
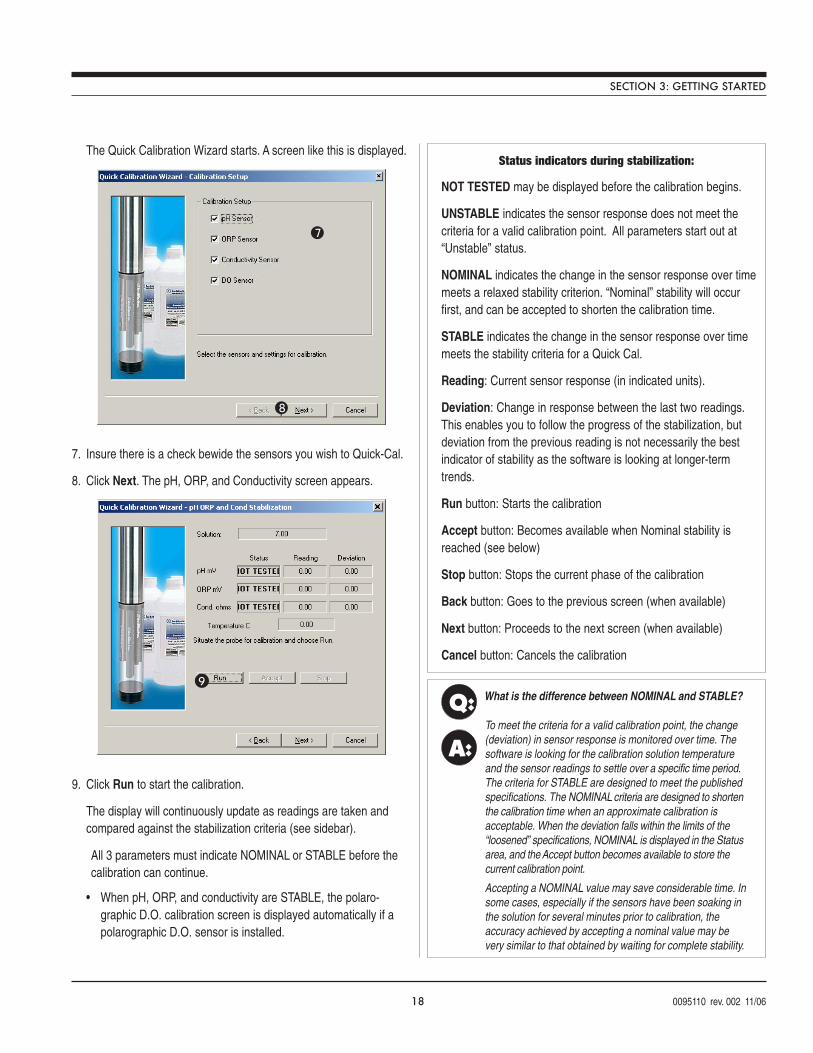
18 0095110 rev. 002 11/06
The Quick Calibration Wizard starts. A screen like this is displayed.
7. Insure there is a check bewide the sensors you wish to Quick-Cal.
8. Click Next. The pH, ORP, and Conductivity screen appears.
9. Click Run to start the calibration.
The display will continuously update as readings are taken andcompared against the stabilization criteria (see sidebar).
All 3 parameters must indicate NOMINAL or STABLE before thecalibration can continue.
• When pH, ORP, and conductivity are STABLE, the polaro-graphic D.O. calibration screen is displayed automatically if apolarographic D.O. sensor is installed.
SECTION 3: GETTING STARTED
Q:
A:
What is the difference between NOMINAL and STABLE?
To meet the criteria for a valid calibration point, the change(deviation) in sensor response is monitored over time. Thesoftware is looking for the calibration solution temperatureand the sensor readings to settle over a specific time period.The criteria for STABLE are designed to meet the publishedspecifications. The NOMINAL criteria are designed to shortenthe calibration time when an approximate calibration isacceptable. When the deviation falls within the limits of the“loosened” specifications, NOMINAL is displayed in the Statusarea, and the Accept button becomes available to store thecurrent calibration point.
Accepting a NOMINAL value may save considerable time. Insome cases, especially if the sensors have been soaking inthe solution for several minutes prior to calibration, theaccuracy achieved by accepting a nominal value may bevery similar to that obtained by waiting for complete stability.
7
8
9
Status indicators during stabilization:
NOT TESTED may be displayed before the calibration begins.
UNSTABLE indicates the sensor response does not meet thecriteria for a valid calibration point. All parameters start out at“Unstable” status.
NOMINAL indicates the change in the sensor response over timemeets a relaxed stability criterion. “Nominal” stability will occurfirst, and can be accepted to shorten the calibration time.
STABLE indicates the change in the sensor response over timemeets the stability criteria for a Quick Cal.
Reading: Current sensor response (in indicated units).
Deviation: Change in response between the last two readings.This enables you to follow the progress of the stabilization, butdeviation from the previous reading is not necessarily the bestindicator of stability as the software is looking at longer-termtrends.
Run button: Starts the calibration
Accept button: Becomes available when Nominal stability isreached (see below)
Stop button: Stops the current phase of the calibration
Back button: Goes to the previous screen (when available)
Next button: Proceeds to the next screen (when available)
Cancel button: Cancels the calibration
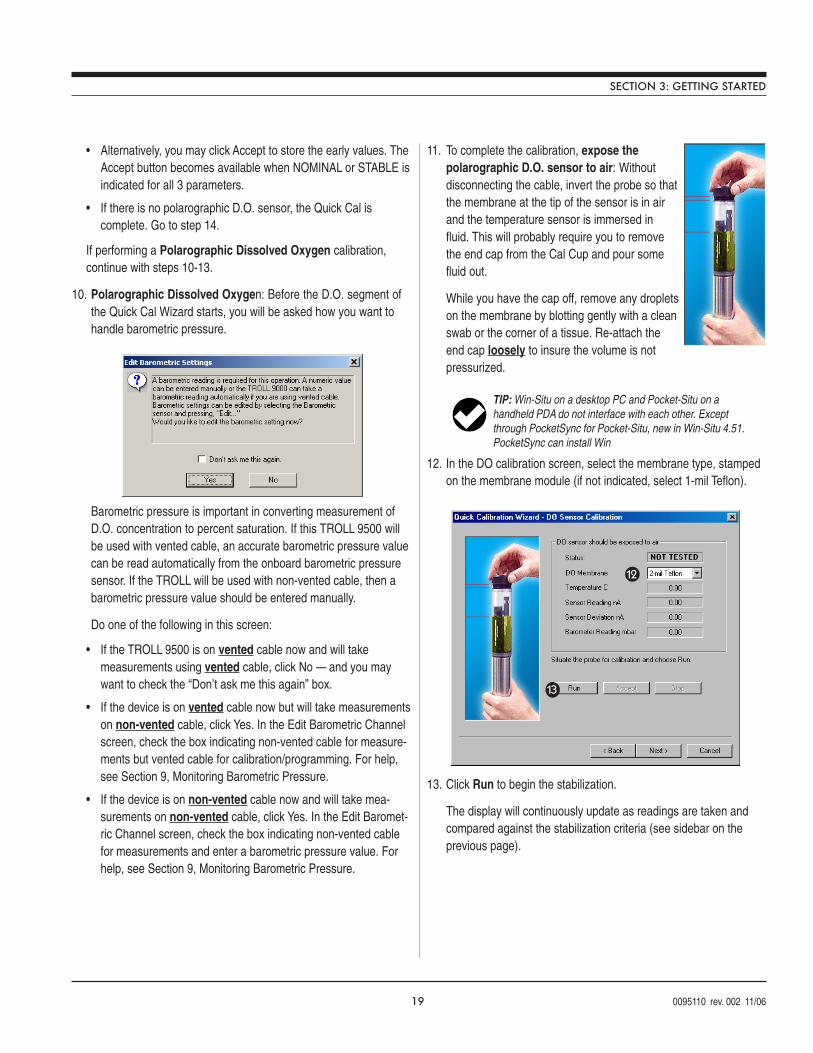
19 0095110 rev. 002 11/06
• Alternatively, you may click Accept to store the early values. TheAccept button becomes available when NOMINAL or STABLE isindicated for all 3 parameters.
• If there is no polarographic D.O. sensor, the Quick Cal iscomplete. Go to step 14.
If performing a Polarographic Dissolved Oxygen calibration,continue with steps 10-13.
10. Polarographic Dissolved Oxygen: Before the D.O. segment ofthe Quick Cal Wizard starts, you will be asked how you want tohandle barometric pressure.
Barometric pressure is important in converting measurement ofD.O. concentration to percent saturation. If this TROLL 9500 willbe used with vented cable, an accurate barometric pressure valuecan be read automatically from the onboard barometric pressuresensor. If the TROLL will be used with non-vented cable, then abarometric pressure value should be entered manually.
Do one of the following in this screen:
• If the TROLL 9500 is on vented cable now and will takemeasurements using vented cable, click No — and you maywant to check the “Don’t ask me this again” box.
• If the device is on vented cable now but will take measurementson non-vented cable, click Yes. In the Edit Barometric Channelscreen, check the box indicating non-vented cable for measure-ments but vented cable for calibration/programming. For help,see Section 9, Monitoring Barometric Pressure.
• If the device is on non-vented cable now and will take mea-surements on non-vented cable, click Yes. In the Edit Baromet-ric Channel screen, check the box indicating non-vented cablefor measurements and enter a barometric pressure value. Forhelp, see Section 9, Monitoring Barometric Pressure.
SECTION 3: GETTING STARTED
13
12
11. To complete the calibration, expose thepolarographic D.O. sensor to air: Withoutdisconnecting the cable, invert the probe so thatthe membrane at the tip of the sensor is in airand the temperature sensor is immersed influid. This will probably require you to removethe end cap from the Cal Cup and pour somefluid out.
While you have the cap off, remove any dropletson the membrane by blotting gently with a cleanswab or the corner of a tissue. Re-attach theend cap loosely to insure the volume is notpressurized.
12. In the DO calibration screen, select the membrane type, stampedon the membrane module (if not indicated, select 1-mil Teflon).
13. Click Run to begin the stabilization.
The display will continuously update as readings are taken andcompared against the stabilization criteria (see sidebar on theprevious page).
TIP: Win-Situ on a desktop PC and Pocket-Situ on ahandheld PDA do not interface with each other. Exceptthrough PocketSync for Pocket-Situ, new in Win-Situ 4.51.PocketSync can install Win
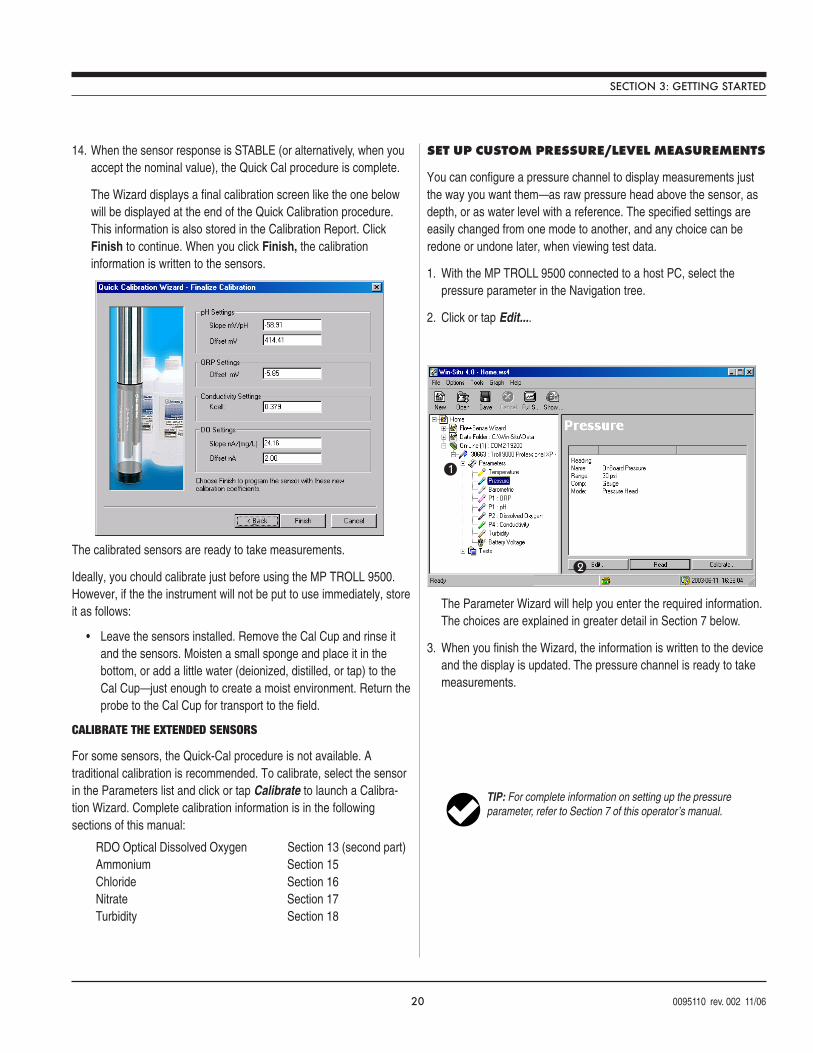
20 0095110 rev. 002 11/06
14. When the sensor response is STABLE (or alternatively, when youaccept the nominal value), the Quick Cal procedure is complete.
The Wizard displays a final calibration screen like the one belowwill be displayed at the end of the Quick Calibration procedure.This information is also stored in the Calibration Report. ClickFinish to continue. When you click Finish, the calibrationinformation is written to the sensors.
The calibrated sensors are ready to take measurements.
Ideally, you chould calibrate just before using the MP TROLL 9500.However, if the the instrument will not be put to use immediately, storeit as follows:
• Leave the sensors installed. Remove the Cal Cup and rinse itand the sensors. Moisten a small sponge and place it in thebottom, or add a little water (deionized, distilled, or tap) to theCal Cup—just enough to create a moist environment. Return theprobe to the Cal Cup for transport to the field.
CALIBRATE THE EXTENDED SENSORS
For some sensors, the Quick-Cal procedure is not available. Atraditional calibration is recommended. To calibrate, select the sensorin the Parameters list and click or tap Calibrate to launch a Calibra-tion Wizard. Complete calibration information is in the followingsections of this manual:
RDO Optical Dissolved Oxygen Section 13 (second part)Ammonium Section 15Chloride Section 16Nitrate Section 17Turbidity Section 18
SET UP CUSTOM PRESSURE/LEVEL MEASUREMENTS
You can configure a pressure channel to display measurements justthe way you want them—as raw pressure head above the sensor, asdepth, or as water level with a reference. The specified settings areeasily changed from one mode to another, and any choice can beredone or undone later, when viewing test data.
1. With the MP TROLL 9500 connected to a host PC, select thepressure parameter in the Navigation tree.
2. Click or tap Edit....
The Parameter Wizard will help you enter the required information.The choices are explained in greater detail in Section 7 below.
3. When you finish the Wizard, the information is written to the deviceand the display is updated. The pressure channel is ready to takemeasurements.
SECTION 3: GETTING STARTED
1
2
TIP: For complete information on setting up the pressureparameter, refer to Section 7 of this operator’s manual.
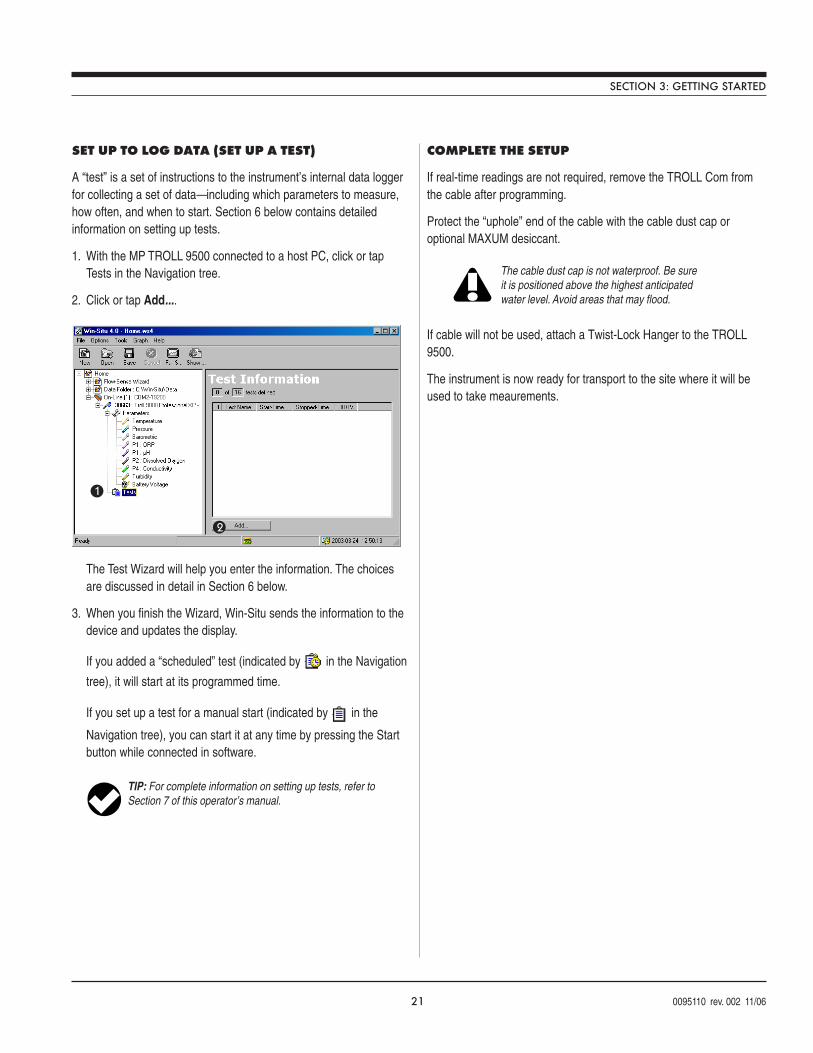
21 0095110 rev. 002 11/06
1
2
SET UP TO LOG DATA (SET UP A TEST)
A “test” is a set of instructions to the instrument’s internal data loggerfor collecting a set of data—including which parameters to measure,how often, and when to start. Section 6 below contains detailedinformation on setting up tests.
1. With the MP TROLL 9500 connected to a host PC, click or tapTests in the Navigation tree.
2. Click or tap Add....
The Test Wizard will help you enter the information. The choicesare discussed in detail in Section 6 below.
3. When you finish the Wizard, Win-Situ sends the information to thedevice and updates the display.
If you added a “scheduled” test (indicated by in the Navigation
tree), it will start at its programmed time.
If you set up a test for a manual start (indicated by in the
Navigation tree), you can start it at any time by pressing the Startbutton while connected in software.
TIP: For complete information on setting up tests, refer toSection 7 of this operator’s manual.
SECTION 3: GETTING STARTED
COMPLETE THE SETUP
If real-time readings are not required, remove the TROLL Com fromthe cable after programming.
Protect the “uphole” end of the cable with the cable dust cap oroptional MAXUM desiccant.
If cable will not be used, attach a Twist-Lock Hanger to the TROLL9500.
The instrument is now ready for transport to the site where it will beused to take meaurements.
The cable dust cap is not waterproof. Be sureit is positioned above the highest anticipatedwater level. Avoid areas that may flood.
22 0095110 rev. 002 11/06
Multi-ParameterWater Quality TROLL®
4 CONTROL SOFTWARE
The interface from a desktop or laptop computer (PC) to the Multi-Parameter TROLL 9500 is provided by instrument control softwarecalled Win-Situ®. Instrument control is accomplished through afamiliar, easy-to-use Navigation Tree interface.
For field use on a hand-held computer (PDA), optional Pocket-Situprovides all of Win-Situ’s functionality and features in a convenientfield-portable platform.
Use Win-Situ or Pocket-Situ for these tasks:
• to calibrate water-quality sensors
• to convert pressure measurements to depth or level readings
• to set up data collection schedules (“tests”)
• to take direct “manual” readings
• to take continuous real-time readings (Profiling)
• to transfer data from the Multi-Parameter TROLL 9500 to thehost computer
• to view logged data in text or graph format
• to delete data from the Multi-Parameter TROLL 9500 in order tofree up memory
• to monitor battery and memory usage
• to set the device clock
• to upgrade device firmware (when available)
• to choose measurement units and other custom display options
• to monitor indicator water-quality parameters during low-flowpumping
• to schedule automatic remote transmissions (if available)
SYSTEM REQUIREMENTS
WIN-SITU 4
Win-Situ 4 requires a desktop or laptop computer running Microsoft®
Windows® 2000 SP2 or later with a serial communications port and aCD-ROM drive.
POCKET-SITU 4
Pocket-Situ runs on the In-Situ RuggedReader® or other supportedPDA with
• Operating System: Microsoft Pocket PC (Windows Mobile®)2003 or later
• A serial communications port for connection to the TROLL 9500,
• At least 16 megabyte capacity for data storage (SD card, CFcard, or the device’s built-in non-volatile memory).
For installation and file exchange, Pocket-Situ requires the followinginstalled on an office desktop or laptop computer:
• Microsoft® ActiveSync®,• Win-Situ 4,• Win-Situ Sync (or Pocket-Sync 4, earlier version of Win-Situ
Sync)
INSTALLATION
WIN-SITU 4 (DESKTOP OR LAPTOP PC)
1. Insert the In-Situ software/resource CD in your computer’s CD-ROM drive.
• If the menu does not display automatically, choose Run from theWindows Start Menu and type D:\ISISoftwareCD.html, where Dis your CD-ROM drive letter.
2. Select Win-Situ 4, then click on Setup. Follow the instruc-tions to install Win-Situ 4 to your local hard drive. A shortcutwill be created on the desktop.
POCKET-SITU 4 (PDA)
1. From the In-Situ CD main menu select Pocket-Situ 4. Click onSetup and follow the instructions.
2. Connect the RuggedReader to the desktop computer, establish aconnection in Microsoft ActiveSync®, launch the Win-Situ SoftwareManager, and follow the instructions to install Pocket-Situ 4 on theRuggedReader.
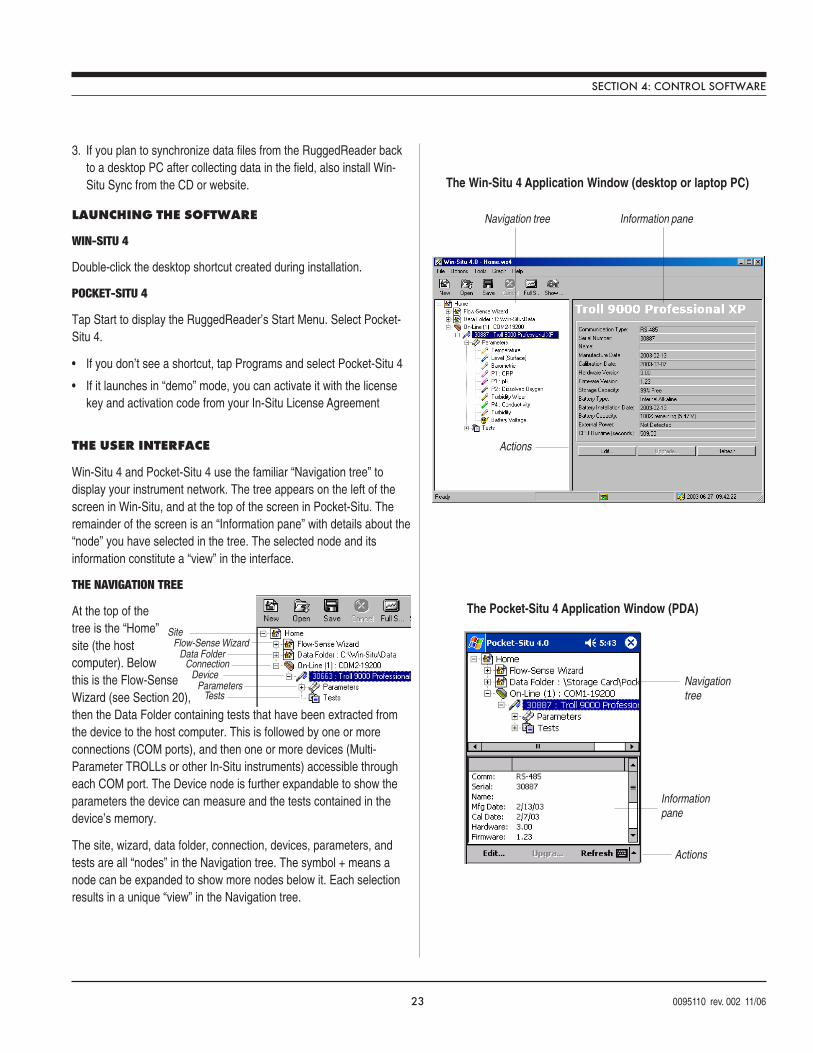
23 0095110 rev. 002 11/06
SECTION 4: CONTROL SOFTWARE
Navigation tree
Actions
Information pane
The Win-Situ 4 Application Window (desktop or laptop PC)
The Pocket-Situ 4 Application Window (PDA)
Actions
Navigationtree
Informationpane
3. If you plan to synchronize data files from the RuggedReader backto a desktop PC after collecting data in the field, also install Win-Situ Sync from the CD or website.
LAUNCHING THE SOFTWARE
WIN-SITU 4
Double-click the desktop shortcut created during installation.
POCKET-SITU 4
Tap Start to display the RuggedReader’s Start Menu. Select Pocket-Situ 4.
• If you don’t see a shortcut, tap Programs and select Pocket-Situ 4
• If it launches in “demo” mode, you can activate it with the licensekey and activation code from your In-Situ License Agreement
THE USER INTERFACE
Win-Situ 4 and Pocket-Situ 4 use the familiar “Navigation tree” todisplay your instrument network. The tree appears on the left of thescreen in Win-Situ, and at the top of the screen in Pocket-Situ. Theremainder of the screen is an “Information pane” with details about the“node” you have selected in the tree. The selected node and itsinformation constitute a “view” in the interface.
THE NAVIGATION TREE
At the top of thetree is the “Home”site (the hostcomputer). Belowthis is the Flow-SenseWizard (see Section 20),then the Data Folder containing tests that have been extracted fromthe device to the host computer. This is followed by one or moreconnections (COM ports), and then one or more devices (Multi-Parameter TROLLs or other In-Situ instruments) accessible througheach COM port. The Device node is further expandable to show theparameters the device can measure and the tests contained in thedevice’s memory.
The site, wizard, data folder, connection, devices, parameters, andtests are all “nodes” in the Navigation tree. The symbol + means anode can be expanded to show more nodes below it. Each selectionresults in a unique “view” in the Navigation tree.
SiteFlow-Sense Wizard
Data FolderConnection
DeviceParameters
Tests
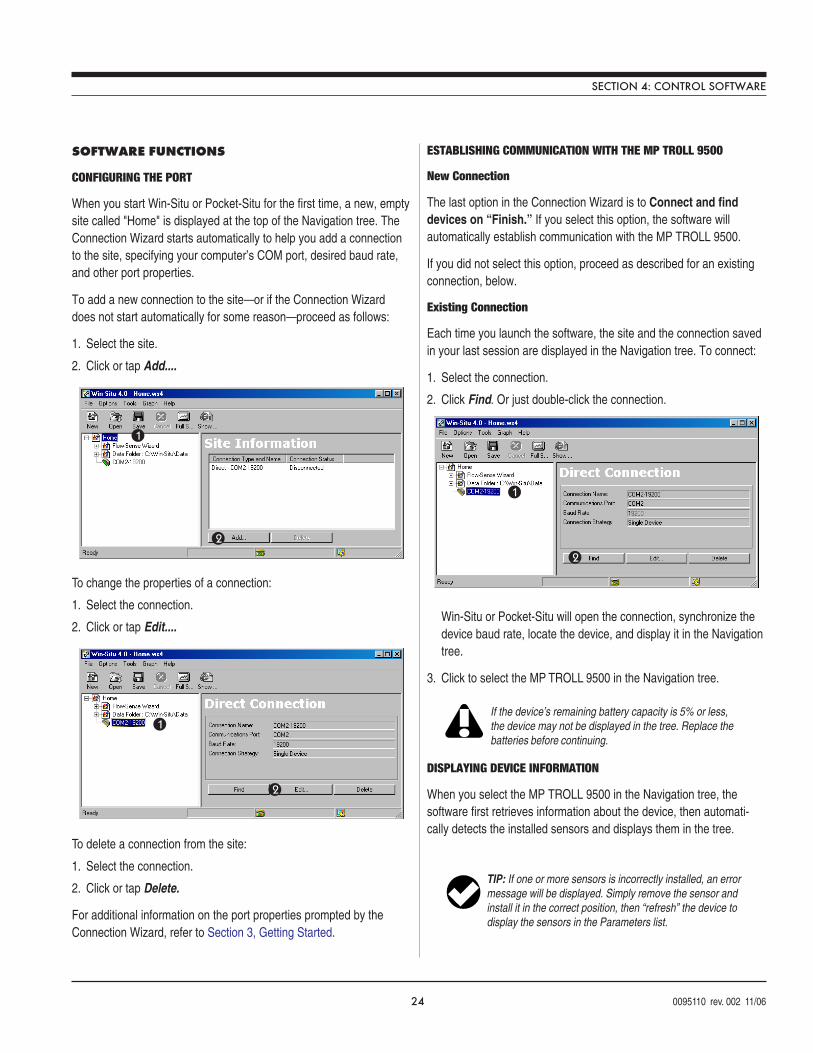
24 0095110 rev. 002 11/06
SOFTWARE FUNCTIONS
CONFIGURING THE PORT
When you start Win-Situ or Pocket-Situ for the first time, a new, emptysite called "Home" is displayed at the top of the Navigation tree. TheConnection Wizard starts automatically to help you add a connectionto the site, specifying your computer’s COM port, desired baud rate,and other port properties.
To add a new connection to the site—or if the Connection Wizarddoes not start automatically for some reason—proceed as follows:
1. Select the site.
2. Click or tap Add....
To change the properties of a connection:
1. Select the connection.
2. Click or tap Edit....
To delete a connection from the site:
1. Select the connection.
2. Click or tap Delete.
For additional information on the port properties prompted by theConnection Wizard, refer to Section 3, Getting Started.
ESTABLISHING COMMUNICATION WITH THE MP TROLL 9500
New Connection
The last option in the Connection Wizard is to Connect and finddevices on “Finish.” If you select this option, the software willautomatically establish communication with the MP TROLL 9500.
If you did not select this option, proceed as described for an existingconnection, below.
Existing Connection
Each time you launch the software, the site and the connection savedin your last session are displayed in the Navigation tree. To connect:
1. Select the connection.
2. Click Find. Or just double-click the connection.
Win-Situ or Pocket-Situ will open the connection, synchronize thedevice baud rate, locate the device, and display it in the Navigationtree.
3. Click to select the MP TROLL 9500 in the Navigation tree.
DISPLAYING DEVICE INFORMATION
When you select the MP TROLL 9500 in the Navigation tree, thesoftware first retrieves information about the device, then automati-cally detects the installed sensors and displays them in the tree.
1
2
2
1
2
1
TIP: If one or more sensors is incorrectly installed, an errormessage will be displayed. Simply remove the sensor andinstall it in the correct position, then “refresh” the device todisplay the sensors in the Parameters list.
SECTION 4: CONTROL SOFTWARE
If the device’s remaining battery capacity is 5% or less,the device may not be displayed in the tree. Replace thebatteries before continuing.
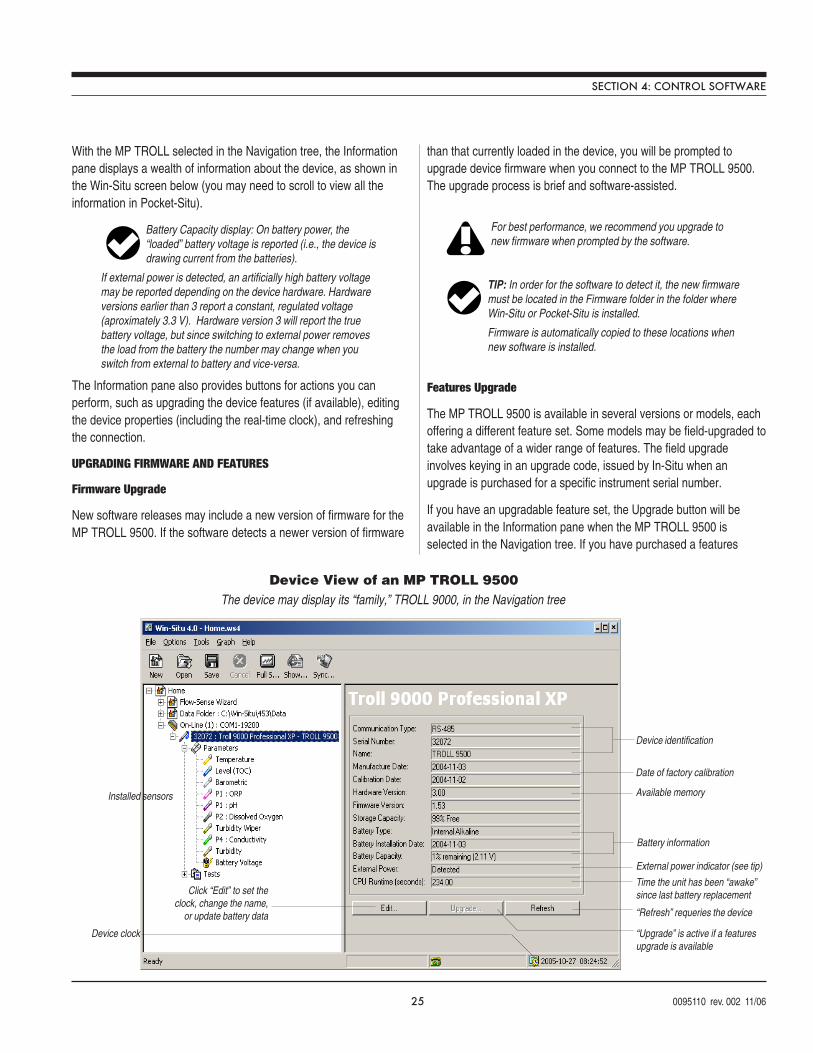
25 0095110 rev. 002 11/06
With the MP TROLL selected in the Navigation tree, the Informationpane displays a wealth of information about the device, as shown inthe Win-Situ screen below (you may need to scroll to view all theinformation in Pocket-Situ).
The Information pane also provides buttons for actions you canperform, such as upgrading the device features (if available), editingthe device properties (including the real-time clock), and refreshingthe connection.
UPGRADING FIRMWARE AND FEATURES
Firmware Upgrade
New software releases may include a new version of firmware for theMP TROLL 9500. If the software detects a newer version of firmware
than that currently loaded in the device, you will be prompted toupgrade device firmware when you connect to the MP TROLL 9500.The upgrade process is brief and software-assisted.
Features Upgrade
The MP TROLL 9500 is available in several versions or models, eachoffering a different feature set. Some models may be field-upgraded totake advantage of a wider range of features. The field upgradeinvolves keying in an upgrade code, issued by In-Situ when anupgrade is purchased for a specific instrument serial number.
If you have an upgradable feature set, the Upgrade button will beavailable in the Information pane when the MP TROLL 9500 isselected in the Navigation tree. If you have purchased a features
Battery Capacity display: On battery power, the“loaded” battery voltage is reported (i.e., the device isdrawing current from the batteries).
If external power is detected, an artificially high battery voltagemay be reported depending on the device hardware. Hardwareversions earlier than 3 report a constant, regulated voltage(aproximately 3.3 V). Hardware version 3 will report the truebattery voltage, but since switching to external power removesthe load from the battery the number may change when youswitch from external to battery and vice-versa.
SECTION 4: CONTROL SOFTWARE
TIP: In order for the software to detect it, the new firmwaremust be located in the Firmware folder in the folder whereWin-Situ or Pocket-Situ is installed.
Firmware is automatically copied to these locations whennew software is installed.
For best performance, we recommend you upgrade tonew firmware when prompted by the software.
Date of factory calibration
Available memory
Time the unit has been “awake”since last battery replacement
Battery information
Device identification
Click “Edit” to set theclock, change the name,
or update battery data
“Upgrade” is active if a featuresupgrade is available
Device View of an MP TROLL 9500
Device clock
“Refresh” requeries the device
Installed sensors
External power indicator (see tip)
The device may display its “family,” TROLL 9000, in the Navigation tree
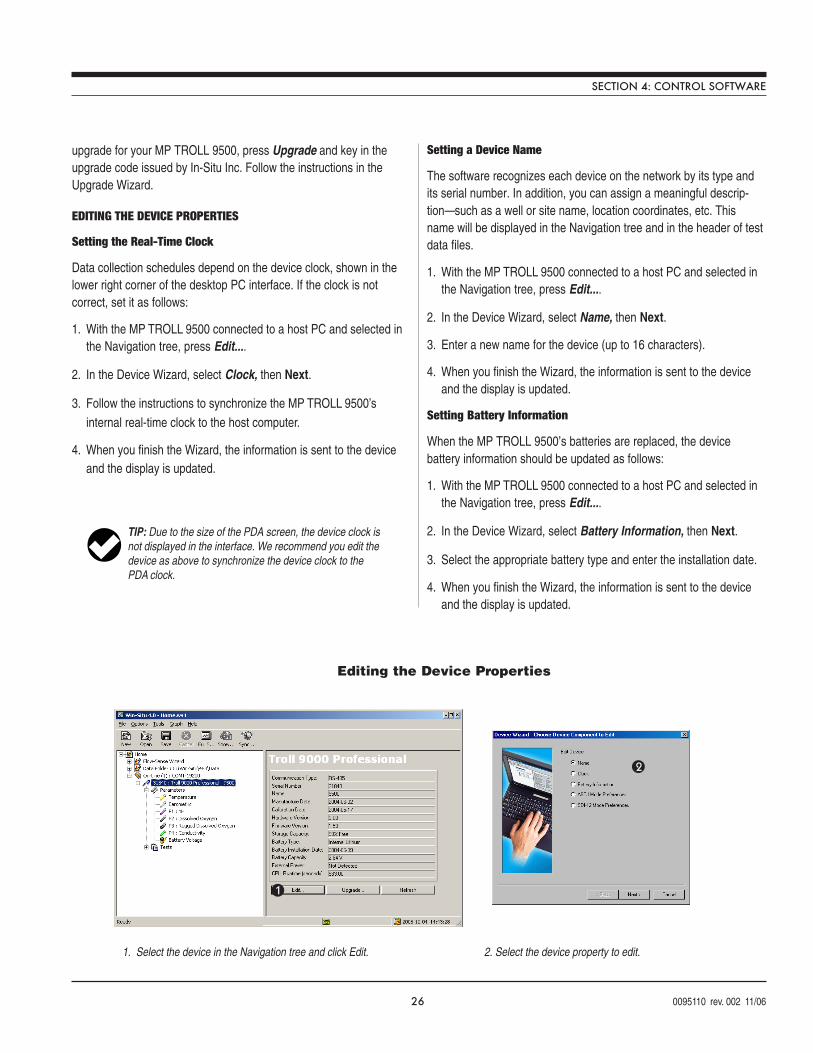
26 0095110 rev. 002 11/06
upgrade for your MP TROLL 9500, press Upgrade and key in theupgrade code issued by In-Situ Inc. Follow the instructions in theUpgrade Wizard.
EDITING THE DEVICE PROPERTIES
Setting the Real-Time Clock
Data collection schedules depend on the device clock, shown in thelower right corner of the desktop PC interface. If the clock is notcorrect, set it as follows:
1. With the MP TROLL 9500 connected to a host PC and selected inthe Navigation tree, press Edit....
2. In the Device Wizard, select Clock, then Next.
3. Follow the instructions to synchronize the MP TROLL 9500’sinternal real-time clock to the host computer.
4. When you finish the Wizard, the information is sent to the deviceand the display is updated.
Setting a Device Name
The software recognizes each device on the network by its type andits serial number. In addition, you can assign a meaningful descrip-tion—such as a well or site name, location coordinates, etc. Thisname will be displayed in the Navigation tree and in the header of testdata files.
1. With the MP TROLL 9500 connected to a host PC and selected inthe Navigation tree, press Edit....
2. In the Device Wizard, select Name, then Next.
3. Enter a new name for the device (up to 16 characters).
4. When you finish the Wizard, the information is sent to the deviceand the display is updated.
Setting Battery Information
When the MP TROLL 9500’s batteries are replaced, the devicebattery information should be updated as follows:
1. With the MP TROLL 9500 connected to a host PC and selected inthe Navigation tree, press Edit....
2. In the Device Wizard, select Battery Information, then Next.
3. Select the appropriate battery type and enter the installation date.
4. When you finish the Wizard, the information is sent to the deviceand the display is updated.
TIP: Due to the size of the PDA screen, the device clock isnot displayed in the interface. We recommend you edit thedevice as above to synchronize the device clock to thePDA clock.
1
2
Editing the Device Properties
1. Select the device in the Navigation tree and click Edit. 2. Select the device property to edit.
SECTION 4: CONTROL SOFTWARE
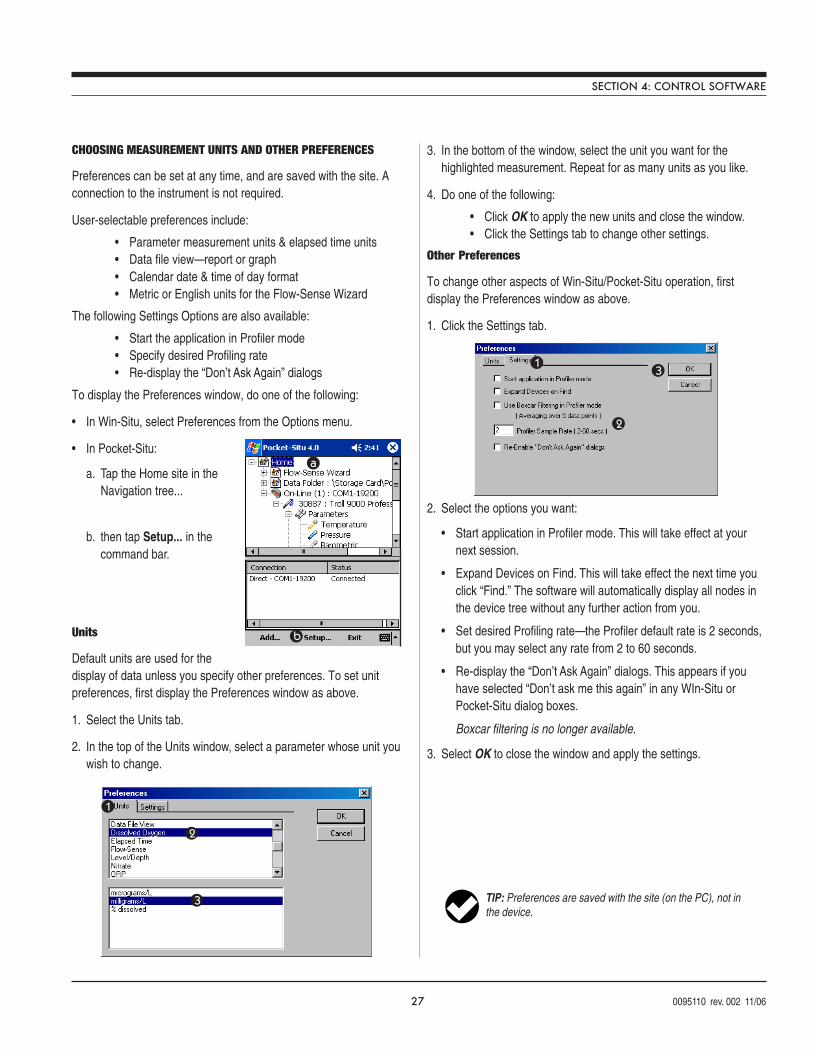
27 0095110 rev. 002 11/06
CHOOSING MEASUREMENT UNITS AND OTHER PREFERENCES
Preferences can be set at any time, and are saved with the site. Aconnection to the instrument is not required.
User-selectable preferences include:
• Parameter measurement units & elapsed time units• Data file view—report or graph• Calendar date & time of day format• Metric or English units for the Flow-Sense Wizard
The following Settings Options are also available:
• Start the application in Profiler mode• Specify desired Profiling rate• Re-display the “Don’t Ask Again” dialogs
To display the Preferences window, do one of the following:
• In Win-Situ, select Preferences from the Options menu.
• In Pocket-Situ:
a. Tap the Home site in theNavigation tree...
b. then tap Setup... in thecommand bar.
Units
Default units are used for thedisplay of data unless you specify other preferences. To set unitpreferences, first display the Preferences window as above.
1. Select the Units tab.
2. In the top of the Units window, select a parameter whose unit youwish to change.
3. In the bottom of the window, select the unit you want for thehighlighted measurement. Repeat for as many units as you like.
4. Do one of the following:
• Click OK to apply the new units and close the window.• Click the Settings tab to change other settings.
Other Preferences
To change other aspects of Win-Situ/Pocket-Situ operation, firstdisplay the Preferences window as above.
1. Click the Settings tab.
2. Select the options you want:
• Start application in Profiler mode. This will take effect at yournext session.
• Expand Devices on Find. This will take effect the next time youclick “Find.” The software will automatically display all nodes inthe device tree without any further action from you.
• Set desired Profiling rate—the Profiler default rate is 2 seconds,but you may select any rate from 2 to 60 seconds.
• Re-display the “Don’t Ask Again” dialogs. This appears if youhave selected “Don’t ask me this again” in any WIn-Situ orPocket-Situ dialog boxes.
Boxcar filtering is no longer available.
3. Select OK to close the window and apply the settings.
SECTION 4: CONTROL SOFTWARE
a
b
2
31
1
2
3 TIP: Preferences are saved with the site (on the PC), not inthe device.
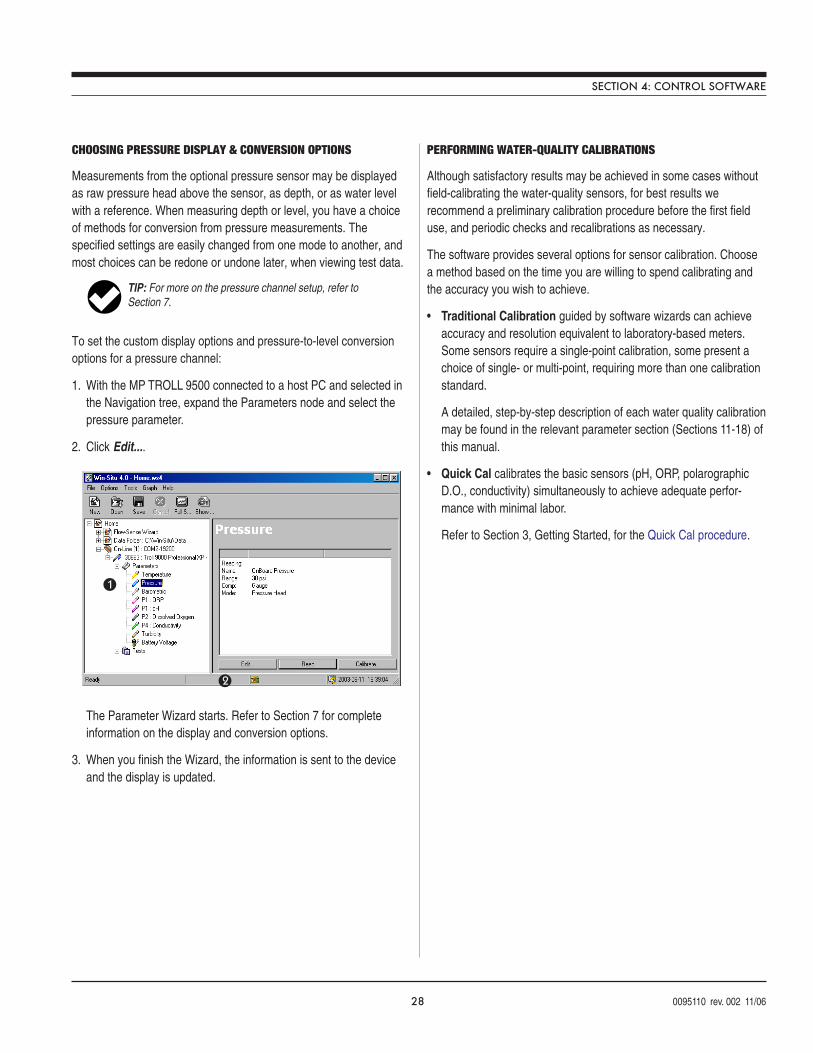
28 0095110 rev. 002 11/06
CHOOSING PRESSURE DISPLAY & CONVERSION OPTIONS
Measurements from the optional pressure sensor may be displayedas raw pressure head above the sensor, as depth, or as water levelwith a reference. When measuring depth or level, you have a choiceof methods for conversion from pressure measurements. Thespecified settings are easily changed from one mode to another, andmost choices can be redone or undone later, when viewing test data.
To set the custom display options and pressure-to-level conversionoptions for a pressure channel:
1. With the MP TROLL 9500 connected to a host PC and selected inthe Navigation tree, expand the Parameters node and select thepressure parameter.
2. Click Edit....
The Parameter Wizard starts. Refer to Section 7 for completeinformation on the display and conversion options.
3. When you finish the Wizard, the information is sent to the deviceand the display is updated.
SECTION 4: CONTROL SOFTWARE
TIP: For more on the pressure channel setup, refer toSection 7.
1
2
PERFORMING WATER-QUALITY CALIBRATIONS
Although satisfactory results may be achieved in some cases withoutfield-calibrating the water-quality sensors, for best results werecommend a preliminary calibration procedure before the first fielduse, and periodic checks and recalibrations as necessary.
The software provides several options for sensor calibration. Choosea method based on the time you are willing to spend calibrating andthe accuracy you wish to achieve.
• Traditional Calibration guided by software wizards can achieveaccuracy and resolution equivalent to laboratory-based meters.Some sensors require a single-point calibration, some present achoice of single- or multi-point, requiring more than one calibrationstandard.
A detailed, step-by-step description of each water quality calibrationmay be found in the relevant parameter section (Sections 11-18) ofthis manual.
• Quick Cal calibrates the basic sensors (pH, ORP, polarographicD.O., conductivity) simultaneously to achieve adequate perfor-mance with minimal labor.
Refer to Section 3, Getting Started, for the Quick Cal procedure.
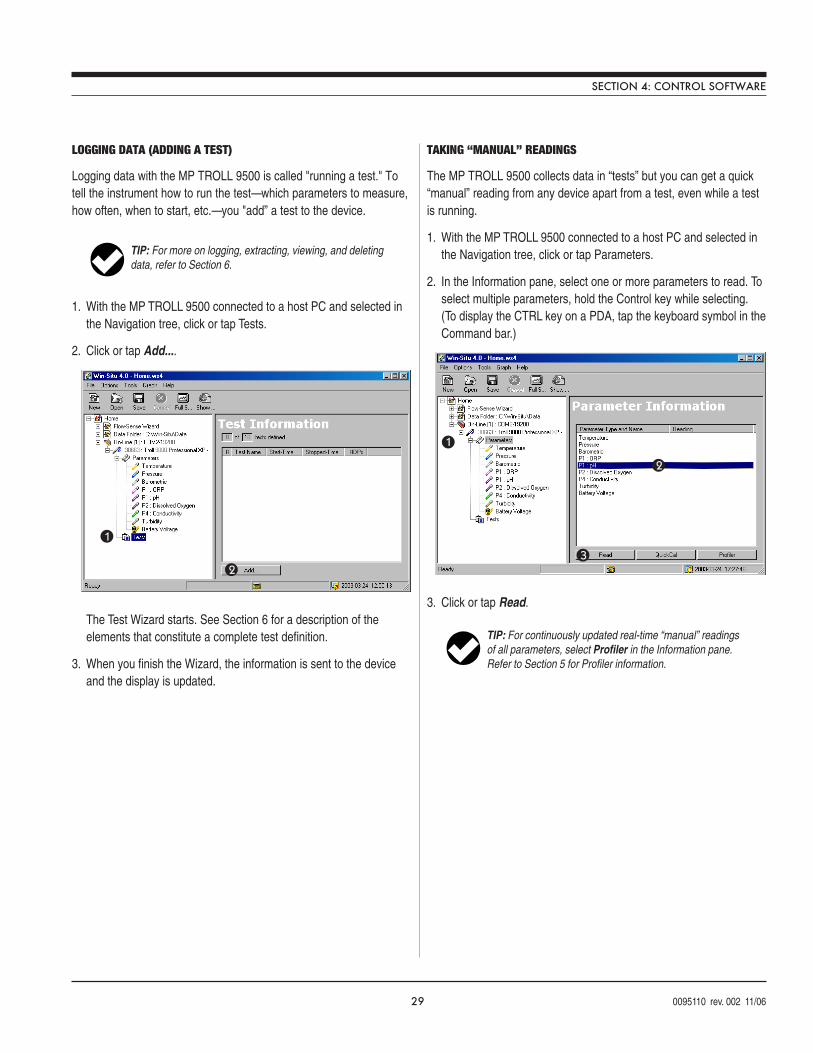
29 0095110 rev. 002 11/06
LOGGING DATA (ADDING A TEST)
Logging data with the MP TROLL 9500 is called "running a test." Totell the instrument how to run the test—which parameters to measure,how often, when to start, etc.—you "add” a test to the device.
1. With the MP TROLL 9500 connected to a host PC and selected inthe Navigation tree, click or tap Tests.
2. Click or tap Add....
The Test Wizard starts. See Section 6 for a description of theelements that constitute a complete test definition.
3. When you finish the Wizard, the information is sent to the deviceand the display is updated.
SECTION 4: CONTROL SOFTWARE
1
2
3
TIP: For continuously updated real-time “manual” readingsof all parameters, select Profiler in the Information pane.Refer to Section 5 for Profiler information.
TIP: For more on logging, extracting, viewing, and deletingdata, refer to Section 6.
1
2
TAKING “MANUAL” READINGS
The MP TROLL 9500 collects data in “tests” but you can get a quick“manual” reading from any device apart from a test, even while a testis running.
1. With the MP TROLL 9500 connected to a host PC and selected inthe Navigation tree, click or tap Parameters.
2. In the Information pane, select one or more parameters to read. Toselect multiple parameters, hold the Control key while selecting.(To display the CTRL key on a PDA, tap the keyboard symbol in theCommand bar.)
3. Click or tap Read.
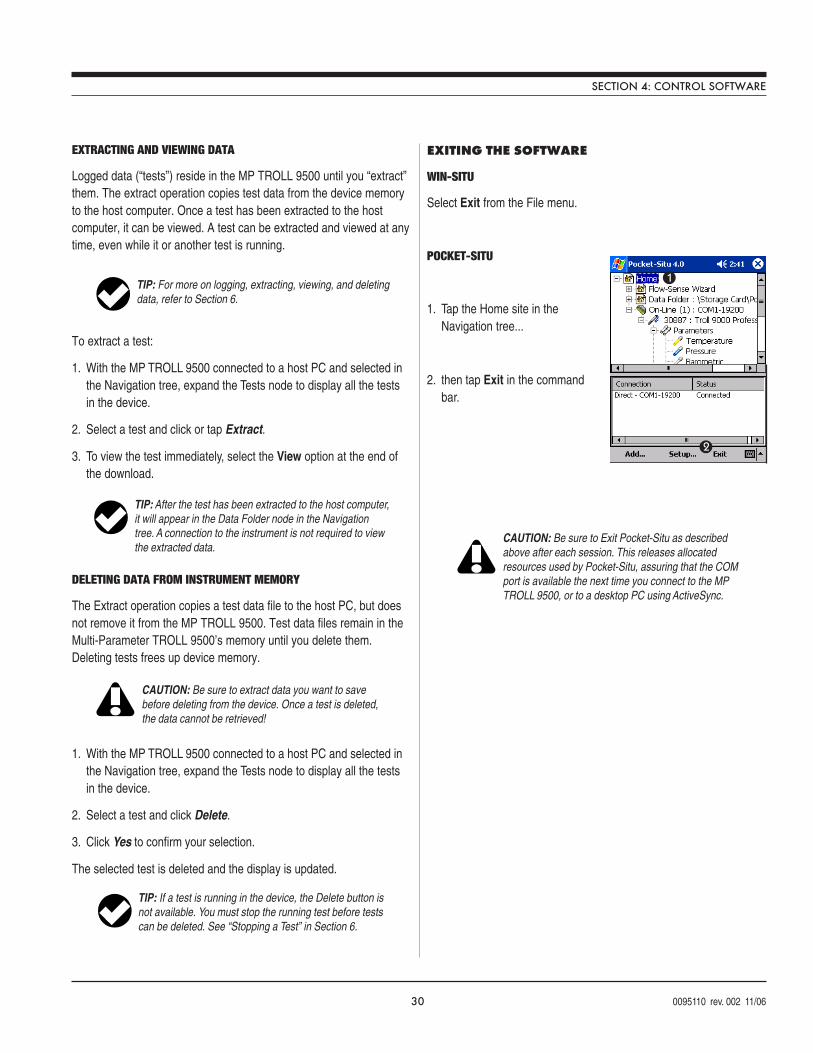
30 0095110 rev. 002 11/06
SECTION 4: CONTROL SOFTWARE
EXTRACTING AND VIEWING DATA
Logged data (“tests”) reside in the MP TROLL 9500 until you “extract”them. The extract operation copies test data from the device memoryto the host computer. Once a test has been extracted to the hostcomputer, it can be viewed. A test can be extracted and viewed at anytime, even while it or another test is running.
To extract a test:
1. With the MP TROLL 9500 connected to a host PC and selected inthe Navigation tree, expand the Tests node to display all the testsin the device.
2. Select a test and click or tap Extract.
3. To view the test immediately, select the View option at the end ofthe download.
DELETING DATA FROM INSTRUMENT MEMORY
The Extract operation copies a test data file to the host PC, but doesnot remove it from the MP TROLL 9500. Test data files remain in theMulti-Parameter TROLL 9500’s memory until you delete them.Deleting tests frees up device memory.
1. With the MP TROLL 9500 connected to a host PC and selected inthe Navigation tree, expand the Tests node to display all the testsin the device.
2. Select a test and click Delete.
3. Click Yes to confirm your selection.
The selected test is deleted and the display is updated.
TIP: For more on logging, extracting, viewing, and deletingdata, refer to Section 6.
TIP: After the test has been extracted to the host computer,it will appear in the Data Folder node in the Navigationtree. A connection to the instrument is not required to viewthe extracted data.
CAUTION: Be sure to extract data you want to savebefore deleting from the device. Once a test is deleted,the data cannot be retrieved!
TIP: If a test is running in the device, the Delete button isnot available. You must stop the running test before testscan be deleted. See “Stopping a Test” in Section 6.
EXITING THE SOFTWARE
WIN-SITU
Select Exit from the File menu.
POCKET-SITU
1. Tap the Home site in theNavigation tree...
2. then tap Exit in the commandbar.
1
2
CAUTION: Be sure to Exit Pocket-Situ as describedabove after each session. This releases allocatedresources used by Pocket-Situ, assuring that the COMport is available the next time you connect to the MPTROLL 9500, or to a desktop PC using ActiveSync.
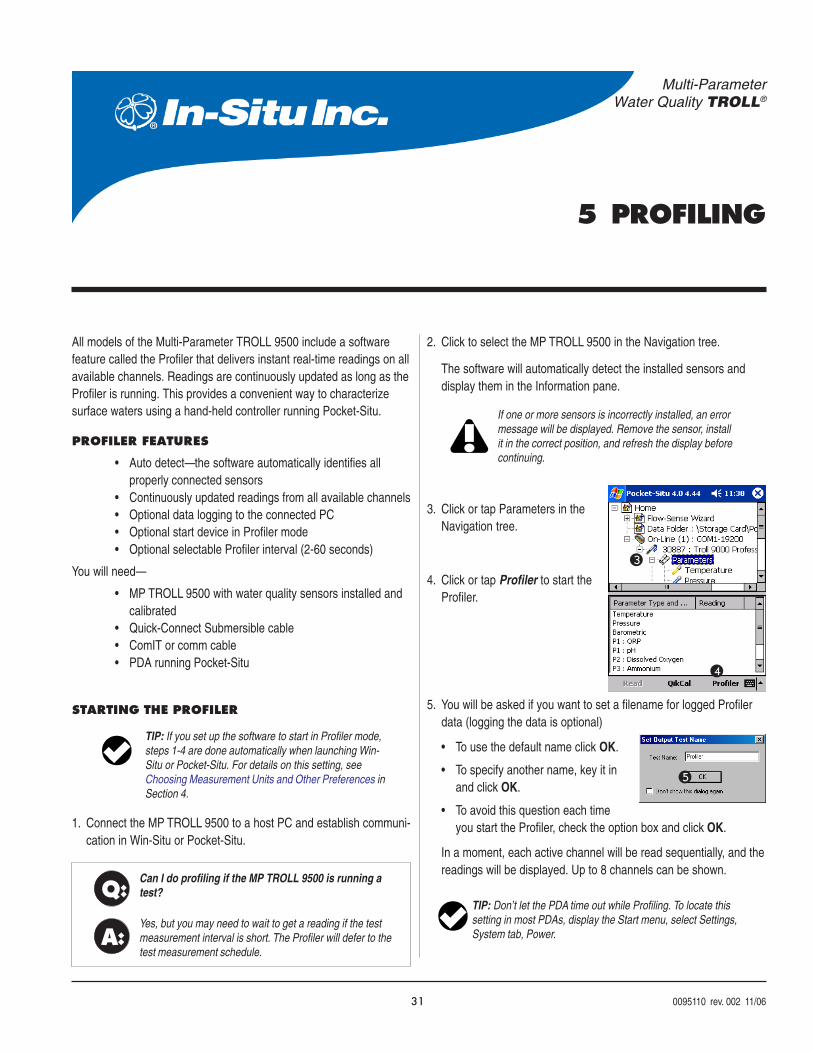
31 0095110 rev. 002 11/06
Multi-ParameterWater Quality TROLL®
5 PROFILING
If one or more sensors is incorrectly installed, an errormessage will be displayed. Remove the sensor, installit in the correct position, and refresh the display beforecontinuing.
All models of the Multi-Parameter TROLL 9500 include a softwarefeature called the Profiler that delivers instant real-time readings on allavailable channels. Readings are continuously updated as long as theProfiler is running. This provides a convenient way to characterizesurface waters using a hand-held controller running Pocket-Situ.
PROFILER FEATURES
• Auto detect—the software automatically identifies allproperly connected sensors
• Continuously updated readings from all available channels• Optional data logging to the connected PC• Optional start device in Profiler mode• Optional selectable Profiler interval (2-60 seconds)
You will need—
• MP TROLL 9500 with water quality sensors installed andcalibrated
• Quick-Connect Submersible cable• ComIT or comm cable• PDA running Pocket-Situ
STARTING THE PROFILER
1. Connect the MP TROLL 9500 to a host PC and establish communi-cation in Win-Situ or Pocket-Situ.
2. Click to select the MP TROLL 9500 in the Navigation tree.
The software will automatically detect the installed sensors anddisplay them in the Information pane.
3. Click or tap Parameters in theNavigation tree.
4. Click or tap Profiler to start theProfiler.
5. You will be asked if you want to set a filename for logged Profilerdata (logging the data is optional)
• To use the default name click OK.
• To specify another name, key it inand click OK.
• To avoid this question each timeyou start the Profiler, check the option box and click OK.
In a moment, each active channel will be read sequentially, and thereadings will be displayed. Up to 8 channels can be shown.
TIP: Don’t let the PDA time out while Profiling. To locate thissetting in most PDAs, display the Start menu, select Settings,System tab, Power.
5
TIP: If you set up the software to start in Profiler mode,steps 1-4 are done automatically when launching Win-Situ or Pocket-Situ. For details on this setting, seeChoosing Measurement Units and Other Preferences inSection 4.
3
4
Q:
A:
Can I do profiling if the MP TROLL 9500 is running atest?
Yes, but you may need to wait to get a reading if the testmeasurement interval is short. The Profiler will defer to thetest measurement schedule.
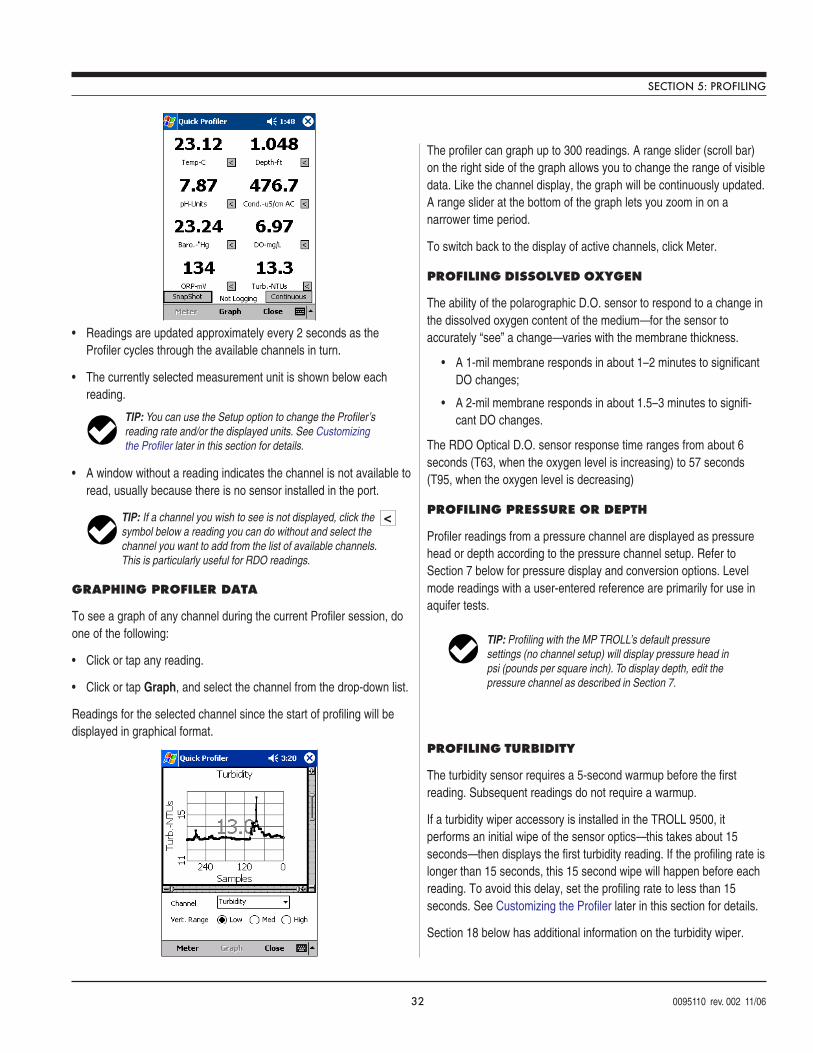
32 0095110 rev. 002 11/06
• Readings are updated approximately every 2 seconds as theProfiler cycles through the available channels in turn.
• The currently selected measurement unit is shown below eachreading.
• A window without a reading indicates the channel is not available toread, usually because there is no sensor installed in the port.
GRAPHING PROFILER DATA
To see a graph of any channel during the current Profiler session, doone of the following:
• Click or tap any reading.
• Click or tap Graph, and select the channel from the drop-down list.
Readings for the selected channel since the start of profiling will bedisplayed in graphical format.
The profiler can graph up to 300 readings. A range slider (scroll bar)on the right side of the graph allows you to change the range of visibledata. Like the channel display, the graph will be continuously updated.A range slider at the bottom of the graph lets you zoom in on anarrower time period.
To switch back to the display of active channels, click Meter.
PROFILING DISSOLVED OXYGEN
The ability of the polarographic D.O. sensor to respond to a change inthe dissolved oxygen content of the medium—for the sensor toaccurately “see” a change—varies with the membrane thickness.
• A 1-mil membrane responds in about 1–2 minutes to significantDO changes;
• A 2-mil membrane responds in about 1.5–3 minutes to signifi-cant DO changes.
The RDO Optical D.O. sensor response time ranges from about 6seconds (T63, when the oxygen level is increasing) to 57 seconds(T95, when the oxygen level is decreasing)
PROFILING PRESSURE OR DEPTH
Profiler readings from a pressure channel are displayed as pressurehead or depth according to the pressure channel setup. Refer toSection 7 below for pressure display and conversion options. Levelmode readings with a user-entered reference are primarily for use inaquifer tests.
PROFILING TURBIDITY
The turbidity sensor requires a 5-second warmup before the firstreading. Subsequent readings do not require a warmup.
If a turbidity wiper accessory is installed in the TROLL 9500, itperforms an initial wipe of the sensor optics—this takes about 15seconds—then displays the first turbidity reading. If the profiling rate islonger than 15 seconds, this 15 second wipe will happen before eachreading. To avoid this delay, set the profiling rate to less than 15seconds. See Customizing the Profiler later in this section for details.
Section 18 below has additional information on the turbidity wiper.
SECTION 5: PROFILING
TIP: You can use the Setup option to change the Profiler’sreading rate and/or the displayed units. See Customizingthe Profiler later in this section for details.
TIP: Profiling with the MP TROLL’s default pressuresettings (no channel setup) will display pressure head inpsi (pounds per square inch). To display depth, edit thepressure channel as described in Section 7.
<TIP: If a channel you wish to see is not displayed, click thesymbol below a reading you can do without and select thechannel you want to add from the list of available channels.This is particularly useful for RDO readings.
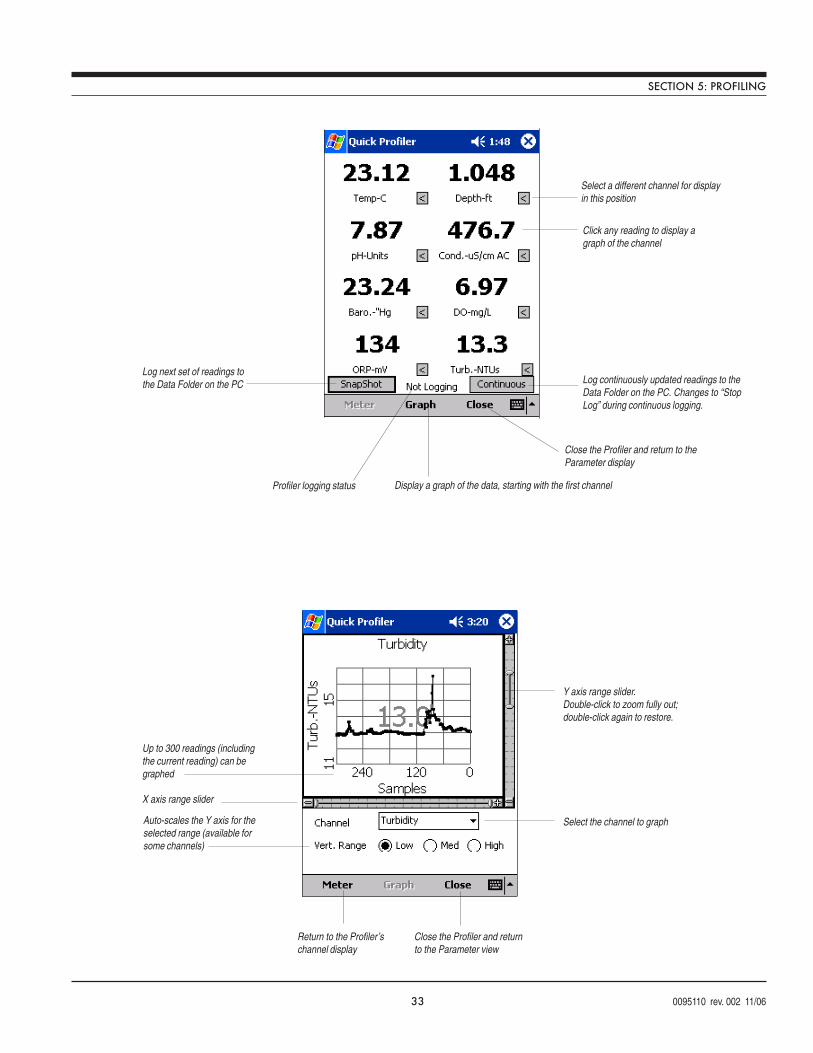
33 0095110 rev. 002 11/06
SECTION 5: PROFILING
Close the Profiler and return to theParameter display
Display a graph of the data, starting with the first channel
Log next set of readings tothe Data Folder on the PC Log continuously updated readings to the
Data Folder on the PC. Changes to “StopLog” during continuous logging.
Select a different channel for displayin this position
Profiler logging status
Click any reading to display agraph of the channel
Select the channel to graph
Y axis range slider.Double-click to zoom fully out;double-click again to restore.
Close the Profiler and returnto the Parameter view
Return to the Profiler’schannel display
Up to 300 readings (includingthe current reading) can begraphed
X axis range slider
Auto-scales the Y axis for theselected range (available forsome channels)
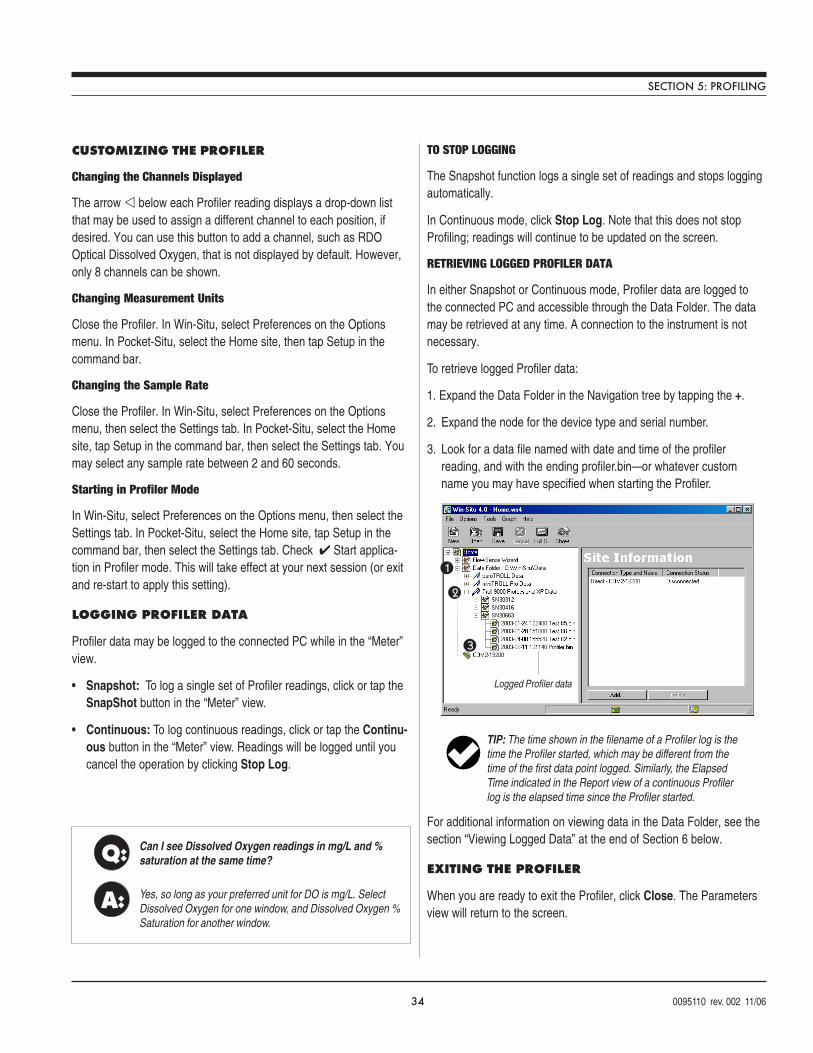
34 0095110 rev. 002 11/06
Q:
A:
Can I see Dissolved Oxygen readings in mg/L and %saturation at the same time?
Yes, so long as your preferred unit for DO is mg/L. SelectDissolved Oxygen for one window, and Dissolved Oxygen %Saturation for another window.
TIP: The time shown in the filename of a Profiler log is thetime the Profiler started, which may be different from thetime of the first data point logged. Similarly, the ElapsedTime indicated in the Report view of a continuous Profilerlog is the elapsed time since the Profiler started.
CUSTOMIZING THE PROFILER
Changing the Channels Displayed
The arrow below each Profiler reading displays a drop-down listthat may be used to assign a different channel to each position, ifdesired. You can use this button to add a channel, such as RDOOptical Dissolved Oxygen, that is not displayed by default. However,only 8 channels can be shown.
Changing Measurement Units
Close the Profiler. In Win-Situ, select Preferences on the Optionsmenu. In Pocket-Situ, select the Home site, then tap Setup in thecommand bar.
Changing the Sample Rate
Close the Profiler. In Win-Situ, select Preferences on the Optionsmenu, then select the Settings tab. In Pocket-Situ, select the Homesite, tap Setup in the command bar, then select the Settings tab. Youmay select any sample rate between 2 and 60 seconds.
Starting in Profiler Mode
In Win-Situ, select Preferences on the Options menu, then select theSettings tab. In Pocket-Situ, select the Home site, tap Setup in thecommand bar, then select the Settings tab. Check Start applica-tion in Profiler mode. This will take effect at your next session (or exitand re-start to apply this setting).
LOGGING PROFILER DATA
Profiler data may be logged to the connected PC while in the “Meter”view.
• Snapshot: To log a single set of Profiler readings, click or tap theSnapShot button in the “Meter” view.
• Continuous: To log continuous readings, click or tap the Continu-ous button in the “Meter” view. Readings will be logged until youcancel the operation by clicking Stop Log.
TO STOP LOGGING
The Snapshot function logs a single set of readings and stops loggingautomatically.
In Continuous mode, click Stop Log. Note that this does not stopProfiling; readings will continue to be updated on the screen.
RETRIEVING LOGGED PROFILER DATA
In either Snapshot or Continuous mode, Profiler data are logged tothe connected PC and accessible through the Data Folder. The datamay be retrieved at any time. A connection to the instrument is notnecessary.
To retrieve logged Profiler data:
1. Expand the Data Folder in the Navigation tree by tapping the +.
2. Expand the node for the device type and serial number.
3. Look for a data file named with date and time of the profilerreading, and with the ending profiler.bin—or whatever customname you may have specified when starting the Profiler.
For additional information on viewing data in the Data Folder, see thesection “Viewing Logged Data” at the end of Section 6 below.
EXITING THE PROFILER
When you are ready to exit the Profiler, click Close. The Parametersview will return to the screen.
SECTION 5: PROFILING
Logged Profiler data
1
2
3
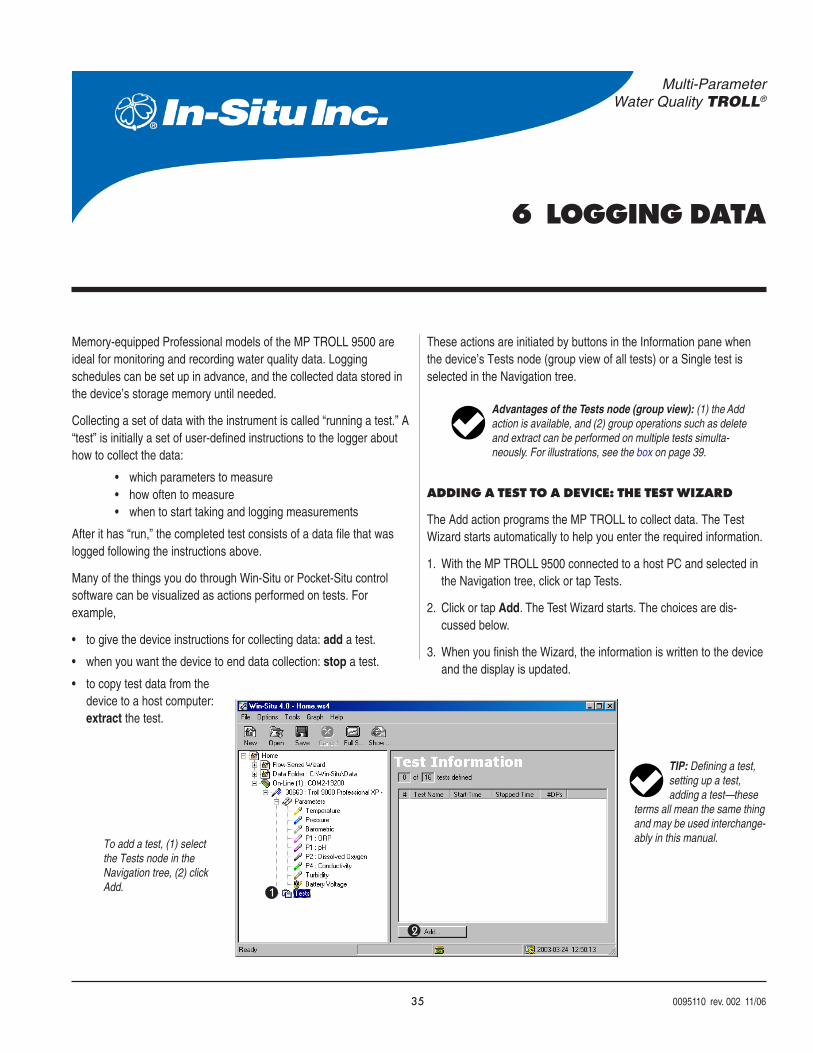
35 0095110 rev. 002 11/06
Multi-ParameterWater Quality TROLL®
TIP: Defining a test,setting up a test,adding a test—these
terms all mean the same thingand may be used interchange-ably in this manual.
6 LOGGING DATA
1
2
Advantages of the Tests node (group view): (1) the Addaction is available, and (2) group operations such as deleteand extract can be performed on multiple tests simulta-neously. For illustrations, see the box on page 39.
To add a test, (1) selectthe Tests node in theNavigation tree, (2) clickAdd.
Memory-equipped Professional models of the MP TROLL 9500 areideal for monitoring and recording water quality data. Loggingschedules can be set up in advance, and the collected data stored inthe device’s storage memory until needed.
Collecting a set of data with the instrument is called “running a test.” A“test” is initially a set of user-defined instructions to the logger abouthow to collect the data:
• which parameters to measure• how often to measure• when to start taking and logging measurements
After it has “run,” the completed test consists of a data file that waslogged following the instructions above.
Many of the things you do through Win-Situ or Pocket-Situ controlsoftware can be visualized as actions performed on tests. Forexample,
• to give the device instructions for collecting data: add a test.
• when you want the device to end data collection: stop a test.
• to copy test data from thedevice to a host computer:extract the test.
These actions are initiated by buttons in the Information pane whenthe device’s Tests node (group view of all tests) or a Single test isselected in the Navigation tree.
ADDING A TEST TO A DEVICE: THE TEST WIZARD
The Add action programs the MP TROLL to collect data. The TestWizard starts automatically to help you enter the required information.
1. With the MP TROLL 9500 connected to a host PC and selected inthe Navigation tree, click or tap Tests.
2. Click or tap Add. The Test Wizard starts. The choices are dis-cussed below.
3. When you finish the Wizard, the information is written to the deviceand the display is updated.
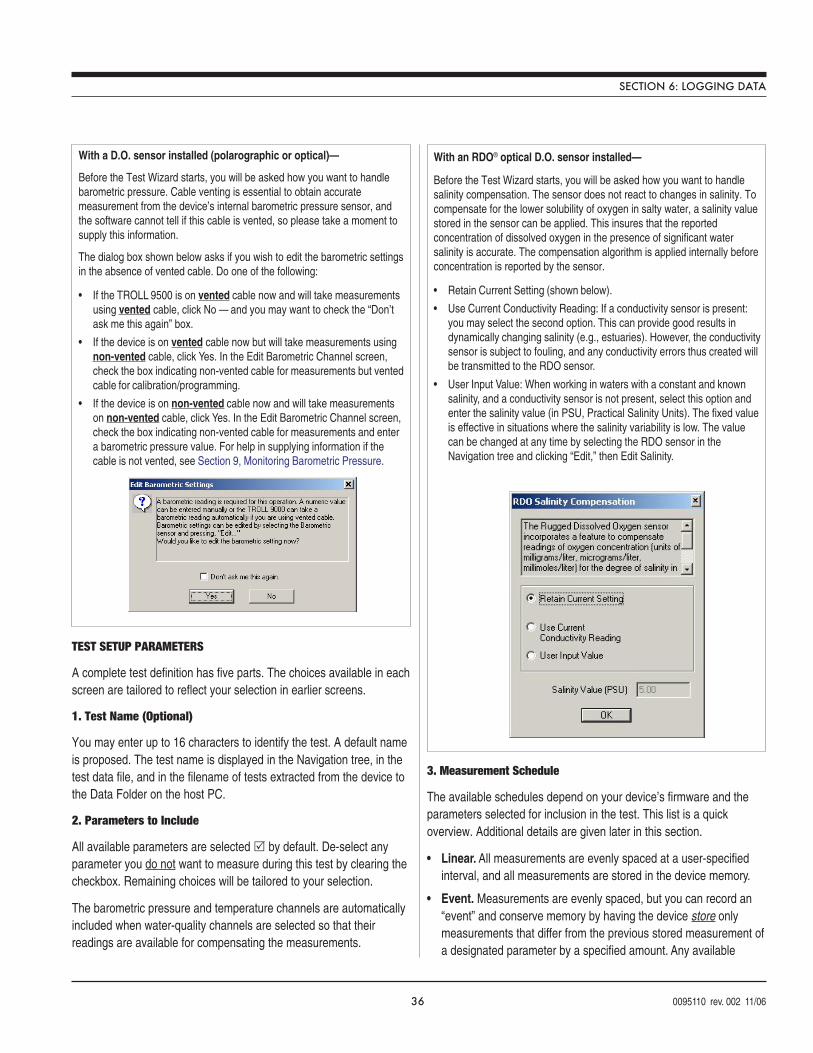
36 0095110 rev. 002 11/06
TEST SETUP PARAMETERS
A complete test definition has five parts. The choices available in eachscreen are tailored to reflect your selection in earlier screens.
1. Test Name (Optional)
You may enter up to 16 characters to identify the test. A default nameis proposed. The test name is displayed in the Navigation tree, in thetest data file, and in the filename of tests extracted from the device tothe Data Folder on the host PC.
2. Parameters to Include
All available parameters are selected by default. De-select anyparameter you do not want to measure during this test by clearing thecheckbox. Remaining choices will be tailored to your selection.
The barometric pressure and temperature channels are automaticallyincluded when water-quality channels are selected so that theirreadings are available for compensating the measurements.
3. Measurement Schedule
The available schedules depend on your device’s firmware and theparameters selected for inclusion in the test. This list is a quickoverview. Additional details are given later in this section.
• Linear. All measurements are evenly spaced at a user-specifiedinterval, and all measurements are stored in the device memory.
• Event. Measurements are evenly spaced, but you can record an“event” and conserve memory by having the device store onlymeasurements that differ from the previous stored measurement ofa designated parameter by a specified amount. Any available
With a D.O. sensor installed (polarographic or optical)—
Before the Test Wizard starts, you will be asked how you want to handlebarometric pressure. Cable venting is essential to obtain accuratemeasurement from the device’s internal barometric pressure sensor, andthe software cannot tell if this cable is vented, so please take a moment tosupply this information.
The dialog box shown below asks if you wish to edit the barometric settingsin the absence of vented cable. Do one of the following:
• If the TROLL 9500 is on vented cable now and will take measurementsusing vented cable, click No — and you may want to check the “Don’task me this again” box.
• If the device is on vented cable now but will take measurements usingnon-vented cable, click Yes. In the Edit Barometric Channel screen,check the box indicating non-vented cable for measurements but ventedcable for calibration/programming.
• If the device is on non-vented cable now and will take measurementson non-vented cable, click Yes. In the Edit Barometric Channel screen,check the box indicating non-vented cable for measurements and entera barometric pressure value. For help in supplying information if thecable is not vented, see Section 9, Monitoring Barometric Pressure.
SECTION 6: LOGGING DATA
With an RDO® optical D.O. sensor installed—
Before the Test Wizard starts, you will be asked how you want to handlesalinity compensation. The sensor does not react to changes in salinity. Tocompensate for the lower solubility of oxygen in salty water, a salinity valuestored in the sensor can be applied. This insures that the reportedconcentration of dissolved oxygen in the presence of significant watersalinity is accurate. The compensation algorithm is applied internally beforeconcentration is reported by the sensor.
• Retain Current Setting (shown below).
• Use Current Conductivity Reading: If a conductivity sensor is present:you may select the second option. This can provide good results indynamically changing salinity (e.g., estuaries). However, the conductivitysensor is subject to fouling, and any conductivity errors thus created willbe transmitted to the RDO sensor.
• User Input Value: When working in waters with a constant and knownsalinity, and a conductivity sensor is not present, select this option andenter the salinity value (in PSU, Practical Salinity Units). The fixed valueis effective in situations where the salinity variability is low. The valuecan be changed at any time by selecting the RDO sensor in theNavigation tree and clicking “Edit,” then Edit Salinity.
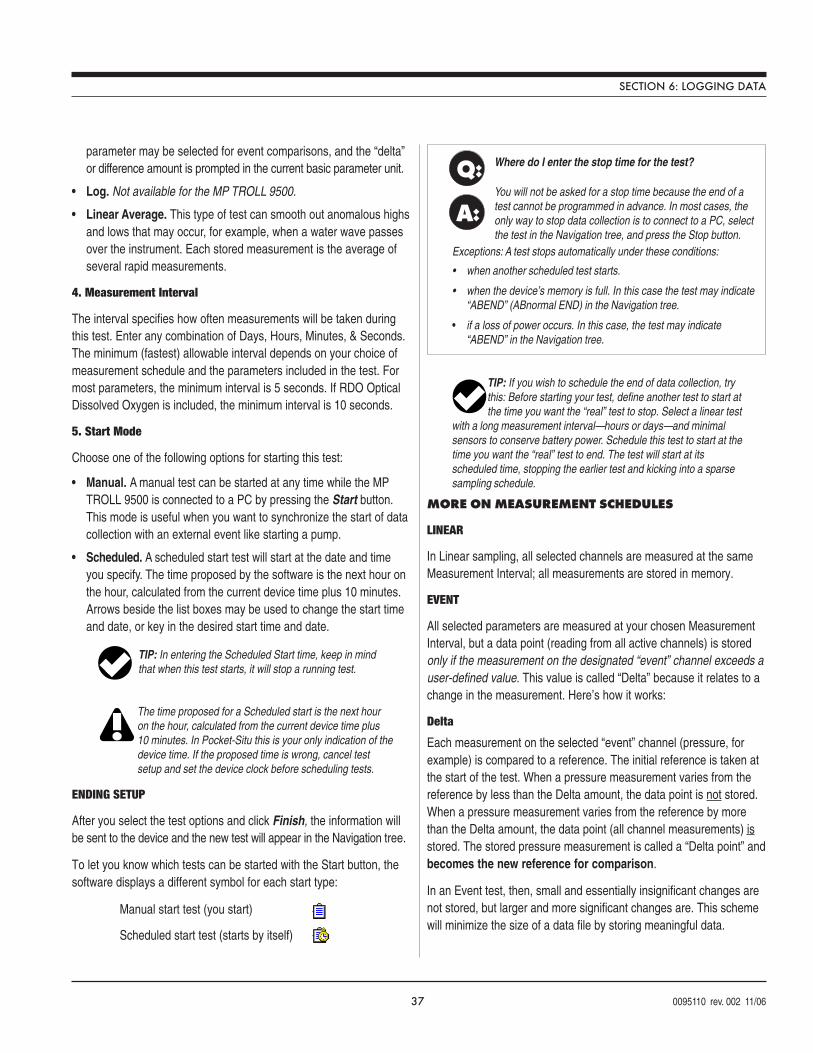
37 0095110 rev. 002 11/06
parameter may be selected for event comparisons, and the “delta”or difference amount is prompted in the current basic parameter unit.
• Log. Not available for the MP TROLL 9500.
• Linear Average. This type of test can smooth out anomalous highsand lows that may occur, for example, when a water wave passesover the instrument. Each stored measurement is the average ofseveral rapid measurements.
4. Measurement Interval
The interval specifies how often measurements will be taken duringthis test. Enter any combination of Days, Hours, Minutes, & Seconds.The minimum (fastest) allowable interval depends on your choice ofmeasurement schedule and the parameters included in the test. Formost parameters, the minimum interval is 5 seconds. If RDO OpticalDissolved Oxygen is included, the minimum interval is 10 seconds.
5. Start Mode
Choose one of the following options for starting this test:
• Manual. A manual test can be started at any time while the MPTROLL 9500 is connected to a PC by pressing the Start button.This mode is useful when you want to synchronize the start of datacollection with an external event like starting a pump.
• Scheduled. A scheduled start test will start at the date and timeyou specify. The time proposed by the software is the next hour onthe hour, calculated from the current device time plus 10 minutes.Arrows beside the list boxes may be used to change the start timeand date, or key in the desired start time and date.
ENDING SETUP
After you select the test options and click Finish, the information willbe sent to the device and the new test will appear in the Navigation tree.
To let you know which tests can be started with the Start button, thesoftware displays a different symbol for each start type:
Manual start test (you start)
Scheduled start test (starts by itself)
MORE ON MEASUREMENT SCHEDULES
LINEAR
In Linear sampling, all selected channels are measured at the sameMeasurement Interval; all measurements are stored in memory.
EVENT
All selected parameters are measured at your chosen MeasurementInterval, but a data point (reading from all active channels) is storedonly if the measurement on the designated “event” channel exceeds auser-defined value. This value is called “Delta” because it relates to achange in the measurement. Here’s how it works:
Delta
Each measurement on the selected “event” channel (pressure, forexample) is compared to a reference. The initial reference is taken atthe start of the test. When a pressure measurement varies from thereference by less than the Delta amount, the data point is not stored.When a pressure measurement varies from the reference by morethan the Delta amount, the data point (all channel measurements) isstored. The stored pressure measurement is called a “Delta point” andbecomes the new reference for comparison.
In an Event test, then, small and essentially insignificant changes arenot stored, but larger and more significant changes are. This schemewill minimize the size of a data file by storing meaningful data.
SECTION 6: LOGGING DATA
Q:
A:
Where do I enter the stop time for the test?
You will not be asked for a stop time because the end of atest cannot be programmed in advance. In most cases, theonly way to stop data collection is to connect to a PC, selectthe test in the Navigation tree, and press the Stop button.
Exceptions: A test stops automatically under these conditions:
• when another scheduled test starts.
• when the device’s memory is full. In this case the test may indicate“ABEND” (ABnormal END) in the Navigation tree.
• if a loss of power occurs. In this case, the test may indicate“ABEND” in the Navigation tree.
TIP: If you wish to schedule the end of data collection, trythis: Before starting your test, define another test to start atthe time you want the “real” test to stop. Select a linear test
with a long measurement interval—hours or days—and minimalsensors to conserve battery power. Schedule this test to start at thetime you want the “real” test to end. The test will start at itsscheduled time, stopping the earlier test and kicking into a sparsesampling schedule.
TIP: In entering the Scheduled Start time, keep in mindthat when this test starts, it will stop a running test.
The time proposed for a Scheduled start is the next houron the hour, calculated from the current device time plus10 minutes. In Pocket-Situ this is your only indication of thedevice time. If the proposed time is wrong, cancel testsetup and set the device clock before scheduling tests.
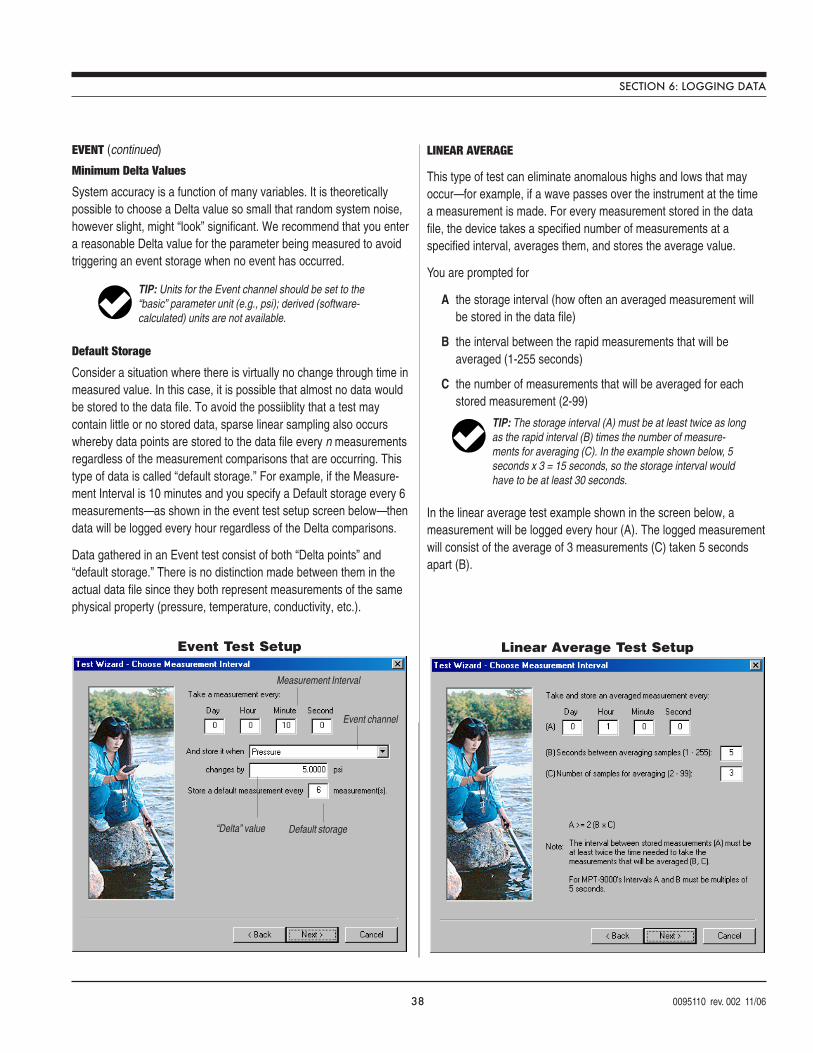
38 0095110 rev. 002 11/06
SECTION 6: LOGGING DATA
TIP: Units for the Event channel should be set to the“basic” parameter unit (e.g., psi); derived (software-calculated) units are not available.
Measurement Interval
“Delta” value Default storage
Event Test Setup
Event channel
EVENT (continued)
Minimum Delta Values
System accuracy is a function of many variables. It is theoreticallypossible to choose a Delta value so small that random system noise,however slight, might “look” significant. We recommend that you entera reasonable Delta value for the parameter being measured to avoidtriggering an event storage when no event has occurred.
Default Storage
Consider a situation where there is virtually no change through time inmeasured value. In this case, it is possible that almost no data wouldbe stored to the data file. To avoid the possiiblity that a test maycontain little or no stored data, sparse linear sampling also occurswhereby data points are stored to the data file every n measurementsregardless of the measurement comparisons that are occurring. Thistype of data is called “default storage.” For example, if the Measure-ment Interval is 10 minutes and you specify a Default storage every 6measurements—as shown in the event test setup screen below—thendata will be logged every hour regardless of the Delta comparisons.
Data gathered in an Event test consist of both “Delta points” and“default storage.” There is no distinction made between them in theactual data file since they both represent measurements of the samephysical property (pressure, temperature, conductivity, etc.).
LINEAR AVERAGE
This type of test can eliminate anomalous highs and lows that mayoccur—for example, if a wave passes over the instrument at the timea measurement is made. For every measurement stored in the datafile, the device takes a specified number of measurements at aspecified interval, averages them, and stores the average value.
You are prompted for
A the storage interval (how often an averaged measurement willbe stored in the data file)
B the interval between the rapid measurements that will beaveraged (1-255 seconds)
C the number of measurements that will be averaged for eachstored measurement (2-99)
In the linear average test example shown in the screen below, ameasurement will be logged every hour (A). The logged measurementwill consist of the average of 3 measurements (C) taken 5 secondsapart (B).
Linear Average Test Setup
TIP: The storage interval (A) must be at least twice as longas the rapid interval (B) times the number of measure-ments for averaging (C). In the example shown below, 5seconds x 3 = 15 seconds, so the storage interval wouldhave to be at least 30 seconds.
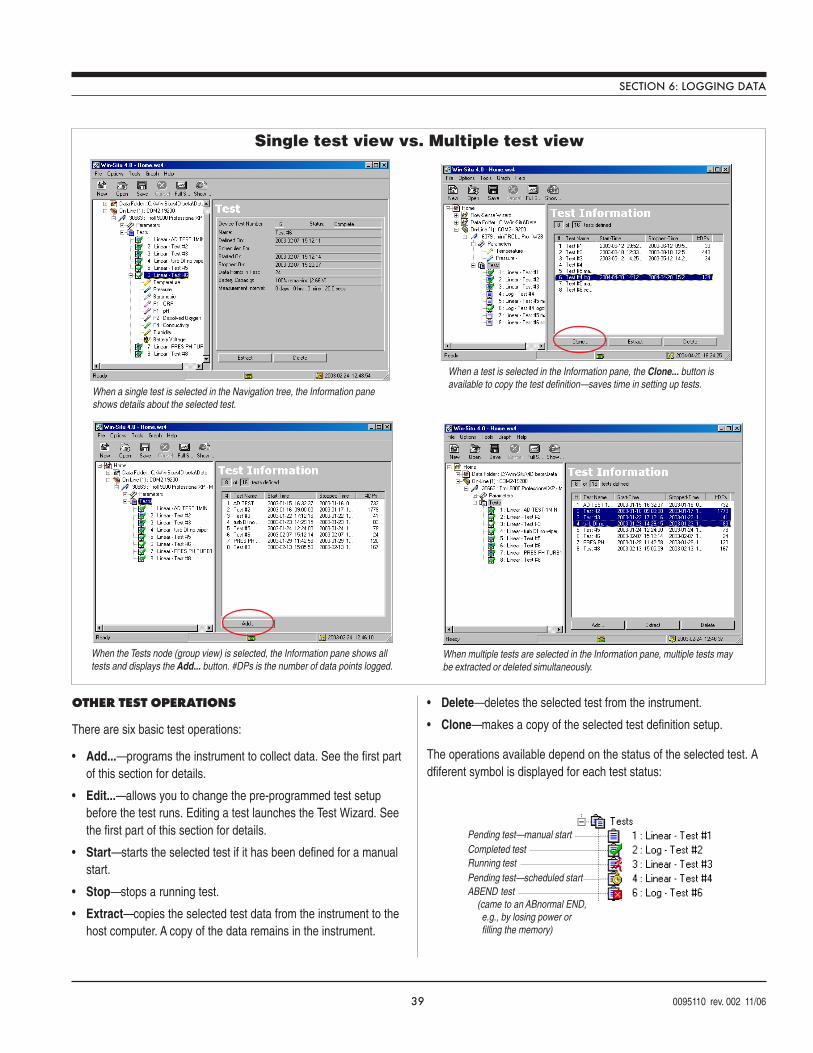
39 0095110 rev. 002 11/06
OTHER TEST OPERATIONS
There are six basic test operations:
• Add...—programs the instrument to collect data. See the first partof this section for details.
• Edit...—allows you to change the pre-programmed test setupbefore the test runs. Editing a test launches the Test Wizard. Seethe first part of this section for details.
• Start—starts the selected test if it has been defined for a manualstart.
• Stop—stops a running test.
• Extract—copies the selected test data from the instrument to thehost computer. A copy of the data remains in the instrument.
SECTION 6: LOGGING DATA
When a single test is selected in the Navigation tree, the Information paneshows details about the selected test.
When the Tests node (group view) is selected, the Information pane shows alltests and displays the Add... button. #DPs is the number of data points logged.
When multiple tests are selected in the Information pane, multiple tests maybe extracted or deleted simultaneously.
Single test view vs. Multiple test view
When a test is selected in the Information pane, the Clone... button isavailable to copy the test definition—saves time in setting up tests.
Pending test—manual startCompleted testRunning testPending test—scheduled startABEND test (came to an ABnormal END, e.g., by losing power or filling the memory)
• Delete—deletes the selected test from the instrument.
• Clone—makes a copy of the selected test definition setup.
The operations available depend on the status of the selected test. Adfiferent symbol is displayed for each test status:
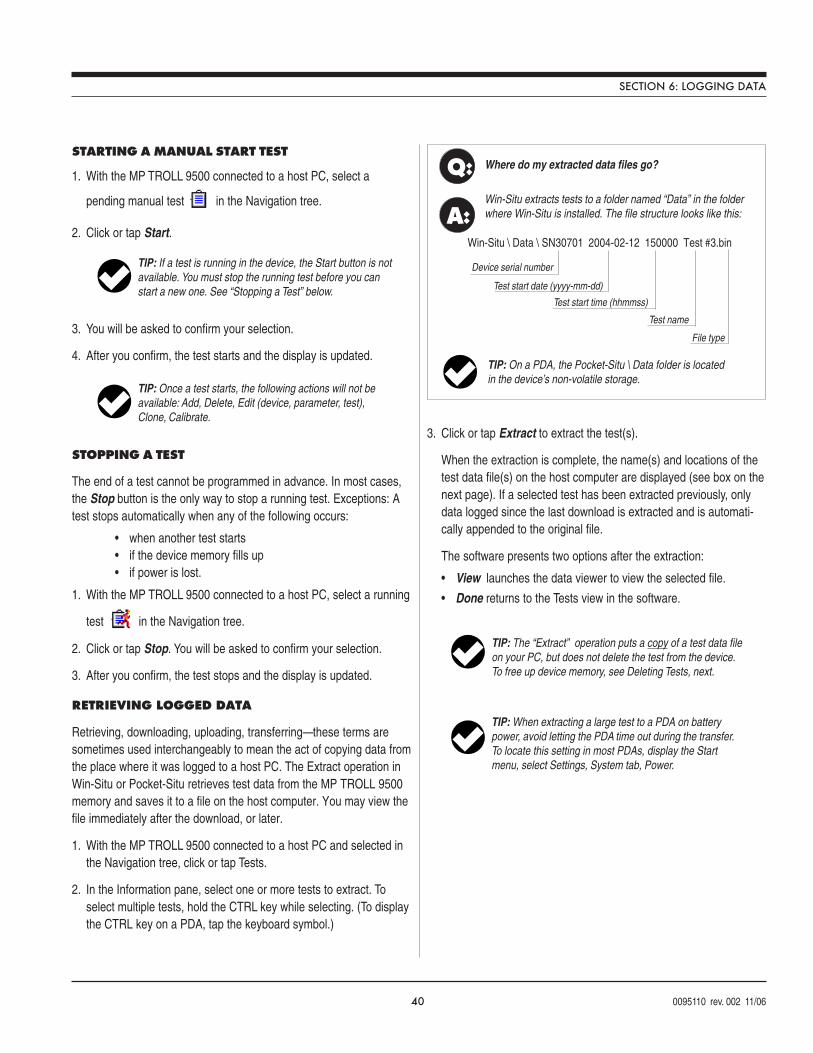
40 0095110 rev. 002 11/06
TIP: When extracting a large test to a PDA on batterypower, avoid letting the PDA time out during the transfer.To locate this setting in most PDAs, display the Startmenu, select Settings, System tab, Power.
STARTING A MANUAL START TEST
1. With the MP TROLL 9500 connected to a host PC, select a
pending manual test in the Navigation tree.
2. Click or tap Start.
3. You will be asked to confirm your selection.
4. After you confirm, the test starts and the display is updated.
STOPPING A TEST
The end of a test cannot be programmed in advance. In most cases,the Stop button is the only way to stop a running test. Exceptions: Atest stops automatically when any of the following occurs:
• when another test starts• if the device memory fills up• if power is lost.
1. With the MP TROLL 9500 connected to a host PC, select a running
test in the Navigation tree.
2. Click or tap Stop. You will be asked to confirm your selection.
3. After you confirm, the test stops and the display is updated.
RETRIEVING LOGGED DATA
Retrieving, downloading, uploading, transferring—these terms aresometimes used interchangeably to mean the act of copying data fromthe place where it was logged to a host PC. The Extract operation inWin-Situ or Pocket-Situ retrieves test data from the MP TROLL 9500memory and saves it to a file on the host computer. You may view thefile immediately after the download, or later.
1. With the MP TROLL 9500 connected to a host PC and selected inthe Navigation tree, click or tap Tests.
2. In the Information pane, select one or more tests to extract. Toselect multiple tests, hold the CTRL key while selecting. (To displaythe CTRL key on a PDA, tap the keyboard symbol.)
3. Click or tap Extract to extract the test(s).
When the extraction is complete, the name(s) and locations of thetest data file(s) on the host computer are displayed (see box on thenext page). If a selected test has been extracted previously, onlydata logged since the last download is extracted and is automati-cally appended to the original file.
The software presents two options after the extraction:
• View launches the data viewer to view the selected file.
• Done returns to the Tests view in the software.
SECTION 6: LOGGING DATA
TIP: If a test is running in the device, the Start button is notavailable. You must stop the running test before you canstart a new one. See “Stopping a Test” below.
TIP: Once a test starts, the following actions will not beavailable: Add, Delete, Edit (device, parameter, test),Clone, Calibrate.
TIP: The “Extract” operation puts a copy of a test data fileon your PC, but does not delete the test from the device.To free up device memory, see Deleting Tests, next.
TIP: On a PDA, the Pocket-Situ \ Data folder is locatedin the device’s non-volatile storage.
Q:
A:
Where do my extracted data files go?
Win-Situ extracts tests to a folder named “Data” in the folderwhere Win-Situ is installed. The file structure looks like this:
Device serial number
Test start date (yyyy-mm-dd)
Test start time (hhmmss)
Test name
File type
Win-Situ \ Data \ SN30701 2004-02-12 150000 Test #3.bin
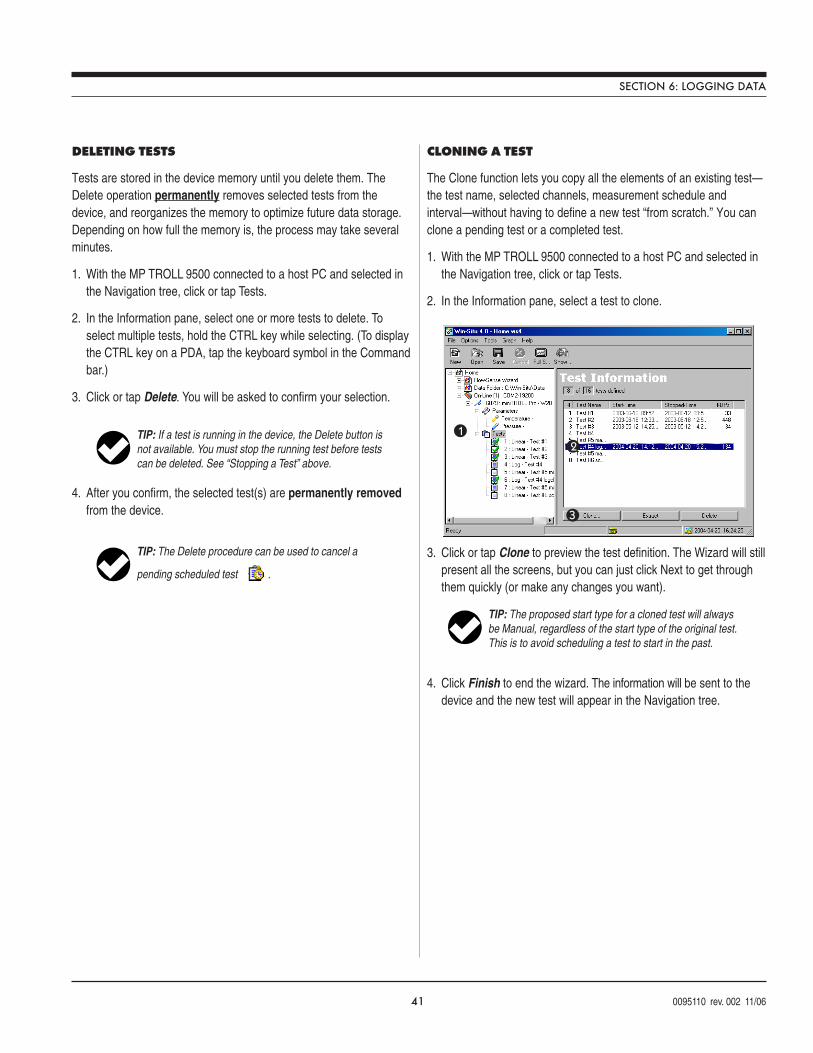
41 0095110 rev. 002 11/06
TIP: If a test is running in the device, the Delete button isnot available. You must stop the running test before testscan be deleted. See “Stopping a Test” above.
TIP: The Delete procedure can be used to cancel a
pending scheduled test .
DELETING TESTS
Tests are stored in the device memory until you delete them. TheDelete operation permanently removes selected tests from thedevice, and reorganizes the memory to optimize future data storage.Depending on how full the memory is, the process may take severalminutes.
1. With the MP TROLL 9500 connected to a host PC and selected inthe Navigation tree, click or tap Tests.
2. In the Information pane, select one or more tests to delete. Toselect multiple tests, hold the CTRL key while selecting. (To displaythe CTRL key on a PDA, tap the keyboard symbol in the Commandbar.)
3. Click or tap Delete. You will be asked to confirm your selection.
4. After you confirm, the selected test(s) are permanently removedfrom the device. 3
12
TIP: The proposed start type for a cloned test will alwaysbe Manual, regardless of the start type of the original test.This is to avoid scheduling a test to start in the past.
SECTION 6: LOGGING DATA
CLONING A TEST
The Clone function lets you copy all the elements of an existing test—the test name, selected channels, measurement schedule andinterval—without having to define a new test “from scratch.” You canclone a pending test or a completed test.
1. With the MP TROLL 9500 connected to a host PC and selected inthe Navigation tree, click or tap Tests.
2. In the Information pane, select a test to clone.
3. Click or tap Clone to preview the test definition. The Wizard will stillpresent all the screens, but you can just click Next to get throughthem quickly (or make any changes you want).
4. Click Finish to end the wizard. The information will be sent to thedevice and the new test will appear in the Navigation tree.
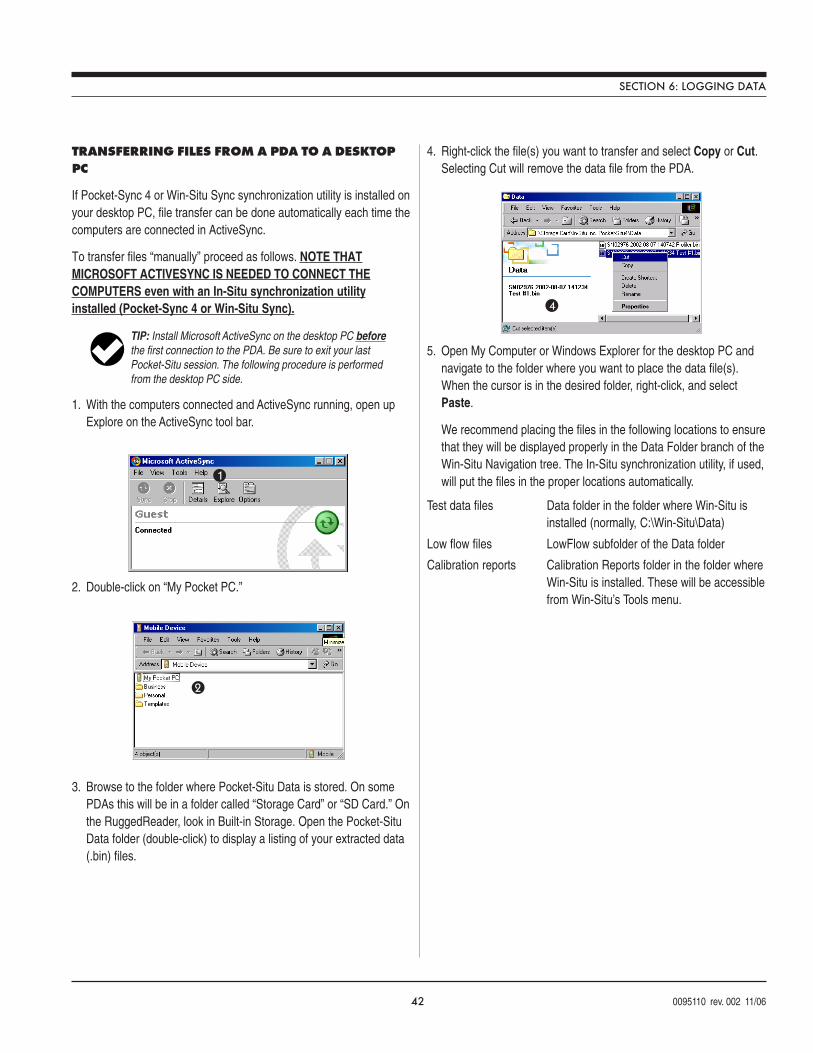
42 0095110 rev. 002 11/06
TIP: Install Microsoft ActiveSync on the desktop PC beforethe first connection to the PDA. Be sure to exit your lastPocket-Situ session. The following procedure is performedfrom the desktop PC side.
TRANSFERRING FILES FROM A PDA TO A DESKTOPPC
If Pocket-Sync 4 or Win-Situ Sync synchronization utility is installed onyour desktop PC, file transfer can be done automatically each time thecomputers are connected in ActiveSync.
To transfer files “manually” proceed as follows. NOTE THATMICROSOFT ACTIVESYNC IS NEEDED TO CONNECT THECOMPUTERS even with an In-Situ synchronization utilityinstalled (Pocket-Sync 4 or Win-Situ Sync).
1. With the computers connected and ActiveSync running, open upExplore on the ActiveSync tool bar.
2. Double-click on “My Pocket PC.”
3. Browse to the folder where Pocket-Situ Data is stored. On somePDAs this will be in a folder called “Storage Card” or “SD Card.” Onthe RuggedReader, look in Built-in Storage. Open the Pocket-SituData folder (double-click) to display a listing of your extracted data(.bin) files.
SECTION 6: LOGGING DATA
1
2
4
4. Right-click the file(s) you want to transfer and select Copy or Cut.Selecting Cut will remove the data file from the PDA.
5. Open My Computer or Windows Explorer for the desktop PC andnavigate to the folder where you want to place the data file(s).When the cursor is in the desired folder, right-click, and selectPaste.
We recommend placing the files in the following locations to ensurethat they will be displayed properly in the Data Folder branch of theWin-Situ Navigation tree. The In-Situ synchronization utility, if used,will put the files in the proper locations automatically.
Test data files Data folder in the folder where Win-Situ isinstalled (normally, C:\Win-Situ\Data)
Low flow files LowFlow subfolder of the Data folder
Calibration reports Calibration Reports folder in the folder whereWin-Situ is installed. These will be accessiblefrom Win-Situ’s Tools menu.
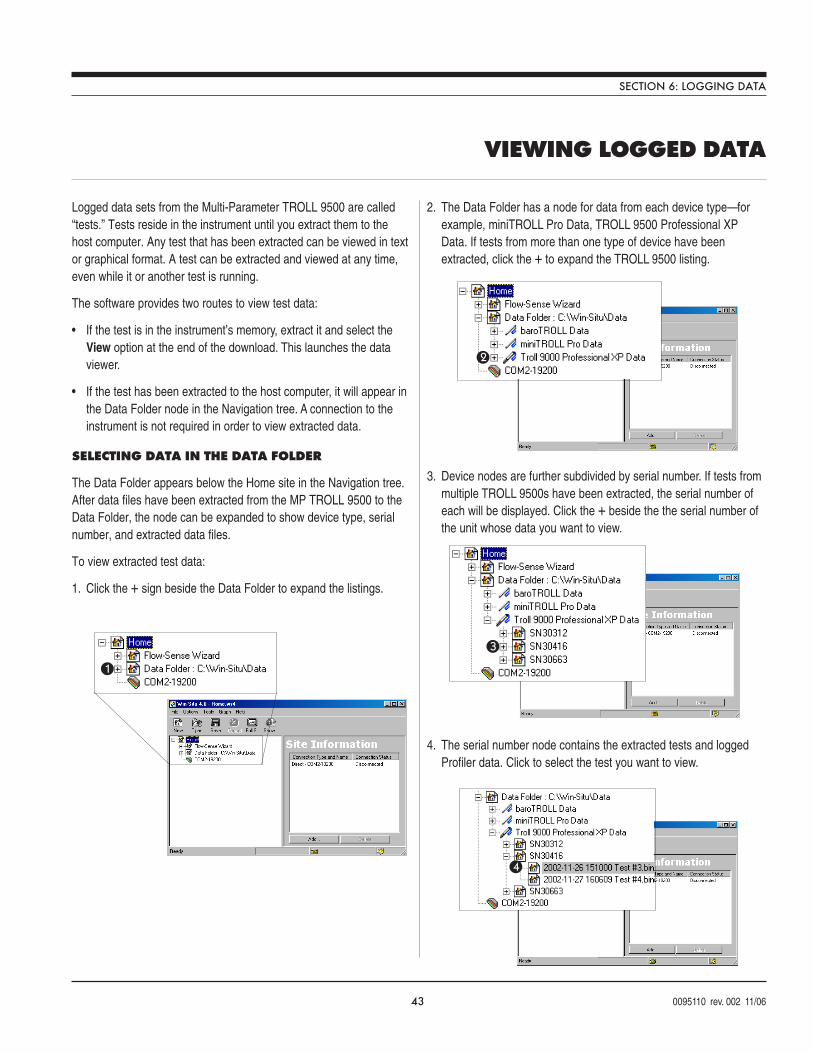
43 0095110 rev. 002 11/06
1
VIEWING LOGGED DATA
2
3
4
Logged data sets from the Multi-Parameter TROLL 9500 are called“tests.” Tests reside in the instrument until you extract them to thehost computer. Any test that has been extracted can be viewed in textor graphical format. A test can be extracted and viewed at any time,even while it or another test is running.
The software provides two routes to view test data:
• If the test is in the instrument’s memory, extract it and select theView option at the end of the download. This launches the dataviewer.
• If the test has been extracted to the host computer, it will appear inthe Data Folder node in the Navigation tree. A connection to theinstrument is not required in order to view extracted data.
SELECTING DATA IN THE DATA FOLDER
The Data Folder appears below the Home site in the Navigation tree.After data files have been extracted from the MP TROLL 9500 to theData Folder, the node can be expanded to show device type, serialnumber, and extracted data files.
To view extracted test data:
1. Click the + sign beside the Data Folder to expand the listings.
2. The Data Folder has a node for data from each device type—forexample, miniTROLL Pro Data, TROLL 9500 Professional XPData. If tests from more than one type of device have beenextracted, click the + to expand the TROLL 9500 listing.
3. Device nodes are further subdivided by serial number. If tests frommultiple TROLL 9500s have been extracted, the serial number ofeach will be displayed. Click the + beside the the serial number ofthe unit whose data you want to view.
4. The serial number node contains the extracted tests and loggedProfiler data. Click to select the test you want to view.
SECTION 6: LOGGING DATA
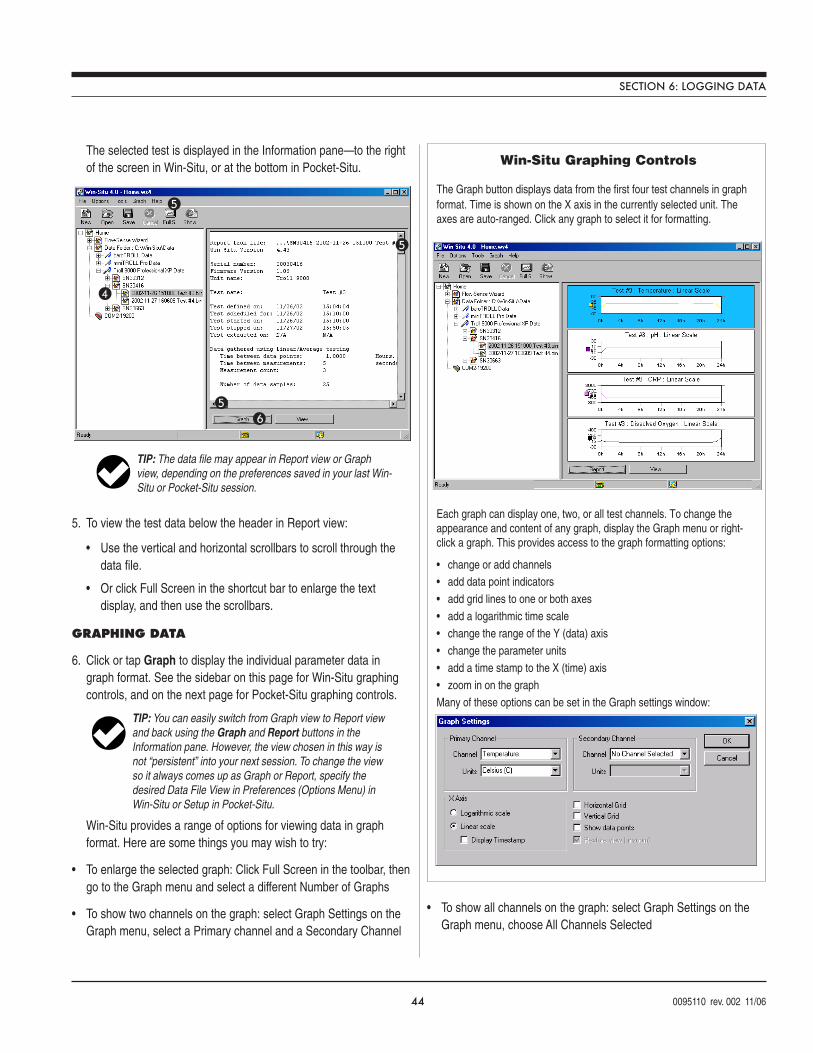
44 0095110 rev. 002 11/06
TIP: The data file may appear in Report view or Graphview, depending on the preferences saved in your last Win-Situ or Pocket-Situ session.
TIP: You can easily switch from Graph view to Report viewand back using the Graph and Report buttons in theInformation pane. However, the view chosen in this way isnot “persistent” into your next session. To change the viewso it always comes up as Graph or Report, specify thedesired Data File View in Preferences (Options Menu) inWin-Situ or Setup in Pocket-Situ.
Win-Situ Graphing Controls
The Graph button displays data from the first four test channels in graphformat. Time is shown on the X axis in the currently selected unit. Theaxes are auto-ranged. Click any graph to select it for formatting.
Each graph can display one, two, or all test channels. To change theappearance and content of any graph, display the Graph menu or right-click a graph. This provides access to the graph formatting options:
• change or add channels• add data point indicators• add grid lines to one or both axes• add a logarithmic time scale• change the range of the Y (data) axis• change the parameter units• add a time stamp to the X (time) axis• zoom in on the graphMany of these options can be set in the Graph settings window:
The selected test is displayed in the Information pane—to the rightof the screen in Win-Situ, or at the bottom in Pocket-Situ.
5. To view the test data below the header in Report view:
• Use the vertical and horizontal scrollbars to scroll through thedata file.
• Or click Full Screen in the shortcut bar to enlarge the textdisplay, and then use the scrollbars.
GRAPHING DATA
6. Click or tap Graph to display the individual parameter data ingraph format. See the sidebar on this page for Win-Situ graphingcontrols, and on the next page for Pocket-Situ graphing controls.
Win-Situ provides a range of options for viewing data in graphformat. Here are some things you may wish to try:
• To enlarge the selected graph: Click Full Screen in the toolbar, thengo to the Graph menu and select a different Number of Graphs
• To show two channels on the graph: select Graph Settings on theGraph menu, select a Primary channel and a Secondary Channel
• To show all channels on the graph: select Graph Settings on theGraph menu, choose All Channels Selected
SECTION 6: LOGGING DATA
4
5
6
5
5
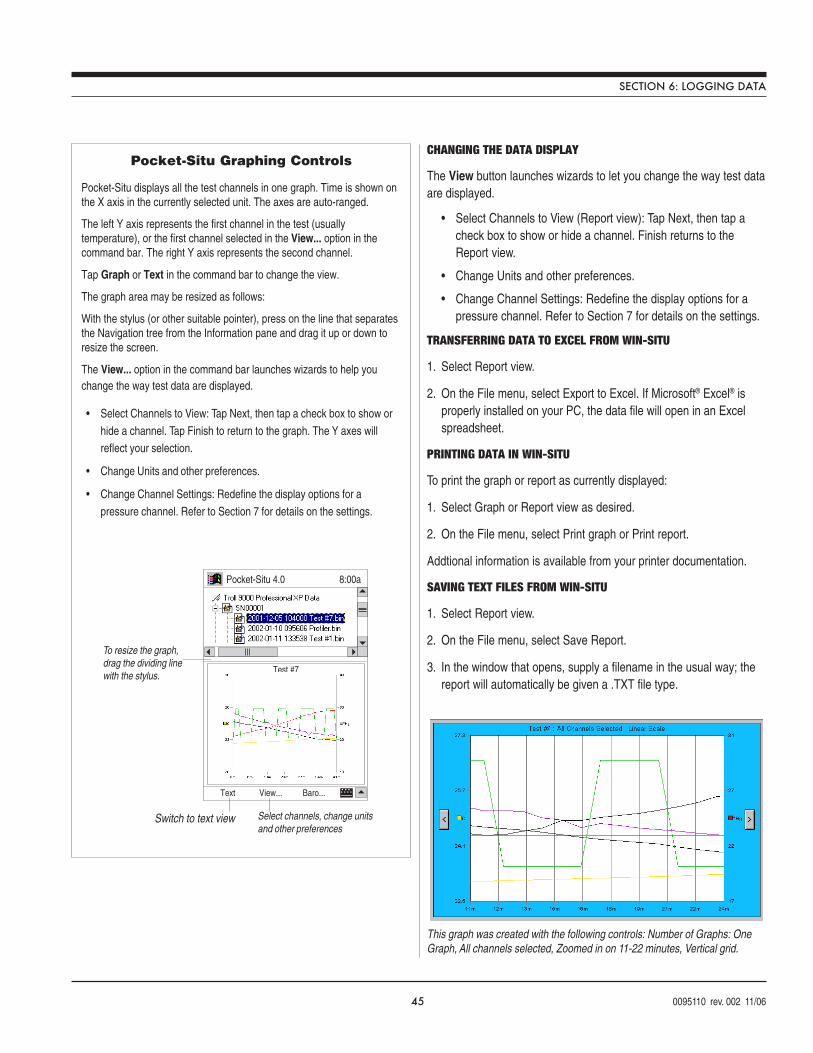
45 0095110 rev. 002 11/06
Pocket-Situ Graphing Controls
Pocket-Situ displays all the test channels in one graph. Time is shown onthe X axis in the currently selected unit. The axes are auto-ranged.
The left Y axis represents the first channel in the test (usuallytemperature), or the first channel selected in the View... option in thecommand bar. The right Y axis represents the second channel.
Tap Graph or Text in the command bar to change the view.
The graph area may be resized as follows:
With the stylus (or other suitable pointer), press on the line that separatesthe Navigation tree from the Information pane and drag it up or down toresize the screen.
The View... option in the command bar launches wizards to help youchange the way test data are displayed.
• Select Channels to View: Tap Next, then tap a check box to show or
hide a channel. Tap Finish to return to the graph. The Y axes willreflect your selection.
• Change Units and other preferences.
• Change Channel Settings: Redefine the display options for a
pressure channel. Refer to Section 7 for details on the settings.
This graph was created with the following controls: Number of Graphs: OneGraph, All channels selected, Zoomed in on 11-22 minutes, Vertical grid.
CHANGING THE DATA DISPLAY
The View button launches wizards to let you change the way test dataare displayed.
• Select Channels to View (Report view): Tap Next, then tap acheck box to show or hide a channel. Finish returns to theReport view.
• Change Units and other preferences.
• Change Channel Settings: Redefine the display options for apressure channel. Refer to Section 7 for details on the settings.
TRANSFERRING DATA TO EXCEL FROM WIN-SITU
1. Select Report view.
2. On the File menu, select Export to Excel. If Microsoft® Excel® isproperly installed on your PC, the data file will open in an Excelspreadsheet.
PRINTING DATA IN WIN-SITU
To print the graph or report as currently displayed:
1. Select Graph or Report view as desired.
2. On the File menu, select Print graph or Print report.
Addtional information is available from your printer documentation.
SAVING TEXT FILES FROM WIN-SITU
1. Select Report view.
2. On the File menu, select Save Report.
3. In the window that opens, supply a filename in the usual way; thereport will automatically be given a .TXT file type.
Test #7
Switch to text view
Pocket-Situ 4.0 8:00a
Text View... Baro...
To resize the graph,drag the dividing linewith the stylus.
Select channels, change unitsand other preferences
.......—
SECTION 6: LOGGING DATA
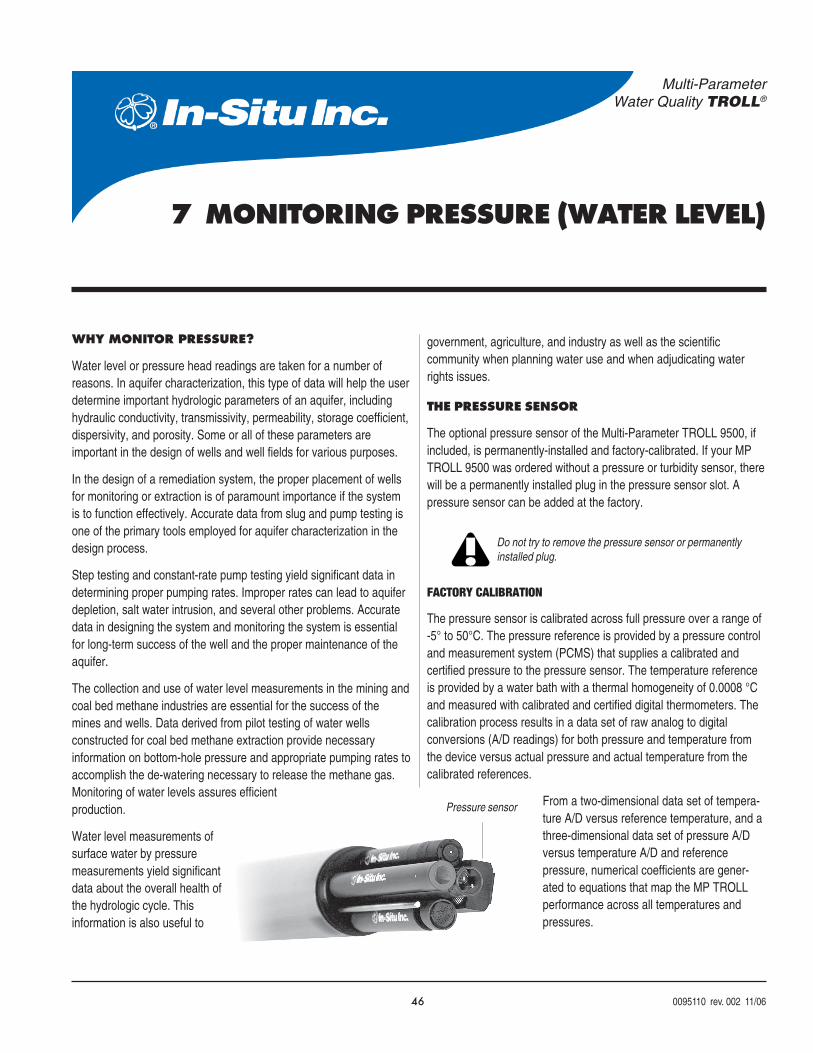
46 0095110 rev. 002 11/06
Multi-ParameterWater Quality TROLL®
7 MONITORING PRESSURE (WATER LEVEL)
Pressure sensor
Do not try to remove the pressure sensor or permanentlyinstalled plug.
WHY MONITOR PRESSURE?
Water level or pressure head readings are taken for a number ofreasons. In aquifer characterization, this type of data will help the userdetermine important hydrologic parameters of an aquifer, includinghydraulic conductivity, transmissivity, permeability, storage coefficient,dispersivity, and porosity. Some or all of these parameters areimportant in the design of wells and well fields for various purposes.
In the design of a remediation system, the proper placement of wellsfor monitoring or extraction is of paramount importance if the systemis to function effectively. Accurate data from slug and pump testing isone of the primary tools employed for aquifer characterization in thedesign process.
Step testing and constant-rate pump testing yield significant data indetermining proper pumping rates. Improper rates can lead to aquiferdepletion, salt water intrusion, and several other problems. Accuratedata in designing the system and monitoring the system is essentialfor long-term success of the well and the proper maintenance of theaquifer.
The collection and use of water level measurements in the mining andcoal bed methane industries are essential for the success of themines and wells. Data derived from pilot testing of water wellsconstructed for coal bed methane extraction provide necessaryinformation on bottom-hole pressure and appropriate pumping rates toaccomplish the de-watering necessary to release the methane gas.Monitoring of water levels assures efficientproduction.
Water level measurements ofsurface water by pressuremeasurements yield significantdata about the overall health ofthe hydrologic cycle. Thisinformation is also useful to
government, agriculture, and industry as well as the scientificcommunity when planning water use and when adjudicating waterrights issues.
THE PRESSURE SENSOR
The optional pressure sensor of the Multi-Parameter TROLL 9500, ifincluded, is permanently-installed and factory-calibrated. If your MPTROLL 9500 was ordered without a pressure or turbidity sensor, therewill be a permanently installed plug in the pressure sensor slot. Apressure sensor can be added at the factory.
FACTORY CALIBRATION
The pressure sensor is calibrated across full pressure over a range of-5° to 50°C. The pressure reference is provided by a pressure controland measurement system (PCMS) that supplies a calibrated andcertified pressure to the pressure sensor. The temperature referenceis provided by a water bath with a thermal homogeneity of 0.0008 °Cand measured with calibrated and certified digital thermometers. Thecalibration process results in a data set of raw analog to digitalconversions (A/D readings) for both pressure and temperature fromthe device versus actual pressure and actual temperature from thecalibrated references.
From a two-dimensional data set of tempera-ture A/D versus reference temperature, and athree-dimensional data set of pressure A/Dversus temperature A/D and referencepressure, numerical coefficients are gener-ated to equations that map the MP TROLLperformance across all temperatures andpressures.
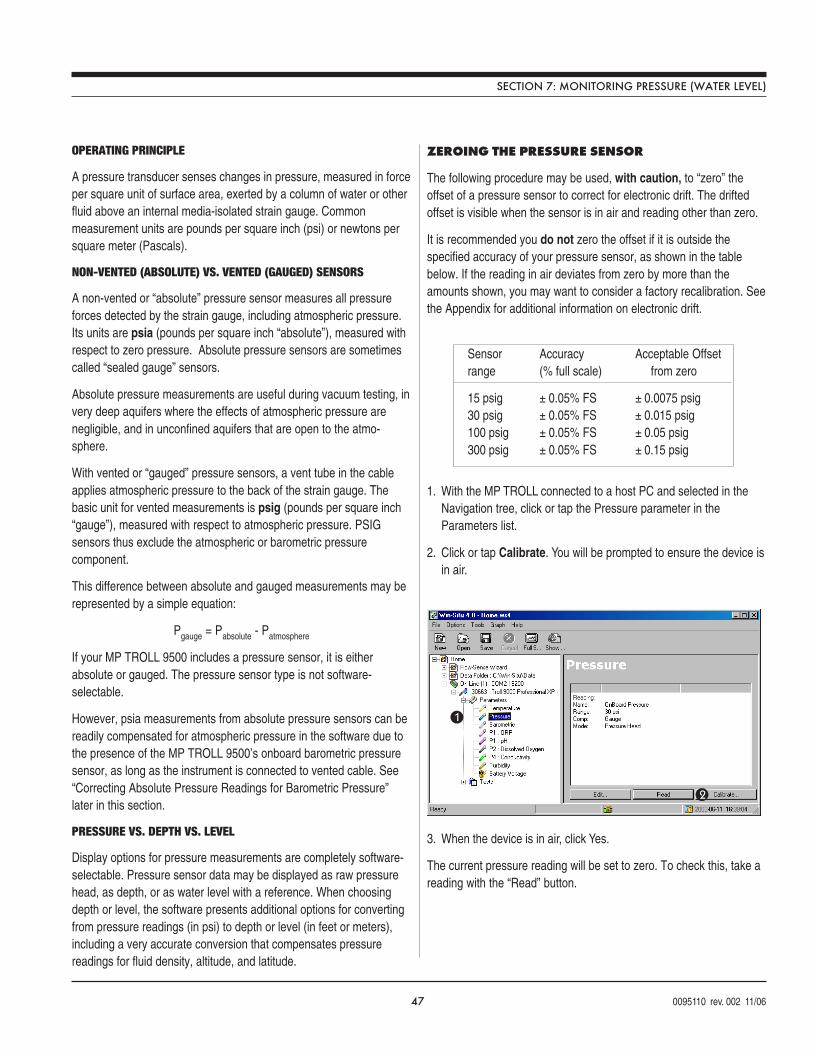
47 0095110 rev. 002 11/06
OPERATING PRINCIPLE
A pressure transducer senses changes in pressure, measured in forceper square unit of surface area, exerted by a column of water or otherfluid above an internal media-isolated strain gauge. Commonmeasurement units are pounds per square inch (psi) or newtons persquare meter (Pascals).
NON-VENTED (ABSOLUTE) VS. VENTED (GAUGED) SENSORS
A non-vented or “absolute” pressure sensor measures all pressureforces detected by the strain gauge, including atmospheric pressure.Its units are psia (pounds per square inch “absolute”), measured withrespect to zero pressure. Absolute pressure sensors are sometimescalled “sealed gauge” sensors.
Absolute pressure measurements are useful during vacuum testing, invery deep aquifers where the effects of atmospheric pressure arenegligible, and in unconfined aquifers that are open to the atmo-sphere.
With vented or “gauged” pressure sensors, a vent tube in the cableapplies atmospheric pressure to the back of the strain gauge. Thebasic unit for vented measurements is psig (pounds per square inch“gauge”), measured with respect to atmospheric pressure. PSIGsensors thus exclude the atmospheric or barometric pressurecomponent.
This difference between absolute and gauged measurements may berepresented by a simple equation:
Pgauge = Pabsolute - Patmosphere
If your MP TROLL 9500 includes a pressure sensor, it is eitherabsolute or gauged. The pressure sensor type is not software-selectable.
However, psia measurements from absolute pressure sensors can bereadily compensated for atmospheric pressure in the software due tothe presence of the MP TROLL 9500’s onboard barometric pressuresensor, as long as the instrument is connected to vented cable. See“Correcting Absolute Pressure Readings for Barometric Pressure”later in this section.
PRESSURE VS. DEPTH VS. LEVEL
Display options for pressure measurements are completely software-selectable. Pressure sensor data may be displayed as raw pressurehead, as depth, or as water level with a reference. When choosingdepth or level, the software presents additional options for convertingfrom pressure readings (in psi) to depth or level (in feet or meters),including a very accurate conversion that compensates pressurereadings for fluid density, altitude, and latitude.
ZEROING THE PRESSURE SENSOR
The following procedure may be used, with caution, to “zero” theoffset of a pressure sensor to correct for electronic drift. The driftedoffset is visible when the sensor is in air and reading other than zero.
It is recommended you do not zero the offset if it is outside thespecified accuracy of your pressure sensor, as shown in the tablebelow. If the reading in air deviates from zero by more than theamounts shown, you may want to consider a factory recalibration. Seethe Appendix for additional information on electronic drift.
1. With the MP TROLL connected to a host PC and selected in theNavigation tree, click or tap the Pressure parameter in theParameters list.
2. Click or tap Calibrate. You will be prompted to ensure the device isin air.
3. When the device is in air, click Yes.
The current pressure reading will be set to zero. To check this, take areading with the “Read” button.
SECTION 7: MONITORING PRESSURE (WATER LEVEL)
1
2
Sensor Accuracy Acceptable Offsetrange (% full scale) from zero
15 psig ± 0.05% FS ± 0.0075 psig30 psig ± 0.05% FS ± 0.015 psig100 psig ± 0.05% FS ± 0.05 psig300 psig ± 0.05% FS ± 0.15 psig
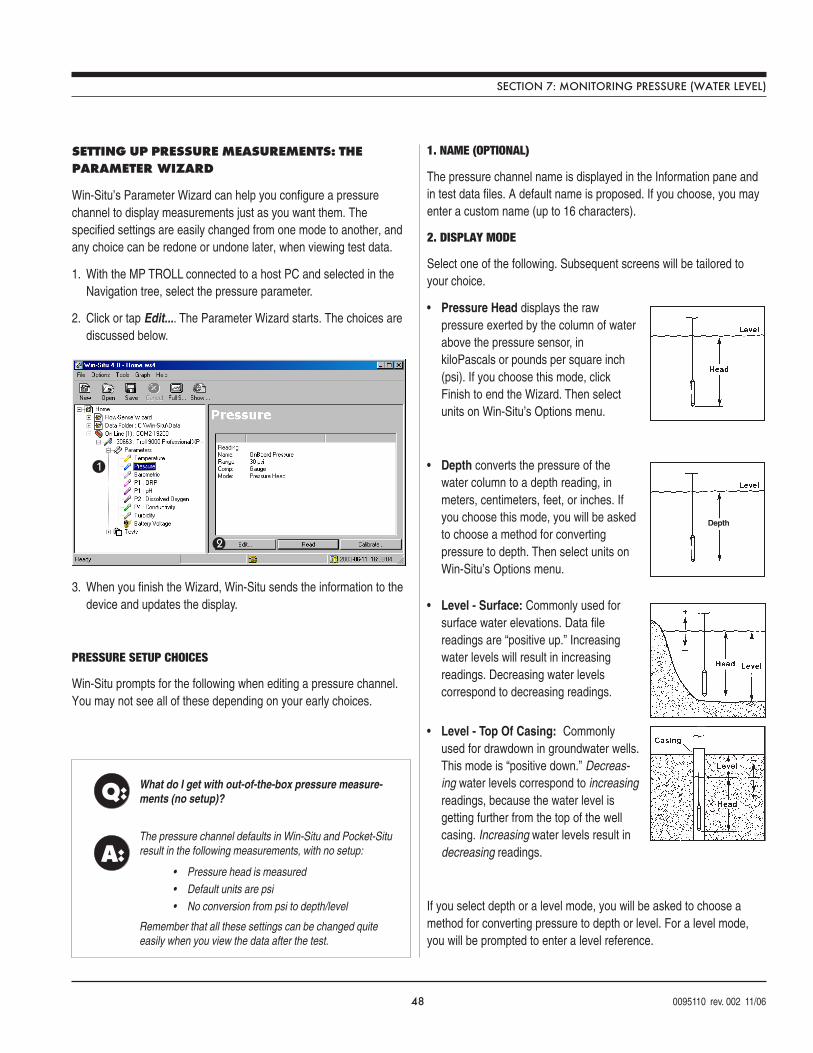
48 0095110 rev. 002 11/06
Depth
SETTING UP PRESSURE MEASUREMENTS: THEPARAMETER WIZARD
Win-Situ’s Parameter Wizard can help you configure a pressurechannel to display measurements just as you want them. Thespecified settings are easily changed from one mode to another, andany choice can be redone or undone later, when viewing test data.
1. With the MP TROLL connected to a host PC and selected in theNavigation tree, select the pressure parameter.
2. Click or tap Edit.... The Parameter Wizard starts. The choices arediscussed below.
3. When you finish the Wizard, Win-Situ sends the information to thedevice and updates the display.
PRESSURE SETUP CHOICES
Win-Situ prompts for the following when editing a pressure channel.You may not see all of these depending on your early choices.
1. NAME (OPTIONAL)
The pressure channel name is displayed in the Information pane andin test data files. A default name is proposed. If you choose, you mayenter a custom name (up to 16 characters).
2. DISPLAY MODE
Select one of the following. Subsequent screens will be tailored toyour choice.
• Pressure Head displays the rawpressure exerted by the column of waterabove the pressure sensor, inkiloPascals or pounds per square inch(psi). If you choose this mode, clickFinish to end the Wizard. Then selectunits on Win-Situ’s Options menu.
• Depth converts the pressure of thewater column to a depth reading, inmeters, centimeters, feet, or inches. Ifyou choose this mode, you will be askedto choose a method for convertingpressure to depth. Then select units onWin-Situ’s Options menu.
• Level - Surface: Commonly used forsurface water elevations. Data filereadings are “positive up.” Increasingwater levels will result in increasingreadings. Decreasing water levelscorrespond to decreasing readings.
• Level - Top Of Casing: Commonlyused for drawdown in groundwater wells.This mode is “positive down.” Decreas-ing water levels correspond to increasingreadings, because the water level isgetting further from the top of the wellcasing. Increasing water levels result indecreasing readings.
If you select depth or a level mode, you will be asked to choose amethod for converting pressure to depth or level. For a level mode,you will be prompted to enter a level reference.
Q:
A:
What do I get with out-of-the-box pressure measure-ments (no setup)?
The pressure channel defaults in Win-Situ and Pocket-Situresult in the following measurements, with no setup:
• Pressure head is measured• Default units are psi• No conversion from psi to depth/level
Remember that all these settings can be changed quiteeasily when you view the data after the test.
1
2
SECTION 7: MONITORING PRESSURE (WATER LEVEL)
49 0095110 rev. 002 11/06
Fluid density by temperature
Temp. Density Temp. Density Temp. Density(°C) (g/cm3) (°C) (g/cm3) (°C) (g/cm3)
1 0.999900 11 0.999605 21 0.9979922 0.999941 12 0.999498 22 0.9977703 0.999965 13 0.999377 23 0.9975384 0.999973 14 0.999244 24 0.9972965 0.999965 15 0.999099 25 0.9970446 0.999941 16 0.998943 26 0.9967837 0.999902 17 0.998774 27 0.9965128 0.999849 18 0.998595 28 0.9962329 0.999781 19 0.998405 29 0.99594410 0.999700 20 0.998203 30 0.995646
3. CONVERTING PRESSURE TO DEPTH OR LEVEL
The conversion from pressure in pounds per square inch (psi) todepth or level in meters or feet requires some knowledge of theproperties of the fluid being monitored and optionally of the device’slocation on the earth’s surface.
Conversion Using Specific Gravity
Pressure may be adequately converted to feet or meters of fluid usinga dimensionless specific gravity value. A specific gravity of 1.0(characteristic of pure water at 4°C) is adequate for many ground-water applications.
Conversion Using Density, Latitude, and Elevation
Pressure in the English unit psi is first converted to the SI unit Pascal(Pa). Conversion from Pascals to meters or feet requires twoadditional values:
• Liquid Density. Pure groundwater at 20°C has a density of 0.998g/cm3. A table of density by temperature appears on this page. TheAppendix includes a method to experimentally determine liquiddensity if the working fluid is not pure water.
• Gravitational Acceleration. The acceleration due to gravity thatan object experiences is location-specific. Given your latitude andelevation, Win-Situ can calculate a value for gravitational accelera-tion for your location.
4. LEVEL REFERENCE
If you selected a level display mode (Surface or Top of Casing), youwill be prompted to enter a level reference. This is a user-specifiedstarting point for level display modes, and can be any value youchoose. Here are some examples:
• Surface: If you calculate the water level above mean sea level(MSL) and enter this as the Level Reference, then data will bedisplayed as elevations above MSL.
• Top of Casing: If you measure the distance to the water surface(DTW) from the top of the well casing and enter this number as theLevel Reference, then data will be displayed as DTW values.
• A Level Reference of 0 is equivalent to “zeroing” the probe. Datawill be displayed as changes, either positive or negative, from thestarting water level.
Reference Time
The MP TROLL takes a “snapshot” of the sensor’s raw pressurereading, then your Level Reference is substituted. You can specifythat the snapshot be taken now or when the test starts. The data filewill show the Reference (raw pressure) Reading and when it wastaken.
• Now: the pressure is measured when you finish setting up thepressure parameter, and the value is stored until the test starts. Allmeasurements taken during the test will be relative to the waterlevel at the time you finished the wizard.
• Start of Test: the Reference measurement will be taken at timet=0. All measurements taken during the test will be relative to thewater level at the moment the test starts.
LIQUID DENSITY
The conversion from PSI units to meters or feet of fluid requiresseveral conversion factors. One of these is the density (ρ) of theaqueous solution being monitored. Pure groundwater at 20°C has adensity of 0.998 grams per cubic centimeter (g/cm3).
Use the values in the table below for density if you do not otherwiseknow it. However, since these data assume pure water, there is noaccommodation for other variables (such as salinity) that can affectyour actual water conditions. Alternatively, you could compute the fluiddensity using the procedure given in the Appendix to this manual.
TIP: Either specific gravity or density, latitude & elevationmay be used to convert from pressure (psi) to depth/level(meters or feet ). A gain in accuracy may be realized byselecting the density, latitude & elevation option.
SECTION 7: MONITORING PRESSURE (WATER LEVEL)
TIP: After setting up the pressure channel with the desireddisplay options, select the units you want to see. Use Win-Situ’s Options menu, or Pocket-Situ’s Setup button.
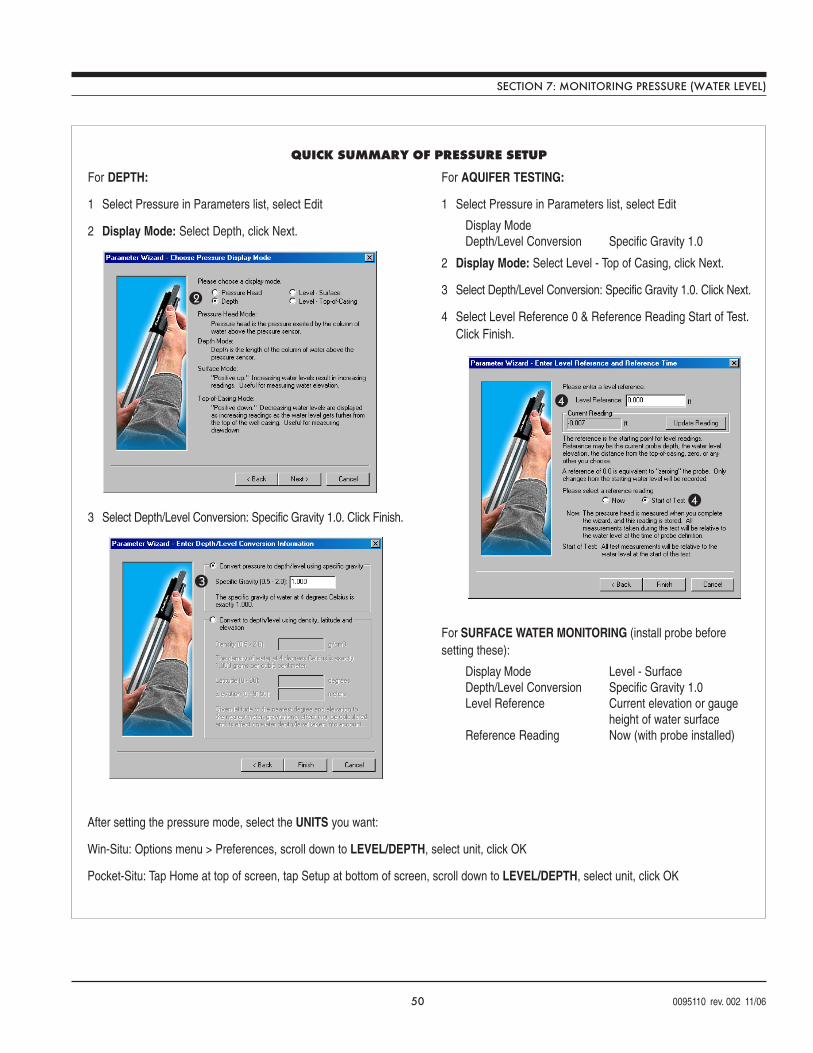
50 0095110 rev. 002 11/06
For DEPTH:
1 Select Pressure in Parameters list, select Edit
2 Display Mode: Select Depth, click Next.
3 Select Depth/Level Conversion: Specific Gravity 1.0. Click Finish.
QUICK SUMMARY OF PRESSURE SETUP
For SURFACE WATER MONITORING (install probe beforesetting these):
Display Mode Level - SurfaceDepth/Level Conversion Specific Gravity 1.0Level Reference Current elevation or gauge
height of water surfaceReference Reading Now (with probe installed)
For AQUIFER TESTING:
1 Select Pressure in Parameters list, select Edit
Display ModeDepth/Level Conversion Specific Gravity 1.0
2 Display Mode: Select Level - Top of Casing, click Next.
3 Select Depth/Level Conversion: Specific Gravity 1.0. Click Next.
4 Select Level Reference 0 & Reference Reading Start of Test.Click Finish.
After setting the pressure mode, select the UNITS you want:
Win-Situ: Options menu > Preferences, scroll down to LEVEL/DEPTH, select unit, click OK
Pocket-Situ: Tap Home at top of screen, tap Setup at bottom of screen, scroll down to LEVEL/DEPTH, select unit, click OK
2
3
4
4
SECTION 7: MONITORING PRESSURE (WATER LEVEL)
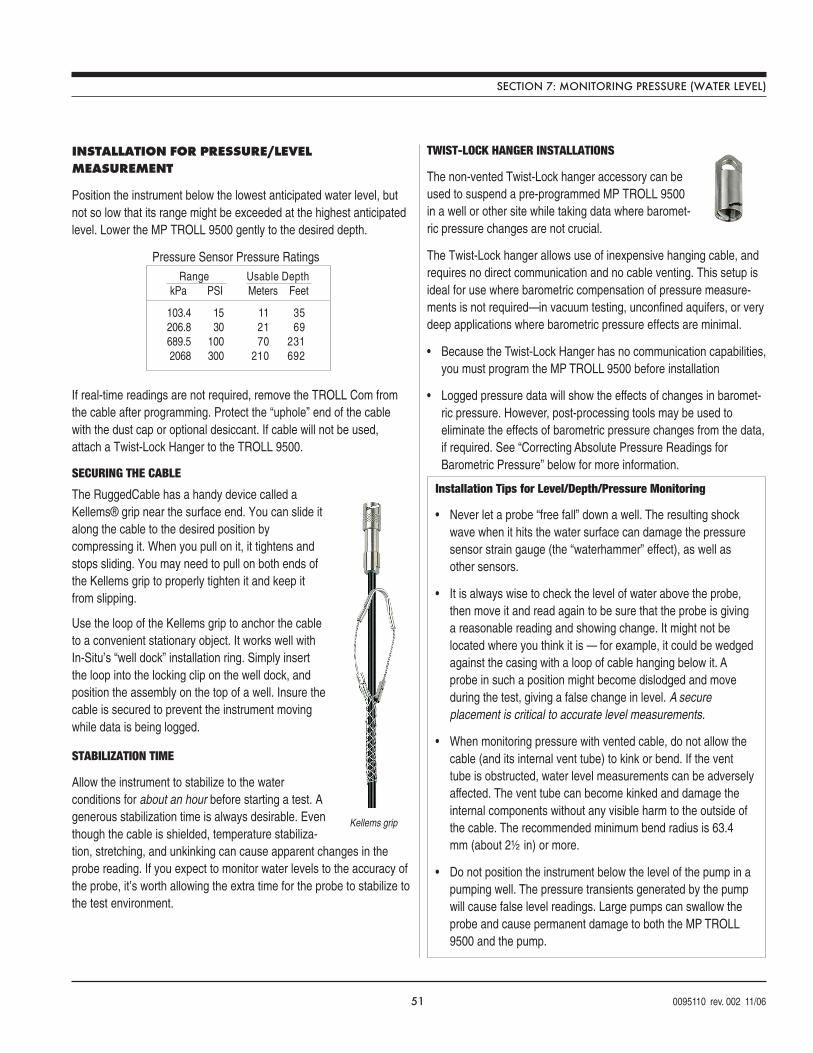
51 0095110 rev. 002 11/06
INSTALLATION FOR PRESSURE/LEVELMEASUREMENT
Position the instrument below the lowest anticipated water level, butnot so low that its range might be exceeded at the highest anticipatedlevel. Lower the MP TROLL 9500 gently to the desired depth.
If real-time readings are not required, remove the TROLL Com fromthe cable after programming. Protect the “uphole” end of the cablewith the dust cap or optional desiccant. If cable will not be used,attach a Twist-Lock Hanger to the TROLL 9500.
SECURING THE CABLE
The RuggedCable has a handy device called aKellems® grip near the surface end. You can slide italong the cable to the desired position bycompressing it. When you pull on it, it tightens andstops sliding. You may need to pull on both ends ofthe Kellems grip to properly tighten it and keep itfrom slipping.
Use the loop of the Kellems grip to anchor the cableto a convenient stationary object. It works well withIn-Situ’s “well dock” installation ring. Simply insertthe loop into the locking clip on the well dock, andposition the assembly on the top of a well. Insure thecable is secured to prevent the instrument movingwhile data is being logged.
STABILIZATION TIME
Allow the instrument to stabilize to the waterconditions for about an hour before starting a test. Agenerous stabilization time is always desirable. Eventhough the cable is shielded, temperature stabiliza-tion, stretching, and unkinking can cause apparent changes in theprobe reading. If you expect to monitor water levels to the accuracy ofthe probe, it’s worth allowing the extra time for the probe to stabilize tothe test environment.
TWIST-LOCK HANGER INSTALLATIONS
The non-vented Twist-Lock hanger accessory can beused to suspend a pre-programmed MP TROLL 9500in a well or other site while taking data where baromet-ric pressure changes are not crucial.
The Twist-Lock hanger allows use of inexpensive hanging cable, andrequires no direct communication and no cable venting. This setup isideal for use where barometric compensation of pressure measure-ments is not required—in vacuum testing, unconfined aquifers, or verydeep applications where barometric pressure effects are minimal.
• Because the Twist-Lock Hanger has no communication capabilities,you must program the MP TROLL 9500 before installation
• Logged pressure data will show the effects of changes in baromet-ric pressure. However, post-processing tools may be used toeliminate the effects of barometric pressure changes from the data,if required. See “Correcting Absolute Pressure Readings forBarometric Pressure” below for more information.
SECTION 7: MONITORING PRESSURE (WATER LEVEL)
Range Usable DepthkPa PSI Meters Feet
103.4 15 11 35206.8 30 21 69689.5 100 70 2312068 300 210 692
Pressure Sensor Pressure Ratings
Kellems grip
Installation Tips for Level/Depth/Pressure Monitoring
• Never let a probe “free fall” down a well. The resulting shockwave when it hits the water surface can damage the pressuresensor strain gauge (the “waterhammer” effect), as well asother sensors.
• It is always wise to check the level of water above the probe,then move it and read again to be sure that the probe is givinga reasonable reading and showing change. It might not belocated where you think it is — for example, it could be wedgedagainst the casing with a loop of cable hanging below it. Aprobe in such a position might become dislodged and moveduring the test, giving a false change in level. A secureplacement is critical to accurate level measurements.
• When monitoring pressure with vented cable, do not allow thecable (and its internal vent tube) to kink or bend. If the venttube is obstructed, water level measurements can be adverselyaffected. The vent tube can become kinked and damage theinternal components without any visible harm to the outside ofthe cable. The recommended minimum bend radius is 63.4mm (about 2½ in) or more.
• Do not position the instrument below the level of the pump in apumping well. The pressure transients generated by the pumpwill cause false level readings. Large pumps can swallow theprobe and cause permanent damage to both the MP TROLL9500 and the pump.
52 0095110 rev. 002 11/06
CORRECTING ABSOLUTE PRESSURE READINGS FORBAROMETRIC PRESSURE
Pressure measured with an “absolute” or “non-vented” (psia) pressuresensor includes all pressure forces detected by the strain gauge—atmospheric pressure as well as the pressure due to the watercolumn. “Gauged” or “vented” (psig) sensors remove the atmosphericpressure component (pressure due to the atmosphere), so thatatmospheric pressure on a water surface is not doubled in themeasurements from a sensor under the water surface.
Barometric compensation of absolute pressure measurements, ifrequired, may be accomplished in a couple of ways.
MANUAL BAROMETRIC PRESSURE COMPENSATION
Using the MP TROLL’s Barometric Pressure Sensor
If your model of MP TROLL 9500 includes an onboard barometricpressure sensor, and the instrument is attached to vented cable, thebarometric pressure sensor output can be used to correct measure-ments from a submerged absolute (psia) pressure sensor. In thiscase, set up the pressure channel in “pressure head” mode, andselect the same units for both the water pressure channel and thebarometric pressure channel. Set up and run a test that includes bothpressure channels. Extract (download) the data, and subtract thebarometric pressure measurements from the water pressure measure-ments.
Using a Second Unit and a Spreadsheet
If a barometric pressure sensor is not present, and/or the cable is notvented, barometric compensation of absolute pressure measurementsmay be accomplished with the use of a separate device—a BaroTROLL or Absolute miniTROLL—installed above the water surface,taking barometric pressure measurements. Set up both devices to usethe same units and display mode—the only difference will be if a levelreference is used; in that case the barometric reference should bezero, the downhole reference will be the water level. Schedule tests tostart at the same time in each unit. Extract (download) the data fromboth tests, and subtract the barometric pressure measurements fromthe water pressure measurements (by hand or in a spreadsheet).
SECTION 7: MONITORING PRESSURE (WATER LEVEL)
AUTOMATIC BAROMETRIC PRESSURE COMPENSATION
A Baro Wizard in Win-Situ and Pocket-Situ allows for automaticbarometric pressure compensation of absolute pressure data, eitherusing a fixed user-specified value or by reference to a file of baro-metric pressure data collected at the same time by a BaroTROLL orother absolute (psia) instrument installed at the surface. The baro-metrically corrected absolute pressure data may be saved in a newfile, if desired.
Collecting Barometric Pressure Data for Reference
Be sure to set the clock in the BaroTROLL (or other absoltueinstrument). Add a test. Ideally, this test should start before the test inthe Absolute MP TROLL 9500 starts and log data on approximatelythe same schedule. Run the test. Extract the test (it is not necessaryto stop it.)
Collecting PSIA Data
Set the clock in the Absolute MP TROLL 9500. Add a test and run itas usual. Extract this test also.
Using the Baro Wizard
The difference in pressure between a BaroTROLL at the surface anda submerged MP TROLL 9500 with an absolute (psia) pressuresensor can be calculated from extracted test data files. This task issimplified if the BaroTROLL test covers the entire duration of theAbsolute instrument’s test.
1. Launch Win-Situ or Pocket-Situ. Connection to an instrument is notnecessary after the tests have been extracted.
2. In the data folder, select a test extracted from an MP TROLL 9500with an Absolute pressure sensor (PSIA data).
3. On the Tools menu, select Baro Wiz.
TIP: For additional information on correcting absolutepressure measurements, see Technical Note 13 in theDownloads section of our website at www.in-situ.com.
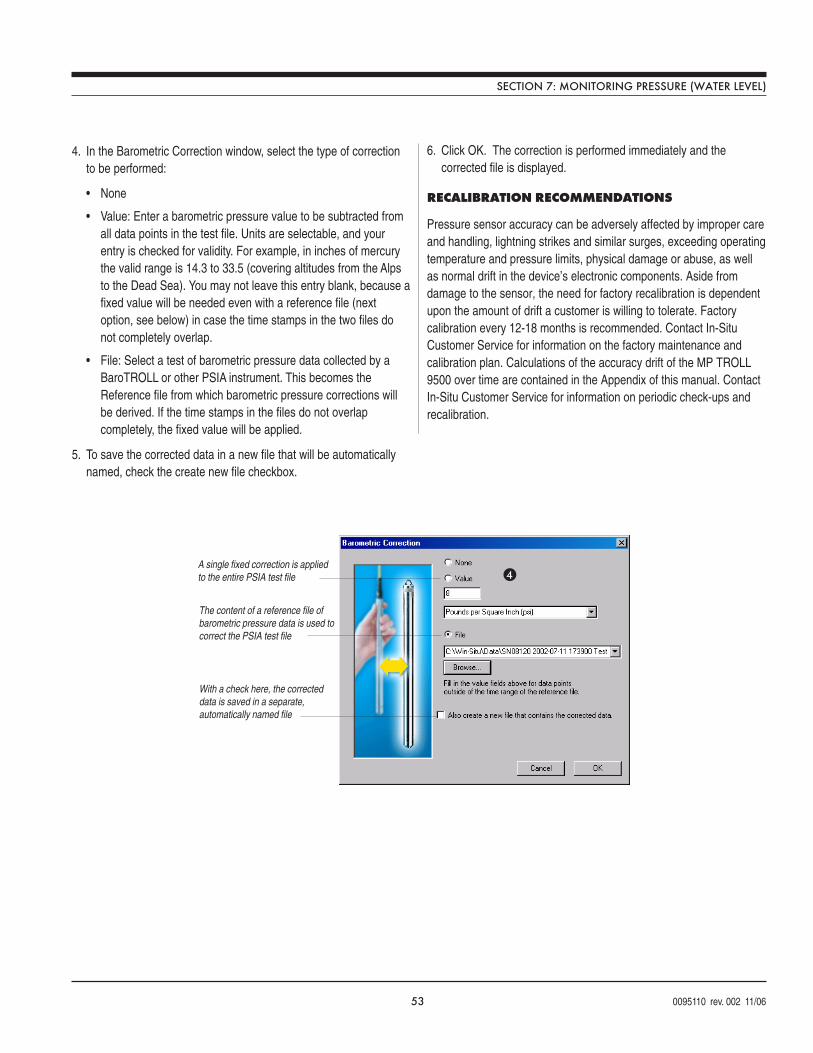
53 0095110 rev. 002 11/06
SECTION 7: MONITORING PRESSURE (WATER LEVEL)
4. In the Barometric Correction window, select the type of correctionto be performed:
• None
• Value: Enter a barometric pressure value to be subtracted fromall data points in the test file. Units are selectable, and yourentry is checked for validity. For example, in inches of mercurythe valid range is 14.3 to 33.5 (covering altitudes from the Alpsto the Dead Sea). You may not leave this entry blank, because afixed value will be needed even with a reference file (nextoption, see below) in case the time stamps in the two files donot completely overlap.
• File: Select a test of barometric pressure data collected by aBaroTROLL or other PSIA instrument. This becomes theReference file from which barometric pressure corrections willbe derived. If the time stamps in the files do not overlapcompletely, the fixed value will be applied.
5. To save the corrected data in a new file that will be automaticallynamed, check the create new file checkbox.
6. Click OK. The correction is performed immediately and thecorrected file is displayed.
RECALIBRATION RECOMMENDATIONS
Pressure sensor accuracy can be adversely affected by improper careand handling, lightning strikes and similar surges, exceeding operatingtemperature and pressure limits, physical damage or abuse, as wellas normal drift in the device’s electronic components. Aside fromdamage to the sensor, the need for factory recalibration is dependentupon the amount of drift a customer is willing to tolerate. Factorycalibration every 12-18 months is recommended. Contact In-SituCustomer Service for information on the factory maintenance andcalibration plan. Calculations of the accuracy drift of the MP TROLL9500 over time are contained in the Appendix of this manual. ContactIn-Situ Customer Service for information on periodic check-ups andrecalibration.
A single fixed correction is appliedto the entire PSIA test file
The content of a reference file ofbarometric pressure data is used tocorrect the PSIA test file
4
With a check here, the correcteddata is saved in a separate,automatically named file
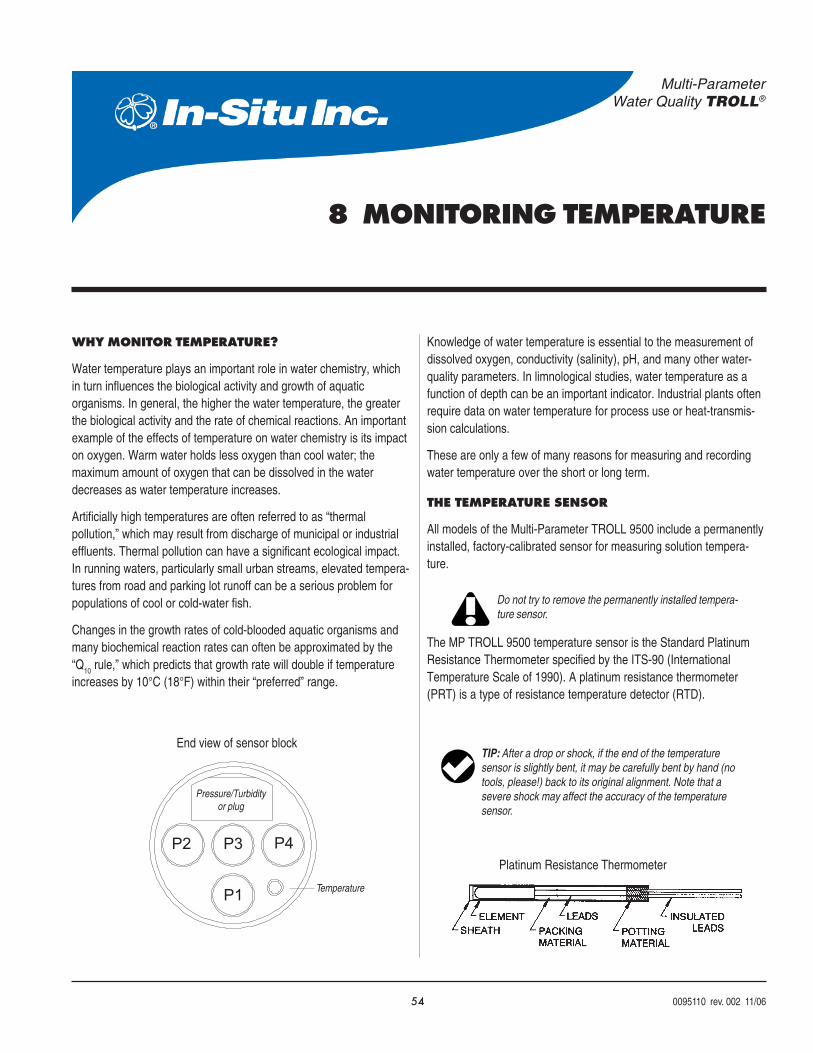
54 0095110 rev. 002 11/06
Multi-ParameterWater Quality TROLL®
8 MONITORING TEMPERATURE
1
2 3 4
Pressure/Turbidityor plug
Temperature
End view of sensor block
P1
P2 P3 P4
Do not try to remove the permanently installed tempera-ture sensor.
Platinum Resistance Thermometer
TIP: After a drop or shock, if the end of the temperaturesensor is slightly bent, it may be carefully bent by hand (notools, please!) back to its original alignment. Note that asevere shock may affect the accuracy of the temperaturesensor.
WHY MONITOR TEMPERATURE?
Water temperature plays an important role in water chemistry, whichin turn influences the biological activity and growth of aquaticorganisms. In general, the higher the water temperature, the greaterthe biological activity and the rate of chemical reactions. An importantexample of the effects of temperature on water chemistry is its impacton oxygen. Warm water holds less oxygen than cool water; themaximum amount of oxygen that can be dissolved in the waterdecreases as water temperature increases.
Artificially high temperatures are often referred to as “thermalpollution,” which may result from discharge of municipal or industrialeffluents. Thermal pollution can have a significant ecological impact.In running waters, particularly small urban streams, elevated tempera-tures from road and parking lot runoff can be a serious problem forpopulations of cool or cold-water fish.
Changes in the growth rates of cold-blooded aquatic organisms andmany biochemical reaction rates can often be approximated by the“Q
10 rule,” which predicts that growth rate will double if temperature
increases by 10°C (18°F) within their “preferred” range.
Knowledge of water temperature is essential to the measurement ofdissolved oxygen, conductivity (salinity), pH, and many other water-quality parameters. In limnological studies, water temperature as afunction of depth can be an important indicator. Industrial plants oftenrequire data on water temperature for process use or heat-transmis-sion calculations.
These are only a few of many reasons for measuring and recordingwater temperature over the short or long term.
THE TEMPERATURE SENSOR
All models of the Multi-Parameter TROLL 9500 include a permanentlyinstalled, factory-calibrated sensor for measuring solution tempera-ture.
The MP TROLL 9500 temperature sensor is the Standard PlatinumResistance Thermometer specified by the ITS-90 (InternationalTemperature Scale of 1990). A platinum resistance thermometer(PRT) is a type of resistance temperature detector (RTD).
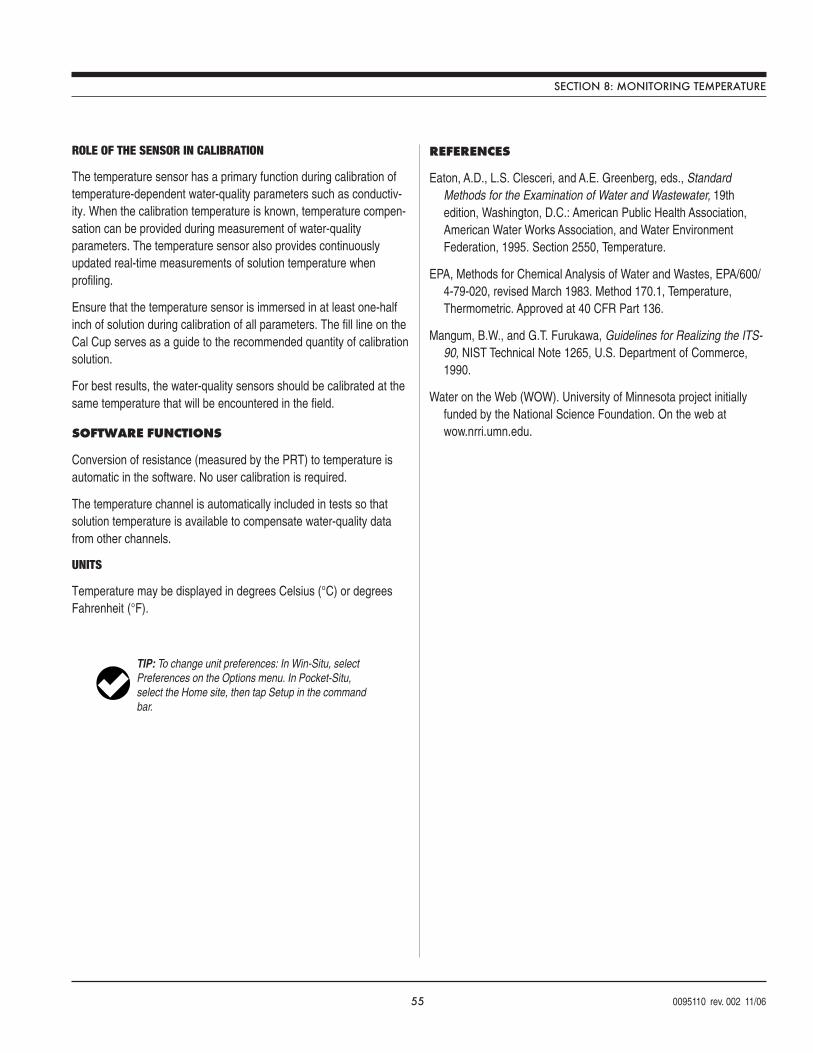
55 0095110 rev. 002 11/06
TIP: To change unit preferences: In Win-Situ, selectPreferences on the Options menu. In Pocket-Situ,select the Home site, then tap Setup in the commandbar.
ROLE OF THE SENSOR IN CALIBRATION
The temperature sensor has a primary function during calibration oftemperature-dependent water-quality parameters such as conductiv-ity. When the calibration temperature is known, temperature compen-sation can be provided during measurement of water-qualityparameters. The temperature sensor also provides continuouslyupdated real-time measurements of solution temperature whenprofiling.
Ensure that the temperature sensor is immersed in at least one-halfinch of solution during calibration of all parameters. The fill line on theCal Cup serves as a guide to the recommended quantity of calibrationsolution.
For best results, the water-quality sensors should be calibrated at thesame temperature that will be encountered in the field.
SOFTWARE FUNCTIONS
Conversion of resistance (measured by the PRT) to temperature isautomatic in the software. No user calibration is required.
The temperature channel is automatically included in tests so thatsolution temperature is available to compensate water-quality datafrom other channels.
UNITS
Temperature may be displayed in degrees Celsius (°C) or degreesFahrenheit (°F).
REFERENCES
Eaton, A.D., L.S. Clesceri, and A.E. Greenberg, eds., StandardMethods for the Examination of Water and Wastewater, 19thedition, Washington, D.C.: American Public Health Association,American Water Works Association, and Water EnvironmentFederation, 1995. Section 2550, Temperature.
EPA, Methods for Chemical Analysis of Water and Wastes, EPA/600/4-79-020, revised March 1983. Method 170.1, Temperature,Thermometric. Approved at 40 CFR Part 136.
Mangum, B.W., and G.T. Furukawa, Guidelines for Realizing the ITS-90, NIST Technical Note 1265, U.S. Department of Commerce,1990.
Water on the Web (WOW). University of Minnesota project initiallyfunded by the National Science Foundation. On the web atwow.nrri.umn.edu.
SECTION 8: MONITORING TEMPERATURE
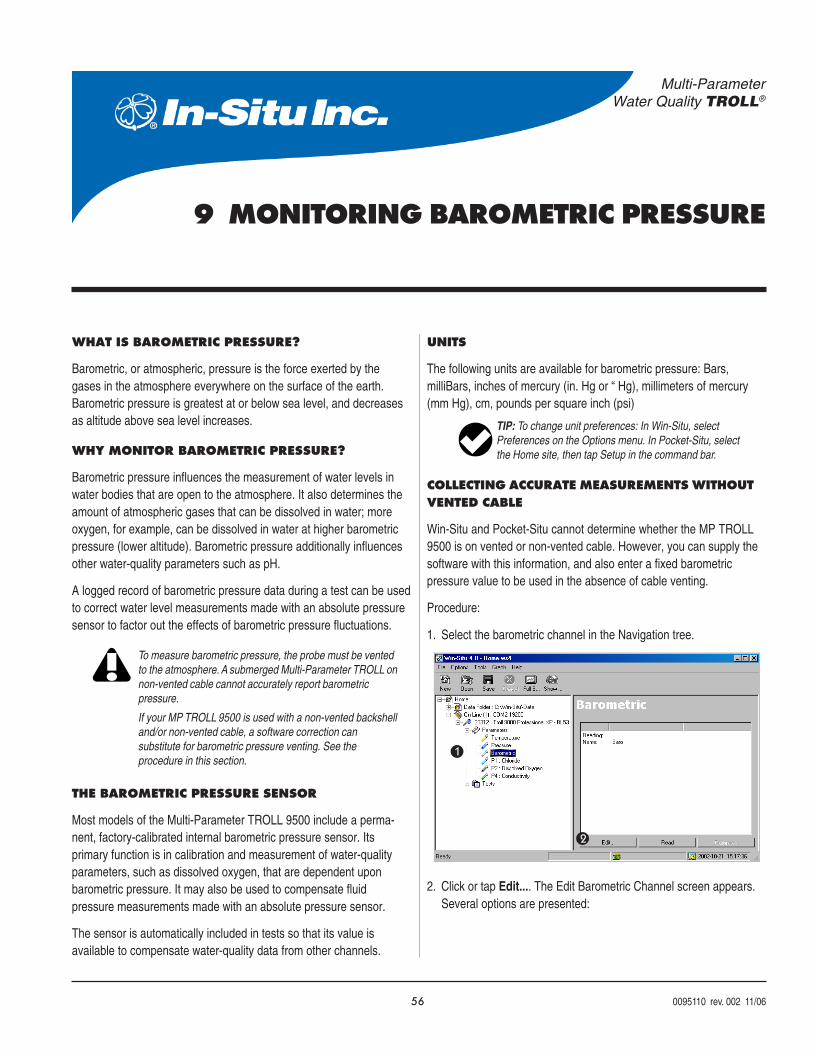
56 0095110 rev. 002 11/06
Multi-ParameterWater Quality TROLL®
9 MONITORING BAROMETRIC PRESSURE
To measure barometric pressure, the probe must be ventedto the atmosphere. A submerged Multi-Parameter TROLL onnon-vented cable cannot accurately report barometricpressure.
If your MP TROLL 9500 is used with a non-vented backshelland/or non-vented cable, a software correction cansubstitute for barometric pressure venting. See theprocedure in this section.
WHAT IS BAROMETRIC PRESSURE?
Barometric, or atmospheric, pressure is the force exerted by thegases in the atmosphere everywhere on the surface of the earth.Barometric pressure is greatest at or below sea level, and decreasesas altitude above sea level increases.
WHY MONITOR BAROMETRIC PRESSURE?
Barometric pressure influences the measurement of water levels inwater bodies that are open to the atmosphere. It also determines theamount of atmospheric gases that can be dissolved in water; moreoxygen, for example, can be dissolved in water at higher barometricpressure (lower altitude). Barometric pressure additionally influencesother water-quality parameters such as pH.
A logged record of barometric pressure data during a test can be usedto correct water level measurements made with an absolute pressuresensor to factor out the effects of barometric pressure fluctuations.
THE BAROMETRIC PRESSURE SENSOR
Most models of the Multi-Parameter TROLL 9500 include a perma-nent, factory-calibrated internal barometric pressure sensor. Itsprimary function is in calibration and measurement of water-qualityparameters, such as dissolved oxygen, that are dependent uponbarometric pressure. It may also be used to compensate fluidpressure measurements made with an absolute pressure sensor.
The sensor is automatically included in tests so that its value isavailable to compensate water-quality data from other channels.
UNITS
The following units are available for barometric pressure: Bars,milliBars, inches of mercury (in. Hg or “ Hg), millimeters of mercury(mm Hg), cm, pounds per square inch (psi)
COLLECTING ACCURATE MEASUREMENTS WITHOUTVENTED CABLE
Win-Situ and Pocket-Situ cannot determine whether the MP TROLL9500 is on vented or non-vented cable. However, you can supply thesoftware with this information, and also enter a fixed barometricpressure value to be used in the absence of cable venting.
Procedure:
1. Select the barometric channel in the Navigation tree.
2. Click or tap Edit.... The Edit Barometric Channel screen appears.Several options are presented:
TIP: To change unit preferences: In Win-Situ, selectPreferences on the Options menu. In Pocket-Situ, selectthe Home site, then tap Setup in the command bar.
1
2
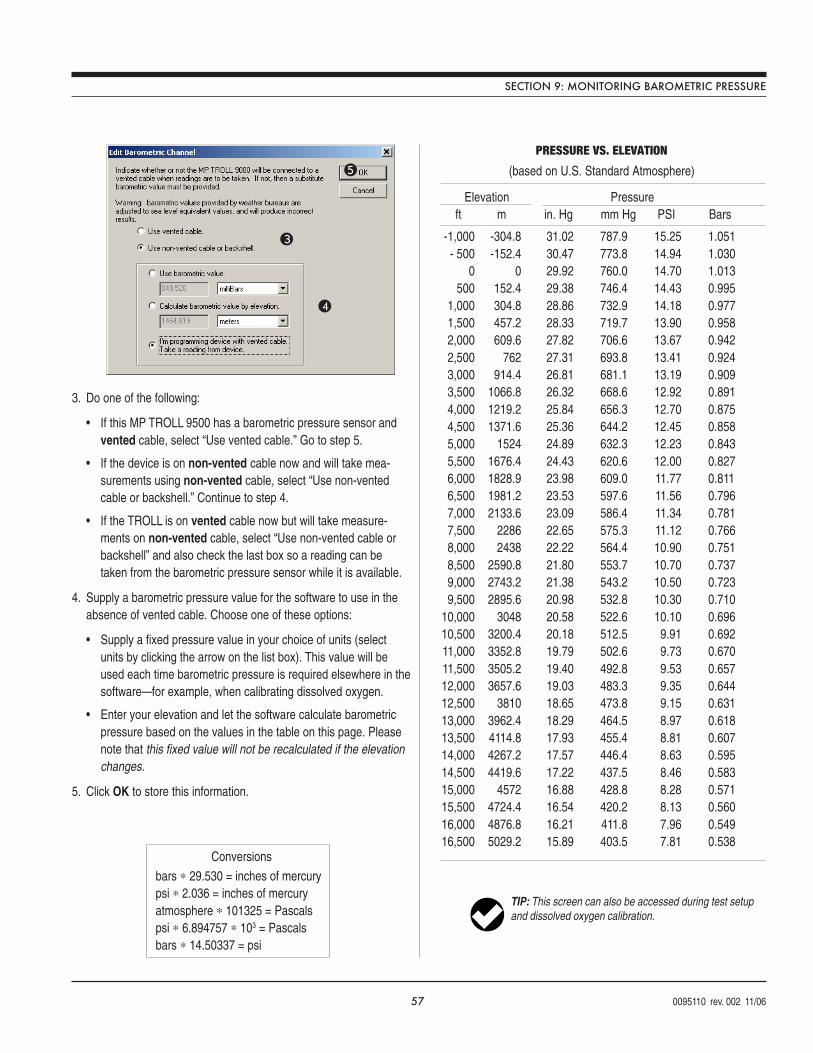
57 0095110 rev. 002 11/06
Elevation Pressureft m in. Hg mm Hg PSI Bars
-1,000 -304.8 31.02 787.9 15.25 1.051- 500 -152.4 30.47 773.8 14.94 1.030
0 0 29.92 760.0 14.70 1.013500 152.4 29.38 746.4 14.43 0.995
1,000 304.8 28.86 732.9 14.18 0.9771,500 457.2 28.33 719.7 13.90 0.9582,000 609.6 27.82 706.6 13.67 0.9422,500 762 27.31 693.8 13.41 0.9243,000 914.4 26.81 681.1 13.19 0.9093,500 1066.8 26.32 668.6 12.92 0.8914,000 1219.2 25.84 656.3 12.70 0.8754,500 1371.6 25.36 644.2 12.45 0.8585,000 1524 24.89 632.3 12.23 0.8435,500 1676.4 24.43 620.6 12.00 0.8276,000 1828.9 23.98 609.0 11.77 0.8116,500 1981.2 23.53 597.6 11.56 0.7967,000 2133.6 23.09 586.4 11.34 0.7817,500 2286 22.65 575.3 11.12 0.7668,000 2438 22.22 564.4 10.90 0.7518,500 2590.8 21.80 553.7 10.70 0.7379,000 2743.2 21.38 543.2 10.50 0.7239,500 2895.6 20.98 532.8 10.30 0.710
10,000 3048 20.58 522.6 10.10 0.69610,500 3200.4 20.18 512.5 9.91 0.69211,000 3352.8 19.79 502.6 9.73 0.67011,500 3505.2 19.40 492.8 9.53 0.65712,000 3657.6 19.03 483.3 9.35 0.64412,500 3810 18.65 473.8 9.15 0.63113,000 3962.4 18.29 464.5 8.97 0.61813,500 4114.8 17.93 455.4 8.81 0.60714,000 4267.2 17.57 446.4 8.63 0.59514,500 4419.6 17.22 437.5 8.46 0.58315,000 4572 16.88 428.8 8.28 0.57115,500 4724.4 16.54 420.2 8.13 0.56016,000 4876.8 16.21 411.8 7.96 0.54916,500 5029.2 15.89 403.5 7.81 0.538
PRESSURE VS. ELEVATION
(based on U.S. Standard Atmosphere)
3. Do one of the following:
• If this MP TROLL 9500 has a barometric pressure sensor andvented cable, select “Use vented cable.” Go to step 5.
• If the device is on non-vented cable now and will take mea-surements using non-vented cable, select “Use non-ventedcable or backshell.” Continue to step 4.
• If the TROLL is on vented cable now but will take measure-ments on non-vented cable, select “Use non-vented cable orbackshell” and also check the last box so a reading can betaken from the barometric pressure sensor while it is available.
4. Supply a barometric pressure value for the software to use in theabsence of vented cable. Choose one of these options:
• Supply a fixed pressure value in your choice of units (selectunits by clicking the arrow on the list box). This value will beused each time barometric pressure is required elsewhere in thesoftware—for example, when calibrating dissolved oxygen.
• Enter your elevation and let the software calculate barometricpressure based on the values in the table on this page. Pleasenote that this fixed value will not be recalculated if the elevationchanges.
5. Click OK to store this information.
TIP: This screen can also be accessed during test setupand dissolved oxygen calibration.
SECTION 9: MONITORING BAROMETRIC PRESSURE
bars ∗ 29.530 = inches of mercurypsi ∗ 2.036 = inches of mercuryatmosphere ∗ 101325 = Pascalspsi ∗ 6.894757 ∗ 103 = Pascalsbars ∗ 14.50337 = psi
Conversions
3
5
4
58 0095110 rev. 002 11/06
Multi-ParameterWater Quality TROLL®
10 MONITORING WATER QUALITY: OVERVIEW
WHY MONITOR WATER QUALITY?
At a time of increasing demands on the finite natural resources of ourplanet, public organizations and private individuals alike have becomeacutely aware of the responsibility to maintain the quality of the earth’sair and water supplies.
Recent rapid advances in knowledge and technology have made itpossible to deliver accurate, timely, and reliable data on processes wecannot necessarily examine visually. New-generation sensors for in-situ measurement of surface waters and groundwater can be anefficient alternative to time- and labor-intensive programs of fieldsampling and transportation to a laboratory for analysis, or cansupplement such programs. If it is possible to collect, interpret, andrespond in a timely fashion to accurate information about watersupplies and water quality, we can design better systems for protec-tion of those supplies.
Monitoring water-quality parameters can reveal much about thepresence and movement of natural and unnatural components ofwater—the presence of harmful bacteria, potential pollution sources,depletion of nutrient requirements for aquatic life, salt-water intrusioninto fresh water bodies, changes in water level or temperature thatcan alert observers to the onset of an “event” that can adversely affectthe quality of the resource.
Monitoring water quality in surface and groundwater resources maybe required by Federal, state, or local regulations. Digital records ofmonitoring can document compliance with guidelines and standardsmandated by regulatory bodies.
Profiling and logging water-quality data can provide timely informationon continually changing conditions—profiling to provide instantaneousreal-time feedback, logging to track trends and demonstrate compli-ance.
THE SENSORS
The Multi-Parameter TROLL 9500 takes advantage of new technolo-gies to monitor water-quality parameters in-situ with high accuracy.Each sensor has been manufactured to our rigid specifications and isdesigned to operate with the entire suite of sensors and with the MPTROLL 9500 electronics. These “smart” sensors retain serial numberidentification and calibration information, and are detected andidentified by the instrument. A sensor may be calibrated in any MPTROLL 9500 and moved to another port that accepts the sensor type,or used in another MP TROLL 9500, without recalibration. The mostaccurate results will be obtained when a sensor is calibrated andoperated in the same MP TROLL 9500.
The water quality sensors available for the Multi-Parameter TROLL9500 may be classed in two general types:
BASIC SENSOR SET
• pH• Oxidation-reduction potential (ORP)• Combination pH/ORP• Dissolved Oxygen, polarographic (DO)• Conductivity (and Specific Conductance, Salinity, Total
Dissolved Solids, Resistivity)
The pH sensor and ORP sensor are Single ISEs (ion-selectiveelectrodes). The Combination pH/ORP sensor is a Multiple ISE.
The Basic sensors can be factory-calibrated and pre-installed in theMP TROLL 9500. They are ready for use right out of the box with abrief Quick Cal. However, for best results, if your software supports it,we recommend that you perform a traditional two-point calibration forpH and DO, and a specific range calibration for conductivity asdescribed in sections 11-13 below. The accuracy that can be achievedfrom the instrument is proportional to the time and care you put intocalibration.
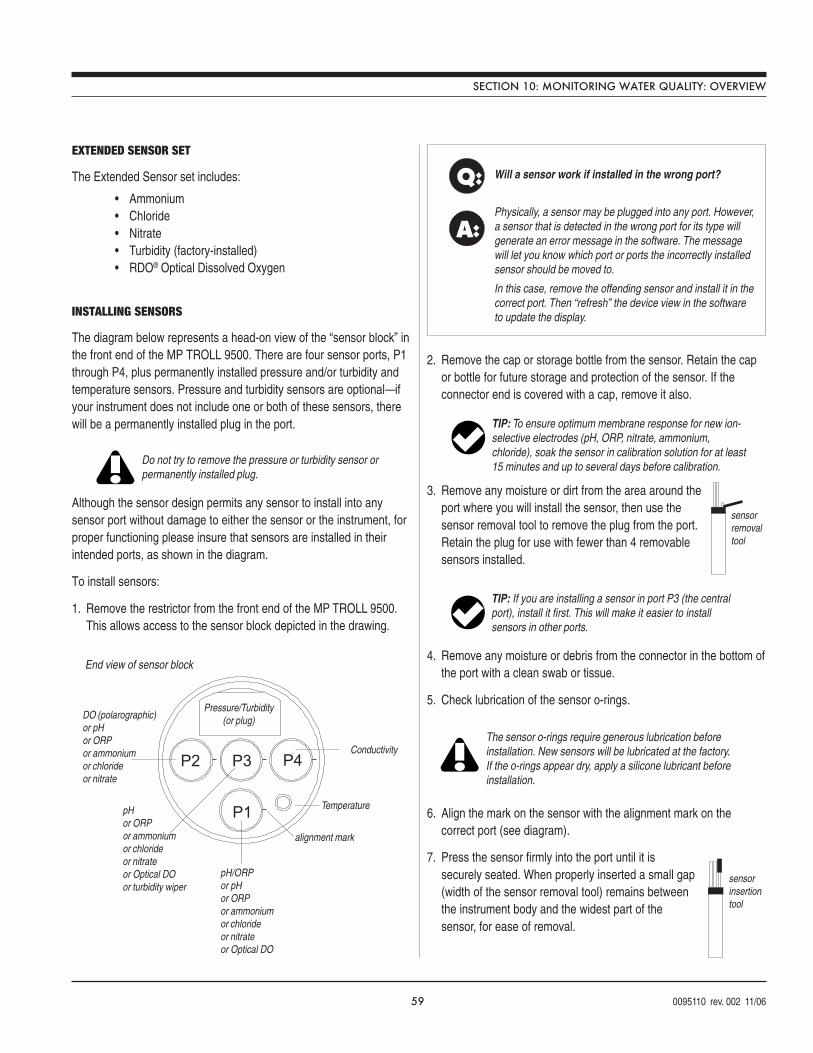
59 0095110 rev. 002 11/06
Q:
A:
Will a sensor work if installed in the wrong port?
Physically, a sensor may be plugged into any port. However,a sensor that is detected in the wrong port for its type willgenerate an error message in the software. The messagewill let you know which port or ports the incorrectly installedsensor should be moved to.
In this case, remove the offending sensor and install it in thecorrect port. Then “refresh” the device view in the softwareto update the display.
Do not try to remove the pressure or turbidity sensor orpermanently installed plug.
P1
P2 P3 P4 Conductivity
1
2 3 4
Pressure/Turbidity(or plug)
Temperature
DO (polarographic)or pHor ORPor ammoniumor chlorideor nitrate
pH/ORPor pHor ORPor ammoniumor chlorideor nitrateor Optical DO
pHor ORPor ammoniumor chlorideor nitrateor Optical DOor turbidity wiper
End view of sensor block
P1
P2 P3 P4
alignment mark
TIP: If you are installing a sensor in port P3 (the centralport), install it first. This will make it easier to installsensors in other ports.
The sensor o-rings require generous lubrication beforeinstallation. New sensors will be lubricated at the factory.If the o-rings appear dry, apply a silicone lubricant beforeinstallation.
sensorremovaltool
EXTENDED SENSOR SET
The Extended Sensor set includes:
• Ammonium• Chloride• Nitrate• Turbidity (factory-installed)• RDO® Optical Dissolved Oxygen
INSTALLING SENSORS
The diagram below represents a head-on view of the “sensor block” inthe front end of the MP TROLL 9500. There are four sensor ports, P1through P4, plus permanently installed pressure and/or turbidity andtemperature sensors. Pressure and turbidity sensors are optional—ifyour instrument does not include one or both of these sensors, therewill be a permanently installed plug in the port.
Although the sensor design permits any sensor to install into anysensor port without damage to either the sensor or the instrument, forproper functioning please insure that sensors are installed in theirintended ports, as shown in the diagram.
To install sensors:
1. Remove the restrictor from the front end of the MP TROLL 9500.This allows access to the sensor block depicted in the drawing.
2. Remove the cap or storage bottle from the sensor. Retain the capor bottle for future storage and protection of the sensor. If theconnector end is covered with a cap, remove it also.
3. Remove any moisture or dirt from the area around theport where you will install the sensor, then use thesensor removal tool to remove the plug from the port.Retain the plug for use with fewer than 4 removablesensors installed.
4. Remove any moisture or debris from the connector in the bottom ofthe port with a clean swab or tissue.
5. Check lubrication of the sensor o-rings.
6. Align the mark on the sensor with the alignment mark on thecorrect port (see diagram).
7. Press the sensor firmly into the port until it issecurely seated. When properly inserted a small gap(width of the sensor removal tool) remains betweenthe instrument body and the widest part of thesensor, for ease of removal.
SECTION 10: MONITORING WATER QUALITY: OVERVIEW
TIP: To ensure optimum membrane response for new ion-selective electrodes (pH, ORP, nitrate, ammonium,chloride), soak the sensor in calibration solution for at least15 minutes and up to several days before calibration.
sensorinsertiontool
60 0095110 rev. 002 11/06
Q:
A:
What is the difference between NOMINAL and STABLE?
To meet the criteria for a valid calibration point, the change(deviation) in sensor response is monitored over time. Thesoftware is looking for the calibration solution temperatureand the sensor readings to settle over a specific time period.The criteria for STABLE are designed to meet the publishedspecifications. The NOMINAL criteria are designed to shortenthe calibration time when an approximate calibration isacceptable. When the deviation falls within the limits of the“loosened” specifications, NOMINAL is displayed in the Statusarea, and the Accept button becomes available to store thecurrent calibration point.
Accepting a NOMINAL value may save considerable time. Insome cases, especially if the sensors have been soaking inthe solution for several minutes prior to calibration, theaccuracy achieved by accepting a nominal value may bevery similar to that obtained by waiting for complete stability.
sensorremovaltool
REMOVING SENSORS
Sensors may be removed for inspection, cleaning, routine mainte-nance, and storage. Because the smart sensors retain calibrationinformation, they may be removed and re-installed—even in anotherMP TROLL 9500— as often as necessary.
Remove a sensor by positioning the yoke of the sensorremoval tool at the point where the sensor enters thesensor block. Firmly pry the sensor upward until it popsout.
Sensor O-Rings
Two Viton® o-rings on each sensor provide a watertight seal againstwater leakage into the instrument body. We recommend that youinspect these o-rings each time you remove or install a sensor. Checkcarefully for cracks, tears, splitting, shredding, and other damage. Ifthe o-rings are in good condition, apply silicone lubricant beforeinstalling the sensor again. Remove excess lubricant with a tissue,and take care to keep grease away from the area around theconnector at the bottom of the sensor. Should lubricant get into thisarea, it can be removed with a clean cotton swab.
If the o-rings become damaged to the extent that no longer provide aneffective seal, they should be replaced. Sensor o-rings and lubricantare available from In-Situ Inc. or your distributor.
CALIBRATION OVERVIEW
The MP TROLL 9500 and its control software provide several optionsfor calibration of the water-quality sensors. Select the method thatsuits the time you have at your disposal and the degree of accuracyyou want to achieve when measuring water-quality parameters.
Satisfactory results may be achieved using the Quick Cal procedure.Some sensors can even return nominal results straight out of the boxusing the factory-supplied default calibration coefficients. However, forbest results we recommend a full traditional calibration procedurebefore the first field use, and periodic checks and recalibrations asnecessary thereafter.
The following available options are briefly described in the next twopages:
• Traditional Calibration
• Quick Calibration
• Out-of-Box
• Factory Defaults
* Custom Sensor Preparation
TRADITIONAL CALIBRATION
A full traditional calibration, guided by software wizards, can achievethe highest level of accuracy. Some sensors require a single-pointcalibration, others present a choice of single- or multi-point, requiringmore than one calibration standard. A single-point calibration givesgood results in the range of values represented by the selectedcalibration solution. When a wide range of values are expected, amulti-point calibration is recommended.
With the sensor installed in the MP TROLL 9000 and immersed incalibration solution, the sensor is powered at regular intervals and itsresponse is monitored. The difference (deviation) between theminimum and maximum response over a predetermined time period istracked by the software. When the peaks of the response fall withinpredetermined limits for the time period, the sensor response isconsidered sufficiently stable to provide a valid calibration point. Thelength of time and allowable deviation are specific to each sensor type,and furthermore are specific to the determination of nominal stabilityor complete stability. The time period of interest is shorter for nominalstability than for complete stability, allowing for a shortening of thecalibration soak time while still returning a valid calibration point.
• Available for: All water-quality parameters.
• Requirements: MP TROLL 9500, sensors (installed), Cal Cup,and one or more calibration solutions for each parameter to becalibrated. Suitable calibration solutions are supplied in In-Situ’sindividual calibration kits.
• Where to find the method in this manual: Sections 11-19.
SECTION 10: MONITORING WATER QUALITY: OVERVIEW
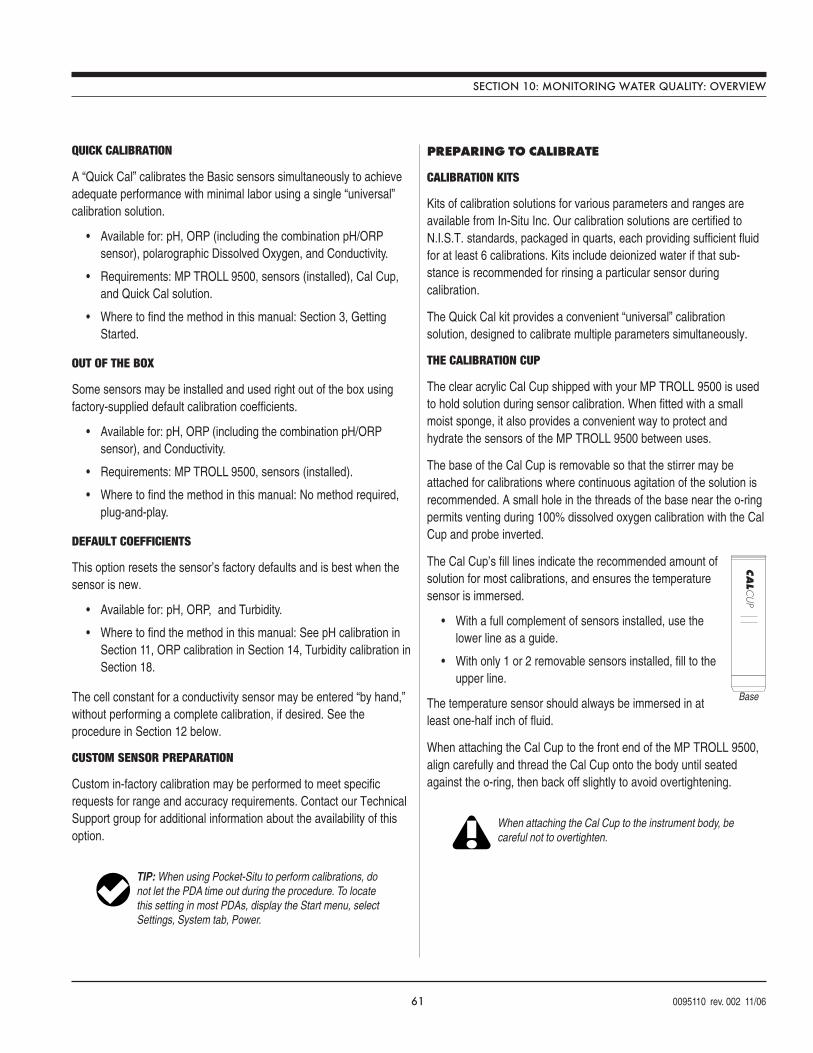
61 0095110 rev. 002 11/06
CA
LCU
P
Base
When attaching the Cal Cup to the instrument body, becareful not to overtighten.
QUICK CALIBRATION
A “Quick Cal” calibrates the Basic sensors simultaneously to achieveadequate performance with minimal labor using a single “universal”calibration solution.
• Available for: pH, ORP (including the combination pH/ORPsensor), polarographic Dissolved Oxygen, and Conductivity.
• Requirements: MP TROLL 9500, sensors (installed), Cal Cup,and Quick Cal solution.
• Where to find the method in this manual: Section 3, GettingStarted.
OUT OF THE BOX
Some sensors may be installed and used right out of the box usingfactory-supplied default calibration coefficients.
• Available for: pH, ORP (including the combination pH/ORPsensor), and Conductivity.
• Requirements: MP TROLL 9500, sensors (installed).
• Where to find the method in this manual: No method required,plug-and-play.
DEFAULT COEFFICIENTS
This option resets the sensor’s factory defaults and is best when thesensor is new.
• Available for: pH, ORP, and Turbidity.
• Where to find the method in this manual: See pH calibration inSection 11, ORP calibration in Section 14, Turbidity calibration inSection 18.
The cell constant for a conductivity sensor may be entered “by hand,”without performing a complete calibration, if desired. See theprocedure in Section 12 below.
CUSTOM SENSOR PREPARATION
Custom in-factory calibration may be performed to meet specificrequests for range and accuracy requirements. Contact our TechnicalSupport group for additional information about the availability of thisoption.
PREPARING TO CALIBRATE
CALIBRATION KITS
Kits of calibration solutions for various parameters and ranges areavailable from In-Situ Inc. Our calibration solutions are certified toN.I.S.T. standards, packaged in quarts, each providing sufficient fluidfor at least 6 calibrations. Kits include deionized water if that sub-stance is recommended for rinsing a particular sensor duringcalibration.
The Quick Cal kit provides a convenient “universal” calibrationsolution, designed to calibrate multiple parameters simultaneously.
THE CALIBRATION CUP
The clear acrylic Cal Cup shipped with your MP TROLL 9500 is usedto hold solution during sensor calibration. When fitted with a smallmoist sponge, it also provides a convenient way to protect andhydrate the sensors of the MP TROLL 9500 between uses.
The base of the Cal Cup is removable so that the stirrer may beattached for calibrations where continuous agitation of the solution isrecommended. A small hole in the threads of the base near the o-ringpermits venting during 100% dissolved oxygen calibration with the CalCup and probe inverted.
The Cal Cup’s fill lines indicate the recommended amount ofsolution for most calibrations, and ensures the temperaturesensor is immersed.
• With a full complement of sensors installed, use thelower line as a guide.
• With only 1 or 2 removable sensors installed, fill to theupper line.
The temperature sensor should always be immersed in atleast one-half inch of fluid.
When attaching the Cal Cup to the front end of the MP TROLL 9500,align carefully and thread the Cal Cup onto the body until seatedagainst the o-ring, then back off slightly to avoid overtightening.
TIP: When using Pocket-Situ to perform calibrations, donot let the PDA time out during the procedure. To locatethis setting in most PDAs, display the Start menu, selectSettings, System tab, Power.
SECTION 10: MONITORING WATER QUALITY: OVERVIEW
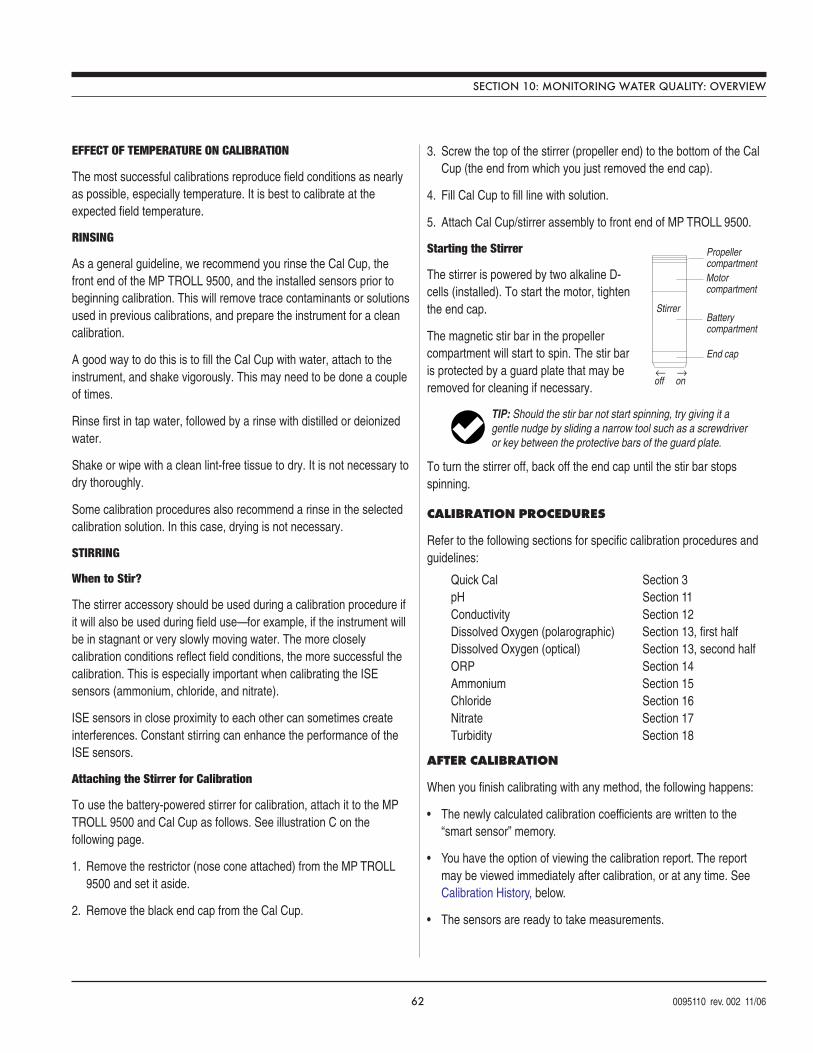
62 0095110 rev. 002 11/06
Stirrer
Propellercompartment
Batterycompartment
Motorcompartment
End cap
← →off on
EFFECT OF TEMPERATURE ON CALIBRATION
The most successful calibrations reproduce field conditions as nearlyas possible, especially temperature. It is best to calibrate at theexpected field temperature.
RINSING
As a general guideline, we recommend you rinse the Cal Cup, thefront end of the MP TROLL 9500, and the installed sensors prior tobeginning calibration. This will remove trace contaminants or solutionsused in previous calibrations, and prepare the instrument for a cleancalibration.
A good way to do this is to fill the Cal Cup with water, attach to theinstrument, and shake vigorously. This may need to be done a coupleof times.
Rinse first in tap water, followed by a rinse with distilled or deionizedwater.
Shake or wipe with a clean lint-free tissue to dry. It is not necessary todry thoroughly.
Some calibration procedures also recommend a rinse in the selectedcalibration solution. In this case, drying is not necessary.
STIRRING
When to Stir?
The stirrer accessory should be used during a calibration procedure ifit will also be used during field use—for example, if the instrument willbe in stagnant or very slowly moving water. The more closelycalibration conditions reflect field conditions, the more successful thecalibration. This is especially important when calibrating the ISEsensors (ammonium, chloride, and nitrate).
ISE sensors in close proximity to each other can sometimes createinterferences. Constant stirring can enhance the performance of theISE sensors.
Attaching the Stirrer for Calibration
To use the battery-powered stirrer for calibration, attach it to the MPTROLL 9500 and Cal Cup as follows. See illustration C on thefollowing page.
1. Remove the restrictor (nose cone attached) from the MP TROLL9500 and set it aside.
2. Remove the black end cap from the Cal Cup.
3. Screw the top of the stirrer (propeller end) to the bottom of the CalCup (the end from which you just removed the end cap).
4. Fill Cal Cup to fill line with solution.
5. Attach Cal Cup/stirrer assembly to front end of MP TROLL 9500.
Starting the Stirrer
The stirrer is powered by two alkaline D-cells (installed). To start the motor, tightenthe end cap.
The magnetic stir bar in the propellercompartment will start to spin. The stir baris protected by a guard plate that may beremoved for cleaning if necessary.
To turn the stirrer off, back off the end cap until the stir bar stopsspinning.
CALIBRATION PROCEDURES
Refer to the following sections for specific calibration procedures andguidelines:
Quick Cal Section 3pH Section 11Conductivity Section 12Dissolved Oxygen (polarographic) Section 13, first halfDissolved Oxygen (optical) Section 13, second halfORP Section 14Ammonium Section 15Chloride Section 16Nitrate Section 17Turbidity Section 18
AFTER CALIBRATION
When you finish calibrating with any method, the following happens:
• The newly calculated calibration coefficients are written to the“smart sensor” memory.
• You have the option of viewing the calibration report. The reportmay be viewed immediately after calibration, or at any time. SeeCalibration History, below.
• The sensors are ready to take measurements.
TIP: Should the stir bar not start spinning, try giving it agentle nudge by sliding a narrow tool such as a screwdriveror key between the protective bars of the guard plate.
SECTION 10: MONITORING WATER QUALITY: OVERVIEW
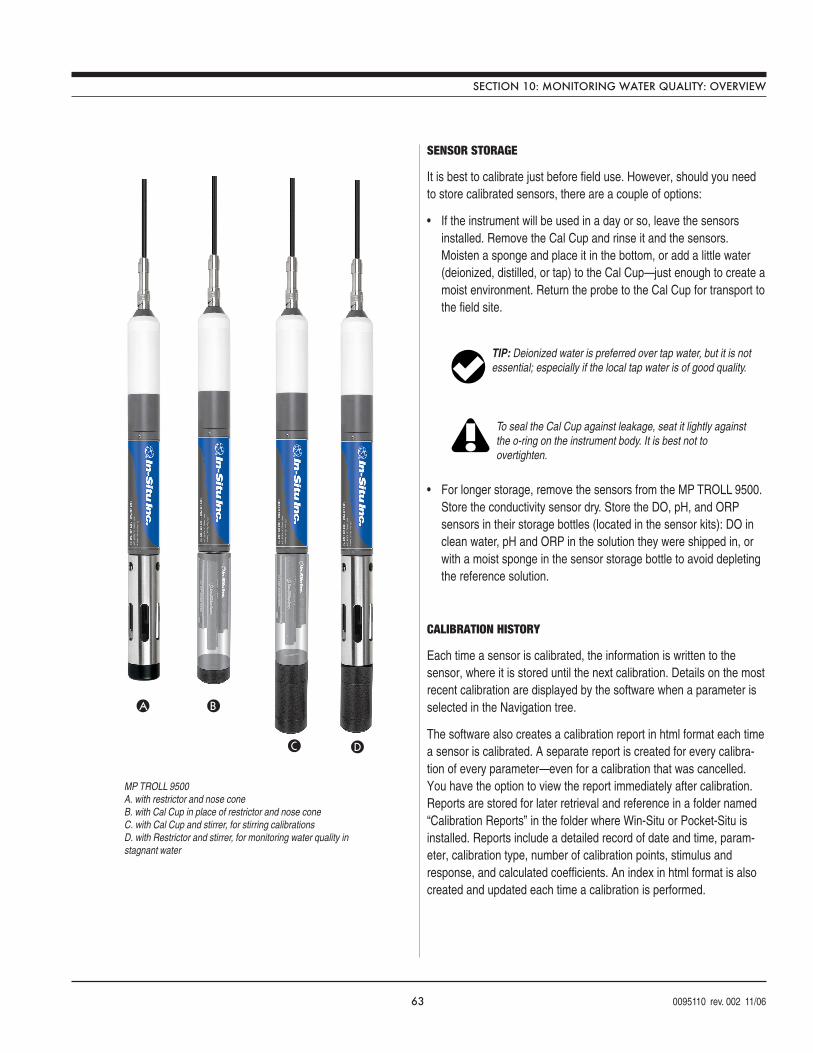
63 0095110 rev. 002 11/06
MP TROLL 9500A. with restrictor and nose coneB. with Cal Cup in place of restrictor and nose coneC. with Cal Cup and stirrer, for stirring calibrationsD. with Restrictor and stirrer, for monitoring water quality instagnant water
To seal the Cal Cup against leakage, seat it lightly againstthe o-ring on the instrument body. It is best not toovertighten.
TIP: Deionized water is preferred over tap water, but it is notessential; especially if the local tap water is of good quality.
SENSOR STORAGE
It is best to calibrate just before field use. However, should you needto store calibrated sensors, there are a couple of options:
• If the instrument will be used in a day or so, leave the sensorsinstalled. Remove the Cal Cup and rinse it and the sensors.Moisten a sponge and place it in the bottom, or add a little water(deionized, distilled, or tap) to the Cal Cup—just enough to create amoist environment. Return the probe to the Cal Cup for transport tothe field site.
• For longer storage, remove the sensors from the MP TROLL 9500.Store the conductivity sensor dry. Store the DO, pH, and ORPsensors in their storage bottles (located in the sensor kits): DO inclean water, pH and ORP in the solution they were shipped in, orwith a moist sponge in the sensor storage bottle to avoid depletingthe reference solution.
CALIBRATION HISTORY
Each time a sensor is calibrated, the information is written to thesensor, where it is stored until the next calibration. Details on the mostrecent calibration are displayed by the software when a parameter isselected in the Navigation tree.
The software also creates a calibration report in html format each timea sensor is calibrated. A separate report is created for every calibra-tion of every parameter—even for a calibration that was cancelled.You have the option to view the report immediately after calibration.Reports are stored for later retrieval and reference in a folder named“Calibration Reports” in the folder where Win-Situ or Pocket-Situ isinstalled. Reports include a detailed record of date and time, param-eter, calibration type, number of calibration points, stimulus andresponse, and calculated coefficients. An index in html format is alsocreated and updated each time a calibration is performed.
SECTION 10: MONITORING WATER QUALITY: OVERVIEW
DC
BA
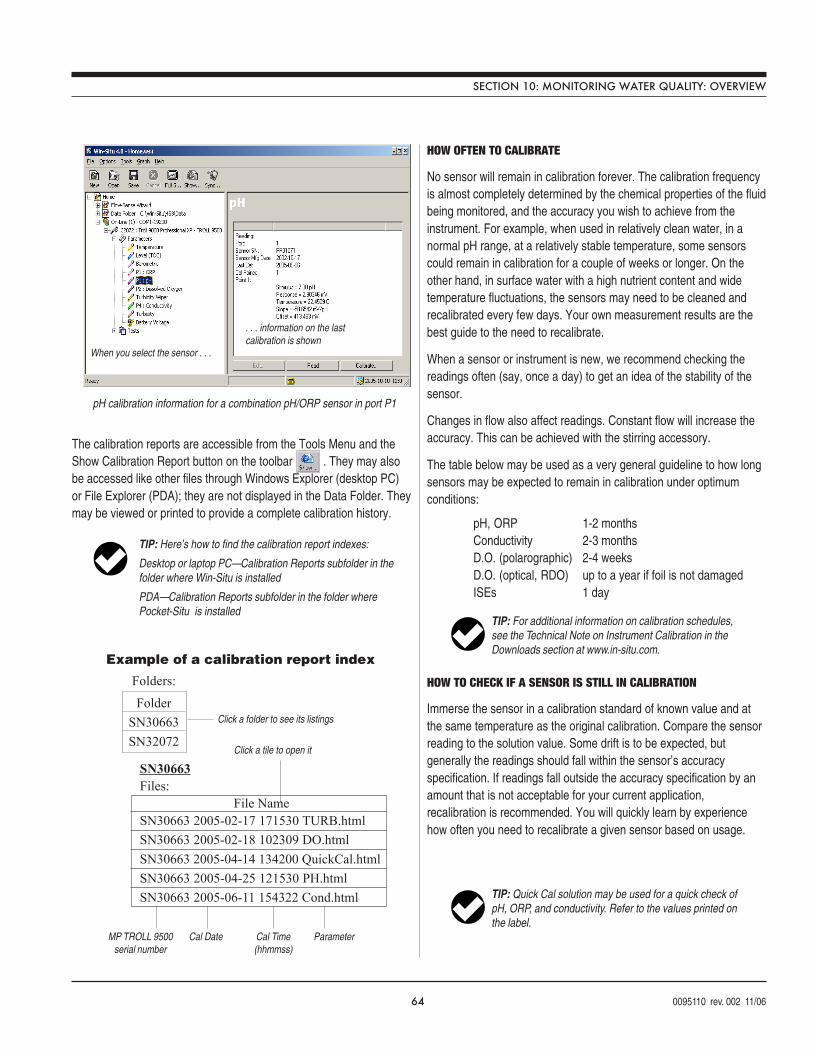
64 0095110 rev. 002 11/06
SN30663Files:
File NameSN30663 2005-02-17 171530 TURB.htmlSN30663 2005-02-18 102309 DO.htmlSN30663 2005-04-14 134200 QuickCal.htmlSN30663 2005-04-25 121530 PH.htmlSN30663 2005-06-11 154322 Cond.html
Folders:
FolderSN30663SN32072
Example of a calibration report index
Click a folder to see its listings
Click a tile to open it
MP TROLL 9500serial number
Cal Date Cal Time(hhmmss)
Parameter
TIP: Here’s how to find the calibration report indexes:
Desktop or laptop PC—Calibration Reports subfolder in thefolder where Win-Situ is installed
PDA—Calibration Reports subfolder in the folder wherePocket-Situ is installed
The calibration reports are accessible from the Tools Menu and theShow Calibration Report button on the toolbar . They may alsobe accessed like other files through Windows Explorer (desktop PC)or File Explorer (PDA); they are not displayed in the Data Folder. Theymay be viewed or printed to provide a complete calibration history.
HOW OFTEN TO CALIBRATE
No sensor will remain in calibration forever. The calibration frequencyis almost completely determined by the chemical properties of the fluidbeing monitored, and the accuracy you wish to achieve from theinstrument. For example, when used in relatively clean water, in anormal pH range, at a relatively stable temperature, some sensorscould remain in calibration for a couple of weeks or longer. On theother hand, in surface water with a high nutrient content and widetemperature fluctuations, the sensors may need to be cleaned andrecalibrated every few days. Your own measurement results are thebest guide to the need to recalibrate.
When a sensor or instrument is new, we recommend checking thereadings often (say, once a day) to get an idea of the stability of thesensor.
Changes in flow also affect readings. Constant flow will increase theaccuracy. This can be achieved with the stirring accessory.
The table below may be used as a very general guideline to how longsensors may be expected to remain in calibration under optimumconditions:
pH, ORP 1-2 monthsConductivity 2-3 monthsD.O. (polarographic) 2-4 weeksD.O. (optical, RDO) up to a year if foil is not damagedISEs 1 day
HOW TO CHECK IF A SENSOR IS STILL IN CALIBRATION
Immerse the sensor in a calibration standard of known value and atthe same temperature as the original calibration. Compare the sensorreading to the solution value. Some drift is to be expected, butgenerally the readings should fall within the sensor’s accuracyspecification. If readings fall outside the accuracy specification by anamount that is not acceptable for your current application,recalibration is recommended. You will quickly learn by experiencehow often you need to recalibrate a given sensor based on usage.
SECTION 10: MONITORING WATER QUALITY: OVERVIEW
TIP: For additional information on calibration schedules,see the Technical Note on Instrument Calibration in theDownloads section at www.in-situ.com.
When you select the sensor . . .
. . . information on the lastcalibration is shown
pH calibration information for a combination pH/ORP sensor in port P1
TIP: Quick Cal solution may be used for a quick check ofpH, ORP, and conductivity. Refer to the values printed onthe label.
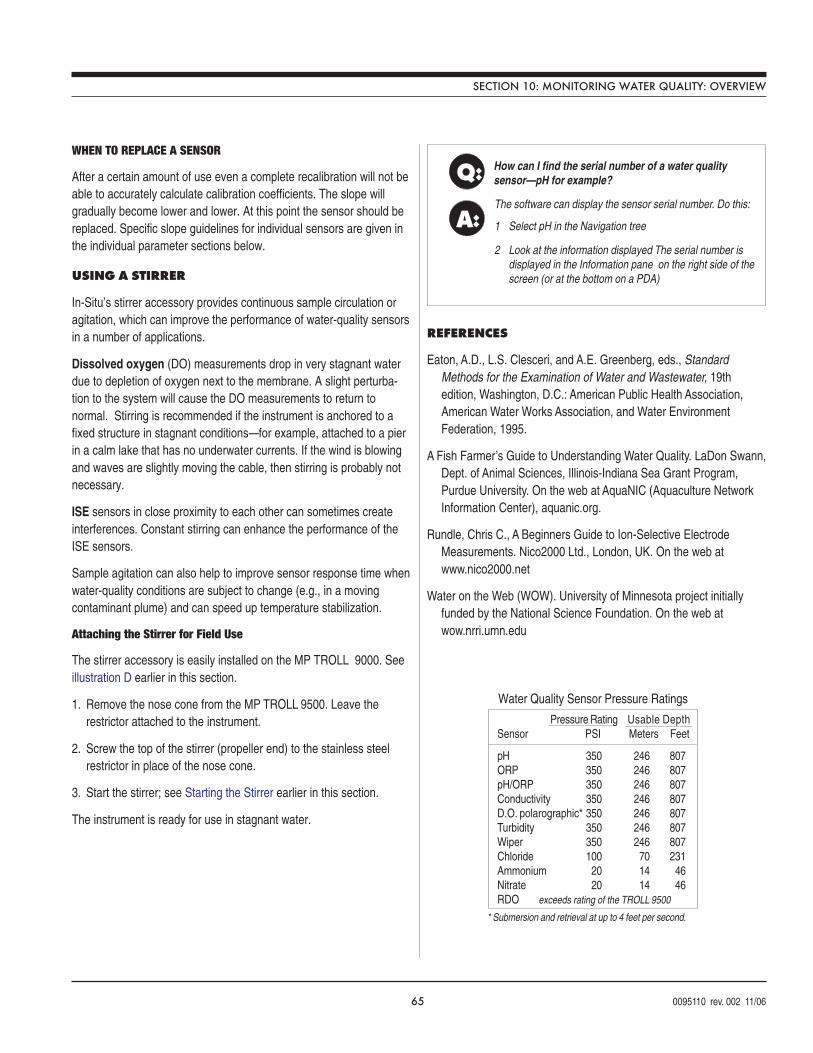
65 0095110 rev. 002 11/06
WHEN TO REPLACE A SENSOR
After a certain amount of use even a complete recalibration will not beable to accurately calculate calibration coefficients. The slope willgradually become lower and lower. At this point the sensor should bereplaced. Specific slope guidelines for individual sensors are given inthe individual parameter sections below.
USING A STIRRER
In-Situ’s stirrer accessory provides continuous sample circulation oragitation, which can improve the performance of water-quality sensorsin a number of applications.
Dissolved oxygen (DO) measurements drop in very stagnant waterdue to depletion of oxygen next to the membrane. A slight perturba-tion to the system will cause the DO measurements to return tonormal. Stirring is recommended if the instrument is anchored to afixed structure in stagnant conditions—for example, attached to a pierin a calm lake that has no underwater currents. If the wind is blowingand waves are slightly moving the cable, then stirring is probably notnecessary.
ISE sensors in close proximity to each other can sometimes createinterferences. Constant stirring can enhance the performance of theISE sensors.
Sample agitation can also help to improve sensor response time whenwater-quality conditions are subject to change (e.g., in a movingcontaminant plume) and can speed up temperature stabilization.
Attaching the Stirrer for Field Use
The stirrer accessory is easily installed on the MP TROLL 9000. Seeillustration D earlier in this section.
1. Remove the nose cone from the MP TROLL 9500. Leave therestrictor attached to the instrument.
2. Screw the top of the stirrer (propeller end) to the stainless steelrestrictor in place of the nose cone.
3. Start the stirrer; see Starting the Stirrer earlier in this section.
The instrument is ready for use in stagnant water.
SECTION 10: MONITORING WATER QUALITY: OVERVIEW
Q:
A:
How can I find the serial number of a water qualitysensor—pH for example?
The software can display the sensor serial number. Do this:
1 Select pH in the Navigation tree
2 Look at the information displayed The serial number isdisplayed in the Information pane on the right side of thescreen (or at the bottom on a PDA)
REFERENCES
Eaton, A.D., L.S. Clesceri, and A.E. Greenberg, eds., StandardMethods for the Examination of Water and Wastewater, 19thedition, Washington, D.C.: American Public Health Association,American Water Works Association, and Water EnvironmentFederation, 1995.
A Fish Farmer’s Guide to Understanding Water Quality. LaDon Swann,Dept. of Animal Sciences, Illinois-Indiana Sea Grant Program,Purdue University. On the web at AquaNIC (Aquaculture NetworkInformation Center), aquanic.org.
Rundle, Chris C., A Beginners Guide to Ion-Selective ElectrodeMeasurements. Nico2000 Ltd., London, UK. On the web atwww.nico2000.net
Water on the Web (WOW). University of Minnesota project initiallyfunded by the National Science Foundation. On the web atwow.nrri.umn.edu
Pressure Rating Usable DepthSensor PSI Meters Feet
pH 350 246 807ORP 350 246 807pH/ORP 350 246 807Conductivity 350 246 807D.O. polarographic* 350 246 807Turbidity 350 246 807Wiper 350 246 807Chloride 100 70 231Ammonium 20 14 46Nitrate 20 14 46RDO exceeds rating of the TROLL 9500
Water Quality Sensor Pressure Ratings
* Submersion and retrieval at up to 4 feet per second.
66 0095110 rev. 002 11/06
Multi-ParameterWater Quality TROLL®
11 pH
Fluid pH units
Acid rain < 5Distilled water 5.6Most natural waters 8Safe for freshwater fish 6-9Properly chlorinated swimming pool 7.2 - 7.6
Typical pH values
WHAT IS pH?
The term pH is derived from “p” meaning power and “H” for theelement hydrogen and literally means “power of hydrogen.” pH isdefined as the negative logarithm of the hydrogen ion activity (orconcentration in moles/liter):
pH = - log [ H+] or [H+] = 10-pH
Water (H2O) dissociates into hydrogen ions (H+) and hydroxide ions
(OH–) in aqueous solution. At 25°C there are 1.0 x 10⁻⁷ moles/L ofhydrogen ions and 1.0 x 10⁻⁷ moles/L of hydroxide ions in pure water.Thus the water is neutral (pH = 7) because there are equal amountsof each ion. Addition of a substance with hydrogen or hydroxide ionswill shift the balance and cause the water to become either acidic orbasic.
The pH scale ranges from 0 (most acidic) to 14 (most basic or leastacidic). A change of 1 pH unit corresponds to a tenfold change inhydrogen ion concentration.
WHY MEASURE pH?
A pH value indicates the amount of hydrogen ion that is present in anaqueous environment. The hydrogen ion concentration gives an indi-cation of the acidity of a substance. pH is an important measurementin natural waters because most chemical and biochemical processesare pH dependent. The physiological chemistry of most living organ-isms can tolerate only small changes in pH and still provide the chemi-
cal reactions that sustain life. The solubility of many chemicals is pHdependent. Thus, pH determines their availability to living organisms.
Natural waters usually have pH values in the range of 4 to 9. Mostnatural waters are slightly basic (~ pH 8) because of the presence ofcarbonates (CO
32–) and bicarbonates (HCO
3–). Extremely fresh water
can even be slightly acidic (~ pH 6), depending on the concentrationof dissolved carbon dioxide (CO
2). The carbon dioxide combines with
water to form a small amount of carbonic acid (H2CO
3) and this
process lowers the pH. Nitrogen oxides (NOx) and sulfur dioxides
(SO2) from automobile exhaust and the burning of coal combine with
water in the atmosphere to form nitric (HNO3) and sulfuric acid
(H2SO
4). This falls to the ground as acid rain and accumulates in
surface water. Runoff from mining spoils and the decomposition ofplant materials can also cause acidic surface water.
pH values below 5 in natural waters are generally considered to betoo acidic. Freshwater fish seem to do well in the pH range of 6 to 9.Acidic drinking water is a concern because of its corrosive characteris-tics to plumbing and appliances. pH also affects the ammonia/ammonium (NH
3/NH
4+) equilibrium in water. Even a small amount of
ammonia is detrimental to fish while a moderate amount of ammo-nium is tolerated. At a pH of 6.5 almost all ammonia is in the form ofammonium. However, as the pH becomes slightly basic, ammonium ischanged into harmful ammonia. The lethal dose of ammonia for troutis only 0.2 mg/L.
THE pH SENSOR
pH electrodes use a potentiometric method to measure the pH of asolution. The pH sensor consists of a pH-sensitive glass whosevoltage is proportional to the hydrogen ion concentration. A secondsensor (electrode) serves as a reference, which supplies a constantstable output. Electrical contact is made with the solution using asaturated potassium chloride (KCl) solution. The electrode behavior isdescribed by the Nernst equation:
Em = E
o + (2.3 RT/nF) log [H+]
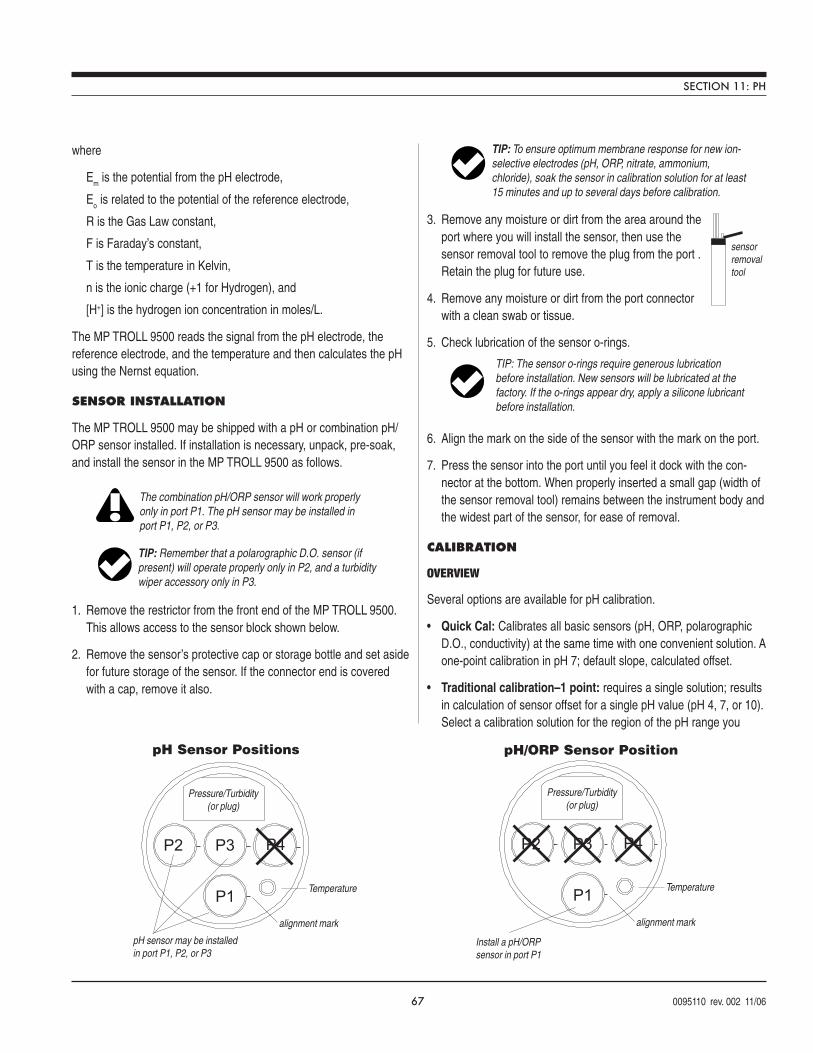
67 0095110 rev. 002 11/06
TIP: Remember that a polarographic D.O. sensor (ifpresent) will operate properly only in P2, and a turbiditywiper accessory only in P3.
The combination pH/ORP sensor will work properlyonly in port P1. The pH sensor may be installed inport P1, P2, or P3.
sensorremovaltool
where
Em is the potential from the pH electrode,
Eo is related to the potential of the reference electrode,
R is the Gas Law constant,
F is Faraday’s constant,
T is the temperature in Kelvin,
n is the ionic charge (+1 for Hydrogen), and
[H+] is the hydrogen ion concentration in moles/L.
The MP TROLL 9500 reads the signal from the pH electrode, thereference electrode, and the temperature and then calculates the pHusing the Nernst equation.
SENSOR INSTALLATION
The MP TROLL 9500 may be shipped with a pH or combination pH/ORP sensor installed. If installation is necessary, unpack, pre-soak,and install the sensor in the MP TROLL 9500 as follows.
1. Remove the restrictor from the front end of the MP TROLL 9500.This allows access to the sensor block shown below.
2. Remove the sensor’s protective cap or storage bottle and set asidefor future storage of the sensor. If the connector end is coveredwith a cap, remove it also.
3. Remove any moisture or dirt from the area around theport where you will install the sensor, then use thesensor removal tool to remove the plug from the port .Retain the plug for future use.
4. Remove any moisture or dirt from the port connectorwith a clean swab or tissue.
5. Check lubrication of the sensor o-rings.
6. Align the mark on the side of the sensor with the mark on the port.
7. Press the sensor into the port until you feel it dock with the con-nector at the bottom. When properly inserted a small gap (width ofthe sensor removal tool) remains between the instrument body andthe widest part of the sensor, for ease of removal.
CALIBRATION
OVERVIEW
Several options are available for pH calibration.
• Quick Cal: Calibrates all basic sensors (pH, ORP, polarographicD.O., conductivity) at the same time with one convenient solution. Aone-point calibration in pH 7; default slope, calculated offset.
• Traditional calibration–1 point: requires a single solution; resultsin calculation of sensor offset for a single pH value (pH 4, 7, or 10).Select a calibration solution for the region of the pH range you
TIP: The sensor o-rings require generous lubricationbefore installation. New sensors will be lubricated at thefactory. If the o-rings appear dry, apply a silicone lubricantbefore installation.
1
2 3 4
Pressure/Turbidity(or plug)
Temperature
Install a pH/ORPsensor in port P1
P1
P2 P3 P4
alignment mark
pH/ORP Sensor Position
1
2 3 4
Pressure/Turbidity(or plug)
Temperature
pH sensor may be installedin port P1, P2, or P3
P1
P2 P3 P4
alignment mark
pH Sensor Positions
SECTION 11: PH
TIP: To ensure optimum membrane response for new ion-selective electrodes (pH, ORP, nitrate, ammonium,chloride), soak the sensor in calibration solution for at least15 minutes and up to several days before calibration.
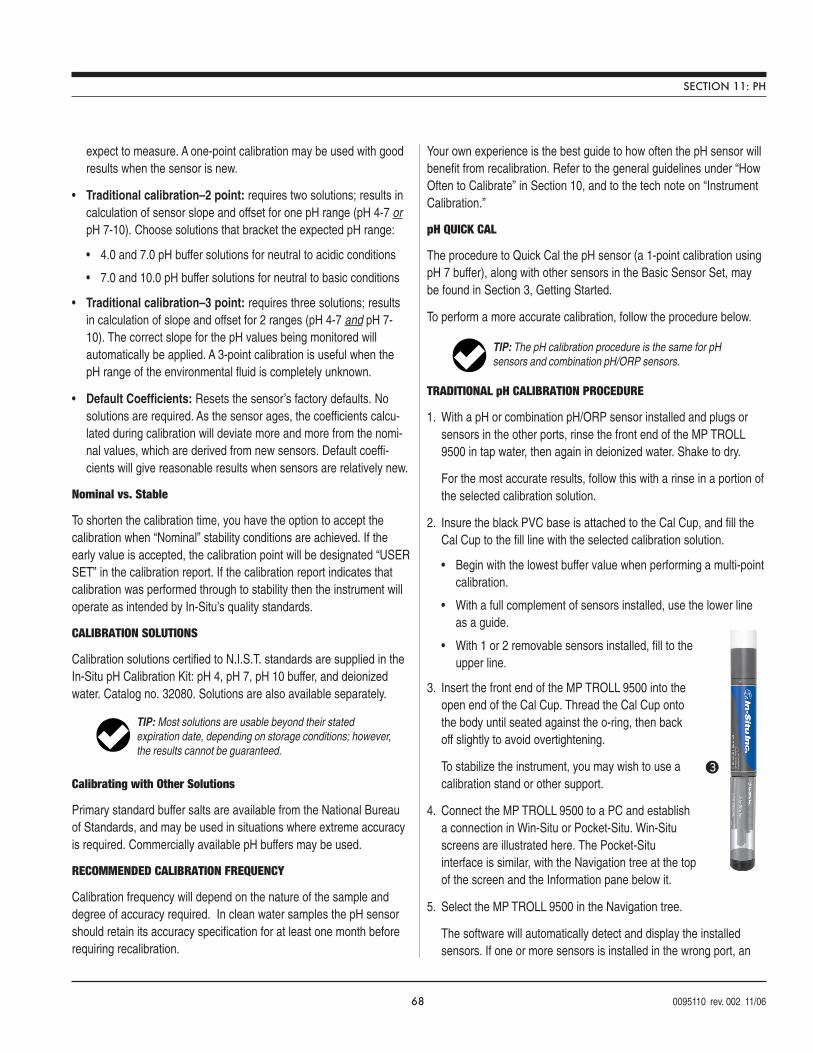
68 0095110 rev. 002 11/06
TIP: Most solutions are usable beyond their statedexpiration date, depending on storage conditions; however,the results cannot be guaranteed.
expect to measure. A one-point calibration may be used with goodresults when the sensor is new.
• Traditional calibration–2 point: requires two solutions; results incalculation of sensor slope and offset for one pH range (pH 4-7 orpH 7-10). Choose solutions that bracket the expected pH range:
• 4.0 and 7.0 pH buffer solutions for neutral to acidic conditions
• 7.0 and 10.0 pH buffer solutions for neutral to basic conditions
• Traditional calibration–3 point: requires three solutions; resultsin calculation of slope and offset for 2 ranges (pH 4-7 and pH 7-10). The correct slope for the pH values being monitored willautomatically be applied. A 3-point calibration is useful when thepH range of the environmental fluid is completely unknown.
• Default Coefficients: Resets the sensor’s factory defaults. Nosolutions are required. As the sensor ages, the coefficients calcu-lated during calibration will deviate more and more from the nomi-nal values, which are derived from new sensors. Default coeffi-cients will give reasonable results when sensors are relatively new.
Nominal vs. Stable
To shorten the calibration time, you have the option to accept thecalibration when “Nominal” stability conditions are achieved. If theearly value is accepted, the calibration point will be designated “USERSET” in the calibration report. If the calibration report indicates thatcalibration was performed through to stability then the instrument willoperate as intended by In-Situ’s quality standards.
CALIBRATION SOLUTIONS
Calibration solutions certified to N.I.S.T. standards are supplied in theIn-Situ pH Calibration Kit: pH 4, pH 7, pH 10 buffer, and deionizedwater. Catalog no. 32080. Solutions are also available separately.
Calibrating with Other Solutions
Primary standard buffer salts are available from the National Bureauof Standards, and may be used in situations where extreme accuracyis required. Commercially available pH buffers may be used.
RECOMMENDED CALIBRATION FREQUENCY
Calibration frequency will depend on the nature of the sample anddegree of accuracy required. In clean water samples the pH sensorshould retain its accuracy specification for at least one month beforerequiring recalibration.
Your own experience is the best guide to how often the pH sensor willbenefit from recalibration. Refer to the general guidelines under “HowOften to Calibrate” in Section 10, and to the tech note on “InstrumentCalibration.”
pH QUICK CAL
The procedure to Quick Cal the pH sensor (a 1-point calibration usingpH 7 buffer), along with other sensors in the Basic Sensor Set, maybe found in Section 3, Getting Started.
To perform a more accurate calibration, follow the procedure below.
TRADITIONAL pH CALIBRATION PROCEDURE
1. With a pH or combination pH/ORP sensor installed and plugs orsensors in the other ports, rinse the front end of the MP TROLL9500 in tap water, then again in deionized water. Shake to dry.
For the most accurate results, follow this with a rinse in a portion ofthe selected calibration solution.
2. Insure the black PVC base is attached to the Cal Cup, and fill theCal Cup to the fill line with the selected calibration solution.
• Begin with the lowest buffer value when performing a multi-pointcalibration.
• With a full complement of sensors installed, use the lower lineas a guide.
• With 1 or 2 removable sensors installed, fill to theupper line.
3. Insert the front end of the MP TROLL 9500 into theopen end of the Cal Cup. Thread the Cal Cup ontothe body until seated against the o-ring, then backoff slightly to avoid overtightening.
To stabilize the instrument, you may wish to use acalibration stand or other support.
4. Connect the MP TROLL 9500 to a PC and establisha connection in Win-Situ or Pocket-Situ. Win-Situscreens are illustrated here. The Pocket-Situinterface is similar, with the Navigation tree at the topof the screen and the Information pane below it.
5. Select the MP TROLL 9500 in the Navigation tree.
The software will automatically detect and display the installedsensors. If one or more sensors is installed in the wrong port, an
TIP: The pH calibration procedure is the same for pHsensors and combination pH/ORP sensors.
SECTION 11: PH
3
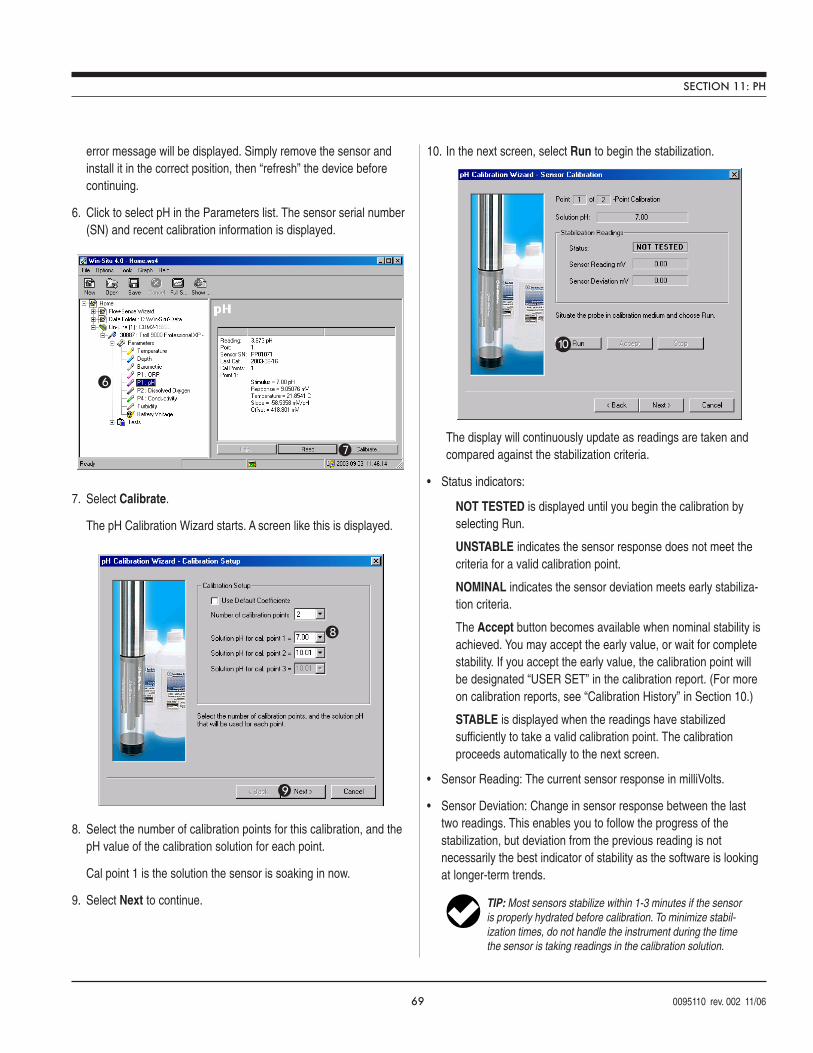
69 0095110 rev. 002 11/06
7
6
10
TIP: Most sensors stabilize within 1-3 minutes if the sensoris properly hydrated before calibration. To minimize stabil-ization times, do not handle the instrument during the timethe sensor is taking readings in the calibration solution.
error message will be displayed. Simply remove the sensor andinstall it in the correct position, then “refresh” the device beforecontinuing.
6. Click to select pH in the Parameters list. The sensor serial number(SN) and recent calibration information is displayed.
7. Select Calibrate.
The pH Calibration Wizard starts. A screen like this is displayed.
8. Select the number of calibration points for this calibration, and thepH value of the calibration solution for each point.
Cal point 1 is the solution the sensor is soaking in now.
9. Select Next to continue.
10. In the next screen, select Run to begin the stabilization.
The display will continuously update as readings are taken andcompared against the stabilization criteria.
• Status indicators:
NOT TESTED is displayed until you begin the calibration byselecting Run.
UNSTABLE indicates the sensor response does not meet thecriteria for a valid calibration point.
NOMINAL indicates the sensor deviation meets early stabiliza-tion criteria.
The Accept button becomes available when nominal stability isachieved. You may accept the early value, or wait for completestability. If you accept the early value, the calibration point willbe designated “USER SET” in the calibration report. (For moreon calibration reports, see “Calibration History” in Section 10.)
STABLE is displayed when the readings have stabilizedsufficiently to take a valid calibration point. The calibrationproceeds automatically to the next screen.
• Sensor Reading: The current sensor response in milliVolts.
• Sensor Deviation: Change in sensor response between the lasttwo readings. This enables you to follow the progress of thestabilization, but deviation from the previous reading is notnecessarily the best indicator of stability as the software is lookingat longer-term trends.
8
9
SECTION 11: PH
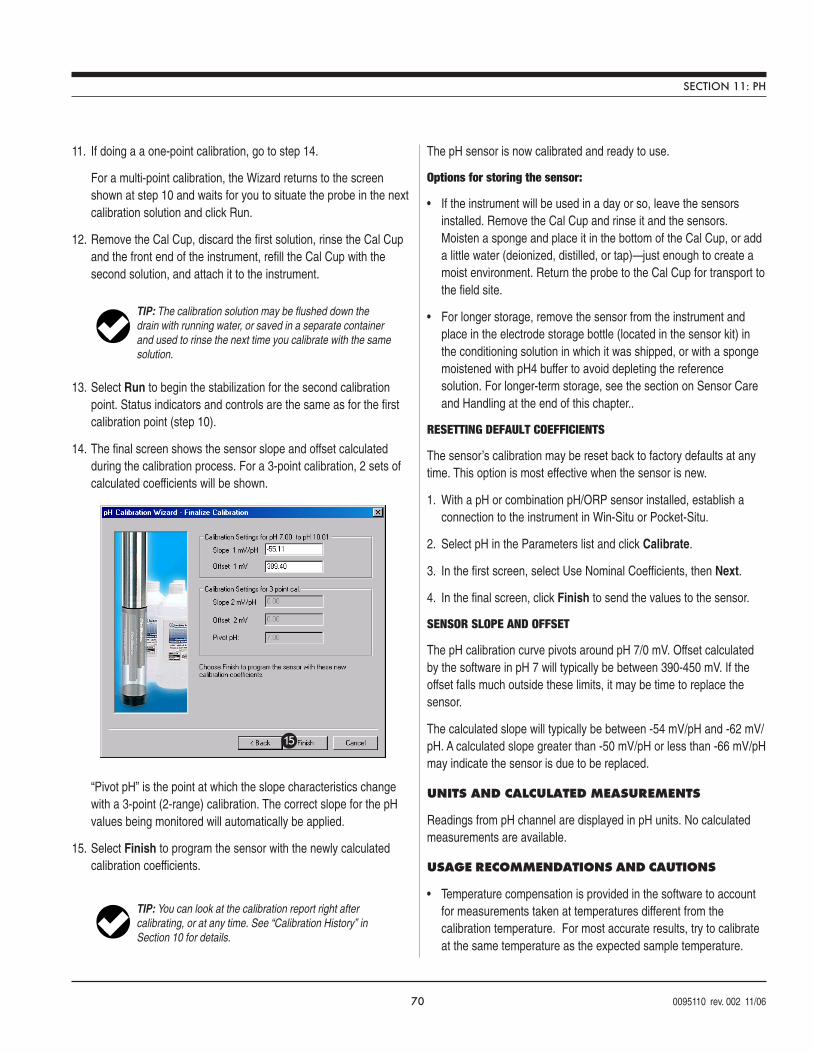
70 0095110 rev. 002 11/06
TIP: The calibration solution may be flushed down thedrain with running water, or saved in a separate containerand used to rinse the next time you calibrate with the samesolution.
11. If doing a a one-point calibration, go to step 14.
For a multi-point calibration, the Wizard returns to the screenshown at step 10 and waits for you to situate the probe in the nextcalibration solution and click Run.
12. Remove the Cal Cup, discard the first solution, rinse the Cal Cupand the front end of the instrument, refill the Cal Cup with thesecond solution, and attach it to the instrument.
13. Select Run to begin the stabilization for the second calibrationpoint. Status indicators and controls are the same as for the firstcalibration point (step 10).
14. The final screen shows the sensor slope and offset calculatedduring the calibration process. For a 3-point calibration, 2 sets ofcalculated coefficients will be shown.
“Pivot pH” is the point at which the slope characteristics changewith a 3-point (2-range) calibration. The correct slope for the pHvalues being monitored will automatically be applied.
15. Select Finish to program the sensor with the newly calculatedcalibration coefficients.
The pH sensor is now calibrated and ready to use.
Options for storing the sensor:
• If the instrument will be used in a day or so, leave the sensorsinstalled. Remove the Cal Cup and rinse it and the sensors.Moisten a sponge and place it in the bottom of the Cal Cup, or adda little water (deionized, distilled, or tap)—just enough to create amoist environment. Return the probe to the Cal Cup for transport tothe field site.
• For longer storage, remove the sensor from the instrument andplace in the electrode storage bottle (located in the sensor kit) inthe conditioning solution in which it was shipped, or with a spongemoistened with pH4 buffer to avoid depleting the referencesolution. For longer-term storage, see the section on Sensor Careand Handling at the end of this chapter..
RESETTING DEFAULT COEFFICIENTS
The sensor’s calibration may be reset back to factory defaults at anytime. This option is most effective when the sensor is new.
1. With a pH or combination pH/ORP sensor installed, establish aconnection to the instrument in Win-Situ or Pocket-Situ.
2. Select pH in the Parameters list and click Calibrate.
3. In the first screen, select Use Nominal Coefficients, then Next.
4. In the final screen, click Finish to send the values to the sensor.
SENSOR SLOPE AND OFFSET
The pH calibration curve pivots around pH 7/0 mV. Offset calculatedby the software in pH 7 will typically be between 390-450 mV. If theoffset falls much outside these limits, it may be time to replace thesensor.
The calculated slope will typically be between -54 mV/pH and -62 mV/pH. A calculated slope greater than -50 mV/pH or less than -66 mV/pHmay indicate the sensor is due to be replaced.
UNITS AND CALCULATED MEASUREMENTS
Readings from pH channel are displayed in pH units. No calculatedmeasurements are available.
USAGE RECOMMENDATIONS AND CAUTIONS
• Temperature compensation is provided in the software to accountfor measurements taken at temperatures different from thecalibration temperature. For most accurate results, try to calibrateat the same temperature as the expected sample temperature.
TIP: You can look at the calibration report right aftercalibrating, or at any time. See “Calibration History” inSection 10 for details.
15
SECTION 11: PH
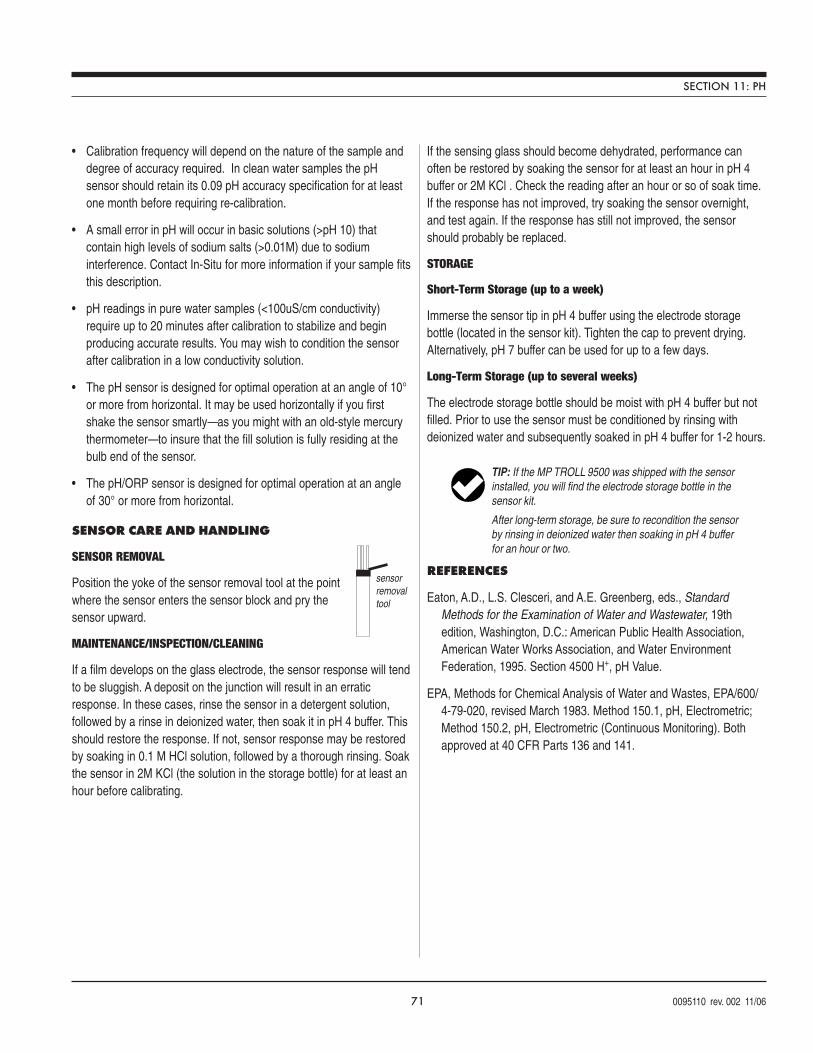
71 0095110 rev. 002 11/06
sensorremovaltool
• Calibration frequency will depend on the nature of the sample anddegree of accuracy required. In clean water samples the pHsensor should retain its 0.09 pH accuracy specification for at leastone month before requiring re-calibration.
• A small error in pH will occur in basic solutions (>pH 10) thatcontain high levels of sodium salts (>0.01M) due to sodiuminterference. Contact In-Situ for more information if your sample fitsthis description.
• pH readings in pure water samples (<100uS/cm conductivity)require up to 20 minutes after calibration to stabilize and beginproducing accurate results. You may wish to condition the sensorafter calibration in a low conductivity solution.
• The pH sensor is designed for optimal operation at an angle of 10°or more from horizontal. It may be used horizontally if you firstshake the sensor smartly—as you might with an old-style mercurythermometer—to insure that the fill solution is fully residing at thebulb end of the sensor.
• The pH/ORP sensor is designed for optimal operation at an angleof 30° or more from horizontal.
SENSOR CARE AND HANDLING
SENSOR REMOVAL
Position the yoke of the sensor removal tool at the pointwhere the sensor enters the sensor block and pry thesensor upward.
MAINTENANCE/INSPECTION/CLEANING
If a film develops on the glass electrode, the sensor response will tendto be sluggish. A deposit on the junction will result in an erraticresponse. In these cases, rinse the sensor in a detergent solution,followed by a rinse in deionized water, then soak it in pH 4 buffer. Thisshould restore the response. If not, sensor response may be restoredby soaking in 0.1 M HCl solution, followed by a thorough rinsing. Soakthe sensor in 2M KCl (the solution in the storage bottle) for at least anhour before calibrating.
If the sensing glass should become dehydrated, performance canoften be restored by soaking the sensor for at least an hour in pH 4buffer or 2M KCl . Check the reading after an hour or so of soak time.If the response has not improved, try soaking the sensor overnight,and test again. If the response has still not improved, the sensorshould probably be replaced.
STORAGE
Short-Term Storage (up to a week)
Immerse the sensor tip in pH 4 buffer using the electrode storagebottle (located in the sensor kit). Tighten the cap to prevent drying.Alternatively, pH 7 buffer can be used for up to a few days.
Long-Term Storage (up to several weeks)
The electrode storage bottle should be moist with pH 4 buffer but notfilled. Prior to use the sensor must be conditioned by rinsing withdeionized water and subsequently soaked in pH 4 buffer for 1-2 hours.
REFERENCES
Eaton, A.D., L.S. Clesceri, and A.E. Greenberg, eds., StandardMethods for the Examination of Water and Wastewater, 19thedition, Washington, D.C.: American Public Health Association,American Water Works Association, and Water EnvironmentFederation, 1995. Section 4500 H+, pH Value.
EPA, Methods for Chemical Analysis of Water and Wastes, EPA/600/4-79-020, revised March 1983. Method 150.1, pH, Electrometric;Method 150.2, pH, Electrometric (Continuous Monitoring). Bothapproved at 40 CFR Parts 136 and 141.
TIP: If the MP TROLL 9500 was shipped with the sensorinstalled, you will find the electrode storage bottle in thesensor kit.
After long-term storage, be sure to recondition the sensorby rinsing in deionized water then soaking in pH 4 bufferfor an hour or two.
SECTION 11: PH
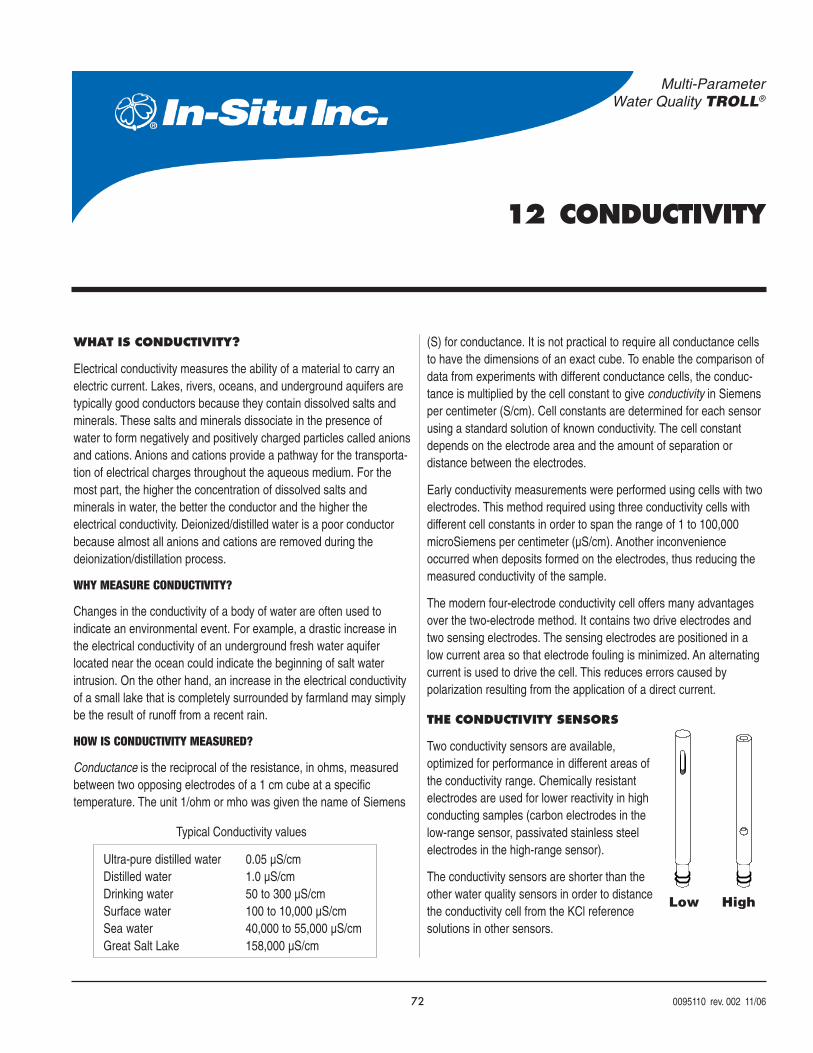
72 0095110 rev. 002 11/06
Multi-ParameterWater Quality TROLL®
12 CONDUCTIVITY
Ultra-pure distilled water 0.05 µS/cmDistilled water 1.0 µS/cmDrinking water 50 to 300 µS/cmSurface water 100 to 10,000 µS/cmSea water 40,000 to 55,000 µS/cmGreat Salt Lake 158,000 µS/cm
Typical Conductivity values
WHAT IS CONDUCTIVITY?
Electrical conductivity measures the ability of a material to carry anelectric current. Lakes, rivers, oceans, and underground aquifers aretypically good conductors because they contain dissolved salts andminerals. These salts and minerals dissociate in the presence ofwater to form negatively and positively charged particles called anionsand cations. Anions and cations provide a pathway for the transporta-tion of electrical charges throughout the aqueous medium. For themost part, the higher the concentration of dissolved salts andminerals in water, the better the conductor and the higher theelectrical conductivity. Deionized/distilled water is a poor conductorbecause almost all anions and cations are removed during thedeionization/distillation process.
WHY MEASURE CONDUCTIVITY?
Changes in the conductivity of a body of water are often used toindicate an environmental event. For example, a drastic increase inthe electrical conductivity of an underground fresh water aquiferlocated near the ocean could indicate the beginning of salt waterintrusion. On the other hand, an increase in the electrical conductivityof a small lake that is completely surrounded by farmland may simplybe the result of runoff from a recent rain.
HOW IS CONDUCTIVITY MEASURED?
Conductance is the reciprocal of the resistance, in ohms, measuredbetween two opposing electrodes of a 1 cm cube at a specifictemperature. The unit 1/ohm or mho was given the name of Siemens
(S) for conductance. It is not practical to require all conductance cellsto have the dimensions of an exact cube. To enable the comparison ofdata from experiments with different conductance cells, the conduc-tance is multiplied by the cell constant to give conductivity in Siemensper centimeter (S/cm). Cell constants are determined for each sensorusing a standard solution of known conductivity. The cell constantdepends on the electrode area and the amount of separation ordistance between the electrodes.
Early conductivity measurements were performed using cells with twoelectrodes. This method required using three conductivity cells withdifferent cell constants in order to span the range of 1 to 100,000microSiemens per centimeter (µS/cm). Another inconvenienceoccurred when deposits formed on the electrodes, thus reducing themeasured conductivity of the sample.
The modern four-electrode conductivity cell offers many advantagesover the two-electrode method. It contains two drive electrodes andtwo sensing electrodes. The sensing electrodes are positioned in alow current area so that electrode fouling is minimized. An alternatingcurrent is used to drive the cell. This reduces errors caused bypolarization resulting from the application of a direct current.
THE CONDUCTIVITY SENSORS
Two conductivity sensors are available,optimized for performance in different areas ofthe conductivity range. Chemically resistantelectrodes are used for lower reactivity in highconducting samples (carbon electrodes in thelow-range sensor, passivated stainless steelelectrodes in the high-range sensor).
The conductivity sensors are shorter than theother water quality sensors in order to distancethe conductivity cell from the KCl referencesolutions in other sensors.
Low High
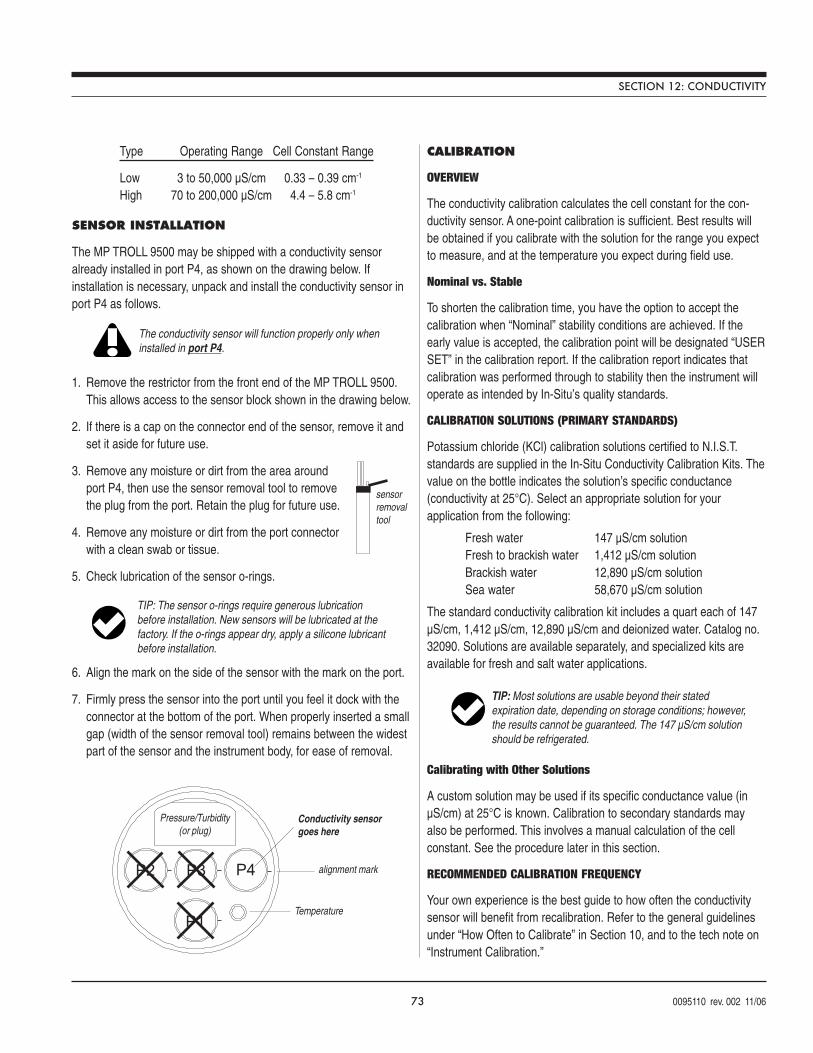
73 0095110 rev. 002 11/06
Type Operating Range Cell Constant Range
Low 3 to 50,000 µS/cm 0.33 – 0.39 cm-1
High 70 to 200,000 µS/cm 4.4 – 5.8 cm-1
SENSOR INSTALLATION
The MP TROLL 9500 may be shipped with a conductivity sensoralready installed in port P4, as shown on the drawing below. Ifinstallation is necessary, unpack and install the conductivity sensor inport P4 as follows.
1. Remove the restrictor from the front end of the MP TROLL 9500.This allows access to the sensor block shown in the drawing below.
2. If there is a cap on the connector end of the sensor, remove it andset it aside for future use.
3. Remove any moisture or dirt from the area aroundport P4, then use the sensor removal tool to removethe plug from the port. Retain the plug for future use.
4. Remove any moisture or dirt from the port connectorwith a clean swab or tissue.
5. Check lubrication of the sensor o-rings.
6. Align the mark on the side of the sensor with the mark on the port.
7. Firmly press the sensor into the port until you feel it dock with theconnector at the bottom of the port. When properly inserted a smallgap (width of the sensor removal tool) remains between the widestpart of the sensor and the instrument body, for ease of removal.
CALIBRATION
OVERVIEW
The conductivity calibration calculates the cell constant for the con-ductivity sensor. A one-point calibration is sufficient. Best results willbe obtained if you calibrate with the solution for the range you expectto measure, and at the temperature you expect during field use.
Nominal vs. Stable
To shorten the calibration time, you have the option to accept thecalibration when “Nominal” stability conditions are achieved. If theearly value is accepted, the calibration point will be designated “USERSET” in the calibration report. If the calibration report indicates thatcalibration was performed through to stability then the instrument willoperate as intended by In-Situ’s quality standards.
CALIBRATION SOLUTIONS (PRIMARY STANDARDS)
Potassium chloride (KCl) calibration solutions certified to N.I.S.T.standards are supplied in the In-Situ Conductivity Calibration Kits. Thevalue on the bottle indicates the solution’s specific conductance(conductivity at 25°C). Select an appropriate solution for yourapplication from the following:
Fresh water 147 µS/cm solutionFresh to brackish water 1,412 µS/cm solutionBrackish water 12,890 µS/cm solutionSea water 58,670 µS/cm solution
The standard conductivity calibration kit includes a quart each of 147µS/cm, 1,412 µS/cm, 12,890 µS/cm and deionized water. Catalog no.32090. Solutions are available separately, and specialized kits areavailable for fresh and salt water applications.
Calibrating with Other Solutions
A custom solution may be used if its specific conductance value (inµS/cm) at 25°C is known. Calibration to secondary standards mayalso be performed. This involves a manual calculation of the cellconstant. See the procedure later in this section.
RECOMMENDED CALIBRATION FREQUENCY
Your own experience is the best guide to how often the conductivitysensor will benefit from recalibration. Refer to the general guidelinesunder “How Often to Calibrate” in Section 10, and to the tech note on“Instrument Calibration.”
The conductivity sensor will function properly only wheninstalled in port P4.
sensorremovaltool
TIP: Most solutions are usable beyond their statedexpiration date, depending on storage conditions; however,the results cannot be guaranteed. The 147 µS/cm solutionshould be refrigerated.
TIP: The sensor o-rings require generous lubricationbefore installation. New sensors will be lubricated at thefactory. If the o-rings appear dry, apply a silicone lubricantbefore installation.
SECTION 12: CONDUCTIVITY
1
2 3 4
Conductivity sensorgoes here
Pressure/Turbidity(or plug)
TemperatureP1
P2 P3 P4 alignment mark
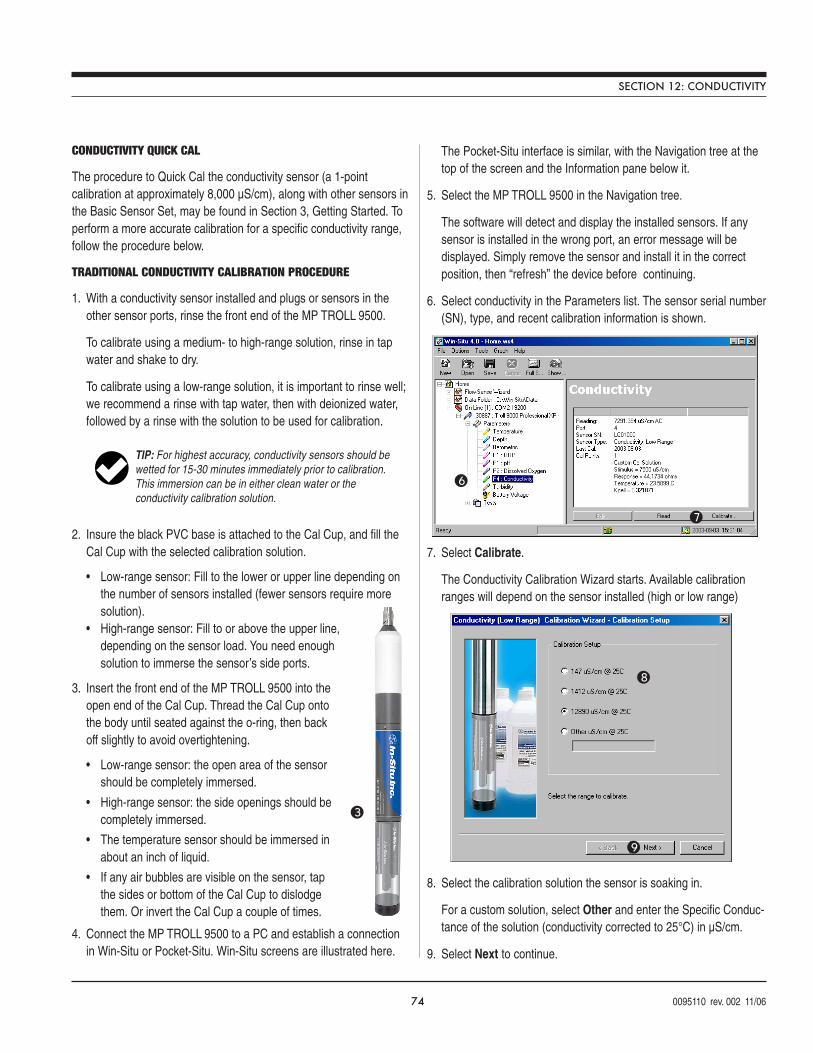
74 0095110 rev. 002 11/06
CONDUCTIVITY QUICK CAL
The procedure to Quick Cal the conductivity sensor (a 1-pointcalibration at approximately 8,000 µS/cm), along with other sensors inthe Basic Sensor Set, may be found in Section 3, Getting Started. Toperform a more accurate calibration for a specific conductivity range,follow the procedure below.
TRADITIONAL CONDUCTIVITY CALIBRATION PROCEDURE
1. With a conductivity sensor installed and plugs or sensors in theother sensor ports, rinse the front end of the MP TROLL 9500.
To calibrate using a medium- to high-range solution, rinse in tapwater and shake to dry.
To calibrate using a low-range solution, it is important to rinse well;we recommend a rinse with tap water, then with deionized water,followed by a rinse with the solution to be used for calibration.
2. Insure the black PVC base is attached to the Cal Cup, and fill theCal Cup with the selected calibration solution.
• Low-range sensor: Fill to the lower or upper line depending onthe number of sensors installed (fewer sensors require moresolution).
• High-range sensor: Fill to or above the upper line,depending on the sensor load. You need enoughsolution to immerse the sensor’s side ports.
3. Insert the front end of the MP TROLL 9500 into theopen end of the Cal Cup. Thread the Cal Cup ontothe body until seated against the o-ring, then backoff slightly to avoid overtightening.
• Low-range sensor: the open area of the sensorshould be completely immersed.
• High-range sensor: the side openings should becompletely immersed.
• The temperature sensor should be immersed inabout an inch of liquid.
• If any air bubbles are visible on the sensor, tapthe sides or bottom of the Cal Cup to dislodgethem. Or invert the Cal Cup a couple of times.
4. Connect the MP TROLL 9500 to a PC and establish a connectionin Win-Situ or Pocket-Situ. Win-Situ screens are illustrated here.
The Pocket-Situ interface is similar, with the Navigation tree at thetop of the screen and the Information pane below it.
5. Select the MP TROLL 9500 in the Navigation tree.
The software will detect and display the installed sensors. If anysensor is installed in the wrong port, an error message will bedisplayed. Simply remove the sensor and install it in the correctposition, then “refresh” the device before continuing.
6. Select conductivity in the Parameters list. The sensor serial number(SN), type, and recent calibration information is shown.
7. Select Calibrate.
The Conductivity Calibration Wizard starts. Available calibrationranges will depend on the sensor installed (high or low range)
8. Select the calibration solution the sensor is soaking in.
For a custom solution, select Other and enter the Specific Conduc-tance of the solution (conductivity corrected to 25°C) in µS/cm.
9. Select Next to continue.
7
6
8
9
SECTION 12: CONDUCTIVITY
TIP: For highest accuracy, conductivity sensors should bewetted for 15-30 minutes immediately prior to calibration.This immersion can be in either clean water or theconductivity calibration solution.
3
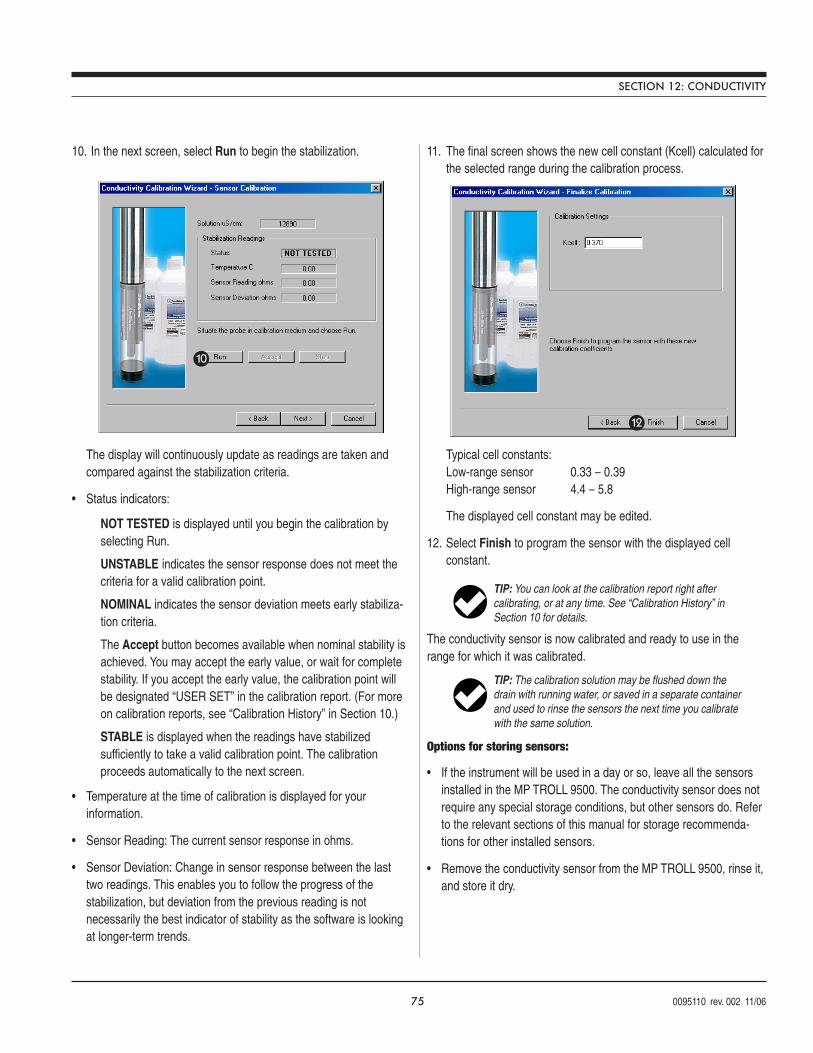
75 0095110 rev. 002 11/06
10. In the next screen, select Run to begin the stabilization.
The display will continuously update as readings are taken andcompared against the stabilization criteria.
• Status indicators:
NOT TESTED is displayed until you begin the calibration byselecting Run.
UNSTABLE indicates the sensor response does not meet thecriteria for a valid calibration point.
NOMINAL indicates the sensor deviation meets early stabiliza-tion criteria.
The Accept button becomes available when nominal stability isachieved. You may accept the early value, or wait for completestability. If you accept the early value, the calibration point willbe designated “USER SET” in the calibration report. (For moreon calibration reports, see “Calibration History” in Section 10.)
STABLE is displayed when the readings have stabilizedsufficiently to take a valid calibration point. The calibrationproceeds automatically to the next screen.
• Temperature at the time of calibration is displayed for yourinformation.
• Sensor Reading: The current sensor response in ohms.
• Sensor Deviation: Change in sensor response between the lasttwo readings. This enables you to follow the progress of thestabilization, but deviation from the previous reading is notnecessarily the best indicator of stability as the software is lookingat longer-term trends.
11. The final screen shows the new cell constant (Kcell) calculated forthe selected range during the calibration process.
Typical cell constants:Low-range sensor 0.33 – 0.39High-range sensor 4.4 – 5.8
The displayed cell constant may be edited.
12. Select Finish to program the sensor with the displayed cellconstant.
The conductivity sensor is now calibrated and ready to use in therange for which it was calibrated.
Options for storing sensors:
• If the instrument will be used in a day or so, leave all the sensorsinstalled in the MP TROLL 9500. The conductivity sensor does notrequire any special storage conditions, but other sensors do. Referto the relevant sections of this manual for storage recommenda-tions for other installed sensors.
• Remove the conductivity sensor from the MP TROLL 9500, rinse it,and store it dry.
TIP: The calibration solution may be flushed down thedrain with running water, or saved in a separate containerand used to rinse the sensors the next time you calibratewith the same solution.
TIP: You can look at the calibration report right aftercalibrating, or at any time. See “Calibration History” inSection 10 for details.
12
10
SECTION 12: CONDUCTIVITY
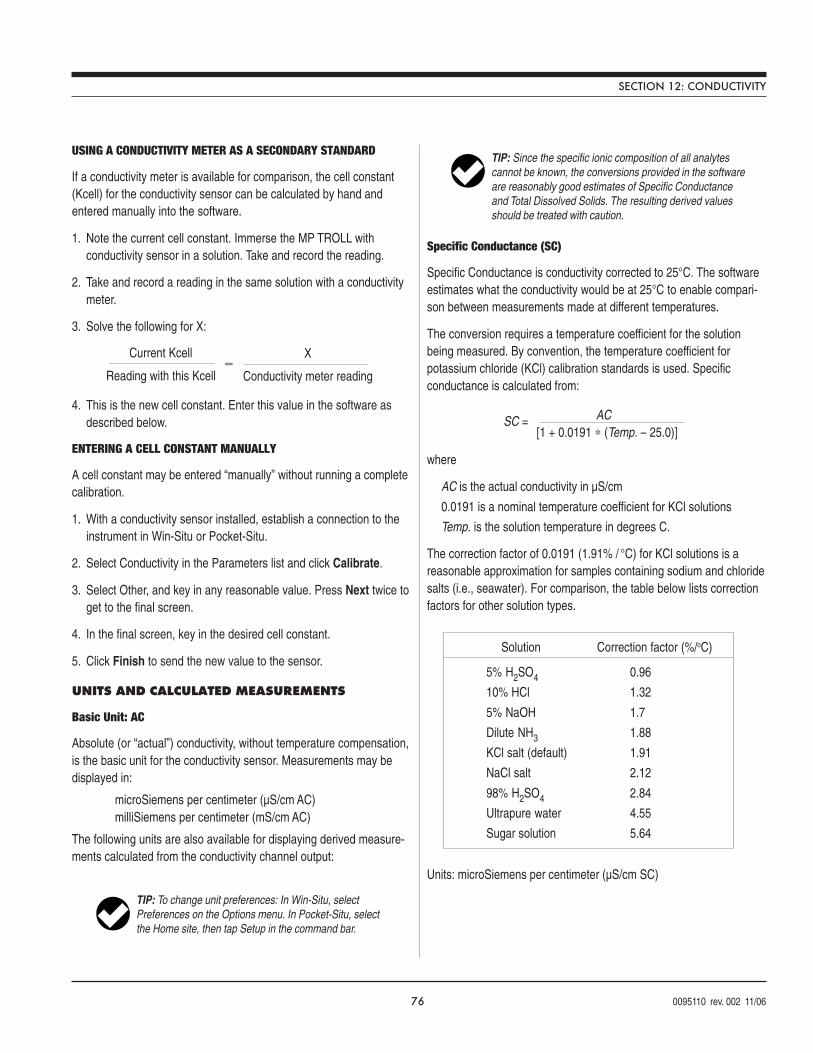
76 0095110 rev. 002 11/06
USING A CONDUCTIVITY METER AS A SECONDARY STANDARD
If a conductivity meter is available for comparison, the cell constant(Kcell) for the conductivity sensor can be calculated by hand andentered manually into the software.
1. Note the current cell constant. Immerse the MP TROLL withconductivity sensor in a solution. Take and record the reading.
2. Take and record a reading in the same solution with a conductivitymeter.
3. Solve the following for X:
4. This is the new cell constant. Enter this value in the software asdescribed below.
ENTERING A CELL CONSTANT MANUALLY
A cell constant may be entered “manually” without running a completecalibration.
1. With a conductivity sensor installed, establish a connection to theinstrument in Win-Situ or Pocket-Situ.
2. Select Conductivity in the Parameters list and click Calibrate.
3. Select Other, and key in any reasonable value. Press Next twice toget to the final screen.
4. In the final screen, key in the desired cell constant.
5. Click Finish to send the new value to the sensor.
UNITS AND CALCULATED MEASUREMENTS
Basic Unit: AC
Absolute (or “actual”) conductivity, without temperature compensation,is the basic unit for the conductivity sensor. Measurements may bedisplayed in:
microSiemens per centimeter (µS/cm AC)milliSiemens per centimeter (mS/cm AC)
The following units are also available for displaying derived measure-ments calculated from the conductivity channel output:
Specific Conductance (SC)
Specific Conductance is conductivity corrected to 25°C. The softwareestimates what the conductivity would be at 25°C to enable compari-son between measurements made at different temperatures.
The conversion requires a temperature coefficient for the solutionbeing measured. By convention, the temperature coefficient forpotassium chloride (KCl) calibration standards is used. Specificconductance is calculated from:
where
AC is the actual conductivity in µS/cm
0.0191 is a nominal temperature coefficient for KCl solutions
Temp. is the solution temperature in degrees C.
The correction factor of 0.0191 (1.91% / °C) for KCl solutions is areasonable approximation for samples containing sodium and chloridesalts (i.e., seawater). For comparison, the table below lists correctionfactors for other solution types.
Units: microSiemens per centimeter (µS/cm SC)
Current Kcell
Reading with this Kcell
X
Conductivity meter reading=
AC [1 + 0.0191 ∗ (Temp. – 25.0)]
SC =
Solution Correction factor (%/oC)
5% H2SO4 0.96
10% HCl 1.32
5% NaOH 1.7
Dilute NH3 1.88
KCl salt (default) 1.91
NaCl salt 2.12
98% H2SO4 2.84
Ultrapure water 4.55
Sugar solution 5.64
SECTION 12: CONDUCTIVITY
TIP: To change unit preferences: In Win-Situ, selectPreferences on the Options menu. In Pocket-Situ, selectthe Home site, then tap Setup in the command bar.
TIP: Since the specific ionic composition of all analytescannot be known, the conversions provided in the softwareare reasonably good estimates of Specific Conductanceand Total Dissolved Solids. The resulting derived valuesshould be treated with caution.
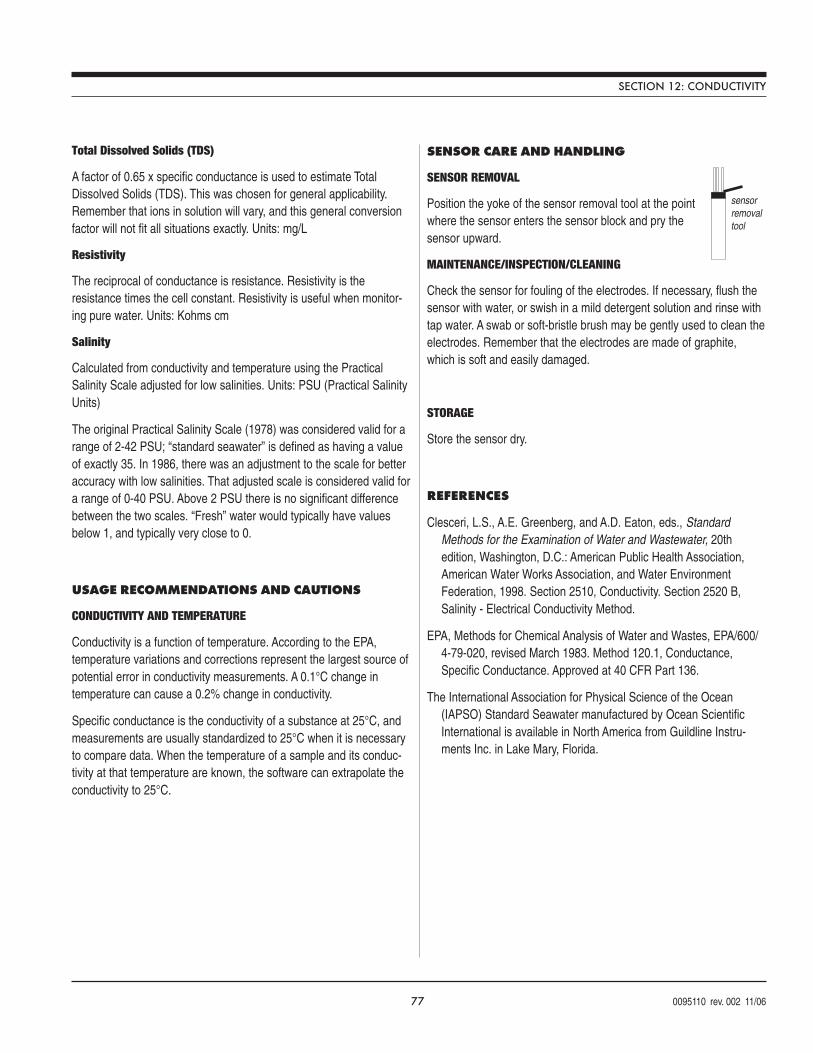
77 0095110 rev. 002 11/06
Total Dissolved Solids (TDS)
A factor of 0.65 x specific conductance is used to estimate TotalDissolved Solids (TDS). This was chosen for general applicability.Remember that ions in solution will vary, and this general conversionfactor will not fit all situations exactly. Units: mg/L
Resistivity
The reciprocal of conductance is resistance. Resistivity is theresistance times the cell constant. Resistivity is useful when monitor-ing pure water. Units: Kohms cm
Salinity
Calculated from conductivity and temperature using the PracticalSalinity Scale adjusted for low salinities. Units: PSU (Practical SalinityUnits)
The original Practical Salinity Scale (1978) was considered valid for arange of 2-42 PSU; “standard seawater” is defined as having a valueof exactly 35. In 1986, there was an adjustment to the scale for betteraccuracy with low salinities. That adjusted scale is considered valid fora range of 0-40 PSU. Above 2 PSU there is no significant differencebetween the two scales. “Fresh” water would typically have valuesbelow 1, and typically very close to 0.
USAGE RECOMMENDATIONS AND CAUTIONS
CONDUCTIVITY AND TEMPERATURE
Conductivity is a function of temperature. According to the EPA,temperature variations and corrections represent the largest source ofpotential error in conductivity measurements. A 0.1°C change intemperature can cause a 0.2% change in conductivity.
Specific conductance is the conductivity of a substance at 25°C, andmeasurements are usually standardized to 25°C when it is necessaryto compare data. When the temperature of a sample and its conduc-tivity at that temperature are known, the software can extrapolate theconductivity to 25°C.
sensorremovaltool
SENSOR CARE AND HANDLING
SENSOR REMOVAL
Position the yoke of the sensor removal tool at the pointwhere the sensor enters the sensor block and pry thesensor upward.
MAINTENANCE/INSPECTION/CLEANING
Check the sensor for fouling of the electrodes. If necessary, flush thesensor with water, or swish in a mild detergent solution and rinse withtap water. A swab or soft-bristle brush may be gently used to clean theelectrodes. Remember that the electrodes are made of graphite,which is soft and easily damaged.
STORAGE
Store the sensor dry.
REFERENCES
Clesceri, L.S., A.E. Greenberg, and A.D. Eaton, eds., StandardMethods for the Examination of Water and Wastewater, 20thedition, Washington, D.C.: American Public Health Association,American Water Works Association, and Water EnvironmentFederation, 1998. Section 2510, Conductivity. Section 2520 B,Salinity - Electrical Conductivity Method.
EPA, Methods for Chemical Analysis of Water and Wastes, EPA/600/4-79-020, revised March 1983. Method 120.1, Conductance,Specific Conductance. Approved at 40 CFR Part 136.
The International Association for Physical Science of the Ocean(IAPSO) Standard Seawater manufactured by Ocean ScientificInternational is available in North America from Guildline Instru-ments Inc. in Lake Mary, Florida.
SECTION 12: CONDUCTIVITY
78 0095110 rev. 002 11/06
Multi-ParameterWater Quality TROLL®
13 DISSOLVED OXYGEN
WHAT IS DISSOLVED OXYGEN?
The amount of dissolved oxygen (D.O.) in both natural water andwastewater is a function of several parameters. D.O. is highlydependent on temperature and atmospheric pressure. An increase intemperature causes a decrease in the amount of oxygen that candissolve in water. On the other hand, higher atmospheric pressuresresult in higher D.O. values. Salinity is also a factor. Oxygen solubilityis greater in freshwater than in saltwater. There are also chemical andbiochemical processes that affect D.O.
Most of the dissolved oxygen in water comes from the atmosphere,but oxygen from the photosynthesis of aquatic plants is also a keysource. D.O. levels in lakes and other surface water will actually followa cyclic or diurnal pattern over the course of a day, rising and falling aslight intensity changes from dawn to dusk.
WHY MEASURE DISSOLVED OXYGEN?
Most aquatic life requires an average D.O. value greater than 5.0milligrams dissolved oxygen per liter of water (mg/L) in order tosurvive. Although the amount of dissolved oxygen in a body of waterfluctuates due to natural processes, large deviations from the normare usually a result of human activity. Changes in D.O. levels areusually the result of a buildup in organic waste. Organic waste canenter surface water from sewage treatment facilities, runoff fromagricultural feed lots or domestic areas and from industrial discharge.Organic wastes often contain nitrates and phosphates. Nitrates and
100% DO, 0°C, 1 atm, 0 ppm Chlorine* 14.6 mg/L100% DO, 20°C, 1 atm, 0 ppm Chlorine 9.09 mg/L100% DO, 0°C, 0.75 atm, 0 ppm Chlorine 6.77 mg/L100% DO, 20°C, 1 atm, 20 ppm Chlorine 7.35 mg/LSafe level for most aquatic life > 5.0 mg/L* representative of solute concentration
Typical D.O. values
phosphates are nutrients for aquatic plants and algae, stimulatingoverproduction when present in excessive levels. Accelerated growthof blooms increase the number of photosynthesizing plants, whichtemporarily increases the amount of dissolved oxygen. Howeversubmerged aquatic vegetation eventually experience a reduction insunlight due to increased coverage on the surface. This decrease insunlight leads to a reduction in photosynthesis and eventual death.Bacterial processes take over and consume even more dissolvedoxygen. Fish and other aquatic species die due to lack of dissolvedoxygen. This tragic process is known as eutrophication.
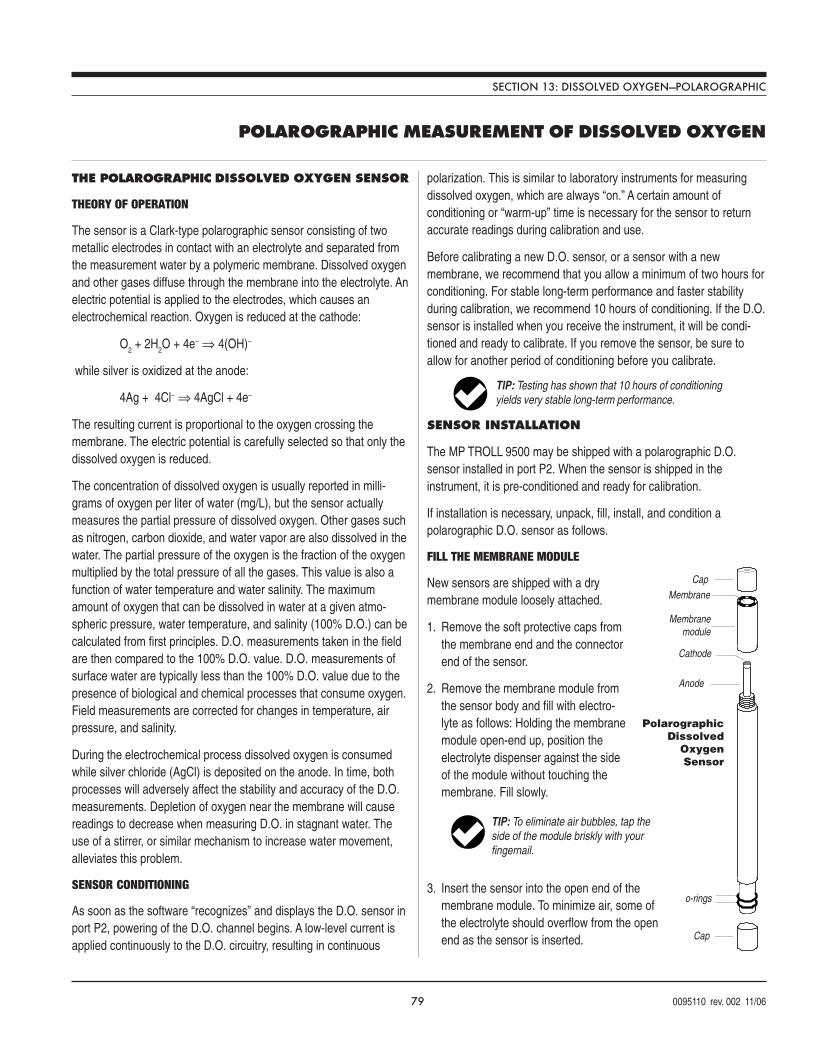
79 0095110 rev. 002 11/06
THE POLAROGRAPHIC DISSOLVED OXYGEN SENSOR
THEORY OF OPERATION
The sensor is a Clark-type polarographic sensor consisting of twometallic electrodes in contact with an electrolyte and separated fromthe measurement water by a polymeric membrane. Dissolved oxygenand other gases diffuse through the membrane into the electrolyte. Anelectric potential is applied to the electrodes, which causes anelectrochemical reaction. Oxygen is reduced at the cathode:
O2 + 2H
2O + 4e– ⇒ 4(OH)–
while silver is oxidized at the anode:
4Ag + 4Cl– ⇒ 4AgCl + 4e–
The resulting current is proportional to the oxygen crossing themembrane. The electric potential is carefully selected so that only thedissolved oxygen is reduced.
The concentration of dissolved oxygen is usually reported in milli-grams of oxygen per liter of water (mg/L), but the sensor actuallymeasures the partial pressure of dissolved oxygen. Other gases suchas nitrogen, carbon dioxide, and water vapor are also dissolved in thewater. The partial pressure of the oxygen is the fraction of the oxygenmultiplied by the total pressure of all the gases. This value is also afunction of water temperature and water salinity. The maximumamount of oxygen that can be dissolved in water at a given atmo-spheric pressure, water temperature, and salinity (100% D.O.) can becalculated from first principles. D.O. measurements taken in the fieldare then compared to the 100% D.O. value. D.O. measurements ofsurface water are typically less than the 100% D.O. value due to thepresence of biological and chemical processes that consume oxygen.Field measurements are corrected for changes in temperature, airpressure, and salinity.
During the electrochemical process dissolved oxygen is consumedwhile silver chloride (AgCl) is deposited on the anode. In time, bothprocesses will adversely affect the stability and accuracy of the D.O.measurements. Depletion of oxygen near the membrane will causereadings to decrease when measuring D.O. in stagnant water. Theuse of a stirrer, or similar mechanism to increase water movement,alleviates this problem.
SENSOR CONDITIONING
As soon as the software “recognizes” and displays the D.O. sensor inport P2, powering of the D.O. channel begins. A low-level current isapplied continuously to the D.O. circuitry, resulting in continuous
polarization. This is similar to laboratory instruments for measuringdissolved oxygen, which are always “on.” A certain amount ofconditioning or “warm-up” time is necessary for the sensor to returnaccurate readings during calibration and use.
Before calibrating a new D.O. sensor, or a sensor with a newmembrane, we recommend that you allow a minimum of two hours forconditioning. For stable long-term performance and faster stabilityduring calibration, we recommend 10 hours of conditioning. If the D.O.sensor is installed when you receive the instrument, it will be condi-tioned and ready to calibrate. If you remove the sensor, be sure toallow for another period of conditioning before you calibrate.
SENSOR INSTALLATION
The MP TROLL 9500 may be shipped with a polarographic D.O.sensor installed in port P2. When the sensor is shipped in theinstrument, it is pre-conditioned and ready for calibration.
If installation is necessary, unpack, fill, install, and condition apolarographic D.O. sensor as follows.
FILL THE MEMBRANE MODULE
New sensors are shipped with a drymembrane module loosely attached.
1. Remove the soft protective caps fromthe membrane end and the connectorend of the sensor.
2. Remove the membrane module fromthe sensor body and fill with electro-lyte as follows: Holding the membranemodule open-end up, position theelectrolyte dispenser against the sideof the module without touching themembrane. Fill slowly.
3. Insert the sensor into the open end of themembrane module. To minimize air, some ofthe electrolyte should overflow from the openend as the sensor is inserted.
POLAROGRAPHIC MEASUREMENT OF DISSOLVED OXYGEN
Membrane
PolarographicDissolved
Oxygen Sensor
Cathode
Membranemodule
Anode
o-rings
Cap
Cap
TIP: To eliminate air bubbles, tap theside of the module briskly with yourfingernail.
SECTION 13: DISSOLVED OXYGEN—POLAROGRAPHIC
TIP: Testing has shown that 10 hours of conditioningyields very stable long-term performance.
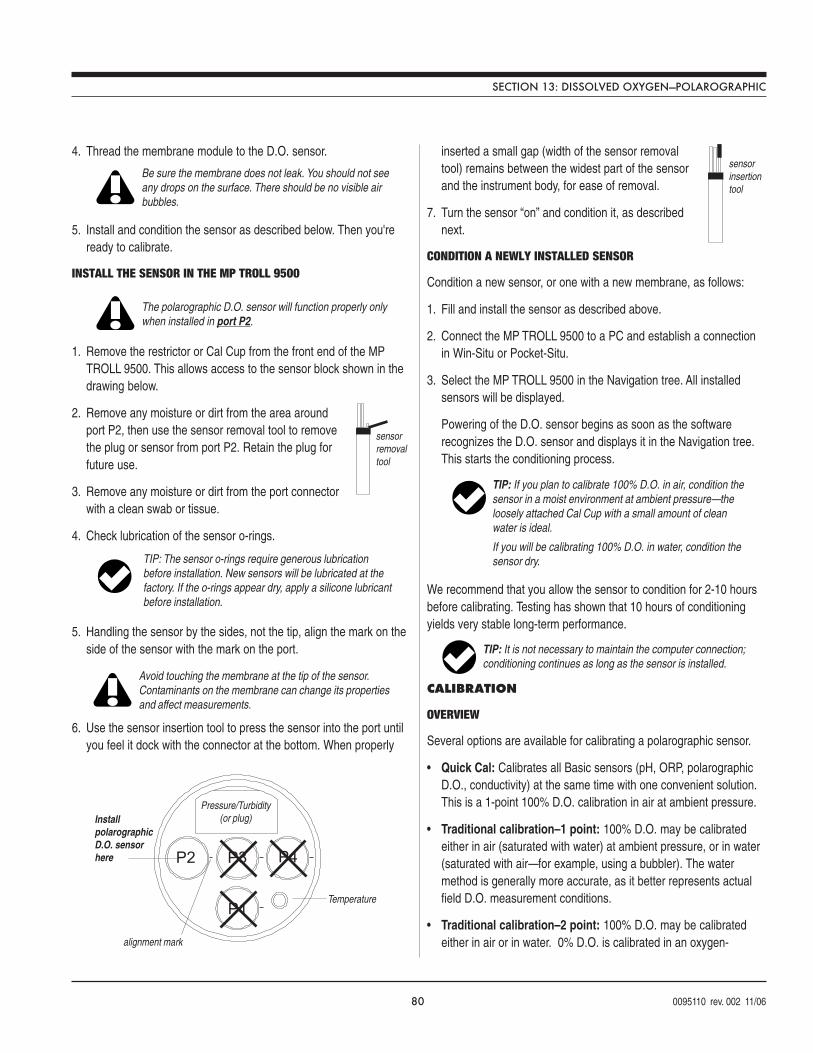
80 0095110 rev. 002 11/06
4. Thread the membrane module to the D.O. sensor.
5. Install and condition the sensor as described below. Then you'reready to calibrate.
INSTALL THE SENSOR IN THE MP TROLL 9500
1. Remove the restrictor or Cal Cup from the front end of the MPTROLL 9500. This allows access to the sensor block shown in thedrawing below.
2. Remove any moisture or dirt from the area aroundport P2, then use the sensor removal tool to removethe plug or sensor from port P2. Retain the plug forfuture use.
3. Remove any moisture or dirt from the port connectorwith a clean swab or tissue.
4. Check lubrication of the sensor o-rings.
5. Handling the sensor by the sides, not the tip, align the mark on theside of the sensor with the mark on the port.
6. Use the sensor insertion tool to press the sensor into the port untilyou feel it dock with the connector at the bottom. When properly
inserted a small gap (width of the sensor removaltool) remains between the widest part of the sensorand the instrument body, for ease of removal.
7. Turn the sensor “on” and condition it, as describednext.
CONDITION A NEWLY INSTALLED SENSOR
Condition a new sensor, or one with a new membrane, as follows:
1. Fill and install the sensor as described above.
2. Connect the MP TROLL 9500 to a PC and establish a connectionin Win-Situ or Pocket-Situ.
3. Select the MP TROLL 9500 in the Navigation tree. All installedsensors will be displayed.
Powering of the D.O. sensor begins as soon as the softwarerecognizes the D.O. sensor and displays it in the Navigation tree.This starts the conditioning process.
We recommend that you allow the sensor to condition for 2-10 hoursbefore calibrating. Testing has shown that 10 hours of conditioningyields very stable long-term performance.
CALIBRATION
OVERVIEW
Several options are available for calibrating a polarographic sensor.
• Quick Cal: Calibrates all Basic sensors (pH, ORP, polarographicD.O., conductivity) at the same time with one convenient solution.This is a 1-point 100% D.O. calibration in air at ambient pressure.
• Traditional calibration–1 point: 100% D.O. may be calibratedeither in air (saturated with water) at ambient pressure, or in water(saturated with air—for example, using a bubbler). The watermethod is generally more accurate, as it better represents actualfield D.O. measurement conditions.
• Traditional calibration–2 point: 100% D.O. may be calibratedeither in air or in water. 0% D.O. is calibrated in an oxygen-
1
2 3 4
InstallpolarographicD.O. sensorhere
Pressure/Turbidity(or plug)
TemperatureP1
P2 P3 P4
alignment mark
The polarographic D.O. sensor will function properly onlywhen installed in port P2.
sensorremovaltool
Avoid touching the membrane at the tip of the sensor.Contaminants on the membrane can change its propertiesand affect measurements.
sensorinsertiontool
TIP: The sensor o-rings require generous lubricationbefore installation. New sensors will be lubricated at thefactory. If the o-rings appear dry, apply a silicone lubricantbefore installation.
TIP: It is not necessary to maintain the computer connection;conditioning continues as long as the sensor is installed.
Be sure the membrane does not leak. You should not seeany drops on the surface. There should be no visible airbubbles.
SECTION 13: DISSOLVED OXYGEN—POLAROGRAPHIC
TIP: If you plan to calibrate 100% D.O. in air, condition thesensor in a moist environment at ambient pressure—theloosely attached Cal Cup with a small amount of cleanwater is ideal.
If you will be calibrating 100% D.O. in water, condition thesensor dry.
81 0095110 rev. 002 11/06
depleted solution such as sodium sulfite or nitrogen-saturatedwater. A 2-point calibration is recommended
• when you expect to measure very low D.O. values (< 5 mg/L),• when required by Standard Operating Procedures.
Nominal vs. Stable
To shorten the calibration time, you have the option to accept thecalibration when “Nominal” stability is achieved. If the early value isaccepted, the calibration point will be designated “USER SET” in thecalibration report. If the calibration report indicates that calibration wasperformed through to stability then the instrument will operate asintended by In-Situ’s quality standards.
CALIBRATION SOLUTIONS & EQUIPMENT
100% D.O. calibrations may be performed in water saturated with air,or in air saturated with water. Deionized water is available from In-SituInc., but any clean water may be used. In-Situ’s bubbler calibration kitis designed for an efficient water calibration.
An oxygen-depleted solution is used to calibrate the 0% D.O. Sodiumsulfite is available from In-Situ Inc. For a cleaner calibration, nitrogen-saturated water may be used.
RECOMMENDED CALIBRATION FREQUENCY
Your own experience is the best guide to how often the polarographicD.O. sensor will benefit from recalibration under conditions of normalusage. Refer to the general guidelines under “How Often to Calibrate”in Section 10, and the tech note on “Instrument Calibration.”
Until a new polarographic sensor has been thoroughly conditioned, itmay require more frequent calibration. In the absence of otherindications, a calibration should be performed every 2-4 weeks.
In addition, the polarographic D.O. sensor should be conditioned for2-4 hours and recalibrated in the following circumstances:
• after cleaning the sensor,• after replacing the membrane module,
• when taking measurements at an elevation different from that atwhich the sensor was last calibrated.
DISSOLVED OXYGEN CALIBRATION TIPS
The following discussion may help you to obtain the best results fromthe polarographic D.O. calibration.
• Air or Water? The software provides two options for conducting a100% D.O. calibration:
∗ in air (saturated with water). This is the condition during a QuickCal in the inverted Cal Cup with the sensor membrane exposedto air, temperature sensor submerged, and Cal Cup vented tothe atmosphere.
∗ in water (saturated with air). In-Situ’s bubbler calibration kitprovides everything needed to create a vigorous bubbling actionto insure air-saturated water. The Cal Cup is not used.
Since dissolved oxygen measurements are typically made in water,calibrating in water will often yield better results. When calibrated inair, the membrane’s behavior in water must be estimated.
• The D.O. calibration procedure is very sensitive to changes intemperature. Ideally, it should be done in an area protected fromdirect sunlight and away from ventilation ducts.
• The nature of the sensor membrane influences the response. Besure to note the membrane thickness before starting the calibra-tion. (If no thickness is indicated, the membrane is 1-mil Teflon.)Membrane thickness is more important with a 100% calibration inair.
DISSOLVED OXYGEN QUICK CAL
The procedure to Quick Cal the polarographic D.O. sensor, along withother Basic sensors, is in Section 3, Getting Started. This is a single-point 100% calibration in air (saturated with water).
The following traditional calibration is recommended for use when
• the user is required to enter a specific stimulus at the calibrationtemperature and pressure,
• calibration in water is preferred,
• a 0% calibration point is needed.
TRADITIONAL DISSOLVED OXYGEN CALIBRATION PROCEDURE
You may select a 1-point or a 2-point calibration. The first point (100%saturation) may be taken in air or in water.
Prepare the MP TROLL 9500 for water or air calibration as describedon the following page.
Q:
A:
I did a Quick Cal. Why should I recalibrate D.O.?
The D.O. Quick Cal, especially if done through to stability,can provide accurate measurement results. However, someprocedures require a look-up table for the stimulus at agiven temperature and pressure. This can be done in thetraditional D.O. calibration. Also, better measurement resultswill be obtained when the 100% calibration is done in watersaturated with air. This procedure is not provided for inQuick Cal. In addition, the traditional calibration provides fora 0% (0 ppm, 0 mg/L) calibration, which is recommendedwhen measuring very low D.O. values.
SECTION 13: DISSOLVED OXYGEN—POLAROGRAPHIC
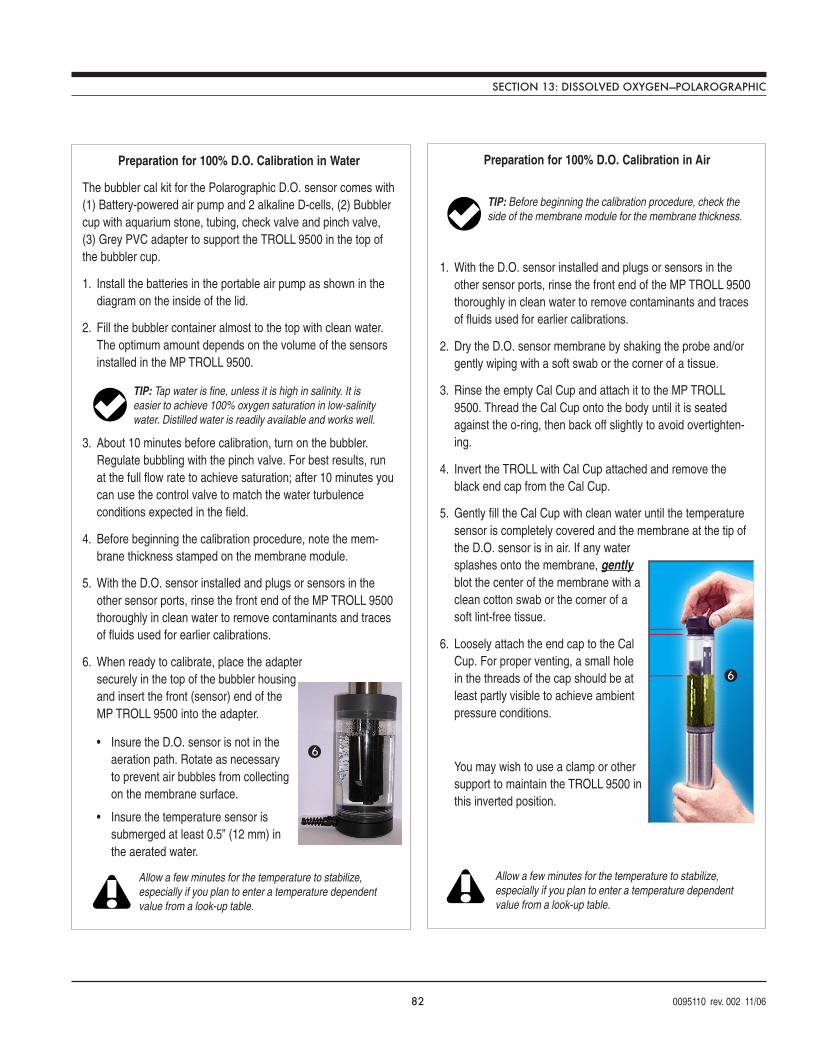
82 0095110 rev. 002 11/06
SECTION 13: DISSOLVED OXYGEN—POLAROGRAPHIC
Preparation for 100% D.O. Calibration in Water
The bubbler cal kit for the Polarographic D.O. sensor comes with(1) Battery-powered air pump and 2 alkaline D-cells, (2) Bubblercup with aquarium stone, tubing, check valve and pinch valve,(3) Grey PVC adapter to support the TROLL 9500 in the top ofthe bubbler cup.
1. Install the batteries in the portable air pump as shown in thediagram on the inside of the lid.
2. Fill the bubbler container almost to the top with clean water.The optimum amount depends on the volume of the sensorsinstalled in the MP TROLL 9500.
3. About 10 minutes before calibration, turn on the bubbler.Regulate bubbling with the pinch valve. For best results, runat the full flow rate to achieve saturation; after 10 minutes youcan use the control valve to match the water turbulenceconditions expected in the field.
4. Before beginning the calibration procedure, note the mem-brane thickness stamped on the membrane module.
5. With the D.O. sensor installed and plugs or sensors in theother sensor ports, rinse the front end of the MP TROLL 9500thoroughly in clean water to remove contaminants and tracesof fluids used for earlier calibrations.
6. When ready to calibrate, place the adaptersecurely in the top of the bubbler housingand insert the front (sensor) end of theMP TROLL 9500 into the adapter.
TIP: Tap water is fine, unless it is high in salinity. It iseasier to achieve 100% oxygen saturation in low-salinitywater. Distilled water is readily available and works well.
Allow a few minutes for the temperature to stabilize,especially if you plan to enter a temperature dependentvalue from a look-up table.
6• Insure the D.O. sensor is not in the
aeration path. Rotate as necessaryto prevent air bubbles from collectingon the membrane surface.
• Insure the temperature sensor issubmerged at least 0.5” (12 mm) inthe aerated water.
Preparation for 100% D.O. Calibration in Air
1. With the D.O. sensor installed and plugs or sensors in theother sensor ports, rinse the front end of the MP TROLL 9500thoroughly in clean water to remove contaminants and tracesof fluids used for earlier calibrations.
2. Dry the D.O. sensor membrane by shaking the probe and/orgently wiping with a soft swab or the corner of a tissue.
3. Rinse the empty Cal Cup and attach it to the MP TROLL9500. Thread the Cal Cup onto the body until it is seatedagainst the o-ring, then back off slightly to avoid overtighten-ing.
4. Invert the TROLL with Cal Cup attached and remove theblack end cap from the Cal Cup.
5. Gently fill the Cal Cup with clean water until the temperaturesensor is completely covered and the membrane at the tip ofthe D.O. sensor is in air. If any watersplashes onto the membrane, gentlyblot the center of the membrane with aclean cotton swab or the corner of asoft lint-free tissue.
6. Loosely attach the end cap to the CalCup. For proper venting, a small holein the threads of the cap should be atleast partly visible to achieve ambientpressure conditions.
You may wish to use a clamp or othersupport to maintain the TROLL 9500 inthis inverted position.
Allow a few minutes for the temperature to stabilize,especially if you plan to enter a temperature dependentvalue from a look-up table.
TIP: Before beginning the calibration procedure, check theside of the membrane module for the membrane thickness.
6
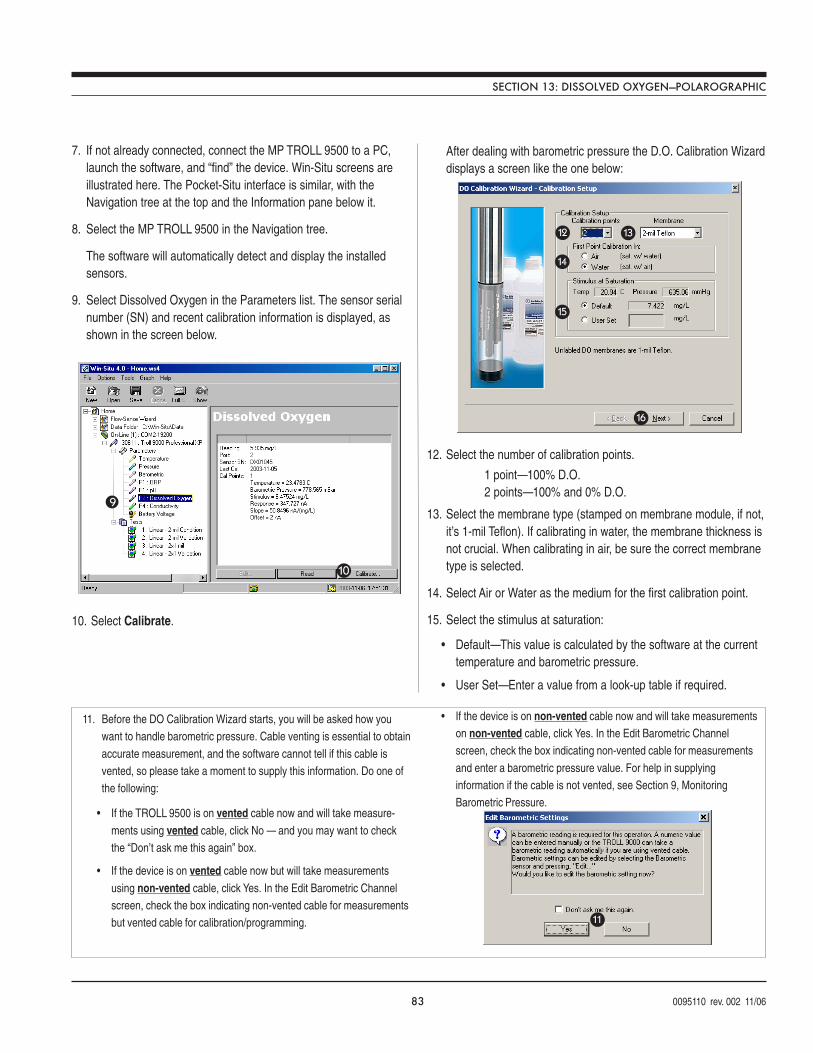
83 0095110 rev. 002 11/06
7. If not already connected, connect the MP TROLL 9500 to a PC,launch the software, and “find” the device. Win-Situ screens areillustrated here. The Pocket-Situ interface is similar, with theNavigation tree at the top and the Information pane below it.
8. Select the MP TROLL 9500 in the Navigation tree.
The software will automatically detect and display the installedsensors.
9. Select Dissolved Oxygen in the Parameters list. The sensor serialnumber (SN) and recent calibration information is displayed, asshown in the screen below.
10. Select Calibrate.
After dealing with barometric pressure the D.O. Calibration Wizarddisplays a screen like the one below:
12. Select the number of calibration points.
1 point—100% D.O.2 points—100% and 0% D.O.
13. Select the membrane type (stamped on membrane module, if not,it’s 1-mil Teflon). If calibrating in water, the membrane thickness isnot crucial. When calibrating in air, be sure the correct membranetype is selected.
14. Select Air or Water as the medium for the first calibration point.
15. Select the stimulus at saturation:
• Default—This value is calculated by the software at the currenttemperature and barometric pressure.
• User Set—Enter a value from a look-up table if required.
12 13
16
14
15
SECTION 13: DISSOLVED OXYGEN—POLAROGRAPHIC
11. Before the DO Calibration Wizard starts, you will be asked how youwant to handle barometric pressure. Cable venting is essential to obtain
accurate measurement, and the software cannot tell if this cable isvented, so please take a moment to supply this information. Do one ofthe following:
• If the TROLL 9500 is on vented cable now and will take measure-
ments using vented cable, click No — and you may want to checkthe “Don’t ask me this again” box.
• If the device is on vented cable now but will take measurements
using non-vented cable, click Yes. In the Edit Barometric Channelscreen, check the box indicating non-vented cable for measurementsbut vented cable for calibration/programming.
10
9
• If the device is on non-vented cable now and will take measurementson non-vented cable, click Yes. In the Edit Barometric Channelscreen, check the box indicating non-vented cable for measurements
and enter a barometric pressure value. For help in supplyinginformation if the cable is not vented, see Section 9, MonitoringBarometric Pressure.
11
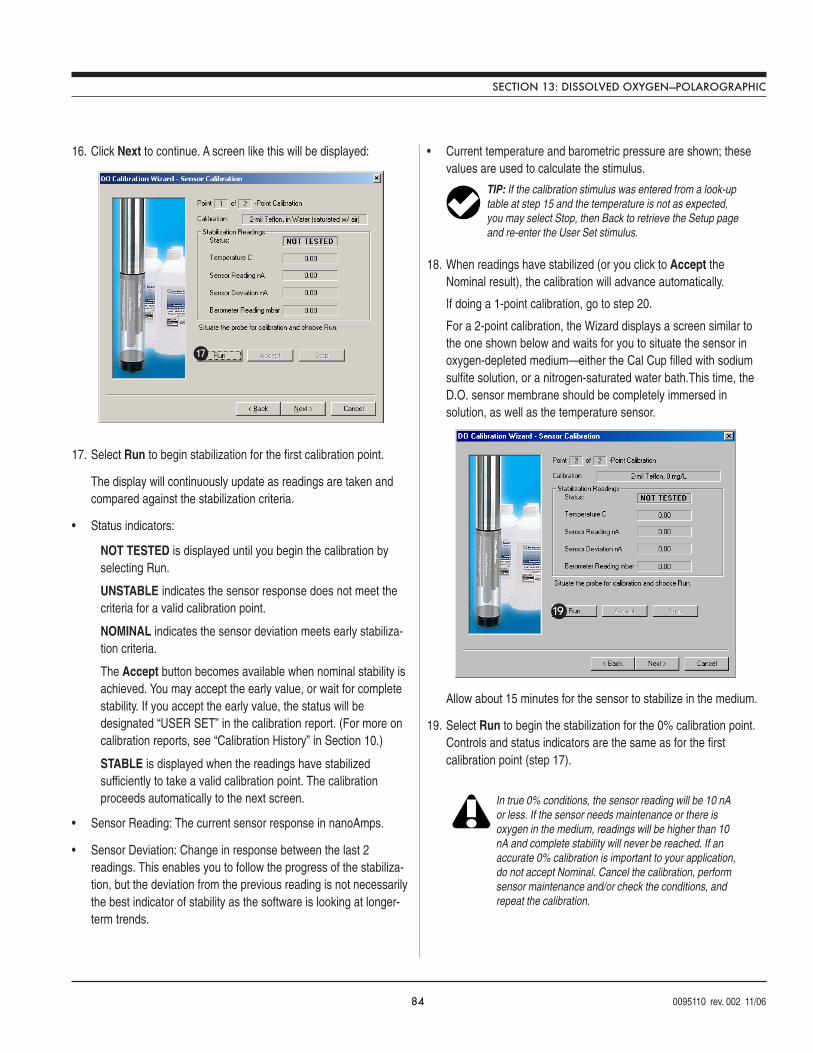
84 0095110 rev. 002 11/06
16. Click Next to continue. A screen like this will be displayed:
17. Select Run to begin stabilization for the first calibration point.
The display will continuously update as readings are taken andcompared against the stabilization criteria.
• Status indicators:
NOT TESTED is displayed until you begin the calibration byselecting Run.
UNSTABLE indicates the sensor response does not meet thecriteria for a valid calibration point.
NOMINAL indicates the sensor deviation meets early stabiliza-tion criteria.
The Accept button becomes available when nominal stability isachieved. You may accept the early value, or wait for completestability. If you accept the early value, the status will bedesignated “USER SET” in the calibration report. (For more oncalibration reports, see “Calibration History” in Section 10.)
STABLE is displayed when the readings have stabilizedsufficiently to take a valid calibration point. The calibrationproceeds automatically to the next screen.
• Sensor Reading: The current sensor response in nanoAmps.
• Sensor Deviation: Change in response between the last 2readings. This enables you to follow the progress of the stabiliza-tion, but the deviation from the previous reading is not necessarilythe best indicator of stability as the software is looking at longer-term trends.
• Current temperature and barometric pressure are shown; thesevalues are used to calculate the stimulus.
18. When readings have stabilized (or you click to Accept theNominal result), the calibration will advance automatically.
If doing a 1-point calibration, go to step 20.
For a 2-point calibration, the Wizard displays a screen similar tothe one shown below and waits for you to situate the sensor inoxygen-depleted medium—either the Cal Cup filled with sodiumsulfite solution, or a nitrogen-saturated water bath.This time, theD.O. sensor membrane should be completely immersed insolution, as well as the temperature sensor.
Allow about 15 minutes for the sensor to stabilize in the medium.
19. Select Run to begin the stabilization for the 0% calibration point.Controls and status indicators are the same as for the firstcalibration point (step 17).
TIP: If the calibration stimulus was entered from a look-uptable at step 15 and the temperature is not as expected,you may select Stop, then Back to retrieve the Setup pageand re-enter the User Set stimulus.
SECTION 13: DISSOLVED OXYGEN—POLAROGRAPHIC
17
19
In true 0% conditions, the sensor reading will be 10 nAor less. If the sensor needs maintenance or there isoxygen in the medium, readings will be higher than 10nA and complete stability will never be reached. If anaccurate 0% calibration is important to your application,do not accept Nominal. Cancel the calibration, performsensor maintenance and/or check the conditions, andrepeat the calibration.
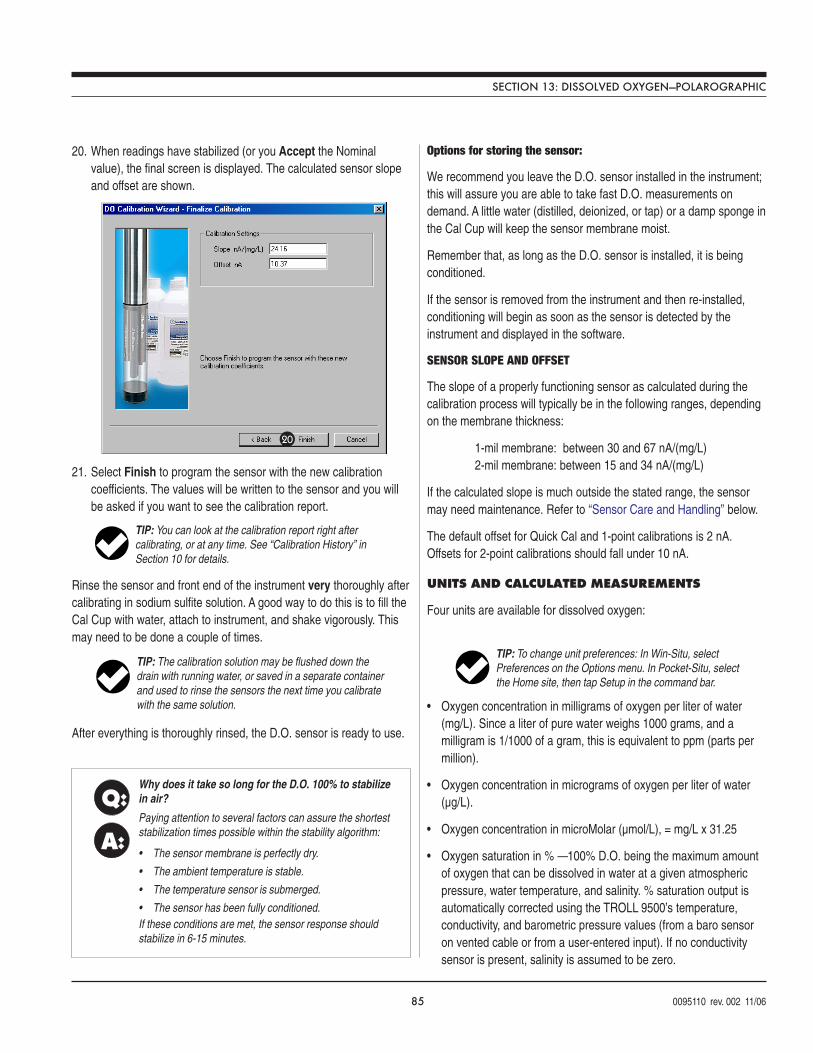
85 0095110 rev. 002 11/06
20. When readings have stabilized (or you Accept the Nominalvalue), the final screen is displayed. The calculated sensor slopeand offset are shown.
21. Select Finish to program the sensor with the new calibrationcoefficients. The values will be written to the sensor and you willbe asked if you want to see the calibration report.
Rinse the sensor and front end of the instrument very thoroughly aftercalibrating in sodium sulfite solution. A good way to do this is to fill theCal Cup with water, attach to instrument, and shake vigorously. Thismay need to be done a couple of times.
After everything is thoroughly rinsed, the D.O. sensor is ready to use.
Options for storing the sensor:
We recommend you leave the D.O. sensor installed in the instrument;this will assure you are able to take fast D.O. measurements ondemand. A little water (distilled, deionized, or tap) or a damp sponge inthe Cal Cup will keep the sensor membrane moist.
Remember that, as long as the D.O. sensor is installed, it is beingconditioned.
If the sensor is removed from the instrument and then re-installed,conditioning will begin as soon as the sensor is detected by theinstrument and displayed in the software.
SENSOR SLOPE AND OFFSET
The slope of a properly functioning sensor as calculated during thecalibration process will typically be in the following ranges, dependingon the membrane thickness:
1-mil membrane: between 30 and 67 nA/(mg/L)2-mil membrane: between 15 and 34 nA/(mg/L)
If the calculated slope is much outside the stated range, the sensormay need maintenance. Refer to “Sensor Care and Handling” below.
The default offset for Quick Cal and 1-point calibrations is 2 nA.Offsets for 2-point calibrations should fall under 10 nA.
UNITS AND CALCULATED MEASUREMENTS
Four units are available for dissolved oxygen:
• Oxygen concentration in milligrams of oxygen per liter of water(mg/L). Since a liter of pure water weighs 1000 grams, and amilligram is 1/1000 of a gram, this is equivalent to ppm (parts permillion).
• Oxygen concentration in micrograms of oxygen per liter of water(µg/L).
• Oxygen concentration in microMolar (µmol/L), = mg/L x 31.25
• Oxygen saturation in % —100% D.O. being the maximum amountof oxygen that can be dissolved in water at a given atmosphericpressure, water temperature, and salinity. % saturation output isautomatically corrected using the TROLL 9500’s temperature,conductivity, and barometric pressure values (from a baro sensoron vented cable or from a user-entered input). If no conductivitysensor is present, salinity is assumed to be zero.
TIP: To change unit preferences: In Win-Situ, selectPreferences on the Options menu. In Pocket-Situ, selectthe Home site, then tap Setup in the command bar.
SECTION 13: DISSOLVED OXYGEN—POLAROGRAPHIC
Q:
A:
Why does it take so long for the D.O. 100% to stabilizein air?
Paying attention to several factors can assure the shorteststabilization times possible within the stability algorithm:
• The sensor membrane is perfectly dry.
• The ambient temperature is stable.
• The temperature sensor is submerged.
• The sensor has been fully conditioned.If these conditions are met, the sensor response shouldstabilize in 6-15 minutes.
TIP: You can look at the calibration report right aftercalibrating, or at any time. See “Calibration History” inSection 10 for details.
TIP: The calibration solution may be flushed down thedrain with running water, or saved in a separate containerand used to rinse the sensors the next time you calibratewith the same solution.
20
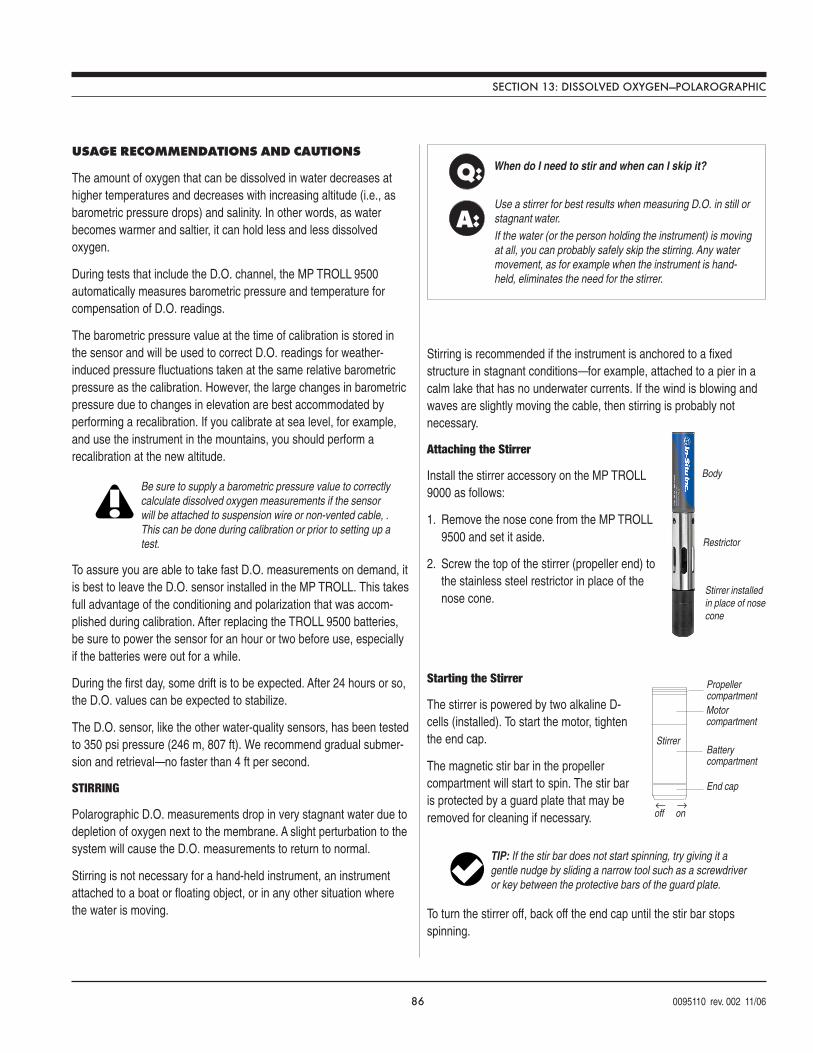
86 0095110 rev. 002 11/06
USAGE RECOMMENDATIONS AND CAUTIONS
The amount of oxygen that can be dissolved in water decreases athigher temperatures and decreases with increasing altitude (i.e., asbarometric pressure drops) and salinity. In other words, as waterbecomes warmer and saltier, it can hold less and less dissolvedoxygen.
During tests that include the D.O. channel, the MP TROLL 9500automatically measures barometric pressure and temperature forcompensation of D.O. readings.
The barometric pressure value at the time of calibration is stored inthe sensor and will be used to correct D.O. readings for weather-induced pressure fluctuations taken at the same relative barometricpressure as the calibration. However, the large changes in barometricpressure due to changes in elevation are best accommodated byperforming a recalibration. If you calibrate at sea level, for example,and use the instrument in the mountains, you should perform arecalibration at the new altitude.
To assure you are able to take fast D.O. measurements on demand, itis best to leave the D.O. sensor installed in the MP TROLL. This takesfull advantage of the conditioning and polarization that was accom-plished during calibration. After replacing the TROLL 9500 batteries,be sure to power the sensor for an hour or two before use, especiallyif the batteries were out for a while.
During the first day, some drift is to be expected. After 24 hours or so,the D.O. values can be expected to stabilize.
The D.O. sensor, like the other water-quality sensors, has been testedto 350 psi pressure (246 m, 807 ft). We recommend gradual submer-sion and retrieval—no faster than 4 ft per second.
STIRRING
Polarographic D.O. measurements drop in very stagnant water due todepletion of oxygen next to the membrane. A slight perturbation to thesystem will cause the D.O. measurements to return to normal.
Stirring is not necessary for a hand-held instrument, an instrumentattached to a boat or floating object, or in any other situation wherethe water is moving.
Stirring is recommended if the instrument is anchored to a fixedstructure in stagnant conditions—for example, attached to a pier in acalm lake that has no underwater currents. If the wind is blowing andwaves are slightly moving the cable, then stirring is probably notnecessary.
Attaching the Stirrer
Install the stirrer accessory on the MP TROLL9000 as follows:
1. Remove the nose cone from the MP TROLL9500 and set it aside.
2. Screw the top of the stirrer (propeller end) tothe stainless steel restrictor in place of thenose cone.
Starting the Stirrer
The stirrer is powered by two alkaline D-cells (installed). To start the motor, tightenthe end cap.
The magnetic stir bar in the propellercompartment will start to spin. The stir baris protected by a guard plate that may beremoved for cleaning if necessary.
To turn the stirrer off, back off the end cap until the stir bar stopsspinning.
Stirrer
Propellercompartment
Batterycompartment
Motorcompartment
End cap
← →off on
TIP: If the stir bar does not start spinning, try giving it agentle nudge by sliding a narrow tool such as a screwdriveror key between the protective bars of the guard plate.
Q:
A:
When do I need to stir and when can I skip it?
Use a stirrer for best results when measuring D.O. in still orstagnant water.If the water (or the person holding the instrument) is movingat all, you can probably safely skip the stirring. Any watermovement, as for example when the instrument is hand-held, eliminates the need for the stirrer.
SECTION 13: DISSOLVED OXYGEN—POLAROGRAPHIC
Be sure to supply a barometric pressure value to correctlycalculate dissolved oxygen measurements if the sensorwill be attached to suspension wire or non-vented cable, .This can be done during calibration or prior to setting up atest.
Body
Restrictor
Stirrer installedin place of nosecone
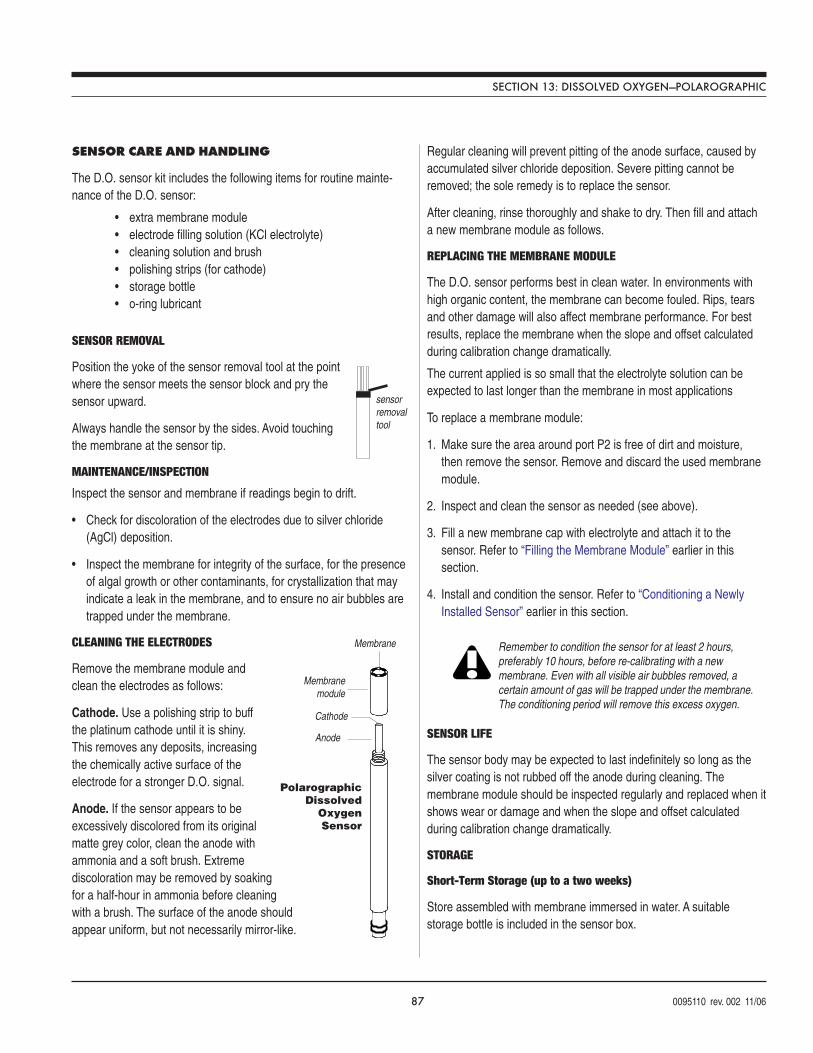
87 0095110 rev. 002 11/06
SENSOR CARE AND HANDLING
The D.O. sensor kit includes the following items for routine mainte-nance of the D.O. sensor:
• extra membrane module• electrode filling solution (KCl electrolyte)• cleaning solution and brush• polishing strips (for cathode)• storage bottle• o-ring lubricant
SENSOR REMOVAL
Position the yoke of the sensor removal tool at the pointwhere the sensor meets the sensor block and pry thesensor upward.
Always handle the sensor by the sides. Avoid touchingthe membrane at the sensor tip.
MAINTENANCE/INSPECTION
Inspect the sensor and membrane if readings begin to drift.
• Check for discoloration of the electrodes due to silver chloride(AgCl) deposition.
• Inspect the membrane for integrity of the surface, for the presenceof algal growth or other contaminants, for crystallization that mayindicate a leak in the membrane, and to ensure no air bubbles aretrapped under the membrane.
CLEANING THE ELECTRODES
Remove the membrane module andclean the electrodes as follows:
Cathode. Use a polishing strip to buffthe platinum cathode until it is shiny.This removes any deposits, increasingthe chemically active surface of theelectrode for a stronger D.O. signal.
Anode. If the sensor appears to beexcessively discolored from its originalmatte grey color, clean the anode withammonia and a soft brush. Extremediscoloration may be removed by soakingfor a half-hour in ammonia before cleaningwith a brush. The surface of the anode shouldappear uniform, but not necessarily mirror-like.
SECTION 13: DISSOLVED OXYGEN—POLAROGRAPHIC
Cathode
Membrane
Membranemodule
Anode
PolarographicDissolved
Oxygen Sensor
Regular cleaning will prevent pitting of the anode surface, caused byaccumulated silver chloride deposition. Severe pitting cannot beremoved; the sole remedy is to replace the sensor.
After cleaning, rinse thoroughly and shake to dry. Then fill and attacha new membrane module as follows.
REPLACING THE MEMBRANE MODULE
The D.O. sensor performs best in clean water. In environments withhigh organic content, the membrane can become fouled. Rips, tearsand other damage will also affect membrane performance. For bestresults, replace the membrane when the slope and offset calculatedduring calibration change dramatically.
The current applied is so small that the electrolyte solution can beexpected to last longer than the membrane in most applications
To replace a membrane module:
1. Make sure the area around port P2 is free of dirt and moisture,then remove the sensor. Remove and discard the used membranemodule.
2. Inspect and clean the sensor as needed (see above).
3. Fill a new membrane cap with electrolyte and attach it to thesensor. Refer to “Filling the Membrane Module” earlier in thissection.
4. Install and condition the sensor. Refer to “Conditioning a NewlyInstalled Sensor” earlier in this section.
SENSOR LIFE
The sensor body may be expected to last indefinitely so long as thesilver coating is not rubbed off the anode during cleaning. Themembrane module should be inspected regularly and replaced when itshows wear or damage and when the slope and offset calculatedduring calibration change dramatically.
STORAGE
Short-Term Storage (up to a two weeks)
Store assembled with membrane immersed in water. A suitablestorage bottle is included in the sensor box.
sensorremovaltool
Remember to condition the sensor for at least 2 hours,preferably 10 hours, before re-calibrating with a newmembrane. Even with all visible air bubbles removed, acertain amount of gas will be trapped under the membrane.The conditioning period will remove this excess oxygen.
88 0095110 rev. 002 11/06
SECTION 13: DISSOLVED OXYGEN—POLAROGRAPHIC
Long-Term Storage
Remove the membrane module, rinse with deionized water, cap andstore dry.
REFERENCES
Eaton, A.D., L.S. Clesceri, and A.E. Greenberg, eds., StandardMethods for the Examination of Water and Wastewater, 19thedition, Washington, D.C.: American Public Health Association,American Water Works Association, and Water EnvironmentFederation, 1995. Section 4500-O G, Oxygen (Dissolved),Membrane Electrode Method.
EPA, Methods for Chemical Analysis of Water and Wastes, EPA/600/4-79-020, revised March 1983. Method 360.1, Oxygen, Dissolved,Membrane Electrode. Approved at 40 CFR Part 136.
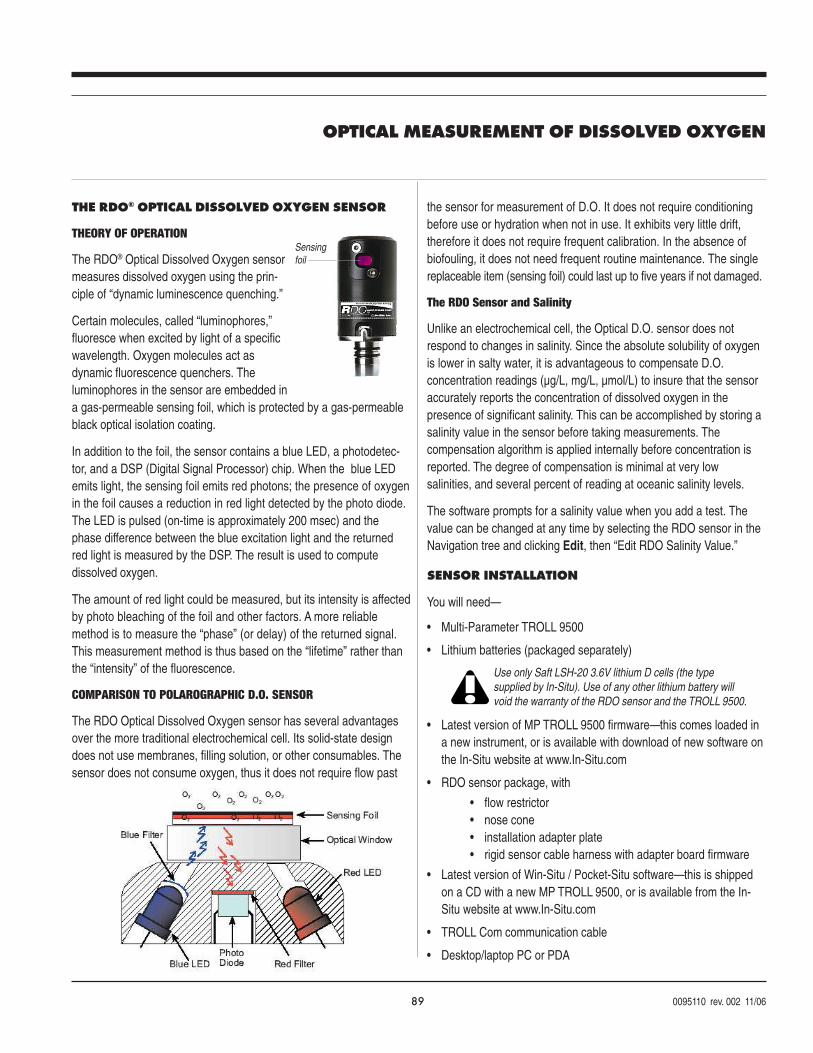
89 0095110 rev. 002 11/06
Sensingfoil
OPTICAL MEASUREMENT OF DISSOLVED OXYGEN
Use only Saft LSH-20 3.6V lithium D cells (the typesupplied by In-Situ). Use of any other lithium battery willvoid the warranty of the RDO sensor and the TROLL 9500.
THE RDO® OPTICAL DISSOLVED OXYGEN SENSOR
THEORY OF OPERATION
The RDO® Optical Dissolved Oxygen sensormeasures dissolved oxygen using the prin-ciple of “dynamic luminescence quenching.”
Certain molecules, called “luminophores,”fluoresce when excited by light of a specificwavelength. Oxygen molecules act asdynamic fluorescence quenchers. Theluminophores in the sensor are embedded ina gas-permeable sensing foil, which is protected by a gas-permeableblack optical isolation coating.
In addition to the foil, the sensor contains a blue LED, a photodetec-tor, and a DSP (Digital Signal Processor) chip. When the blue LEDemits light, the sensing foil emits red photons; the presence of oxygenin the foil causes a reduction in red light detected by the photo diode.The LED is pulsed (on-time is approximately 200 msec) and thephase difference between the blue excitation light and the returnedred light is measured by the DSP. The result is used to computedissolved oxygen.
The amount of red light could be measured, but its intensity is affectedby photo bleaching of the foil and other factors. A more reliablemethod is to measure the “phase” (or delay) of the returned signal.This measurement method is thus based on the “lifetime” rather thanthe “intensity” of the fluorescence.
COMPARISON TO POLAROGRAPHIC D.O. SENSOR
The RDO Optical Dissolved Oxygen sensor has several advantagesover the more traditional electrochemical cell. Its solid-state designdoes not use membranes, filling solution, or other consumables. Thesensor does not consume oxygen, thus it does not require flow past
the sensor for measurement of D.O. It does not require conditioningbefore use or hydration when not in use. It exhibits very little drift,therefore it does not require frequent calibration. In the absence ofbiofouling, it does not need frequent routine maintenance. The singlereplaceable item (sensing foil) could last up to five years if not damaged.
The RDO Sensor and Salinity
Unlike an electrochemical cell, the Optical D.O. sensor does notrespond to changes in salinity. Since the absolute solubility of oxygenis lower in salty water, it is advantageous to compensate D.O.concentration readings (µg/L, mg/L, µmol/L) to insure that the sensoraccurately reports the concentration of dissolved oxygen in thepresence of significant salinity. This can be accomplished by storing asalinity value in the sensor before taking measurements. Thecompensation algorithm is applied internally before concentration isreported. The degree of compensation is minimal at very lowsalinities, and several percent of reading at oceanic salinity levels.
The software prompts for a salinity value when you add a test. Thevalue can be changed at any time by selecting the RDO sensor in theNavigation tree and clicking Edit, then “Edit RDO Salinity Value.”
SENSOR INSTALLATION
You will need—
• Multi-Parameter TROLL 9500
• Lithium batteries (packaged separately)
• Latest version of MP TROLL 9500 firmware—this comes loaded ina new instrument, or is available with download of new software onthe In-Situ website at www.In-Situ.com
• RDO sensor package, with
• flow restrictor• nose cone• installation adapter plate• rigid sensor cable harness with adapter board firmware
• Latest version of Win-Situ / Pocket-Situ software—this is shippedon a CD with a new MP TROLL 9500, or is available from the In-Situ website at www.In-Situ.com
• TROLL Com communication cable
• Desktop/laptop PC or PDA
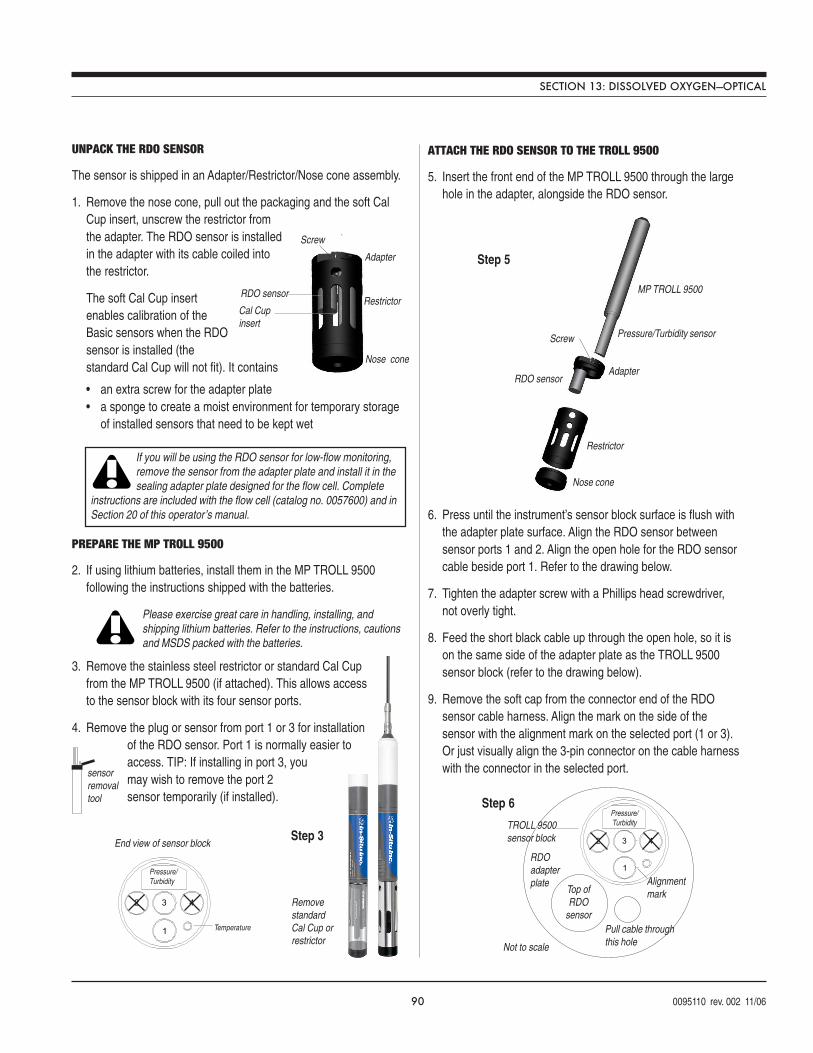
90 0095110 rev. 002 11/06
Nose cone
Restrictor
Adapter
RDO sensor
Screw
Cal Cupinsert
Please exercise great care in handling, installing, andshipping lithium batteries. Refer to the instructions, cautionsand MSDS packed with the batteries.
sensorremovaltool
1
2 3 4
End view of sensor block
Pressure/Turbidity
Temperature
Nose cone
MP TROLL 9500
AdapterRDO sensor
Restrictor
Pressure/Turbidity sensorScrew
Step 5
1
2 3 4
Top ofRDO
sensor
Pressure/Turbidity
Not to scale
Step 6
Pull cable throughthis hole
TROLL 9500sensor block
RDOadapterplate Alignment
mark
SECTION 13: DISSOLVED OXYGEN—OPTICAL
UNPACK THE RDO SENSOR
The sensor is shipped in an Adapter/Restrictor/Nose cone assembly.
1. Remove the nose cone, pull out the packaging and the soft CalCup insert, unscrew the restrictor fromthe adapter. The RDO sensor is installedin the adapter with its cable coiled intothe restrictor.
The soft Cal Cup insertenables calibration of theBasic sensors when the RDOsensor is installed (thestandard Cal Cup will not fit). It contains
• an extra screw for the adapter plate• a sponge to create a moist environment for temporary storage
of installed sensors that need to be kept wet
PREPARE THE MP TROLL 9500
2. If using lithium batteries, install them in the MP TROLL 9500following the instructions shipped with the batteries.
3. Remove the stainless steel restrictor or standard Cal Cupfrom the MP TROLL 9500 (if attached). This allows accessto the sensor block with its four sensor ports.
4. Remove the plug or sensor from port 1 or 3 for installationof the RDO sensor. Port 1 is normally easier toaccess. TIP: If installing in port 3, youmay wish to remove the port 2sensor temporarily (if installed).
ATTACH THE RDO SENSOR TO THE TROLL 9500
5. Insert the front end of the MP TROLL 9500 through the largehole in the adapter, alongside the RDO sensor.
6. Press until the instrument’s sensor block surface is flush withthe adapter plate surface. Align the RDO sensor betweensensor ports 1 and 2. Align the open hole for the RDO sensorcable beside port 1. Refer to the drawing below.
7. Tighten the adapter screw with a Phillips head screwdriver,not overly tight.
8. Feed the short black cable up through the open hole, so it ison the same side of the adapter plate as the TROLL 9500sensor block (refer to the drawing below).
9. Remove the soft cap from the connector end of the RDOsensor cable harness. Align the mark on the side of thesensor with the alignment mark on the selected port (1 or 3).Or just visually align the 3-pin connector on the cable harnesswith the connector in the selected port.
RemovestandardCal Cup orrestrictor
Step 3
If you will be using the RDO sensor for low-flow monitoring,remove the sensor from the adapter plate and install it in thesealing adapter plate designed for the flow cell. Complete
instructions are included with the flow cell (catalog no. 0057600) and inSection 20 of this operator’s manual.
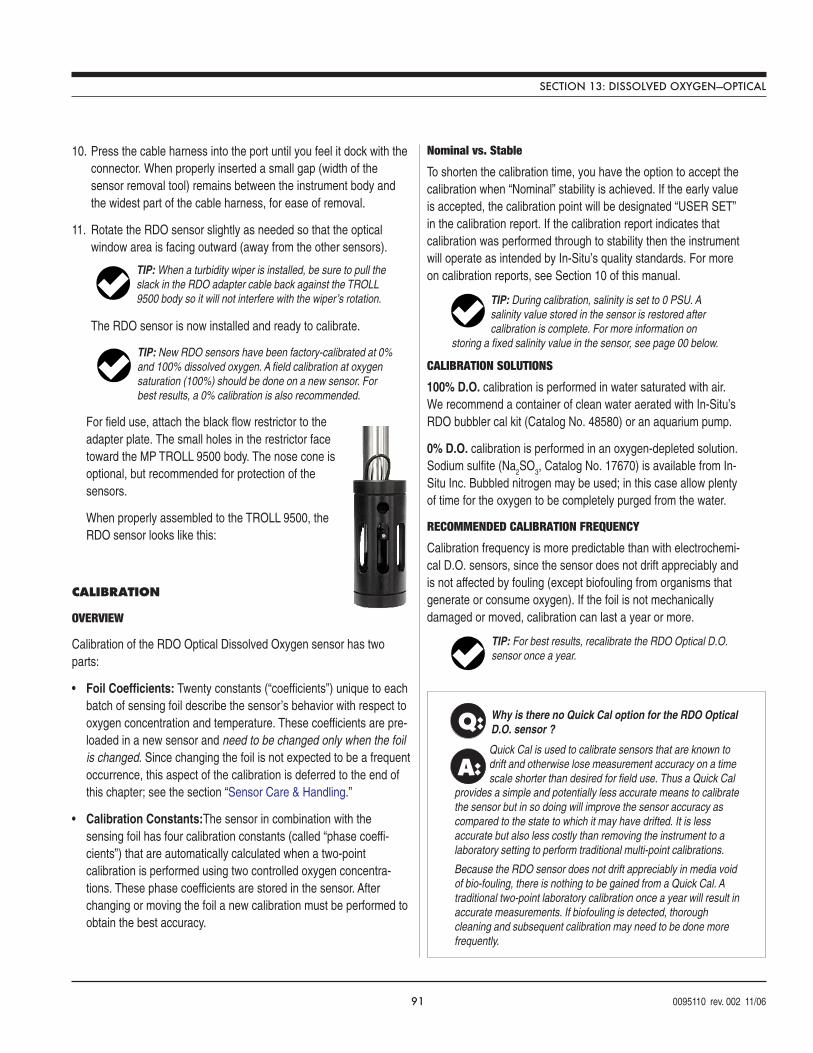
91 0095110 rev. 002 11/06
TIP: When a turbidity wiper is installed, be sure to pull theslack in the RDO adapter cable back against the TROLL9500 body so it will not interfere with the wiper’s rotation.
TIP: New RDO sensors have been factory-calibrated at 0%and 100% dissolved oxygen. A field calibration at oxygensaturation (100%) should be done on a new sensor. Forbest results, a 0% calibration is also recommended.
TIP: For best results, recalibrate the RDO Optical D.O.sensor once a year.
SECTION 13: DISSOLVED OXYGEN—OPTICAL
10. Press the cable harness into the port until you feel it dock with theconnector. When properly inserted a small gap (width of thesensor removal tool) remains between the instrument body andthe widest part of the cable harness, for ease of removal.
11. Rotate the RDO sensor slightly as needed so that the opticalwindow area is facing outward (away from the other sensors).
The RDO sensor is now installed and ready to calibrate.
For field use, attach the black flow restrictor to theadapter plate. The small holes in the restrictor facetoward the MP TROLL 9500 body. The nose cone isoptional, but recommended for protection of thesensors.
When properly assembled to the TROLL 9500, theRDO sensor looks like this:
CALIBRATION
OVERVIEW
Calibration of the RDO Optical Dissolved Oxygen sensor has twoparts:
• Foil Coefficients: Twenty constants (“coefficients”) unique to eachbatch of sensing foil describe the sensor’s behavior with respect tooxygen concentration and temperature. These coefficients are pre-loaded in a new sensor and need to be changed only when the foilis changed. Since changing the foil is not expected to be a frequentoccurrence, this aspect of the calibration is deferred to the end ofthis chapter; see the section “Sensor Care & Handling.”
• Calibration Constants:The sensor in combination with thesensing foil has four calibration constants (called “phase coeffi-cients”) that are automatically calculated when a two-pointcalibration is performed using two controlled oxygen concentra-tions. These phase coefficients are stored in the sensor. Afterchanging or moving the foil a new calibration must be performed toobtain the best accuracy.
Nominal vs. Stable
To shorten the calibration time, you have the option to accept thecalibration when “Nominal” stability is achieved. If the early valueis accepted, the calibration point will be designated “USER SET”in the calibration report. If the calibration report indicates thatcalibration was performed through to stability then the instrumentwill operate as intended by In-Situ’s quality standards. For moreon calibration reports, see Section 10 of this manual.
CALIBRATION SOLUTIONS
100% D.O. calibration is performed in water saturated with air.We recommend a container of clean water aerated with In-Situ’sRDO bubbler cal kit (Catalog No. 48580) or an aquarium pump.
0% D.O. calibration is performed in an oxygen-depleted solution.Sodium sulfite (Na
2SO
3, Catalog No. 17670) is available from In-
Situ Inc. Bubbled nitrogen may be used; in this case allow plentyof time for the oxygen to be completely purged from the water.
RECOMMENDED CALIBRATION FREQUENCY
Calibration frequency is more predictable than with electrochemi-cal D.O. sensors, since the sensor does not drift appreciably andis not affected by fouling (except biofouling from organisms thatgenerate or consume oxygen). If the foil is not mechanicallydamaged or moved, calibration can last a year or more.
TIP: During calibration, salinity is set to 0 PSU. Asalinity value stored in the sensor is restored aftercalibration is complete. For more information on
storing a fixed salinity value in the sensor, see page 00 below.
Q: Why is there no Quick Cal option for the RDO OpticalD.O. sensor ?
provides a simple and potentially less accurate means to calibratethe sensor but in so doing will improve the sensor accuracy ascompared to the state to which it may have drifted. It is lessaccurate but also less costly than removing the instrument to alaboratory setting to perform traditional multi-point calibrations.
Because the RDO sensor does not drift appreciably in media voidof bio-fouling, there is nothing to be gained from a Quick Cal. Atraditional two-point laboratory calibration once a year will result inaccurate measurements. If biofouling is detected, thoroughcleaning and subsequent calibration may need to be done morefrequently.
A:Quick Cal is used to calibrate sensors that are known todrift and otherwise lose measurement accuracy on a timescale shorter than desired for field use. Thus a Quick Cal
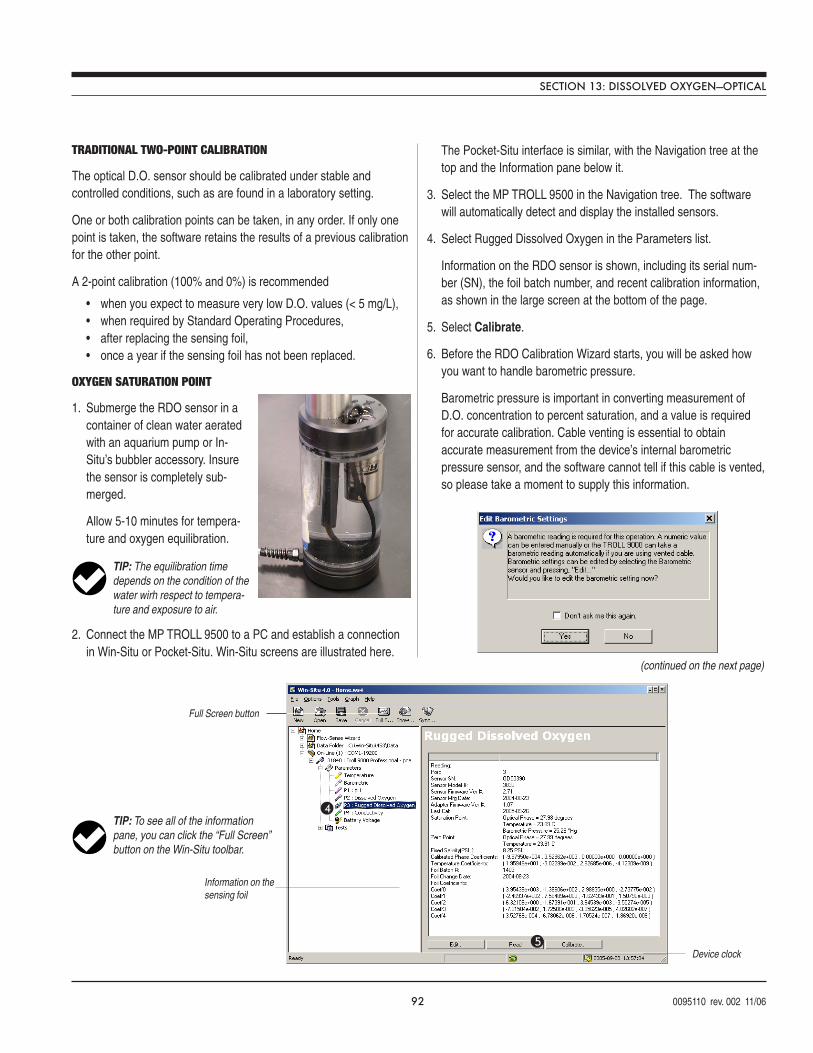
92 0095110 rev. 002 11/06
4
5
Full Screen button
TIP: To see all of the informationpane, you can click the “Full Screen”button on the Win-Situ toolbar.
Information on thesensing foil
Device clock
TIP: The equilibration timedepends on the condition of thewater wirh respect to tempera-ture and exposure to air.
SECTION 13: DISSOLVED OXYGEN—OPTICAL
TRADITIONAL TWO-POINT CALIBRATION
The optical D.O. sensor should be calibrated under stable andcontrolled conditions, such as are found in a laboratory setting.
One or both calibration points can be taken, in any order. If only onepoint is taken, the software retains the results of a previous calibrationfor the other point.
A 2-point calibration (100% and 0%) is recommended
• when you expect to measure very low D.O. values (< 5 mg/L),• when required by Standard Operating Procedures,• after replacing the sensing foil,• once a year if the sensing foil has not been replaced.
OXYGEN SATURATION POINT
1. Submerge the RDO sensor in acontainer of clean water aeratedwith an aquarium pump or In-Situ’s bubbler accessory. Insurethe sensor is completely sub-merged.
Allow 5-10 minutes for tempera-ture and oxygen equilibration.
2. Connect the MP TROLL 9500 to a PC and establish a connectionin Win-Situ or Pocket-Situ. Win-Situ screens are illustrated here.
The Pocket-Situ interface is similar, with the Navigation tree at thetop and the Information pane below it.
3. Select the MP TROLL 9500 in the Navigation tree. The softwarewill automatically detect and display the installed sensors.
4. Select Rugged Dissolved Oxygen in the Parameters list.
Information on the RDO sensor is shown, including its serial num-ber (SN), the foil batch number, and recent calibration information,as shown in the large screen at the bottom of the page.
5. Select Calibrate.
6. Before the RDO Calibration Wizard starts, you will be asked howyou want to handle barometric pressure.
Barometric pressure is important in converting measurement ofD.O. concentration to percent saturation, and a value is requiredfor accurate calibration. Cable venting is essential to obtainaccurate measurement from the device’s internal barometricpressure sensor, and the software cannot tell if this cable is vented,so please take a moment to supply this information.
(continued on the next page)
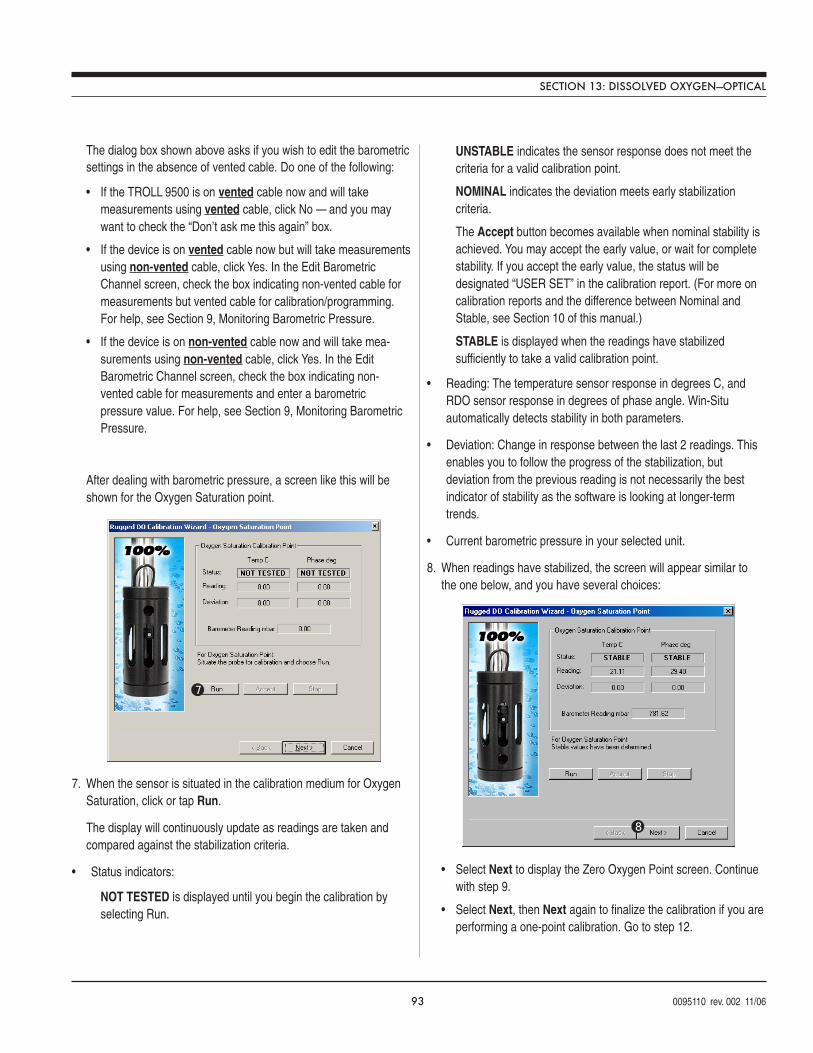
93 0095110 rev. 002 11/06
8
SECTION 13: DISSOLVED OXYGEN—OPTICAL
The dialog box shown above asks if you wish to edit the barometricsettings in the absence of vented cable. Do one of the following:
• If the TROLL 9500 is on vented cable now and will takemeasurements using vented cable, click No — and you maywant to check the “Don’t ask me this again” box.
• If the device is on vented cable now but will take measurementsusing non-vented cable, click Yes. In the Edit BarometricChannel screen, check the box indicating non-vented cable formeasurements but vented cable for calibration/programming.For help, see Section 9, Monitoring Barometric Pressure.
• If the device is on non-vented cable now and will take mea-surements using non-vented cable, click Yes. In the EditBarometric Channel screen, check the box indicating non-vented cable for measurements and enter a barometricpressure value. For help, see Section 9, Monitoring BarometricPressure.
After dealing with barometric pressure, a screen like this will beshown for the Oxygen Saturation point.
7. When the sensor is situated in the calibration medium for OxygenSaturation, click or tap Run.
The display will continuously update as readings are taken andcompared against the stabilization criteria.
• Status indicators:
NOT TESTED is displayed until you begin the calibration byselecting Run.
UNSTABLE indicates the sensor response does not meet thecriteria for a valid calibration point.
NOMINAL indicates the deviation meets early stabilizationcriteria.
The Accept button becomes available when nominal stability isachieved. You may accept the early value, or wait for completestability. If you accept the early value, the status will bedesignated “USER SET” in the calibration report. (For more oncalibration reports and the difference between Nominal andStable, see Section 10 of this manual.)
STABLE is displayed when the readings have stabilizedsufficiently to take a valid calibration point.
• Reading: The temperature sensor response in degrees C, andRDO sensor response in degrees of phase angle. Win-Situautomatically detects stability in both parameters.
• Deviation: Change in response between the last 2 readings. Thisenables you to follow the progress of the stabilization, butdeviation from the previous reading is not necessarily the bestindicator of stability as the software is looking at longer-termtrends.
• Current barometric pressure in your selected unit.
8. When readings have stabilized, the screen will appear similar tothe one below, and you have several choices:
• Select Next to display the Zero Oxygen Point screen. Continuewith step 9.
• Select Next, then Next again to finalize the calibration if you areperforming a one-point calibration. Go to step 12.
7
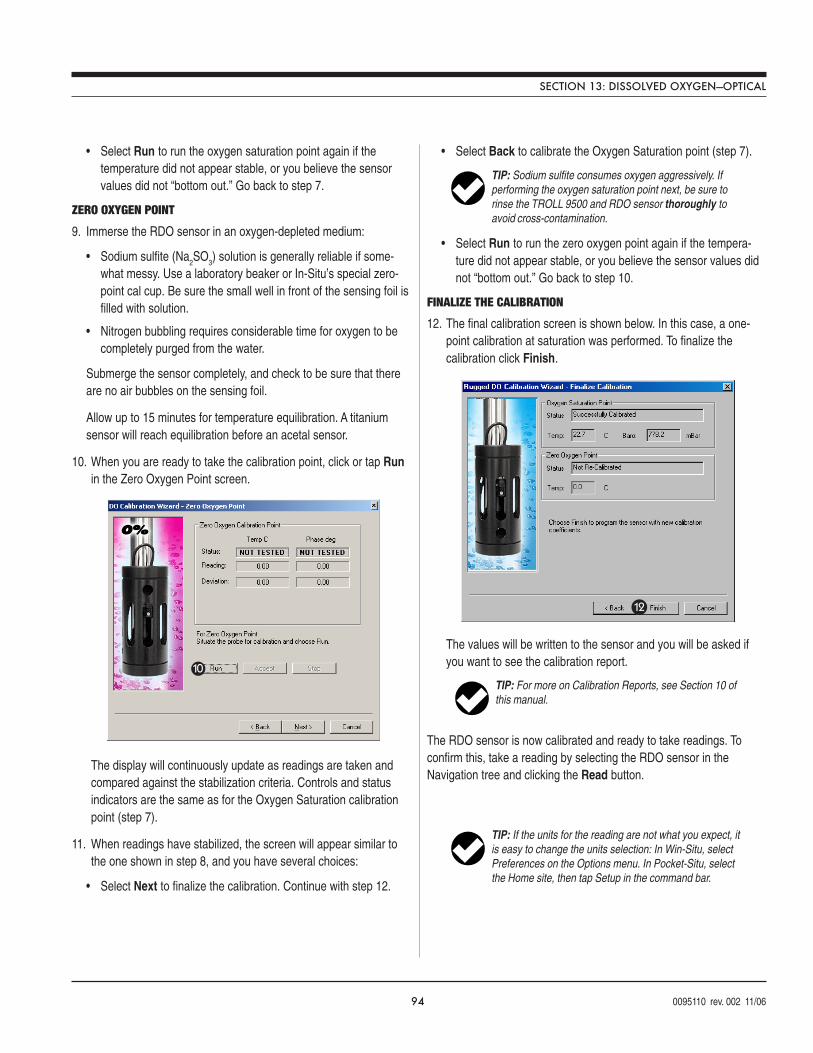
94 0095110 rev. 002 11/06
TIP: Sodium sulfite consumes oxygen aggressively. Ifperforming the oxygen saturation point next, be sure torinse the TROLL 9500 and RDO sensor thoroughly toavoid cross-contamination.
12
TIP: For more on Calibration Reports, see Section 10 ofthis manual.
SECTION 13: DISSOLVED OXYGEN—OPTICAL
• Select Run to run the oxygen saturation point again if thetemperature did not appear stable, or you believe the sensorvalues did not “bottom out.” Go back to step 7.
ZERO OXYGEN POINT
9. Immerse the RDO sensor in an oxygen-depleted medium:
• Sodium sulfite (Na2SO
3) solution is generally reliable if some-
what messy. Use a laboratory beaker or In-Situ’s special zero-point cal cup. Be sure the small well in front of the sensing foil isfilled with solution.
• Nitrogen bubbling requires considerable time for oxygen to becompletely purged from the water.
Submerge the sensor completely, and check to be sure that thereare no air bubbles on the sensing foil.
Allow up to 15 minutes for temperature equilibration. A titaniumsensor will reach equilibration before an acetal sensor.
10. When you are ready to take the calibration point, click or tap Runin the Zero Oxygen Point screen.
The display will continuously update as readings are taken andcompared against the stabilization criteria. Controls and statusindicators are the same as for the Oxygen Saturation calibrationpoint (step 7).
11. When readings have stabilized, the screen will appear similar tothe one shown in step 8, and you have several choices:
• Select Next to finalize the calibration. Continue with step 12.
• Select Back to calibrate the Oxygen Saturation point (step 7).
• Select Run to run the zero oxygen point again if the tempera-ture did not appear stable, or you believe the sensor values didnot “bottom out.” Go back to step 10.
FINALIZE THE CALIBRATION
12. The final calibration screen is shown below. In this case, a one-point calibration at saturation was performed. To finalize thecalibration click Finish.
The values will be written to the sensor and you will be asked ifyou want to see the calibration report.
The RDO sensor is now calibrated and ready to take readings. Toconfirm this, take a reading by selecting the RDO sensor in theNavigation tree and clicking the Read button.
10
TIP: If the units for the reading are not what you expect, itis easy to change the units selection: In Win-Situ, selectPreferences on the Options menu. In Pocket-Situ, selectthe Home site, then tap Setup in the command bar.
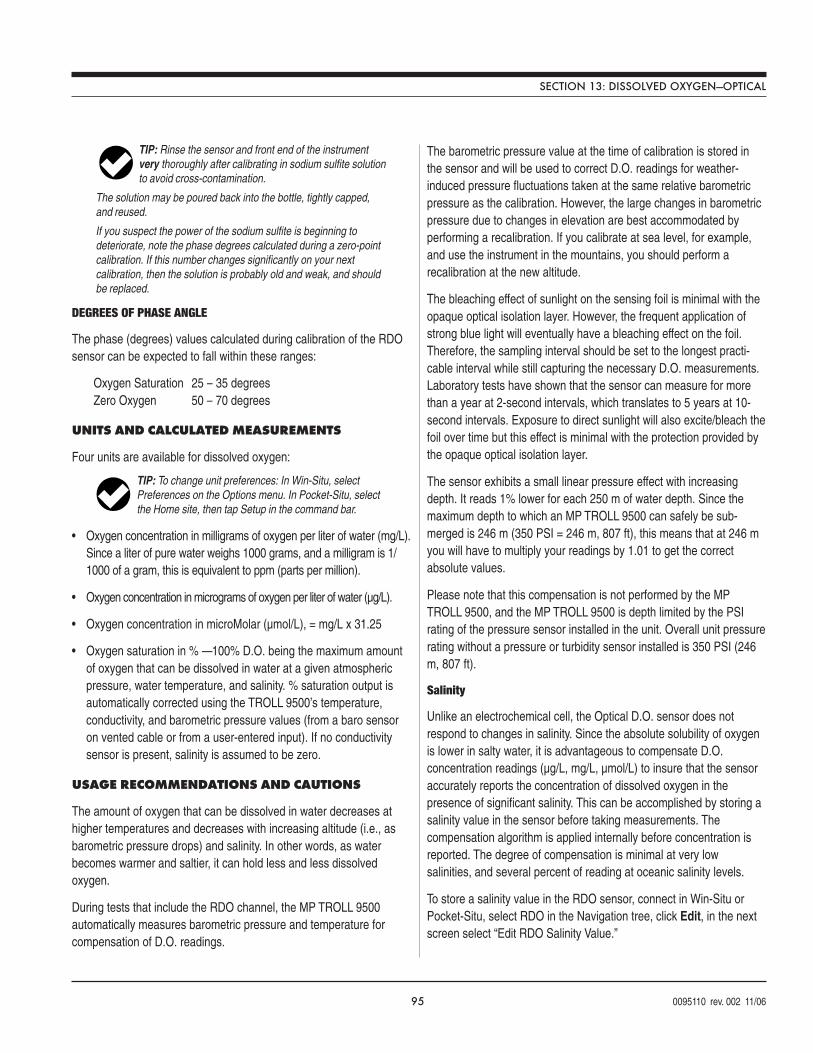
95 0095110 rev. 002 11/06
SECTION 13: DISSOLVED OXYGEN—OPTICAL
DEGREES OF PHASE ANGLE
The phase (degrees) values calculated during calibration of the RDOsensor can be expected to fall within these ranges:
Oxygen Saturation 25 – 35 degreesZero Oxygen 50 – 70 degrees
UNITS AND CALCULATED MEASUREMENTS
Four units are available for dissolved oxygen:
• Oxygen concentration in milligrams of oxygen per liter of water (mg/L).Since a liter of pure water weighs 1000 grams, and a milligram is 1/1000 of a gram, this is equivalent to ppm (parts per million).
• Oxygen concentration in micrograms of oxygen per liter of water (µg/L).
• Oxygen concentration in microMolar (µmol/L), = mg/L x 31.25
• Oxygen saturation in % —100% D.O. being the maximum amountof oxygen that can be dissolved in water at a given atmosphericpressure, water temperature, and salinity. % saturation output isautomatically corrected using the TROLL 9500’s temperature,conductivity, and barometric pressure values (from a baro sensoron vented cable or from a user-entered input). If no conductivitysensor is present, salinity is assumed to be zero.
USAGE RECOMMENDATIONS AND CAUTIONS
The amount of oxygen that can be dissolved in water decreases athigher temperatures and decreases with increasing altitude (i.e., asbarometric pressure drops) and salinity. In other words, as waterbecomes warmer and saltier, it can hold less and less dissolvedoxygen.
During tests that include the RDO channel, the MP TROLL 9500automatically measures barometric pressure and temperature forcompensation of D.O. readings.
The barometric pressure value at the time of calibration is stored inthe sensor and will be used to correct D.O. readings for weather-induced pressure fluctuations taken at the same relative barometricpressure as the calibration. However, the large changes in barometricpressure due to changes in elevation are best accommodated byperforming a recalibration. If you calibrate at sea level, for example,and use the instrument in the mountains, you should perform arecalibration at the new altitude.
The bleaching effect of sunlight on the sensing foil is minimal with theopaque optical isolation layer. However, the frequent application ofstrong blue light will eventually have a bleaching effect on the foil.Therefore, the sampling interval should be set to the longest practi-cable interval while still capturing the necessary D.O. measurements.Laboratory tests have shown that the sensor can measure for morethan a year at 2-second intervals, which translates to 5 years at 10-second intervals. Exposure to direct sunlight will also excite/bleach thefoil over time but this effect is minimal with the protection provided bythe opaque optical isolation layer.
The sensor exhibits a small linear pressure effect with increasingdepth. It reads 1% lower for each 250 m of water depth. Since themaximum depth to which an MP TROLL 9500 can safely be sub-merged is 246 m (350 PSI = 246 m, 807 ft), this means that at 246 myou will have to multiply your readings by 1.01 to get the correctabsolute values.
Please note that this compensation is not performed by the MPTROLL 9500, and the MP TROLL 9500 is depth limited by the PSIrating of the pressure sensor installed in the unit. Overall unit pressurerating without a pressure or turbidity sensor installed is 350 PSI (246m, 807 ft).
Salinity
Unlike an electrochemical cell, the Optical D.O. sensor does notrespond to changes in salinity. Since the absolute solubility of oxygenis lower in salty water, it is advantageous to compensate D.O.concentration readings (µg/L, mg/L, µmol/L) to insure that the sensoraccurately reports the concentration of dissolved oxygen in thepresence of significant salinity. This can be accomplished by storing asalinity value in the sensor before taking measurements. Thecompensation algorithm is applied internally before concentration isreported. The degree of compensation is minimal at very lowsalinities, and several percent of reading at oceanic salinity levels.
To store a salinity value in the RDO sensor, connect in Win-Situ orPocket-Situ, select RDO in the Navigation tree, click Edit, in the nextscreen select “Edit RDO Salinity Value.”
TIP: To change unit preferences: In Win-Situ, selectPreferences on the Options menu. In Pocket-Situ, selectthe Home site, then tap Setup in the command bar.
TIP: Rinse the sensor and front end of the instrumentvery thoroughly after calibrating in sodium sulfite solutionto avoid cross-contamination.
The solution may be poured back into the bottle, tightly capped,and reused.
If you suspect the power of the sodium sulfite is beginning todeteriorate, note the phase degrees calculated during a zero-pointcalibration. If this number changes significantly on your nextcalibration, then the solution is probably old and weak, and shouldbe replaced.
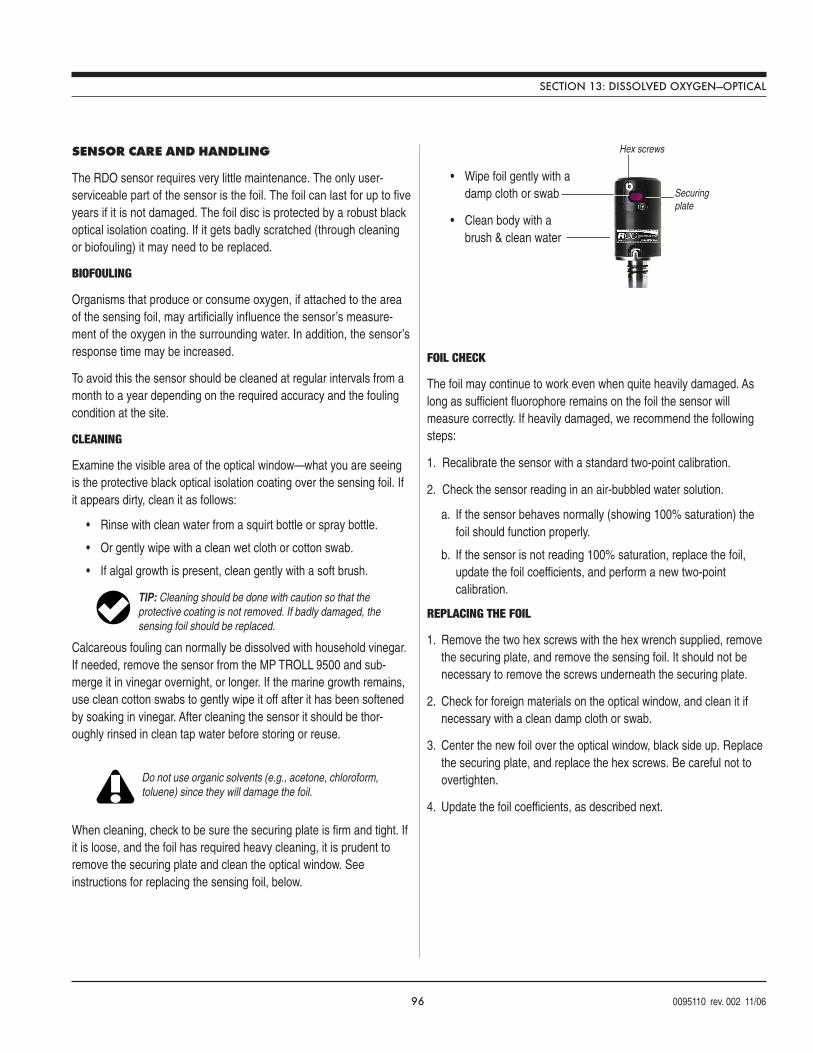
96 0095110 rev. 002 11/06
SECTION 13: DISSOLVED OXYGEN—OPTICAL
SENSOR CARE AND HANDLING
The RDO sensor requires very little maintenance. The only user-serviceable part of the sensor is the foil. The foil can last for up to fiveyears if it is not damaged. The foil disc is protected by a robust blackoptical isolation coating. If it gets badly scratched (through cleaningor biofouling) it may need to be replaced.
BIOFOULING
Organisms that produce or consume oxygen, if attached to the areaof the sensing foil, may artificially influence the sensor’s measure-ment of the oxygen in the surrounding water. In addition, the sensor’sresponse time may be increased.
To avoid this the sensor should be cleaned at regular intervals from amonth to a year depending on the required accuracy and the foulingcondition at the site.
CLEANING
Examine the visible area of the optical window—what you are seeingis the protective black optical isolation coating over the sensing foil. Ifit appears dirty, clean it as follows:
• Rinse with clean water from a squirt bottle or spray bottle.
• Or gently wipe with a clean wet cloth or cotton swab.
• If algal growth is present, clean gently with a soft brush.
Calcareous fouling can normally be dissolved with household vinegar.If needed, remove the sensor from the MP TROLL 9500 and sub-merge it in vinegar overnight, or longer. If the marine growth remains,use clean cotton swabs to gently wipe it off after it has been softenedby soaking in vinegar. After cleaning the sensor it should be thor-oughly rinsed in clean tap water before storing or reuse.
When cleaning, check to be sure the securing plate is firm and tight. Ifit is loose, and the foil has required heavy cleaning, it is prudent toremove the securing plate and clean the optical window. Seeinstructions for replacing the sensing foil, below.
TIP: Cleaning should be done with caution so that theprotective coating is not removed. If badly damaged, thesensing foil should be replaced.
• Wipe foil gently with adamp cloth or swab
• Clean body with abrush & clean water
Securingplate
Hex screws
Do not use organic solvents (e.g., acetone, chloroform,toluene) since they will damage the foil.
FOIL CHECK
The foil may continue to work even when quite heavily damaged. Aslong as sufficient fluorophore remains on the foil the sensor willmeasure correctly. If heavily damaged, we recommend the followingsteps:
1. Recalibrate the sensor with a standard two-point calibration.
2. Check the sensor reading in an air-bubbled water solution.
a. If the sensor behaves normally (showing 100% saturation) thefoil should function properly.
b. If the sensor is not reading 100% saturation, replace the foil,update the foil coefficients, and perform a new two-pointcalibration.
REPLACING THE FOIL
1. Remove the two hex screws with the hex wrench supplied, removethe securing plate, and remove the sensing foil. It should not benecessary to remove the screws underneath the securing plate.
2. Check for foreign materials on the optical window, and clean it ifnecessary with a clean damp cloth or swab.
3. Center the new foil over the optical window, black side up. Replacethe securing plate, and replace the hex screws. Be careful not toovertighten.
4. Update the foil coefficients, as described next.
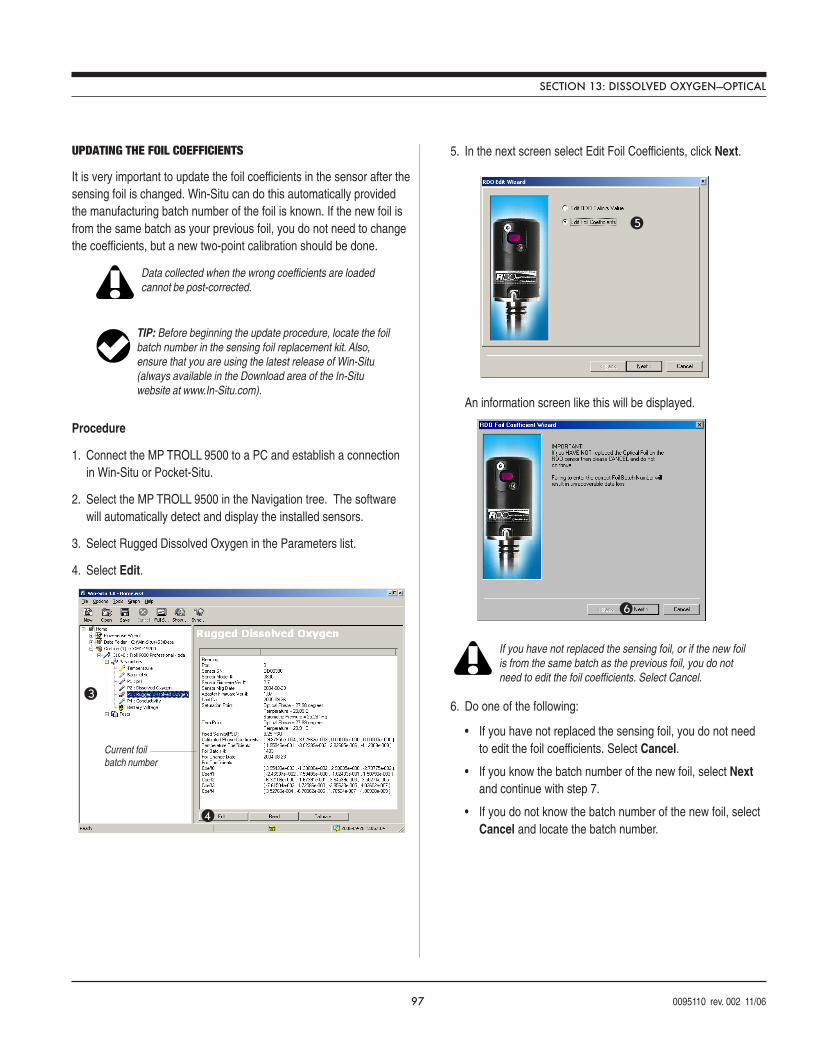
97 0095110 rev. 002 11/06
SECTION 13: DISSOLVED OXYGEN—OPTICAL
6
5
Data collected when the wrong coefficients are loadedcannot be post-corrected.
TIP: Before beginning the update procedure, locate the foilbatch number in the sensing foil replacement kit. Also,ensure that you are using the latest release of Win-Situ(always available in the Download area of the In-Situwebsite at www.In-Situ.com).
3
4
Current foilbatch number
UPDATING THE FOIL COEFFICIENTS
It is very important to update the foil coefficients in the sensor after thesensing foil is changed. Win-Situ can do this automatically providedthe manufacturing batch number of the foil is known. If the new foil isfrom the same batch as your previous foil, you do not need to changethe coefficients, but a new two-point calibration should be done.
Procedure
1. Connect the MP TROLL 9500 to a PC and establish a connectionin Win-Situ or Pocket-Situ.
2. Select the MP TROLL 9500 in the Navigation tree. The softwarewill automatically detect and display the installed sensors.
3. Select Rugged Dissolved Oxygen in the Parameters list.
4. Select Edit.
5. In the next screen select Edit Foil Coefficients, click Next.
An information screen like this will be displayed.
6. Do one of the following:
• If you have not replaced the sensing foil, you do not needto edit the foil coefficients. Select Cancel.
• If you know the batch number of the new foil, select Nextand continue with step 7.
• If you do not know the batch number of the new foil, selectCancel and locate the batch number.
If you have not replaced the sensing foil, or if the new foilis from the same batch as the previous foil, you do notneed to edit the foil coefficients. Select Cancel.
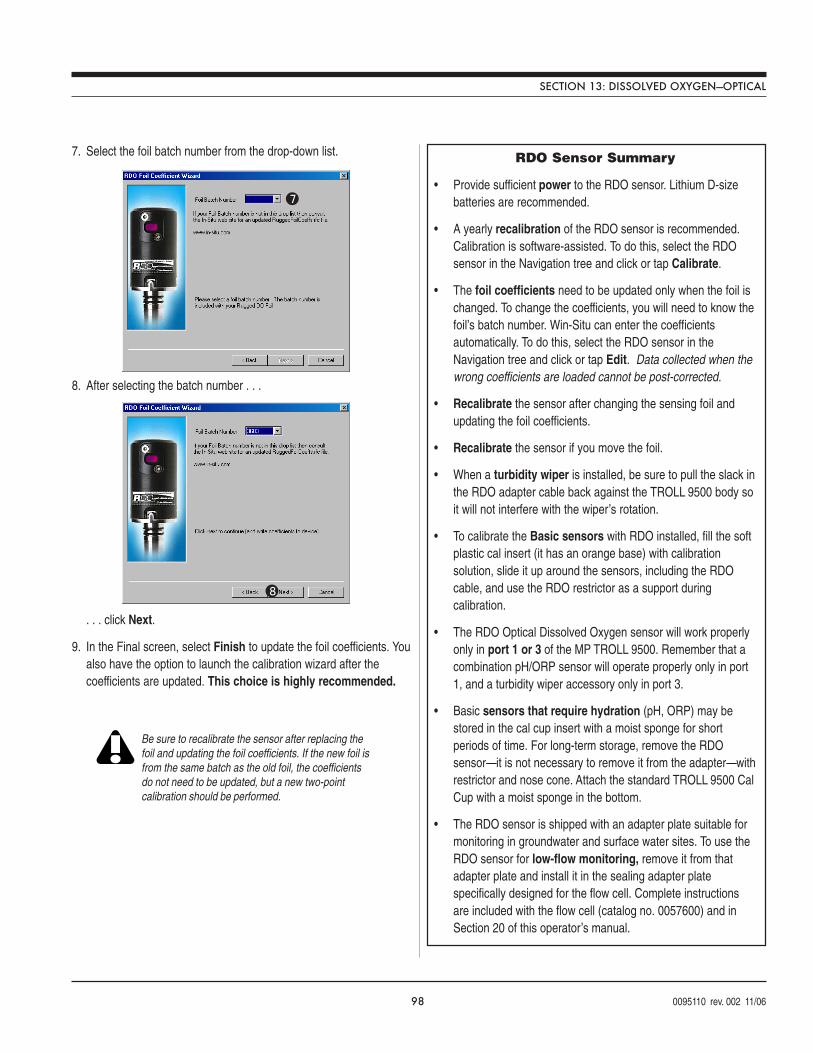
98 0095110 rev. 002 11/06
SECTION 13: DISSOLVED OXYGEN—OPTICAL
Be sure to recalibrate the sensor after replacing thefoil and updating the foil coefficients. If the new foil isfrom the same batch as the old foil, the coefficientsdo not need to be updated, but a new two-pointcalibration should be performed.
8
7
7. Select the foil batch number from the drop-down list.
8. After selecting the batch number . . .
. . . click Next.
9. In the Final screen, select Finish to update the foil coefficients. Youalso have the option to launch the calibration wizard after thecoefficients are updated. This choice is highly recommended.
RDO Sensor Summary
• Provide sufficient power to the RDO sensor. Lithium D-sizebatteries are recommended.
• A yearly recalibration of the RDO sensor is recommended.Calibration is software-assisted. To do this, select the RDOsensor in the Navigation tree and click or tap Calibrate.
• The foil coefficients need to be updated only when the foil ischanged. To change the coefficients, you will need to know thefoil’s batch number. Win-Situ can enter the coefficientsautomatically. To do this, select the RDO sensor in theNavigation tree and click or tap Edit. Data collected when thewrong coefficients are loaded cannot be post-corrected.
• Recalibrate the sensor after changing the sensing foil andupdating the foil coefficients.
• Recalibrate the sensor if you move the foil.
• When a turbidity wiper is installed, be sure to pull the slack inthe RDO adapter cable back against the TROLL 9500 body soit will not interfere with the wiper’s rotation.
• To calibrate the Basic sensors with RDO installed, fill the softplastic cal insert (it has an orange base) with calibrationsolution, slide it up around the sensors, including the RDOcable, and use the RDO restrictor as a support duringcalibration.
• The RDO Optical Dissolved Oxygen sensor will work properlyonly in port 1 or 3 of the MP TROLL 9500. Remember that acombination pH/ORP sensor will operate properly only in port1, and a turbidity wiper accessory only in port 3.
• Basic sensors that require hydration (pH, ORP) may bestored in the cal cup insert with a moist sponge for shortperiods of time. For long-term storage, remove the RDOsensor—it is not necessary to remove it from the adapter—withrestrictor and nose cone. Attach the standard TROLL 9500 CalCup with a moist sponge in the bottom.
• The RDO sensor is shipped with an adapter plate suitable formonitoring in groundwater and surface water sites. To use theRDO sensor for low-flow monitoring, remove it from thatadapter plate and install it in the sealing adapter platespecifically designed for the flow cell. Complete instructionsare included with the flow cell (catalog no. 0057600) and inSection 20 of this operator’s manual.
99 0095110 rev. 002 11/06
Multi-ParameterWater Quality TROLL®
14 OXIDATION-REDUCTION POTENTIAL
Fluid ORP (mV)
Properly chlorinated swimming pool > 700Salt water aquarium ~ 350Harmful to aquatic life > 400
Typical ORP values
WHAT IS ORP?
Oxidation Reduction Potential (ORP) is a measure of a watersystem’s capacity to either release or gain electrons in chemicalreactions. The process of oxidation involves losing electrons whilereduction involves gaining electrons. Oxidation and reduction (redox)reactions control the behavior of many chemical constituents indrinking water, wastewater, and aquatic environments. The reactivityand solubility of critical elements in living systems is strongly depen-dent on redox conditions. ORP values are used much like pH valuesto determine water quality. While pH values characterize the relativestate of a system for receiving or donating hydrogen ions (acting as abase or an acid), ORP values characterize the relative state of asystem for gaining or losing electrons. ORP values are affected by alloxidizing and reducing agents, not just acids and bases.
WHY MEASURE ORP?
The effect that potable water has on plumbing is directly related to itsORP value. Unfavorable values can cause excessive corrosion,leading to expensive repairs. ORP is one parameter that can bemonitored during the disinfecting process for drinking water, swimmingpool water, and spa water.
The life expectancy of bacteria in water is related to ORP. In fact,studies have shown that the life span of bacteria in water is moredependent on the ORP value than on the chlorine concentration. Forswimming pools at a normal pH value between 7.2 and 7.6, the ORPvalue must be kept above 700 mV to kill unwanted organisms.
Hypochlorite or other oxidizing agents must be added when the ORPfalls below 700 mV. In contrast, natural waters need a much lowerORP value in order to support life. Generally ORP values above 400mV are harmful to aquatic life. Ideally the ORP value in salt wateraquariums should be kept between 350 and 390 mV. ORP levelsbelow 300 mV are to be avoided. An oxidizing environment is neededto convert any ammonia (NH3) to nitrites (NO2
–) and nitrates (NO3–).
Ammonia levels as low as 0.002 mg/l can be harmful to some fishspecies.
The determination of ORP is particularly worthwhile in water thatcontains a relatively high concentration of a redox-active species, e.g.,the salts of many metals (Fe2
+, Fe3+) and strong oxidizing (chlorine)
and reducing (sulfite ion) agents. Thus, ORP can sometimes beutilized to track the metallic pollution of ground- or surface water, or todetermine the chlorine content of wastewater effluent. However, ORPis a nonspecific measurement—that is, the measured potential isreflective of a combination of the effects of all the dissolved species inthe medium. Because of this factor, the measurement of ORP inrelatively clean environmental water (ground, surface, estuarine, andmarine) has only limited utility unless a predominant redox-activespecies is known to be present. Care is required not to “over-interpret”ORP data unless specific information about the site is known.
THE ORP SENSOR
The operation of the ORP sensor is very similar to that of the pHsensor. A two-electrode system is used to make a potentiometricmeasurement. The ORP electrode serves as an electron donor orelectron acceptor depending upon the test solution. A referenceelectrode is used to supply a constant stable output for comparison.Electrical contact is made with the solution using a saturated potas-sium chloride (KCl) solution. The electrode behavior is described bythe Nernst equation:
Em = Eo - (RT/nF) ln [ox] / [red]
where
Em is the potential from the ORP electrode,
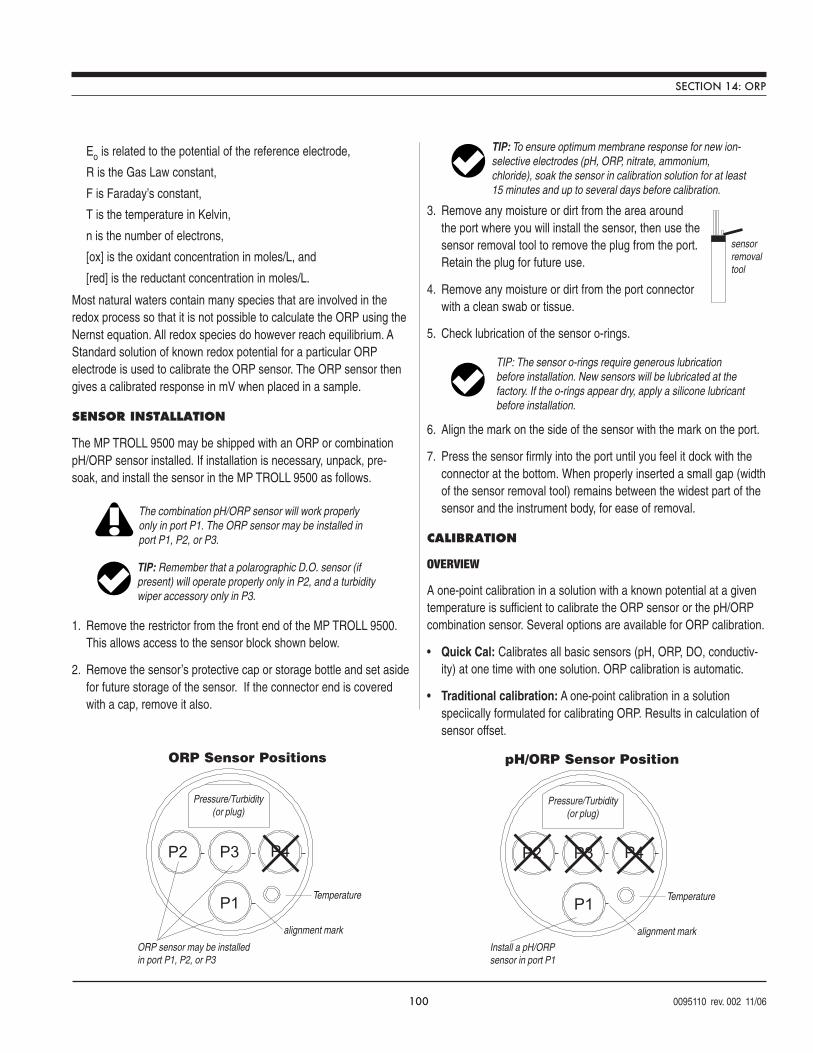
100 0095110 rev. 002 11/06
TIP: Remember that a polarographic D.O. sensor (ifpresent) will operate properly only in P2, and a turbiditywiper accessory only in P3.
The combination pH/ORP sensor will work properlyonly in port P1. The ORP sensor may be installed inport P1, P2, or P3.
TIP: To ensure optimum membrane response for new ion-selective electrodes (pH, ORP, nitrate, ammonium,chloride), soak the sensor in calibration solution for at least15 minutes and up to several days before calibration.
TIP: The sensor o-rings require generous lubricationbefore installation. New sensors will be lubricated at thefactory. If the o-rings appear dry, apply a silicone lubricantbefore installation.
sensorremovaltool
1
2 3 4
Pressure/Turbidity(or plug)
Temperature
ORP sensor may be installedin port P1, P2, or P3
P1
P2 P3 P4
alignment mark
ORP Sensor Positions
1
2 3 4
Pressure/Turbidity(or plug)
Temperature
Install a pH/ORPsensor in port P1
P1
P2 P3 P4
alignment mark
pH/ORP Sensor Position
Eo is related to the potential of the reference electrode,
R is the Gas Law constant,
F is Faraday’s constant,
T is the temperature in Kelvin,
n is the number of electrons,
[ox] is the oxidant concentration in moles/L, and
[red] is the reductant concentration in moles/L.
Most natural waters contain many species that are involved in theredox process so that it is not possible to calculate the ORP using theNernst equation. All redox species do however reach equilibrium. AStandard solution of known redox potential for a particular ORPelectrode is used to calibrate the ORP sensor. The ORP sensor thengives a calibrated response in mV when placed in a sample.
SENSOR INSTALLATION
The MP TROLL 9500 may be shipped with an ORP or combinationpH/ORP sensor installed. If installation is necessary, unpack, pre-soak, and install the sensor in the MP TROLL 9500 as follows.
1. Remove the restrictor from the front end of the MP TROLL 9500.This allows access to the sensor block shown below.
2. Remove the sensor’s protective cap or storage bottle and set asidefor future storage of the sensor. If the connector end is coveredwith a cap, remove it also.
3. Remove any moisture or dirt from the area aroundthe port where you will install the sensor, then use thesensor removal tool to remove the plug from the port.Retain the plug for future use.
4. Remove any moisture or dirt from the port connectorwith a clean swab or tissue.
5. Check lubrication of the sensor o-rings.
6. Align the mark on the side of the sensor with the mark on the port.
7. Press the sensor firmly into the port until you feel it dock with theconnector at the bottom. When properly inserted a small gap (widthof the sensor removal tool) remains between the widest part of thesensor and the instrument body, for ease of removal.
CALIBRATION
OVERVIEW
A one-point calibration in a solution with a known potential at a giventemperature is sufficient to calibrate the ORP sensor or the pH/ORPcombination sensor. Several options are available for ORP calibration.
• Quick Cal: Calibrates all basic sensors (pH, ORP, DO, conductiv-ity) at one time with one solution. ORP calibration is automatic.
• Traditional calibration: A one-point calibration in a solutionspeciically formulated for calibrating ORP. Results in calculation ofsensor offset.
SECTION 14: ORP
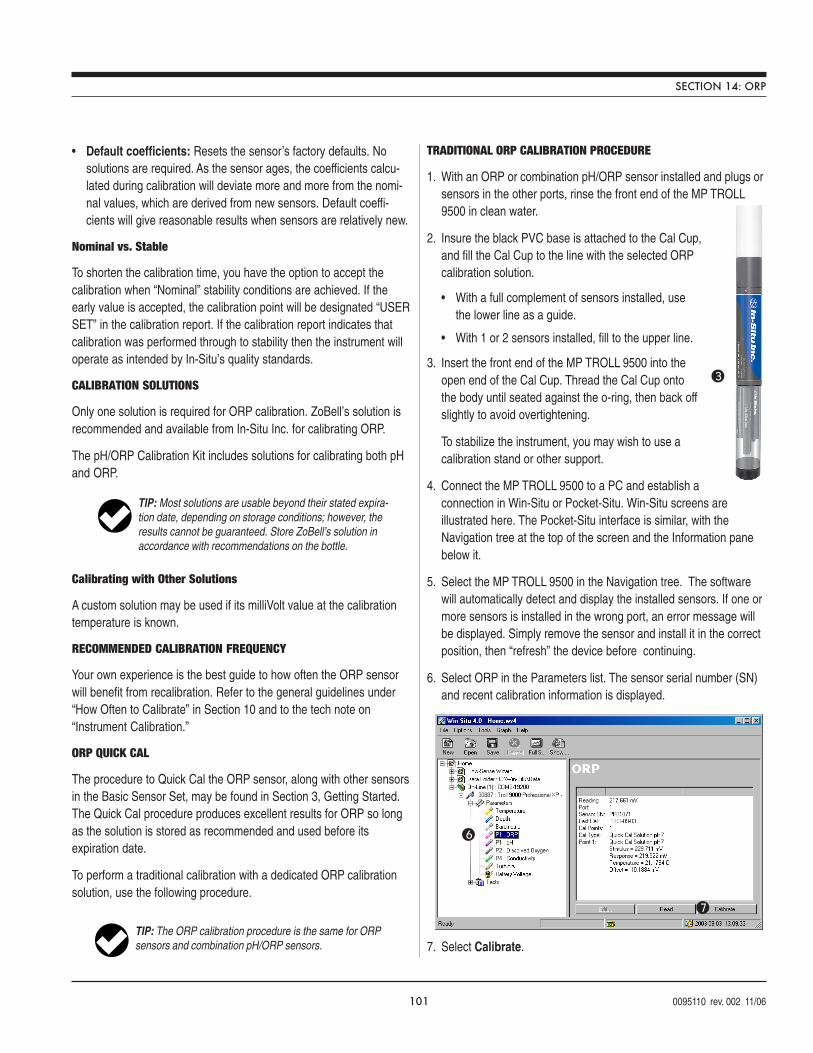
101 0095110 rev. 002 11/06
TIP: Most solutions are usable beyond their stated expira-tion date, depending on storage conditions; however, theresults cannot be guaranteed. Store ZoBell’s solution inaccordance with recommendations on the bottle.
TIP: The ORP calibration procedure is the same for ORPsensors and combination pH/ORP sensors.
6
7
• Default coefficients: Resets the sensor’s factory defaults. Nosolutions are required. As the sensor ages, the coefficients calcu-lated during calibration will deviate more and more from the nomi-nal values, which are derived from new sensors. Default coeffi-cients will give reasonable results when sensors are relatively new.
Nominal vs. Stable
To shorten the calibration time, you have the option to accept thecalibration when “Nominal” stability conditions are achieved. If theearly value is accepted, the calibration point will be designated “USERSET” in the calibration report. If the calibration report indicates thatcalibration was performed through to stability then the instrument willoperate as intended by In-Situ’s quality standards.
CALIBRATION SOLUTIONS
Only one solution is required for ORP calibration. ZoBell’s solution isrecommended and available from In-Situ Inc. for calibrating ORP.
The pH/ORP Calibration Kit includes solutions for calibrating both pHand ORP.
Calibrating with Other Solutions
A custom solution may be used if its milliVolt value at the calibrationtemperature is known.
RECOMMENDED CALIBRATION FREQUENCY
Your own experience is the best guide to how often the ORP sensorwill benefit from recalibration. Refer to the general guidelines under“How Often to Calibrate” in Section 10 and to the tech note on“Instrument Calibration.”
ORP QUICK CAL
The procedure to Quick Cal the ORP sensor, along with other sensorsin the Basic Sensor Set, may be found in Section 3, Getting Started.The Quick Cal procedure produces excellent results for ORP so longas the solution is stored as recommended and used before itsexpiration date.
To perform a traditional calibration with a dedicated ORP calibrationsolution, use the following procedure.
TRADITIONAL ORP CALIBRATION PROCEDURE
1. With an ORP or combination pH/ORP sensor installed and plugs orsensors in the other ports, rinse the front end of the MP TROLL9500 in clean water.
2. Insure the black PVC base is attached to the Cal Cup,and fill the Cal Cup to the line with the selected ORPcalibration solution.
• With a full complement of sensors installed, usethe lower line as a guide.
• With 1 or 2 sensors installed, fill to the upper line.
3. Insert the front end of the MP TROLL 9500 into theopen end of the Cal Cup. Thread the Cal Cup ontothe body until seated against the o-ring, then back offslightly to avoid overtightening.
To stabilize the instrument, you may wish to use acalibration stand or other support.
4. Connect the MP TROLL 9500 to a PC and establish aconnection in Win-Situ or Pocket-Situ. Win-Situ screens areillustrated here. The Pocket-Situ interface is similar, with theNavigation tree at the top of the screen and the Information panebelow it.
5. Select the MP TROLL 9500 in the Navigation tree. The softwarewill automatically detect and display the installed sensors. If one ormore sensors is installed in the wrong port, an error message willbe displayed. Simply remove the sensor and install it in the correctposition, then “refresh” the device before continuing.
6. Select ORP in the Parameters list. The sensor serial number (SN)and recent calibration information is displayed.
7. Select Calibrate.
SECTION 14: ORP
3
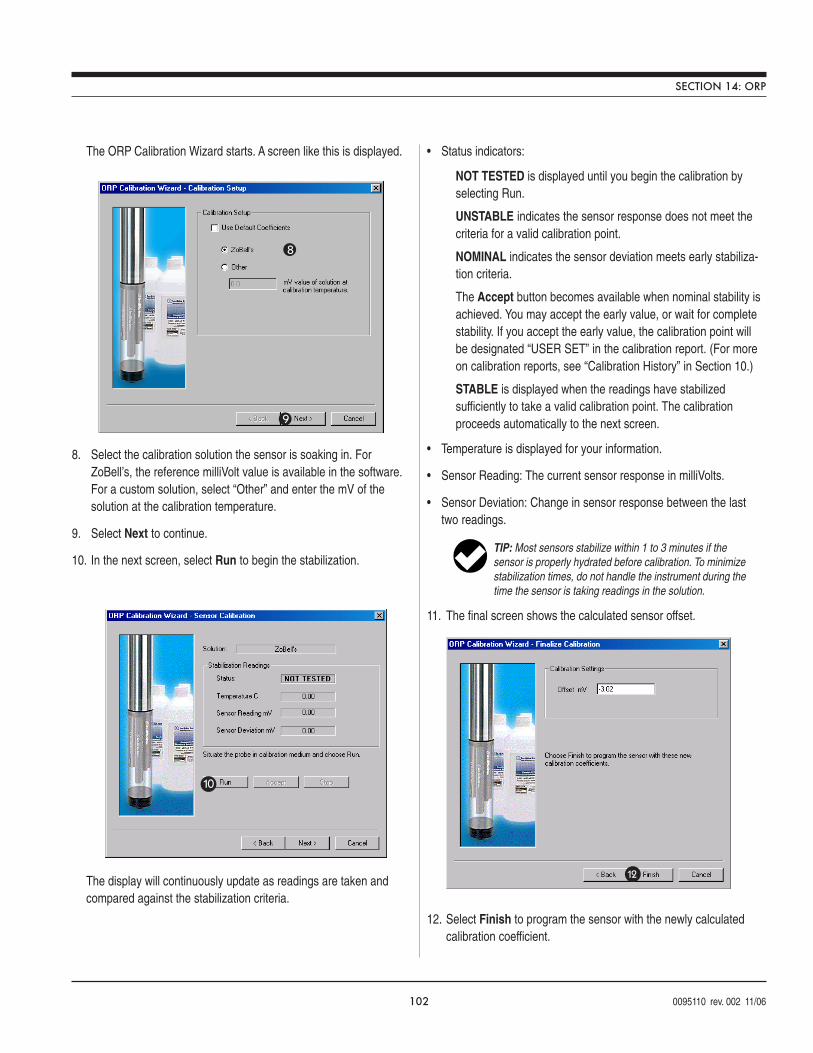
102 0095110 rev. 002 11/06
8
9
10
TIP: Most sensors stabilize within 1 to 3 minutes if thesensor is properly hydrated before calibration. To minimizestabilization times, do not handle the instrument during thetime the sensor is taking readings in the solution.
12
The ORP Calibration Wizard starts. A screen like this is displayed.
8. Select the calibration solution the sensor is soaking in. ForZoBell’s, the reference milliVolt value is available in the software.For a custom solution, select “Other” and enter the mV of thesolution at the calibration temperature.
9. Select Next to continue.
10. In the next screen, select Run to begin the stabilization.
The display will continuously update as readings are taken andcompared against the stabilization criteria.
• Status indicators:
NOT TESTED is displayed until you begin the calibration byselecting Run.
UNSTABLE indicates the sensor response does not meet thecriteria for a valid calibration point.
NOMINAL indicates the sensor deviation meets early stabiliza-tion criteria.
The Accept button becomes available when nominal stability isachieved. You may accept the early value, or wait for completestability. If you accept the early value, the calibration point willbe designated “USER SET” in the calibration report. (For moreon calibration reports, see “Calibration History” in Section 10.)
STABLE is displayed when the readings have stabilizedsufficiently to take a valid calibration point. The calibrationproceeds automatically to the next screen.
• Temperature is displayed for your information.
• Sensor Reading: The current sensor response in milliVolts.
• Sensor Deviation: Change in sensor response between the lasttwo readings.
11. The final screen shows the calculated sensor offset.
12. Select Finish to program the sensor with the newly calculatedcalibration coefficient.
SECTION 14: ORP
103 0095110 rev. 002 11/06
TIP: You can look at the calibration report right aftercalibrating, or at any time. See “Calibration History” inSection 10 for details.
TIP: The calibration solution may be flushed down thedrain with running water, or saved in a separate containerand used to rinse the next time you calibrate with the samesolution.
The ORP sensor is now calibrated and ready to use.
Options for storing sensors:
• If the instrument will be used in a day or so, leave the sensorsinstalled. Remove the Cal Cup and rinse it and the sensors.Moisten a sponge and place it in the bottom of the Cal Cup, or adda little water (deionized, distilled, or tap)—just enough to create amoist environment. Return the probe to the Cal Cup for transport tothe field site.
• For longer storage, remove the sensor from the instrument andplace in the electrode storage bottle (located in the sensor kit) inthe conditioning solution in which it was shipped, or with a spongemoistened with pH4 buffer to avoid depleting the referencesolution. For longer-term storage, see the section on Sensor Careand Handling at the end of this chapter.
RESETTING DEFAULT COEFFICIENTS
The sensor’s calibration may be reset back to factory defaults at anytime. This option is most effective when the sensor is new.
1. With an ORP or combination pH/ORP sensor installed, establish aconnection to the instrument in Win-Situ or Pocket-Situ.
2. Select ORP in the Parameters list and click Calibrate.
3. In the first screen, select Use Nominal Coefficients, then Next.
4. In the final screen, click Finish to send the values to the sensor.
UNITS AND CALCULATED MEASUREMENTS
Readings from the ORP channel may be displayed in Volts or milli-Volts. No calculated measurements are available.
Normalization to Standard Hydrogen Electrode Values
ORP values are dependent on solution composition, temperature, andthe type of sensor used. ORP (Eh) values reported in the literature areoften normalized to the standard hydrogen electrode as a standardreference electrode. Since the standard hydrogen electrode isextremely fragile, it is impractical to use in the field. In-Situ’s sensor
uses a silver/silver-chloride reference electrode in place of thestandard hydrogen electrode.
The following equation may be used to normalize the readingsreported by our sensor calibrated with our solution to standardhydrogen electrode values (±50 mV).
ORPSHE = ORPobserved + 215.81 – TC ∗ [0.77942 + TC ∗ 0.001934]
where
ORPSHE is the sample potential relative to the standard hydro-gen electrode
ORPobserved is the sample potential relative to the In-Situ referenceelectrode
TC
is the sample temperature in °C
ORP measured by a sensor immersed in a solution should not beequated with thermodynamic Eh. Differences may occur due to lack ofchemical equilibrium, presence of multiple redox couples, sensorpoisoning, and other factors.
In addition, like all platinum ORP electrodes, In-Situ’s ORP sensormay give unstable readings in solutions containing chromous,vanadous, titanous, and other ions that are stronger reducing agentsthan hydrogen or platinum.
USAGE RECOMMENDATIONS AND CAUTIONS
• ORP calibration is not absolutely necessary if the sensor is in goodworking condition. If it is, then the sensor “deviation” reportedduring calibration is usually less than the sensor’s accuracyspecification.
• ORP readings vary slightly with temperature, but are not easilycorrected because, unlike pH, the ORP value depends on theactivity of many ions in solution. pH values are more easilycorrected because they are due to the activity of one ion, H+.
• The pH/ORP sensor is designed for optimal operation at an angleof 30° or more from horizontal.
• The ORP sensor may be operated horizontally.
SECTION 14: ORP
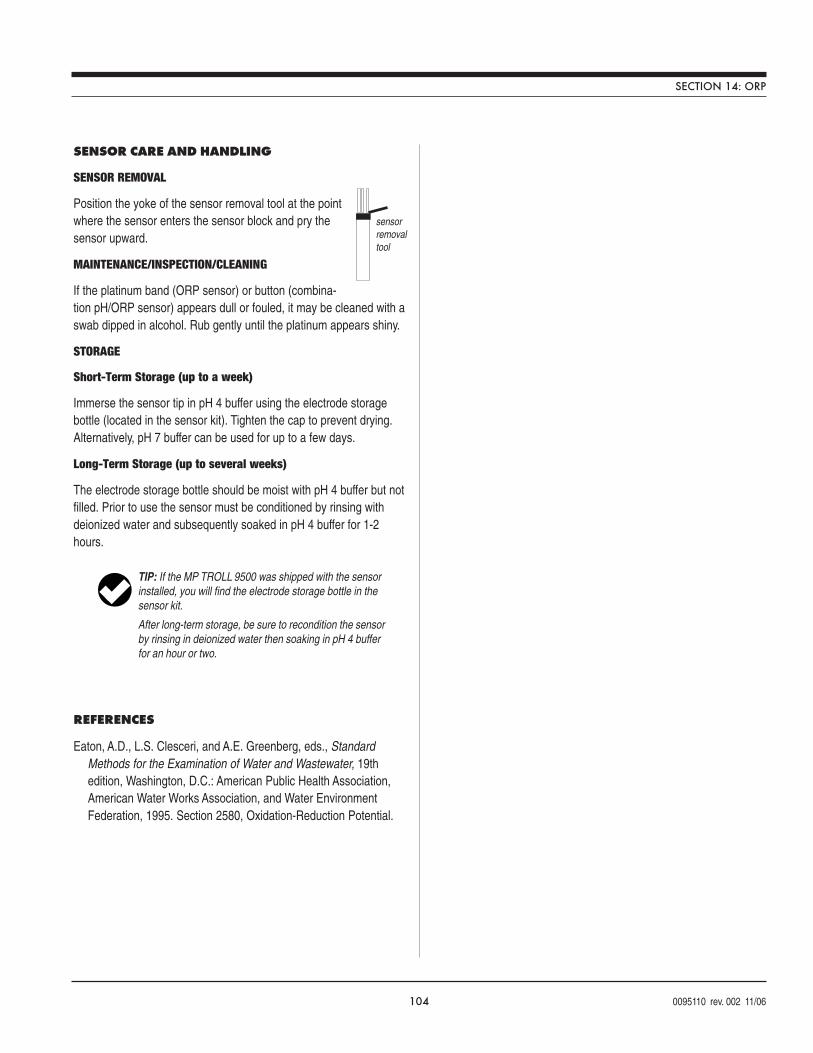
104 0095110 rev. 002 11/06
sensorremovaltool
TIP: If the MP TROLL 9500 was shipped with the sensorinstalled, you will find the electrode storage bottle in thesensor kit.
After long-term storage, be sure to recondition the sensorby rinsing in deionized water then soaking in pH 4 bufferfor an hour or two.
SENSOR CARE AND HANDLING
SENSOR REMOVAL
Position the yoke of the sensor removal tool at the pointwhere the sensor enters the sensor block and pry thesensor upward.
MAINTENANCE/INSPECTION/CLEANING
If the platinum band (ORP sensor) or button (combina-tion pH/ORP sensor) appears dull or fouled, it may be cleaned with aswab dipped in alcohol. Rub gently until the platinum appears shiny.
STORAGE
Short-Term Storage (up to a week)
Immerse the sensor tip in pH 4 buffer using the electrode storagebottle (located in the sensor kit). Tighten the cap to prevent drying.Alternatively, pH 7 buffer can be used for up to a few days.
Long-Term Storage (up to several weeks)
The electrode storage bottle should be moist with pH 4 buffer but notfilled. Prior to use the sensor must be conditioned by rinsing withdeionized water and subsequently soaked in pH 4 buffer for 1-2hours.
REFERENCES
Eaton, A.D., L.S. Clesceri, and A.E. Greenberg, eds., StandardMethods for the Examination of Water and Wastewater, 19thedition, Washington, D.C.: American Public Health Association,American Water Works Association, and Water EnvironmentFederation, 1995. Section 2580, Oxidation-Reduction Potential.
SECTION 14: ORP
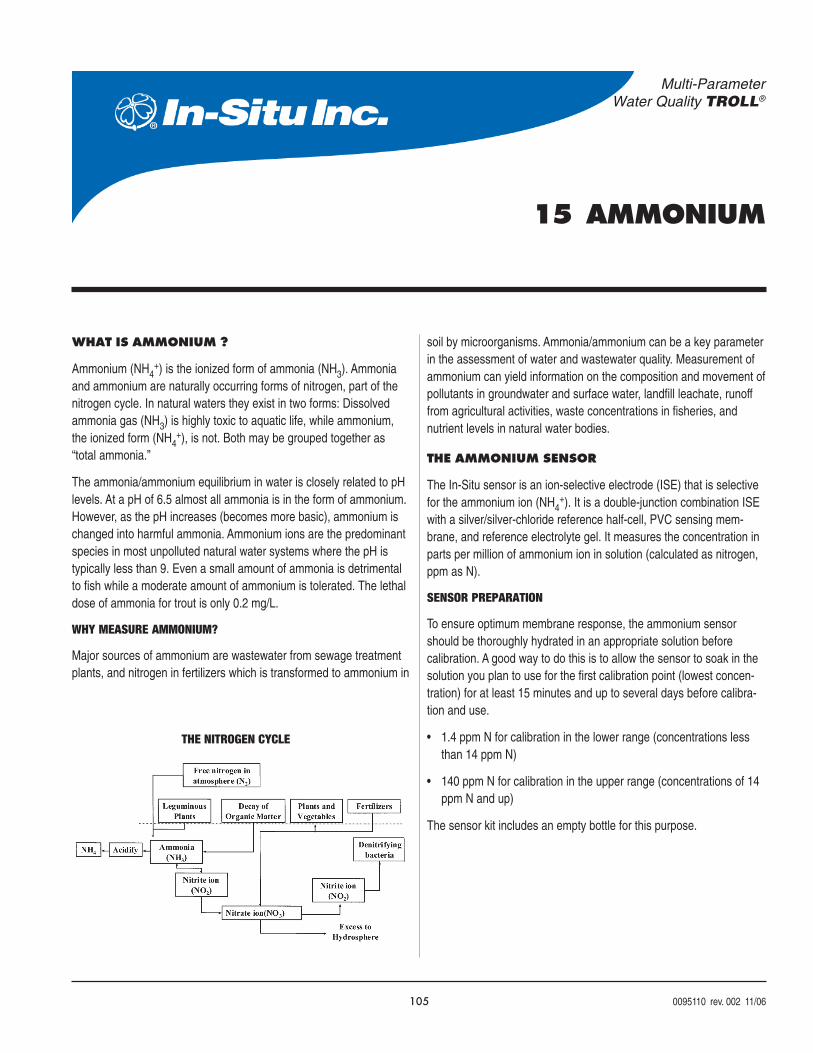
105 0095110 rev. 002 11/06
Multi-ParameterWater Quality TROLL®
15 AMMONIUM
WHAT IS AMMONIUM ?
Ammonium (NH4+) is the ionized form of ammonia (NH3). Ammonia
and ammonium are naturally occurring forms of nitrogen, part of thenitrogen cycle. In natural waters they exist in two forms: Dissolvedammonia gas (NH3) is highly toxic to aquatic life, while ammonium,the ionized form (NH4
+), is not. Both may be grouped together as“total ammonia.”
The ammonia/ammonium equilibrium in water is closely related to pHlevels. At a pH of 6.5 almost all ammonia is in the form of ammonium.However, as the pH increases (becomes more basic), ammonium ischanged into harmful ammonia. Ammonium ions are the predominantspecies in most unpolluted natural water systems where the pH istypically less than 9. Even a small amount of ammonia is detrimentalto fish while a moderate amount of ammonium is tolerated. The lethaldose of ammonia for trout is only 0.2 mg/L.
WHY MEASURE AMMONIUM?
Major sources of ammonium are wastewater from sewage treatmentplants, and nitrogen in fertilizers which is transformed to ammonium in
soil by microorganisms. Ammonia/ammonium can be a key parameterin the assessment of water and wastewater quality. Measurement ofammonium can yield information on the composition and movement ofpollutants in groundwater and surface water, landfill leachate, runofffrom agricultural activities, waste concentrations in fisheries, andnutrient levels in natural water bodies.
THE AMMONIUM SENSOR
The In-Situ sensor is an ion-selective electrode (ISE) that is selectivefor the ammonium ion (NH4
+). It is a double-junction combination ISEwith a silver/silver-chloride reference half-cell, PVC sensing mem-brane, and reference electrolyte gel. It measures the concentration inparts per million of ammonium ion in solution (calculated as nitrogen,ppm as N).
SENSOR PREPARATION
To ensure optimum membrane response, the ammonium sensorshould be thoroughly hydrated in an appropriate solution beforecalibration. A good way to do this is to allow the sensor to soak in thesolution you plan to use for the first calibration point (lowest concen-tration) for at least 15 minutes and up to several days before calibra-tion and use.
• 1.4 ppm N for calibration in the lower range (concentrations lessthan 14 ppm N)
• 140 ppm N for calibration in the upper range (concentrations of 14ppm N and up)
The sensor kit includes an empty bottle for this purpose.
THE NITROGEN CYCLE
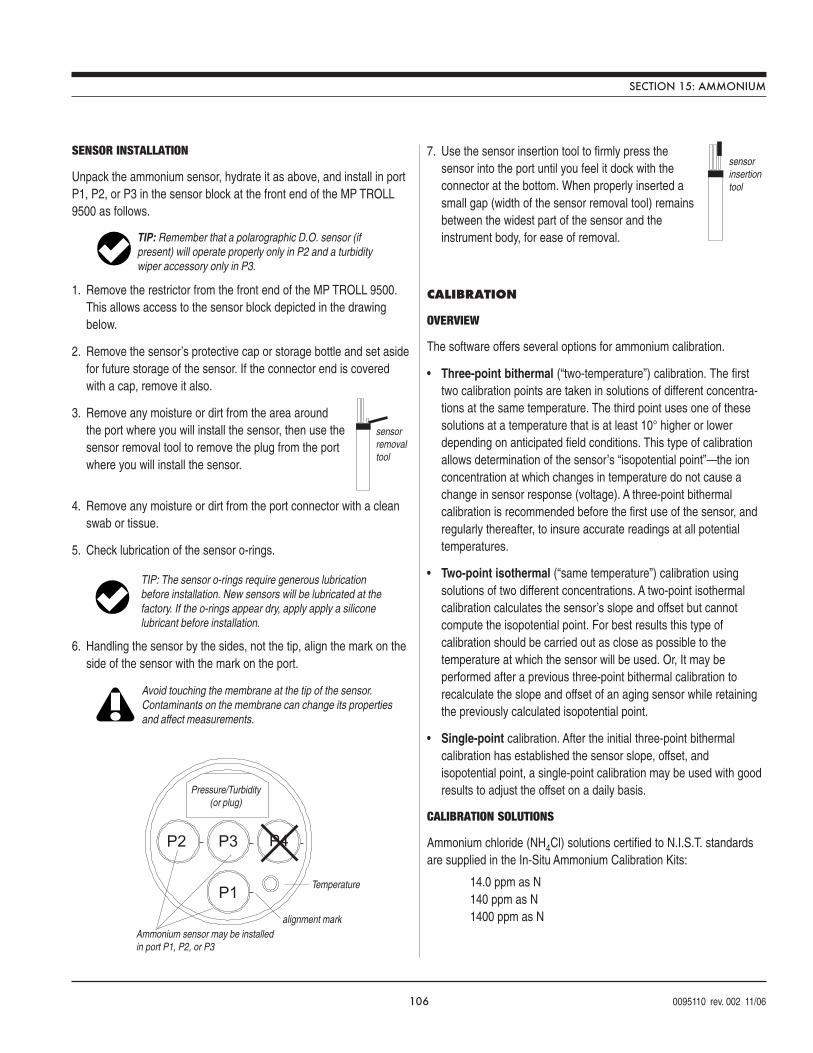
106 0095110 rev. 002 11/06
SENSOR INSTALLATION
Unpack the ammonium sensor, hydrate it as above, and install in portP1, P2, or P3 in the sensor block at the front end of the MP TROLL9500 as follows.
1. Remove the restrictor from the front end of the MP TROLL 9500.This allows access to the sensor block depicted in the drawingbelow.
2. Remove the sensor’s protective cap or storage bottle and set asidefor future storage of the sensor. If the connector end is coveredwith a cap, remove it also.
3. Remove any moisture or dirt from the area aroundthe port where you will install the sensor, then use thesensor removal tool to remove the plug from the portwhere you will install the sensor.
4. Remove any moisture or dirt from the port connector with a cleanswab or tissue.
5. Check lubrication of the sensor o-rings.
6. Handling the sensor by the sides, not the tip, align the mark on theside of the sensor with the mark on the port.
7. Use the sensor insertion tool to firmly press thesensor into the port until you feel it dock with theconnector at the bottom. When properly inserted asmall gap (width of the sensor removal tool) remainsbetween the widest part of the sensor and theinstrument body, for ease of removal.
CALIBRATION
OVERVIEW
The software offers several options for ammonium calibration.
• Three-point bithermal (“two-temperature”) calibration. The firsttwo calibration points are taken in solutions of different concentra-tions at the same temperature. The third point uses one of thesesolutions at a temperature that is at least 10° higher or lowerdepending on anticipated field conditions. This type of calibrationallows determination of the sensor’s “isopotential point”—the ionconcentration at which changes in temperature do not cause achange in sensor response (voltage). A three-point bithermalcalibration is recommended before the first use of the sensor, andregularly thereafter, to insure accurate readings at all potentialtemperatures.
• Two-point isothermal (“same temperature”) calibration usingsolutions of two different concentrations. A two-point isothermalcalibration calculates the sensor’s slope and offset but cannotcompute the isopotential point. For best results this type ofcalibration should be carried out as close as possible to thetemperature at which the sensor will be used. Or, It may beperformed after a previous three-point bithermal calibration torecalculate the slope and offset of an aging sensor while retainingthe previously calculated isopotential point.
• Single-point calibration. After the initial three-point bithermalcalibration has established the sensor slope, offset, andisopotential point, a single-point calibration may be used with goodresults to adjust the offset on a daily basis.
CALIBRATION SOLUTIONS
Ammonium chloride (NH4Cl) solutions certified to N.I.S.T. standardsare supplied in the In-Situ Ammonium Calibration Kits:
14.0 ppm as N140 ppm as N1400 ppm as N
TIP: The sensor o-rings require generous lubricationbefore installation. New sensors will be lubricated at thefactory. If the o-rings appear dry, apply apply a siliconelubricant before installation.
TIP: Remember that a polarographic D.O. sensor (ifpresent) will operate properly only in P2 and a turbiditywiper accessory only in P3.
sensorremovaltool
Avoid touching the membrane at the tip of the sensor.Contaminants on the membrane can change its propertiesand affect measurements.
sensorinsertiontool
1
2 3 4
Pressure/Turbidity(or plug)
Temperature
Ammonium sensor may be installedin port P1, P2, or P3
P1
P2 P3 P4
alignment mark
SECTION 15: AMMONIUM
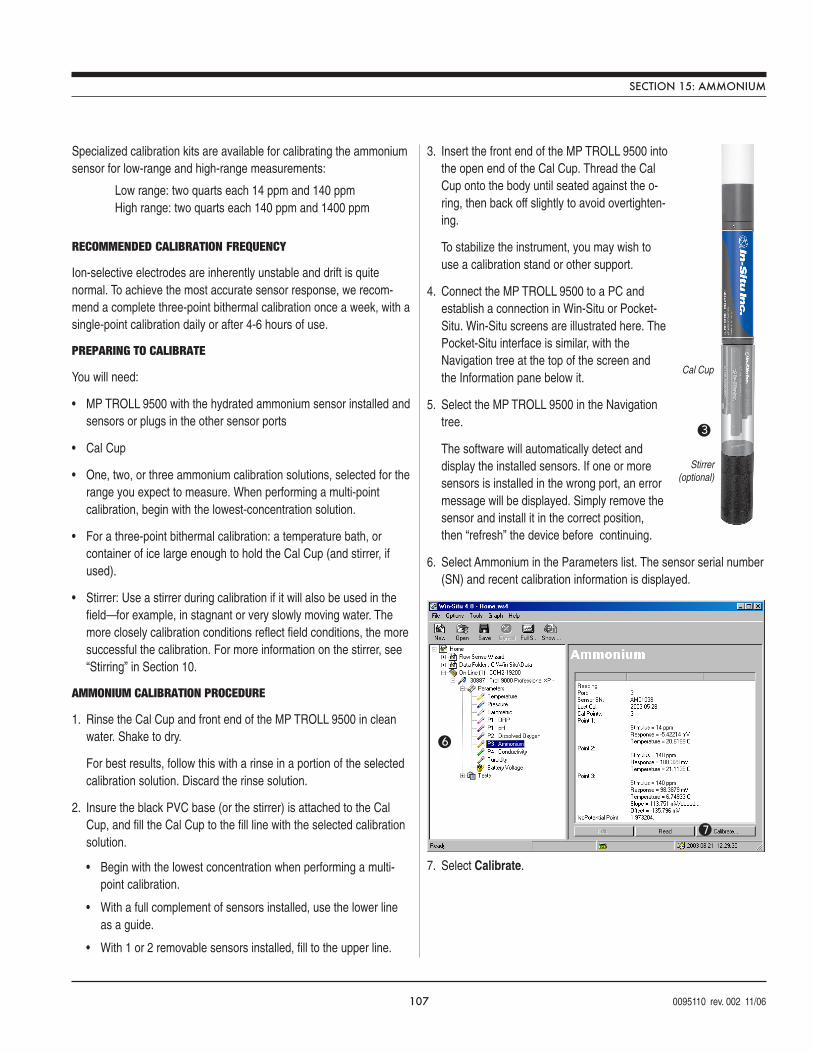
107 0095110 rev. 002 11/06
Specialized calibration kits are available for calibrating the ammoniumsensor for low-range and high-range measurements:
Low range: two quarts each 14 ppm and 140 ppmHigh range: two quarts each 140 ppm and 1400 ppm
RECOMMENDED CALIBRATION FREQUENCY
Ion-selective electrodes are inherently unstable and drift is quitenormal. To achieve the most accurate sensor response, we recom-mend a complete three-point bithermal calibration once a week, with asingle-point calibration daily or after 4-6 hours of use.
PREPARING TO CALIBRATE
You will need:
• MP TROLL 9500 with the hydrated ammonium sensor installed andsensors or plugs in the other sensor ports
• Cal Cup
• One, two, or three ammonium calibration solutions, selected for therange you expect to measure. When performing a multi-pointcalibration, begin with the lowest-concentration solution.
• For a three-point bithermal calibration: a temperature bath, orcontainer of ice large enough to hold the Cal Cup (and stirrer, ifused).
• Stirrer: Use a stirrer during calibration if it will also be used in thefield—for example, in stagnant or very slowly moving water. Themore closely calibration conditions reflect field conditions, the moresuccessful the calibration. For more information on the stirrer, see“Stirring” in Section 10.
AMMONIUM CALIBRATION PROCEDURE
1. Rinse the Cal Cup and front end of the MP TROLL 9500 in cleanwater. Shake to dry.
For best results, follow this with a rinse in a portion of the selectedcalibration solution. Discard the rinse solution.
2. Insure the black PVC base (or the stirrer) is attached to the CalCup, and fill the Cal Cup to the fill line with the selected calibrationsolution.
• Begin with the lowest concentration when performing a multi-point calibration.
• With a full complement of sensors installed, use the lower lineas a guide.
• With 1 or 2 removable sensors installed, fill to the upper line.
3. Insert the front end of the MP TROLL 9500 intothe open end of the Cal Cup. Thread the CalCup onto the body until seated against the o-ring, then back off slightly to avoid overtighten-ing.
To stabilize the instrument, you may wish touse a calibration stand or other support.
4. Connect the MP TROLL 9500 to a PC andestablish a connection in Win-Situ or Pocket-Situ. Win-Situ screens are illustrated here. ThePocket-Situ interface is similar, with theNavigation tree at the top of the screen andthe Information pane below it.
5. Select the MP TROLL 9500 in the Navigationtree.
The software will automatically detect anddisplay the installed sensors. If one or moresensors is installed in the wrong port, an errormessage will be displayed. Simply remove thesensor and install it in the correct position,then “refresh” the device before continuing.
6. Select Ammonium in the Parameters list. The sensor serial number(SN) and recent calibration information is displayed.
7. Select Calibrate.
6
7
SECTION 15: AMMONIUM
3
Cal Cup
Stirrer(optional)
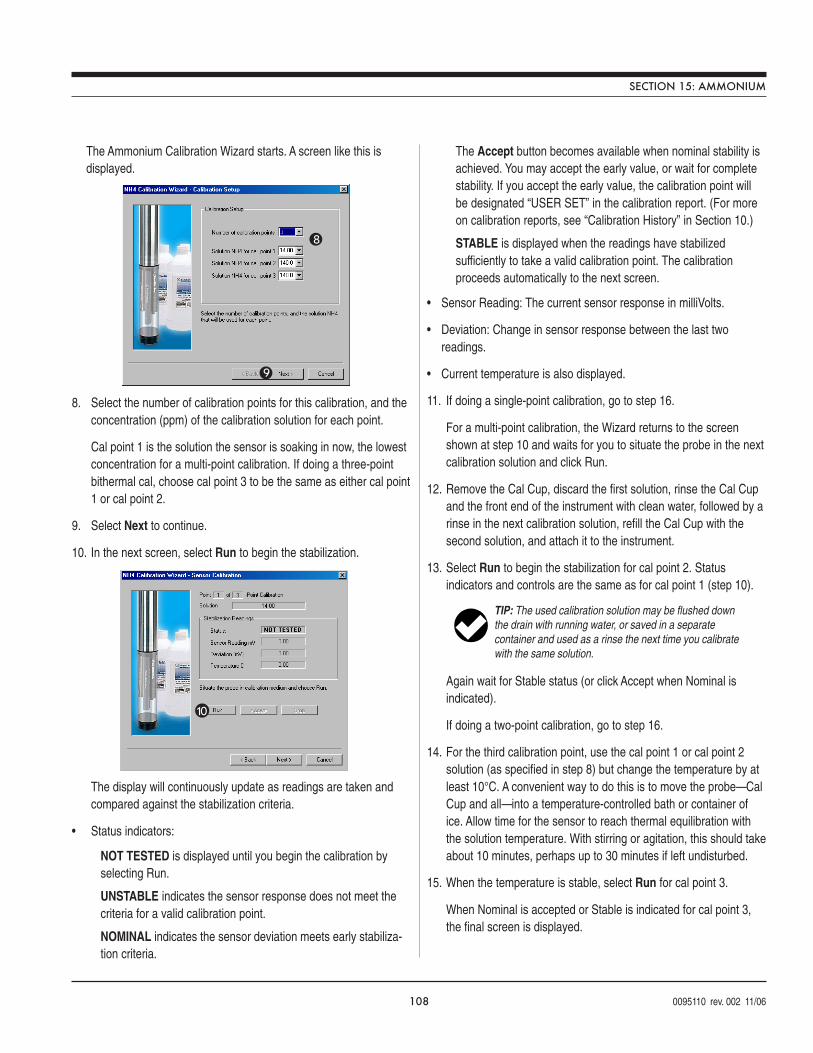
108 0095110 rev. 002 11/06
The Ammonium Calibration Wizard starts. A screen like this isdisplayed.
8. Select the number of calibration points for this calibration, and theconcentration (ppm) of the calibration solution for each point.
Cal point 1 is the solution the sensor is soaking in now, the lowestconcentration for a multi-point calibration. If doing a three-pointbithermal cal, choose cal point 3 to be the same as either cal point1 or cal point 2.
9. Select Next to continue.
10. In the next screen, select Run to begin the stabilization.
The display will continuously update as readings are taken andcompared against the stabilization criteria.
• Status indicators:
NOT TESTED is displayed until you begin the calibration byselecting Run.
UNSTABLE indicates the sensor response does not meet thecriteria for a valid calibration point.
NOMINAL indicates the sensor deviation meets early stabiliza-tion criteria.
The Accept button becomes available when nominal stability isachieved. You may accept the early value, or wait for completestability. If you accept the early value, the calibration point willbe designated “USER SET” in the calibration report. (For moreon calibration reports, see “Calibration History” in Section 10.)
STABLE is displayed when the readings have stabilizedsufficiently to take a valid calibration point. The calibrationproceeds automatically to the next screen.
• Sensor Reading: The current sensor response in milliVolts.
• Deviation: Change in sensor response between the last tworeadings.
• Current temperature is also displayed.
11. If doing a single-point calibration, go to step 16.
For a multi-point calibration, the Wizard returns to the screenshown at step 10 and waits for you to situate the probe in the nextcalibration solution and click Run.
12. Remove the Cal Cup, discard the first solution, rinse the Cal Cupand the front end of the instrument with clean water, followed by arinse in the next calibration solution, refill the Cal Cup with thesecond solution, and attach it to the instrument.
13. Select Run to begin the stabilization for cal point 2. Statusindicators and controls are the same as for cal point 1 (step 10).
Again wait for Stable status (or click Accept when Nominal isindicated).
If doing a two-point calibration, go to step 16.
14. For the third calibration point, use the cal point 1 or cal point 2solution (as specified in step 8) but change the temperature by atleast 10°C. A convenient way to do this is to move the probe—CalCup and all—into a temperature-controlled bath or container ofice. Allow time for the sensor to reach thermal equilibration withthe solution temperature. With stirring or agitation, this should takeabout 10 minutes, perhaps up to 30 minutes if left undisturbed.
15. When the temperature is stable, select Run for cal point 3.
When Nominal is accepted or Stable is indicated for cal point 3,the final screen is displayed.
8
9
10
TIP: The used calibration solution may be flushed downthe drain with running water, or saved in a separatecontainer and used as a rinse the next time you calibratewith the same solution.
SECTION 15: AMMONIUM
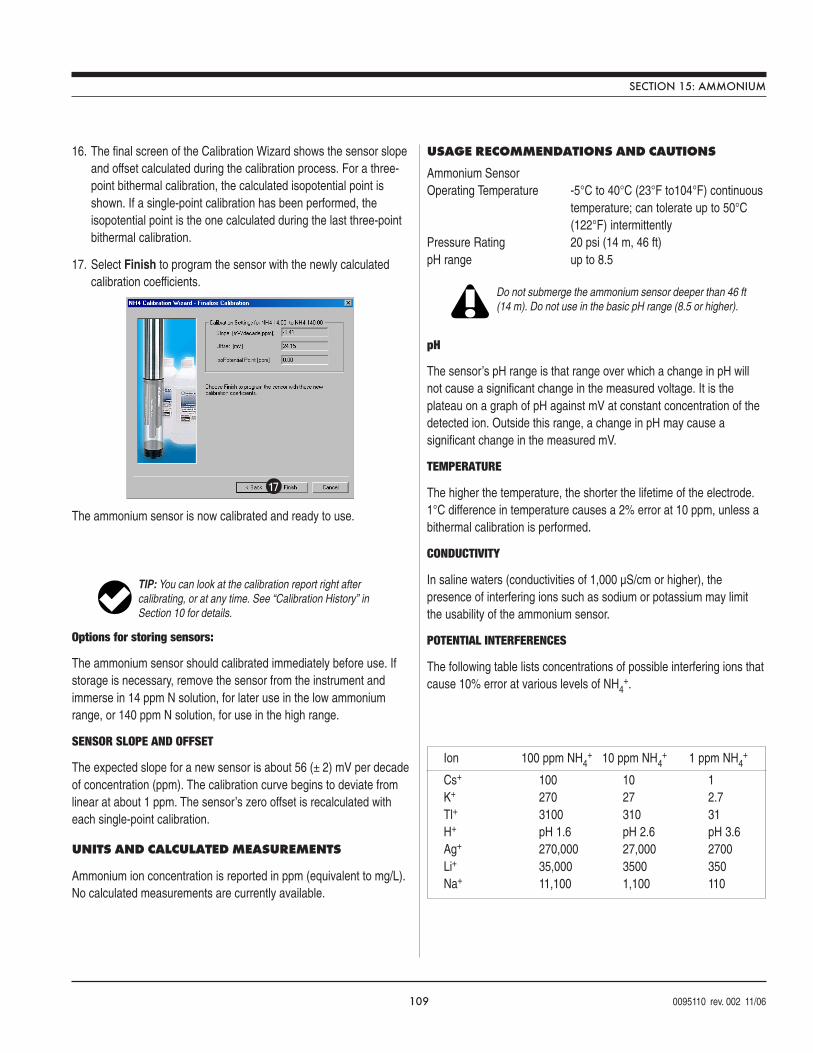
109 0095110 rev. 002 11/06
16. The final screen of the Calibration Wizard shows the sensor slopeand offset calculated during the calibration process. For a three-point bithermal calibration, the calculated isopotential point isshown. If a single-point calibration has been performed, theisopotential point is the one calculated during the last three-pointbithermal calibration.
17. Select Finish to program the sensor with the newly calculatedcalibration coefficients.
The ammonium sensor is now calibrated and ready to use.
Options for storing sensors:
The ammonium sensor should calibrated immediately before use. Ifstorage is necessary, remove the sensor from the instrument andimmerse in 14 ppm N solution, for later use in the low ammoniumrange, or 140 ppm N solution, for use in the high range.
SENSOR SLOPE AND OFFSET
The expected slope for a new sensor is about 56 (± 2) mV per decadeof concentration (ppm). The calibration curve begins to deviate fromlinear at about 1 ppm. The sensor’s zero offset is recalculated witheach single-point calibration.
UNITS AND CALCULATED MEASUREMENTS
Ammonium ion concentration is reported in ppm (equivalent to mg/L).No calculated measurements are currently available.
USAGE RECOMMENDATIONS AND CAUTIONS
Ammonium SensorOperating Temperature -5°C to 40°C (23°F to104°F) continuous
temperature; can tolerate up to 50°C(122°F) intermittently
Pressure Rating 20 psi (14 m, 46 ft)pH range up to 8.5
pH
The sensor’s pH range is that range over which a change in pH willnot cause a significant change in the measured voltage. It is theplateau on a graph of pH against mV at constant concentration of thedetected ion. Outside this range, a change in pH may cause asignificant change in the measured mV.
TEMPERATURE
The higher the temperature, the shorter the lifetime of the electrode.1°C difference in temperature causes a 2% error at 10 ppm, unless abithermal calibration is performed.
CONDUCTIVITY
In saline waters (conductivities of 1,000 µS/cm or higher), thepresence of interfering ions such as sodium or potassium may limitthe usability of the ammonium sensor.
POTENTIAL INTERFERENCES
The following table lists concentrations of possible interfering ions thatcause 10% error at various levels of NH4
+.
TIP: You can look at the calibration report right aftercalibrating, or at any time. See “Calibration History” inSection 10 for details.
17
Do not submerge the ammonium sensor deeper than 46 ft(14 m). Do not use in the basic pH range (8.5 or higher).
Ion 100 ppm NH4+ 10 ppm NH4
+ 1 ppm NH4+
Cs+ 100 10 1K+ 270 27 2.7Tl+ 3100 310 31H+ pH 1.6 pH 2.6 pH 3.6Ag+ 270,000 27,000 2700Li+ 35,000 3500 350Na+ 11,100 1,100 110
SECTION 15: AMMONIUM
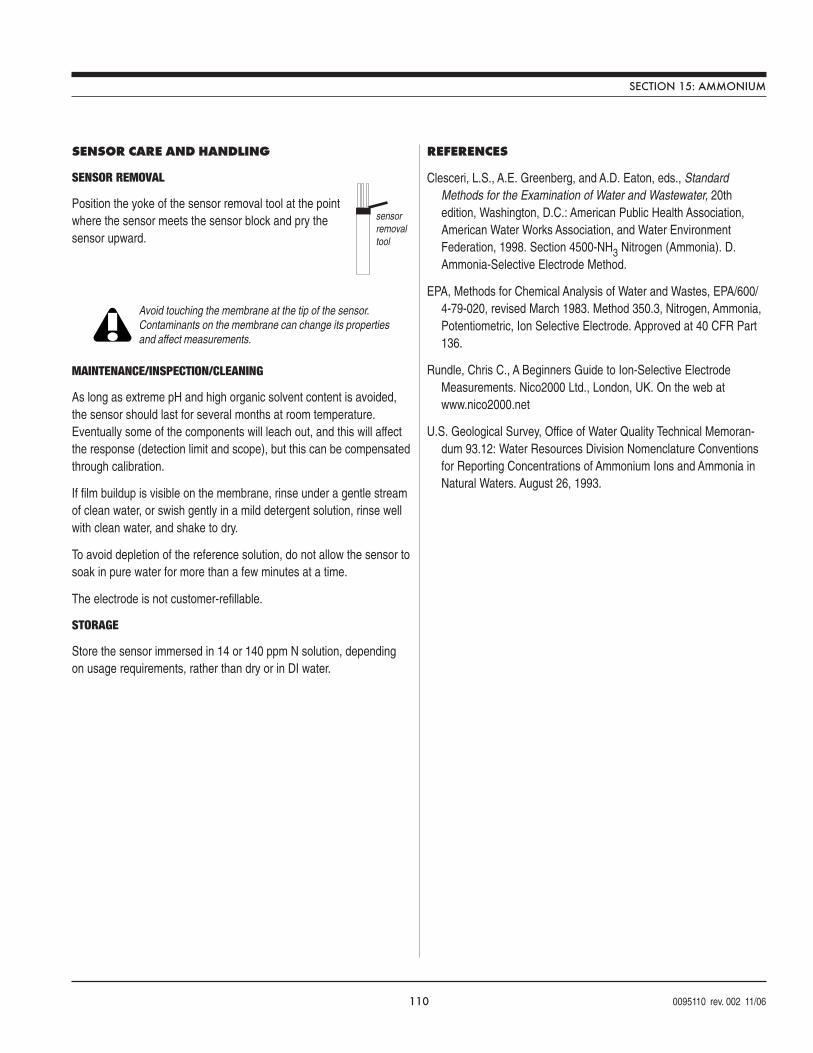
110 0095110 rev. 002 11/06
SENSOR CARE AND HANDLING
SENSOR REMOVAL
Position the yoke of the sensor removal tool at the pointwhere the sensor meets the sensor block and pry thesensor upward.
MAINTENANCE/INSPECTION/CLEANING
As long as extreme pH and high organic solvent content is avoided,the sensor should last for several months at room temperature.Eventually some of the components will leach out, and this will affectthe response (detection limit and scope), but this can be compensatedthrough calibration.
If film buildup is visible on the membrane, rinse under a gentle streamof clean water, or swish gently in a mild detergent solution, rinse wellwith clean water, and shake to dry.
To avoid depletion of the reference solution, do not allow the sensor tosoak in pure water for more than a few minutes at a time.
The electrode is not customer-refillable.
STORAGE
Store the sensor immersed in 14 or 140 ppm N solution, dependingon usage requirements, rather than dry or in DI water.
REFERENCES
Clesceri, L.S., A.E. Greenberg, and A.D. Eaton, eds., StandardMethods for the Examination of Water and Wastewater, 20thedition, Washington, D.C.: American Public Health Association,American Water Works Association, and Water EnvironmentFederation, 1998. Section 4500-NH3 Nitrogen (Ammonia). D.Ammonia-Selective Electrode Method.
EPA, Methods for Chemical Analysis of Water and Wastes, EPA/600/4-79-020, revised March 1983. Method 350.3, Nitrogen, Ammonia,Potentiometric, Ion Selective Electrode. Approved at 40 CFR Part136.
Rundle, Chris C., A Beginners Guide to Ion-Selective ElectrodeMeasurements. Nico2000 Ltd., London, UK. On the web atwww.nico2000.net
U.S. Geological Survey, Office of Water Quality Technical Memoran-dum 93.12: Water Resources Division Nomenclature Conventionsfor Reporting Concentrations of Ammonium Ions and Ammonia inNatural Waters. August 26, 1993.
sensorremovaltool
Avoid touching the membrane at the tip of the sensor.Contaminants on the membrane can change its propertiesand affect measurements.
SECTION 15: AMMONIUM
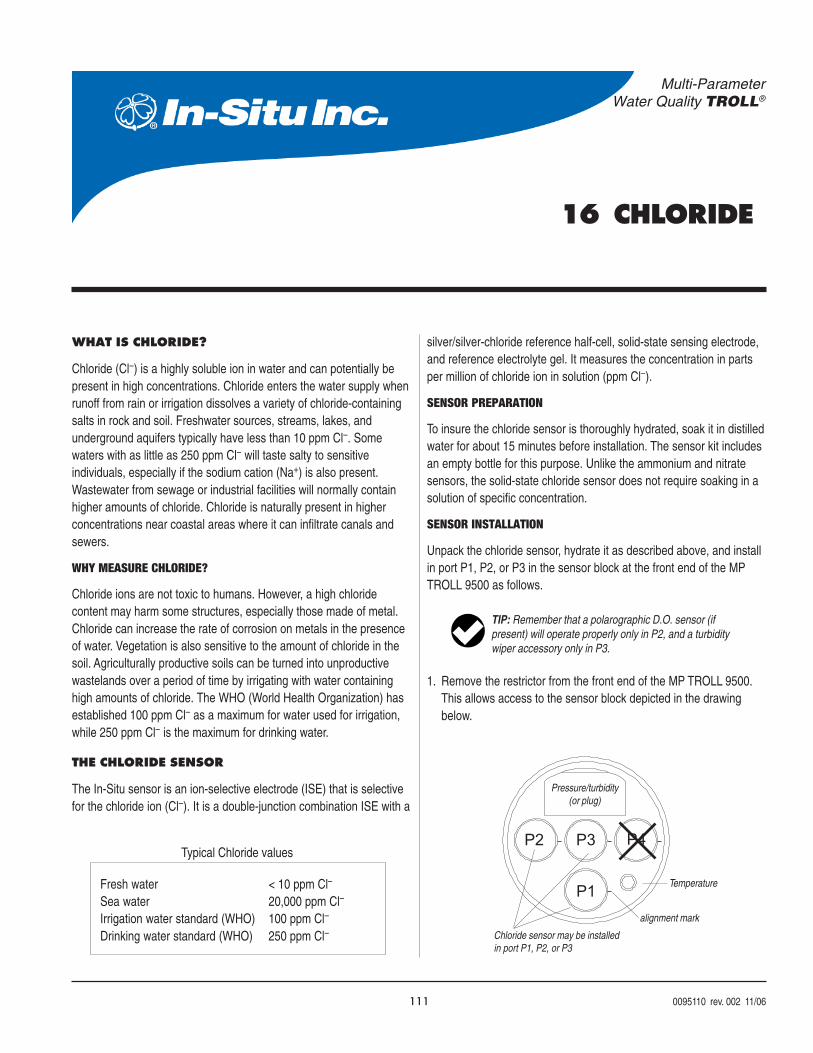
111 0095110 rev. 002 11/06
Multi-ParameterWater Quality TROLL®
16 CHLORIDE
WHAT IS CHLORIDE?
Chloride (Cl–) is a highly soluble ion in water and can potentially bepresent in high concentrations. Chloride enters the water supply whenrunoff from rain or irrigation dissolves a variety of chloride-containingsalts in rock and soil. Freshwater sources, streams, lakes, andunderground aquifers typically have less than 10 ppm Cl–. Somewaters with as little as 250 ppm Cl– will taste salty to sensitiveindividuals, especially if the sodium cation (Na+) is also present.Wastewater from sewage or industrial facilities will normally containhigher amounts of chloride. Chloride is naturally present in higherconcentrations near coastal areas where it can infiltrate canals andsewers.
WHY MEASURE CHLORIDE?
Chloride ions are not toxic to humans. However, a high chloridecontent may harm some structures, especially those made of metal.Chloride can increase the rate of corrosion on metals in the presenceof water. Vegetation is also sensitive to the amount of chloride in thesoil. Agriculturally productive soils can be turned into unproductivewastelands over a period of time by irrigating with water containinghigh amounts of chloride. The WHO (World Health Organization) hasestablished 100 ppm Cl– as a maximum for water used for irrigation,while 250 ppm Cl– is the maximum for drinking water.
THE CHLORIDE SENSOR
The In-Situ sensor is an ion-selective electrode (ISE) that is selectivefor the chloride ion (Cl–). It is a double-junction combination ISE with a
silver/silver-chloride reference half-cell, solid-state sensing electrode,and reference electrolyte gel. It measures the concentration in partsper million of chloride ion in solution (ppm Cl–).
SENSOR PREPARATION
To insure the chloride sensor is thoroughly hydrated, soak it in distilledwater for about 15 minutes before installation. The sensor kit includesan empty bottle for this purpose. Unlike the ammonium and nitratesensors, the solid-state chloride sensor does not require soaking in asolution of specific concentration.
SENSOR INSTALLATION
Unpack the chloride sensor, hydrate it as described above, and installin port P1, P2, or P3 in the sensor block at the front end of the MPTROLL 9500 as follows.
1. Remove the restrictor from the front end of the MP TROLL 9500.This allows access to the sensor block depicted in the drawingbelow.
Fresh water < 10 ppm Cl–
Sea water 20,000 ppm Cl–
Irrigation water standard (WHO) 100 ppm Cl–
Drinking water standard (WHO) 250 ppm Cl–
Typical Chloride values
TIP: Remember that a polarographic D.O. sensor (ifpresent) will operate properly only in P2, and a turbiditywiper accessory only in P3.
1
2 3 4
Pressure/turbidity(or plug)
Temperature
Chloride sensor may be installedin port P1, P2, or P3
P1
P2 P3 P4
alignment mark
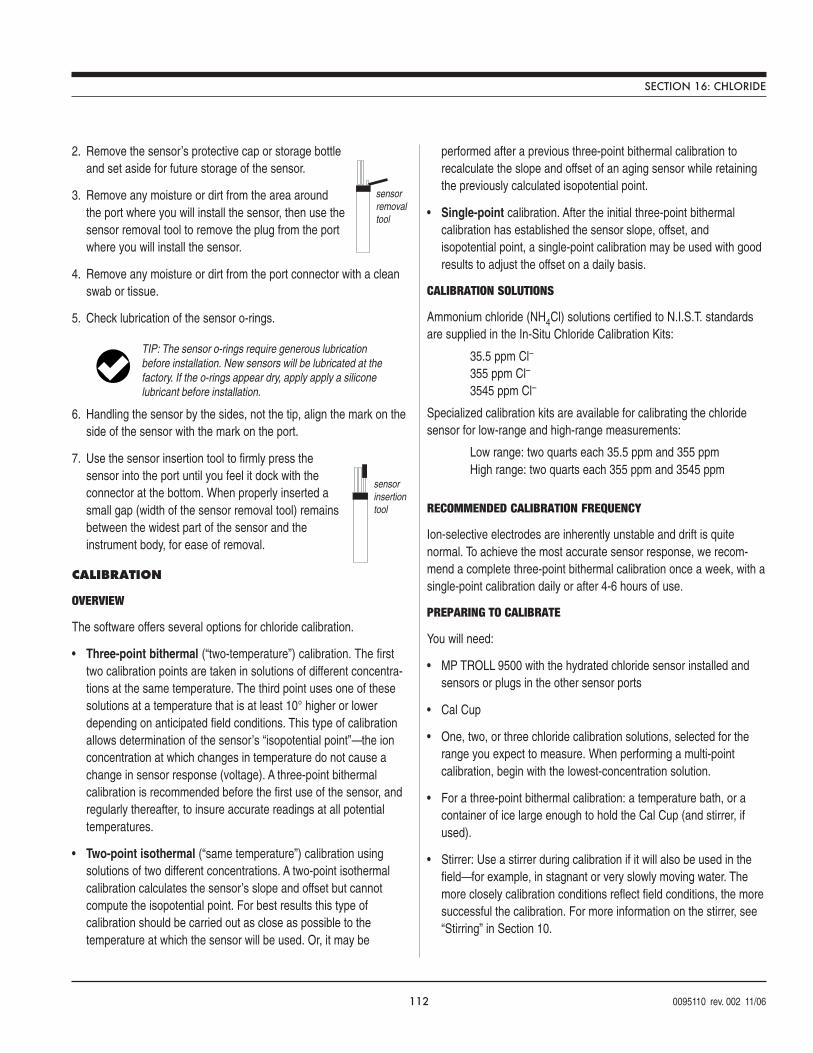
112 0095110 rev. 002 11/06
2. Remove the sensor’s protective cap or storage bottleand set aside for future storage of the sensor.
3. Remove any moisture or dirt from the area aroundthe port where you will install the sensor, then use thesensor removal tool to remove the plug from the portwhere you will install the sensor.
4. Remove any moisture or dirt from the port connector with a cleanswab or tissue.
5. Check lubrication of the sensor o-rings.
6. Handling the sensor by the sides, not the tip, align the mark on theside of the sensor with the mark on the port.
7. Use the sensor insertion tool to firmly press thesensor into the port until you feel it dock with theconnector at the bottom. When properly inserted asmall gap (width of the sensor removal tool) remainsbetween the widest part of the sensor and theinstrument body, for ease of removal.
CALIBRATION
OVERVIEW
The software offers several options for chloride calibration.
• Three-point bithermal (“two-temperature”) calibration. The firsttwo calibration points are taken in solutions of different concentra-tions at the same temperature. The third point uses one of thesesolutions at a temperature that is at least 10° higher or lowerdepending on anticipated field conditions. This type of calibrationallows determination of the sensor’s “isopotential point”—the ionconcentration at which changes in temperature do not cause achange in sensor response (voltage). A three-point bithermalcalibration is recommended before the first use of the sensor, andregularly thereafter, to insure accurate readings at all potentialtemperatures.
• Two-point isothermal (“same temperature”) calibration usingsolutions of two different concentrations. A two-point isothermalcalibration calculates the sensor’s slope and offset but cannotcompute the isopotential point. For best results this type ofcalibration should be carried out as close as possible to thetemperature at which the sensor will be used. Or, it may be
performed after a previous three-point bithermal calibration torecalculate the slope and offset of an aging sensor while retainingthe previously calculated isopotential point.
• Single-point calibration. After the initial three-point bithermalcalibration has established the sensor slope, offset, andisopotential point, a single-point calibration may be used with goodresults to adjust the offset on a daily basis.
CALIBRATION SOLUTIONS
Ammonium chloride (NH4Cl) solutions certified to N.I.S.T. standardsare supplied in the In-Situ Chloride Calibration Kits:
35.5 ppm Cl–
355 ppm Cl–
3545 ppm Cl–
Specialized calibration kits are available for calibrating the chloridesensor for low-range and high-range measurements:
Low range: two quarts each 35.5 ppm and 355 ppmHigh range: two quarts each 355 ppm and 3545 ppm
RECOMMENDED CALIBRATION FREQUENCY
Ion-selective electrodes are inherently unstable and drift is quitenormal. To achieve the most accurate sensor response, we recom-mend a complete three-point bithermal calibration once a week, with asingle-point calibration daily or after 4-6 hours of use.
PREPARING TO CALIBRATE
You will need:
• MP TROLL 9500 with the hydrated chloride sensor installed andsensors or plugs in the other sensor ports
• Cal Cup
• One, two, or three chloride calibration solutions, selected for therange you expect to measure. When performing a multi-pointcalibration, begin with the lowest-concentration solution.
• For a three-point bithermal calibration: a temperature bath, or acontainer of ice large enough to hold the Cal Cup (and stirrer, ifused).
• Stirrer: Use a stirrer during calibration if it will also be used in thefield—for example, in stagnant or very slowly moving water. Themore closely calibration conditions reflect field conditions, the moresuccessful the calibration. For more information on the stirrer, see“Stirring” in Section 10.
TIP: The sensor o-rings require generous lubricationbefore installation. New sensors will be lubricated at thefactory. If the o-rings appear dry, apply apply a siliconelubricant before installation.
sensorremovaltool
sensorinsertiontool
SECTION 16: CHLORIDE
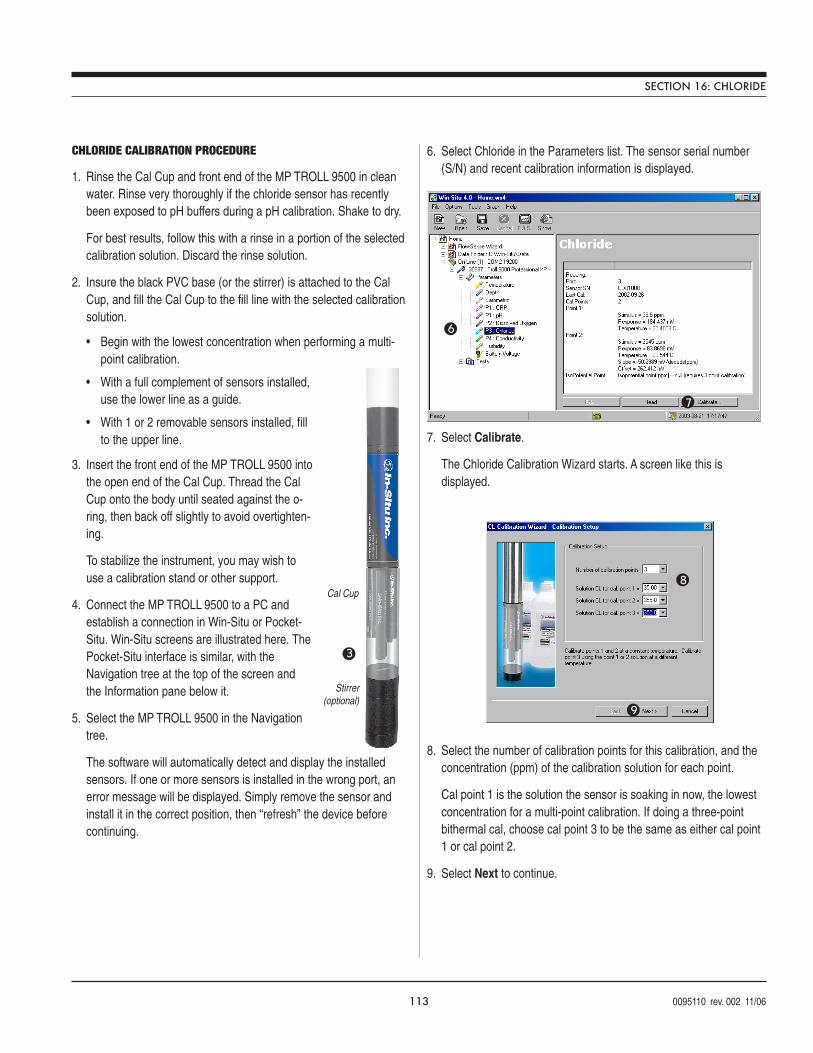
113 0095110 rev. 002 11/06
CHLORIDE CALIBRATION PROCEDURE
1. Rinse the Cal Cup and front end of the MP TROLL 9500 in cleanwater. Rinse very thoroughly if the chloride sensor has recentlybeen exposed to pH buffers during a pH calibration. Shake to dry.
For best results, follow this with a rinse in a portion of the selectedcalibration solution. Discard the rinse solution.
2. Insure the black PVC base (or the stirrer) is attached to the CalCup, and fill the Cal Cup to the fill line with the selected calibrationsolution.
• Begin with the lowest concentration when performing a multi-point calibration.
• With a full complement of sensors installed,use the lower line as a guide.
• With 1 or 2 removable sensors installed, fillto the upper line.
3. Insert the front end of the MP TROLL 9500 intothe open end of the Cal Cup. Thread the CalCup onto the body until seated against the o-ring, then back off slightly to avoid overtighten-ing.
To stabilize the instrument, you may wish touse a calibration stand or other support.
4. Connect the MP TROLL 9500 to a PC andestablish a connection in Win-Situ or Pocket-Situ. Win-Situ screens are illustrated here. ThePocket-Situ interface is similar, with theNavigation tree at the top of the screen andthe Information pane below it.
5. Select the MP TROLL 9500 in the Navigationtree.
The software will automatically detect and display the installedsensors. If one or more sensors is installed in the wrong port, anerror message will be displayed. Simply remove the sensor andinstall it in the correct position, then “refresh” the device beforecontinuing.
6. Select Chloride in the Parameters list. The sensor serial number(S/N) and recent calibration information is displayed.
7. Select Calibrate.
The Chloride Calibration Wizard starts. A screen like this isdisplayed.
8. Select the number of calibration points for this calibration, and theconcentration (ppm) of the calibration solution for each point.
Cal point 1 is the solution the sensor is soaking in now, the lowestconcentration for a multi-point calibration. If doing a three-pointbithermal cal, choose cal point 3 to be the same as either cal point1 or cal point 2.
9. Select Next to continue.
6
7
8
9
SECTION 16: CHLORIDE
3
Cal Cup
Stirrer(optional)
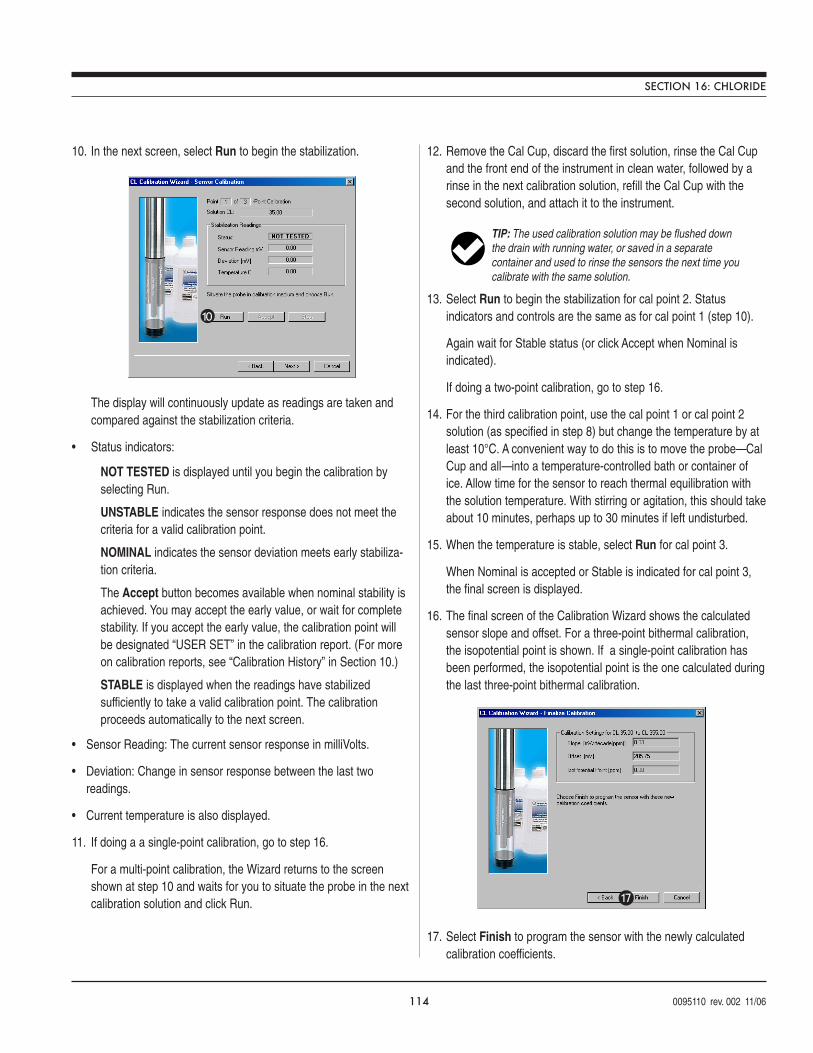
114 0095110 rev. 002 11/06
10. In the next screen, select Run to begin the stabilization.
The display will continuously update as readings are taken andcompared against the stabilization criteria.
• Status indicators:
NOT TESTED is displayed until you begin the calibration byselecting Run.
UNSTABLE indicates the sensor response does not meet thecriteria for a valid calibration point.
NOMINAL indicates the sensor deviation meets early stabiliza-tion criteria.
The Accept button becomes available when nominal stability isachieved. You may accept the early value, or wait for completestability. If you accept the early value, the calibration point willbe designated “USER SET” in the calibration report. (For moreon calibration reports, see “Calibration History” in Section 10.)
STABLE is displayed when the readings have stabilizedsufficiently to take a valid calibration point. The calibrationproceeds automatically to the next screen.
• Sensor Reading: The current sensor response in milliVolts.
• Deviation: Change in sensor response between the last tworeadings.
• Current temperature is also displayed.
11. If doing a a single-point calibration, go to step 16.
For a multi-point calibration, the Wizard returns to the screenshown at step 10 and waits for you to situate the probe in the nextcalibration solution and click Run.
12. Remove the Cal Cup, discard the first solution, rinse the Cal Cupand the front end of the instrument in clean water, followed by arinse in the next calibration solution, refill the Cal Cup with thesecond solution, and attach it to the instrument.
13. Select Run to begin the stabilization for cal point 2. Statusindicators and controls are the same as for cal point 1 (step 10).
Again wait for Stable status (or click Accept when Nominal isindicated).
If doing a two-point calibration, go to step 16.
14. For the third calibration point, use the cal point 1 or cal point 2solution (as specified in step 8) but change the temperature by atleast 10°C. A convenient way to do this is to move the probe—CalCup and all—into a temperature-controlled bath or container ofice. Allow time for the sensor to reach thermal equilibration withthe solution temperature. With stirring or agitation, this should takeabout 10 minutes, perhaps up to 30 minutes if left undisturbed.
15. When the temperature is stable, select Run for cal point 3.
When Nominal is accepted or Stable is indicated for cal point 3,the final screen is displayed.
16. The final screen of the Calibration Wizard shows the calculatedsensor slope and offset. For a three-point bithermal calibration,the isopotential point is shown. If a single-point calibration hasbeen performed, the isopotential point is the one calculated duringthe last three-point bithermal calibration.
17. Select Finish to program the sensor with the newly calculatedcalibration coefficients.
TIP: The used calibration solution may be flushed downthe drain with running water, or saved in a separatecontainer and used to rinse the sensors the next time youcalibrate with the same solution.
17
10
SECTION 16: CHLORIDE
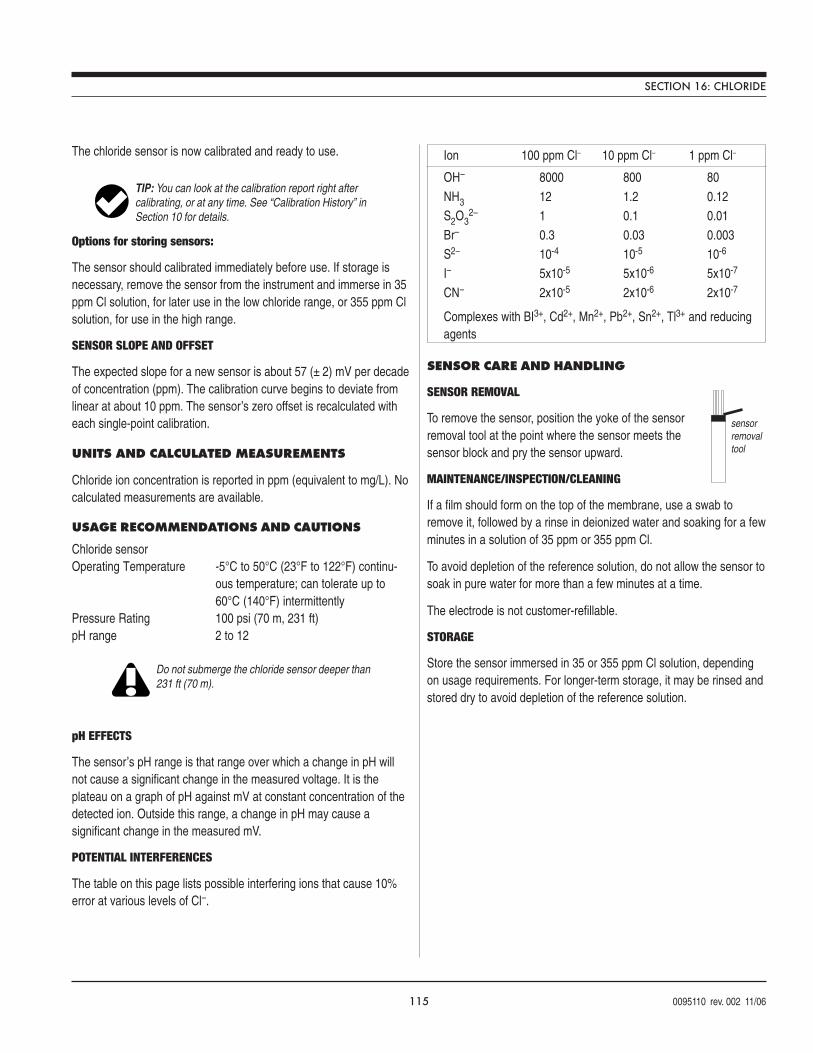
115 0095110 rev. 002 11/06
The chloride sensor is now calibrated and ready to use.
Options for storing sensors:
The sensor should calibrated immediately before use. If storage isnecessary, remove the sensor from the instrument and immerse in 35ppm Cl solution, for later use in the low chloride range, or 355 ppm Clsolution, for use in the high range.
SENSOR SLOPE AND OFFSET
The expected slope for a new sensor is about 57 (± 2) mV per decadeof concentration (ppm). The calibration curve begins to deviate fromlinear at about 10 ppm. The sensor’s zero offset is recalculated witheach single-point calibration.
UNITS AND CALCULATED MEASUREMENTS
Chloride ion concentration is reported in ppm (equivalent to mg/L). Nocalculated measurements are available.
USAGE RECOMMENDATIONS AND CAUTIONS
Chloride sensorOperating Temperature -5°C to 50°C (23°F to 122°F) continu-
ous temperature; can tolerate up to60°C (140°F) intermittently
Pressure Rating 100 psi (70 m, 231 ft)pH range 2 to 12
pH EFFECTS
The sensor’s pH range is that range over which a change in pH willnot cause a significant change in the measured voltage. It is theplateau on a graph of pH against mV at constant concentration of thedetected ion. Outside this range, a change in pH may cause asignificant change in the measured mV.
POTENTIAL INTERFERENCES
The table on this page lists possible interfering ions that cause 10%error at various levels of Cl–.
sensorremovaltool
SENSOR CARE AND HANDLING
SENSOR REMOVAL
To remove the sensor, position the yoke of the sensorremoval tool at the point where the sensor meets thesensor block and pry the sensor upward.
MAINTENANCE/INSPECTION/CLEANING
If a film should form on the top of the membrane, use a swab toremove it, followed by a rinse in deionized water and soaking for a fewminutes in a solution of 35 ppm or 355 ppm Cl.
To avoid depletion of the reference solution, do not allow the sensor tosoak in pure water for more than a few minutes at a time.
The electrode is not customer-refillable.
STORAGE
Store the sensor immersed in 35 or 355 ppm Cl solution, dependingon usage requirements. For longer-term storage, it may be rinsed andstored dry to avoid depletion of the reference solution.
Ion 100 ppm Cl– 10 ppm Cl– 1 ppm Cl–
OH– 8000 800 80
NH3 12 1.2 0.12S2O3
2– 1 0.1 0.01
Br– 0.3 0.03 0.003S2– 10-4 10-5 10-6
I– 5x10⁻⁵ 5x10⁻⁶ 5x10⁻⁷
CN– 2x10⁻⁵ 2x10⁻⁶ 2x10⁻⁷
Complexes with BI3+, Cd2+, Mn2+, Pb2+, Sn2+, Tl3+ and reducingagents
Do not submerge the chloride sensor deeper than231 ft (70 m).
TIP: You can look at the calibration report right aftercalibrating, or at any time. See “Calibration History” inSection 10 for details.
SECTION 16: CHLORIDE
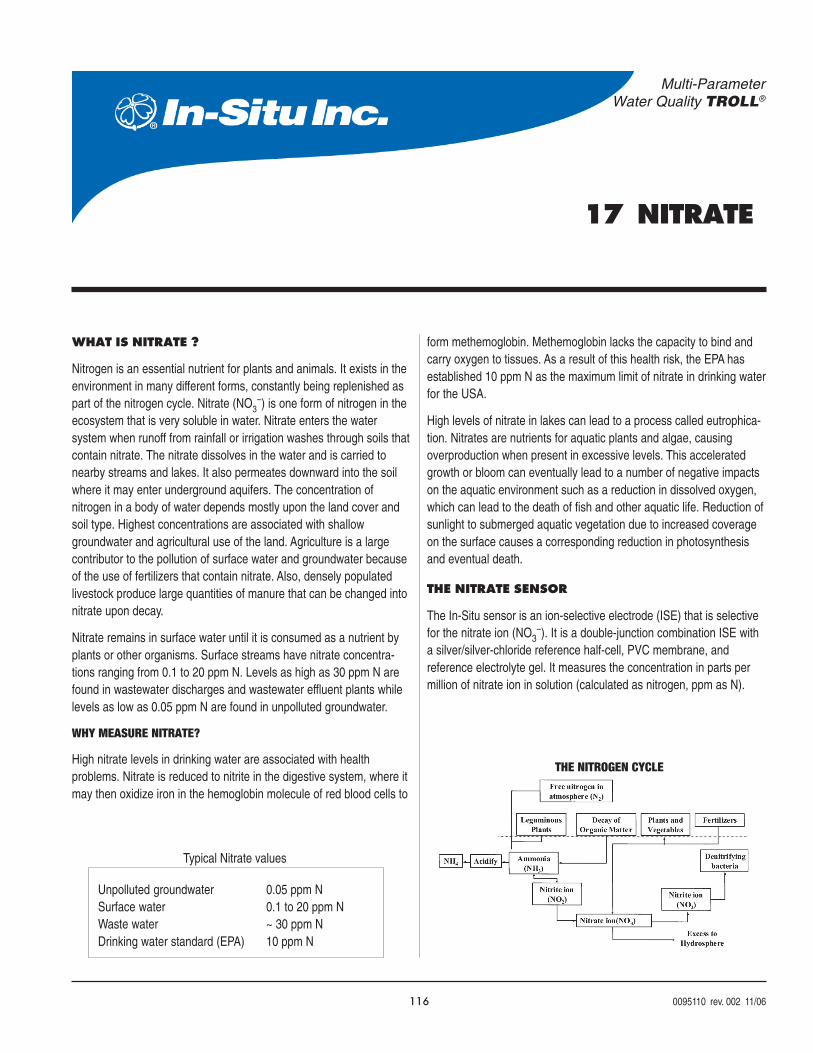
116 0095110 rev. 002 11/06
Multi-ParameterWater Quality TROLL®
17 NITRATE
Unpolluted groundwater 0.05 ppm NSurface water 0.1 to 20 ppm NWaste water ~ 30 ppm NDrinking water standard (EPA) 10 ppm N
Typical Nitrate values
WHAT IS NITRATE ?
Nitrogen is an essential nutrient for plants and animals. It exists in theenvironment in many different forms, constantly being replenished aspart of the nitrogen cycle. Nitrate (NO3
–) is one form of nitrogen in theecosystem that is very soluble in water. Nitrate enters the watersystem when runoff from rainfall or irrigation washes through soils thatcontain nitrate. The nitrate dissolves in the water and is carried tonearby streams and lakes. It also permeates downward into the soilwhere it may enter underground aquifers. The concentration ofnitrogen in a body of water depends mostly upon the land cover andsoil type. Highest concentrations are associated with shallowgroundwater and agricultural use of the land. Agriculture is a largecontributor to the pollution of surface water and groundwater becauseof the use of fertilizers that contain nitrate. Also, densely populatedlivestock produce large quantities of manure that can be changed intonitrate upon decay.
Nitrate remains in surface water until it is consumed as a nutrient byplants or other organisms. Surface streams have nitrate concentra-tions ranging from 0.1 to 20 ppm N. Levels as high as 30 ppm N arefound in wastewater discharges and wastewater effluent plants whilelevels as low as 0.05 ppm N are found in unpolluted groundwater.
WHY MEASURE NITRATE?
High nitrate levels in drinking water are associated with healthproblems. Nitrate is reduced to nitrite in the digestive system, where itmay then oxidize iron in the hemoglobin molecule of red blood cells to
form methemoglobin. Methemoglobin lacks the capacity to bind andcarry oxygen to tissues. As a result of this health risk, the EPA hasestablished 10 ppm N as the maximum limit of nitrate in drinking waterfor the USA.
High levels of nitrate in lakes can lead to a process called eutrophica-tion. Nitrates are nutrients for aquatic plants and algae, causingoverproduction when present in excessive levels. This acceleratedgrowth or bloom can eventually lead to a number of negative impactson the aquatic environment such as a reduction in dissolved oxygen,which can lead to the death of fish and other aquatic life. Reduction ofsunlight to submerged aquatic vegetation due to increased coverageon the surface causes a corresponding reduction in photosynthesisand eventual death.
THE NITRATE SENSOR
The In-Situ sensor is an ion-selective electrode (ISE) that is selectivefor the nitrate ion (NO3
–). It is a double-junction combination ISE witha silver/silver-chloride reference half-cell, PVC membrane, andreference electrolyte gel. It measures the concentration in parts permillion of nitrate ion in solution (calculated as nitrogen, ppm as N).
THE NITROGEN CYCLE
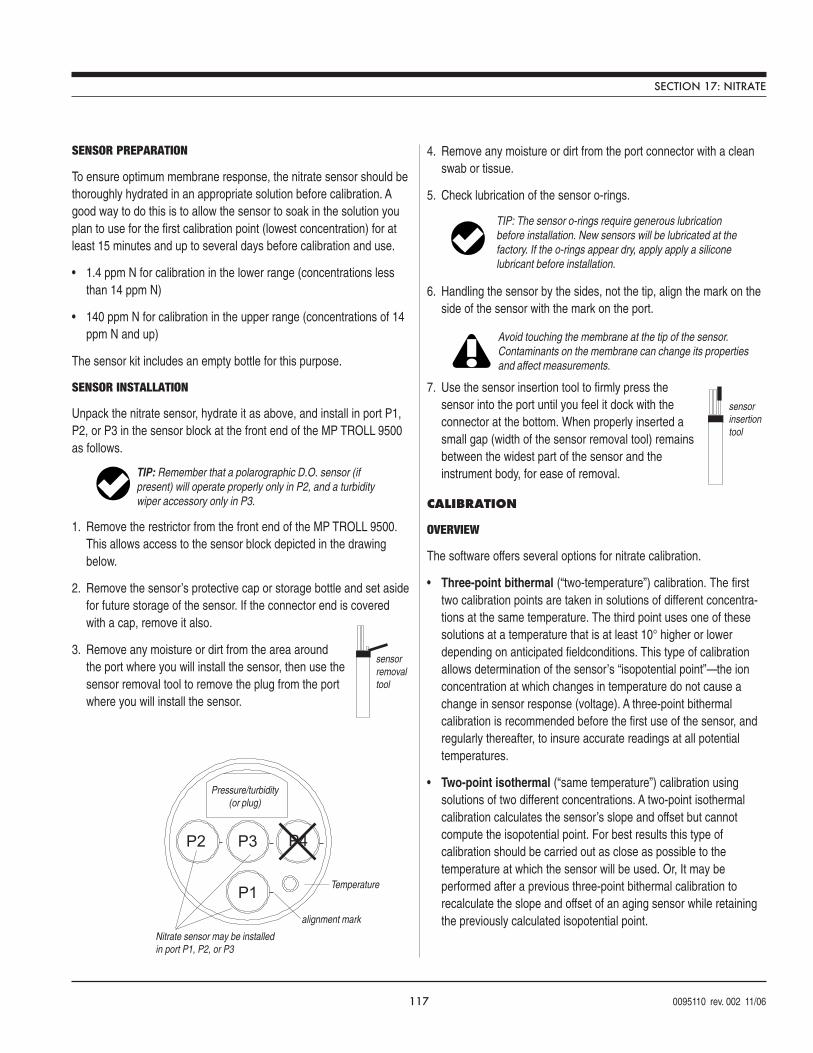
117 0095110 rev. 002 11/06
SENSOR PREPARATION
To ensure optimum membrane response, the nitrate sensor should bethoroughly hydrated in an appropriate solution before calibration. Agood way to do this is to allow the sensor to soak in the solution youplan to use for the first calibration point (lowest concentration) for atleast 15 minutes and up to several days before calibration and use.
• 1.4 ppm N for calibration in the lower range (concentrations lessthan 14 ppm N)
• 140 ppm N for calibration in the upper range (concentrations of 14ppm N and up)
The sensor kit includes an empty bottle for this purpose.
SENSOR INSTALLATION
Unpack the nitrate sensor, hydrate it as above, and install in port P1,P2, or P3 in the sensor block at the front end of the MP TROLL 9500as follows.
1. Remove the restrictor from the front end of the MP TROLL 9500.This allows access to the sensor block depicted in the drawingbelow.
2. Remove the sensor’s protective cap or storage bottle and set asidefor future storage of the sensor. If the connector end is coveredwith a cap, remove it also.
3. Remove any moisture or dirt from the area aroundthe port where you will install the sensor, then use thesensor removal tool to remove the plug from the portwhere you will install the sensor.
4. Remove any moisture or dirt from the port connector with a cleanswab or tissue.
5. Check lubrication of the sensor o-rings.
6. Handling the sensor by the sides, not the tip, align the mark on theside of the sensor with the mark on the port.
7. Use the sensor insertion tool to firmly press thesensor into the port until you feel it dock with theconnector at the bottom. When properly inserted asmall gap (width of the sensor removal tool) remainsbetween the widest part of the sensor and theinstrument body, for ease of removal.
CALIBRATION
OVERVIEW
The software offers several options for nitrate calibration.
• Three-point bithermal (“two-temperature”) calibration. The firsttwo calibration points are taken in solutions of different concentra-tions at the same temperature. The third point uses one of thesesolutions at a temperature that is at least 10° higher or lowerdepending on anticipated fieldconditions. This type of calibrationallows determination of the sensor’s “isopotential point”—the ionconcentration at which changes in temperature do not cause achange in sensor response (voltage). A three-point bithermalcalibration is recommended before the first use of the sensor, andregularly thereafter, to insure accurate readings at all potentialtemperatures.
• Two-point isothermal (“same temperature”) calibration usingsolutions of two different concentrations. A two-point isothermalcalibration calculates the sensor’s slope and offset but cannotcompute the isopotential point. For best results this type ofcalibration should be carried out as close as possible to thetemperature at which the sensor will be used. Or, It may beperformed after a previous three-point bithermal calibration torecalculate the slope and offset of an aging sensor while retainingthe previously calculated isopotential point.
TIP: Remember that a polarographic D.O. sensor (ifpresent) will operate properly only in P2, and a turbiditywiper accessory only in P3.
sensorremovaltool
sensorinsertiontool
Avoid touching the membrane at the tip of the sensor.Contaminants on the membrane can change its propertiesand affect measurements.
TIP: The sensor o-rings require generous lubricationbefore installation. New sensors will be lubricated at thefactory. If the o-rings appear dry, apply apply a siliconelubricant before installation.
1
2 3 4
Pressure/turbidity(or plug)
Temperature
Nitrate sensor may be installedin port P1, P2, or P3
P1
P2 P3 P4
alignment mark
SECTION 17: NITRATE
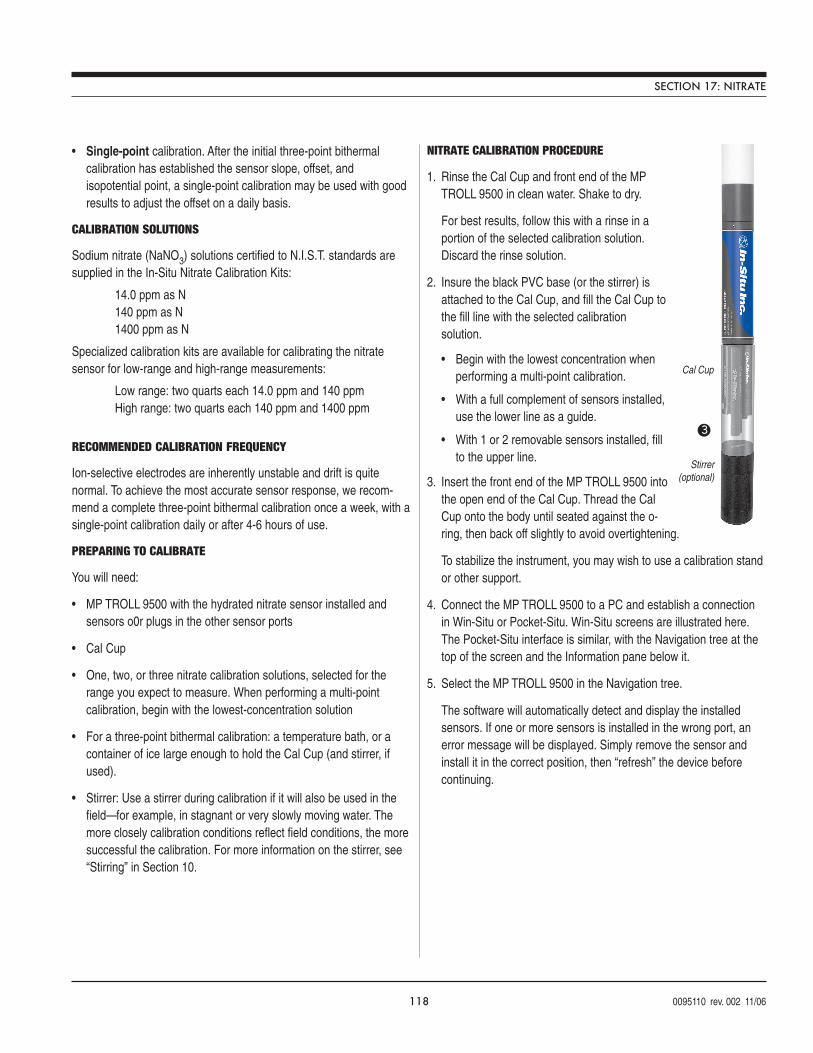
118 0095110 rev. 002 11/06
• Single-point calibration. After the initial three-point bithermalcalibration has established the sensor slope, offset, andisopotential point, a single-point calibration may be used with goodresults to adjust the offset on a daily basis.
CALIBRATION SOLUTIONS
Sodium nitrate (NaNO3) solutions certified to N.I.S.T. standards aresupplied in the In-Situ Nitrate Calibration Kits:
14.0 ppm as N140 ppm as N1400 ppm as N
Specialized calibration kits are available for calibrating the nitratesensor for low-range and high-range measurements:
Low range: two quarts each 14.0 ppm and 140 ppmHigh range: two quarts each 140 ppm and 1400 ppm
RECOMMENDED CALIBRATION FREQUENCY
Ion-selective electrodes are inherently unstable and drift is quitenormal. To achieve the most accurate sensor response, we recom-mend a complete three-point bithermal calibration once a week, with asingle-point calibration daily or after 4-6 hours of use.
PREPARING TO CALIBRATE
You will need:
• MP TROLL 9500 with the hydrated nitrate sensor installed andsensors o0r plugs in the other sensor ports
• Cal Cup
• One, two, or three nitrate calibration solutions, selected for therange you expect to measure. When performing a multi-pointcalibration, begin with the lowest-concentration solution
• For a three-point bithermal calibration: a temperature bath, or acontainer of ice large enough to hold the Cal Cup (and stirrer, ifused).
• Stirrer: Use a stirrer during calibration if it will also be used in thefield—for example, in stagnant or very slowly moving water. Themore closely calibration conditions reflect field conditions, the moresuccessful the calibration. For more information on the stirrer, see“Stirring” in Section 10.
NITRATE CALIBRATION PROCEDURE
1. Rinse the Cal Cup and front end of the MPTROLL 9500 in clean water. Shake to dry.
For best results, follow this with a rinse in aportion of the selected calibration solution.Discard the rinse solution.
2. Insure the black PVC base (or the stirrer) isattached to the Cal Cup, and fill the Cal Cup tothe fill line with the selected calibrationsolution.
• Begin with the lowest concentration whenperforming a multi-point calibration.
• With a full complement of sensors installed,use the lower line as a guide.
• With 1 or 2 removable sensors installed, fillto the upper line.
3. Insert the front end of the MP TROLL 9500 intothe open end of the Cal Cup. Thread the CalCup onto the body until seated against the o-ring, then back off slightly to avoid overtightening.
To stabilize the instrument, you may wish to use a calibration standor other support.
4. Connect the MP TROLL 9500 to a PC and establish a connectionin Win-Situ or Pocket-Situ. Win-Situ screens are illustrated here.The Pocket-Situ interface is similar, with the Navigation tree at thetop of the screen and the Information pane below it.
5. Select the MP TROLL 9500 in the Navigation tree.
The software will automatically detect and display the installedsensors. If one or more sensors is installed in the wrong port, anerror message will be displayed. Simply remove the sensor andinstall it in the correct position, then “refresh” the device beforecontinuing.
SECTION 17: NITRATE
3
Cal Cup
Stirrer(optional)
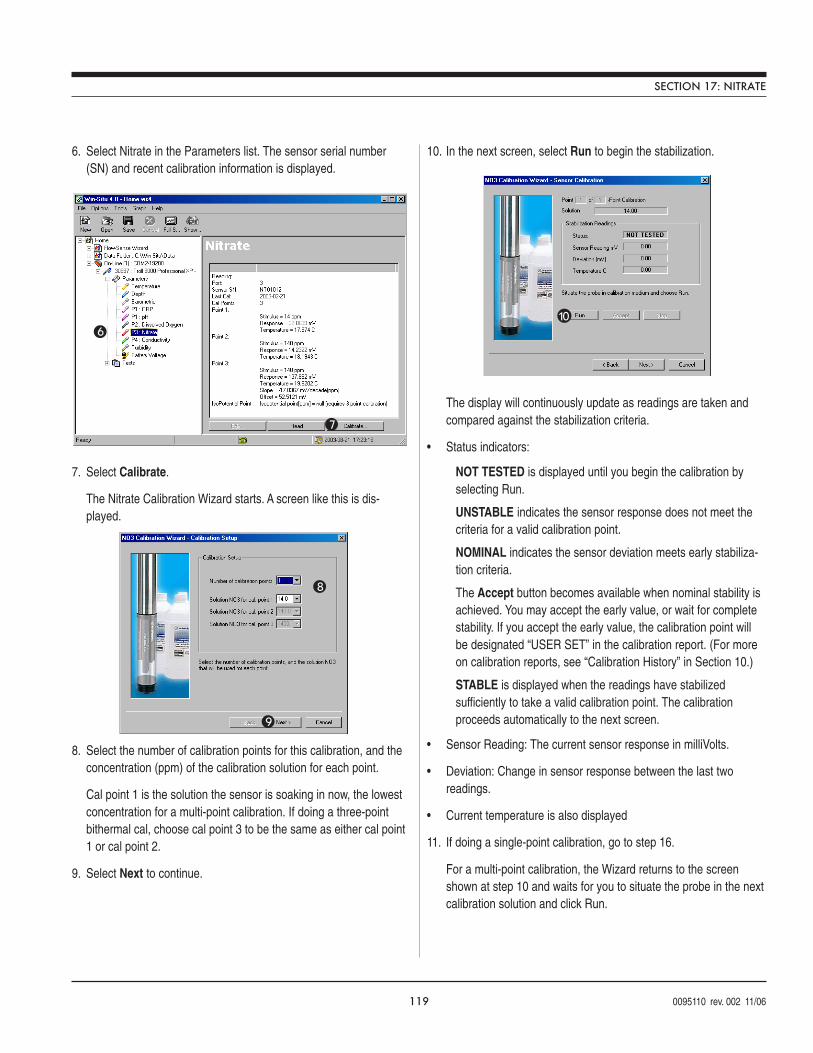
119 0095110 rev. 002 11/06
6. Select Nitrate in the Parameters list. The sensor serial number(SN) and recent calibration information is displayed.
7. Select Calibrate.
The Nitrate Calibration Wizard starts. A screen like this is dis-played.
8. Select the number of calibration points for this calibration, and theconcentration (ppm) of the calibration solution for each point.
Cal point 1 is the solution the sensor is soaking in now, the lowestconcentration for a multi-point calibration. If doing a three-pointbithermal cal, choose cal point 3 to be the same as either cal point1 or cal point 2.
9. Select Next to continue.
10. In the next screen, select Run to begin the stabilization.
The display will continuously update as readings are taken andcompared against the stabilization criteria.
• Status indicators:
NOT TESTED is displayed until you begin the calibration byselecting Run.
UNSTABLE indicates the sensor response does not meet thecriteria for a valid calibration point.
NOMINAL indicates the sensor deviation meets early stabiliza-tion criteria.
The Accept button becomes available when nominal stability isachieved. You may accept the early value, or wait for completestability. If you accept the early value, the calibration point willbe designated “USER SET” in the calibration report. (For moreon calibration reports, see “Calibration History” in Section 10.)
STABLE is displayed when the readings have stabilizedsufficiently to take a valid calibration point. The calibrationproceeds automatically to the next screen.
• Sensor Reading: The current sensor response in milliVolts.
• Deviation: Change in sensor response between the last tworeadings.
• Current temperature is also displayed
11. If doing a single-point calibration, go to step 16.
For a multi-point calibration, the Wizard returns to the screenshown at step 10 and waits for you to situate the probe in the nextcalibration solution and click Run.
8
9
106
7
SECTION 17: NITRATE
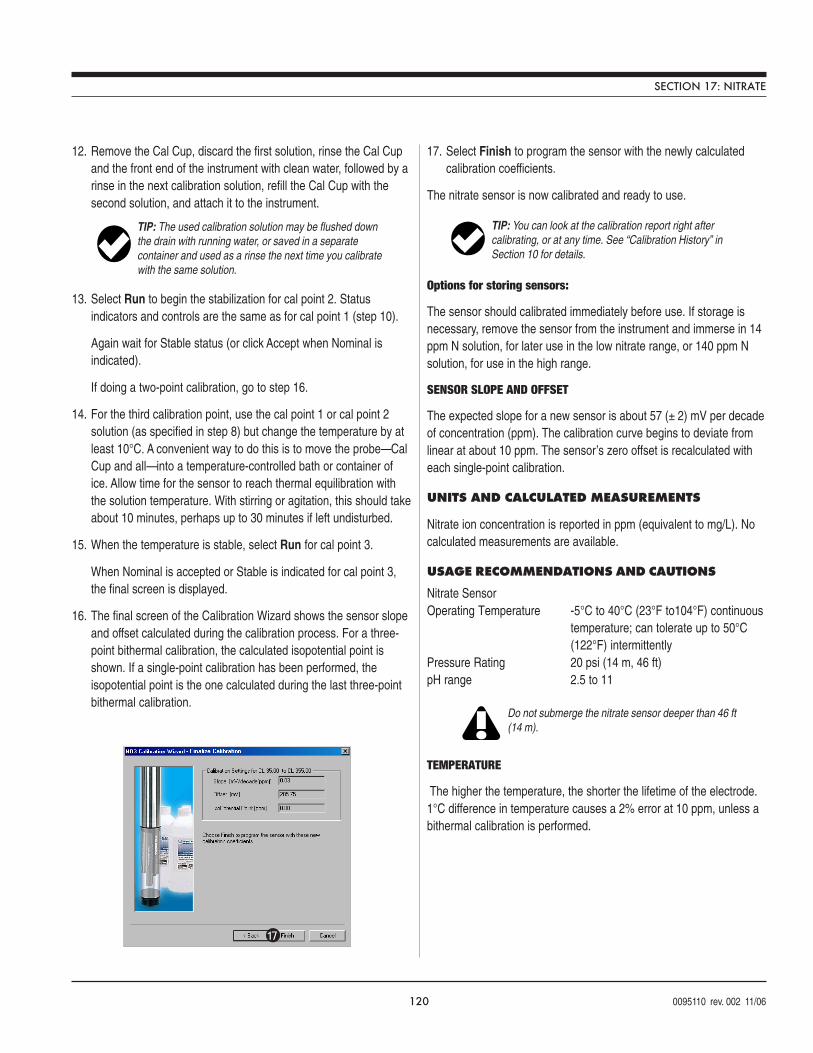
120 0095110 rev. 002 11/06
12. Remove the Cal Cup, discard the first solution, rinse the Cal Cupand the front end of the instrument with clean water, followed by arinse in the next calibration solution, refill the Cal Cup with thesecond solution, and attach it to the instrument.
13. Select Run to begin the stabilization for cal point 2. Statusindicators and controls are the same as for cal point 1 (step 10).
Again wait for Stable status (or click Accept when Nominal isindicated).
If doing a two-point calibration, go to step 16.
14. For the third calibration point, use the cal point 1 or cal point 2solution (as specified in step 8) but change the temperature by atleast 10°C. A convenient way to do this is to move the probe—CalCup and all—into a temperature-controlled bath or container ofice. Allow time for the sensor to reach thermal equilibration withthe solution temperature. With stirring or agitation, this should takeabout 10 minutes, perhaps up to 30 minutes if left undisturbed.
15. When the temperature is stable, select Run for cal point 3.
When Nominal is accepted or Stable is indicated for cal point 3,the final screen is displayed.
16. The final screen of the Calibration Wizard shows the sensor slopeand offset calculated during the calibration process. For a three-point bithermal calibration, the calculated isopotential point isshown. If a single-point calibration has been performed, theisopotential point is the one calculated during the last three-pointbithermal calibration.
17. Select Finish to program the sensor with the newly calculatedcalibration coefficients.
The nitrate sensor is now calibrated and ready to use.
Options for storing sensors:
The sensor should calibrated immediately before use. If storage isnecessary, remove the sensor from the instrument and immerse in 14ppm N solution, for later use in the low nitrate range, or 140 ppm Nsolution, for use in the high range.
SENSOR SLOPE AND OFFSET
The expected slope for a new sensor is about 57 (± 2) mV per decadeof concentration (ppm). The calibration curve begins to deviate fromlinear at about 10 ppm. The sensor’s zero offset is recalculated witheach single-point calibration.
UNITS AND CALCULATED MEASUREMENTS
Nitrate ion concentration is reported in ppm (equivalent to mg/L). Nocalculated measurements are available.
USAGE RECOMMENDATIONS AND CAUTIONS
Nitrate SensorOperating Temperature -5°C to 40°C (23°F to104°F) continuous
temperature; can tolerate up to 50°C(122°F) intermittently
Pressure Rating 20 psi (14 m, 46 ft)pH range 2.5 to 11
TEMPERATURE
The higher the temperature, the shorter the lifetime of the electrode.1°C difference in temperature causes a 2% error at 10 ppm, unless abithermal calibration is performed.
Do not submerge the nitrate sensor deeper than 46 ft(14 m).
TIP: You can look at the calibration report right aftercalibrating, or at any time. See “Calibration History” inSection 10 for details.
TIP: The used calibration solution may be flushed downthe drain with running water, or saved in a separatecontainer and used as a rinse the next time you calibratewith the same solution.
SECTION 17: NITRATE
17
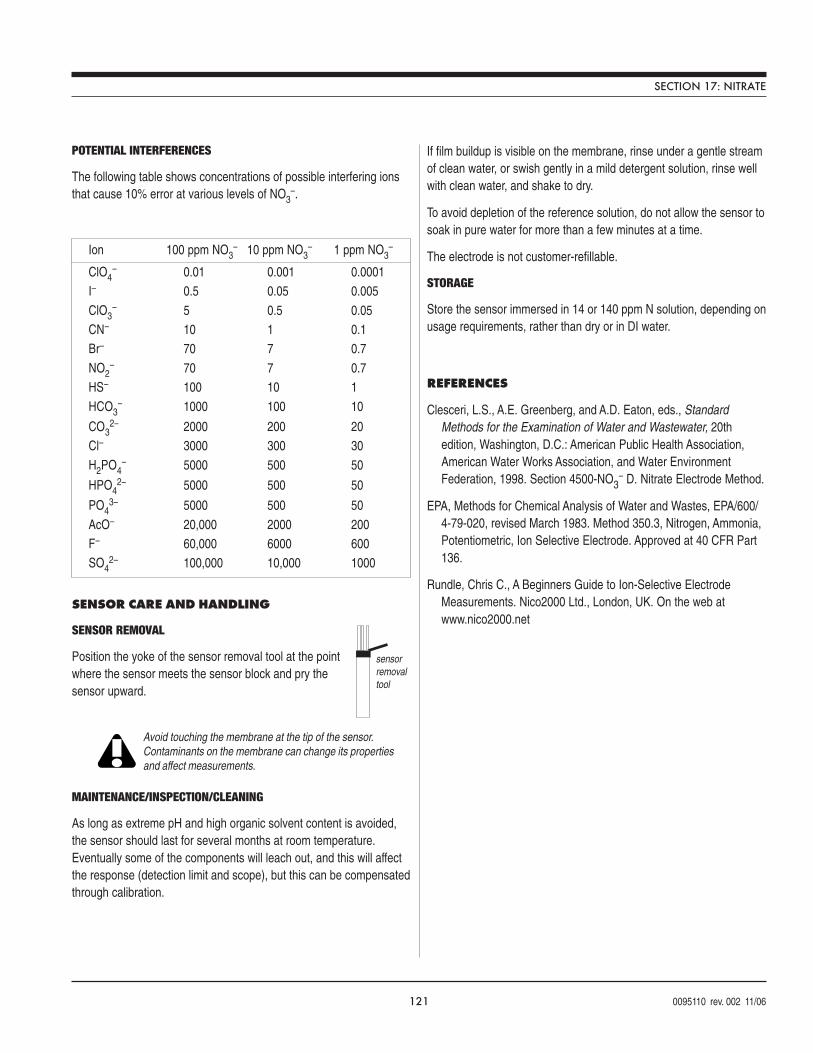
121 0095110 rev. 002 11/06
POTENTIAL INTERFERENCES
The following table shows concentrations of possible interfering ionsthat cause 10% error at various levels of NO3
–.
SENSOR CARE AND HANDLING
SENSOR REMOVAL
Position the yoke of the sensor removal tool at the pointwhere the sensor meets the sensor block and pry thesensor upward.
MAINTENANCE/INSPECTION/CLEANING
As long as extreme pH and high organic solvent content is avoided,the sensor should last for several months at room temperature.Eventually some of the components will leach out, and this will affectthe response (detection limit and scope), but this can be compensatedthrough calibration.
If film buildup is visible on the membrane, rinse under a gentle streamof clean water, or swish gently in a mild detergent solution, rinse wellwith clean water, and shake to dry.
To avoid depletion of the reference solution, do not allow the sensor tosoak in pure water for more than a few minutes at a time.
The electrode is not customer-refillable.
STORAGE
Store the sensor immersed in 14 or 140 ppm N solution, depending onusage requirements, rather than dry or in DI water.
REFERENCES
Clesceri, L.S., A.E. Greenberg, and A.D. Eaton, eds., StandardMethods for the Examination of Water and Wastewater, 20thedition, Washington, D.C.: American Public Health Association,American Water Works Association, and Water EnvironmentFederation, 1998. Section 4500-NO3
– D. Nitrate Electrode Method.
EPA, Methods for Chemical Analysis of Water and Wastes, EPA/600/4-79-020, revised March 1983. Method 350.3, Nitrogen, Ammonia,Potentiometric, Ion Selective Electrode. Approved at 40 CFR Part136.
Rundle, Chris C., A Beginners Guide to Ion-Selective ElectrodeMeasurements. Nico2000 Ltd., London, UK. On the web atwww.nico2000.net
Avoid touching the membrane at the tip of the sensor.Contaminants on the membrane can change its propertiesand affect measurements.
sensorremovaltool
Ion 100 ppm NO3– 10 ppm NO3
– 1 ppm NO3–
ClO4– 0.01 0.001 0.0001
I– 0.5 0.05 0.005
ClO3– 5 0.5 0.05
CN– 10 1 0.1Br– 70 7 0.7
NO2– 70 7 0.7
HS– 100 10 1
HCO3– 1000 100 10
CO32– 2000 200 20
Cl– 3000 300 30
H2PO4– 5000 500 50
HPO42– 5000 500 50
PO43– 5000 500 50
AcO– 20,000 2000 200F– 60,000 6000 600SO4
2– 100,000 10,000 1000
SECTION 17: NITRATE
122 0095110 rev. 002 11/06
Multi-ParameterWater Quality TROLL®
Turbidity sensor
Optional wiper
WHAT IS TURBIDITY?
Turbidity is an indirect measure of the clarity or transparency of water,and thus an important indicator of its condition and productivity.Created by suspended matter and microscopic organisms, turbiditycauses light to be scattered and absorbed rather than transmitteddirectly through water. Turbidity is the physical characteristic of thesolution that causes light scattering. Turbidity is the opposite of clarity.
The APHA reference work Standard Methods (Clesceri and others,1998) defines turbidity as “an expression of the optical property thatcauses light to be scattered and absorbed rather than transmitted withno change in direction or flux level through the sample.”
Turbidity is not . . .
• a direct measure of clarity.• a measure of color.• a measure of suspended solids; it is a measure of their
light-scattering abilities.
The In-Situ Turbidity sensor* is in conformance with the ISO 7027turbidity standard which specifies 90° scattered light.
WHY MEASURE TURBIDITY?
Turbidity measurements
• can provide a reasonable estimate of the total suspended solids orsediments (TSS) concentration in water.
• can tell us something about the healthof a natural water body. Clear waterlets light penetrate more deeply into alake or stream than does murky water.This light allows photosynthesis to occurand oxygen to be produced.
• can be a useful indicator of runoff into surface water systems.
• in flow-cell or in-line applications, when pumping water at very lowrates, can provide a good indication of true formation water.
Higher turbidity levels make it more costly to treat surface water foruse as drinking water. Controlling turbidity may be an effective way toprotect against pathogens in drinking water.
Aesthetic considerations also play a role in our desire to quantifyturbidity: Most people would rather look at, drink, or swim in clearwater than in water that appears cloudy, and closely associateappearance with the health of the body of water.
HOW IS TURBIDITY MEASURED?
Historical methods for measuring turbidity relied on subjectiveestimates that depended largely on the eye of the beholder.
In the Jackson Candle method, for example, a candle flame isobserved through the length of a glass tube intowhich a fluid sample is poured until the rays oftransmitted and scattered light appear equal and theflame essentially disappears. Among severaldrawbacks to this method, the reproducibility ofstandards formulated from natural sediments wasdifficult to control.
The Secchi disk method used in limnological studiesinvolves submerging a weighted, black-and-white
18 TURBIDITY
EPA drinking water 0.3 - 0.5 NTUTreated water 0 - 1 NTUFresh water, >21.5” visibility < 10 NTUFresh water, 2.5” visibility 240 NTUShort-term stress to aquatic life > 10 NTUUnsafe level for most aquatic life > 100 NTU
Typical turbidity values
* Contains an assembly, US Pat. No. 6,842,243
123 0095110 rev. 002 11/06
Use of the wiper will significantly impact battery life.Lithium batteries are recommended.
painted metal plate until the pattern can no longer be detected. Theplate is then pulled up until it is visible again. The average of the twodepths provides an estimate of water clarity or transparency.
Modern turbidimeters measure the loss in intensity of a light beam asit passes through a solution containing suspended and dissolvedparticles that are large enough to scatter the light. The method isbased upon a comparison of the intensity of light scattered by thesample with the intensity of light scattered by a standard referencesuspension. The nephelometer is a particular type of turbidimeter thatmeasures the intensity of light scattered at right angles (90°) to theincident light. This lessens the difficulty of differentiating smallchanges against a large background. Standards for turbidity-measurement instruments specify the light source, angle, wavelength,beam width, and sample suspensions, among other factors. Many oftoday’s commonly accepted procedures (e.g., Standard Methods,EPA, and ISO) apply to laboratory bench-top instruments.
THE TURBIDITY SENSOR
The optional turbidity sensor of the Multi-Parameter TROLL 9500 ispermanently-installed and factory-calibrated. It may be a turbiditysensor alone or a pressure/turbidity sensor combination. If your MPTROLL 9500 was ordered without a turbidity sensor or a pressuresensor, there will be a permanently installed plug in the pressure/turbidity sensor slot. A turbidity sensor or combination pressure/turbidity sensor can be added at the factory.
The In-Situ turbidity sensor is comprised of a matched solid-statedetector-emitter pair positioned at right angles. The light source is aninfrared LED, optimized for operation at 870 nanometers (nm). Theoptical windows of the detector (photodiode) and emitter (LED) are
scratch-resistant sapphire. ISO 7027 has set a detection angle of 90°and the light wavelength at 860 nm. The sensor uses active modula-tion for ambient light rejection.
The In-Situ sensor is an electronic nephelometer which compares theintensity of light scattered by the environmental fluid with intensity oflight scattered by a standard reference suspension. The higher theintensity of scattered light, as measured in NTU’s, the higher theturbidity. This measurement generally provides a very good correlationwith the concentration of particles in the water that affect clarity.However, measurements of scattered light cannot be directly relatedto a gravimetric equivalent, such as suspended sediment load, unlessa working curve for the specific sample is created.
THE TURBIDITY WIPER
The optional wiper accessory helps to keep the turbidity sensor opticsfree of bubbles and fouling.
The wiper installs in port P3 of the MP TROLL 9500 like otherremoveable sensors. A positional brace aligns it with respect to theturbidity sensor and keeps it stable in moving waters.
The wiper pad is adhesive-free, low-abrasion cotton material. The padis easily replaced when it becomes too soiled to clean the sensoroptics effectively.
SECTION 18: TURBIDITY
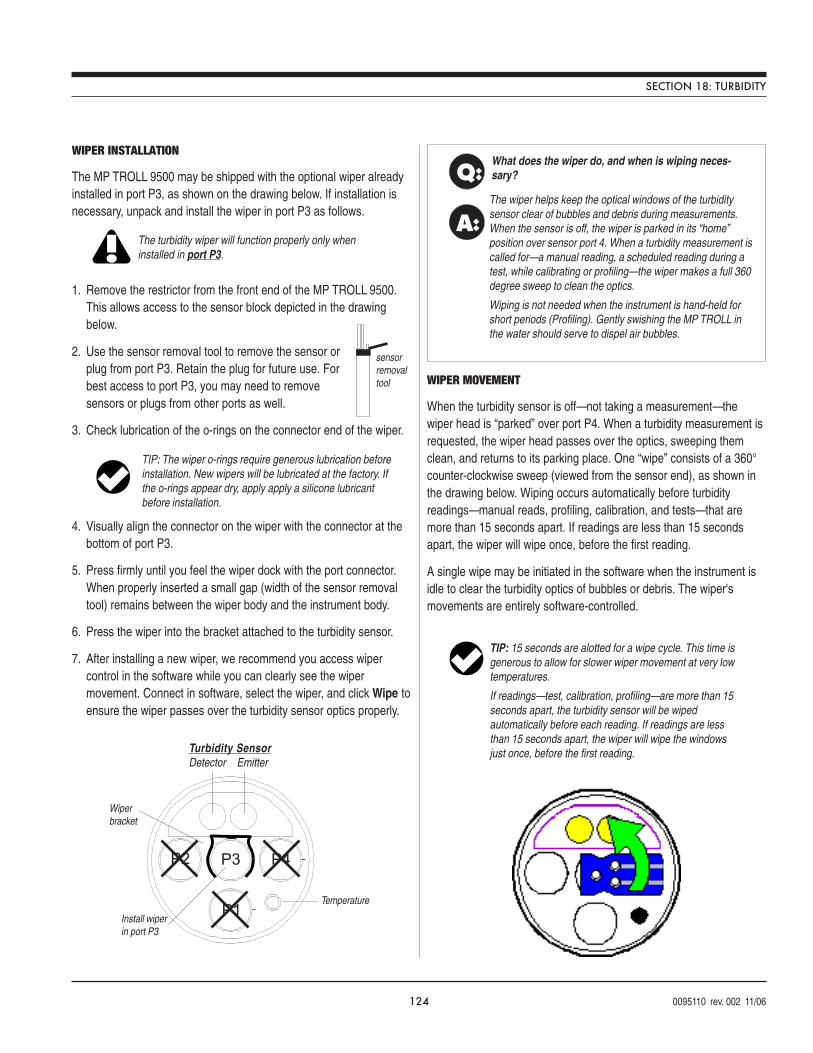
124 0095110 rev. 002 11/06
1
2 3 4
Turbidity SensorDetector Emitter
P2
P1
P3 P4
Temperature
Install wiperin port P3
Wiperbracket
TIP: The wiper o-rings require generous lubrication beforeinstallation. New wipers will be lubricated at the factory. Ifthe o-rings appear dry, apply apply a silicone lubricantbefore installation.
The turbidity wiper will function properly only wheninstalled in port P3.
Q:
A:
What does the wiper do, and when is wiping neces-sary?
The wiper helps keep the optical windows of the turbiditysensor clear of bubbles and debris during measurements.When the sensor is off, the wiper is parked in its “home”position over sensor port 4. When a turbidity measurement iscalled for—a manual reading, a scheduled reading during atest, while calibrating or profiling—the wiper makes a full 360degree sweep to clean the optics.
Wiping is not needed when the instrument is hand-held forshort periods (Profiling). Gently swishing the MP TROLL inthe water should serve to dispel air bubbles.
sensorremovaltool
WIPER INSTALLATION
The MP TROLL 9500 may be shipped with the optional wiper alreadyinstalled in port P3, as shown on the drawing below. If installation isnecessary, unpack and install the wiper in port P3 as follows.
1. Remove the restrictor from the front end of the MP TROLL 9500.This allows access to the sensor block depicted in the drawingbelow.
2. Use the sensor removal tool to remove the sensor orplug from port P3. Retain the plug for future use. Forbest access to port P3, you may need to removesensors or plugs from other ports as well.
3. Check lubrication of the o-rings on the connector end of the wiper.
4. Visually align the connector on the wiper with the connector at thebottom of port P3.
5. Press firmly until you feel the wiper dock with the port connector.When properly inserted a small gap (width of the sensor removaltool) remains between the wiper body and the instrument body.
6. Press the wiper into the bracket attached to the turbidity sensor.
7. After installing a new wiper, we recommend you access wipercontrol in the software while you can clearly see the wipermovement. Connect in software, select the wiper, and click Wipe toensure the wiper passes over the turbidity sensor optics properly.
WIPER MOVEMENT
When the turbidity sensor is off—not taking a measurement—thewiper head is “parked” over port P4. When a turbidity measurement isrequested, the wiper head passes over the optics, sweeping themclean, and returns to its parking place. One “wipe” consists of a 360°counter-clockwise sweep (viewed from the sensor end), as shown inthe drawing below. Wiping occurs automatically before turbidityreadings—manual reads, profiling, calibration, and tests—that aremore than 15 seconds apart. If readings are less than 15 secondsapart, the wiper will wipe once, before the first reading.
A single wipe may be initiated in the software when the instrument isidle to clear the turbidity optics of bubbles or debris. The wiper'smovements are entirely software-controlled.
SECTION 18: TURBIDITY
TIP: 15 seconds are alotted for a wipe cycle. This time isgenerous to allow for slower wiper movement at very lowtemperatures.
If readings—test, calibration, profiling—are more than 15seconds apart, the turbidity sensor will be wipedautomatically before each reading. If readings are lessthan 15 seconds apart, the wiper will wipe the windowsjust once, before the first reading.
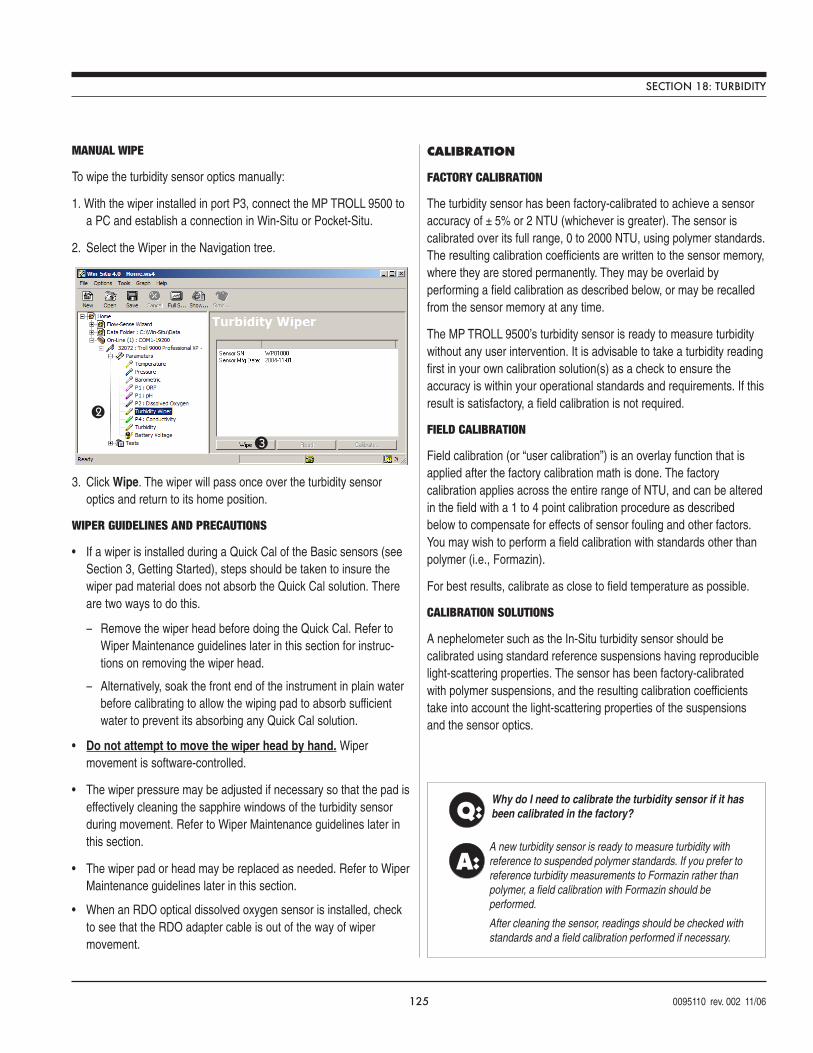
125 0095110 rev. 002 11/06
Q:
A:
Why do I need to calibrate the turbidity sensor if it hasbeen calibrated in the factory?
A new turbidity sensor is ready to measure turbidity withreference to suspended polymer standards. If you prefer toreference turbidity measurements to Formazin rather thanpolymer, a field calibration with Formazin should beperformed.
After cleaning the sensor, readings should be checked withstandards and a field calibration performed if necessary.
MANUAL WIPE
To wipe the turbidity sensor optics manually:
1. With the wiper installed in port P3, connect the MP TROLL 9500 toa PC and establish a connection in Win-Situ or Pocket-Situ.
2. Select the Wiper in the Navigation tree.
3. Click Wipe. The wiper will pass once over the turbidity sensoroptics and return to its home position.
WIPER GUIDELINES AND PRECAUTIONS
• If a wiper is installed during a Quick Cal of the Basic sensors (seeSection 3, Getting Started), steps should be taken to insure thewiper pad material does not absorb the Quick Cal solution. Thereare two ways to do this.
– Remove the wiper head before doing the Quick Cal. Refer toWiper Maintenance guidelines later in this section for instruc-tions on removing the wiper head.
– Alternatively, soak the front end of the instrument in plain waterbefore calibrating to allow the wiping pad to absorb sufficientwater to prevent its absorbing any Quick Cal solution.
• Do not attempt to move the wiper head by hand. Wipermovement is software-controlled.
• The wiper pressure may be adjusted if necessary so that the pad iseffectively cleaning the sapphire windows of the turbidity sensorduring movement. Refer to Wiper Maintenance guidelines later inthis section.
• The wiper pad or head may be replaced as needed. Refer to WiperMaintenance guidelines later in this section.
• When an RDO optical dissolved oxygen sensor is installed, checkto see that the RDO adapter cable is out of the way of wipermovement.
CALIBRATION
FACTORY CALIBRATION
The turbidity sensor has been factory-calibrated to achieve a sensoraccuracy of ± 5% or 2 NTU (whichever is greater). The sensor iscalibrated over its full range, 0 to 2000 NTU, using polymer standards.The resulting calibration coefficients are written to the sensor memory,where they are stored permanently. They may be overlaid byperforming a field calibration as described below, or may be recalledfrom the sensor memory at any time.
The MP TROLL 9500’s turbidity sensor is ready to measure turbiditywithout any user intervention. It is advisable to take a turbidity readingfirst in your own calibration solution(s) as a check to ensure theaccuracy is within your operational standards and requirements. If thisresult is satisfactory, a field calibration is not required.
FIELD CALIBRATION
Field calibration (or “user calibration”) is an overlay function that isapplied after the factory calibration math is done. The factorycalibration applies across the entire range of NTU, and can be alteredin the field with a 1 to 4 point calibration procedure as describedbelow to compensate for effects of sensor fouling and other factors.You may wish to perform a field calibration with standards other thanpolymer (i.e., Formazin).
For best results, calibrate as close to field temperature as possible.
CALIBRATION SOLUTIONS
A nephelometer such as the In-Situ turbidity sensor should becalibrated using standard reference suspensions having reproduciblelight-scattering properties. The sensor has been factory-calibratedwith polymer suspensions, and the resulting calibration coefficientstake into account the light-scattering properties of the suspensionsand the sensor optics.
SECTION 18: TURBIDITY
2
3
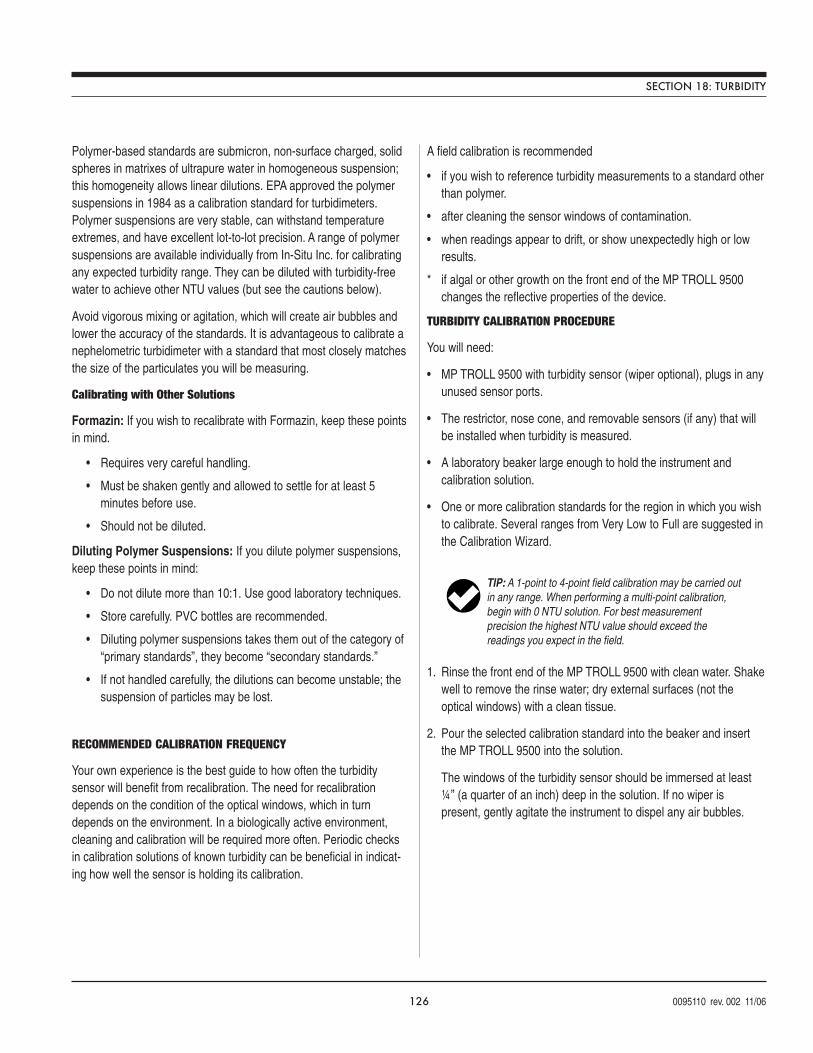
126 0095110 rev. 002 11/06
TIP: A 1-point to 4-point field calibration may be carried outin any range. When performing a multi-point calibration,begin with 0 NTU solution. For best measurementprecision the highest NTU value should exceed thereadings you expect in the field.
Polymer-based standards are submicron, non-surface charged, solidspheres in matrixes of ultrapure water in homogeneous suspension;this homogeneity allows linear dilutions. EPA approved the polymersuspensions in 1984 as a calibration standard for turbidimeters.Polymer suspensions are very stable, can withstand temperatureextremes, and have excellent lot-to-lot precision. A range of polymersuspensions are available individually from In-Situ Inc. for calibratingany expected turbidity range. They can be diluted with turbidity-freewater to achieve other NTU values (but see the cautions below).
Avoid vigorous mixing or agitation, which will create air bubbles andlower the accuracy of the standards. It is advantageous to calibrate anephelometric turbidimeter with a standard that most closely matchesthe size of the particulates you will be measuring.
Calibrating with Other Solutions
Formazin: If you wish to recalibrate with Formazin, keep these pointsin mind.
• Requires very careful handling.
• Must be shaken gently and allowed to settle for at least 5minutes before use.
• Should not be diluted.
Diluting Polymer Suspensions: If you dilute polymer suspensions,keep these points in mind:
• Do not dilute more than 10:1. Use good laboratory techniques.
• Store carefully. PVC bottles are recommended.
• Diluting polymer suspensions takes them out of the category of“primary standards”, they become “secondary standards.”
• If not handled carefully, the dilutions can become unstable; thesuspension of particles may be lost.
RECOMMENDED CALIBRATION FREQUENCY
Your own experience is the best guide to how often the turbiditysensor will benefit from recalibration. The need for recalibrationdepends on the condition of the optical windows, which in turndepends on the environment. In a biologically active environment,cleaning and calibration will be required more often. Periodic checksin calibration solutions of known turbidity can be beneficial in indicat-ing how well the sensor is holding its calibration.
A field calibration is recommended
• if you wish to reference turbidity measurements to a standard otherthan polymer.
• after cleaning the sensor windows of contamination.
• when readings appear to drift, or show unexpectedly high or lowresults.
* if algal or other growth on the front end of the MP TROLL 9500changes the reflective properties of the device.
TURBIDITY CALIBRATION PROCEDURE
You will need:
• MP TROLL 9500 with turbidity sensor (wiper optional), plugs in anyunused sensor ports.
• The restrictor, nose cone, and removable sensors (if any) that willbe installed when turbidity is measured.
• A laboratory beaker large enough to hold the instrument andcalibration solution.
• One or more calibration standards for the region in which you wishto calibrate. Several ranges from Very Low to Full are suggested inthe Calibration Wizard.
1. Rinse the front end of the MP TROLL 9500 with clean water. Shakewell to remove the rinse water; dry external surfaces (not theoptical windows) with a clean tissue.
2. Pour the selected calibration standard into the beaker and insertthe MP TROLL 9500 into the solution.
The windows of the turbidity sensor should be immersed at least¼” (a quarter of an inch) deep in the solution. If no wiper ispresent, gently agitate the instrument to dispel any air bubbles.
SECTION 18: TURBIDITY
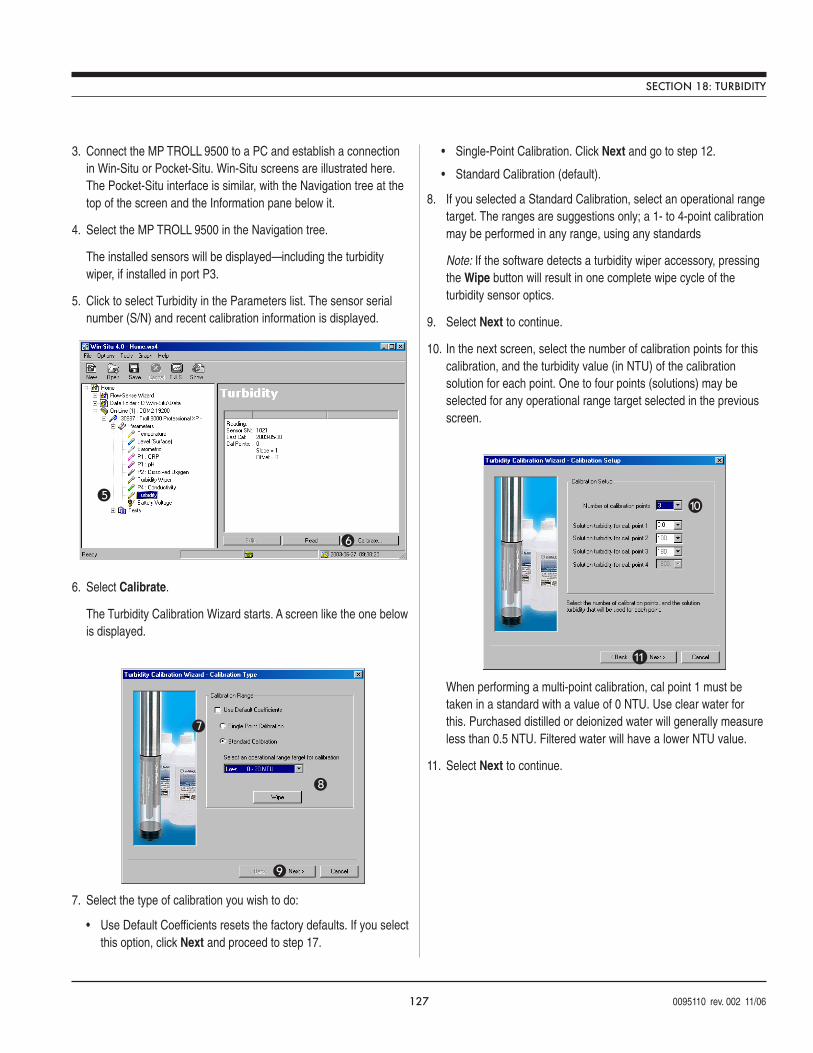
127 0095110 rev. 002 11/06
6
510
11
7
8
9
3. Connect the MP TROLL 9500 to a PC and establish a connectionin Win-Situ or Pocket-Situ. Win-Situ screens are illustrated here.The Pocket-Situ interface is similar, with the Navigation tree at thetop of the screen and the Information pane below it.
4. Select the MP TROLL 9500 in the Navigation tree.
The installed sensors will be displayed—including the turbiditywiper, if installed in port P3.
5. Click to select Turbidity in the Parameters list. The sensor serialnumber (S/N) and recent calibration information is displayed.
6. Select Calibrate.
The Turbidity Calibration Wizard starts. A screen like the one belowis displayed.
7. Select the type of calibration you wish to do:
• Use Default Coefficients resets the factory defaults. If you selectthis option, click Next and proceed to step 17.
• Single-Point Calibration. Click Next and go to step 12.
• Standard Calibration (default).
8. If you selected a Standard Calibration, select an operational rangetarget. The ranges are suggestions only; a 1- to 4-point calibrationmay be performed in any range, using any standards
Note: If the software detects a turbidity wiper accessory, pressingthe Wipe button will result in one complete wipe cycle of theturbidity sensor optics.
9. Select Next to continue.
10. In the next screen, select the number of calibration points for thiscalibration, and the turbidity value (in NTU) of the calibrationsolution for each point. One to four points (solutions) may beselected for any operational range target selected in the previousscreen.
When performing a multi-point calibration, cal point 1 must betaken in a standard with a value of 0 NTU. Use clear water forthis. Purchased distilled or deionized water will generally measureless than 0.5 NTU. Filtered water will have a lower NTU value.
11. Select Next to continue.
SECTION 18: TURBIDITY
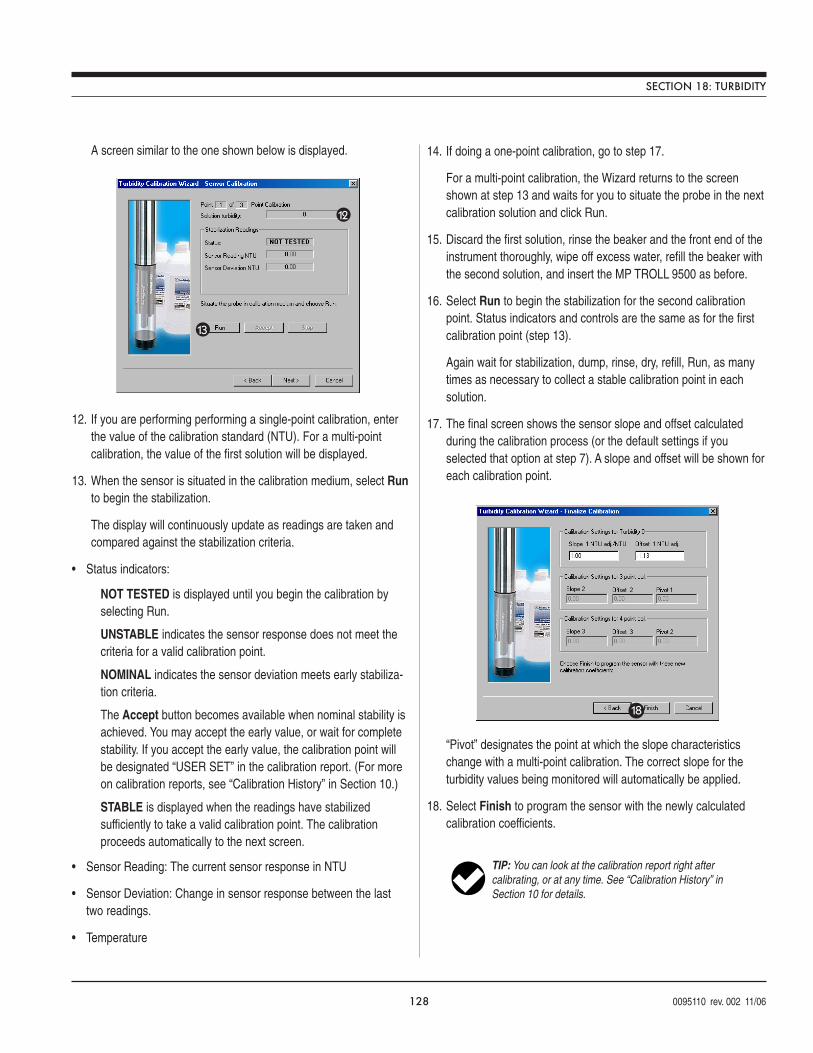
128 0095110 rev. 002 11/06
13
12
18
TIP: You can look at the calibration report right aftercalibrating, or at any time. See “Calibration History” inSection 10 for details.
A screen similar to the one shown below is displayed.
12. If you are performing performing a single-point calibration, enterthe value of the calibration standard (NTU). For a multi-pointcalibration, the value of the first solution will be displayed.
13. When the sensor is situated in the calibration medium, select Runto begin the stabilization.
The display will continuously update as readings are taken andcompared against the stabilization criteria.
• Status indicators:
NOT TESTED is displayed until you begin the calibration byselecting Run.
UNSTABLE indicates the sensor response does not meet thecriteria for a valid calibration point.
NOMINAL indicates the sensor deviation meets early stabiliza-tion criteria.
The Accept button becomes available when nominal stability isachieved. You may accept the early value, or wait for completestability. If you accept the early value, the calibration point willbe designated “USER SET” in the calibration report. (For moreon calibration reports, see “Calibration History” in Section 10.)
STABLE is displayed when the readings have stabilizedsufficiently to take a valid calibration point. The calibrationproceeds automatically to the next screen.
• Sensor Reading: The current sensor response in NTU
• Sensor Deviation: Change in sensor response between the lasttwo readings.
• Temperature
14. If doing a one-point calibration, go to step 17.
For a multi-point calibration, the Wizard returns to the screenshown at step 13 and waits for you to situate the probe in the nextcalibration solution and click Run.
15. Discard the first solution, rinse the beaker and the front end of theinstrument thoroughly, wipe off excess water, refill the beaker withthe second solution, and insert the MP TROLL 9500 as before.
16. Select Run to begin the stabilization for the second calibrationpoint. Status indicators and controls are the same as for the firstcalibration point (step 13).
Again wait for stabilization, dump, rinse, dry, refill, Run, as manytimes as necessary to collect a stable calibration point in eachsolution.
17. The final screen shows the sensor slope and offset calculatedduring the calibration process (or the default settings if youselected that option at step 7). A slope and offset will be shown foreach calibration point.
“Pivot” designates the point at which the slope characteristicschange with a multi-point calibration. The correct slope for theturbidity values being monitored will automatically be applied.
18. Select Finish to program the sensor with the newly calculatedcalibration coefficients.
SECTION 18: TURBIDITY
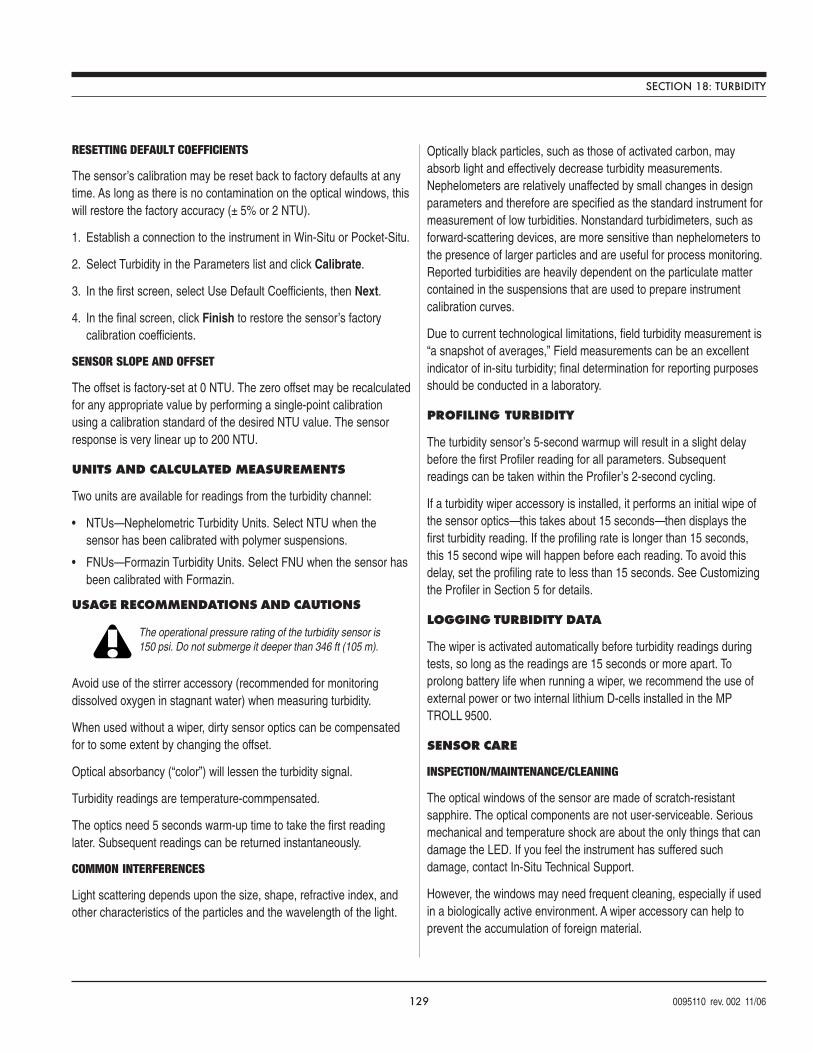
129 0095110 rev. 002 11/06
The operational pressure rating of the turbidity sensor is150 psi. Do not submerge it deeper than 346 ft (105 m).
RESETTING DEFAULT COEFFICIENTS
The sensor’s calibration may be reset back to factory defaults at anytime. As long as there is no contamination on the optical windows, thiswill restore the factory accuracy (± 5% or 2 NTU).
1. Establish a connection to the instrument in Win-Situ or Pocket-Situ.
2. Select Turbidity in the Parameters list and click Calibrate.
3. In the first screen, select Use Default Coefficients, then Next.
4. In the final screen, click Finish to restore the sensor’s factorycalibration coefficients.
SENSOR SLOPE AND OFFSET
The offset is factory-set at 0 NTU. The zero offset may be recalculatedfor any appropriate value by performing a single-point calibrationusing a calibration standard of the desired NTU value. The sensorresponse is very linear up to 200 NTU.
UNITS AND CALCULATED MEASUREMENTS
Two units are available for readings from the turbidity channel:
• NTUs—Nephelometric Turbidity Units. Select NTU when thesensor has been calibrated with polymer suspensions.
• FNUs—Formazin Turbidity Units. Select FNU when the sensor hasbeen calibrated with Formazin.
USAGE RECOMMENDATIONS AND CAUTIONS
Avoid use of the stirrer accessory (recommended for monitoringdissolved oxygen in stagnant water) when measuring turbidity.
When used without a wiper, dirty sensor optics can be compensatedfor to some extent by changing the offset.
Optical absorbancy (“color”) will lessen the turbidity signal.
Turbidity readings are temperature-commpensated.
The optics need 5 seconds warm-up time to take the first readinglater. Subsequent readings can be returned instantaneously.
COMMON INTERFERENCES
Light scattering depends upon the size, shape, refractive index, andother characteristics of the particles and the wavelength of the light.
Optically black particles, such as those of activated carbon, mayabsorb light and effectively decrease turbidity measurements.Nephelometers are relatively unaffected by small changes in designparameters and therefore are specified as the standard instrument formeasurement of low turbidities. Nonstandard turbidimeters, such asforward-scattering devices, are more sensitive than nephelometers tothe presence of larger particles and are useful for process monitoring.Reported turbidities are heavily dependent on the particulate mattercontained in the suspensions that are used to prepare instrumentcalibration curves.
Due to current technological limitations, field turbidity measurement is“a snapshot of averages,” Field measurements can be an excellentindicator of in-situ turbidity; final determination for reporting purposesshould be conducted in a laboratory.
PROFILING TURBIDITY
The turbidity sensor’s 5-second warmup will result in a slight delaybefore the first Profiler reading for all parameters. Subsequentreadings can be taken within the Profiler’s 2-second cycling.
If a turbidity wiper accessory is installed, it performs an initial wipe ofthe sensor optics—this takes about 15 seconds—then displays thefirst turbidity reading. If the profiling rate is longer than 15 seconds,this 15 second wipe will happen before each reading. To avoid thisdelay, set the profiling rate to less than 15 seconds. See Customizingthe Profiler in Section 5 for details.
LOGGING TURBIDITY DATA
The wiper is activated automatically before turbidity readings duringtests, so long as the readings are 15 seconds or more apart. Toprolong battery life when running a wiper, we recommend the use ofexternal power or two internal lithium D-cells installed in the MPTROLL 9500.
SENSOR CARE
INSPECTION/MAINTENANCE/CLEANING
The optical windows of the sensor are made of scratch-resistantsapphire. The optical components are not user-serviceable. Seriousmechanical and temperature shock are about the only things that candamage the LED. If you feel the instrument has suffered suchdamage, contact In-Situ Technical Support.
However, the windows may need frequent cleaning, especially if usedin a biologically active environment. A wiper accessory can help toprevent the accumulation of foreign material.
SECTION 18: TURBIDITY
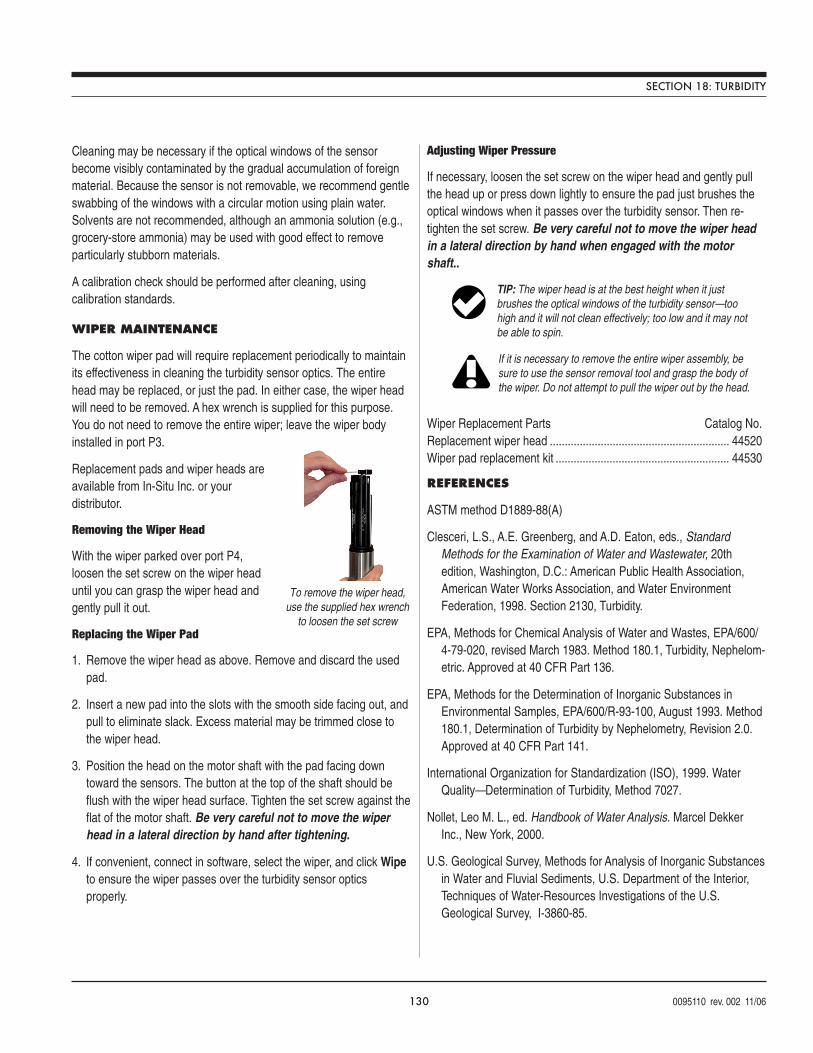
130 0095110 rev. 002 11/06
If it is necessary to remove the entire wiper assembly, besure to use the sensor removal tool and grasp the body ofthe wiper. Do not attempt to pull the wiper out by the head.
Cleaning may be necessary if the optical windows of the sensorbecome visibly contaminated by the gradual accumulation of foreignmaterial. Because the sensor is not removable, we recommend gentleswabbing of the windows with a circular motion using plain water.Solvents are not recommended, although an ammonia solution (e.g.,grocery-store ammonia) may be used with good effect to removeparticularly stubborn materials.
A calibration check should be performed after cleaning, usingcalibration standards.
WIPER MAINTENANCE
The cotton wiper pad will require replacement periodically to maintainits effectiveness in cleaning the turbidity sensor optics. The entirehead may be replaced, or just the pad. In either case, the wiper headwill need to be removed. A hex wrench is supplied for this purpose.You do not need to remove the entire wiper; leave the wiper bodyinstalled in port P3.
Replacement pads and wiper heads areavailable from In-Situ Inc. or yourdistributor.
Removing the Wiper Head
With the wiper parked over port P4,loosen the set screw on the wiper headuntil you can grasp the wiper head andgently pull it out.
Replacing the Wiper Pad
1. Remove the wiper head as above. Remove and discard the usedpad.
2. Insert a new pad into the slots with the smooth side facing out, andpull to eliminate slack. Excess material may be trimmed close tothe wiper head.
3. Position the head on the motor shaft with the pad facing downtoward the sensors. The button at the top of the shaft should beflush with the wiper head surface. Tighten the set screw against theflat of the motor shaft. Be very careful not to move the wiperhead in a lateral direction by hand after tightening.
4. If convenient, connect in software, select the wiper, and click Wipeto ensure the wiper passes over the turbidity sensor opticsproperly.
Adjusting Wiper Pressure
If necessary, loosen the set screw on the wiper head and gently pullthe head up or press down lightly to ensure the pad just brushes theoptical windows when it passes over the turbidity sensor. Then re-tighten the set screw. Be very careful not to move the wiper headin a lateral direction by hand when engaged with the motorshaft..
Wiper Replacement Parts Catalog No.Replacement wiper head ............................................................ 44520Wiper pad replacement kit .......................................................... 44530
REFERENCES
ASTM method D1889-88(A)
Clesceri, L.S., A.E. Greenberg, and A.D. Eaton, eds., StandardMethods for the Examination of Water and Wastewater, 20thedition, Washington, D.C.: American Public Health Association,American Water Works Association, and Water EnvironmentFederation, 1998. Section 2130, Turbidity.
EPA, Methods for Chemical Analysis of Water and Wastes, EPA/600/4-79-020, revised March 1983. Method 180.1, Turbidity, Nephelom-etric. Approved at 40 CFR Part 136.
EPA, Methods for the Determination of Inorganic Substances inEnvironmental Samples, EPA/600/R-93-100, August 1993. Method180.1, Determination of Turbidity by Nephelometry, Revision 2.0.Approved at 40 CFR Part 141.
International Organization for Standardization (ISO), 1999. WaterQuality—Determination of Turbidity, Method 7027.
Nollet, Leo M. L., ed. Handbook of Water Analysis. Marcel DekkerInc., New York, 2000.
U.S. Geological Survey, Methods for Analysis of Inorganic Substancesin Water and Fluvial Sediments, U.S. Department of the Interior,Techniques of Water-Resources Investigations of the U.S.Geological Survey, I-3860-85.
SECTION 18: TURBIDITY
TIP: The wiper head is at the best height when it justbrushes the optical windows of the turbidity sensor—toohigh and it will not clean effectively; too low and it may notbe able to spin.
To remove the wiper head,use the supplied hex wrench
to loosen the set screw
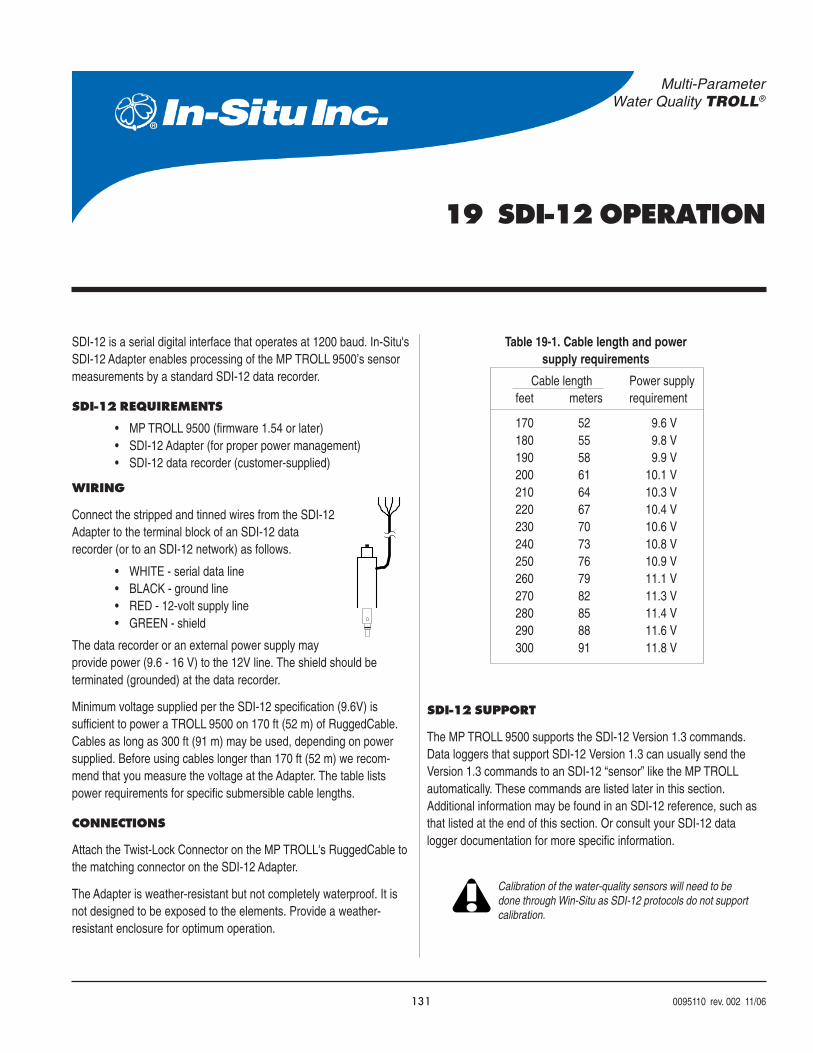
131 0095110 rev. 002 11/06
Multi-ParameterWater Quality TROLL®
19 SDI-12 OPERATION
Calibration of the water-quality sensors will need to bedone through Win-Situ as SDI-12 protocols do not supportcalibration.
SDI-12 is a serial digital interface that operates at 1200 baud. In-Situ'sSDI-12 Adapter enables processing of the MP TROLL 9500’s sensormeasurements by a standard SDI-12 data recorder.
SDI-12 REQUIREMENTS
• MP TROLL 9500 (firmware 1.54 or later)• SDI-12 Adapter (for proper power management)• SDI-12 data recorder (customer-supplied)
WIRING
Connect the stripped and tinned wires from the SDI-12Adapter to the terminal block of an SDI-12 datarecorder (or to an SDI-12 network) as follows.
• WHITE - serial data line• BLACK - ground line• RED - 12-volt supply line• GREEN - shield
The data recorder or an external power supply mayprovide power (9.6 - 16 V) to the 12V line. The shield should beterminated (grounded) at the data recorder.
Minimum voltage supplied per the SDI-12 specification (9.6V) issufficient to power a TROLL 9500 on 170 ft (52 m) of RuggedCable.Cables as long as 300 ft (91 m) may be used, depending on powersupplied. Before using cables longer than 170 ft (52 m) we recom-mend that you measure the voltage at the Adapter. The table listspower requirements for specific submersible cable lengths.
CONNECTIONS
Attach the Twist-Lock Connector on the MP TROLL's RuggedCable tothe matching connector on the SDI-12 Adapter.
The Adapter is weather-resistant but not completely waterproof. It isnot designed to be exposed to the elements. Provide a weather-resistant enclosure for optimum operation.
SDI-12 SUPPORT
The MP TROLL 9500 supports the SDI-12 Version 1.3 commands.Data loggers that support SDI-12 Version 1.3 can usually send theVersion 1.3 commands to an SDI-12 “sensor” like the MP TROLLautomatically. These commands are listed later in this section.Additional information may be found in an SDI-12 reference, such asthat listed at the end of this section. Or consult your SDI-12 datalogger documentation for more specific information.
Cable length Power supplyfeet meters requirement
170 52 9.6 V180 55 9.8 V190 58 9.9 V200 61 10.1 V210 64 10.3 V220 67 10.4 V230 70 10.6 V240 73 10.8 V250 76 10.9 V260 79 11.1 V270 82 11.3 V280 85 11.4 V290 88 11.6 V300 91 11.8 V
Table 19-1. Cable length and powersupply requirements
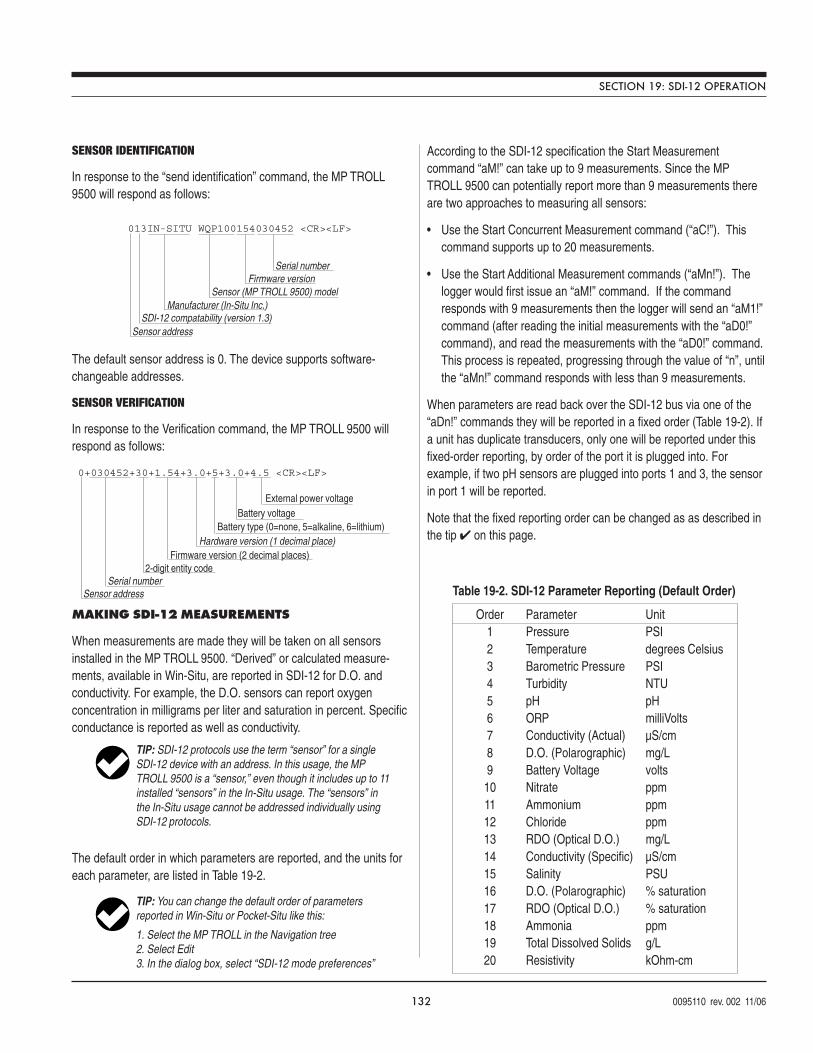
132 0095110 rev. 002 11/06
Sensor (MP TROLL 9500) modelManufacturer (In-Situ Inc.)
Firmware version
SDI-12 compatability (version 1.3)
Serial number
Sensor address
013IN-SITU WQP100154030452 <CR><LF>
TIP: SDI-12 protocols use the term “sensor” for a singleSDI-12 device with an address. In this usage, the MPTROLL 9500 is a “sensor,” even though it includes up to 11installed “sensors” in the In-Situ usage. The “sensors” inthe In-Situ usage cannot be addressed individually usingSDI-12 protocols.
Order Parameter Unit1 Pressure PSI2 Temperature degrees Celsius3 Barometric Pressure PSI4 Turbidity NTU5 pH pH6 ORP milliVolts7 Conductivity (Actual) µS/cm8 D.O. (Polarographic) mg/L9 Battery Voltage volts10 Nitrate ppm11 Ammonium ppm12 Chloride ppm13 RDO (Optical D.O.) mg/L14 Conductivity (Specific) µS/cm15 Salinity PSU16 D.O. (Polarographic) % saturation17 RDO (Optical D.O.) % saturation18 Ammonia ppm19 Total Dissolved Solids g/L20 Resistivity kOhm-cm
Table 19-2. SDI-12 Parameter Reporting (Default Order)
SECTION 19: SDI-12 OPERATION
SENSOR IDENTIFICATION
In response to the “send identification” command, the MP TROLL9500 will respond as follows:
The default sensor address is 0. The device supports software-changeable addresses.
SENSOR VERIFICATION
In response to the Verification command, the MP TROLL 9500 willrespond as follows:
MAKING SDI-12 MEASUREMENTS
When measurements are made they will be taken on all sensorsinstalled in the MP TROLL 9500. “Derived” or calculated measure-ments, available in Win-Situ, are reported in SDI-12 for D.O. andconductivity. For example, the D.O. sensors can report oxygenconcentration in milligrams per liter and saturation in percent. Specificconductance is reported as well as conductivity.
The default order in which parameters are reported, and the units foreach parameter, are listed in Table 19-2.
According to the SDI-12 specification the Start Measurementcommand “aM!” can take up to 9 measurements. Since the MPTROLL 9500 can potentially report more than 9 measurements thereare two approaches to measuring all sensors:
• Use the Start Concurrent Measurement command (“aC!”). Thiscommand supports up to 20 measurements.
• Use the Start Additional Measurement commands (“aMn!”). Thelogger would first issue an “aM!” command. If the commandresponds with 9 measurements then the logger will send an “aM1!”command (after reading the initial measurements with the “aD0!”command), and read the measurements with the “aD0!” command.This process is repeated, progressing through the value of “n”, untilthe “aMn!” command responds with less than 9 measurements.
When parameters are read back over the SDI-12 bus via one of the“aDn!” commands they will be reported in a fixed order (Table 19-2). Ifa unit has duplicate transducers, only one will be reported under thisfixed-order reporting, by order of the port it is plugged into. Forexample, if two pH sensors are plugged into ports 1 and 3, the sensorin port 1 will be reported.
Note that the fixed reporting order can be changed as as described inthe tip on this page.
TIP: You can change the default order of parametersreported in Win-Situ or Pocket-Situ like this:
1. Select the MP TROLL in the Navigation tree2. Select Edit3. In the dialog box, select “SDI-12 mode preferences”
Firmware version (2 decimal places)2-digit entity code
Hardware version (1 decimal place)
Serial numberSensor address
0+030452+30+1.54+3.0+5+3.0+4.5 <CR><LF>
Battery type (0=none, 5=alkaline, 6=lithium)Battery voltage
External power voltage
133 0095110 rev. 002 11/06
TIP: Depending on the SDI-12 data recorder used, rapidsample schedules during a test may result in SDI-12“retries.”
SECTION 19: SDI-12 OPERATION
A measurement is returned for all possible MP TROLL parameters.
• If a sensor port is empty, the unit will report readings with values of0.0.
• If you edit the device to set SDI-12 mode preferences, as de-scribed in the tip above, only the parameters you select will bereported.
• If a sensor is reading out of its range, a value of -999999.9 will bereported.
REDUNDANT LOGGING (WIN-SITU AND SDI-12)
If your MP TROLL 9500 supports internal logging, the instrument iscapable of running tests (programmed in Win-Situ) while participatingin an SDI-12 network; however Win-Situ cannot communicate with theMP TROLL 9500 while it is transmitting SDI-12 data, and conversely,the instrument cannot receive or respond to SDI-12 commands whileconnected to a PC serial port.
This “redundant logging” feature means
• if the SDI-12 recorder somehow “loses” data, the MP TROLL 9500data can be retrieved using Win-Situ.
* if the SDI-12 recorder ceases to function due to power loss, the MPTROLL 9500 will continue to collect new data using its own internalbatteries and clock.
ISCO is a Teledyne Technologies Company.
EXTENDED (ISCO) COMMANDS
Extended commands allow the data sampler to identify both the datachannels and channel units that correspond to the ASCII formattedfloating point data being returned. In response to the “aXPR0!”command, the response will be in the form: “aIxIxIx...<CR><LF>”where ‘a’ is the address, each ‘I’ is a parameter identifier, and each‘x’ specifies the units for the preceding ‘I’.
The data sampler will first issue either a measure or a concurrentmeasure command. These commands return the number ofchannels that will be reported in a subsequent read command. Thisnumber will correspond with the number of pairs returned by theextended commands.
If the expected number of “Ix” pairs is not returned in response tothe “aXPR0!” command, additional “aXPRx!” commands will beissued until all pairs are received.
REFERENCE
SDI-12, A Serial-Digital Interface Standard for Microprocessor-BasedSensors, version 1.3. SDI-12 Support Group, Logan, Utah, April 7,2000. Available at www.sdi-12.org.
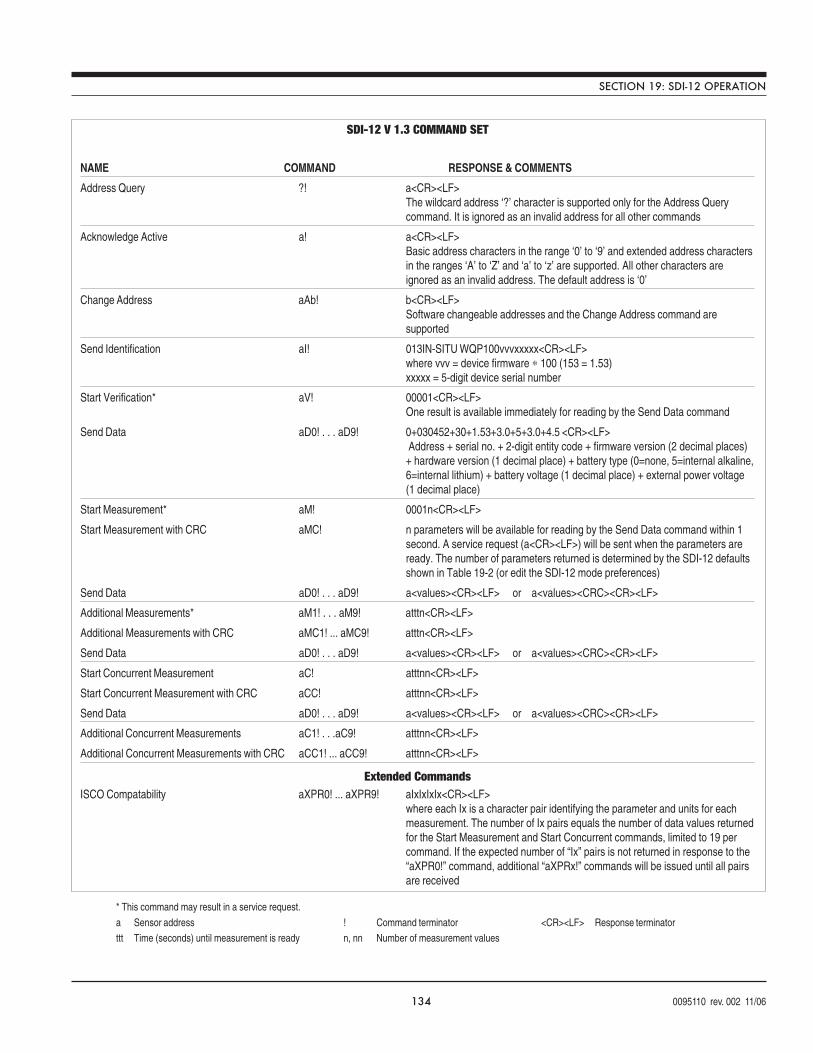
134 0095110 rev. 002 11/06
SDI-12 V 1.3 COMMAND SET
NAME COMMAND RESPONSE & COMMENTS
Address Query ?! a<CR><LF>The wildcard address ‘?’ character is supported only for the Address Querycommand. It is ignored as an invalid address for all other commands
Acknowledge Active a! a<CR><LF>Basic address characters in the range ‘0’ to ‘9’ and extended address charactersin the ranges ‘A’ to ‘Z’ and ‘a’ to ‘z’ are supported. All other characters areignored as an invalid address. The default address is ‘0’
Change Address aAb! b<CR><LF>Software changeable addresses and the Change Address command aresupported
Send Identification aI! 013IN-SITU WQP100vvvxxxxx<CR><LF>where vvv = device firmware ∗ 100 (153 = 1.53)xxxxx = 5-digit device serial number
Start Verification* aV! 00001<CR><LF>One result is available immediately for reading by the Send Data command
Send Data aD0! . . . aD9! 0+030452+30+1.53+3.0+5+3.0+4.5 <CR><LF> Address + serial no. + 2-digit entity code + firmware version (2 decimal places)+ hardware version (1 decimal place) + battery type (0=none, 5=internal alkaline,6=internal lithium) + battery voltage (1 decimal place) + external power voltage(1 decimal place)
Start Measurement* aM! 0001n<CR><LF>
Start Measurement with CRC aMC! n parameters will be available for reading by the Send Data command within 1second. A service request (a<CR><LF>) will be sent when the parameters areready. The number of parameters returned is determined by the SDI-12 defaultsshown in Table 19-2 (or edit the SDI-12 mode preferences)
Send Data aD0! . . . aD9! a<values><CR><LF> or a<values><CRC><CR><LF>
Additional Measurements* aM1! . . . aM9! atttn<CR><LF>
Additional Measurements with CRC aMC1! ... aMC9! atttn<CR><LF>
Send Data aD0! . . . aD9! a<values><CR><LF> or a<values><CRC><CR><LF>
Start Concurrent Measurement aC! atttnn<CR><LF>
Start Concurrent Measurement with CRC aCC! atttnn<CR><LF>
Send Data aD0! . . . aD9! a<values><CR><LF> or a<values><CRC><CR><LF>
Additional Concurrent Measurements aC1! . . .aC9! atttnn<CR><LF>
Additional Concurrent Measurements with CRC aCC1! ... aCC9! atttnn<CR><LF>
Extended CommandsISCO Compatability aXPR0! ... aXPR9! aIxIxIxIx<CR><LF>
where each Ix is a character pair identifying the parameter and units for eachmeasurement. The number of Ix pairs equals the number of data values returnedfor the Start Measurement and Start Concurrent commands, limited to 19 percommand. If the expected number of “Ix” pairs is not returned in response to the“aXPR0!” command, additional “aXPRx!” commands will be issued until all pairsare received
SECTION 19: SDI-12 OPERATION
* This command may result in a service request.
a Sensor address ! Command terminator <CR><LF> Response terminator
ttt Time (seconds) until measurement is ready n, nn Number of measurement values
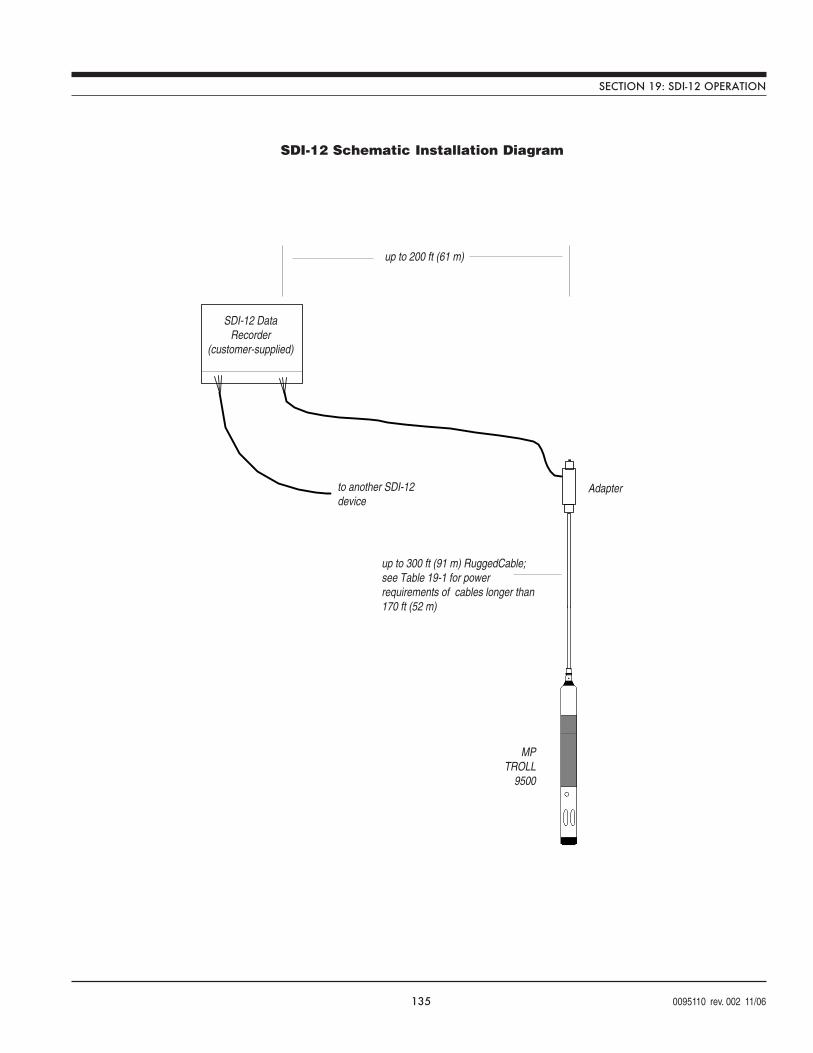
135 0095110 rev. 002 11/06
SDI-12 Schematic Installation Diagram
SECTION 19: SDI-12 OPERATION
SDI-12 DataRecorder
(customer-supplied)
MPTROLL
9500
up to 300 ft (91 m) RuggedCable;see Table 19-1 for powerrequirements of cables longer than170 ft (52 m)
to another SDI-12device
Adapter
up to 200 ft (61 m)
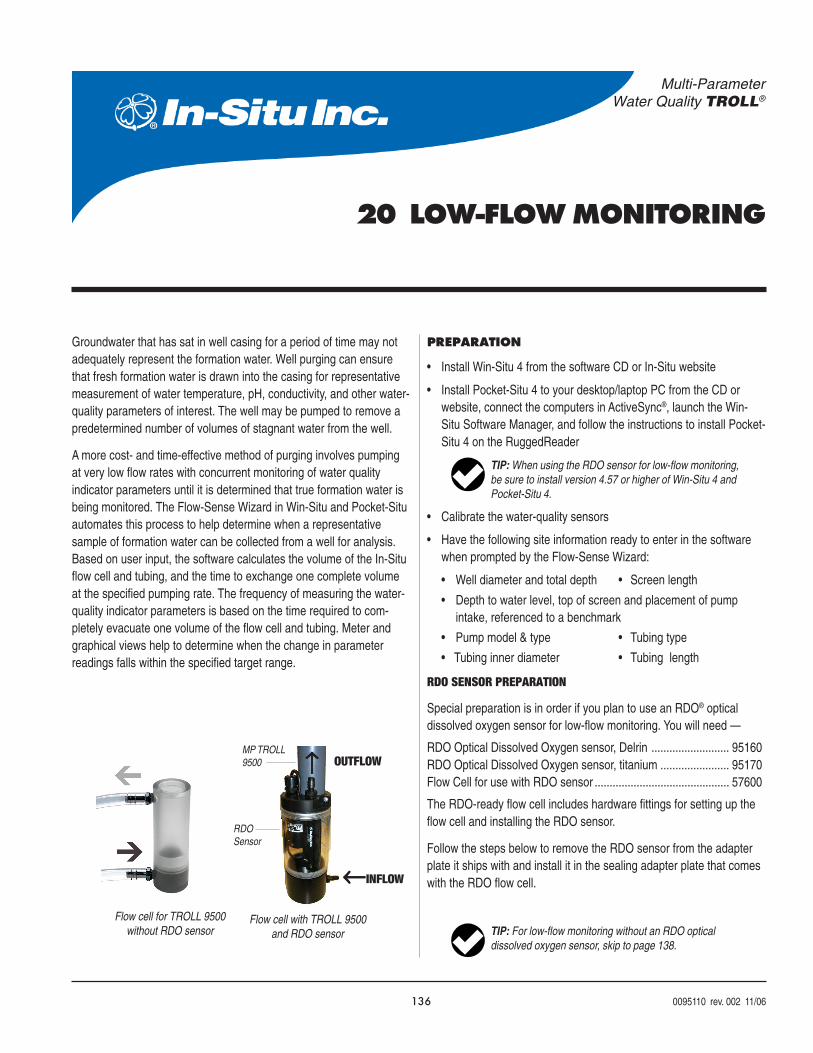
136 0095110 rev. 002 11/06
Multi-ParameterWater Quality TROLL®
20 LOW-FLOW MONITORING
Groundwater that has sat in well casing for a period of time may notadequately represent the formation water. Well purging can ensurethat fresh formation water is drawn into the casing for representativemeasurement of water temperature, pH, conductivity, and other water-quality parameters of interest. The well may be pumped to remove apredetermined number of volumes of stagnant water from the well.
A more cost- and time-effective method of purging involves pumpingat very low flow rates with concurrent monitoring of water qualityindicator parameters until it is determined that true formation water isbeing monitored. The Flow-Sense Wizard in Win-Situ and Pocket-Situautomates this process to help determine when a representativesample of formation water can be collected from a well for analysis.Based on user input, the software calculates the volume of the In-Situflow cell and tubing, and the time to exchange one complete volumeat the specified pumping rate. The frequency of measuring the water-quality indicator parameters is based on the time required to com-pletely evacuate one volume of the flow cell and tubing. Meter andgraphical views help to determine when the change in parameterreadings falls within the specified target range.
PREPARATION
• Install Win-Situ 4 from the software CD or In-Situ website
• Install Pocket-Situ 4 to your desktop/laptop PC from the CD orwebsite, connect the computers in ActiveSync®, launch the Win-Situ Software Manager, and follow the instructions to install Pocket-Situ 4 on the RuggedReader
• Calibrate the water-quality sensors
• Have the following site information ready to enter in the softwarewhen prompted by the Flow-Sense Wizard:
• Well diameter and total depth • Screen length
• Depth to water level, top of screen and placement of pumpintake, referenced to a benchmark
• Pump model & type • Tubing type
• Tubing inner diameter • Tubing length
RDO SENSOR PREPARATION
Special preparation is in order if you plan to use an RDO® opticaldissolved oxygen sensor for low-flow monitoring. You will need —
RDO Optical Dissolved Oxygen sensor, Delrin .......................... 95160RDO Optical Dissolved Oxygen sensor, titanium ....................... 95170Flow Cell for use with RDO sensor ............................................. 57600
The RDO-ready flow cell includes hardware fittings for setting up theflow cell and installing the RDO sensor.
Follow the steps below to remove the RDO sensor from the adapterplate it ships with and install it in the sealing adapter plate that comeswith the RDO flow cell.
TIP: When using the RDO sensor for low-flow monitoring,be sure to install version 4.57 or higher of Win-Situ 4 andPocket-Situ 4.
↑↑↑↑↑MP TROLL9500
RDOSensor
Flow cell with TROLL 9500and RDO sensor
OUTFLOW
←←←←←INFLOW
Flow cell for TROLL 9500without RDO sensor TIP: For low-flow monitoring without an RDO optical
dissolved oxygen sensor, skip to page 138.
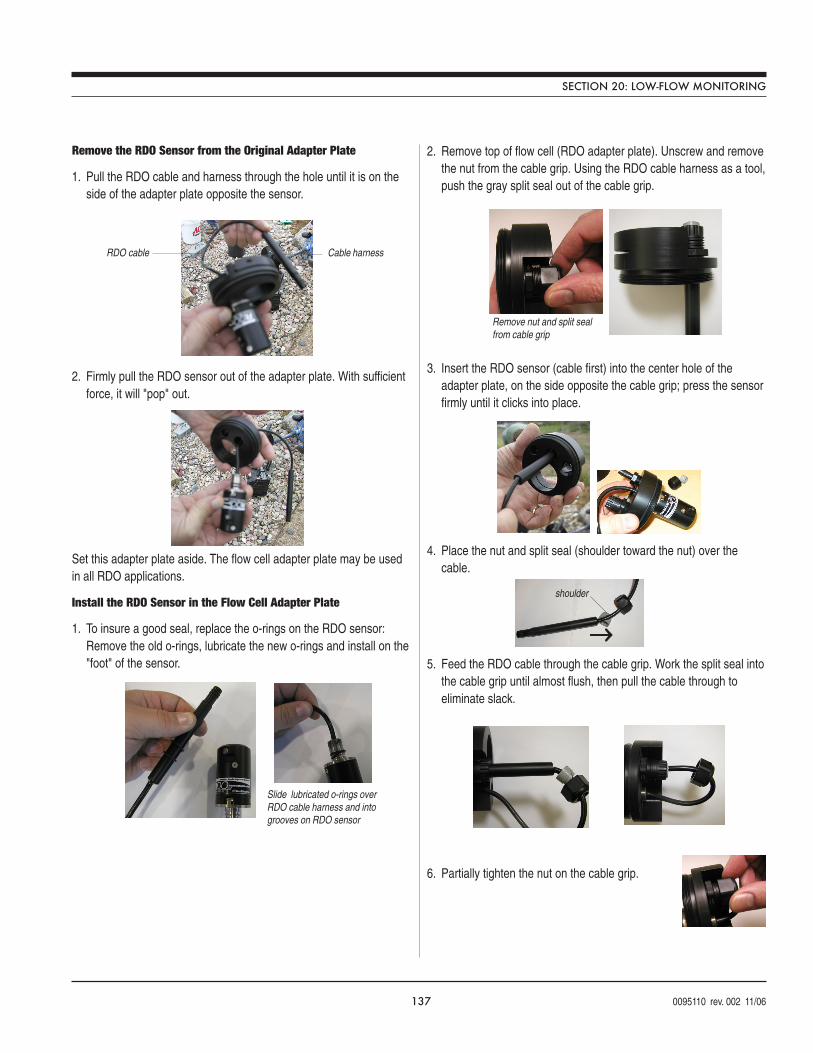
137 0095110 rev. 002 11/06
Remove the RDO Sensor from the Original Adapter Plate
1. Pull the RDO cable and harness through the hole until it is on theside of the adapter plate opposite the sensor.
2. Firmly pull the RDO sensor out of the adapter plate. With sufficientforce, it will "pop" out.
Set this adapter plate aside. The flow cell adapter plate may be usedin all RDO applications.
Install the RDO Sensor in the Flow Cell Adapter Plate
1. To insure a good seal, replace the o-rings on the RDO sensor:Remove the old o-rings, lubricate the new o-rings and install on the"foot" of the sensor.
2. Remove top of flow cell (RDO adapter plate). Unscrew and removethe nut from the cable grip. Using the RDO cable harness as a tool,push the gray split seal out of the cable grip.
3. Insert the RDO sensor (cable first) into the center hole of theadapter plate, on the side opposite the cable grip; press the sensorfirmly until it clicks into place.
4. Place the nut and split seal (shoulder toward the nut) over thecable.
5. Feed the RDO cable through the cable grip. Work the split seal intothe cable grip until almost flush, then pull the cable through toeliminate slack.
6. Partially tighten the nut on the cable grip.
SECTION 20: LOW-FLOW MONITORING
Slide lubricated o-rings overRDO cable harness and intogrooves on RDO sensor
Remove nut and split sealfrom cable grip
RDO cable Cable harness
→→→→→
shoulder
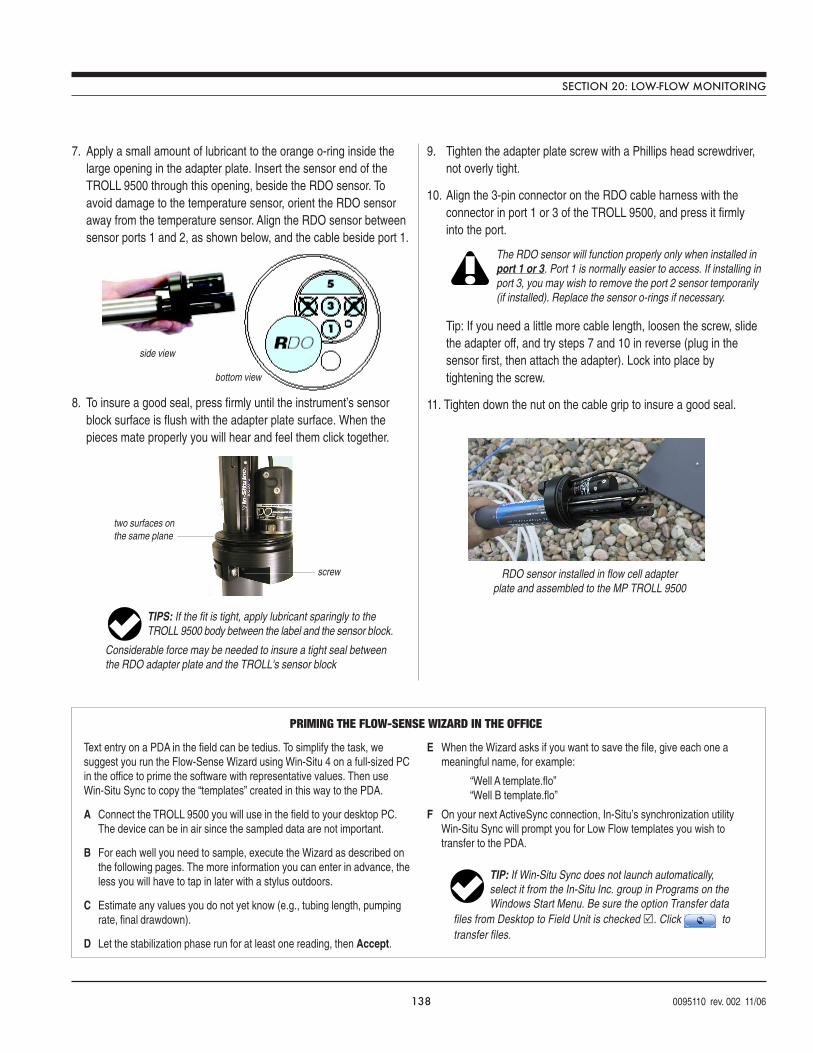
138 0095110 rev. 002 11/06
SECTION 20: LOW-FLOW MONITORING
7. Apply a small amount of lubricant to the orange o-ring inside thelarge opening in the adapter plate. Insert the sensor end of theTROLL 9500 through this opening, beside the RDO sensor. Toavoid damage to the temperature sensor, orient the RDO sensoraway from the temperature sensor. Align the RDO sensor betweensensor ports 1 and 2, as shown below, and the cable beside port 1.
8. To insure a good seal, press firmly until the instrument’s sensorblock surface is flush with the adapter plate surface. When thepieces mate properly you will hear and feel them click together.
side view
bottom view
screw
two surfaces onthe same plane
9. Tighten the adapter plate screw with a Phillips head screwdriver,not overly tight.
10. Align the 3-pin connector on the RDO cable harness with theconnector in port 1 or 3 of the TROLL 9500, and press it firmlyinto the port.
Tip: If you need a little more cable length, loosen the screw, slidethe adapter off, and try steps 7 and 10 in reverse (plug in thesensor first, then attach the adapter). Lock into place bytightening the screw.
11. Tighten down the nut on the cable grip to insure a good seal.
TIPS: If the fit is tight, apply lubricant sparingly to theTROLL 9500 body between the label and the sensor block.
Considerable force may be needed to insure a tight seal betweenthe RDO adapter plate and the TROLL's sensor block
The RDO sensor will function properly only when installed inport 1 or 3. Port 1 is normally easier to access. If installing inport 3, you may wish to remove the port 2 sensor temporarily(if installed). Replace the sensor o-rings if necessary.
RDO sensor installed in flow cell adapterplate and assembled to the MP TROLL 9500
Text entry on a PDA in the field can be tedius. To simplify the task, wesuggest you run the Flow-Sense Wizard using Win-Situ 4 on a full-sized PCin the office to prime the software with representative values. Then useWin-Situ Sync to copy the “templates” created in this way to the PDA.
A Connect the TROLL 9500 you will use in the field to your desktop PC.The device can be in air since the sampled data are not important.
B For each well you need to sample, execute the Wizard as described onthe following pages. The more information you can enter in advance, theless you will have to tap in later with a stylus outdoors.
C Estimate any values you do not yet know (e.g., tubing length, pumpingrate, final drawdown).
D Let the stabilization phase run for at least one reading, then Accept.
E When the Wizard asks if you want to save the file, give each one ameaningful name, for example:
“Well A template.flo”“Well B template.flo”
F On your next ActiveSync connection, In-Situ’s synchronization utilityWin-Situ Sync will prompt you for Low Flow templates you wish totransfer to the PDA.
PRIMING THE FLOW-SENSE WIZARD IN THE OFFICE
TIP: If Win-Situ Sync does not launch automatically,select it from the In-Situ Inc. group in Programs on theWindows Start Menu. Be sure the option Transfer data
files from Desktop to Field Unit is checked . Click totransfer files.
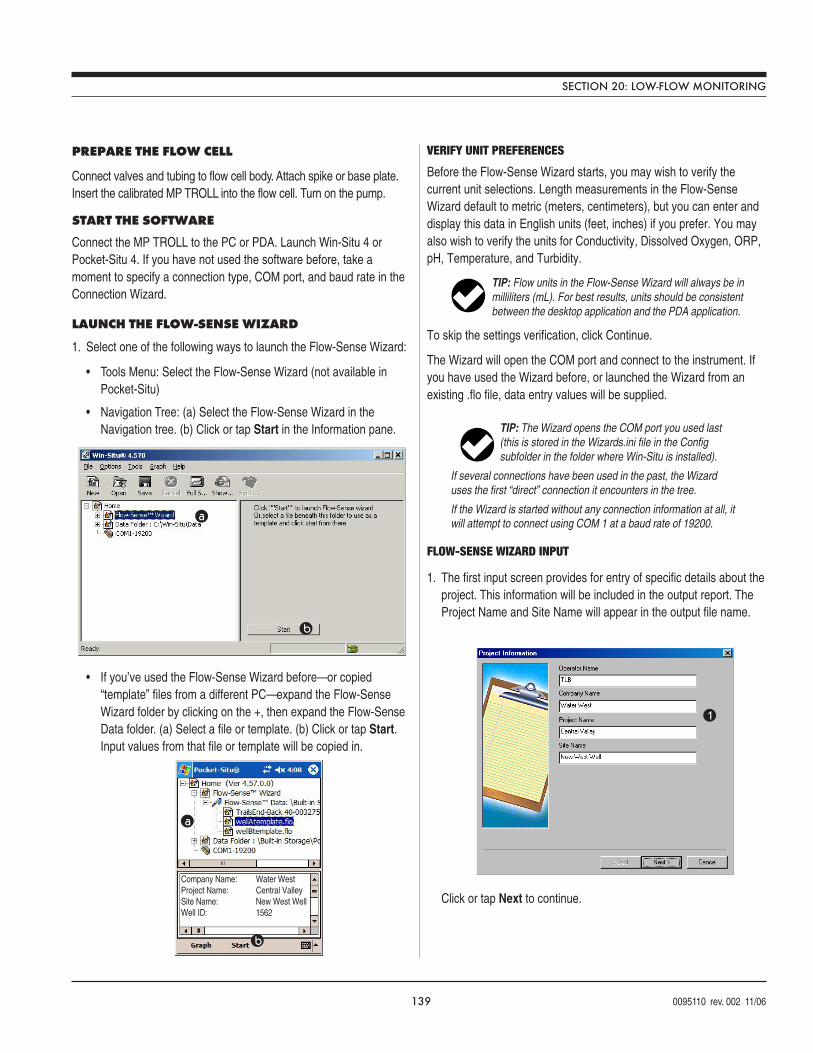
139 0095110 rev. 002 11/06
PREPARE THE FLOW CELL
Connect valves and tubing to flow cell body. Attach spike or base plate.Insert the calibrated MP TROLL into the flow cell. Turn on the pump.
START THE SOFTWARE
Connect the MP TROLL to the PC or PDA. Launch Win-Situ 4 orPocket-Situ 4. If you have not used the software before, take amoment to specify a connection type, COM port, and baud rate in theConnection Wizard.
LAUNCH THE FLOW-SENSE WIZARD
1. Select one of the following ways to launch the Flow-Sense Wizard:
• Tools Menu: Select the Flow-Sense Wizard (not available inPocket-Situ)
• Navigation Tree: (a) Select the Flow-Sense Wizard in theNavigation tree. (b) Click or tap Start in the Information pane.
• If you’ve used the Flow-Sense Wizard before—or copied“template” files from a different PC—expand the Flow-SenseWizard folder by clicking on the +, then expand the Flow-SenseData folder. (a) Select a file or template. (b) Click or tap Start.Input values from that file or template will be copied in.
a
b
SECTION 20: LOW-FLOW MONITORING
VERIFY UNIT PREFERENCES
Before the Flow-Sense Wizard starts, you may wish to verify thecurrent unit selections. Length measurements in the Flow-SenseWizard default to metric (meters, centimeters), but you can enter anddisplay this data in English units (feet, inches) if you prefer. You mayalso wish to verify the units for Conductivity, Dissolved Oxygen, ORP,pH, Temperature, and Turbidity.
To skip the settings verification, click Continue.
The Wizard will open the COM port and connect to the instrument. Ifyou have used the Wizard before, or launched the Wizard from anexisting .flo file, data entry values will be supplied.
FLOW-SENSE WIZARD INPUT
1. The first input screen provides for entry of specific details about theproject. This information will be included in the output report. TheProject Name and Site Name will appear in the output file name.
Click or tap Next to continue.
TIP: Flow units in the Flow-Sense Wizard will always be inmilliliters (mL). For best results, units should be consistentbetween the desktop application and the PDA application.
TIP: The Wizard opens the COM port you used last(this is stored in the Wizards.ini file in the Configsubfolder in the folder where Win-Situ is installed).
If several connections have been used in the past, the Wizarduses the first “direct” connection it encounters in the tree.
If the Wizard is started without any connection information at all, itwill attempt to connect using COM 1 at a baud rate of 19200.
1
a
b
Company Name: Water WestProject Name: Central ValleySite Name: New West WellWell ID: 1562
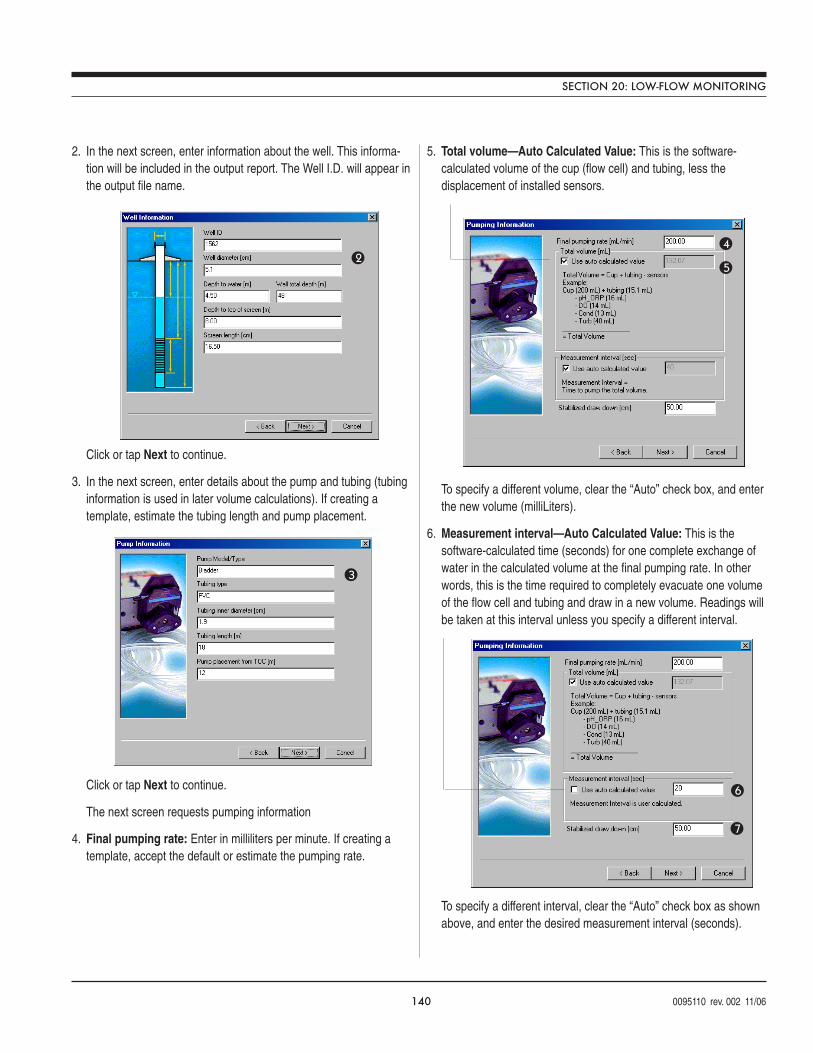
140 0095110 rev. 002 11/06
2. In the next screen, enter information about the well. This informa-tion will be included in the output report. The Well I.D. will appear inthe output file name.
Click or tap Next to continue.
3. In the next screen, enter details about the pump and tubing (tubinginformation is used in later volume calculations). If creating atemplate, estimate the tubing length and pump placement.
Click or tap Next to continue.
The next screen requests pumping information
4. Final pumping rate: Enter in milliliters per minute. If creating atemplate, accept the default or estimate the pumping rate.
5. Total volume—Auto Calculated Value: This is the software-calculated volume of the cup (flow cell) and tubing, less thedisplacement of installed sensors.
To specify a different volume, clear the “Auto” check box, and enterthe new volume (milliLiters).
6. Measurement interval—Auto Calculated Value: This is thesoftware-calculated time (seconds) for one complete exchange ofwater in the calculated volume at the final pumping rate. In otherwords, this is the time required to completely evacuate one volumeof the flow cell and tubing and draw in a new volume. Readings willbe taken at this interval unless you specify a different interval.
To specify a different interval, clear the “Auto” check box as shownabove, and enter the desired measurement interval (seconds).
2
SECTION 20: LOW-FLOW MONITORING
3
4
5
6
7
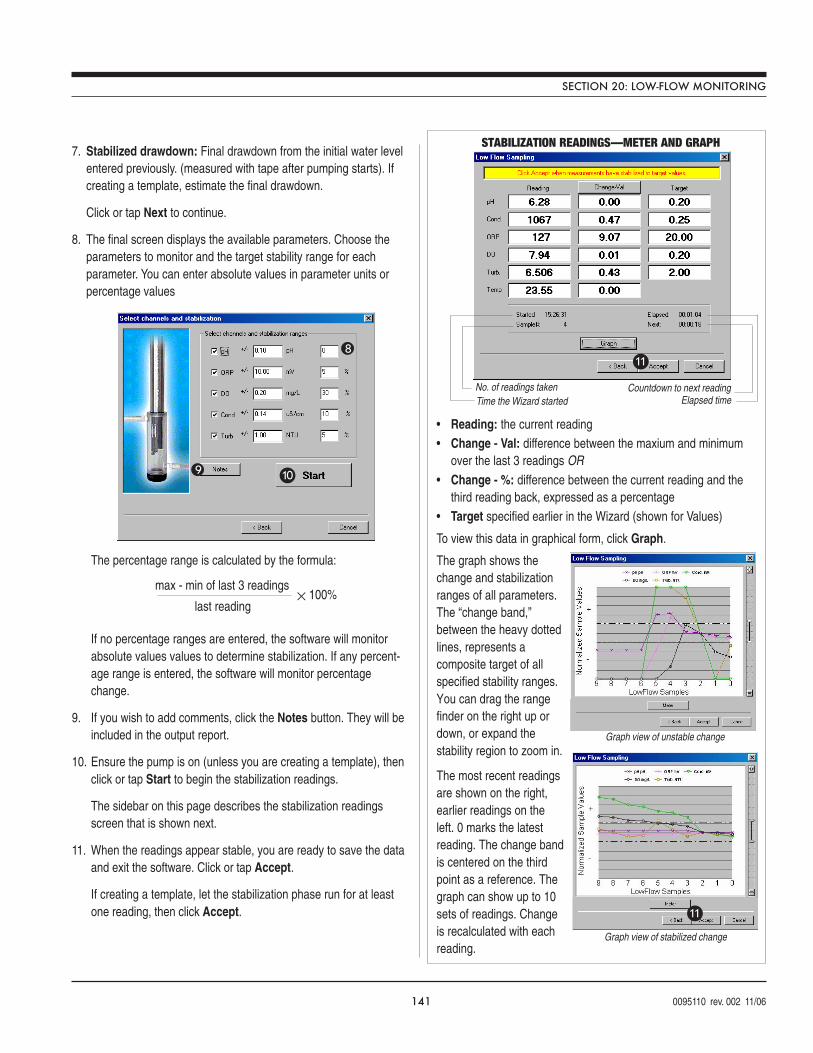
141 0095110 rev. 002 11/06
7. Stabilized drawdown: Final drawdown from the initial water levelentered previously. (measured with tape after pumping starts). Ifcreating a template, estimate the final drawdown.
Click or tap Next to continue.
8. The final screen displays the available parameters. Choose theparameters to monitor and the target stability range for eachparameter. You can enter absolute values in parameter units orpercentage values
The percentage range is calculated by the formula:
If no percentage ranges are entered, the software will monitorabsolute values values to determine stabilization. If any percent-age range is entered, the software will monitor percentagechange.
9. If you wish to add comments, click the Notes button. They will beincluded in the output report.
10. Ensure the pump is on (unless you are creating a template), thenclick or tap Start to begin the stabilization readings.
The sidebar on this page describes the stabilization readingsscreen that is shown next.
11. When the readings appear stable, you are ready to save the dataand exit the software. Click or tap Accept.
If creating a template, let the stabilization phase run for at leastone reading, then click Accept.
8
9 10
SECTION 20: LOW-FLOW MONITORING
max - min of last 3 readings
last reading× 100%
Graph view of unstable change
Graph view of stabilized change
11
Time the Wizard started Elapsed timeNo. of readings taken Countdown to next reading
11
STABILIZATION READINGS—METER AND GRAPH
• Reading: the current reading• Change - Val: difference between the maxium and minimum
over the last 3 readings OR
• Change - %: difference between the current reading and thethird reading back, expressed as a percentage
• Target specified earlier in the Wizard (shown for Values)
To view this data in graphical form, click Graph.
The graph shows thechange and stabilizationranges of all parameters.The “change band,”between the heavy dottedlines, represents acomposite target of allspecified stability ranges.You can drag the rangefinder on the right up ordown, or expand thestability region to zoom in.
The most recent readingsare shown on the right,earlier readings on theleft. 0 marks the latestreading. The change bandis centered on the thirdpoint as a reference. Thegraph can show up to 10sets of readings. Changeis recalculated with eachreading.
142 0095110 rev. 002 11/06
SAVING THE LOW-FLOW DATA OR TEMPLATE
Click Save when a suggested output file name is displayed. You maychange this name if you like. After it is saved, the file will be displayedin the Data Folder branch of the Navigation tree and will open in theInformation pane, like other test files extracted in Win-Situ or Pocket-Situ.
The file may be displayed in report format or as a graph in both Win-Situ and Pocket-Situ. (If you can’t see much on the PDA screen, tryscrolling to the right.) The top of the file presents well, site, and projectinformation. At the end of the file are the measurement data.
Additional functions are available through Win-Situ (desktop/laptop PC).
• Print (file menu)
• Graph (button in Information pane) However, note that bettergraphical report output is available if you export to Excel
• Save as text file (file menu)
• Export to Excel (file menu)
OUTPUT
Low-Flow files are saved as files of type .flo in a folder named Flow-Sense Data under the Flow-Sense Wizard folder, and are accessiblein the Navigation tree. By default they are named as shown below:
EXPORT TO EXCEL OPTION
To automatically create an output report in Microsoft® Excel® fromWin-Situ:
1. In the Win-Situ Navigation tree, select a low-flow data file. If itopens in Graph view, select the Report button.
2. On the Win-Situ File Menu, select Export to Excel.
3. The report will open in an Excel spreadsheet.
USING A CUSTOM EXCEL TEMPLATE
The Win-Situ 4 installation includes an Excel template for creating anoutput report (shown on the following page). This template is namedInSituLowFlow.xlt, and is automatically installed to the Templatesdirectory of the Microsoft operating system. Brief instructions for usingthis template are included in the spreadsheet that opens when youselect Export to Excel.
To format an output report using the custom template,
1. After exporting a low flow data file to Excel, insert a new sheetbased on a template by right-clicking the tab at the bottom of thescreen in Excel.
2. Click Insert, then select the template InSituLowFlow.xlt.
3. When prompted by Excel, select “Enable Macros.”
An example of low flow data formatted in Excel using this templateis shown on the following page.
4. If desired, save the report as an .XLS file.
SECTION 20: LOW-FLOW MONITORING
Flow-Sense Data \ Central Valley-New West Well-1562-6-10-2005.flo
Project name
Site name
Well ID
Date (m-dd-yyyy)
Low flow file designator
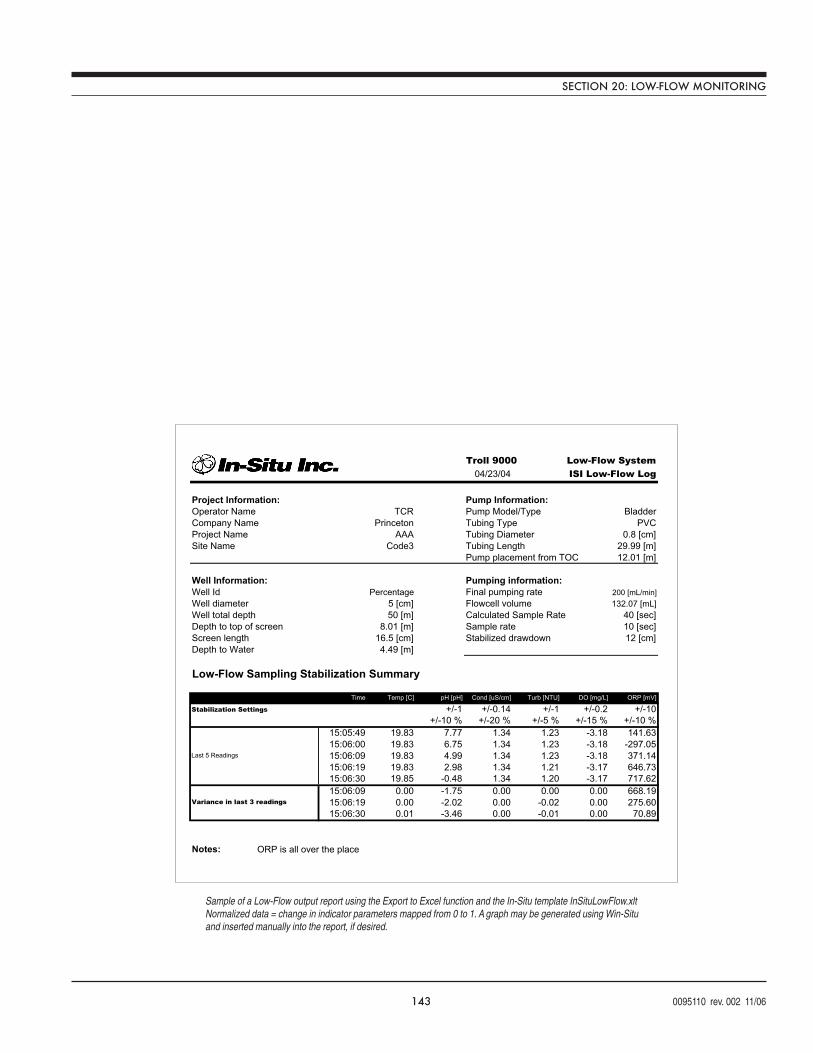
143 0095110 rev. 002 11/06
SECTION 20: LOW-FLOW MONITORING
!" #
! #
$
% %! !&!& ' %()%* +, ,"
-. -. -. -. -.
-./ -./ -./ -./ -./
00 . $
0$0 $ . .
0$0 .
0$0 . $$
0$0 . . $
0$0 . $$
0$0 . . $
0$0 .$ .
,!')
%"
'
!1'%2!
34
5!!
!!6'%,
'!2)
'7)
) %(8
999
'
%(+
%(%2!
,"#':8!
(;<'<
5'<:'3
3'!8
+!8''!'6#
8
+!8'3
#"#
Sample of a Low-Flow output report using the Export to Excel function and the In-Situ template InSituLowFlow.xltNormalized data = change in indicator parameters mapped from 0 to 1. A graph may be generated using Win-Situand inserted manually into the report, if desired.
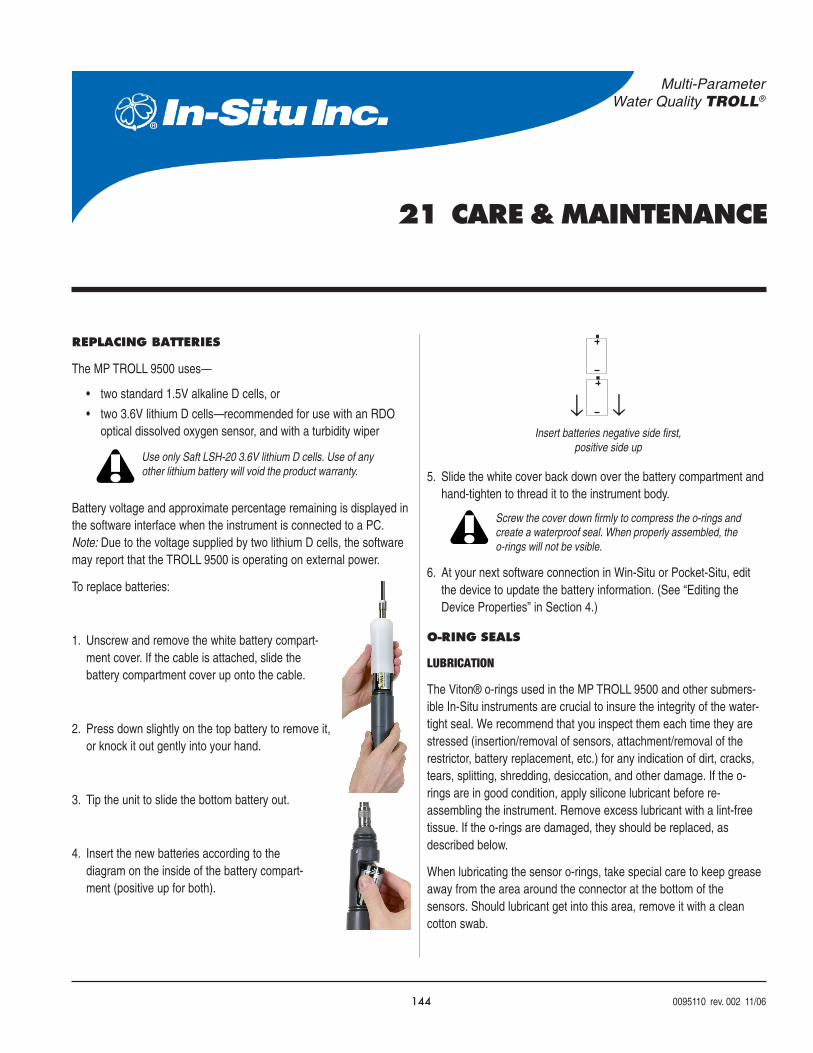
144 0095110 rev. 002 11/06
Multi-ParameterWater Quality TROLL®
21 CARE & MAINTENANCE
REPLACING BATTERIES
The MP TROLL 9500 uses—
• two standard 1.5V alkaline D cells, or
• two 3.6V lithium D cells—recommended for use with an RDOoptical dissolved oxygen sensor, and with a turbidity wiper
Battery voltage and approximate percentage remaining is displayed inthe software interface when the instrument is connected to a PC.Note: Due to the voltage supplied by two lithium D cells, the softwaremay report that the TROLL 9500 is operating on external power.
To replace batteries:
1. Unscrew and remove the white battery compart-ment cover. If the cable is attached, slide thebattery compartment cover up onto the cable.
2. Press down slightly on the top battery to remove it,or knock it out gently into your hand.
3. Tip the unit to slide the bottom battery out.
4. Insert the new batteries according to thediagram on the inside of the battery compart-ment (positive up for both).
5. Slide the white cover back down over the battery compartment andhand-tighten to thread it to the instrument body.
6. At your next software connection in Win-Situ or Pocket-Situ, editthe device to update the battery information. (See “Editing theDevice Properties” in Section 4.)
O-RING SEALS
LUBRICATION
The Viton® o-rings used in the MP TROLL 9500 and other submers-ible In-Situ instruments are crucial to insure the integrity of the water-tight seal. We recommend that you inspect them each time they arestressed (insertion/removal of sensors, attachment/removal of therestrictor, battery replacement, etc.) for any indication of dirt, cracks,tears, splitting, shredding, desiccation, and other damage. If the o-rings are in good condition, apply silicone lubricant before re-assembling the instrument. Remove excess lubricant with a lint-freetissue. If the o-rings are damaged, they should be replaced, asdescribed below.
When lubricating the sensor o-rings, take special care to keep greaseaway from the area around the connector at the bottom of thesensors. Should lubricant get into this area, remove it with a cleancotton swab.
Use only Saft LSH-20 3.6V lithium D cells. Use of anyother lithium battery will void the product warranty.
Screw the cover down firmly to compress the o-rings andcreate a waterproof seal. When properly assembled, theo-rings will not be vsible.
Insert batteries negative side first,positive side up
↓ ↓
145 0095110 rev. 002 11/06
REPLACEMENT
If the o-rings become damaged to the extent that no longer provide aneffective seal, they should be replaced. If there is any doubt whetherthe o-rings should be replaced, it is best to err on the side of safetyand replace them.
Before replacing o-rings, clean all mating surfaces, including the o-ring grooves.
O-rings and lubricant are included in the MP TROLL 9000 Mainte-nance kit available from In-Situ Inc. or your distributor.
GENERAL CLEANING
Rinse the instrument body well, especially if it has been in contact withcontaminated media. Air-dry or wipe with a lint-free tissue.
Ultrasonic cleaning is not recommended.
STORAGE
Store the TROLL 9500 clean and dry. Place the protective reddustcap on the cable end, or store with cable attached to protect theconnector pins and o-ring.
Store the instrument where it will be safe from mechanical shocks thatmay occur, such as rolling off a bench onto a hard surface.
Protect the instrument from temperature extremes. Store within atemperature range of -40°C to +80°C (-40°F to +176°F).
If the sensors are removed for storage, place plugs in the dry sensorports as protection from dust and dirt.
SENSOR STORAGE
For long-term storage, return the water-quality sensors to their originalpackaging. Protect the lubricated o-rings from dust and dirt.
For up to a week, the sensors may be left in the instrument, with amoist sponge in the bottom of the Cal Cup to provide a moistenvironment for those sensors that require it.
TWIST-LOCK CONNECTORS
Keep the pins on all connectors free of dirt and moisture by using thesoft protective dustcap when cable is not attached.
SECTION 21: CARE & MAINTENANCE
146 0095110 rev. 002 11/06
Multi-ParameterWater Quality TROLL®
22 TROUBLESHOOTING
Q:
A:
The MP TROLL 9500 rolled out of the back of my truckand hit the ground pretty hard. It still talks. Is it OK touse?
The instrument is pretty rugged, and can survive a few dropsand rolls. We hope the restrictor was on to protect thesensors! First, check the joint between the body and therestrictor. It should appear smooth and tight to preserve theintegrity of the water seal. Next, remove the restrictor andinsure the pressure sensor is snug against the sensor block.Push it firmly into the sensor block if you see a gap. If thetemperature sensor is bent, straighten it gently but firmly byhand (no tools, please).
If the instrument is dropped repeatedly on the nose cone,check for damage to the batteries.
TROUBLESHOORING CONNECTIONS
Problem: Win-Situ or Pocket-Situ cannot “find” (connect to) the MPTROLL 9500. Error 6146 may be displayed.
Probable Cause: Wrong COM port selected, loose cable connec-tions, device is taking a measurement as part of a test, batteriesare low, elastomer is worn
Suggested Remedy: Check the following:
• all cable connections are tight• the back end is securely attached to the instrument• the correct COM port is selected• the internal battery has voltage remaining; attach external
power• If a test is running, try connecting again—several times if
necessary to “sneak” in between test data points.
Problem: Readings are in the wrong units
Probable Cause: Default units are being used
Suggested Remedy: Select the desired units on the Win-SituOptions menu, or select the Home site in Pocket-Situ and tapSetup in the command bar
Problem: Pocket-Situ hangs
Suggested Remedy: Reset the PDA; see your PDA documentationfor details on hard and soft reset
TROUBLESHOOTING DATA COLLECTION (TESTS)
Problem: Test ABENDed (came to an “ABnormal END”)
Probable Cause: Device lost power or ran out of memory
Suggested Remedy: None; indication of ABEND in software cannotbe reversed. but data collected up until the time the test ABENDedis likely to be fine
Check clock, check memory free, check device power
Problem: Scheduled test did not start
Probable Cause: Incorrect device clock, full memory, power removedat time of first scheduled data point
Suggested Remedy: Synchronize device clock and reschedule test;insure device has sufficient battery power and free memory; insuredevice is powered at time of first scheduled data point
147 0095110 rev. 002 11/06
TROUBLESHOOTING SENSORS
Problem: Sensor will not go into port
Probable Cause: (1) Insufficient lubrication on sensor o-rings. (2)Incorrect sensor alignment.
Suggested Remedy: (1) Generously lubricate sensor o-rings with agood silicone lubricant. Remove excess lubricant with a tissue, andtake care to keep grease away from the area around the connectorat the bottom of the sensor. (2) Align the mark on the side of thesensor (it looks like a small white “V”) with the tic mark on thesensor port. If you have trouble locating these marks, visualize thesensor block as a clock face, with the pressure/turbidity sensor orplug at 12:00. The port alignment marks are at the 3:00 position foreach port.
Problem: Sensor will not come out of port
Probable Cause: Inability to grasp sensor
Suggested Remedy: Try the sensor removal tool. Insert it betweenthe widest part of the sensor and the instrument body and pressdown on the handle, prying the sensor up until it pops out.
Problem: Software does not recognize sensor in port
Probable Cause: (1) Sensor is not firmly seated in port. (2) Excesslubricant or dirt in port. (3) Sensor is in a wrong port for its type.
Suggested Remedy: (1) Re-insert the sensor: Align the mark on theside of the sensor (it looks like a small white “V”) with the tic markon the sensor port. Use sensor insertion tool to press sensor firmlyinto port until you feel it dock with the connector. When properlyinserted a only a very small gap (0.060-0.075 inch, the width of thesensor removal tool) remains between the widest part of thesensor and the instrument body. (2) Remove excess lubricant and/or dirt from the connector on the sensor and from the connector inthe port.(3) Insure the sensor is in the correct port for its type. Somesensors will function properly in any port, others will work only inspecific ports. Refer to diagrams in section 3 or specific sensorsection of this manual. Remove sensor and re-install in correctport, if necessary, then refresh device information in the software.
TROUBLESHOOTING CALIBRATION
Problem: The Cal Cup leaks when rinsing sensors
Probable Cause: Cal Cup is not tightened to probe body sufficientlyto seat against the o-ring
Suggested Remedy: Carefully align threads on Cal Cup with threadson instrument body. Thread the Cal Cup onto the body until it isseated against the o-ring, then back off slightly to avoid overtight-ening.
Problem: The DO readings stabilized during the Quick Cal but nowthe readings are off (too high or too low)
Probable Cause: (1) Too much solution in Cal Cup during the QuickCal to expose the DO sensor to air. (2) Cal Cup is too tightly sealedduring calibration.
Suggested Remedy: (1) The DO membrane must be exposed to airfor a valid 100% DO calibration. If the membrane is submergedwhen you invert the Cal Cup during the Quick Cal, remove the endcap and pour out some of the calibration solution until the mem-brane is in air. (2) Loosen the end cap of the inverted Cal Cupduring DO calibration to avoid pressurizing the chamber.
SECTION 22: TROUBLESHOOTING
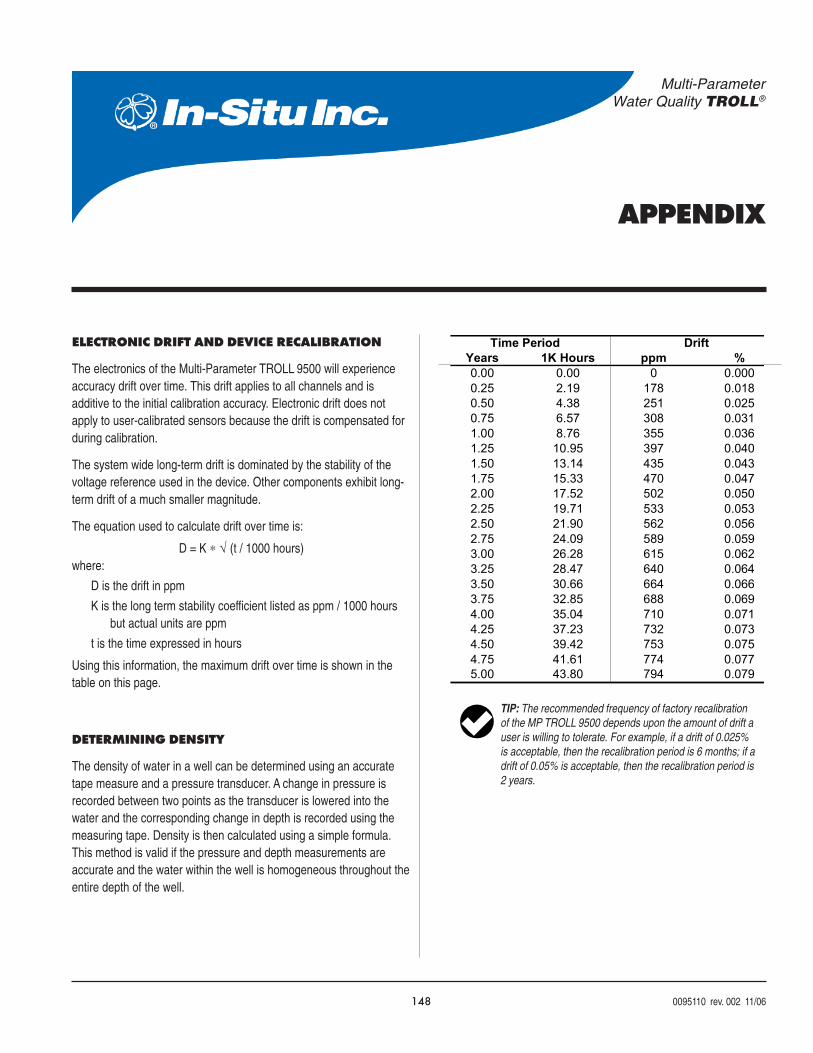
148 0095110 rev. 002 11/06
Multi-ParameterWater Quality TROLL®
APPENDIX
ELECTRONIC DRIFT AND DEVICE RECALIBRATION
The electronics of the Multi-Parameter TROLL 9500 will experienceaccuracy drift over time. This drift applies to all channels and isadditive to the initial calibration accuracy. Electronic drift does notapply to user-calibrated sensors because the drift is compensated forduring calibration.
The system wide long-term drift is dominated by the stability of thevoltage reference used in the device. Other components exhibit long-term drift of a much smaller magnitude.
The equation used to calculate drift over time is:
D = K ∗ √ (t / 1000 hours)where:
D is the drift in ppm
K is the long term stability coefficient listed as ppm / 1000 hoursbut actual units are ppm
t is the time expressed in hours
Using this information, the maximum drift over time is shown in thetable on this page.
DETERMINING DENSITY
The density of water in a well can be determined using an accuratetape measure and a pressure transducer. A change in pressure isrecorded between two points as the transducer is lowered into thewater and the corresponding change in depth is recorded using themeasuring tape. Density is then calculated using a simple formula.This method is valid if the pressure and depth measurements areaccurate and the water within the well is homogeneous throughout theentire depth of the well.
Years 1K Hours ppm %0.00 0.00 0 0.0000.25 2.19 178 0.0180.50 4.38 251 0.0250.75 6.57 308 0.0311.00 8.76 355 0.0361.25 10.95 397 0.0401.50 13.14 435 0.0431.75 15.33 470 0.0472.00 17.52 502 0.0502.25 19.71 533 0.0532.50 21.90 562 0.0562.75 24.09 589 0.0593.00 26.28 615 0.0623.25 28.47 640 0.0643.50 30.66 664 0.0663.75 32.85 688 0.0694.00 35.04 710 0.0714.25 37.23 732 0.0734.50 39.42 753 0.0754.75 41.61 774 0.0775.00 43.80 794 0.079
DriftTime Period
TIP: The recommended frequency of factory recalibrationof the MP TROLL 9500 depends upon the amount of drift auser is willing to tolerate. For example, if a drift of 0.025%is acceptable, then the recalibration period is 6 months; if adrift of 0.05% is acceptable, then the recalibration period is2 years.
149 0095110 rev. 002 11/06
An error of 0.001 m (1 mm) in the depth measurementtranslates into an error of 0.00085 g/cm3 for density.
g x (L2 - L1)
(P2 – P1) x 6.894757ρ =
Note: Density can also be measured using a hydrometer if it ispossible to withdraw a water sample from the well. We recommend anaccuracy of ±0.0005.
Procedure
There are two possible methods for measuring the change in waterdepth. Choose the method that is the most convenient and accurate.
• Attach the tape measure to the transducer cable using an adhesive(e.g., duct tape). The tape measure can be attached to thetransducer itself or to a segment of the cable that will be adjacentto the top of the well casing. Read the cable positions directly fromthe measuring tape. The measuring device must have a resolutionof at least 1 mm or 1/16 in.
• Alternatively, mark the positions of the cable with an indelible felt tippen. The distance between marks is then determined with a tapemeasure after the corresponding cable segment is removed fromthe well.
1. Lower the transducer into the well until it is submerged under aboutone meter of water.
2. Secure the transducer at a fixed depth using the cable at the top ofthe well casing. Wait an hour or so for the system to equilibrate.
3. Take an electronic pressure reading, manually, from the transducerand record this measurement in PSI. This is measurement P
1.
4. Read the tape measure relative to some fixed reference point (e.g.,top of well casing) or mark the position on the cable with anindelible pen. This is measurement L
1.
5. Lower the transducer at least three meters deeper into the waterand repeat steps 3 and 4. These are measurements P
2 and L
2.
6. Density (ρ) in g/cm3 is calculated using the following:
where g is the gravitational acceleration for the location of the wellin m/s2. P must be in PSI units and L must be in meters. If using atape measure calibrated in feet, 1 ft = 0.3048 m (exactly).
APPENDIX
150 0095110 rev. 002 11/06
Multi-ParameterWater Quality TROLL®
GLOSSARY
ABend: Indication in the software interface that a test has come to an“ABnormal END”—usually because the device memory is full, orpower was lost.
ABS: Acrylonitrile Butadiene Styrene, a plastic material.
Absolute pressure sensor: Non-vented pressure sensor that measuresall pressure forces detected by the strain gauge, includingatmospheric pressure. Fluid levels measured with an absolutepressure sensor must be corrected through subtraction of theatmospheric pressure to obtain accurate fluid level measurements.Compare Gauged pressure sensor.
AC: Absolute or Actual Conductivity.
Accuracy: Closeness of agreement between the result of a measure-ment and the true value. Usually expressed as a deviation from100% accuracy.
A/D (analog to digital) converter: Converts an electrical signal to anumeric value that can be interpreted by a computer.
Ambient pressure (temperature): The pressure (temperature) of themedium surrounding the sensor or instrument.
Ammonia (NH3): A toxic, colorless gas with a pungent odor, highly
water-soluble.
Ammonium (NH4+): Solvated ammonium cation produced when
ammonia gas is dissolved in water.
Ammonium chloride (NH4Cl): A salt used to make ammonium and
chloride calibration standards.
Anion: Negatively charged ion (e.g., Cl–, NO3–).
Atmospheric pressure: Pressure due to the atmosphere, altitude-dependent.
Barometric pressure, see Atmospheric pressure
Bithermal: At two temperatures, e.g., a three-point calibration of anammonium, chloride, or nitrate sensor conducted at two differenttemperatures.
Basic sensor set: pH, conductivity, polarographic (Clark cell) dissolvedoxygen, and ORP; pH and ORP may be single-parameter sensorsor a combined sensor; compare Extended sensor set.
Boxcar filtering: A smoothing scheme that looks at the 5 most recentdata points.
Cable, see Comunication cable, Network cable, RuggedCable, TROLLCom, Vented cable
Calibration: The process of determining the response of a measure-ment system to a known amount of the measured component inorder to permit the measurement of unknown samples.
Calibration, out-of-box: Use of new Basic sensors for the MP TROLL9500 directly from the box, with factory-supplied calibrationcoefficients. Sensors should be calibrated after they are used andbegin to drift.
Calibration, Quick Cal: A rapid calibration procedure available for theBasic sensors, using a single solution.
Calibration, traditional: Single- or multi-point methods for calibratingwater-quality sensors individually to gain higher accuracy.
Calibration coefficients: Sensor slope and offset that convert analogmeasurements to user units; calculated during calibration.
Calibration cup: Clear PVC vessel that attaches to the front end of theMP TROLL 9500 in place of the restrictor and holds the recom-mended amount of calibration solution during calibration of thewater-quality sensors.
Calibration kit: Boxed set of standards for calibrating a specific water-quality sensor for operation in a specific range.
151 0095110 rev. 002 11/06
Calibration solution, Calibration standard: A solution whose concentra-tion is accurately known.
Cation: Positively charged ion (e.g., NH4+, Na+).
Cell constant: A value that describes a conductivity cell which isdetermined by electrode area and electrode separation.
Chloride (Cl–): Common anion in water that gives it a salty taste.
Chlorophyll: Green pigment in plants that transforms light energy intochemical energy during photosynthesis.
Clone: Copy all elements of a selected test definition to a new test.
Combination electrode: A combination of a sensing or measurementelectrode and a reference electrode in one unit.
COM port: RS232 serial communication port on a PC.
Communication cable: see TROLL Com
Conductivity, electrical: A measure of the ability of an aqueous solutionto carry an electric current. Increases with increasing temperature.
Connection node: Node in the Win-Situ or Pocket-Situ Navigationtree, representing the COM port on the host PC.
Data folder: Node in the Win-Situ or Pocket-Situ Navigation tree,providing a view of tests that have been extracted from the devicememory to the host PC. The Data Folder can be expanded to showthe device type, device serial number, and test name.
Data point: In logged data, one reading from every channel beingsampled.
Density: Mass of a substance per unit volume (e.g., grams per liter,g/L; grams per cubic centimeter, g/cm3). Water is most dense at 4°Celsius.
Depth: The distance between the water surface and the pressuresensor of the MP TROLL 9500. Converted from pressure unitsusing values selected by the user during pressure parametersetup.
Derived measurement: Value calculated in software from the output ofmore than one sensor; e.g., salinity is derived from conductivityand temperature.
Device node: Node in the Win-Situ or Pocket-Situ Navigation tree,representing the connected MP TROLL 9500.
Digital DO: Proprietary method of powering the dissolved oxygensensor; digital pulsing eliminates the need to stir the sample toavoid oxygen depletion.
Dissolved oxygen (DO): The amount of oxygen present in water andavailable for respiration.
DO: Dissolved Oxygen.
Downhole cable, see RuggedCable
Drift: Gradual change in sensor response with time.
DSP: Digital signal processor.
Electrode: An electric conductor through which an electric currententers or leaves a medium (such as an electrolyte).
Electrolyte: A chemical compound which when dissolved in water willconduct an electric current; sensor filling solution.
Event test, Event sampling: Test measurement schedule in which theselected parameters are measured at the same regular, unvaryinglinear interval, but the data are logged only if the measurements onthe designated event channel exceed a user-specified value.Conserves storage memory while logging all meaningful data.
Extended sensor set: Ammonium, chloride, nitrate, turbidity, andoptical dissolved oxygen sensors; compare Basic sensor set.
Extract: Copy test data from the MP TROLL 9500 memory to a hostPC. Initiated by the Extract button when a test is selected in theNavigation tree.
FEP: Fluorinated ethylene propylene; the generic equivalent ofDuPont Teflon®.
Firmware: Software program that resides in the memory of the MPTROLL 9500; firmware can be field-upgraded.
Flow cell: Clear
vessel with input and output ports for routing flow past the sensors ofthe MP TROLL 9500; alternative to in-situ installation of theinstrument where in-place installation is not possible or practical.
Flow-Sense Wizard: Low-flow application in Win-Situ software formonitoring water-quality indicator parameters in a flow cell duringlow-flow pumping.
FNU: Formazin Turbidity Units; compare NTU
FS: Full scale.
GLOSSARY
152 0095110 rev. 002 11/06
Gauged pressure sensor: Pressure sensor that is vented to theatmosphere; measures only pressure exerted by the water column,excludes the atmospheric pressure component. Compare Absolutepressure sensor; see also Vented cable.
HDPE: High-density polyethylene.
HIF: U.S. Geological Survey’s Hydrological Instrumentation Facility.
Home site: Default site node (top node) in the Win-Situ or Pocket-SituNavigation tree, representing the host computer.
Host PC: Desktop computer running Win-Situ, or PDA runningPocket-Situ, connected to the MP TROLL 9500 via TROLL Com orother communication interface.
Interference: The presence of a species in a sample other than thespecies being measured that causes erroneous values.
Ionic strength: A measure of the total effect of all the ions, bothpositive and negative, present in a solution.
ISA (Ionic Strength Adjustor): Solution of high ionic strength which canbe added to both sample and calibration solutions in equalproportions before measurement to minimize differences in ionicstrength.
ISE (Ion-Selective Electrode): An electrode which responds selectivelyto the ions of a particular species in solution.
Isopotential point: The ion concentration at which changes in tempera-ture do not cause a change in ISE sensor response (voltage).
Isothermal: At constant temperature.
Kcell, see Cell constant
KCl: Potassium chloride.
LED: Light-emitting diode, used in turbidity and Optical DO sensors.
Level reference: User-specified starting point for level readings;entered during pressure parameter setup.
Level—Surface: A mode for displaying logged pressure measure-ments; readings are positive up; useful for measuring surfacewater; permits use of zero or other user reference.
Level—Top of Casing: A mode for displaying logged pressuremeasurements; readings are positive down, as the water leveldraws down from the top of the well casing; permits entry of zero orother user reference.
Limnology: The science of the life and conditions for life in lakes,ponds, and streams.
Linear average: Test measurement schedule in which each measure-ment stored to the data file is the average of multiple closely-spaced measurements.
Linear test, Linear sampling: Test measurement schedule in which theselected parameters are measured at the same regular, unvaryingsample interval and all measurements are logged.
Log test, Log sampling: Test measurement schedule in whichmeasurements begin closely spaced and the interval betweenmeasurements continuously increases. Short for Logarithmicsampling.
LSZH: Low smoke zero halide
µM, µmol/L: micro Molar, unit of dissolved oxygen concentration; toconvert to mg/L, divide by 31.25.
mg/L: Milligram per liter; equivalent to one part per million (ppm).
miniTROLL: In-Situ’s 0.72” diameter downhole pressure/temperaturesmart probe.
Molarity (M): A unit of measure indicating concentration in moles ofsolute per liter of solution.
Multi-ISE: An ion-selective electrode that measures more than oneparameter.
NaNO3: Sodium nitrate.
Na2SO
3: Sodium sulfite.
Navigation tree: Left side of the Win-Situ application interface, or topof the screen in Pocket-Situ, showing selectable nodes: Site, DataFolder, Connection, Device, Parameters, Tests.
Nernst equation: The fundamental equation that relates the electrodepotential to the activity of measured ions in a solution.
Network: Instrument network consists of Multi-Parameter TROLL 9500(up to 32) with submersible cable connected to a network box,connected to additional network boxes via network cable, 12 Vpower supplied by externally applied AC line power.
Network box (T-box, Quad box, Mid-line tap box): Vented environmen-tal enclosure with a regulated power supply and lightning suppres-sion; ties multiple MP TROLLs into an instrument network.
Network cable: Insulated non-vented PVC cable for connectingnetworks of MP TROLL 9500s or other instruments.
GLOSSARY
153 0095110 rev. 002 11/06
NH4Cl: Ammonium chloride.
N.I.S.T.: National Institute of Standards and Technology, a non-regulatory federal agency within the U.S. Department of Com-merce. Formerly known as the National Bureau of Standards.
Nitrate (NO3–): Oxidized form of nitrogen that is highly soluble in
water, present in soils, fertilizer, wastewater, etc.
Node: Element in the Navigation tree on the left side of the Win-Situinterface, or at the top of the screen in Pocket-Situ. When a node isselected, the remainder of the screen displays details about thenode. Nodes include the Site, Data Folder, Connection, Device,Parameters (group node), single Parameter, Tests (group node),single Test.
Non-vented pressure sensor, see Absolute pressure sensor
Nose cone: Detachable threaded protective stainless steel piece atthe front end of the MP TROLL 9500.
Nose cone stirrer, see Stirrer
NTU: Nephelometric turbidity unit, a measure of the intensity of lightscattered by a water sample. From nephelometer, a type ofturbidimeter. Comparable to previously reported Formazin TurbidityUnit (FTU), and Jackson Turbidity Unit (JTU).
Optode: optical electrode.
ORP, see Oxidation-reduction potential
Oxidation-reduction potential (ORP), also called “redox” potential(from “reducing” and “oxidizing”): Voltage difference at an inertelectrode immersed in a reversible oxidation-reduction system;measurement of the state of oxidation of the system.
Parameter node: Node in the Win-Situ or Pocket-Situ Navigation tree,representing a single parameter (pressure, temperature, pH,conductivity, etc.).
Parameters node: Node in the Win-Situ or Pocket-Situ Navigationtree, providing a view of all parameters the device can measure.
Partial pressure: In a mixture of gases, the pressure a single gaswould exerted if it occupied the entire volume.
Pascal: Unit of pressure equal to the pressure resulting from a force of1 newton acting uniformly over an area of 1 square meter.
PC: Desktop or laptop computer.
PDA (Personal Data Assistant): Generic term for a hand-held personalcomputer.
pH: Term used to describe the hydrogen-ion activity of a system; thenegative logarithm of the activity of the hydrogen ions (H+) in thesolution.
Pocket PC: A type of PDA with an ARM processor and Pocket PC(Windows Mobile) operating system.
Pocket-Situ: Win-Situ software for supported PDAs.
PocketSync for Pocket-Situ: Synchronization utility that runs on adesktop/laptop PC; automatically installs or updates Pocket-Situ ona connected PDA; synchronizes data and other files between thePDA and the PC where Win-Situ is installed
Polarization: Application of a direct or alternating current to a sensor.
Potassium chloride (KCl): A salt used to make conductivity calibrationstandards.
ppm: Part-per-million; equivalent to a milligram per liter (mg/L).
Precision: The closeness of agreement between independent testresults obtained under stipulated conditions. A measure of thereproducibility of a method.
Pressure: A type of stress which is exerted uniformly in all directions.Its measure is the force exerted per unit area; e.g., pounds persquare inch (psi), newtons per square meter (pascals).
Pressure transducer: Instrument or component that detects a fluidpressure and produces an electrical signal related to the pressure.
Professional: MP TROLL 9500 model containing memory; able to logdata; accommodates the Basic sensor set.
Professional XP: MP TROLL 9500 model with all features of theProfessional model and in addition allows use of the Extendedsensor set.
Profiler: MP TROLL 9500 model without memory; must be used with aPC or PDA; accommodates the Basic sensor set.
Profiler XP: MP TROLL 9500 model with features of the Profiler and inaddition allows use of the Extended sensor set.
Profiling: Taking continuous real-time readings of all enabled param-eters.
PRT: Platinum resistance thermometer, a type of resistance tempera-ture detector (RTD).
psia: A pressure unit, pounds per square inch absolute, measured withrespect to zero pressure. All forces detected by the strain gaugeare measured, including atmospheric pressure.
GLOSSARY
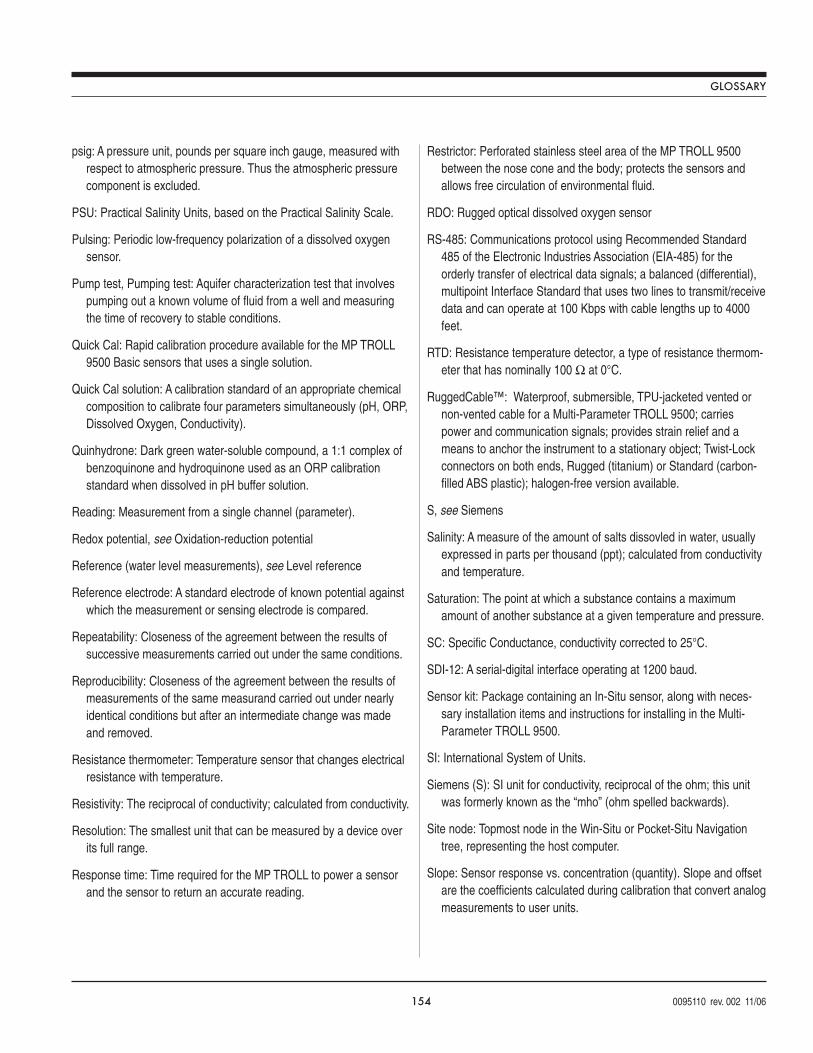
154 0095110 rev. 002 11/06
psig: A pressure unit, pounds per square inch gauge, measured withrespect to atmospheric pressure. Thus the atmospheric pressurecomponent is excluded.
PSU: Practical Salinity Units, based on the Practical Salinity Scale.
Pulsing: Periodic low-frequency polarization of a dissolved oxygensensor.
Pump test, Pumping test: Aquifer characterization test that involvespumping out a known volume of fluid from a well and measuringthe time of recovery to stable conditions.
Quick Cal: Rapid calibration procedure available for the MP TROLL9500 Basic sensors that uses a single solution.
Quick Cal solution: A calibration standard of an appropriate chemicalcomposition to calibrate four parameters simultaneously (pH, ORP,Dissolved Oxygen, Conductivity).
Quinhydrone: Dark green water-soluble compound, a 1:1 complex ofbenzoquinone and hydroquinone used as an ORP calibrationstandard when dissolved in pH buffer solution.
Reading: Measurement from a single channel (parameter).
Redox potential, see Oxidation-reduction potential
Reference (water level measurements), see Level reference
Reference electrode: A standard electrode of known potential againstwhich the measurement or sensing electrode is compared.
Repeatability: Closeness of the agreement between the results ofsuccessive measurements carried out under the same conditions.
Reproducibility: Closeness of the agreement between the results ofmeasurements of the same measurand carried out under nearlyidentical conditions but after an intermediate change was madeand removed.
Resistance thermometer: Temperature sensor that changes electricalresistance with temperature.
Resistivity: The reciprocal of conductivity; calculated from conductivity.
Resolution: The smallest unit that can be measured by a device overits full range.
Response time: Time required for the MP TROLL to power a sensorand the sensor to return an accurate reading.
Restrictor: Perforated stainless steel area of the MP TROLL 9500between the nose cone and the body; protects the sensors andallows free circulation of environmental fluid.
RDO: Rugged optical dissolved oxygen sensor
RS-485: Communications protocol using Recommended Standard485 of the Electronic Industries Association (EIA-485) for theorderly transfer of electrical data signals; a balanced (differential),multipoint Interface Standard that uses two lines to transmit/receivedata and can operate at 100 Kbps with cable lengths up to 4000feet.
RTD: Resistance temperature detector, a type of resistance thermom-eter that has nominally 100 Ω at 0°C.
RuggedCable™: Waterproof, submersible, TPU-jacketed vented ornon-vented cable for a Multi-Parameter TROLL 9500; carriespower and communication signals; provides strain relief and ameans to anchor the instrument to a stationary object; Twist-Lockconnectors on both ends, Rugged (titanium) or Standard (carbon-filled ABS plastic); halogen-free version available.
S, see Siemens
Salinity: A measure of the amount of salts dissovled in water, usuallyexpressed in parts per thousand (ppt); calculated from conductivityand temperature.
Saturation: The point at which a substance contains a maximumamount of another substance at a given temperature and pressure.
SC: Specific Conductance, conductivity corrected to 25°C.
SDI-12: A serial-digital interface operating at 1200 baud.
Sensor kit: Package containing an In-Situ sensor, along with neces-sary installation items and instructions for installing in the Multi-Parameter TROLL 9500.
SI: International System of Units.
Siemens (S): SI unit for conductivity, reciprocal of the ohm; this unitwas formerly known as the “mho” (ohm spelled backwards).
Site node: Topmost node in the Win-Situ or Pocket-Situ Navigationtree, representing the host computer.
Slope: Sensor response vs. concentration (quantity). Slope and offsetare the coefficients calculated during calibration that convert analogmeasurements to user units.
GLOSSARY
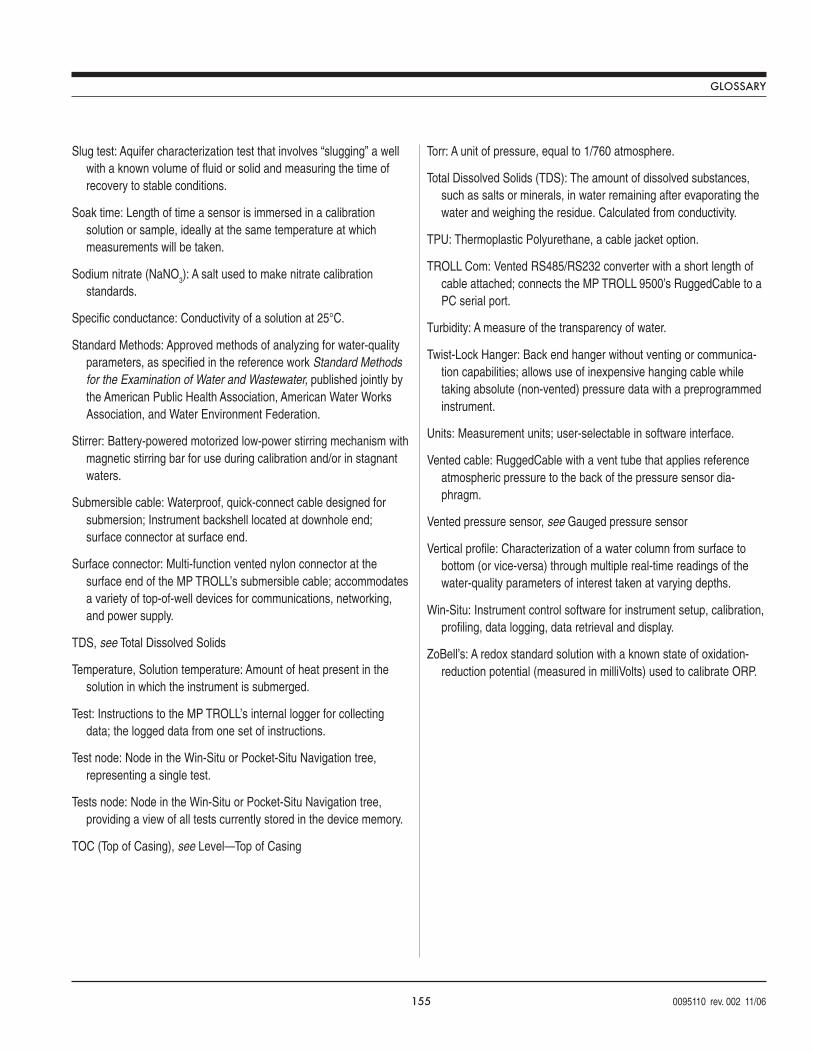
155 0095110 rev. 002 11/06
Slug test: Aquifer characterization test that involves “slugging” a wellwith a known volume of fluid or solid and measuring the time ofrecovery to stable conditions.
Soak time: Length of time a sensor is immersed in a calibrationsolution or sample, ideally at the same temperature at whichmeasurements will be taken.
Sodium nitrate (NaNO3): A salt used to make nitrate calibration
standards.
Specific conductance: Conductivity of a solution at 25°C.
Standard Methods: Approved methods of analyzing for water-qualityparameters, as specified in the reference work Standard Methodsfor the Examination of Water and Wastewater, published jointly bythe American Public Health Association, American Water WorksAssociation, and Water Environment Federation.
Stirrer: Battery-powered motorized low-power stirring mechanism withmagnetic stirring bar for use during calibration and/or in stagnantwaters.
Submersible cable: Waterproof, quick-connect cable designed forsubmersion; Instrument backshell located at downhole end;surface connector at surface end.
Surface connector: Multi-function vented nylon connector at thesurface end of the MP TROLL’s submersible cable; accommodatesa variety of top-of-well devices for communications, networking,and power supply.
TDS, see Total Dissolved Solids
Temperature, Solution temperature: Amount of heat present in thesolution in which the instrument is submerged.
Test: Instructions to the MP TROLL’s internal logger for collectingdata; the logged data from one set of instructions.
Test node: Node in the Win-Situ or Pocket-Situ Navigation tree,representing a single test.
Tests node: Node in the Win-Situ or Pocket-Situ Navigation tree,providing a view of all tests currently stored in the device memory.
TOC (Top of Casing), see Level—Top of Casing
Torr: A unit of pressure, equal to 1/760 atmosphere.
Total Dissolved Solids (TDS): The amount of dissolved substances,such as salts or minerals, in water remaining after evaporating thewater and weighing the residue. Calculated from conductivity.
TPU: Thermoplastic Polyurethane, a cable jacket option.
TROLL Com: Vented RS485/RS232 converter with a short length ofcable attached; connects the MP TROLL 9500’s RuggedCable to aPC serial port.
Turbidity: A measure of the transparency of water.
Twist-Lock Hanger: Back end hanger without venting or communica-tion capabilities; allows use of inexpensive hanging cable whiletaking absolute (non-vented) pressure data with a preprogrammedinstrument.
Units: Measurement units; user-selectable in software interface.
Vented cable: RuggedCable with a vent tube that applies referenceatmospheric pressure to the back of the pressure sensor dia-phragm.
Vented pressure sensor, see Gauged pressure sensor
Vertical profile: Characterization of a water column from surface tobottom (or vice-versa) through multiple real-time readings of thewater-quality parameters of interest taken at varying depths.
Win-Situ: Instrument control software for instrument setup, calibration,profiling, data logging, data retrieval and display.
ZoBell’s: A redox standard solution with a known state of oxidation-reduction potential (measured in milliVolts) used to calibrate ORP.
GLOSSARY
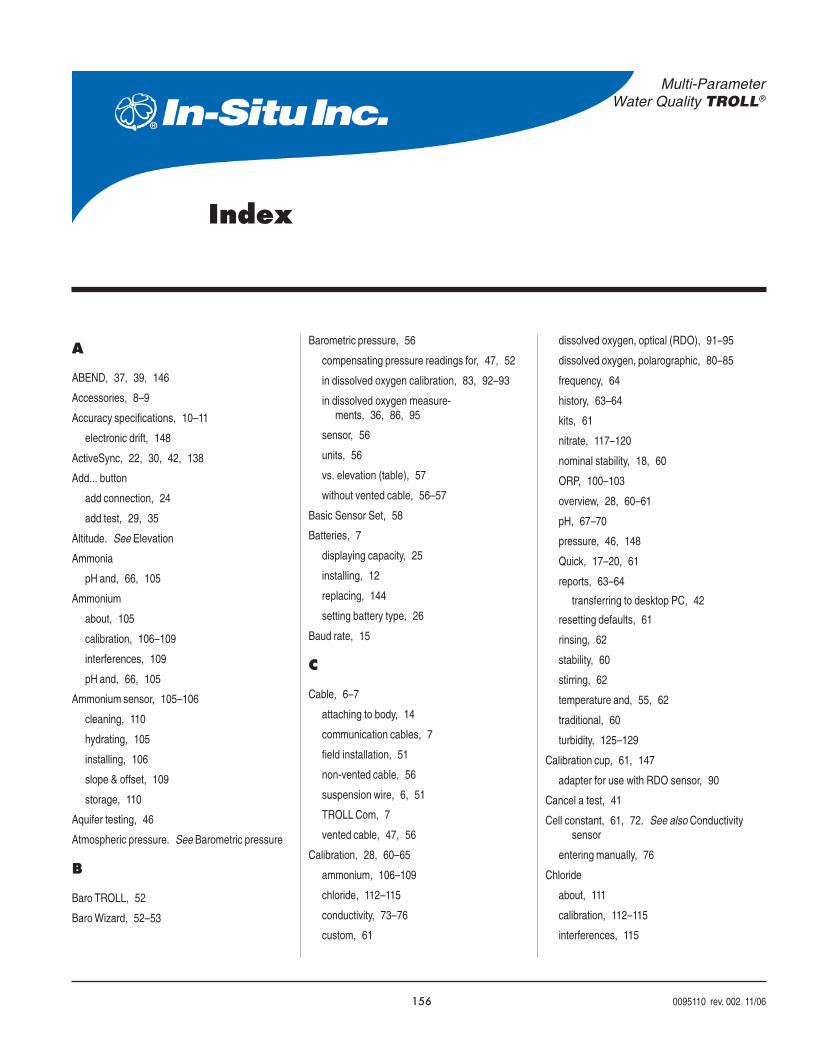
156 0095110 rev. 002 11/06
Multi-ParameterWater Quality TROLL®
Index
A
ABEND, 37, 39, 146
Accessories, 8–9
Accuracy specifications, 10–11
electronic drift, 148
ActiveSync, 22, 30, 42, 138
Add... button
add connection, 24
add test, 29, 35
Altitude. See Elevation
Ammonia
pH and, 66, 105
Ammonium
about, 105
calibration, 106–109
interferences, 109
pH and, 66, 105
Ammonium sensor, 105–106
cleaning, 110
hydrating, 105
installing, 106
slope & offset, 109
storage, 110
Aquifer testing, 46
Atmospheric pressure. See Barometric pressure
B
Baro TROLL, 52
Baro Wizard, 52–53
Barometric pressure, 56
compensating pressure readings for, 47, 52
in dissolved oxygen calibration, 83, 92–93
in dissolved oxygen measure-ments, 36, 86, 95
sensor, 56
units, 56
vs. elevation (table), 57
without vented cable, 56–57
Basic Sensor Set, 58
Batteries, 7
displaying capacity, 25
installing, 12
replacing, 144
setting battery type, 26
Baud rate, 15
C
Cable, 6–7
attaching to body, 14
communication cables, 7
field installation, 51
non-vented cable, 56
suspension wire, 6, 51
TROLL Com, 7
vented cable, 47, 56
Calibration, 28, 60–65
ammonium, 106–109
chloride, 112–115
conductivity, 73–76
custom, 61
dissolved oxygen, optical (RDO), 91–95
dissolved oxygen, polarographic, 80–85
frequency, 64
history, 63–64
kits, 61
nitrate, 117–120
nominal stability, 18, 60
ORP, 100–103
overview, 28, 60–61
pH, 67–70
pressure, 46, 148
Quick, 17–20, 61
reports, 63–64
transferring to desktop PC, 42
resetting defaults, 61
rinsing, 62
stability, 60
stirring, 62
temperature and, 55, 62
traditional, 60
turbidity, 125–129
Calibration cup, 61, 147
adapter for use with RDO sensor, 90
Cancel a test, 41
Cell constant, 61, 72. See also Conductivitysensor
entering manually, 76
Chloride
about, 111
calibration, 112–115
interferences, 115
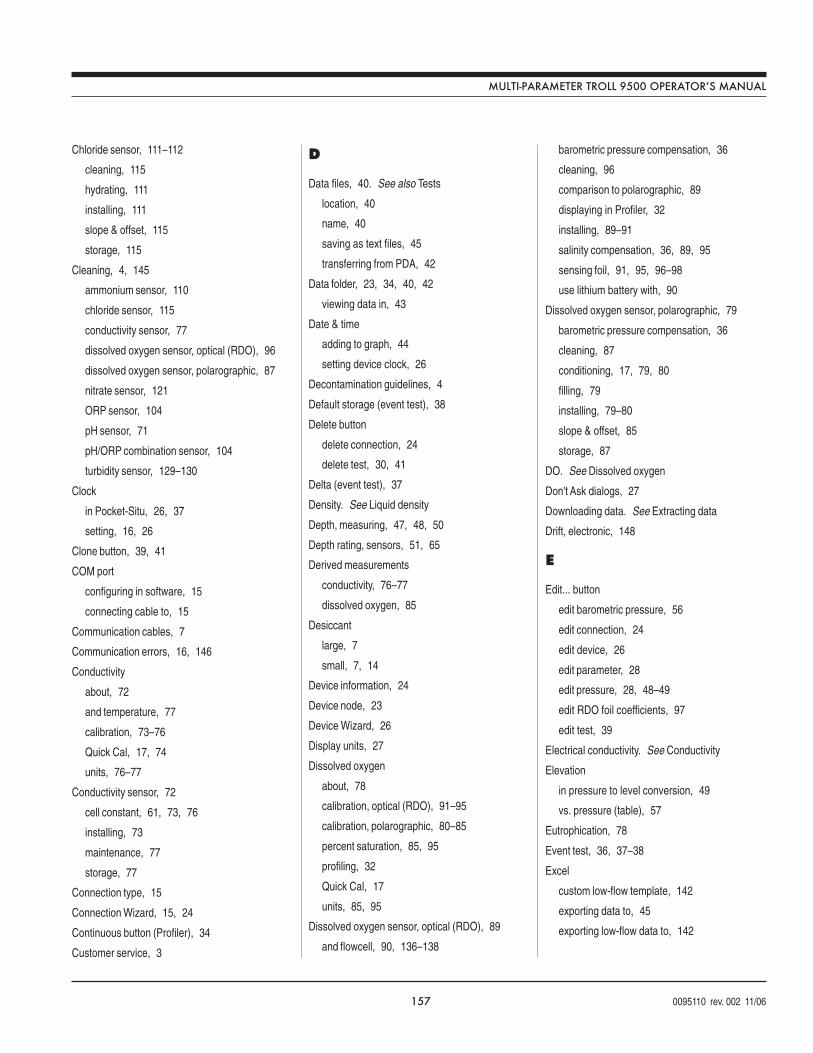
157 0095110 rev. 002 11/06
MULTI-PARAMETER TROLL 9500 OPERATOR’S MANUAL
Chloride sensor, 111–112
cleaning, 115
hydrating, 111
installing, 111
slope & offset, 115
storage, 115
Cleaning, 4, 145
ammonium sensor, 110
chloride sensor, 115
conductivity sensor, 77
dissolved oxygen sensor, optical (RDO), 96
dissolved oxygen sensor, polarographic, 87
nitrate sensor, 121
ORP sensor, 104
pH sensor, 71
pH/ORP combination sensor, 104
turbidity sensor, 129–130
Clock
in Pocket-Situ, 26, 37
setting, 16, 26
Clone button, 39, 41
COM port
configuring in software, 15
connecting cable to, 15
Communication cables, 7
Communication errors, 16, 146
Conductivity
about, 72
and temperature, 77
calibration, 73–76
Quick Cal, 17, 74
units, 76–77
Conductivity sensor, 72
cell constant, 61, 73, 76
installing, 73
maintenance, 77
storage, 77
Connection type, 15
Connection Wizard, 15, 24
Continuous button (Profiler), 34
Customer service, 3
D
Data files, 40. See also Tests
location, 40
name, 40
saving as text files, 45
transferring from PDA, 42
Data folder, 23, 34, 40, 42
viewing data in, 43
Date & time
adding to graph, 44
setting device clock, 26
Decontamination guidelines, 4
Default storage (event test), 38
Delete button
delete connection, 24
delete test, 30, 41
Delta (event test), 37
Density. See Liquid density
Depth, measuring, 47, 48, 50
Depth rating, sensors, 51, 65
Derived measurements
conductivity, 76–77
dissolved oxygen, 85
Desiccant
large, 7
small, 7, 14
Device information, 24
Device node, 23
Device Wizard, 26
Display units, 27
Dissolved oxygen
about, 78
calibration, optical (RDO), 91–95
calibration, polarographic, 80–85
percent saturation, 85, 95
profiling, 32
Quick Cal, 17
units, 85, 95
Dissolved oxygen sensor, optical (RDO), 89
and flowcell, 90, 136–138
barometric pressure compensation, 36
cleaning, 96
comparison to polarographic, 89
displaying in Profiler, 32
installing, 89–91
salinity compensation, 36, 89, 95
sensing foil, 91, 95, 96–98
use lithium battery with, 90
Dissolved oxygen sensor, polarographic, 79
barometric pressure compensation, 36
cleaning, 87
conditioning, 17, 79, 80
filling, 79
installing, 79–80
slope & offset, 85
storage, 87
DO. See Dissolved oxygen
Don't Ask dialogs, 27
Downloading data. See Extracting data
Drift, electronic, 148
E
Edit... button
edit barometric pressure, 56
edit connection, 24
edit device, 26
edit parameter, 28
edit pressure, 28, 48–49
edit RDO foil coefficients, 97
edit test, 39
Electrical conductivity. See Conductivity
Elevation
in pressure to level conversion, 49
vs. pressure (table), 57
Eutrophication, 78
Event test, 36, 37–38
Excel
custom low-flow template, 142
exporting data to, 45
exporting low-flow data to, 142
158 0095110 rev. 002 11/06
MULTI-PARAMETER TROLL 9500 OPERATOR’S MANUAL
Exiting software, 30
Expand devices on find, 27
Extended Sensor Set, 59
Extract button, 40
Extracting data, 30, 40
F
Features upgrade, 25
Find button, 24
expand devices on Find option, 27
Firmware upgrade, 3, 25
Flow-Sense Wizard
creating templates, 138
entering target values, 141
measurement interval, 140
output files, 142
preparation, 136
reports, 142
saving data, 142
setting unit preferences, 139
stabilization readings, graph view, 141
stabilization readings, meter view, 141
starting from a file or template, 139
starting from Navigation tree, 139
starting from Tools menu, 139
total volume, 140
Fluid density. See Liquid density
Formazin, 126
G
Graphing controls
Pocket-Situ, 45
Win-Situ, 44
Graphing data, 44
low-flow data, 141
Profiler data, 32
Gravitational acceleration
in pressure to level conversion, 49
H
Home site, 23
I
Information pane, 23
Installation
accessories for, 9
cable grip, 51
sensors, 59
software, 22
L
Level, measuring, 47, 50
Surface mode, 48
Top of Casing mode, 48
Level reference, 49
Linear average test, 37, 38
Linear test, 36, 37
Liquid density, 49
calculating, 148
in pressure to level conversion, 49
Logging data, 29, 35–41. See also Tests
overview, 21, 29
Low-flow monitoring, 136–142
with RDO sensor, 136–139
Low-flow software. See Flow-Sense Wizard
M
Maintenance & calibration service, 3, 53
Manual readings, 29
Manual start mode, 37
Measurement units, 27
Microsoft ActiveSync, 22, 30, 42, 138
Microsoft Excel, 45, 142
N
Name
connection, 15
data files, 34, 40
device, 26
pressure channel, 48
test, 36
Navigation tree, 23
test status symbols in, 39
Nernst equation, 66, 99
Nitrate
about, 116
calibration, 117–120
interferences, 121
Nitrate sensor, 116–117
cleaning, 121
hydrating, 117
installing, 117
slope & offset, 120
storage, 121
Nominal stability, 18, 60
Non-vented cable, 56
Nose cone, 6
RDO sensor, 91
Nose cone stirrer. See Stirrer
O
O-rings, 144–145
sensor, 60
ORP
about, 99
calibration, 100–103
Quick Cal, 17
resetting default coefficients, 103
units, 103
ORP sensor, 99–100
cleaning, 104
installing, 100
storage, 104
Oxidation-reduction potential. See ORP
P
Parameter Wizard, 48
PDA
timeout, 31, 40, 61
transferring data to desktop PC, 42
159 0095110 rev. 002 11/06
MULTI-PARAMETER TROLL 9500 OPERATOR’S MANUAL
pH
about, 66
calibration, 67–70
Quick Cal, 17, 68
resetting default coefficients, 70
pH sensor, 66–67
cleaning, 71
installing, 67
rehydrating, 71
slope & offset, 70
storage, 70, 71
usage, 70
pH/ORP combination sensor
calibrating, 68, 101
cleaning, 104
installing, 67, 100
usage, 71
Pocket-Situ
about, 22
activating, 23
clock display in, 26, 37
exiting, 30
installing, 22–23
interface, 23
launching, 23
system requirements, 22
Power
external, 7, 25
internal, 7
Practical Salinity Scale, 77
Preferences, 27
Pressure
conversion to depth or level, 49
measuring, 46, 47
Pressure head mode, 48
Pressure rating, sensors, 51, 65
Pressure sensor
about, 46–47
absolute vs. gauged, 47
factory calibration, 46
field recalibration, 47
non-vented vs. vented, 47
recalibration, 53
zeroing, 47
Pressure setup, 48–49
overview, 20
summary, 50
Product specifications, 10–11
Profiling, 31–34
changing channels displayed, 32, 33, 34
changing measurement units, 34
changing sample rate, 27, 34
depth or level, 32
dissolved oxygen, 32
exiting the Profiler, 34
graphing data, 32
logging data, 34
retrieving data, 34
starting software in Profiler mode, 27, 34
starting the Profiler, 31
turbidity, 32, 129
PSIA, 47
PSIG, 47
Pumping tests, 46
Q
Quick Cal, 17–20, 28, 61
sensors that cannot use, 20
tips, 17
with RDO sensor installed, 17, 98
R
RDO. See Dissolved oxygen sensor, optical(RDO)
Refresh button, 24, 25
Removing sensors, 60
Repair service, 3
Resistivity, 77
Restrictor, 6
RMA, 3
S
Salinity, 77
and RDO sensor, 36, 89, 95
Scheduled start mode, 37
SDI-12, 131–133
adapter, 131
commands, 132, 134
out-of-range readings, 133
wiring, 131
Seals
o-rings, 144–145
sensor o-rings, 60
Sensors, 58–60
ammonium, 105–106
barometric pressure, 56
chloride, 111–112
conductivity, 72
dissolved oxygen, optical (RDO), 89
dissolved oxygen, polarographic, 79
installing, 13, 59
nitrate, 116–117
o-rings, 60
ORP, 99–100
pH, 66–67
pressure, 46
removing, 60
replacement, 65
serial number, 2, 65
specifications, 10–11
storage, 63
temperature, 54
turbidity, 123
Serial number, 2
Settings options, 27
Show Calibration Report button, 64
Slug tests, 46
Snapshot button (Profiler), 34
Software, 9. See also Pocket-Situ; Win-Situ
Software upgrade, 3
Specific conductance, 76
160 0095110 rev. 002 11/06
MULTI-PARAMETER TROLL 9500 OPERATOR’S MANUAL
Specific gravity, 49
Specifications, 10–11
Stirrer, 62, 65, 86
Stirring
and polarographic D.O. measurement, 86–88
during calibration, 62
Surface mode, 48
T
Technical support, 3
Temperature
about, 54
and calibration, 55, 62
units, 55
Temperature sensor, 54
Test name, 36
Test setup, 35–37
overview, 21
Test Wizard, 35
Tests, 35
adding to device, 21, 35–37
cancelling, 41
cloning, 41
deleting, 30, 41
event, 36, 37–38
extracting, 30, 40
linear, 36, 37
linear average, 37, 38
manual start mode, 37
measurement interval, 37
measurement schedules, 36
printing, 45
saving as text files, 45
scheduled start mode, 37
setting up, 21, 35–37
starting, 40
status symbols in Navigation tree, 39
stopping, 37, 40
viewing, 30, 43
Tests node (group view in Nav tree), 35
Text files, 45
Top of Casing mode, 48
Total Dissolved Solids, 77
TROLL Com, 7, 15
Turbidity
about, 122–123
calibration, 125–129
calibration standards, 125
profiling, 32, 129
Turbidity sensor, 123
cleaning, 129–130
resetting default coefficients, 129
Turbidity wiper, 123–125
during Quick Cal, 17
installation, 124
maintenance, 130
"manual" wipe, 125
Twist-Lock hanger, 9, 51
U
Units, selecting, 27
Upgrading
features, 25
firmware, 3, 25
software, 3
Uploading data. See Extracting data
User reference. See Level reference
V
Vented cable, 47, 56
Viewing data, 30, 43
W
Warranty provisions, 3
Water level. See Level, measuring
Win-Situ
about, 22
exiting, 30
installing, 22
interface, 23
launching, 23
system requirements, 22
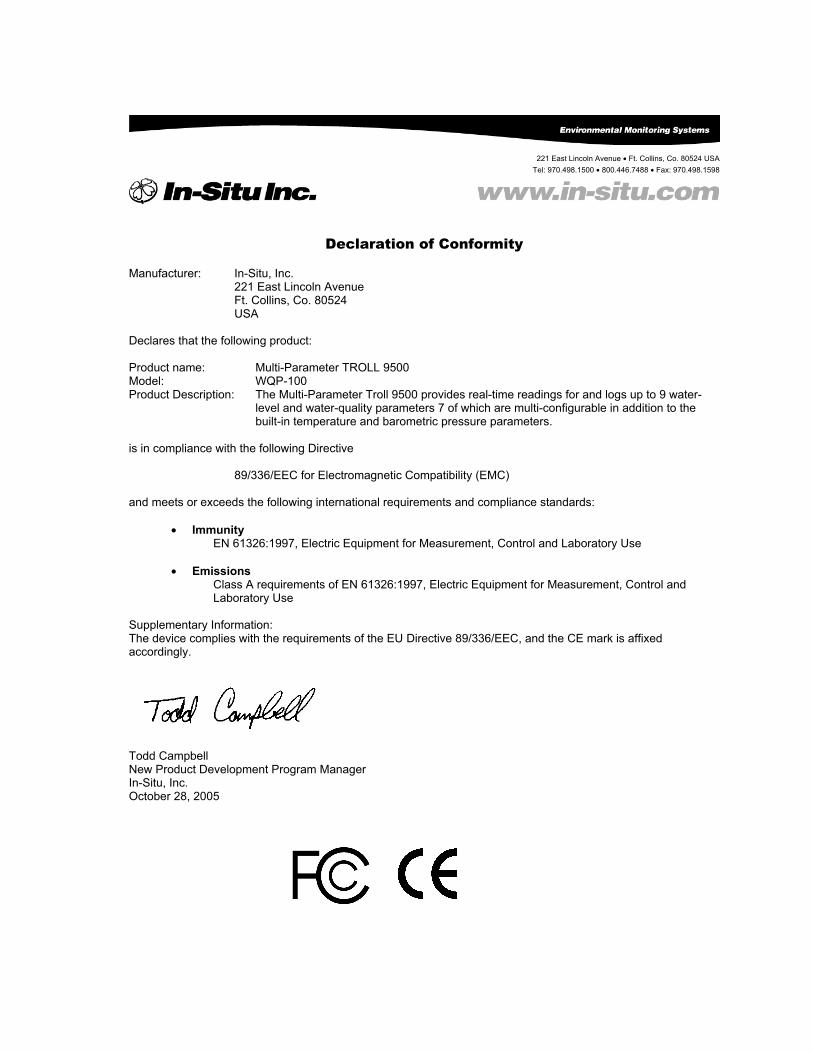
DECLARATION OF CONFORMITY
221 East Lincoln Avenue • Ft. Collins, Co. 80524 USA
Tel: 970.498.1500 • 800.446.7488 • Fax: 970.498.1598
Declaration of Conformity Manufacturer: In-Situ, Inc. 221 East Lincoln Avenue Ft. Collins, Co. 80524 USA Declares that the following product: Product name: Multi-Parameter TROLL 9500 Model: WQP-100 Product Description: The Multi-Parameter Troll 9500 provides real-time readings for and logs up to 9 water-
level and water-quality parameters 7 of which are multi-configurable in addition to the built-in temperature and barometric pressure parameters.
is in compliance with the following Directive 89/336/EEC for Electromagnetic Compatibility (EMC) and meets or exceeds the following international requirements and compliance standards:
• Immunity EN 61326:1997, Electric Equipment for Measurement, Control and Laboratory Use
• Emissions Class A requirements of EN 61326:1997, Electric Equipment for Measurement, Control and
Laboratory Use Supplementary Information: The device complies with the requirements of the EU Directive 89/336/EEC, and the CE mark is affixed accordingly.
Todd Campbell New Product Development Program Manager In-Situ, Inc. October 28, 2005