muhammad ali - strategy and performance · muhammad ali - strategy and performance . 3 from...
TRANSCRIPT
1
Muhammad Ali - Strategy and Performance
2
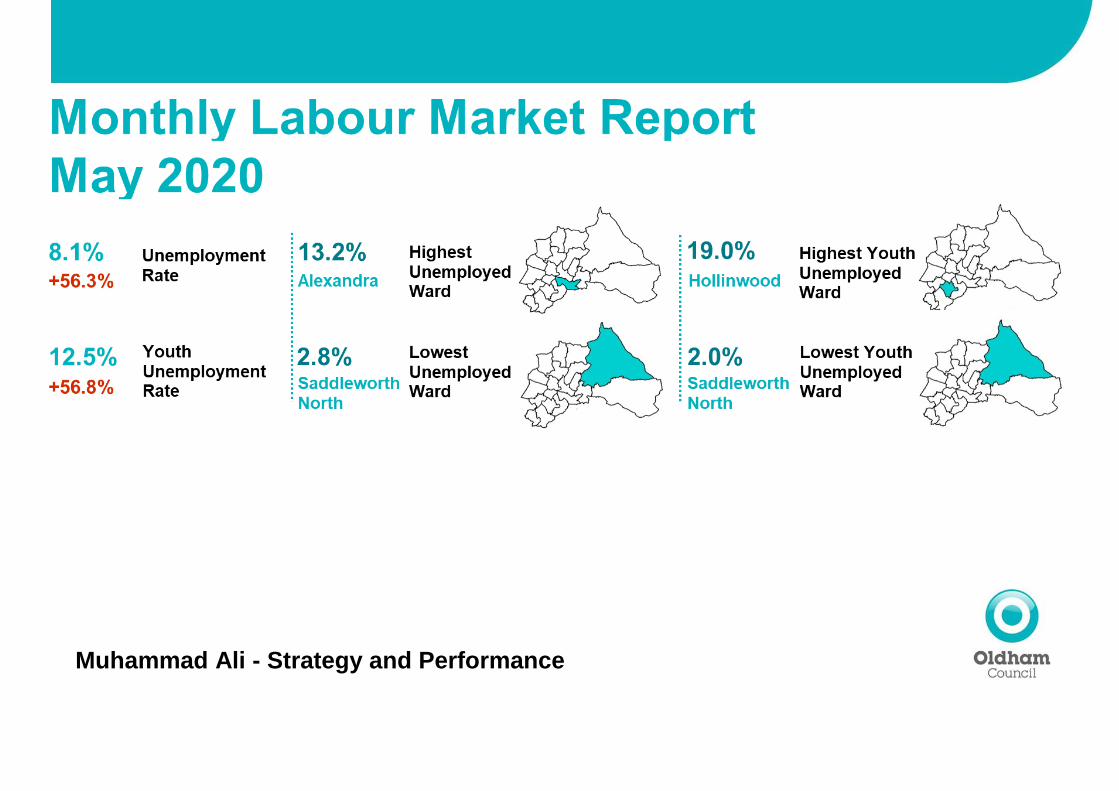
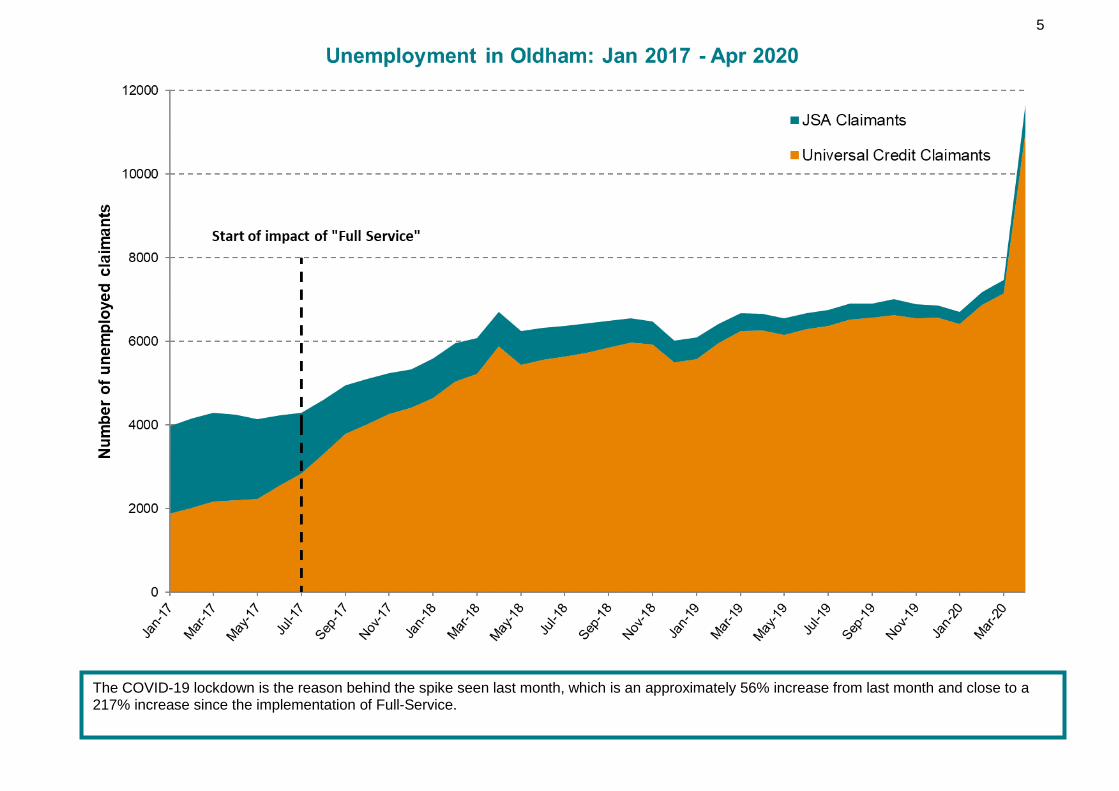
Key Findings this Month These Statistics are for a month period up until 9th April 2020, therefore the first month impact of COVID-19 and the lockdown is within this report. Unemployment The unemployment rate stands at 8.1%, which has increased from 5.2% last month. As of April 2020, there were 11,675 claimants in Oldham (an increase of 4,145 claimants in one month due to the COVID-19 Lockdown) (Universal Credit: 11,015 and JSA: 660). As other local authorities have not yet fully rolled out Full Service, these figures cannot be fairly compared within Greater Manchester. We estimate that fair comparisons will not be possible until mid-2021, when the lockdown is eased and the migration to UC is fully complete. However, Oldham performs well on other comparator measures: our performance outstrips comparator Full Service early adopters even during the COVID-19 lockdown (page 3), and when using the alternative Annual Population Survey Measure (APS), unemployment can be seen to have stabilized and moves closely in line with the Claimant Count rate (page 4).
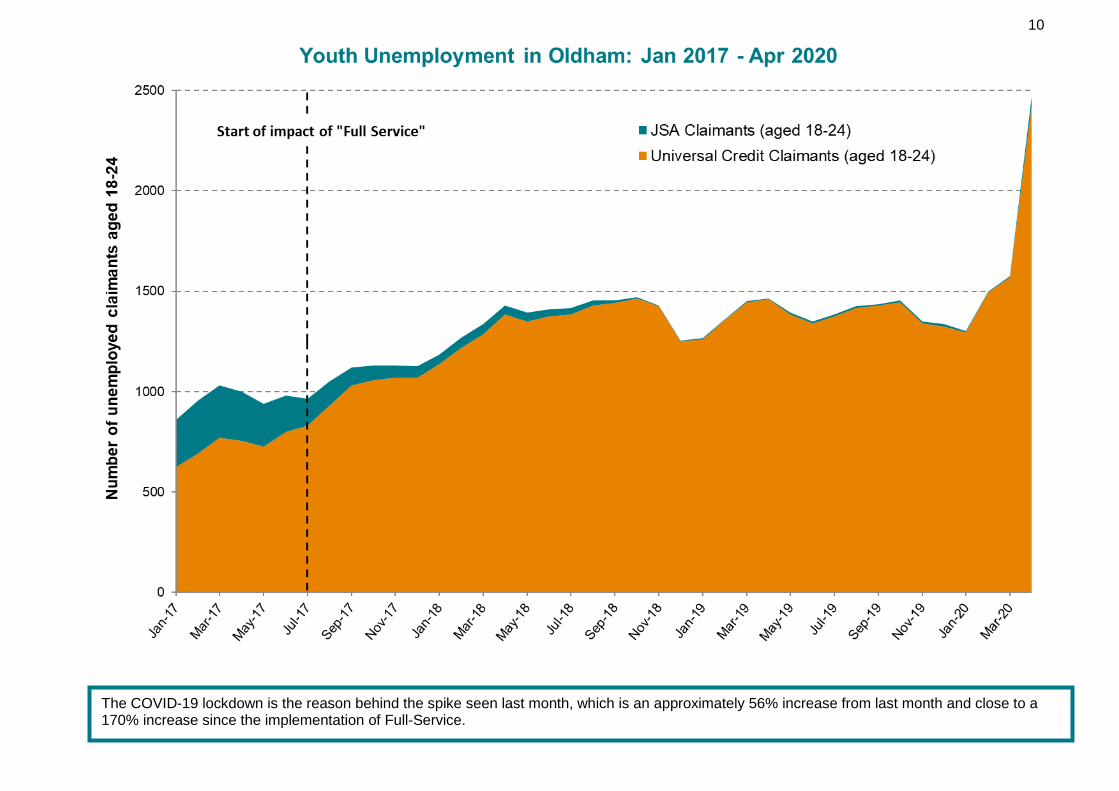
Youth Unemployment Youth unemployment in Oldham has increased this month by 57% due to the COVID-19 economic shock. As of April 2020, there were 2,470 young people (aged 18-24) in Oldham unemployed. This represents a youth unemployment rate of 12.5%, the highest rate across Greater Manchester and higher than the national average of 6.5%. However, as with all age unemployment, comparisons are not yet accurate.
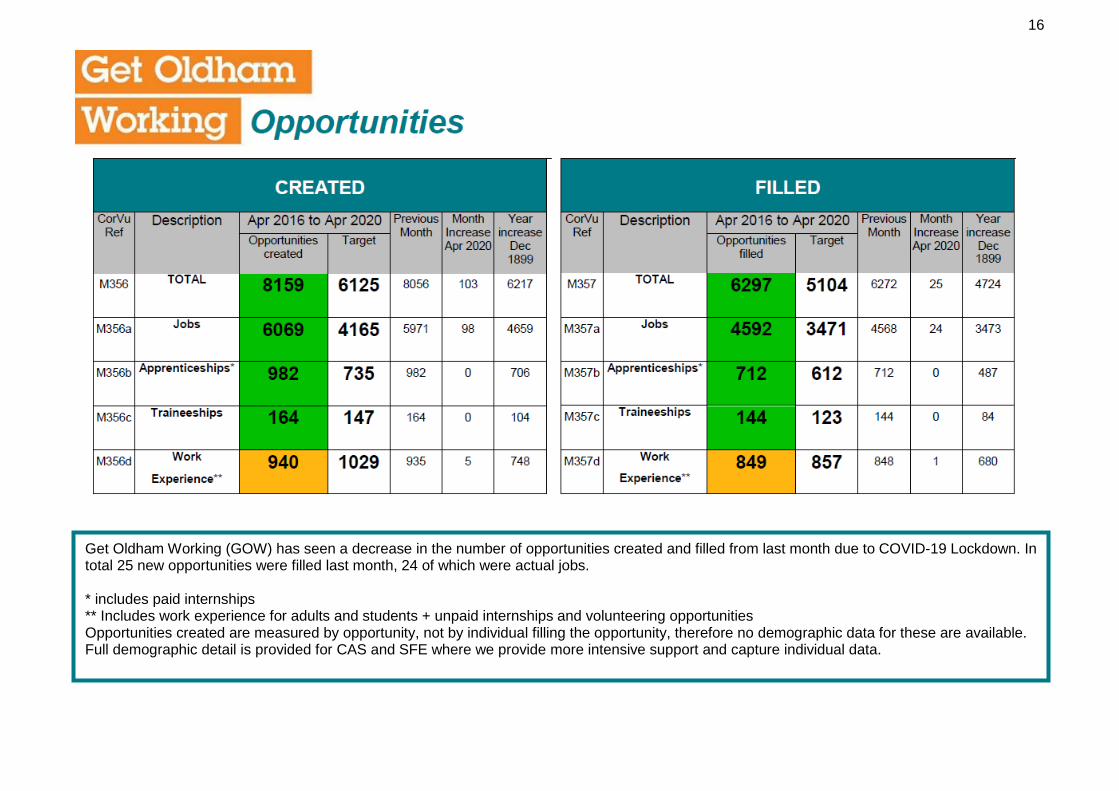
Get Oldham Working Get Oldham Working (GOW) has seen a decrease in the number of opportunities created and filled from last month due to COVID-19 Lockdown. In total 25 new opportunities were filled last month, 24 of which were actual jobs.
NEETs The current NEET rate stands at 3.9%, which has increased from the previous month. However, this is also higher than the NEET rate from 12 months prior, which was at 3.6%. Muhammad Ali - Strategy and Performance
3
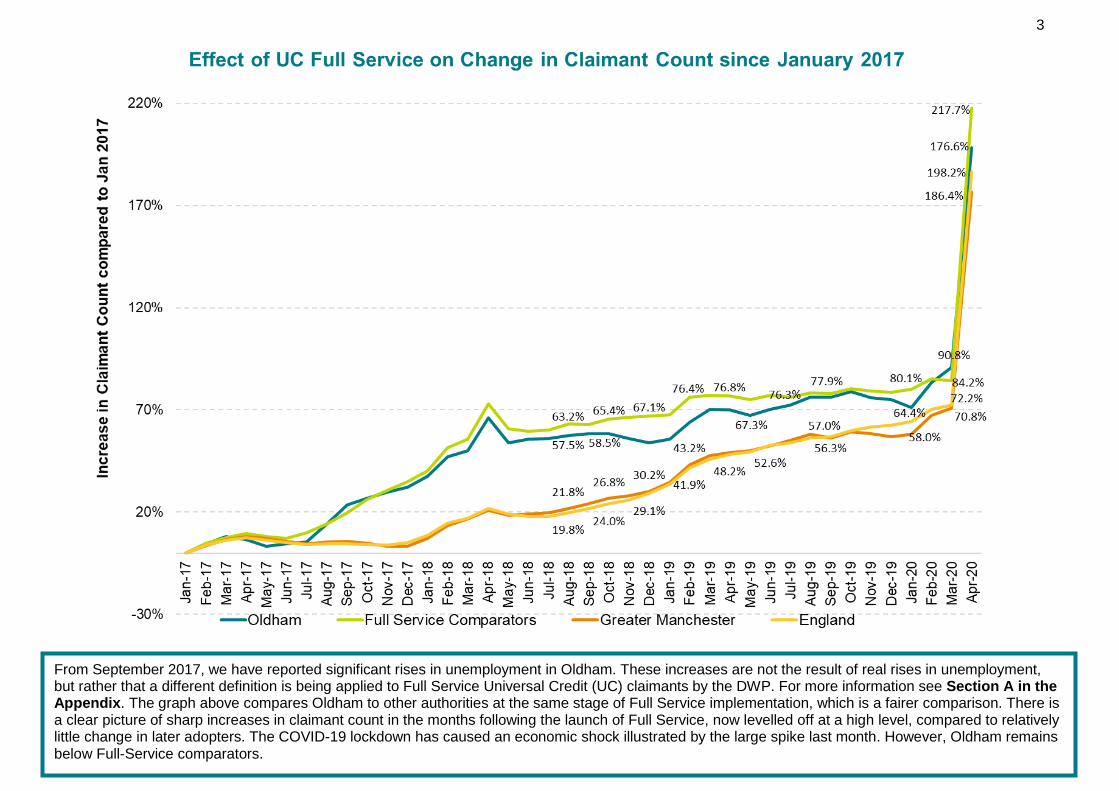
From September 2017, we have reported significant rises in unemployment in Oldham. These increases are not the result of real rises in unemployment, but rather that a different definition is being applied to Full Service Universal Credit (UC) claimants by the DWP. For more information see Section A in the Appendix. The graph above compares Oldham to other authorities at the same stage of Full Service implementation, which is a fairer comparison. There is a clear picture of sharp increases in claimant count in the months following the launch of Full Service, now levelled off at a high level, compared to relatively little change in later adopters. The COVID-19 lockdown has caused an economic shock illustrated by the large spike last month. However, Oldham remains below Full-Service comparators.
4
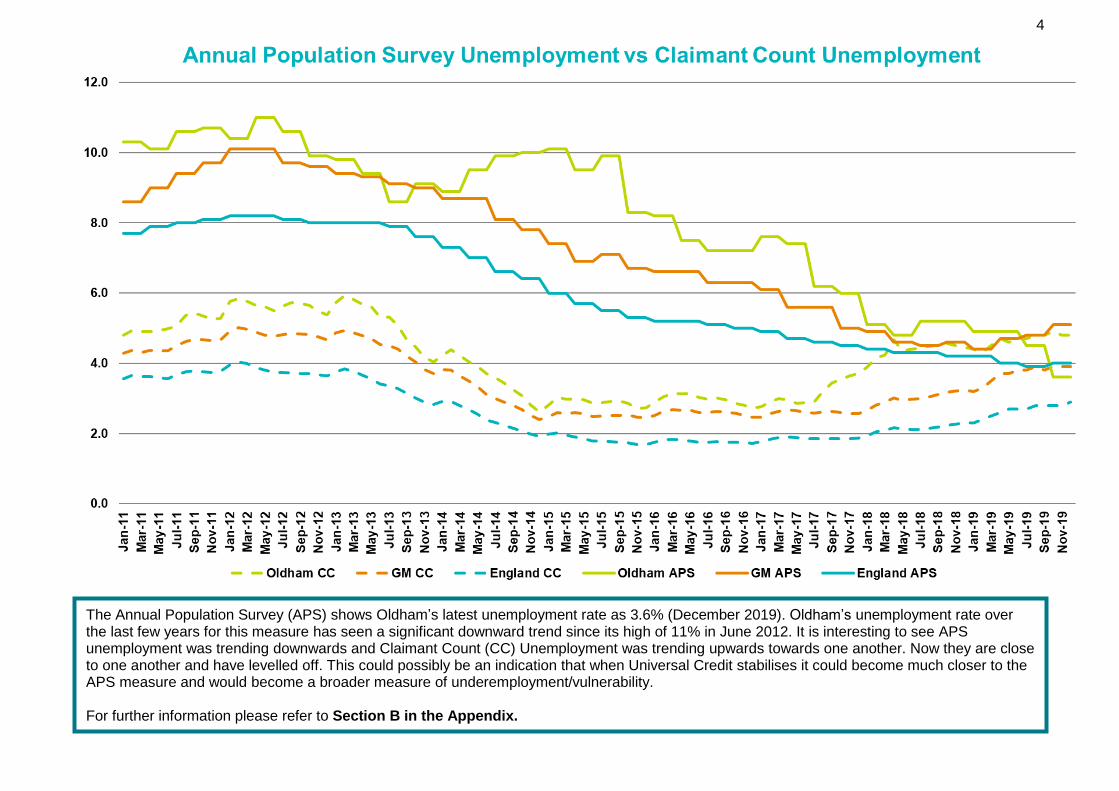
The Annual Population Survey (APS) shows Oldham’s latest unemployment rate as 3.6% (December 2019). Oldham’s unemployment rate over the last few years for this measure has seen a significant downward trend since its high of 11% in June 2012. It is interesting to see APS unemployment was trending downwards and Claimant Count (CC) Unemployment was trending upwards towards one another. Now they are close to one another and have levelled off. This could possibly be an indication that when Universal Credit stabilises it could become much closer to the APS measure and would become a broader measure of underemployment/vulnerability. For further information please refer to Section B in the Appendix.
5
s
The COVID-19 lockdown is the reason behind the spike seen last month, which is an approximately 56% increase from last month and close to a 217% increase since the implementation of Full-Service.

6
Regional Unemployment Statistics (aged 16-64): April 2020
Local Authority Unemployed % Unemployed % Monthly
change % Annual change
Full Service Launch Date
Bolton 12,900 7.4 50.5 88.3 Nov-18
Bury 7,430 6.4 71.2 99.7 Jul-18
Manchester 28,645 7.4 61.5 82.7 Oct-17*
Oldham 11,675 8.1 56.3 75.4 Apr-17
Rochdale 10,325 7.6 59.7 81.1 May-18
Salford 11,850 7.1 64.0 94.6 Sep-18
Stockport 8,775 5.0 67.9 116.9 Nov-18
Tameside 9,635 6.9 63.4 76.3 Mar-18
Trafford 6,605 4.6 82.7 95.7 Jul-17
Wigan 12,895 6.4 61.6 71.9 Apr-18
GM 120,730 6.7 62.0 85.5 -
England 1,768,540 5.0 66.3 93.2 -
The unemployment rate in Oldham currently stands at 8.1%, which is an increase of 56.3% from the previous month. There has been an increase in unemployment this month due to the COVID-19 economic shock, which is reflected UK wide.
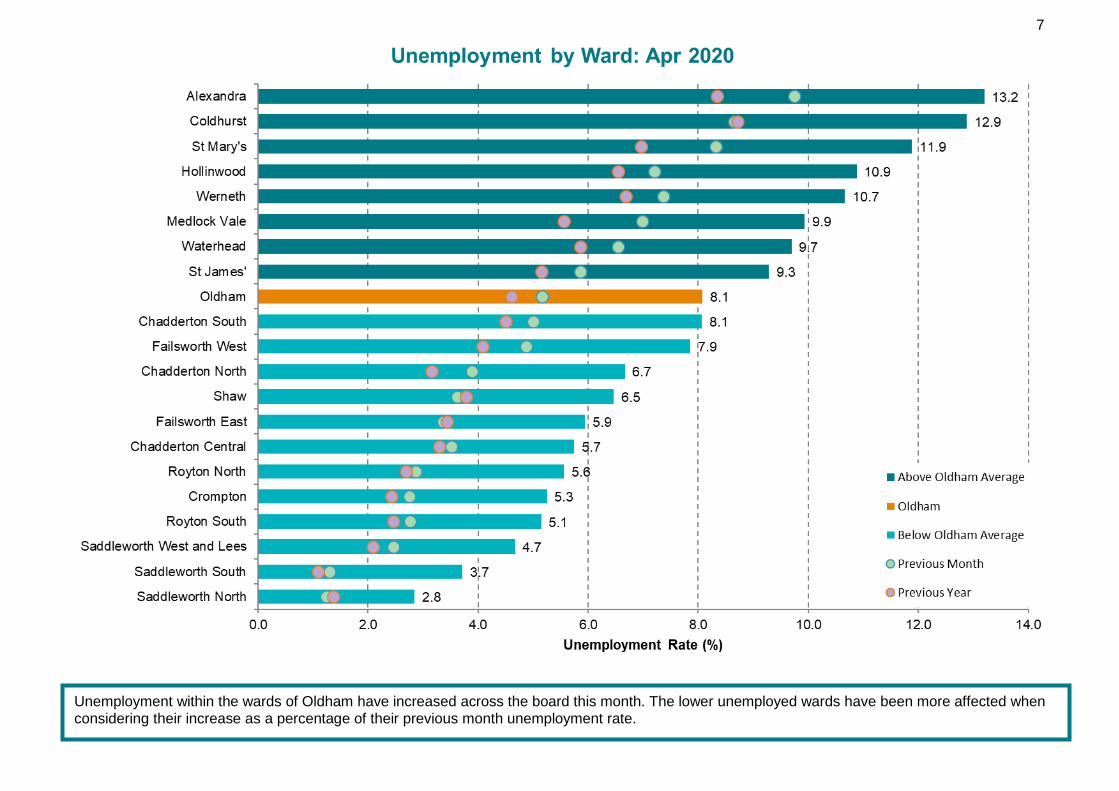
7
Unemployment within the wards of Oldham have increased across the board this month. The lower unemployed wards have been more affected when considering their increase as a percentage of their previous month unemployment rate.
8
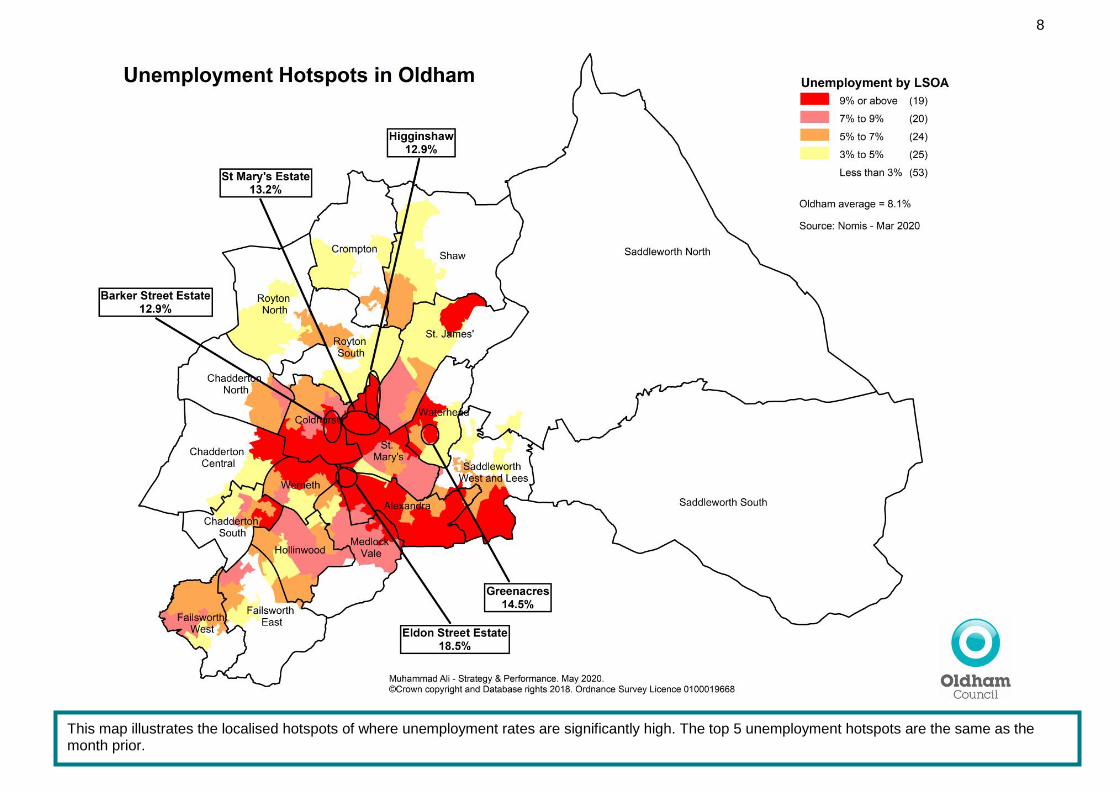
This map illustrates the localised hotspots of where unemployment rates are significantly high. The top 5 unemployment hotspots are the same as the month prior.

9
Youth Unemployment (aged 18-24): April 2020
Local Authority Youth
Unemployed % Youth
Unemployed % Monthly
change % Annual change
Full Service Launch Date
Bolton 2,375 10.3 47.1 78.6 Nov-18
Bury 1,385 10.0 57.4 85.9 Jul-18
Manchester 5,260 6.1 59.6 74.2 Oct-17*
Oldham 2,470 12.5 56.8 68.6 Apr-17
Rochdale 1,975 11.0 57.4 61.9 May-18
Salford 2,205 8.7 62.1 97.8 Sep-18
Stockport 1,460 7.6 58.7 105.6 Nov-18
Tameside 1,940 11.3 58.4 73.2 Mar-18
Trafford 1,165 7.7 77.9 89.4 Jul-17
Wigan 2,375 9.9 48.4 62.7 Apr-18
GM 22,610 8.7 57.2 76.7 -
England 313,155 6.5 58.4 84.1 -
Youth unemployment in Oldham has risen significantly this month to 12.5%. which is a monthly change of 56.8%. There has been a significant increase in youth unemployment this month, which is reflected UK wide as a result of the COVID-19 economic shock.
10
The COVID-19 lockdown is the reason behind the spike seen last month, which is an approximately 56% increase from last month and close to a 170% increase since the implementation of Full-Service.
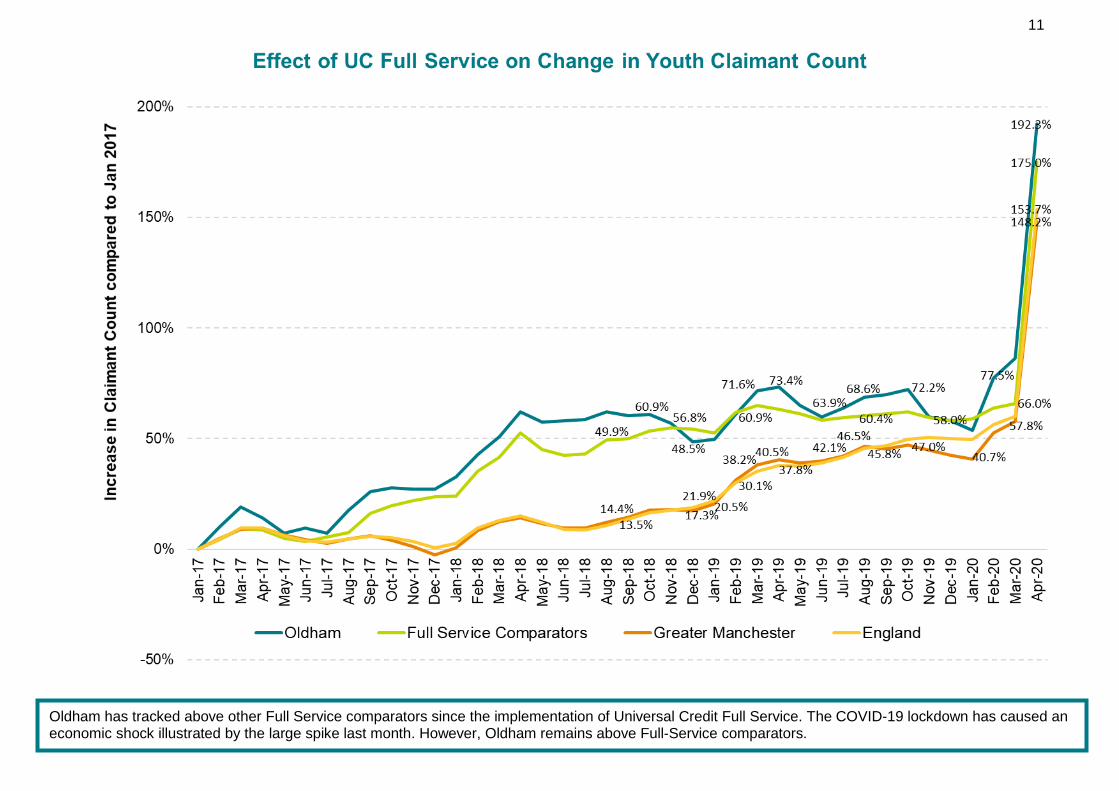
11
Oldham has tracked above other Full Service comparators since the implementation of Universal Credit Full Service. The COVID-19 lockdown has caused an economic shock illustrated by the large spike last month. However, Oldham remains above Full-Service comparators.
12
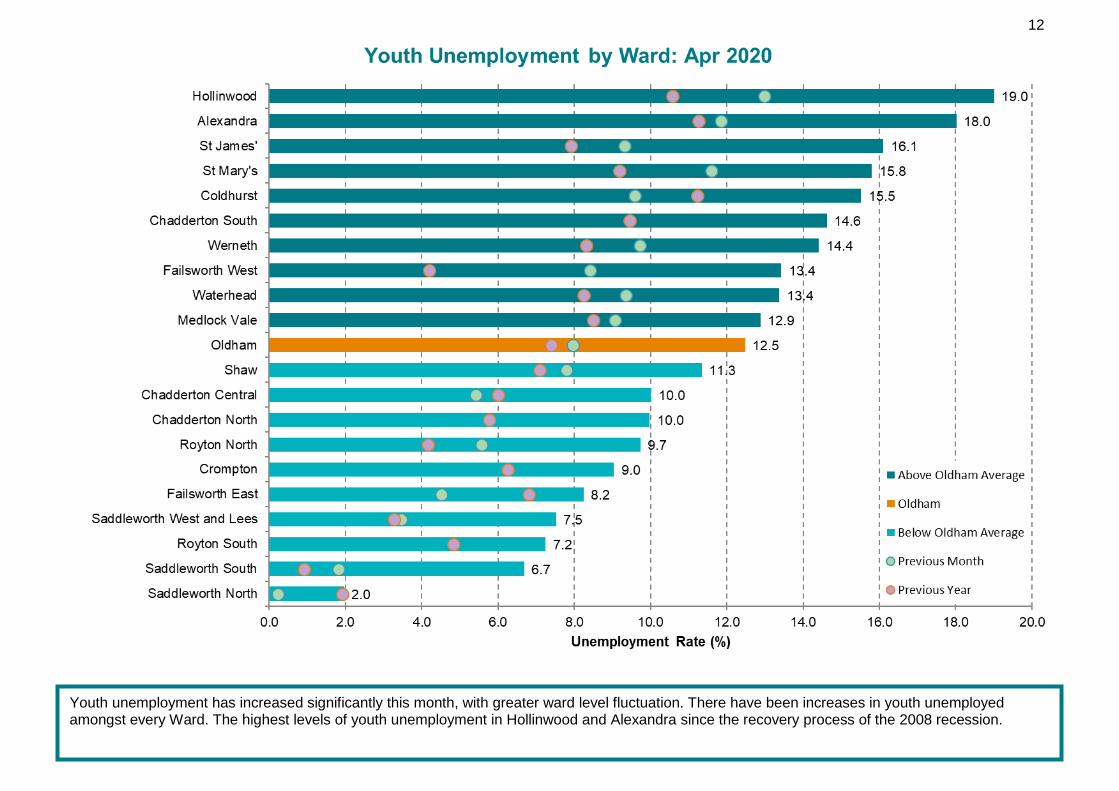
Youth unemployment has increased significantly this month, with greater ward level fluctuation. There have been increases in youth unemployed amongst every Ward. The highest levels of youth unemployment in Hollinwood and Alexandra since the recovery process of the 2008 recession.
13
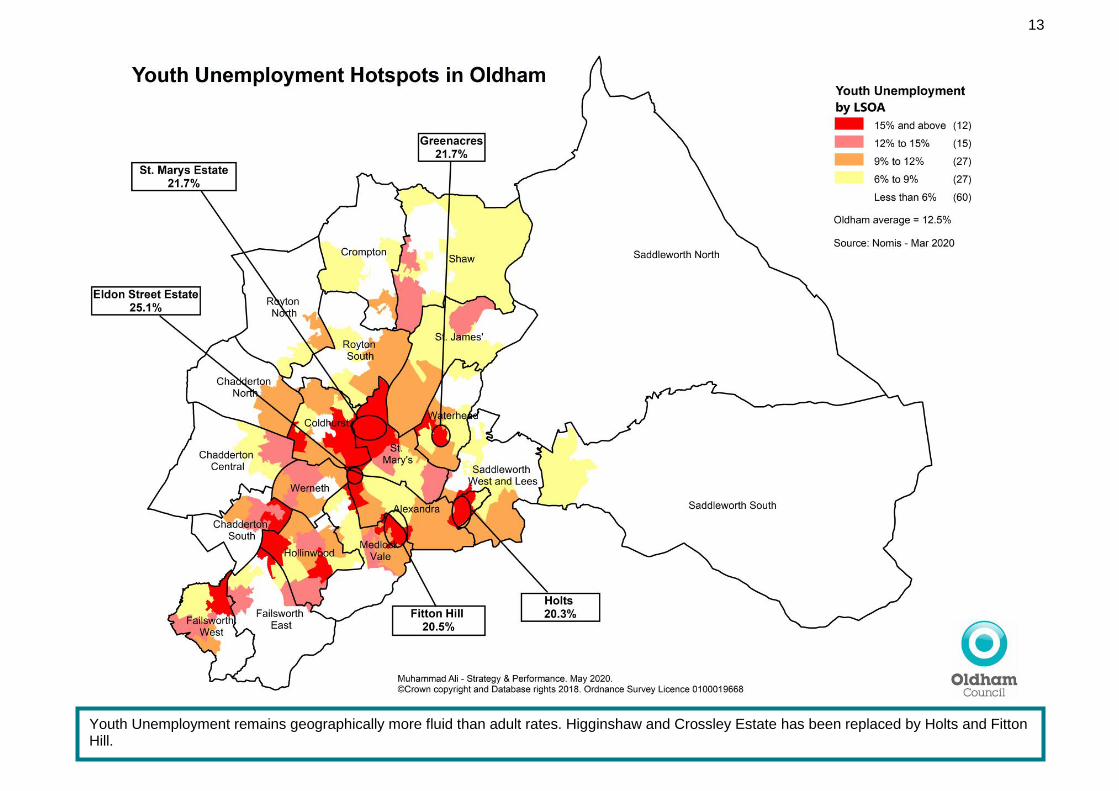
Youth Unemployment remains geographically more fluid than adult rates. Higginshaw and Crossley Estate has been replaced by Holts and Fitton Hill.
14
Universal Credit Sanction Rates: November 2019
Local Authority UC Claimants eligible
for sanctions Number of UC
Sanctions Sanction Rate (%)
GM Rank (1 = highest)
Bolton 6,056 157 2.6 8
Bury 3,491 121 3.5 3
Manchester 15,068 497 3.3 4
Oldham 6,554 188 2.9 6
Rochdale 5,091 224 4.4 2
Salford 5,539 155 2.8 7
Stockport 3,864 85 2.2 10
Tameside 4,948 270 5.5 1
Trafford 3,108 70 2.3 9
Wigan 6,224 194 3.1 5
GM 59,943 1,961 3.3 -
England 855,231 32,403 3.8 -
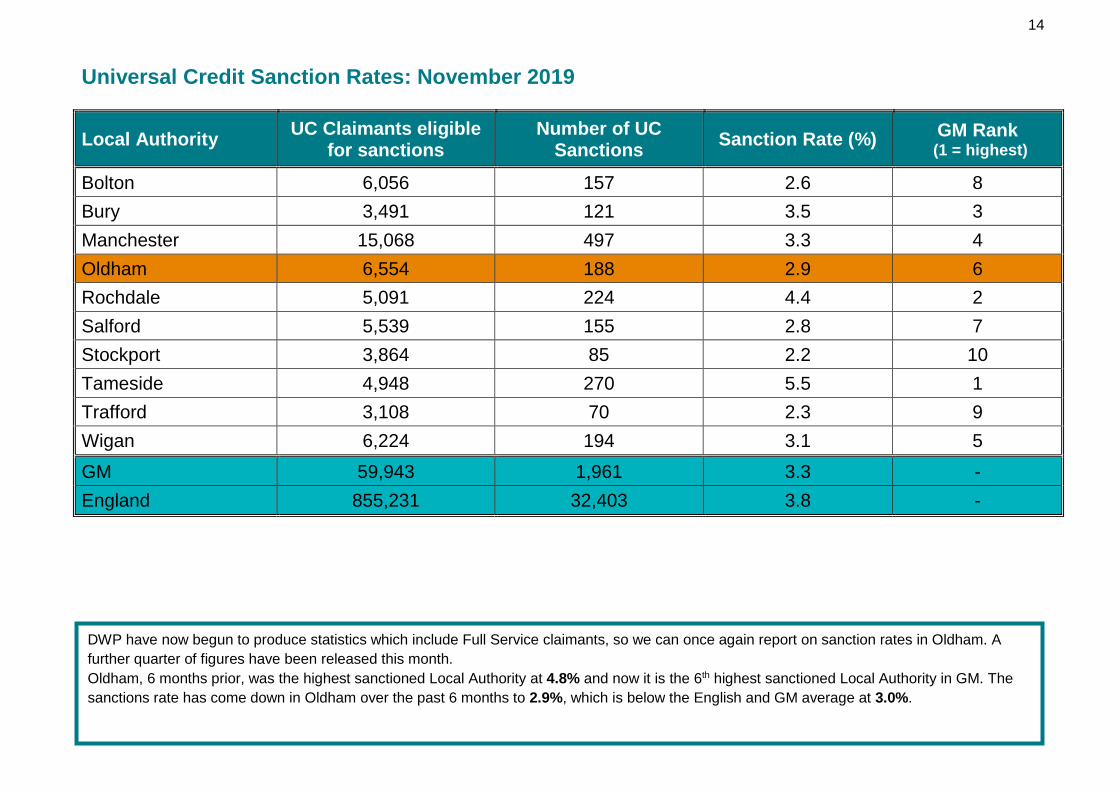
DWP have now begun to produce statistics which include Full Service claimants, so we can once again report on sanction rates in Oldham. A
further quarter of figures have been released this month.
Oldham, 6 months prior, was the highest sanctioned Local Authority at 4.8% and now it is the 6th highest sanctioned Local Authority in GM. The
sanctions rate has come down in Oldham over the past 6 months to 2.9%, which is below the English and GM average at 3.0%.
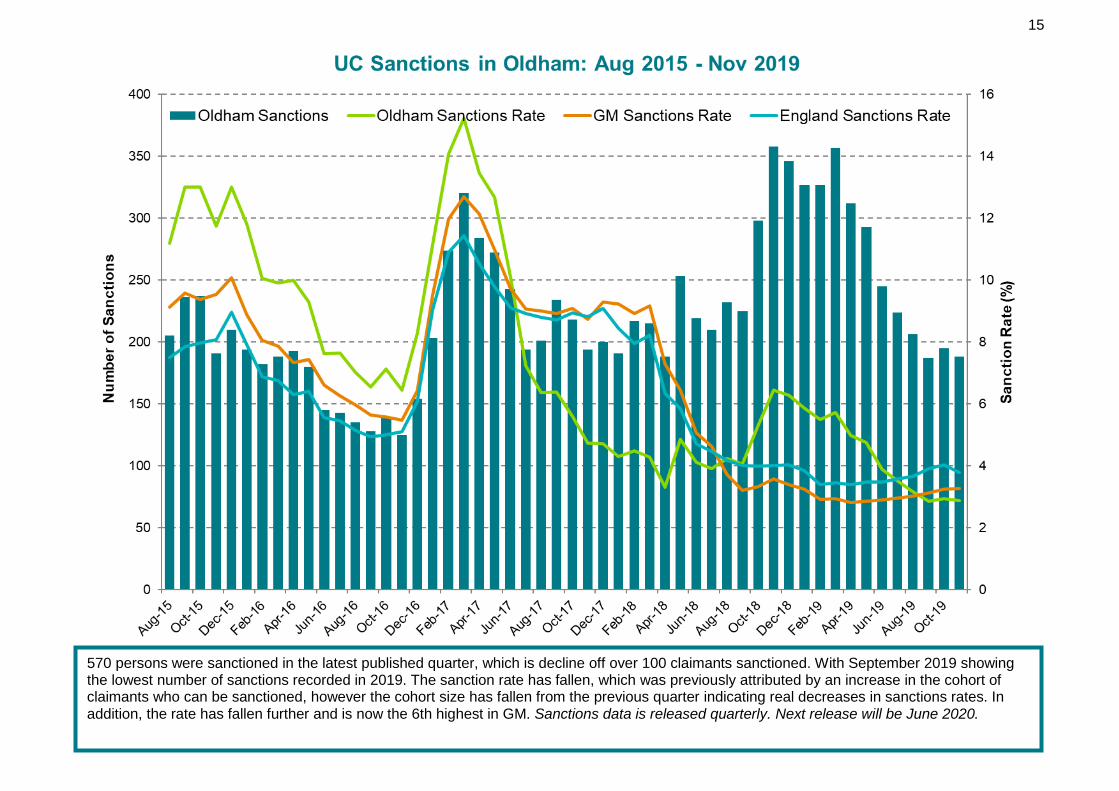
15
570 persons were sanctioned in the latest published quarter, which is decline off over 100 claimants sanctioned. With September 2019 showing the lowest number of sanctions recorded in 2019. The sanction rate has fallen, which was previously attributed by an increase in the cohort of claimants who can be sanctioned, however the cohort size has fallen from the previous quarter indicating real decreases in sanctions rates. In addition, the rate has fallen further and is now the 6th highest in GM. Sanctions data is released quarterly. Next release will be June 2020.
16
Get Oldham Working (GOW) has seen a decrease in the number of opportunities created and filled from last month due to COVID-19 Lockdown. In total 25 new opportunities were filled last month, 24 of which were actual jobs. * includes paid internships ** Includes work experience for adults and students + unpaid internships and volunteering opportunities Opportunities created are measured by opportunity, not by individual filling the opportunity, therefore no demographic data for these are available. Full demographic detail is provided for CAS and SFE where we provide more intensive support and capture individual data.

17
16-19s (Year 12/13) Not in Education, Employment and Training (NEET) in Oldham
NEET as % of cohort (Years 12 & 13)
Apr-20
May-20
Jun-20
Q1 Jul-20
Aug-20
Sep-20
Q2 Oct-20
Nov-20
Dec-20
Q3 Jan-21
Feb-21
Mar-21
Q4
Target
Actual (Year 12 & 13) 3.9%
Last Year’s Performance 3.6%
Actual Numbers 236
Cohort Size 6,144
Numbers 12 months ago (Years 12-14)
218
Source: Positive Steps Oldham
The current NEET rate stands at 3.9%, which has increased from the previous month. However, this is also higher than the NEET rate from 12 months prior, which was at 3.6%.

18
Appendix A – Full Service Comparators From September 2017, we have reported significant rises in unemployment in Oldham. These increases are not the result of real rises in
unemployment, but rather that a different definition is being applied to “Full Service” Universal Credit (UC) claimants by the DWP.
While there is no definitive statement from DWP of who has been added to the figures, we believe this is likely to include
• Claimants awaiting an ESA Work Capability Assessment, who are placed on UC in the interim.
• Unemployed or low-income partners of UC claimants, who are now required to search for work.
Because Oldham was one of the first areas to transition to UC “Full Service”, we have been disproportionately impacted by this change,
and this is likely to continue for around a year. The figures in this report should therefore not be taken as a measure of true
unemployment or as a guide to Oldham’s performance, although the maps still provide an accurate picture of hotspots and NEET figures
are unaffected.
The graph on page 3 compares Oldham to other authorities at the same stage of Full Service implementation, which is a fairer
comparison. There is a clear picture of sharp increases in claimant count in the months following the launch of Full Service, now levelled
off at a high level, compared to relatively little change in later adopters. Oldham is outperforming the early adopter average.

19
Appendix B – Annual Population Survey Unemployment
There are currently 2 prominent unemployment measures used within England, the Claimant Count proxy unemployment measure and
the Annual Population Survey (APS) unemployment measure (page 4). The Annual Population Survey shows Oldham’s unemployment
rate as 5.1%. Oldham’s unemployment rate over the last few years for this measure has seen a significant downwards trends since its
highs of 11% in June 2012. The benefit of the Claimant Count as a dataset is that it is released and updated on a monthly basis. The
Annual Population Survey unemployment rate dataset is a quarterly figure, so it is not as favourable when looking at the trend over time
or when conducting statistical analysis.
When using the Annual Population Survey, it is important to remember that when dealing with subsets of the population, for example at
district level data there are some statistical issue. When splitting the survey to a smaller subset we get a smaller number of survey
respondents, which causes confidence intervals to be much larger, rendering the APS unemployment to become less reliable and
statistically insignificant. For example, the unemployment rate for England (March 2018) was 4.4% with a confidence interval of 0.1%,
this indicates that the unemployment rate could be 4.3% to 4.5%. The data has statistically significance. However, if we split the dataset
to local authority level, the unemployment rate in Oldham (March 2018) was 5.1% with a confidence interval of 1.7%, which states that
the unemployment rate could be anything between 3.4% and 6.8%, which can be categorised as having less statistical significance.