mtu aero engines ag · © mtu aero engines ag. the information contained herein is proprietary to...
TRANSCRIPT
MTU Aero Engines AG
7/28/2017 - Q2 2017 Results
Q2 2017 Results
© MTU Aero Engines AG. The information contained herein is proprietary to the MTU Aero Engines group companies.
• IATA increased its outlook for passenger traffic growth 2017
• FAA engine certification for PW1900G (E190/195-E2) and PW1200G (MRJ)
• PW1100G-JM awarded with 180 minute ETOPS Certification
• First flight of Irkut MS-21 equipped with PW1400G in May
• New record level of MRO revenues
• Repayment of 250 m€ Eurobond in June
• Guidance for revenues and EBIT increased
2
Business Highlights
© MTU Aero Engines AG. The information contained herein is proprietary to the MTU Aero Engines group companies.
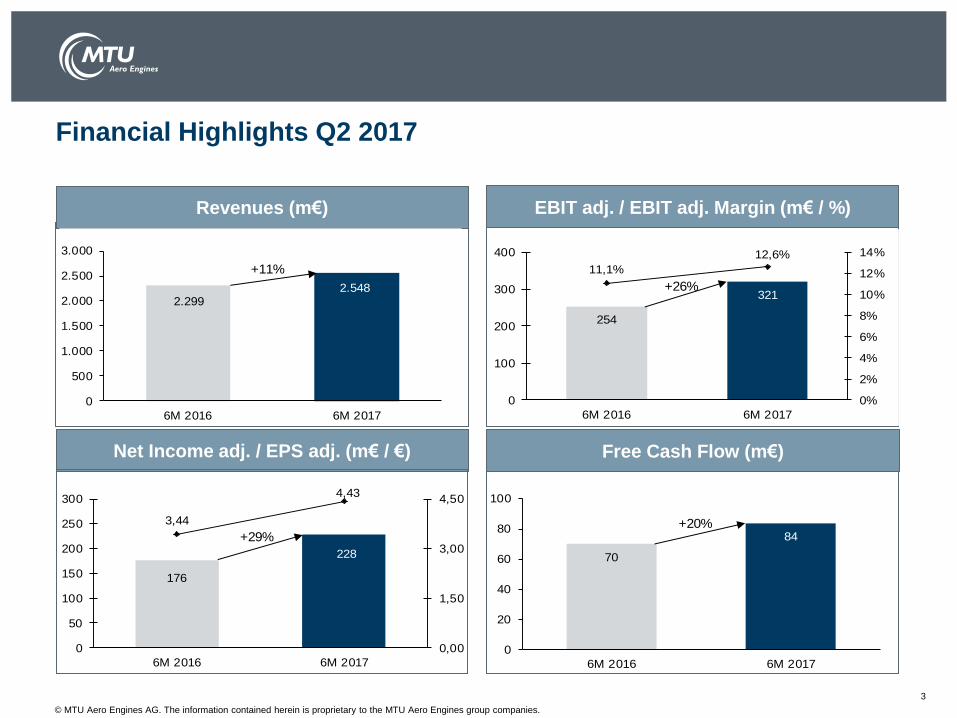
Financial Highlights Q2 2017
Revenues (m€) EBIT adj. / EBIT adj. Margin (m€ / %)
Net Income adj. / EPS adj. (m€ / €) Free Cash Flow (m€)
3
2.2992.548
0
500
1.000
1.500
2.000
2.500
3.000
6M 2016 6M 2017
+11%
254
321
11,1%
12,6%
0%
2%
4%
6%
8%
10%
12%
14%
0
100
200
300
400
6M 2016 6M 2017
+26%
176
228
3,44
4,43
0,00
1,50
3,00
4,50
0
50
100
150
200
250
300
6M 2016 6M 2017
+29%
70
84
0
20
40
60
80
100
6M 2016 6M 2017
+20%
© MTU Aero Engines AG. The information contained herein is proprietary to the MTU Aero Engines group companies.
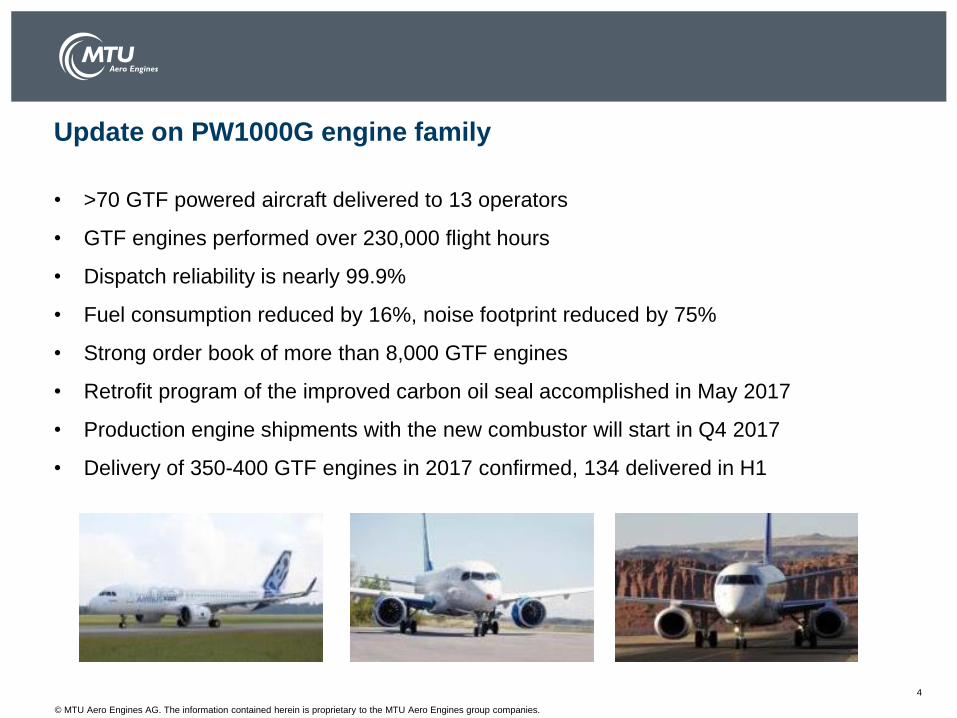
• >70 GTF powered aircraft delivered to 13 operators
• GTF engines performed over 230,000 flight hours
• Dispatch reliability is nearly 99.9%
• Fuel consumption reduced by 16%, noise footprint reduced by 75%
• Strong order book of more than 8,000 GTF engines
• Retrofit program of the improved carbon oil seal accomplished in May 2017
• Production engine shipments with the new combustor will start in Q4 2017
• Delivery of 350-400 GTF engines in 2017 confirmed, 134 delivered in H1
4
Update on PW1000G engine family
© MTU Aero Engines AG. The information contained herein is proprietary to the MTU Aero Engines group companies.
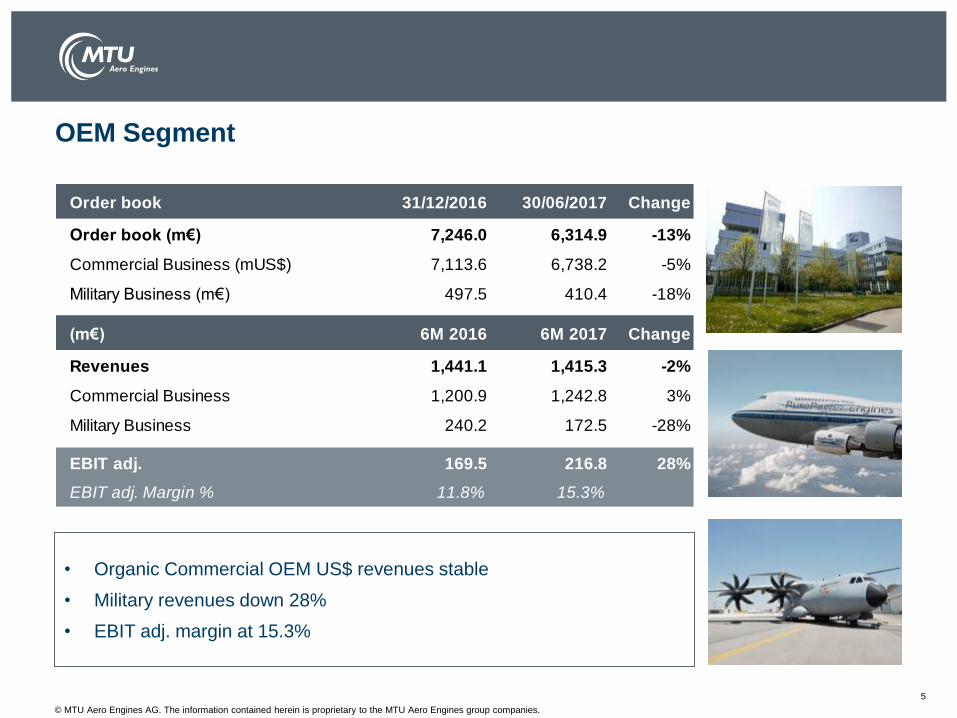
OEM Segment
• Organic Commercial OEM US$ revenues stable
• Military revenues down 28%
• EBIT adj. margin at 15.3%
Order book 31/12/2016 30/06/2017 Change
Order book (m€) 7,246.0 6,314.9 -13%
Commercial Business (mUS$) 7,113.6 6,738.2 -5%
Military Business (m€) 497.5 410.4 -18%
(m€) 6M 2016 6M 2017 Change
Revenues 1,441.1 1,415.3 -2%
Commercial Business 1,200.9 1,242.8 3%
Military Business 240.2 172.5 -28%
EBIT adj. 169.5 216.8 28%
EBIT adj. Margin % 11.8% 15.3%
5
© MTU Aero Engines AG. The information contained herein is proprietary to the MTU Aero Engines group companies.
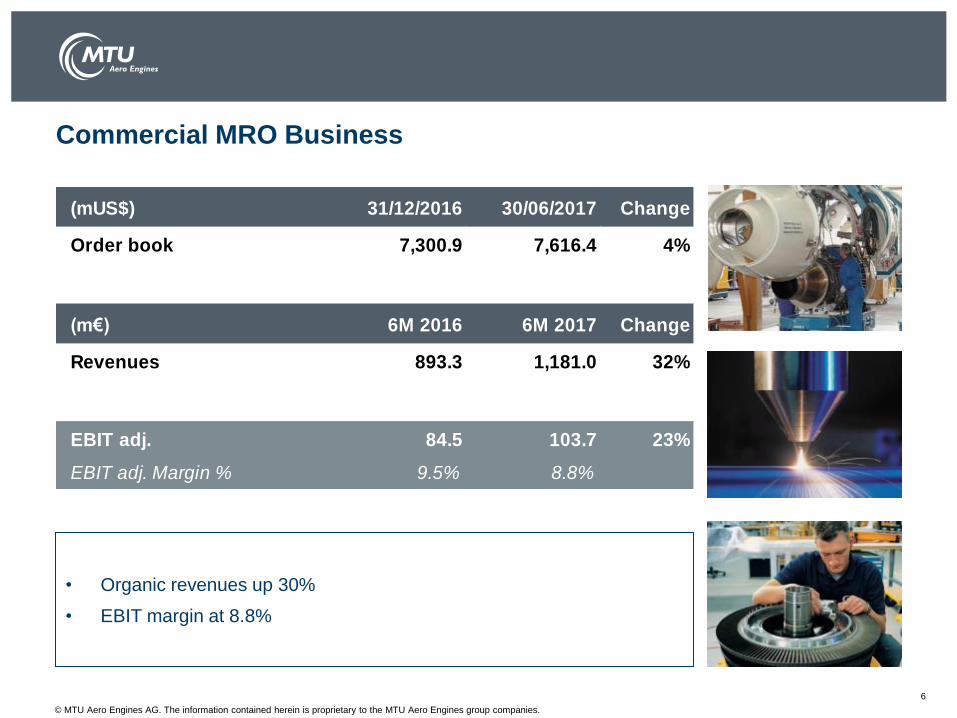
Commercial MRO Business
• Organic revenues up 30%
• EBIT margin at 8.8%
(mUS$) 31/12/2016 30/06/2017 Change
Order book 7,300.9 7,616.4 4%
(m€) 6M 2016 6M 2017 Change
Revenues 893.3 1,181.0 32%
EBIT adj. 84.5 103.7 23%
EBIT adj. Margin % 9.5% 8.8%
6
© MTU Aero Engines AG. The information contained herein is proprietary to the MTU Aero Engines group companies.
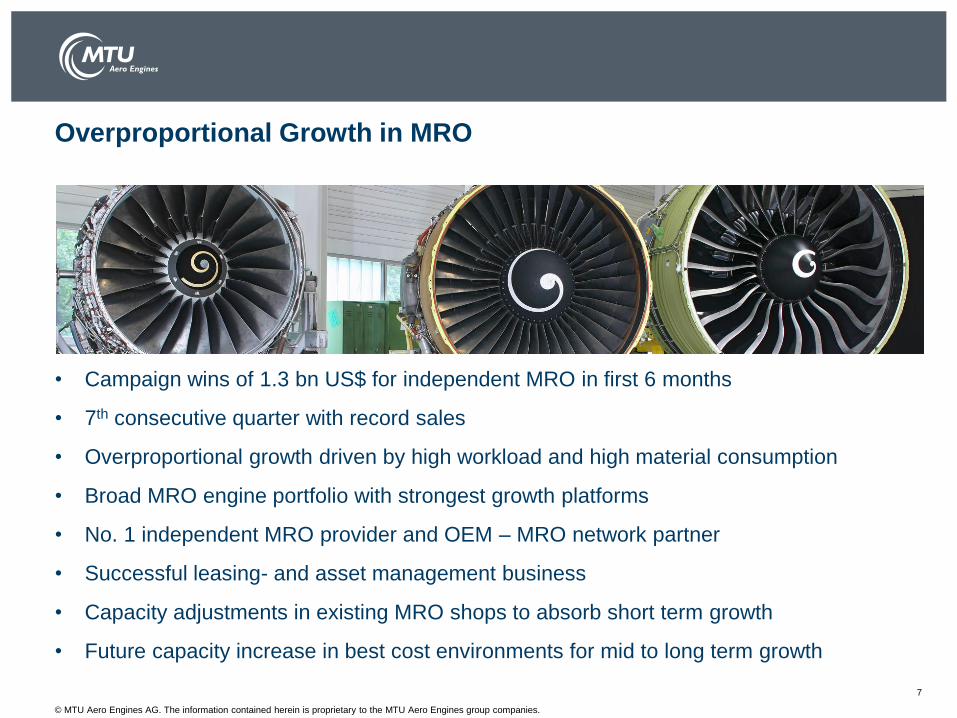
• Campaign wins of 1.3 bn US$ for independent MRO in first 6 months
• 7th consecutive quarter with record sales
• Overproportional growth driven by high workload and high material consumption
• Broad MRO engine portfolio with strongest growth platforms
• No. 1 independent MRO provider and OEM – MRO network partner
• Successful leasing- and asset management business
• Capacity adjustments in existing MRO shops to absorb short term growth
• Future capacity increase in best cost environments for mid to long term growth
7
Overproportional Growth in MRO
© MTU Aero Engines AG. The information contained herein is proprietary to the MTU Aero Engines group companies.
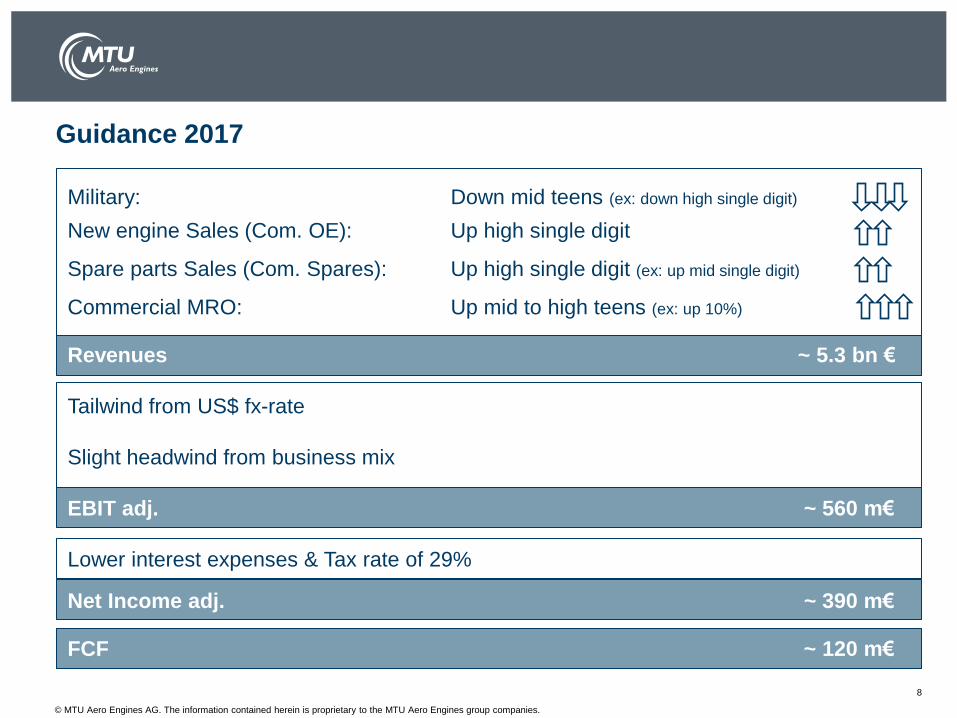
Military: Down mid teens (ex: down high single digit)
New engine Sales (Com. OE): Up high single digit
Spare parts Sales (Com. Spares): Up high single digit (ex: up mid single digit)
Commercial MRO: Up mid to high teens (ex: up 10%)
Revenues ~ 5.3 bn €
Tailwind from US$ fx-rate
Slight headwind from business mix
EBIT adj. ~ 560 m€
Lower interest expenses & Tax rate of 29%
Net Income adj. ~ 390 m€
FCF ~ 120 m€
Guidance 2017
8
© MTU Aero Engines AG. The information contained herein is proprietary to the MTU Aero Engines group companies.
Appendix
9
© MTU Aero Engines AG. The information contained herein is proprietary to the MTU Aero Engines group companies.
10
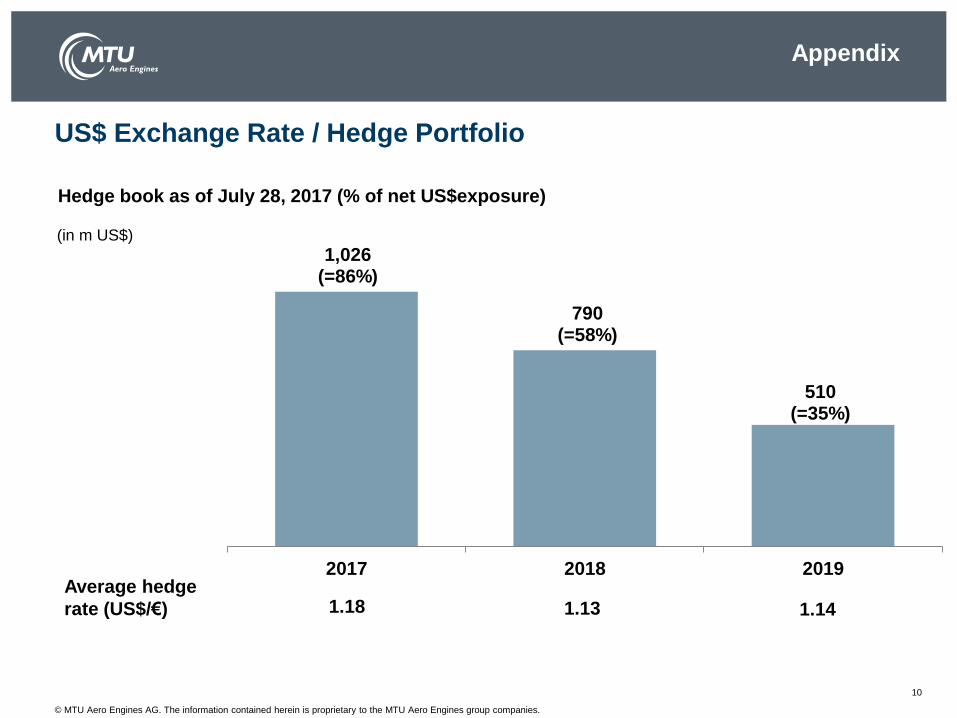
US$ Exchange Rate / Hedge Portfolio
Average hedge
rate (US$/€) 1.18 1.13
Hedge book as of July 28, 2017 (% of net US$exposure)
(in m US$)
1,026 (=86%)
790 (=58%)
510 (=35%)
2017 2018 2019
1.14
Appendix
© MTU Aero Engines AG. The information contained herein is proprietary to the MTU Aero Engines group companies.
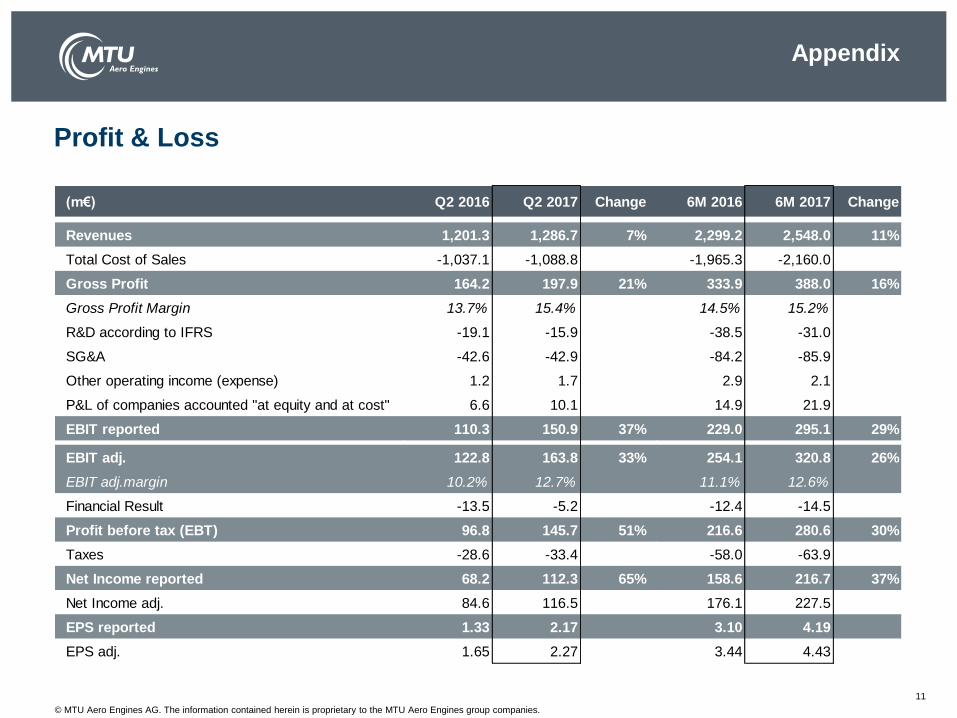
Profit & Loss
Appendix
11
(m€) Q2 2016 Q2 2017 Change 6M 2016 6M 2017 Change
Revenues 1,201.3 1,286.7 7% 2,299.2 2,548.0 11%
Total Cost of Sales -1,037.1 -1,088.8 -1,965.3 -2,160.0
Gross Profit 164.2 197.9 21% 333.9 388.0 16%
Gross Profit Margin 13.7% 15.4% 14.5% 15.2%
R&D according to IFRS -19.1 -15.9 -38.5 -31.0
SG&A -42.6 -42.9 -84.2 -85.9
Other operating income (expense) 1.2 1.7 2.9 2.1
P&L of companies accounted "at equity and at cost" 6.6 10.1 14.9 21.9
EBIT reported 110.3 150.9 37% 229.0 295.1 29%
EBIT adj. 122.8 163.8 33% 254.1 320.8 26%
EBIT adj.margin 10.2% 12.7% 11.1% 12.6%
Financial Result -13.5 -5.2 -12.4 -14.5
Profit before tax (EBT) 96.8 145.7 51% 216.6 280.6 30%
Taxes -28.6 -33.4 -58.0 -63.9
Net Income reported 68.2 112.3 65% 158.6 216.7 37%
Net Income adj. 84.6 116.5 176.1 227.5
EPS reported 1.33 2.17 3.10 4.19
EPS adj. 1.65 2.27 3.44 4.43
© MTU Aero Engines AG. The information contained herein is proprietary to the MTU Aero Engines group companies.
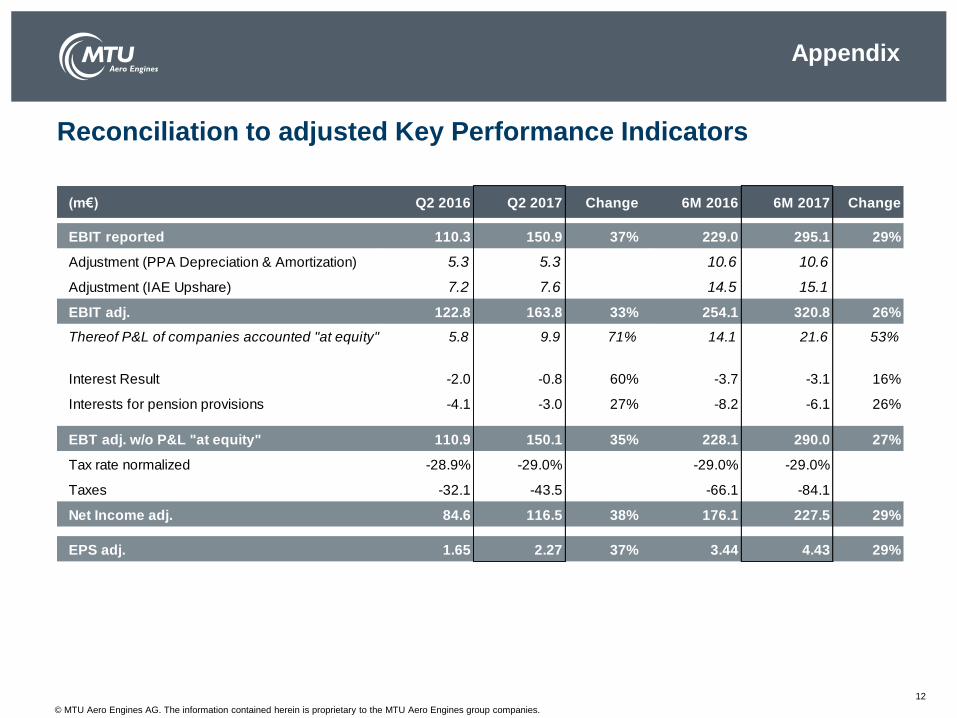
Reconciliation to adjusted Key Performance Indicators
Appendix
12
(m€) Q2 2016 Q2 2017 Change 6M 2016 6M 2017 Change
EBIT reported 110.3 150.9 37% 229.0 295.1 29%
Adjustment (PPA Depreciation & Amortization) 5.3 5.3 10.6 10.6
Adjustment (IAE Upshare) 7.2 7.6 14.5 15.1
EBIT adj. 122.8 163.8 33% 254.1 320.8 26%
Thereof P&L of companies accounted "at equity" 5.8 9.9 71% 14.1 21.6 53%
Interest Result -2.0 -0.8 60% -3.7 -3.1 16%
Interests for pension provisions -4.1 -3.0 27% -8.2 -6.1 26%
EBT adj. w/o P&L "at equity" 110.9 150.1 35% 228.1 290.0 27%
Tax rate normalized -28.9% -29.0% -29.0% -29.0%
Taxes -32.1 -43.5 -66.1 -84.1
Net Income adj. 84.6 116.5 38% 176.1 227.5 29%
EPS adj. 1.65 2.27 37% 3.44 4.43 29%
© MTU Aero Engines AG. The information contained herein is proprietary to the MTU Aero Engines group companies.
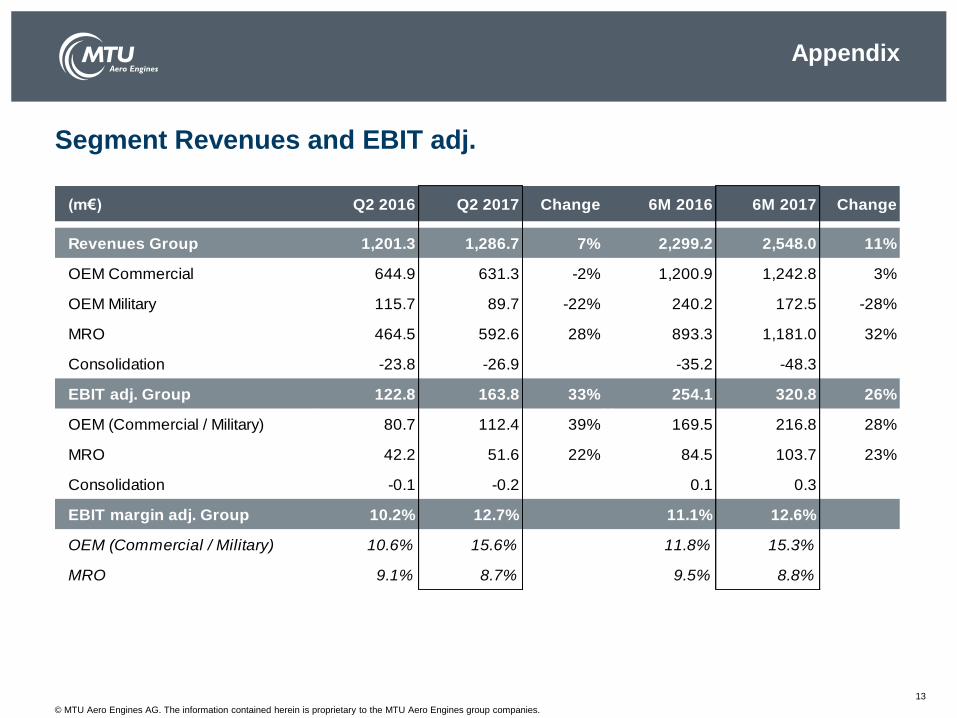
(m€) Q2 2016 Q2 2017 Change 6M 2016 6M 2017 Change
Revenues Group 1,201.3 1,286.7 7% 2,299.2 2,548.0 11%
OEM Commercial 644.9 631.3 -2% 1,200.9 1,242.8 3%
OEM Military 115.7 89.7 -22% 240.2 172.5 -28%
MRO 464.5 592.6 28% 893.3 1,181.0 32%
Consolidation -23.8 -26.9 -35.2 -48.3
EBIT adj. Group 122.8 163.8 33% 254.1 320.8 26%
OEM (Commercial / Military) 80.7 112.4 39% 169.5 216.8 28%
MRO 42.2 51.6 22% 84.5 103.7 23%
Consolidation -0.1 -0.2 0.1 0.3
EBIT margin adj. Group 10.2% 12.7% 11.1% 12.6%
OEM (Commercial / Military) 10.6% 15.6% 11.8% 15.3%
MRO 9.1% 8.7% 9.5% 8.8%
Segment Revenues and EBIT adj.
Appendix
13
© MTU Aero Engines AG. The information contained herein is proprietary to the MTU Aero Engines group companies.
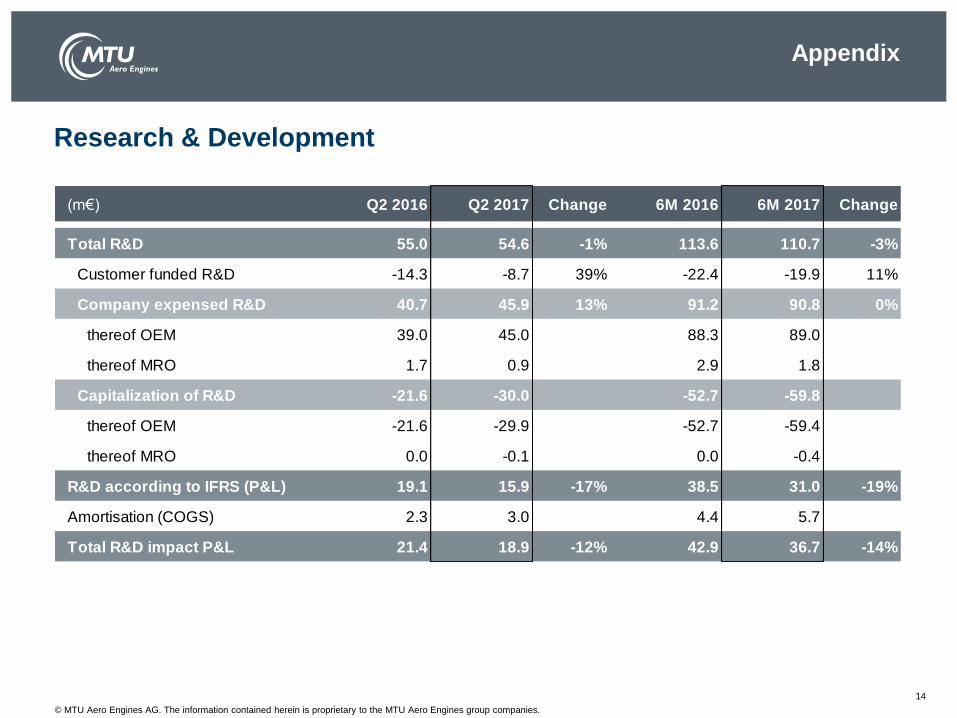
Research & Development
Appendix
14
(m€) Q2 2016 Q2 2017 Change 6M 2016 6M 2017 Change
Total R&D 55.0 54.6 -1% 113.6 110.7 -3%
Customer funded R&D -14.3 -8.7 39% -22.4 -19.9 11%
Company expensed R&D 40.7 45.9 13% 91.2 90.8 0%
thereof OEM 39.0 45.0 88.3 89.0
thereof MRO 1.7 0.9 2.9 1.8
Capitalization of R&D -21.6 -30.0 -52.7 -59.8
thereof OEM -21.6 -29.9 -52.7 -59.4
thereof MRO 0.0 -0.1 0.0 -0.4
R&D according to IFRS (P&L) 19.1 15.9 -17% 38.5 31.0 -19%
Amortisation (COGS) 2.3 3.0 4.4 5.7
Total R&D impact P&L 21.4 18.9 -12% 42.9 36.7 -14%
© MTU Aero Engines AG. The information contained herein is proprietary to the MTU Aero Engines group companies.
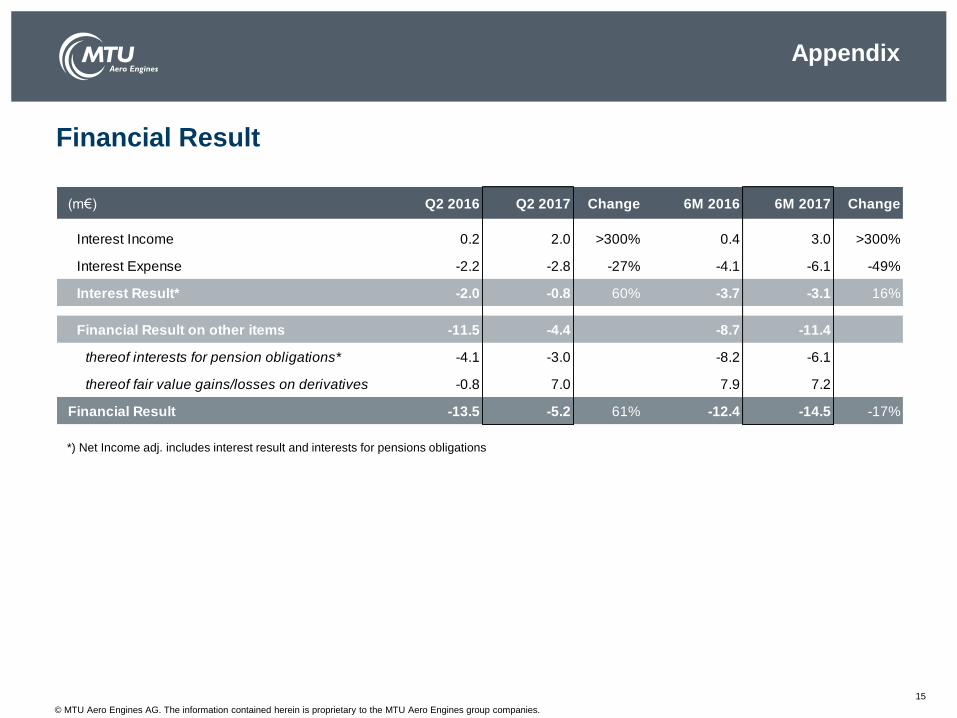
Financial Result
Appendix
15
(m€) Q2 2016 Q2 2017 Change 6M 2016 6M 2017 Change
Interest Income 0.2 2.0 >300% 0.4 3.0 >300%
Interest Expense -2.2 -2.8 -27% -4.1 -6.1 -49%
Interest Result* -2.0 -0.8 60% -3.7 -3.1 16%
Financial Result on other items -11.5 -4.4 -8.7 -11.4
thereof interests for pension obligations* -4.1 -3.0 -8.2 -6.1
thereof fair value gains/losses on derivatives -0.8 7.0 7.9 7.2
Financial Result -13.5 -5.2 61% -12.4 -14.5 -17%
*) Net Income adj. includes interest result and interests for pensions obligations
© MTU Aero Engines AG. The information contained herein is proprietary to the MTU Aero Engines group companies.
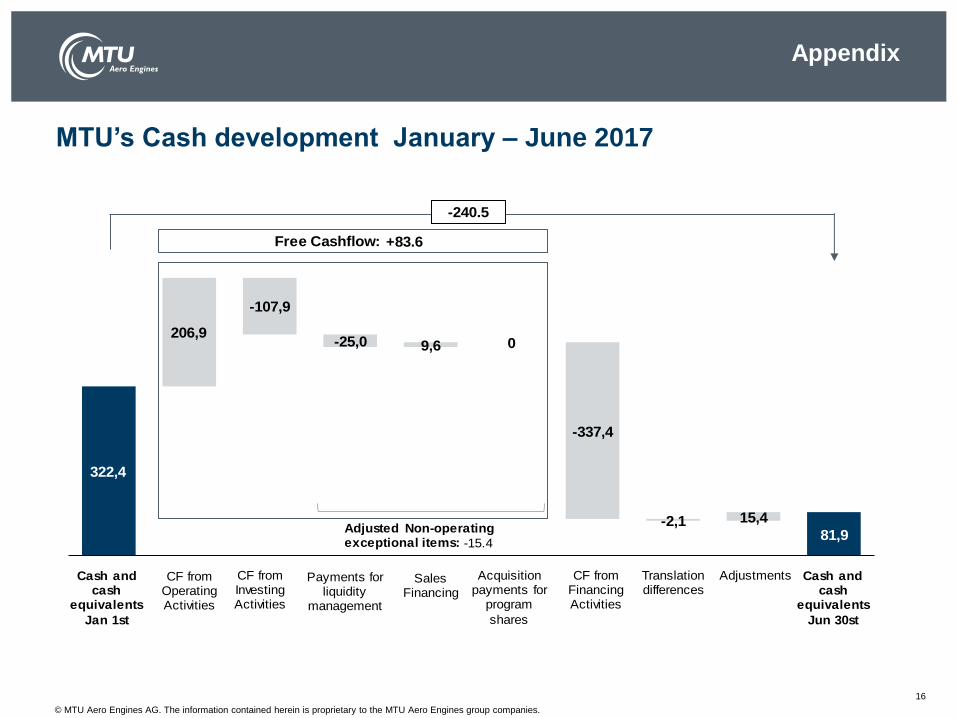
322,4
206,9
-107,9
-25,0 9,6 0
-337,4
-2,1 15,4
81,9
CF from Operating Activities
CF from Investing Activities
Payments for liquidity
management
Sales Financing
Cash and cash
equivalents
Jun 30st
Cash and cash
equivalents
Jan 1st
-240.5
Acquisition payments for
program
shares
CF from Financing Activities
Translation differences
Adjustments
+83.6Free Cashflow:
Adjusted Non-operating exceptional items: -15.4
MTU’s Cash development January – June 2017
Appendix
16
© MTU Aero Engines AG. The information contained herein is proprietary to the MTU Aero Engines group companies.
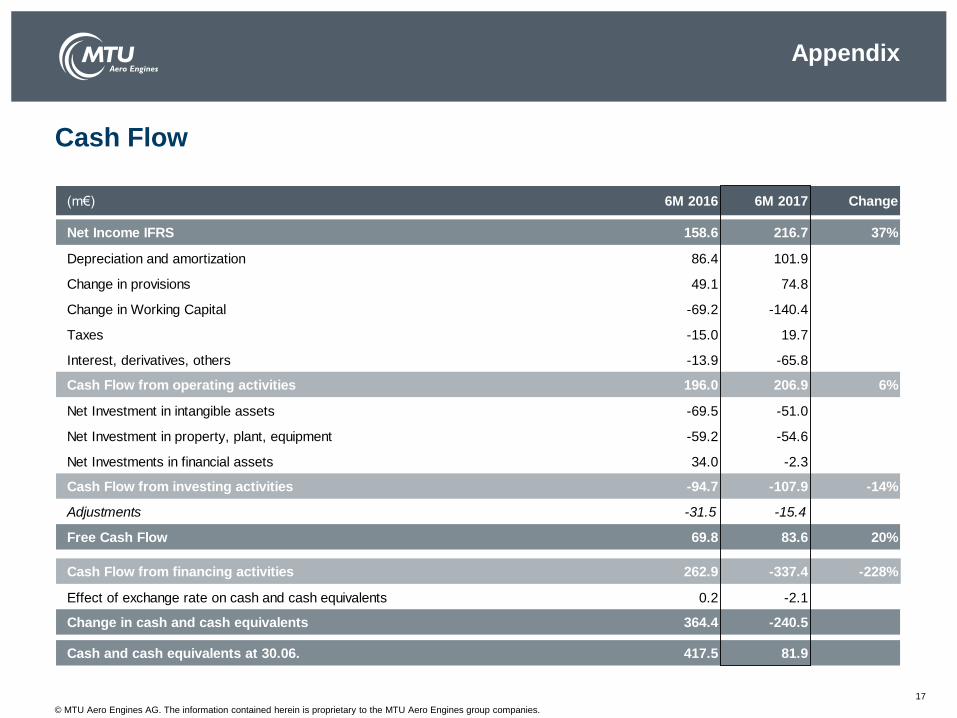
Cash Flow
Appendix
17
(m€) 6M 2016 6M 2017 Change
Net Income IFRS 158.6 216.7 37%
Depreciation and amortization 86.4 101.9
Change in provisions 49.1 74.8
Change in Working Capital -69.2 -140.4
Taxes -15.0 19.7
Interest, derivatives, others -13.9 -65.8
Cash Flow from operating activities 196.0 206.9 6%
Net Investment in intangible assets -69.5 -51.0
Net Investment in property, plant, equipment -59.2 -54.6
Net Investments in financial assets 34.0 -2.3
Cash Flow from investing activities -94.7 -107.9 -14%
Adjustments -31.5 -15.4
Free Cash Flow 69.8 83.6 20%
Cash Flow from financing activities 262.9 -337.4 -228%
Effect of exchange rate on cash and cash equivalents 0.2 -2.1
Change in cash and cash equivalents 364.4 -240.5
Cash and cash equivalents at 30.06. 417.5 81.9
© MTU Aero Engines AG. The information contained herein is proprietary to the MTU Aero Engines group companies.
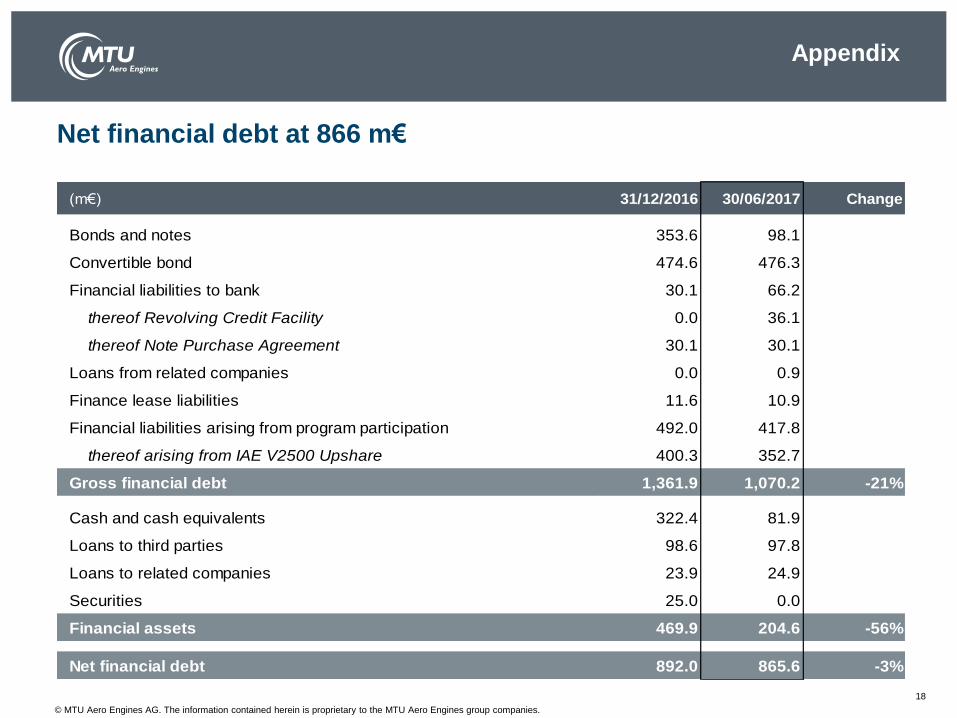
Net financial debt at 866 m€
Appendix
18
(m€) 31/12/2016 30/06/2017 Change
Bonds and notes 353.6 98.1
Convertible bond 474.6 476.3
Financial liabilities to bank 30.1 66.2
thereof Revolving Credit Facility 0.0 36.1
thereof Note Purchase Agreement 30.1 30.1
Loans from related companies 0.0 0.9
Finance lease liabilities 11.6 10.9
Financial liabilities arising from program participation 492.0 417.8
thereof arising from IAE V2500 Upshare 400.3 352.7
Gross financial debt 1,361.9 1,070.2 -21%
Cash and cash equivalents 322.4 81.9
Loans to third parties 98.6 97.8
Loans to related companies 23.9 24.9
Securities 25.0 0.0
Financial assets 469.9 204.6 -56%
Net financial debt 892.0 865.6 -3%
© MTU Aero Engines AG. The information contained herein is proprietary to the MTU Aero Engines group companies.
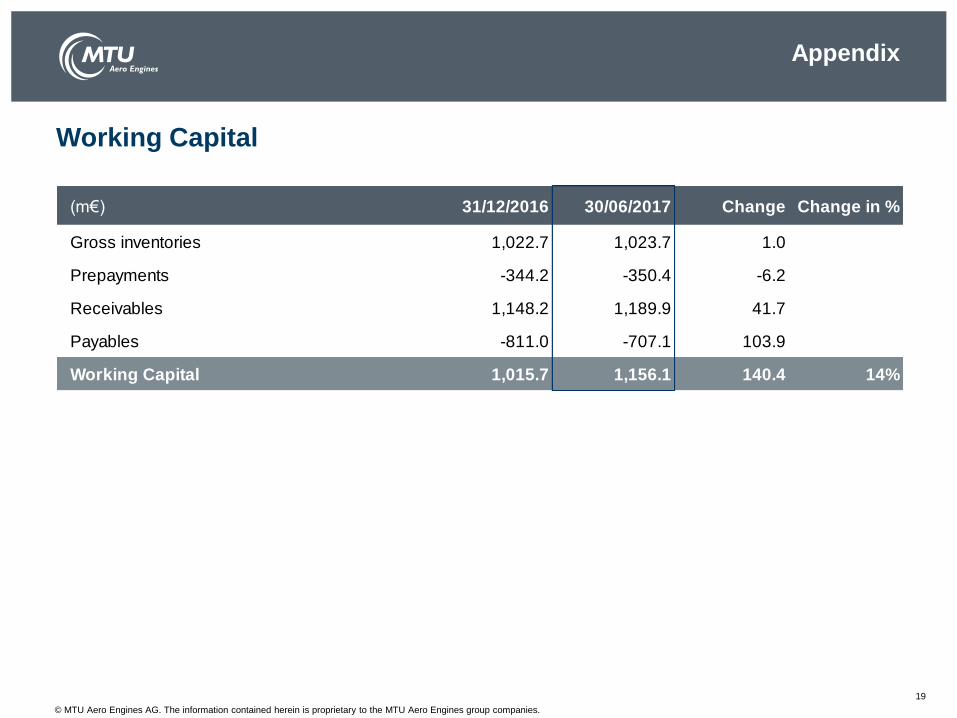
(m€) 31/12/2016 30/06/2017 Change Change in %
Gross inventories 1,022.7 1,023.7 1.0
Prepayments -344.2 -350.4 -6.2
Receivables 1,148.2 1,189.9 41.7
Payables -811.0 -707.1 103.9
Working Capital 1,015.7 1,156.1 140.4 14%
Working Capital
Appendix
19
© MTU Aero Engines AG. The information contained herein is proprietary to the MTU Aero Engines group companies.
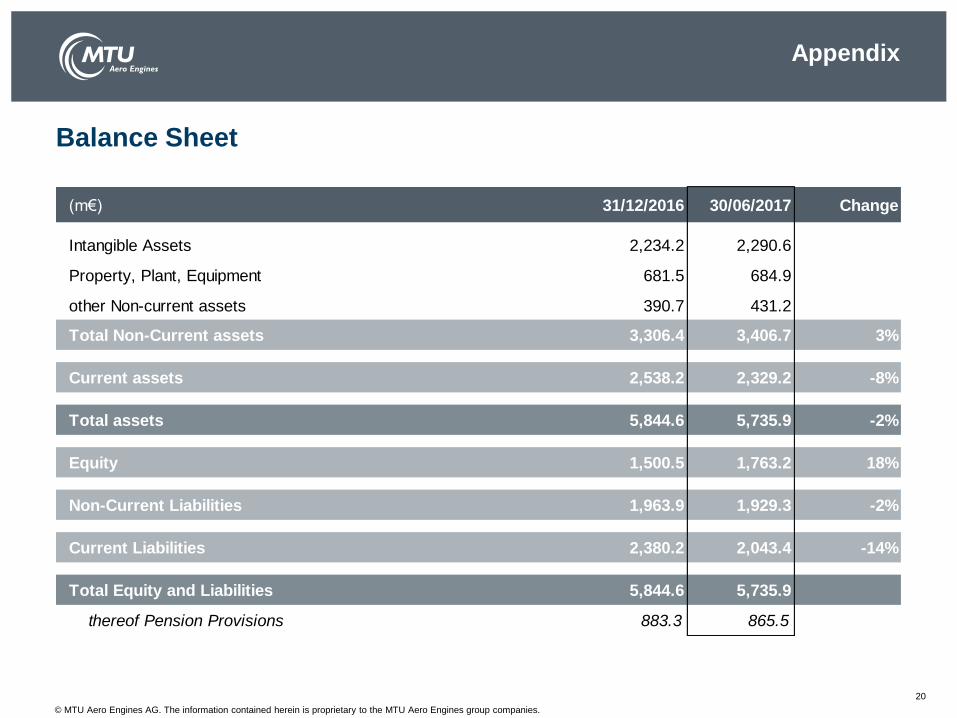
Balance Sheet
Appendix
20
(m€) 31/12/2016 30/06/2017 Change
Intangible Assets 2,234.2 2,290.6
Property, Plant, Equipment 681.5 684.9
other Non-current assets 390.7 431.2
Total Non-Current assets 3,306.4 3,406.7 3%
Current assets 2,538.2 2,329.2 -8%
Total assets 5,844.6 5,735.9 -2%
Equity 1,500.5 1,763.2 18%
Non-Current Liabilities 1,963.9 1,929.3 -2%
Current Liabilities 2,380.2 2,043.4 -14%
Total Equity and Liabilities 5,844.6 5,735.9
thereof Pension Provisions 883.3 865.5
© MTU Aero Engines AG. The information contained herein is proprietary to the MTU Aero Engines group companies.
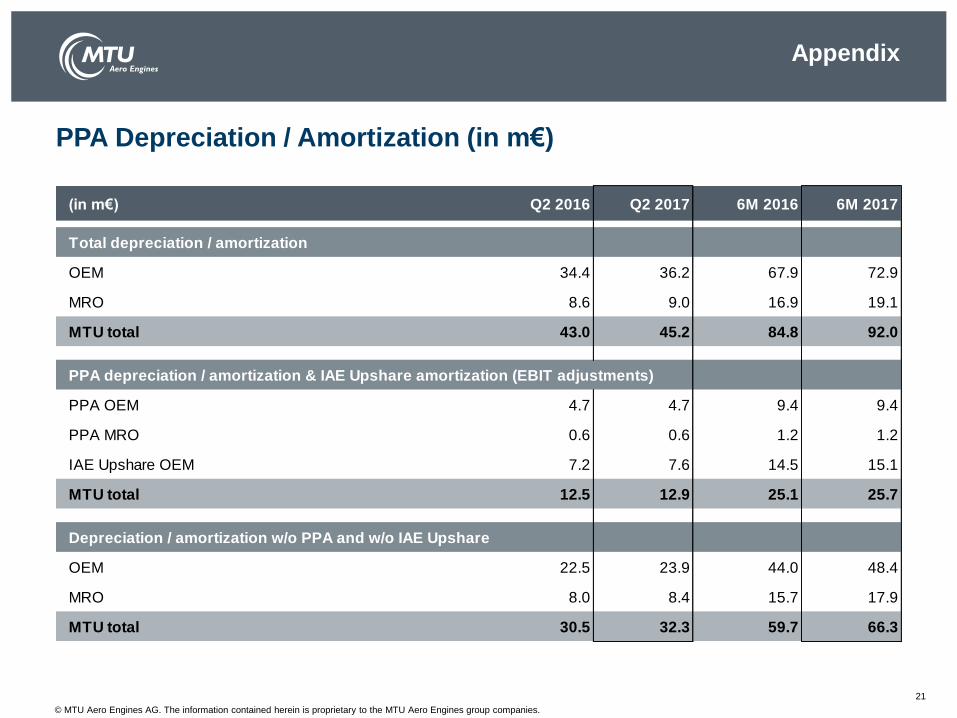
(in m€) Q2 2016 Q2 2017 6M 2016 6M 2017
Total depreciation / amortization
OEM 34.4 36.2 67.9 72.9
MRO 8.6 9.0 16.9 19.1
MTU total 43.0 45.2 84.8 92.0
PPA depreciation / amortization & IAE Upshare amortization (EBIT adjustments)
PPA OEM 4.7 4.7 9.4 9.4
PPA MRO 0.6 0.6 1.2 1.2
IAE Upshare OEM 7.2 7.6 14.5 15.1
MTU total 12.5 12.9 25.1 25.7
Depreciation / amortization w/o PPA and w/o IAE Upshare
OEM 22.5 23.9 44.0 48.4
MRO 8.0 8.4 15.7 17.9
MTU total 30.5 32.3 59.7 66.3
PPA Depreciation / Amortization (in m€)
Appendix
21
© MTU Aero Engines AG. The information contained herein is proprietary to the MTU Aero Engines group companies.
22
Certain of the statements contained herein may be statements of future expectations and other forward-looking statements that are based on management’s current views and assumptions and involve known and unknown risks and uncertainties that could cause actual results, performance or events to differ materially from those expressed or implied in such statements. In addition to statements that are forward-looking by reason of context, the words “may,” “will,” “should,” “expect,” “plan,” “intend,” “anticipate,” “forecast,” “believe,” “estimate,” “predict,” “potential,” or “continue” and similar expressions identify forward-looking statements.
Actual results, performance or events may differ materially from those in such statements due to, without limitation, (i) competition from other companies in MTU’s industry and MTU’s ability to retain or increase its market share, (ii) MTU’s reliance on certain customers for its sales, (iii) risks related to MTU’s participation in consortia and risk and revenue sharing agreements for new aero engine programs, (iv) the impact of non-compete provisions included in certain of MTU’s contracts, (v) the impact of a decline in German or other European defense budgets or changes in funding priorities for military aircraft, (vi) risks associated with government funding, (vii) the impact of significant disruptions in MTU’s supply from key vendors, (viii) the continued success of MTU’s research and development initiatives, (ix) currency exchange rate fluctuations, (x) changes in tax legislation, (xi) the impact of any product liability claims, (xii) MTU’s ability to comply with regulations affecting its business and its ability to respond to changes in the regulatory environment, (xiii) the cyclicality of the airline industry and the current financial difficulties of commercial airlines, (xiv) our substantial leverage and (xv) general local and global economic conditions. Many of these factors may be more likely to occur, or more pronounced, as a result of terrorist activities and their consequences.
The company assumes no obligation to update any forward-looking statement.
Any securities referred to herein have not been and will not be registered under the U.S. Securities Act of 1933, as amended (the “Securities Act”), and may not be offered or sold without registration thereunder or pursuant to an available exemption therefrom. Any public offering of securities of MTU Aero Engines to be made in the United States would have to be made by means of a prospectus that would be obtainable from MTU Aero Engines and would contain detailed information about the issuer of the securities and its management, as well as financial statements.
Neither this document nor the information contained herein constitutes an offer to sell or the solicitation of an offer to buy any securities.
These materials do not constitute an offer of securities for sale in the United States; the securities may not be offered or sold in the United States absent registration or an exemption from registration.
No money, securities or other consideration is being solicited, and, if sent in response to the information contained herein, will not be accepted.
Cautionary Note Regarding Forward-Looking Statements
© MTU Aero Engines AG. The information contained herein is proprietary to the MTU Aero Engines group companies.
This document contains proprietary information of the MTU Aero Engines AG group
companies. The document and its contents shall not be copied or disclosed to any third
party or used for any purpose other than that for which it is provided, without the prior
written agreement of MTU Aero Engines AG.
Proprietary Notice
23