motor gasoline - michigan gasoline demand gasoline demand in michigan is projected to be 4.57...
TRANSCRIPT

4
Motor Gasoline Demand Gasoline demand in Michigan is projected to be 4.57 billion gallons for 2017, a slight increase of 0.2 percent from a year ago. This will be the fifth straight year of gasoline consumption growth if summer demand patterns continue as expected. Since 2005, gasoline consumption had been generally on a downward trend due to increases in fleet-wide fuel efficiency and rising fuel costs, but has been increasing since 2013. The average sales weighted fuel efficiency for the 2016 model year was 25.12 miles per gallon, just edging out the 25.08 miles per gallon average in 2015.1 While these efficiency gains appear to be leveling off, relatively low gasoline prices and improved general economic conditions in the state have helped to give gasoline sales a boost.2 Regionally, demand is also expected to increase, albeit only 0.1 percent.
Supply Nationally, imports of total gasoline to the U.S. for 2017 are down compared to the same time period in 2016. However, for the week ending May 12, 2017, 696 thousand barrels per day of total gasoline were imported into the US compared to 691 thousand barrels per day for the same week in 2016. The bulk of the imported gasoline is destined for the East Coast because of capacity constraints on product pipelines serving the region from the Gulf Coast and the high cost of coastal shipments between U.S. ports. National gasoline inventories are currently near the top of the five-year range for this time of year. For the week ending May 12, U.S. total gasoline inventories stood at 240.7 million barrels (25.9 days of supply), a one day increase in supply levels compared to the same date last year. Regional inventories are at 53.5 million barrels, nearly one million barrels higher than last year. These inventories should help moderate price increases as we enter the summer driving season.
1 UM Transportation Research Institute: http://www.umich.edu/~umtriswt/EDI_sales-weighted-mpg.html 2 Bureau of Labor Statistics: https://data.bls.gov/timeseries/LASST260000000000003

5
Based on the most recent available data, the U.S. refinery utilization rate for February 2017, was 85 percent, 3.3 percentage points lower than the same time last year, and 4.8 percent lower than the 2016 average of 89.8 percent. As refineries begin maintenance and gear up for summer driving demand, this rate is likely to increase. Price According to AAA, the average price for a gallon of regular unleaded gasoline in Michigan on May 23, 2017 was $2.47, up from $2.38 a year ago. This rise in price follows the increasing average costs of crude oil which started this past fall, largely in response to productions curtailments by members of the Organization of the Petroleum Exporting Countries (OPEC). The U.S. price of regular gasoline averaged $2.14/gallon in 2016, the lowest average since 2004. Prices remained below $2.00/gallon in 2016 until the month of April, when demand usually picks up as the summer driving season approaches. Prices slowly rose throughout the remainder of 2016 and have since reached a national average of $2.39/gal for the week of May 22, 2017. The upward price trend has followed a recent uptick in crude oil prices, unexpected infrastructure outages, and the beginning of the seasonal refinery maintenance schedule. The EIA projects U.S. gasoline prices to average $2.39/gallon during the summer driving season (April-September), compared to $2.23/gallon last summer. According to the EIA, U.S. gasoline prices are forecasted to average $2.34/gallon for all of 2017, and if realized, the average annual household expenditure on gasoline would increase $160 compared to 2016.
Passage of House Bill 4738, Public Act 176 of 2015, amended the Motor Fuel Tax Act to increase motor fuel taxes. Effective January 1, 2017, gasoline tax increased from 19 cents per gallon to 26.3 cents per gallon. Gasoline tax rates will be adjusted annually based on consumer inflation (U.S. Consumer Price Index), with increases capped to 5% per year, effective January 1, 2022.

6
Michigan Gasoline Sales
Michigan Gasoline Sales Projection (Millions of Gallons)
NOTE: These projections are based on EIA forecasts of real gasoline prices.
SOURCE: Historical data - Energy Information Administration, U.S. Department of Energy. PROJECTIONS: Energy Security Section, MAE
Total Historical
All Grades (prior year) % Change
Historical 2014 Total 4,320 4,259 1.4%
2015 Total 4,486 4,320 3.8%
2016 Total 4,565 4,486 1.8%
2017 January 357 361 -1.0%
Projection February 343 352 -2.4%
March 375 369 1.7%
April 369 367 0.4%
May 395 391 0.8%
June 388 389 -0.4%
July 402 400 0.4%
August 401 399 0.4%
September 380 383 -0.8%
October 399 396 0.9%
November 377 374 0.7%
December 387 383 0.8%
2017 Total 4,572 4,565 0.2%
7
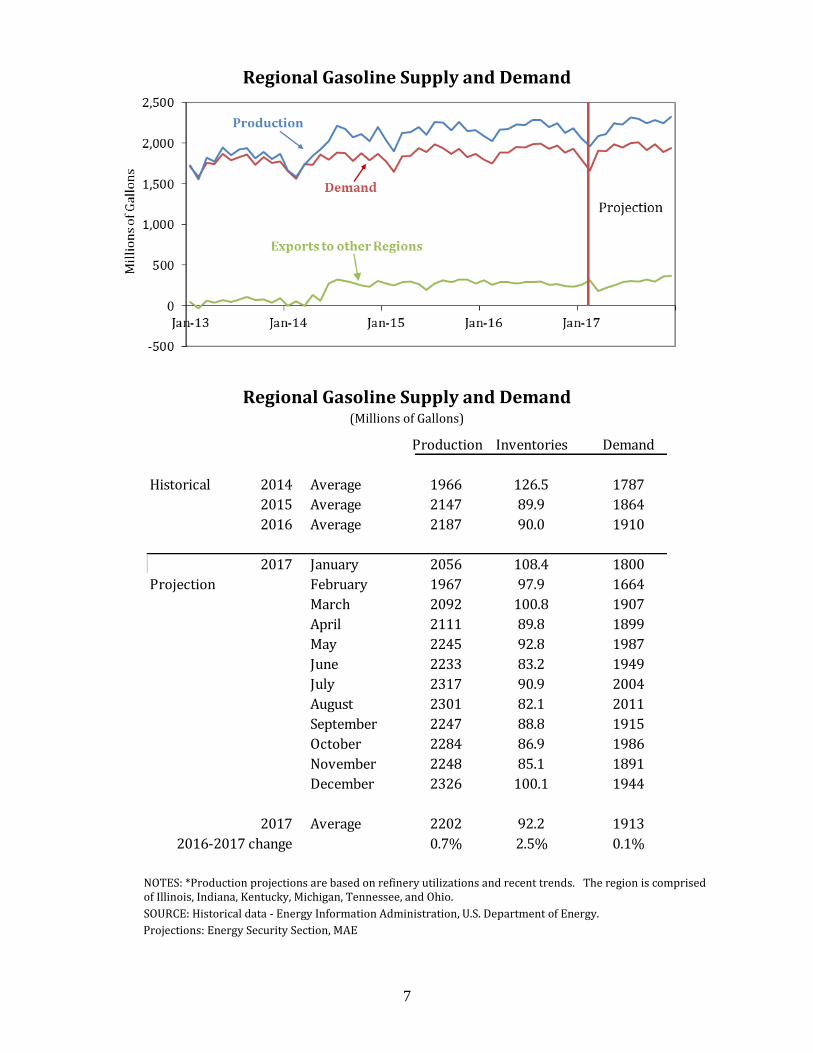
Regional Gasoline Supply and Demand
Regional Gasoline Supply and Demand (Millions of Gallons)
NOTES: *Production projections are based on refinery utilizations and recent trends. The region is comprised of Illinois, Indiana, Kentucky, Michigan, Tennessee, and Ohio.
SOURCE: Historical data - Energy Information Administration, U.S. Department of Energy.
Projections: Energy Security Section, MAE
Production Inventories Demand
Historical 2014 Average 1966 126.5 1787
2015 Average 2147 89.9 1864
2016 Average 2187 90.0 1910
2017 January 2056 108.4 1800
Projection February 1967 97.9 1664
March 2092 100.8 1907
April 2111 89.8 1899
May 2245 92.8 1987
June 2233 83.2 1949
July 2317 90.9 2004
August 2301 82.1 2011
September 2247 88.8 1915
October 2284 86.9 1986
November 2248 85.1 1891
December 2326 100.1 1944
2017 Average 2202 92.2 1913
2016-2017 change 0.7% 2.5% 0.1%

8
Michigan/Midwest Outlook
Michigan consumed an estimated 169.2 million barrels of petroleum products in 2015, the majority of which were motor fuels, such as gasoline and diesel fuel, refined from crude oil. Michigan produces some crude oil in-state, about 5.7 million barrels in 2016, however approximately 96 percent of the petroleum consumed in Michigan is imported from neighboring states and Western Canada. This supply arrives via interstate pipeline as both unrefined crude oil and refined petroleum products. The crude is transported and refined in Southeast Michigan at the Marathon Refinery, which processes approximately 132,000 barrels of crude oil per day (b/d) into gasoline, diesel fuel, petroleum coke, and asphalt. Refineries in neighboring states such as Illinois and Ohio meet the remainder of Michigan’s petroleum needs; their products are imported via pipeline, rail, and truck.
Crude oil stocks in the Midwest remain high, reaching 158 million barrels on April 28, 2017, a 3.5 percent increase over levels seen at this time last year. Absent unexpected infrastructure or supply problems, it is expected that the price and supply of petroleum products will be stable for the remainder of 2017.
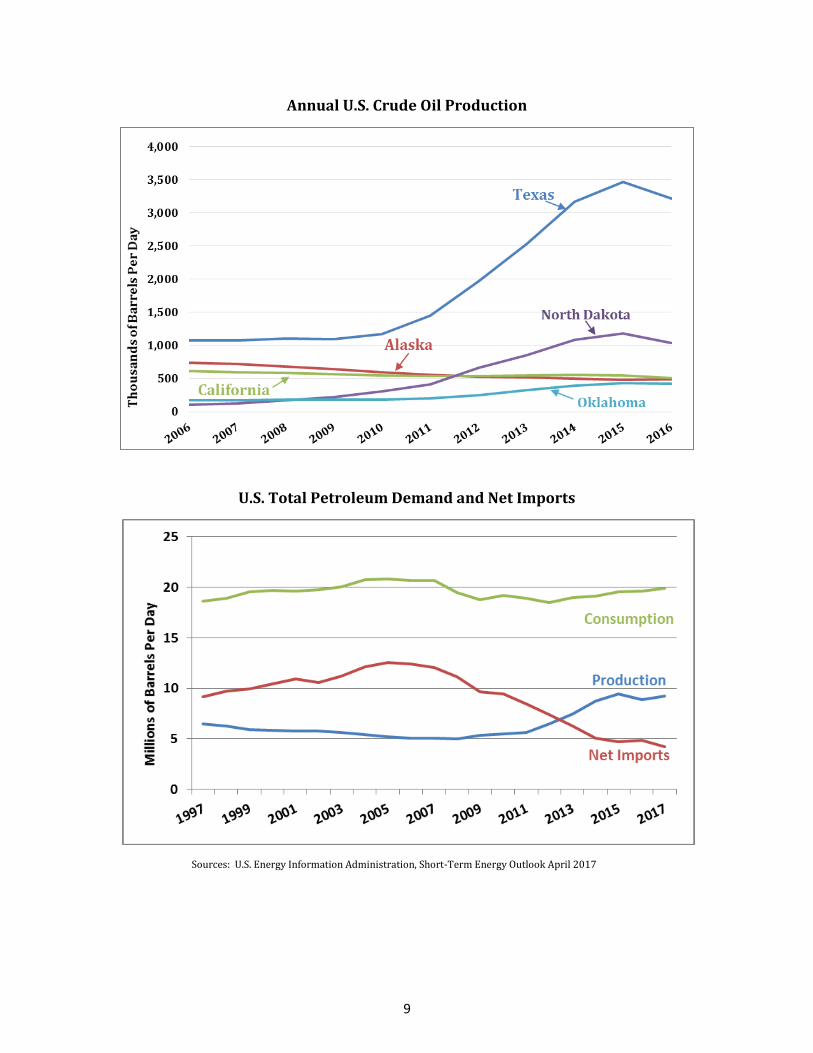
U.S. Outlook As discussed in previous appraisals, the lower cost of crude oil since late 2014 led to a dampening of U.S. production capacity as evidenced by decreased capital investments and active rig counts in the industry. EIA’s April Short Term Energy Outlook (STEO), suggests that the recent modest increases seen in the price of crude oil are contributing to a reversal of that trend. Capital investment spending increased by 72 percent in 2016, earnings are up, and the number of active oil rigs is also increasing. U.S. crude oil production averaged 8.9 million b/d in 2016 and is expected to increase to 9.2 million b/d in 2017 and to 9.9 million b/d in 2018. U.S. crude oil stocks have been above the five-year average since December 2014. As of April 28, 2017 the U.S. had 530 million barrels in inventory, about 3 percent above this time last year.
Petroleum
9
Annual U.S. Crude Oil Production
U.S. Total Petroleum Demand and Net Imports
Sources: U.S. Energy Information Administration, Short-Term Energy Outlook April 2017
10
World Outlook
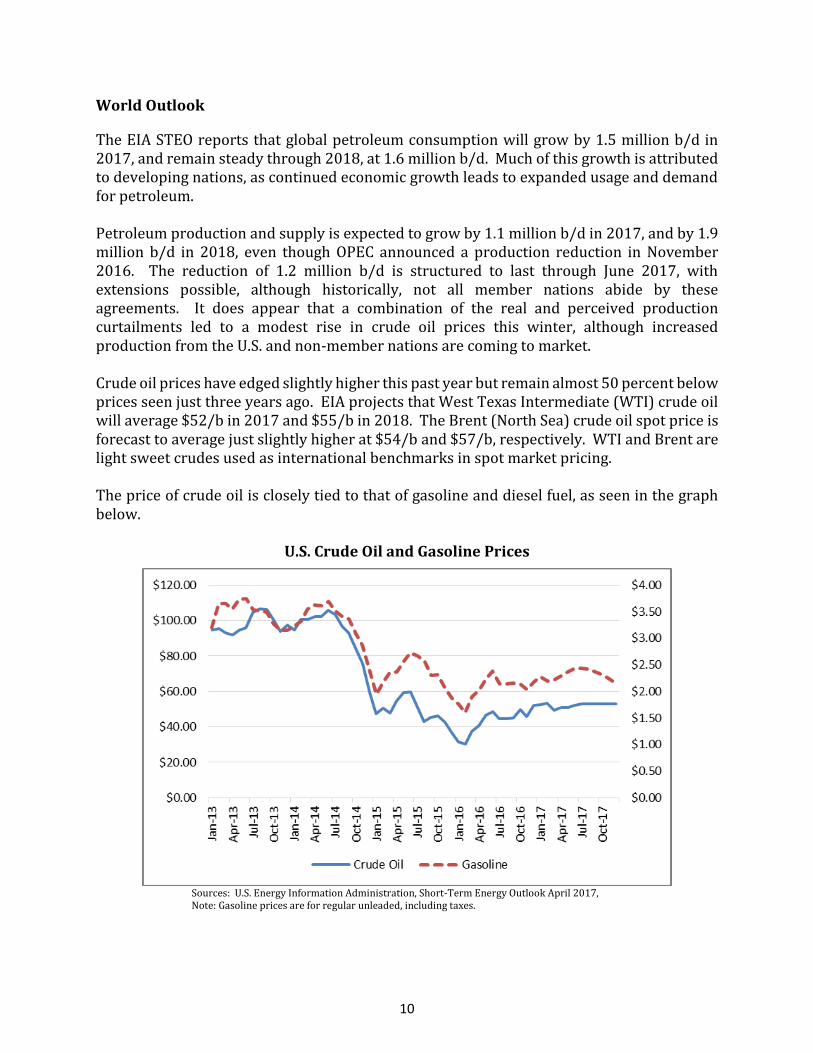
The EIA STEO reports that global petroleum consumption will grow by 1.5 million b/d in 2017, and remain steady through 2018, at 1.6 million b/d. Much of this growth is attributed to developing nations, as continued economic growth leads to expanded usage and demand for petroleum. Petroleum production and supply is expected to grow by 1.1 million b/d in 2017, and by 1.9 million b/d in 2018, even though OPEC announced a production reduction in November 2016. The reduction of 1.2 million b/d is structured to last through June 2017, with extensions possible, although historically, not all member nations abide by these agreements. It does appear that a combination of the real and perceived production curtailments led to a modest rise in crude oil prices this winter, although increased production from the U.S. and non-member nations are coming to market. Crude oil prices have edged slightly higher this past year but remain almost 50 percent below prices seen just three years ago. EIA projects that West Texas Intermediate (WTI) crude oil will average $52/b in 2017 and $55/b in 2018. The Brent (North Sea) crude oil spot price is forecast to average just slightly higher at $54/b and $57/b, respectively. WTI and Brent are light sweet crudes used as international benchmarks in spot market pricing. The price of crude oil is closely tied to that of gasoline and diesel fuel, as seen in the graph below.
U.S. Crude Oil and Gasoline Prices
Sources: U.S. Energy Information Administration, Short-Term Energy Outlook April 2017, Note: Gasoline prices are for regular unleaded, including taxes.

17
Distillates
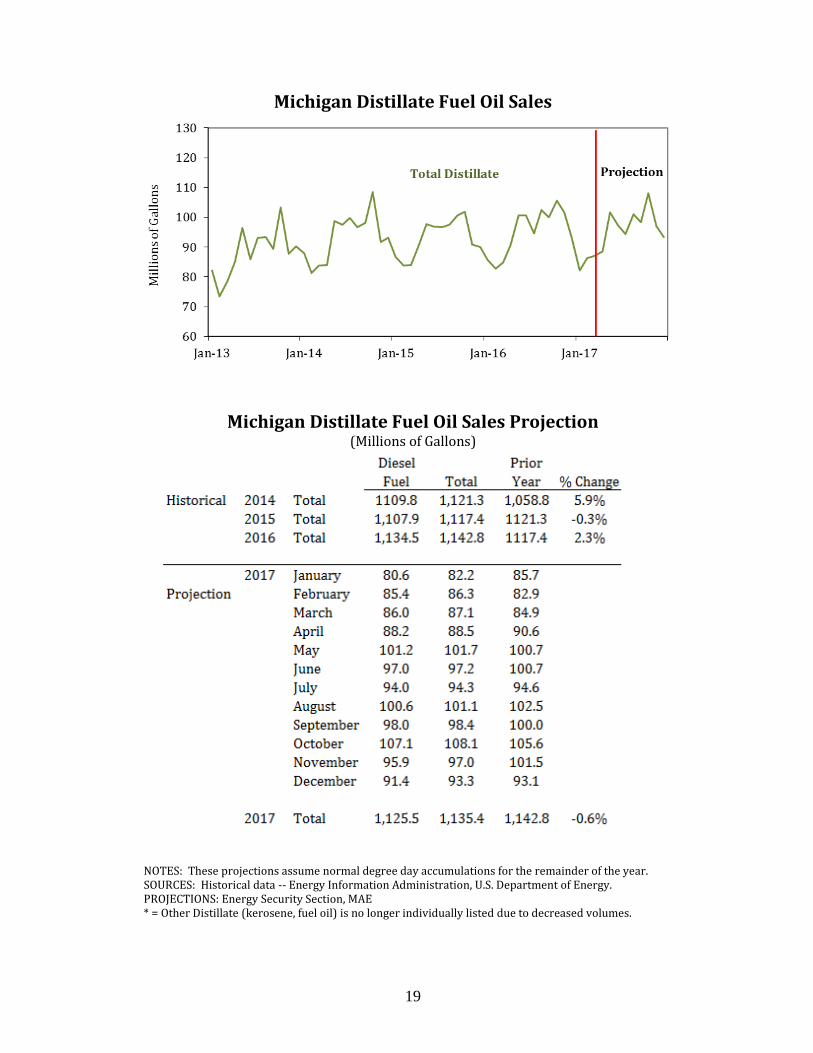
Demand Distillate sales in Michigan are projected to decrease by 0.6 percent to 1,135 million gallons in 2017, following an increase of 2.3 percent in 2016. Diesel fuel remains the prime component of distillate demand, over 98 percent, with the majority being used for transportation by highway trucks and by rail for the industrial sector. Although industrial production is expected to increase throughout 2017, the EIA is projecting a steady rise in diesel fuel prices for 2017, which will likely cause a small drop in distillate demand. Distillate usage in the home heating markets (No. 2 Heating Oil) also took a dip this season, reflecting warmer than normal 2016-17 winter season temperatures and increased heating oil prices. This past heating season (October-March) was 13 percent warmer than historical averages. The predictive model used for distillate demand assumes normal weather conditions and uses projections for industrial production and diesel prices, therefore any significant departures from these projections has the potential to change distillate demand figures.
Supply In 2016, distillate fuel production averaged 4.8 million barrels per day with no signs of slowing down entering 2017. As of the week ending May 12, 2017, distillate production was at 5.04 million barrels per day. While domestic demand has been largely flat or with only modest increases, international demand has been steadily growing and has urged U.S. refiners to continue targeting export markets. U.S. exports of distillate fuel oil averaged a record high 1.19 million barrels per day in 2016. In the past year, U.S distillate inventories have remained well above the five-year average and as of May 12, 2017 stood at 146.8 million barrels, down from 152 million barrels a year ago. Distillate stocks are expected to meet demand and exports of distillate fuels continues to be robust, reaching a record high of 1.19 million barrels/day in 2016. In the graph below, net exports can be seen reaching historic highs in 2016.

18
Price According to the EIA, on‐highway diesel fuel retail prices, which averaged $2.31/gallon in 2016, are projected to rise to an average $2.69/gallon in 2017. For the week of May 15, the average Midwest price of $2.47/gallon was $0.20 higher than last year, and 7 cents below the U.S. average. According to the AAA Fuel Gauge Report; the Michigan on‐highway retail diesel fuel price as of May 23rd was $2.54/gallon, $0.21 (9 percent) higher than last year. Michigan residential heating oil prices averaged $2.19/gallon (excluding sales tax) on March 27, 2017, 31 cents higher than the same time last year. The 2016/2017 heating season began with residential heating oil prices at a price of $2.16/gallon (Oct. 3, 2016). Prices fell during the early weeks of the season, bottoming out at $2.00 per gallon near the end of November before steadily increasing to a season high of $2.29 per gallon at the start of 2017. Sufficient supplies along with moderate winter weather conditions prevented heating oil prices from experiencing much volatility.
Passage of House Bill 4738, Public Act 176 of 2015, amended the Motor Fuel Tax Act to increase motor fuel taxes. Effective January 1, 2017, tax on diesel increased from 15 cents per gallon to 26.3 cents per gallon. Diesel tax rates will be adjusted annually based on consumer inflation (U.S. Consumer Price Index), with increases capped to 5% per year, effective January 1, 2022.
19
Michigan Distillate Fuel Oil Sales
Michigan Distillate Fuel Oil Sales Projection (Millions of Gallons)
NOTES: These projections assume normal degree day accumulations for the remainder of the year. SOURCES: Historical data -- Energy Information Administration, U.S. Department of Energy. PROJECTIONS: Energy Security Section, MAE * = Other Distillate (kerosene, fuel oil) is no longer individually listed due to decreased volumes.
20
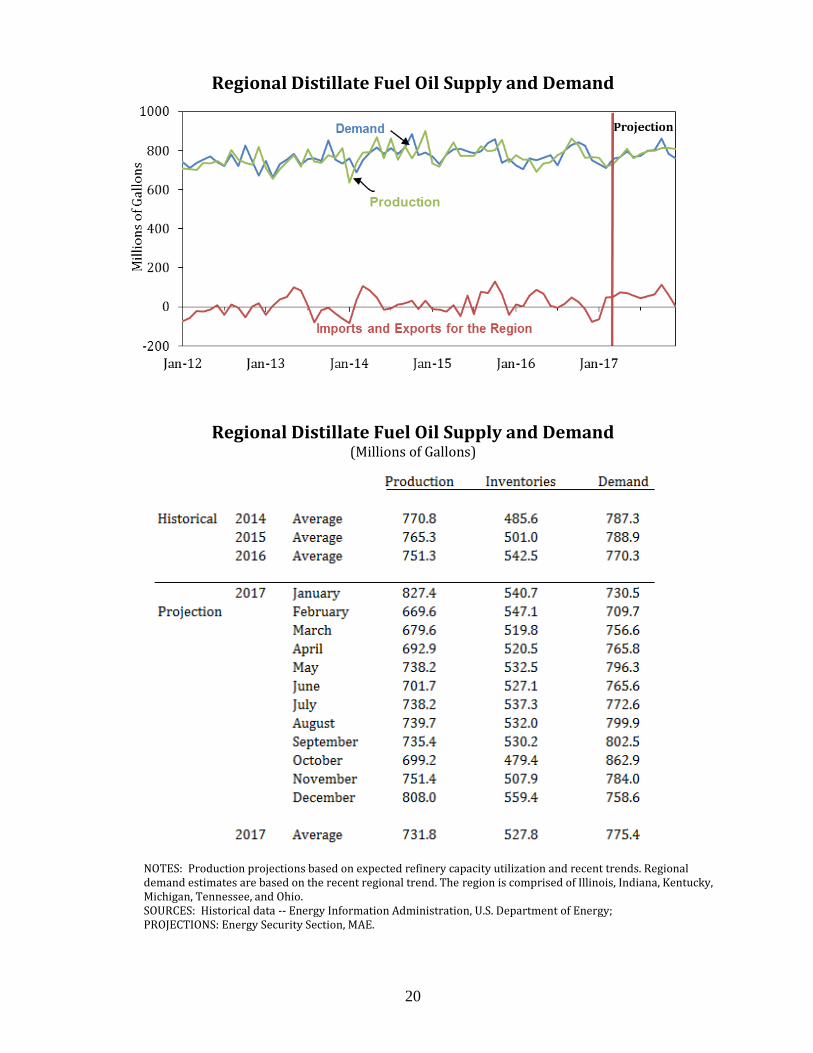
Regional Distillate Fuel Oil Supply and Demand
Regional Distillate Fuel Oil Supply and Demand
(Millions of Gallons)
NOTES: Production projections based on expected refinery capacity utilization and recent trends. Regional demand estimates are based on the recent regional trend. The region is comprised of Illinois, Indiana, Kentucky, Michigan, Tennessee, and Ohio. SOURCES: Historical data -- Energy Information Administration, U.S. Department of Energy; PROJECTIONS: Energy Security Section, MAE.