mortality prediction of rats in acute hemorrhagic shock using machine learning techniques
TRANSCRIPT
ORIGINAL ARTICLE
Mortality prediction of rats in acute hemorrhagicshock using machine learning techniques
Kyung-Ah Kim • Joon Yul Choi • Tae Keun Yoo •
Sung Kean Kim • KilSoo Chung • Deok Won Kim
Received: 29 January 2013 / Accepted: 8 June 2013 / Published online: 23 June 2013
� International Federation for Medical and Biological Engineering 2013
Abstract This study sought to determine a mortality
prediction model that could be used for triage in the setting
of acute hemorrhage from trauma. To achieve this aim,
various machine learning techniques were applied using
the rat model in acute hemorrhage. Thirty-six anesthetized
rats were randomized into three groups according to the
volume of controlled blood loss. Measurements included
heart rate (HR), systolic and diastolic blood pressures (SBP
and DBP), mean arterial pressure, pulse pressure, respira-
tory rate, temperature, blood lactate concentration (LC),
peripheral perfusion (PP), shock index (SI, SI = HR/SBP),
and a new hemorrhage-induced severity index (NI,
NI = LC/PP). NI was suggested as one of the good can-
didates for mortality prediction variable in our previous
study. We constructed mortality prediction models with
logistic regression (LR), artificial neural networks (ANN),
random forest (RF), and support vector machines (SVM)
with variable selection. The SVM model showed better
sensitivity (1.000) and area under curve (0.972) than the
LR, ANN, and RF models for mortality prediction. The
important variables selected by the SVM were NI and LC.
The SVM model may be very helpful to first responders
who need to make accurate triage decisions and rapidly
treat hemorrhagic patients in cases of trauma.
Keywords Hemorrhagic shock � Rat � Mortality �Machine learning � Support vector machine
1 Introduction
The World Health Organization (WHO) reported that
approximately 5 million people died from injury around the
world in 2008 [30]. Hemorrhagic shock accounts for 30 %
of these deaths [15]. Hemorrhagic shock is a clinical syn-
drome resulting from circulatory dysfunction that leads to
decreased tissue oxygenation, the accumulation of oxygen
debt, and ultimately to multiple organ system failure if left
untreated [29]. Thirty-three to 56 % of civilian deaths and
80–90 % of combat deaths occur during the pre-hospital
period [17]. The ability of a first responder to prioritize
patients and perform proper treatment has been emphasized
in instances of both civilian and military trauma [3, 16].
However, because there are few obvious symptoms in
patients, it is difficult to make triage decisions rapidly and
accurately and to utilize appropriate interventions early in
the decision-making process [14].
In the clinical setting, conventional vital signs such as
heart rate (HR), blood pressure (BP), pulse pressure (PPR),
and respiratory rate (RR) have been used to predict hem-
orrhagic shock severity based on the American College of
Surgeons Advanced Trauma Life Support (ATLS) for
Doctors (8th Student Course Manual) [2]. In addition, the
K.-A. Kim
Department of Biomedical Engineering, Chungbuk National
University, College of Medicine, Cheongju, Korea
J. Y. Choi � S. K. Kim � D. W. Kim (&)
Department of Medical Engineering, Yonsei University
College of Medicine, Seoul, Korea
e-mail: [email protected]
T. K. Yoo
Department of Medicine, Yonsei University, Seoul, Korea
S. K. Kim � D. W. Kim
Graduate Program in Biomedical Engineering,
Yonsei University, Seoul, Korea
K. Chung
Department of Electrical System, DongYang Mirae University,
Seoul, Korea
123
Med Biol Eng Comput (2013) 51:1059–1067
DOI 10.1007/s11517-013-1091-0
shock index (SI), defined as a ratio of HR to systolic blood
pressure (SBP), was a better measure of acute blood loss
than HR, SBP, or diastolic blood pressure (DBP) alone [4,
21]. Recent studies have concentrated on tissue status as
measured by lactate concentration (LC) and peripheral
perfusion (PP) to diagnose hemorrhagic shock severity [10,
29]. Our previous study using logistic regression (LR)
analyses demonstrated that a newly proposed hemorrhage-
induced severity index (NI), defined as the LC/PP ratio,
better predicted mortality in rats experiencing acute hem-
orrhage than SI as well as LC or PP alone [6]. However, an
artificial intelligence model is a very suitable alternative to
accurately predict hemorrhagic shock severity using vari-
ous physiological variables simultaneously.
The machine learning techniques have been applied to
diagnose some diseases such as acute appendicitis [12].
Recently, many studies have applied machine learning
techniques to the severity prediction model for hemor-
rhagic shock. Roberts et al. [23] used a polynomial neural
network in a swine model to predict mortality in hemor-
rhagic shock using SBP and mean arterial pressure (MAP).
Eftekhar et al. [11] compared logistic regression (LR) and
artificial neural network (ANN) models to predict mortality
from head trauma in humans and showed that ANN sig-
nificantly outperformed LR in prediction accuracy. Jang
et al. [14] recently applied an artificial neural network
(ANN) and support vector machine (SVM), and Choi et al.
[5] applied random forest (RF) classifiers to mortality
prediction models using a hemorrhagic rat model [5, 14].
Although each machine learning technique could predict
the severity of hemorrhagic shock, few studies simulta-
neously considered all of the aforementioned physiological
variables in constructing a prediction model. Furthermore,
few studies performed variable selection to achieve an
optimized model or compared performance among the
machine learning techniques in predicting mortality from
hemorrhagic shock. In this study, we validated the per-
formance of the machine learning techniques, LR, ANN,
RF, and SVM, and aimed to select an optimal model that
accurately predicts hemorrhagic shock mortality in the rat
model. Essential variables were selected from all physio-
logical variables before constructing each optimal model.
The models were then compared for sensitivity, specificity,
accuracy, and area under the curve (AUC) of the receiver
operating characteristic (ROC).
2 Methods
2.1 Experimental protocol [6]
Thirty-six male Sprague–Dawley rats (Orient, Seongnamsi,
Korea), weighing 300–400 g each, were divided into three
groups with 12 rats in each group depending on controlled
blood volume loss. After anesthesia with an isoflurane
inhalation system (RC2, VetEquip, Pleasanton, CA), blood
volumes of 2.0, 2.5, or 3.0 mL 100 g-1 were drawn
through a right carotid artery catheter using a withdrawal
syringe pump (Pump 11 Plus, Harvard Apparatus, South
Natick, MA) over 15 min for all groups (Fig. 1). The
average percentages of calculated total blood volume
withdrawn from these groups were 32.8, 41.0, and 49.2 %,
respectively [total blood volume (mL) = body weight
(g) 9 0.061] [31].
Uncontrolled hemorrhage was performed by amputation
of the tail at 75 % of its length at 1 min after initiating
volume-controlled hemorrhage. Tail blood was immedi-
ately directed into a tube containing heparinized saline, and
the blood volume collected was determined by weighing
the tube. The stump of the tail was tightly bandaged to stop
uncontrolled bleeding at the end of the controlled hemor-
rhage set at 30 min (Fig. 1). Since the major causative
factor in almost half of hemorrhage-related deaths occurs
during the acute period less than 2 h after injury [19], all
data were collected until death or through 150 min,
whichever came first [6, 19, 22]. Rats that survived
150 min were killed, and death was defined as the absence
of measured MAP [27]. All experimental procedures and
protocols used in this study were approved by the Institu-
tional Animal Care and Use Committee of Yonsei Uni-
versity Health System, Seoul, Korea.
2.2 Data acquisition [6]
The physiological variables such as HR, SBP, DBP, MAP,
PPR, RR, and TEMP were measured with a sampling
frequency of 1 kHz using LabChart 6 Pro software (AD
Instruments, Colorado Springs, CO). The data were fed
into an Analog/Digital conversion system (PowerLab 8/30,
AD Instruments). HR was obtained via ECG signals using
three invasive needle electrodes, placed in the left, right
forelegs, and the right hind leg, with a biological amplifier
(ML136, AD Instruments). An invasive blood pressure
amplifier was constructed using an instrumentation ampli-
fier (AD620, Analog Device, Norwood, MA) and a piezo-
resistive silicon pressure sensor (1620, Measurement
Specialist, Hampton, VA) that was connected to a right
femoral artery catheter. Respirations were assessed by
measuring changes in the thoracic cross-sectional area
using a respiratory belt (MLT1132, AD Instruments). We
measured temperature using a rectal probe (MLT1403, AD
Instruments), which was inserted approximately 5 cm into
the rectum. The SI was calculated dividing the measured
HR by SBP values.
Peripheral perfusion, defined as peripheral tissue perfu-
sion and skin microcirculation, was monitored continuously
1060 Med Biol Eng Comput (2013) 51:1059–1067
123

using a laser Doppler perfusion monitor (PeriFlux system
5000, Perimed, Sweden) with a probe (Probe 407, Peri-
med), which was attached to the right front sole of the paw.
The data were acquired with a sampling frequency of
32 Hz and analyzed by computer software (PeriSoft for
Windows, Perimed). Blood was sampled repetitively from
the left femoral vein using a 31-gauge insulin syringe (BD
Ultra-Fine, Becton–Dickinson, Franklin Lakes, NJ) for LC
measurement and then analyzed immediately with a
portable blood lactate analyzer (Lactate Pro LT-1710,
ARKRAY Inc., Kyoto, Japan), as shown in Fig. 1. Interim
LC values were calculated for every 10-s period between
blood draws through linear interpolation using computer
software (LabVIEW 2009, National Instruments, Austin,
TX) [23]. NI was calculated dividing the measured LC by
PP values.
As all measured data were averaged across every 10-s
period, six data sets were obtained per minute. We
analyzed data based on the changes between at the resting
state (100 %) for 30 s and immediately after the cessation
of bleeding for 10 s, as shown in Fig. 1. The reason for
analyzing over a short time period of 10 s was to limit the
effect of hemostasis as much as possible. These data points
were selected in order to mimic the scenario in which first
responders initially encounter injured and bleeding patients
who have lost unknown quantities of blood due to acute
hemorrhage. The physiological variables used for the
models were compared between the survival and death
groups using the Mann–Whitney U test with a significance
of 0.05 using SPSS version 18.0 (SPSS Inc., Chicago, IL)
as shown in Table 1.
2.3 Machine learning techniques
Logistic regression is used to generate a predictive model
for dichotomous response variables by fitting available data
to a logistic function, which always takes on values
between zero and one. The logistic function consists of
regression coefficients with the respective input variables.
Each of the regression coefficients describes the size of the
contribution of that risk factor. LR models are typically the
gold standard among medical researchers for comparison
in machine learning studies [12]. We compared the per-
formance of the LR model to that of the ANN, RF, and
SVM models.
The concept of ANN is to imitate a biological neural
network. In this study, the architecture of the ANN con-
sisted of three layers: one input, one hidden, and one out-
put. Each layer of the network has elementary processing
units called nodes. There were 11 input nodes and one
output node for survival or death. In general, the perfor-
mance of ANN models relies on the number of hidden
nodes. Since the optimal number of hidden nodes is
determined by empirical method [27], this study trained the
networks that were applied from two to ten hidden nodes to
obtain an optimal ANN model. The ANN algorithm used in
this study was based on the Levenberg–Marquardt back-
propagation algorithm with epoch of 100 and gradient
of\e-50. Back-propagation is an algorithm that calculates
the minimum error by changing weight of layers.
Resting Bleeding Post bleeding
0 1516 20 25
3035 40 45 75 135105
150 (min)
Tail amputation: Lactate concentration measurement
Analysis
10’’30’’14
Fig. 1 Experimental protocol including measurement of lactate concentration, tail amputation, and period of data analysis [6]
Table 1 Comparison of all measured data [mean (standard devia-
tion), p value] at the completion of hemorrhage versus at rest (100 %)
for the survival and death groups [6]
Parameter [%] Survival (n = 16) Death (n = 20) p value
Total bleeding 42.3 (5.1) 51.2 (4.4) \0.001*
NI; LC/PP 437 (196) 1,654 (1,297) \0.001*
SI; HR/SBP 213 (72) 457 (143) \0.001*
PP [PU] 34 (12) 14 (9) \0.001*
SBP [mmHg] 47 (20) 23 (9) \0.001*
MAP [mmHg] 43 (16) 22 (9) \0.001*
PPR [mmHg] 65 (40) 24 (13) \0.001*
DBP [mmHg] 39 (16) 22 (9) \0.001*
TEMP [�C] 98 (1) 97 (1) 0.001*
LC [mmol L-1] 132 (40) 181 (54) 0.004*
RR [bpm] 81 (16) 64 (22) 0.013*
HR [bpm] 90 (12) 95 (9) 0.080
Total bleeding [%] = (bleeding/total blood volume) 9 100
NI new index, SI shock index, PP peripheral perfusion, PU perfusion
unit, SBP systolic blood pressure, MAP mean arterial pressure, PPR
pulse pressure, DBP diastolic blood pressure, TEMP temperature, LC
lactate concentration, RR respiration rate, HR heart rate
* p \ 0.05
Med Biol Eng Comput (2013) 51:1059–1067 1061
123
Random forest is an ensemble classification that consists
of many independent decision trees with outputs. Each tree
is grown independently in combination with a bagging idea
and a random selection of input variables for the condi-
tions. The final result is based on a majority vote of all trees
[12]. The goal of RF is to accurately classify by controlling
the number of the trees. We investigated mortality pre-
diction models using trees of 50, 100, 200, 300, 400, and
500 to find the optimal RF model.
Support vector machines maps data to a higher dimen-
sional space through a kernel function to linearly separate
data patterns. The data are separated into two groups by the
training data referred to as a support vector. SVM models are
determined by choosing the maximum-margin hyperplane
with the nearest support vector of two groups [7]. SVM
improves the accuracy of a model through the optimization
of separating space using the kernel function. To obtain the
optimal SVM model, we carried out exhaustive grid search
by changing penalty parameter C of 0.1, 1, and 10 and scaling
factor r of 0.1 and 1 using the Gaussian kernel function.
2.4 Model construction
The data set in this study was obtained from our previous
study [6]. For model construction, 11 variables including
HR, SBP, DBP, MAP, PPR, TEMP, RR, LC PP, SI, and NI
were used for input data sets. This study obtained one data
set from each rat. Therefore, 36 (1 set/10 s 9 36 rats) data
sets were obtained. The numbers for the survival and death
groups were 16 and 20, respectively. The 36 data sets were
divided randomly into two mutually exclusive data sets. Of
these, 66.7 % (n = 24; survival = 10, death = 14) were
used as a training set to select the optimal variables and
construct the models, and the remaining 33.3 % (n = 12;
survival = 6, death = 6) were used as a testing set. Before
constructing the models, we adopted a grid search in which
a range of parameter values, mentioned above in Sect. 2.3,
for each model was tested to obtain the optimal classifi-
cation using tenfold cross-validation. The optimal ANN
was set with three neurons within the hidden layer. The
optimal RF used 100 trees, and the number of predictors for
each node was set to default. For the SVM, a Gaussian
kernel function with a penalty parameter C of 0.1 and a
scaling factor r of 1 was set.
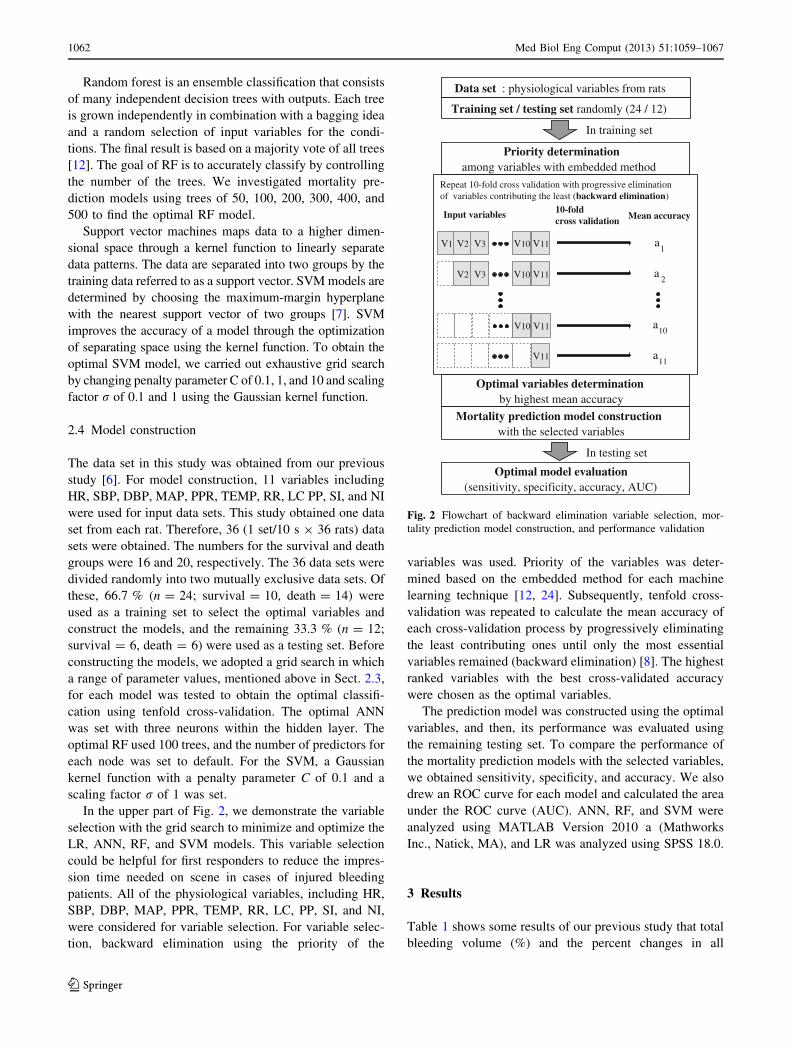
In the upper part of Fig. 2, we demonstrate the variable
selection with the grid search to minimize and optimize the
LR, ANN, RF, and SVM models. This variable selection
could be helpful for first responders to reduce the impres-
sion time needed on scene in cases of injured bleeding
patients. All of the physiological variables, including HR,
SBP, DBP, MAP, PPR, TEMP, RR, LC, PP, SI, and NI,
were considered for variable selection. For variable selec-
tion, backward elimination using the priority of the
variables was used. Priority of the variables was deter-
mined based on the embedded method for each machine
learning technique [12, 24]. Subsequently, tenfold cross-
validation was repeated to calculate the mean accuracy of
each cross-validation process by progressively eliminating
the least contributing ones until only the most essential
variables remained (backward elimination) [8]. The highest
ranked variables with the best cross-validated accuracy
were chosen as the optimal variables.
The prediction model was constructed using the optimal
variables, and then, its performance was evaluated using
the remaining testing set. To compare the performance of
the mortality prediction models with the selected variables,
we obtained sensitivity, specificity, and accuracy. We also
drew an ROC curve for each model and calculated the area
under the ROC curve (AUC). ANN, RF, and SVM were
analyzed using MATLAB Version 2010 a (Mathworks
Inc., Natick, MA), and LR was analyzed using SPSS 18.0.
3 Results
Table 1 shows some results of our previous study that total
bleeding volume (%) and the percent changes in all
Data set : physiological variables from rats
Training set / testing set randomly (24 / 12)
Priority determinationamong variables with embedded method
Repeat 10-fold cross validation with progressive elimination of variables contributing the least (backward elimination)
Input variables 10-fold cross validation Mean accuracy
1aV11V1 V2 V10V3
V11V2 V10V3
V11V10
V11
2a
10a
11a
Optimal variables determination by highest mean accuracy
Mortality prediction model constructionwith the selected variables
Optimal model evaluation(sensitivity, specificity, accuracy, AUC)
In training set
In testing set
Fig. 2 Flowchart of backward elimination variable selection, mor-
tality prediction model construction, and performance validation
1062 Med Biol Eng Comput (2013) 51:1059–1067
123
measured variables (mean ± standard deviation) at the
completion of hemorrhage versus at rest (100 %) for both
the survival and death groups [6]. NI, SI, and LC for the
survival and death groups changed much more than any
other variable, suggesting that they were more sensitive to
acute hemorrhage for 15 min than other variables. The
decreases in PP and BPs including SBP, MAP, PPR, and
DBP were relatively greater than those of TEMP, RR, and
HR. There were significant differences between the two
groups for total bleeding volume and all variables
(p \ 0.05), except for HR.
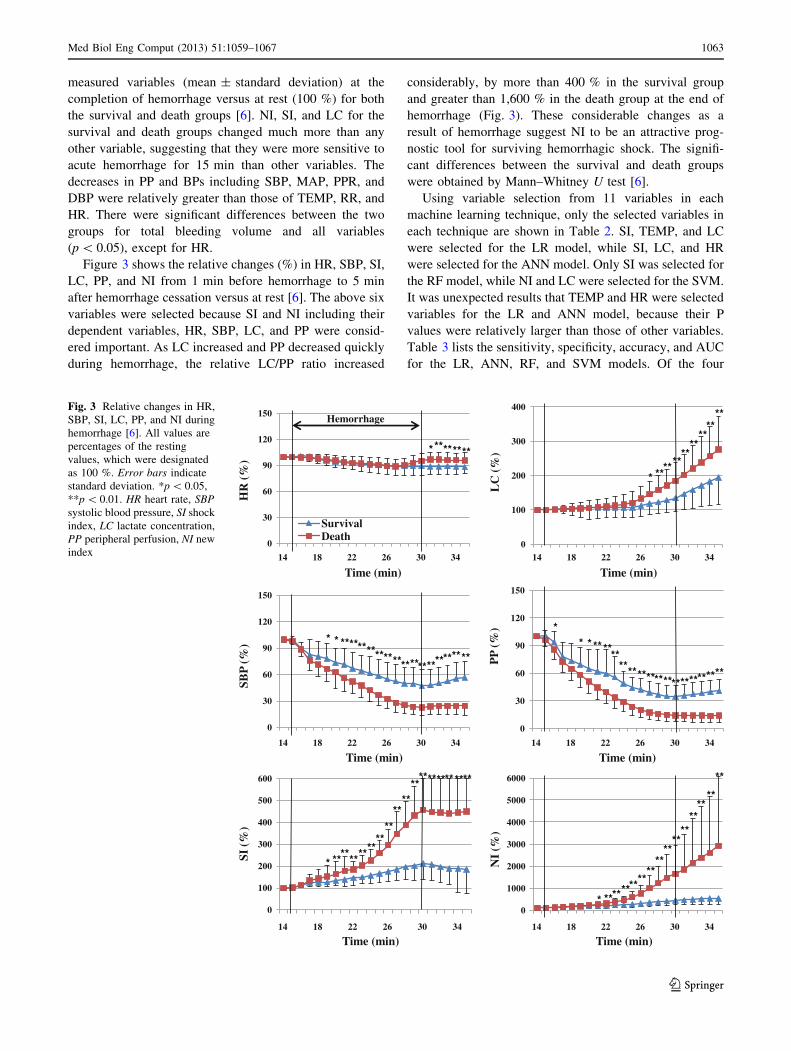
Figure 3 shows the relative changes (%) in HR, SBP, SI,
LC, PP, and NI from 1 min before hemorrhage to 5 min
after hemorrhage cessation versus at rest [6]. The above six
variables were selected because SI and NI including their
dependent variables, HR, SBP, LC, and PP were consid-
ered important. As LC increased and PP decreased quickly
during hemorrhage, the relative LC/PP ratio increased
considerably, by more than 400 % in the survival group
and greater than 1,600 % in the death group at the end of
hemorrhage (Fig. 3). These considerable changes as a
result of hemorrhage suggest NI to be an attractive prog-
nostic tool for surviving hemorrhagic shock. The signifi-
cant differences between the survival and death groups
were obtained by Mann–Whitney U test [6].
Using variable selection from 11 variables in each
machine learning technique, only the selected variables in
each technique are shown in Table 2. SI, TEMP, and LC
were selected for the LR model, while SI, LC, and HR
were selected for the ANN model. Only SI was selected for
the RF model, while NI and LC were selected for the SVM.
It was unexpected results that TEMP and HR were selected
variables for the LR and ANN model, because their P
values were relatively larger than those of other variables.
Table 3 lists the sensitivity, specificity, accuracy, and AUC
for the LR, ANN, RF, and SVM models. Of the four
0
30
60
90
120
150
14 18 22 26 30 34
SBP
(%) * * ************************
******
Time (min)
0
30
60
90
120
150
14 18 22 26 30 34
PP
(%) *
********************************
Time (min)
0
30
60
90
120
150
14 18 22 26 30 34
SurvivalDeath
HR
(%)
*** ******
Time (min)
Hemorrhage
0
100
200
300
400
14 18 22 26 30 34
LC
(%)
* ******
****
****
**
Time (min)
0
100
200
300
400
500
600
14 18 22 26 30 34
SI (%
)
* **********
****
****
**************
Time (min)
0
1000
2000
3000
4000
5000
6000
14 18 22 26 30 34
NI
(%)
* ********
****
****
****
****
**
**
Time (min)
Fig. 3 Relative changes in HR,
SBP, SI, LC, PP, and NI during
hemorrhage [6]. All values are
percentages of the resting
values, which were designated
as 100 %. Error bars indicate
standard deviation. *p \ 0.05,
**p \ 0.01. HR heart rate, SBP
systolic blood pressure, SI shock
index, LC lactate concentration,
PP peripheral perfusion, NI new
index
Med Biol Eng Comput (2013) 51:1059–1067 1063
123
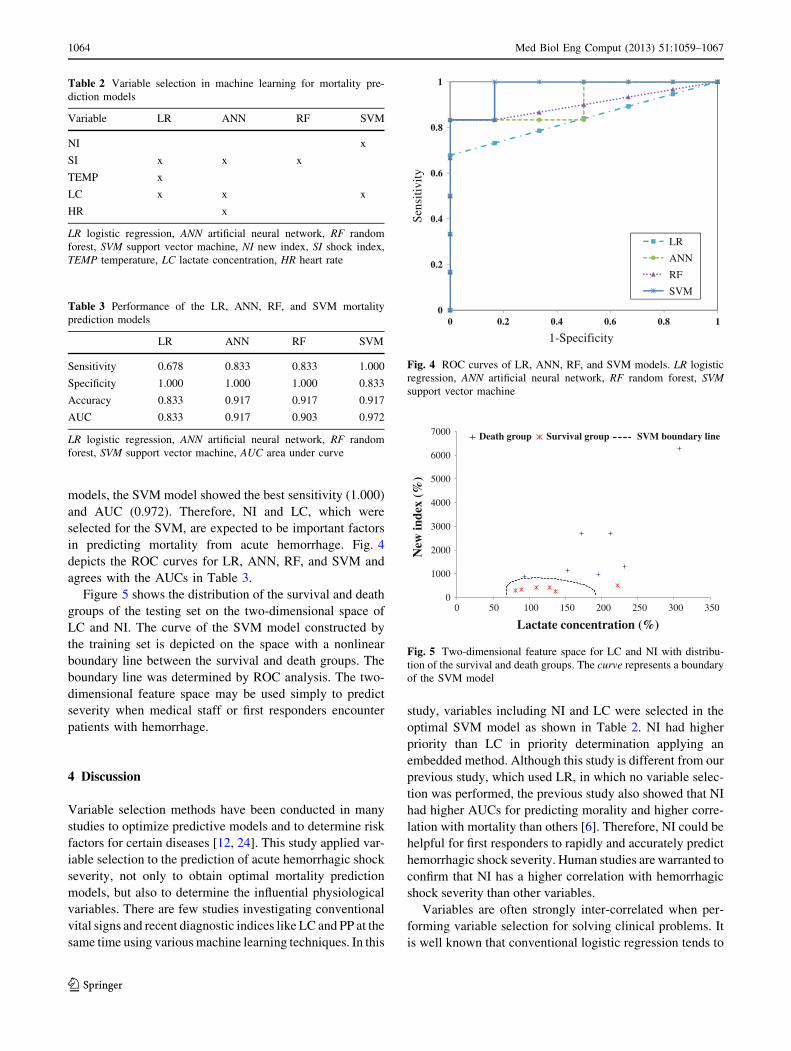
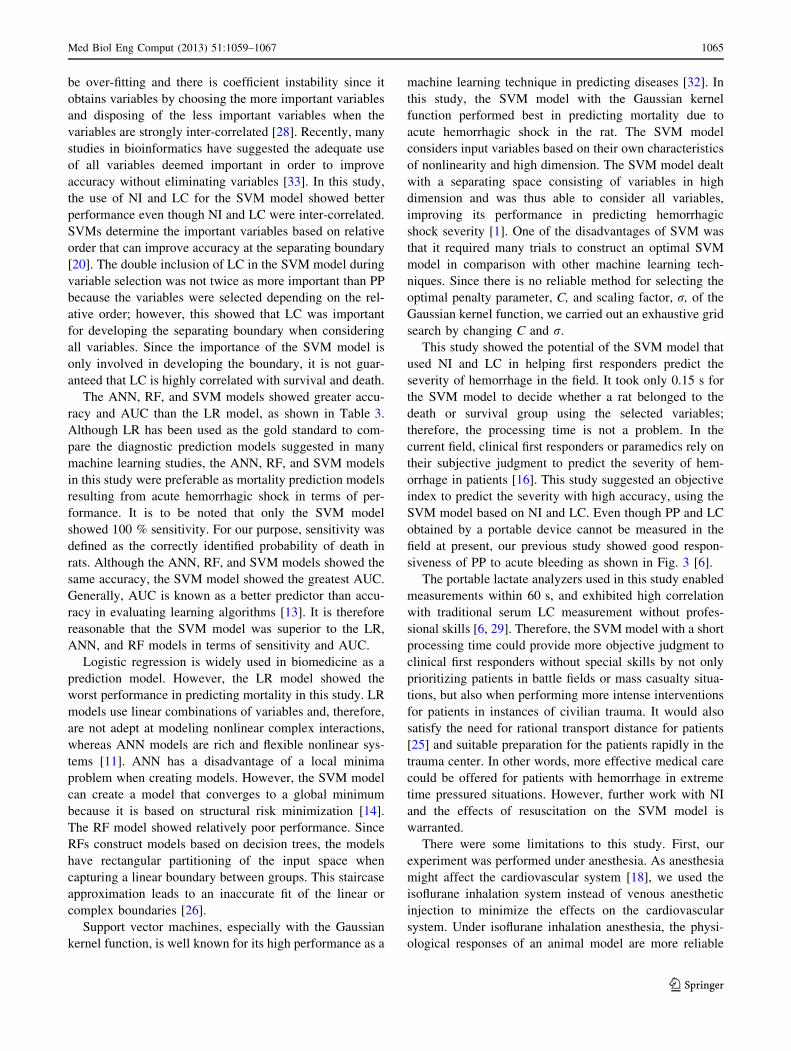
models, the SVM model showed the best sensitivity (1.000)
and AUC (0.972). Therefore, NI and LC, which were
selected for the SVM, are expected to be important factors
in predicting mortality from acute hemorrhage. Fig. 4
depicts the ROC curves for LR, ANN, RF, and SVM and
agrees with the AUCs in Table 3.
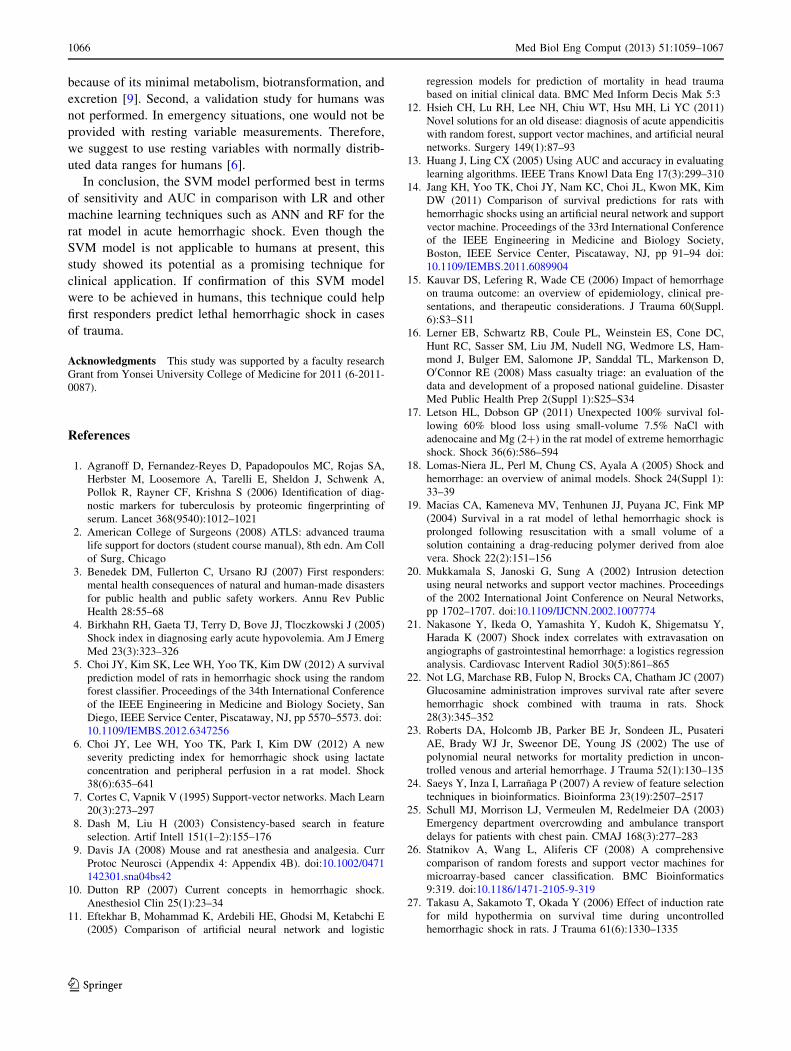
Figure 5 shows the distribution of the survival and death
groups of the testing set on the two-dimensional space of
LC and NI. The curve of the SVM model constructed by
the training set is depicted on the space with a nonlinear
boundary line between the survival and death groups. The
boundary line was determined by ROC analysis. The two-
dimensional feature space may be used simply to predict
severity when medical staff or first responders encounter
patients with hemorrhage.
4 Discussion
Variable selection methods have been conducted in many
studies to optimize predictive models and to determine risk
factors for certain diseases [12, 24]. This study applied var-
iable selection to the prediction of acute hemorrhagic shock
severity, not only to obtain optimal mortality prediction
models, but also to determine the influential physiological
variables. There are few studies investigating conventional
vital signs and recent diagnostic indices like LC and PP at the
same time using various machine learning techniques. In this
study, variables including NI and LC were selected in the
optimal SVM model as shown in Table 2. NI had higher
priority than LC in priority determination applying an
embedded method. Although this study is different from our
previous study, which used LR, in which no variable selec-
tion was performed, the previous study also showed that NI
had higher AUCs for predicting morality and higher corre-
lation with mortality than others [6]. Therefore, NI could be
helpful for first responders to rapidly and accurately predict
hemorrhagic shock severity. Human studies are warranted to
confirm that NI has a higher correlation with hemorrhagic
shock severity than other variables.
Variables are often strongly inter-correlated when per-
forming variable selection for solving clinical problems. It
is well known that conventional logistic regression tends to
Table 2 Variable selection in machine learning for mortality pre-
diction models
Variable LR ANN RF SVM
NI x
SI x x x
TEMP x
LC x x x
HR x
LR logistic regression, ANN artificial neural network, RF random
forest, SVM support vector machine, NI new index, SI shock index,
TEMP temperature, LC lactate concentration, HR heart rate
Table 3 Performance of the LR, ANN, RF, and SVM mortality
prediction models
LR ANN RF SVM
Sensitivity 0.678 0.833 0.833 1.000
Specificity 1.000 1.000 1.000 0.833
Accuracy 0.833 0.917 0.917 0.917
AUC 0.833 0.917 0.903 0.972
LR logistic regression, ANN artificial neural network, RF random
forest, SVM support vector machine, AUC area under curve
0
0.2
0.4
0.6
0.8
1
0 0.2 0.4 0.6 0.8 1
LR
ANN
RF
SVM
Sens
itivi
ty
1-Specificity
Fig. 4 ROC curves of LR, ANN, RF, and SVM models. LR logistic
regression, ANN artificial neural network, RF random forest, SVM
support vector machine
0
1000
2000
3000
4000
5000
6000
7000
0 50 100 150 200 250 300 350
Death group Survival group SVM boundary line
New
inde
x (%
)
Lactate concentration (%)
Fig. 5 Two-dimensional feature space for LC and NI with distribu-
tion of the survival and death groups. The curve represents a boundary
of the SVM model
1064 Med Biol Eng Comput (2013) 51:1059–1067
123
be over-fitting and there is coefficient instability since it
obtains variables by choosing the more important variables
and disposing of the less important variables when the
variables are strongly inter-correlated [28]. Recently, many
studies in bioinformatics have suggested the adequate use
of all variables deemed important in order to improve
accuracy without eliminating variables [33]. In this study,
the use of NI and LC for the SVM model showed better
performance even though NI and LC were inter-correlated.
SVMs determine the important variables based on relative
order that can improve accuracy at the separating boundary
[20]. The double inclusion of LC in the SVM model during
variable selection was not twice as more important than PP
because the variables were selected depending on the rel-
ative order; however, this showed that LC was important
for developing the separating boundary when considering
all variables. Since the importance of the SVM model is
only involved in developing the boundary, it is not guar-
anteed that LC is highly correlated with survival and death.
The ANN, RF, and SVM models showed greater accu-
racy and AUC than the LR model, as shown in Table 3.
Although LR has been used as the gold standard to com-
pare the diagnostic prediction models suggested in many
machine learning studies, the ANN, RF, and SVM models
in this study were preferable as mortality prediction models
resulting from acute hemorrhagic shock in terms of per-
formance. It is to be noted that only the SVM model
showed 100 % sensitivity. For our purpose, sensitivity was
defined as the correctly identified probability of death in
rats. Although the ANN, RF, and SVM models showed the
same accuracy, the SVM model showed the greatest AUC.
Generally, AUC is known as a better predictor than accu-
racy in evaluating learning algorithms [13]. It is therefore
reasonable that the SVM model was superior to the LR,
ANN, and RF models in terms of sensitivity and AUC.
Logistic regression is widely used in biomedicine as a
prediction model. However, the LR model showed the
worst performance in predicting mortality in this study. LR
models use linear combinations of variables and, therefore,
are not adept at modeling nonlinear complex interactions,
whereas ANN models are rich and flexible nonlinear sys-
tems [11]. ANN has a disadvantage of a local minima
problem when creating models. However, the SVM model
can create a model that converges to a global minimum
because it is based on structural risk minimization [14].
The RF model showed relatively poor performance. Since
RFs construct models based on decision trees, the models
have rectangular partitioning of the input space when
capturing a linear boundary between groups. This staircase
approximation leads to an inaccurate fit of the linear or
complex boundaries [26].
Support vector machines, especially with the Gaussian
kernel function, is well known for its high performance as a
machine learning technique in predicting diseases [32]. In
this study, the SVM model with the Gaussian kernel
function performed best in predicting mortality due to
acute hemorrhagic shock in the rat. The SVM model
considers input variables based on their own characteristics
of nonlinearity and high dimension. The SVM model dealt
with a separating space consisting of variables in high
dimension and was thus able to consider all variables,
improving its performance in predicting hemorrhagic
shock severity [1]. One of the disadvantages of SVM was
that it required many trials to construct an optimal SVM
model in comparison with other machine learning tech-
niques. Since there is no reliable method for selecting the
optimal penalty parameter, C, and scaling factor, r, of the
Gaussian kernel function, we carried out an exhaustive grid
search by changing C and r.
This study showed the potential of the SVM model that
used NI and LC in helping first responders predict the
severity of hemorrhage in the field. It took only 0.15 s for
the SVM model to decide whether a rat belonged to the
death or survival group using the selected variables;
therefore, the processing time is not a problem. In the
current field, clinical first responders or paramedics rely on
their subjective judgment to predict the severity of hem-
orrhage in patients [16]. This study suggested an objective
index to predict the severity with high accuracy, using the
SVM model based on NI and LC. Even though PP and LC
obtained by a portable device cannot be measured in the
field at present, our previous study showed good respon-
siveness of PP to acute bleeding as shown in Fig. 3 [6].
The portable lactate analyzers used in this study enabled
measurements within 60 s, and exhibited high correlation
with traditional serum LC measurement without profes-
sional skills [6, 29]. Therefore, the SVM model with a short
processing time could provide more objective judgment to
clinical first responders without special skills by not only
prioritizing patients in battle fields or mass casualty situa-
tions, but also when performing more intense interventions
for patients in instances of civilian trauma. It would also
satisfy the need for rational transport distance for patients
[25] and suitable preparation for the patients rapidly in the
trauma center. In other words, more effective medical care
could be offered for patients with hemorrhage in extreme
time pressured situations. However, further work with NI
and the effects of resuscitation on the SVM model is
warranted.
There were some limitations to this study. First, our
experiment was performed under anesthesia. As anesthesia
might affect the cardiovascular system [18], we used the
isoflurane inhalation system instead of venous anesthetic
injection to minimize the effects on the cardiovascular
system. Under isoflurane inhalation anesthesia, the physi-
ological responses of an animal model are more reliable
Med Biol Eng Comput (2013) 51:1059–1067 1065
123
because of its minimal metabolism, biotransformation, and
excretion [9]. Second, a validation study for humans was
not performed. In emergency situations, one would not be
provided with resting variable measurements. Therefore,
we suggest to use resting variables with normally distrib-
uted data ranges for humans [6].
In conclusion, the SVM model performed best in terms
of sensitivity and AUC in comparison with LR and other
machine learning techniques such as ANN and RF for the
rat model in acute hemorrhagic shock. Even though the
SVM model is not applicable to humans at present, this
study showed its potential as a promising technique for
clinical application. If confirmation of this SVM model
were to be achieved in humans, this technique could help
first responders predict lethal hemorrhagic shock in cases
of trauma.
Acknowledgments This study was supported by a faculty research
Grant from Yonsei University College of Medicine for 2011 (6-2011-
0087).
References
1. Agranoff D, Fernandez-Reyes D, Papadopoulos MC, Rojas SA,
Herbster M, Loosemore A, Tarelli E, Sheldon J, Schwenk A,
Pollok R, Rayner CF, Krishna S (2006) Identification of diag-
nostic markers for tuberculosis by proteomic fingerprinting of
serum. Lancet 368(9540):1012–1021
2. American College of Surgeons (2008) ATLS: advanced trauma
life support for doctors (student course manual), 8th edn. Am Coll
of Surg, Chicago
3. Benedek DM, Fullerton C, Ursano RJ (2007) First responders:
mental health consequences of natural and human-made disasters
for public health and public safety workers. Annu Rev Public
Health 28:55–68
4. Birkhahn RH, Gaeta TJ, Terry D, Bove JJ, Tloczkowski J (2005)
Shock index in diagnosing early acute hypovolemia. Am J Emerg
Med 23(3):323–326
5. Choi JY, Kim SK, Lee WH, Yoo TK, Kim DW (2012) A survival
prediction model of rats in hemorrhagic shock using the random
forest classifier. Proceedings of the 34th International Conference
of the IEEE Engineering in Medicine and Biology Society, San
Diego, IEEE Service Center, Piscataway, NJ, pp 5570–5573. doi:
10.1109/IEMBS.2012.6347256
6. Choi JY, Lee WH, Yoo TK, Park I, Kim DW (2012) A new
severity predicting index for hemorrhagic shock using lactate
concentration and peripheral perfusion in a rat model. Shock
38(6):635–641
7. Cortes C, Vapnik V (1995) Support-vector networks. Mach Learn
20(3):273–297
8. Dash M, Liu H (2003) Consistency-based search in feature
selection. Artif Intell 151(1–2):155–176
9. Davis JA (2008) Mouse and rat anesthesia and analgesia. Curr
Protoc Neurosci (Appendix 4: Appendix 4B). doi:10.1002/0471
142301.sna04bs42
10. Dutton RP (2007) Current concepts in hemorrhagic shock.
Anesthesiol Clin 25(1):23–34
11. Eftekhar B, Mohammad K, Ardebili HE, Ghodsi M, Ketabchi E
(2005) Comparison of artificial neural network and logistic
regression models for prediction of mortality in head trauma
based on initial clinical data. BMC Med Inform Decis Mak 5:3
12. Hsieh CH, Lu RH, Lee NH, Chiu WT, Hsu MH, Li YC (2011)
Novel solutions for an old disease: diagnosis of acute appendicitis
with random forest, support vector machines, and artificial neural
networks. Surgery 149(1):87–93
13. Huang J, Ling CX (2005) Using AUC and accuracy in evaluating
learning algorithms. IEEE Trans Knowl Data Eng 17(3):299–310
14. Jang KH, Yoo TK, Choi JY, Nam KC, Choi JL, Kwon MK, Kim
DW (2011) Comparison of survival predictions for rats with
hemorrhagic shocks using an artificial neural network and support
vector machine. Proceedings of the 33rd International Conference
of the IEEE Engineering in Medicine and Biology Society,
Boston, IEEE Service Center, Piscataway, NJ, pp 91–94 doi:
10.1109/IEMBS.2011.6089904
15. Kauvar DS, Lefering R, Wade CE (2006) Impact of hemorrhage
on trauma outcome: an overview of epidemiology, clinical pre-
sentations, and therapeutic considerations. J Trauma 60(Suppl.
6):S3–S11
16. Lerner EB, Schwartz RB, Coule PL, Weinstein ES, Cone DC,
Hunt RC, Sasser SM, Liu JM, Nudell NG, Wedmore LS, Ham-
mond J, Bulger EM, Salomone JP, Sanddal TL, Markenson D,
O0Connor RE (2008) Mass casualty triage: an evaluation of the
data and development of a proposed national guideline. Disaster
Med Public Health Prep 2(Suppl 1):S25–S34
17. Letson HL, Dobson GP (2011) Unexpected 100% survival fol-
lowing 60% blood loss using small-volume 7.5% NaCl with
adenocaine and Mg (2?) in the rat model of extreme hemorrhagic
shock. Shock 36(6):586–594
18. Lomas-Niera JL, Perl M, Chung CS, Ayala A (2005) Shock and
hemorrhage: an overview of animal models. Shock 24(Suppl 1):
33–39
19. Macias CA, Kameneva MV, Tenhunen JJ, Puyana JC, Fink MP
(2004) Survival in a rat model of lethal hemorrhagic shock is
prolonged following resuscitation with a small volume of a
solution containing a drag-reducing polymer derived from aloe
vera. Shock 22(2):151–156
20. Mukkamala S, Janoski G, Sung A (2002) Intrusion detection
using neural networks and support vector machines. Proceedings
of the 2002 International Joint Conference on Neural Networks,
pp 1702–1707. doi:10.1109/IJCNN.2002.1007774
21. Nakasone Y, Ikeda O, Yamashita Y, Kudoh K, Shigematsu Y,
Harada K (2007) Shock index correlates with extravasation on
angiographs of gastrointestinal hemorrhage: a logistics regression
analysis. Cardiovasc Intervent Radiol 30(5):861–865
22. Not LG, Marchase RB, Fulop N, Brocks CA, Chatham JC (2007)
Glucosamine administration improves survival rate after severe
hemorrhagic shock combined with trauma in rats. Shock
28(3):345–352
23. Roberts DA, Holcomb JB, Parker BE Jr, Sondeen JL, Pusateri
AE, Brady WJ Jr, Sweenor DE, Young JS (2002) The use of
polynomial neural networks for mortality prediction in uncon-
trolled venous and arterial hemorrhage. J Trauma 52(1):130–135
24. Saeys Y, Inza I, Larranaga P (2007) A review of feature selection
techniques in bioinformatics. Bioinforma 23(19):2507–2517
25. Schull MJ, Morrison LJ, Vermeulen M, Redelmeier DA (2003)
Emergency department overcrowding and ambulance transport
delays for patients with chest pain. CMAJ 168(3):277–283
26. Statnikov A, Wang L, Aliferis CF (2008) A comprehensive
comparison of random forests and support vector machines for
microarray-based cancer classification. BMC Bioinformatics
9:319. doi:10.1186/1471-2105-9-319
27. Takasu A, Sakamoto T, Okada Y (2006) Effect of induction rate
for mild hypothermia on survival time during uncontrolled
hemorrhagic shock in rats. J Trauma 61(6):1330–1335
1066 Med Biol Eng Comput (2013) 51:1059–1067
123

28. Waldron L, Pintilie M, Tsao MS, Shepherd FA, Huttenhower C,
Jurisica I (2011) Optimized application of penalized regression
methods to diverse genomic data. Bioinformatics 27(24):3399–
3406
29. Wilson M, Davis DP, Coimbra R (2003) Diagnosis and moni-
toring of hemorrhagic shock during the initial resuscitation of
multiple trauma patients: a review. J Emerg Med 24(4):413–422
30. World Health Organization (2010) World health statistics 2010.
Switzerland, World Health Organization Press, Geneva, pp 62–70
31. Yang S, Zou LY, Bounelis P, Chaudry I, Chatham JC, Marchase
RB (2006) Glucosamine administration during resuscitation
improves organ function after trauma hemorrhage. Shock
25(6):600–607
32. Zhao ZD, Lou YY, Ni JH, Zhang J (2012) RBF-SVM and its
application on reliability evaluation of electric power system
communication network. In: Machine Learning Cybernetics
(ICMLC), 2012 Annual International Conference of the IEEE,
pp.1188–1193. doi: 10.1109/ICMLC.2009.5212365
33. Zou H, Hastie T (2008) Regularization and variable selection
via the elastic net. J R Stat Soc Series B Stat Methodol
67(2):301–320
Med Biol Eng Comput (2013) 51:1059–1067 1067
123