morocco agadir water supply project external … · agadir water supply project external evaluator:...
TRANSCRIPT
1
Morocco
Agadir Water Supply Project
External Evaluator: Hajime Onishi
Mitsubishi UFJ Research & Consulting Co., Ltd.
0.SummaryThis project is highly consistent with government policies and no problems with operation
and maintenance (O&M) systems can be found. The financial situation of the executing
agency (Office National de l’Eau Potable, ONEP) is in a favorable condition for the
timebeing. Major indicators such as the population served by this project, the amount of water
supplied, and the facility utilization rate have exceeded 80% of the target value, and there is
no particular problem with the quality of the purified water produced. Furthermore, the
project contributes to improving the living conditions of the beneficiaries to some extent, and
numerous positive impacts have emerged, including the improvement of the service level of
water supply and the business environment in the target areas. In addition, in terms of
efficiency, although the project period was longer than planned, project cost was kept within
the planned amount. In light of the above, this project is evaluated to be highly satisfactory.
1.Project Description
Project Site
Morocco
Algeria
Spain
Rabat
Agadir
Casablanca
Marrakech
Tan Tan Project SiteProject Site
Morocco
Algeria
Spain
Rabat
Agadir
Casablanca
Marrakech
Tan Tan
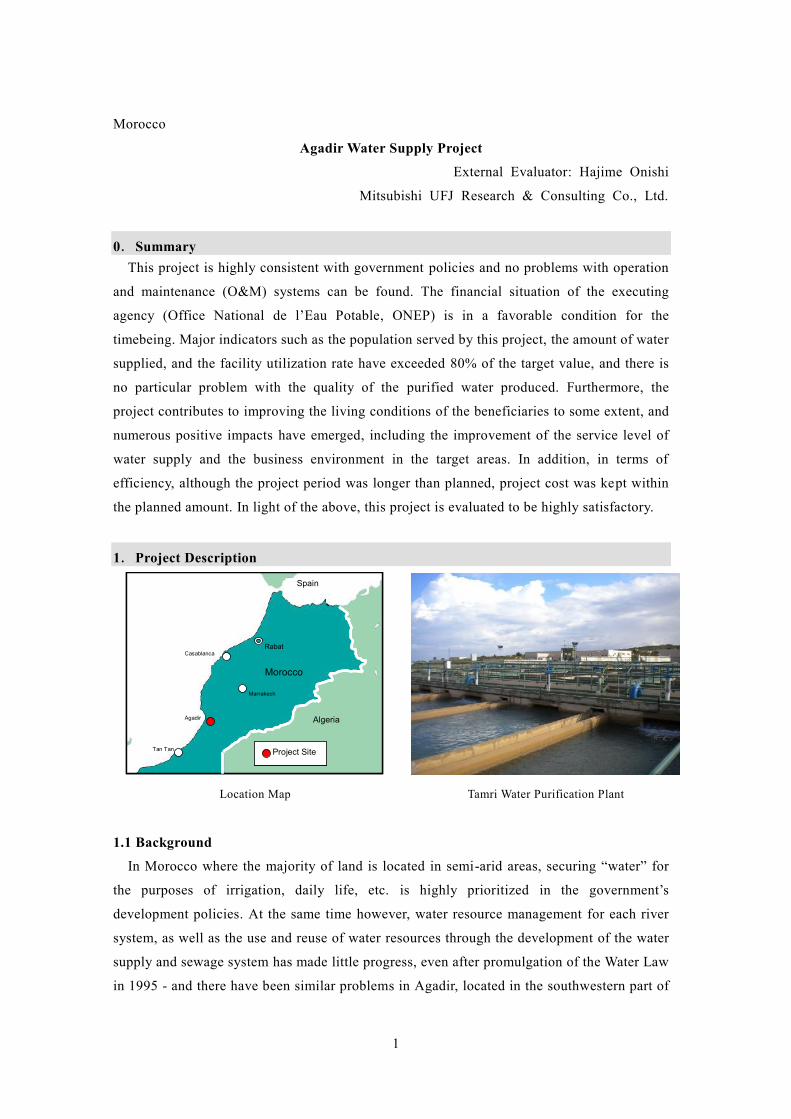
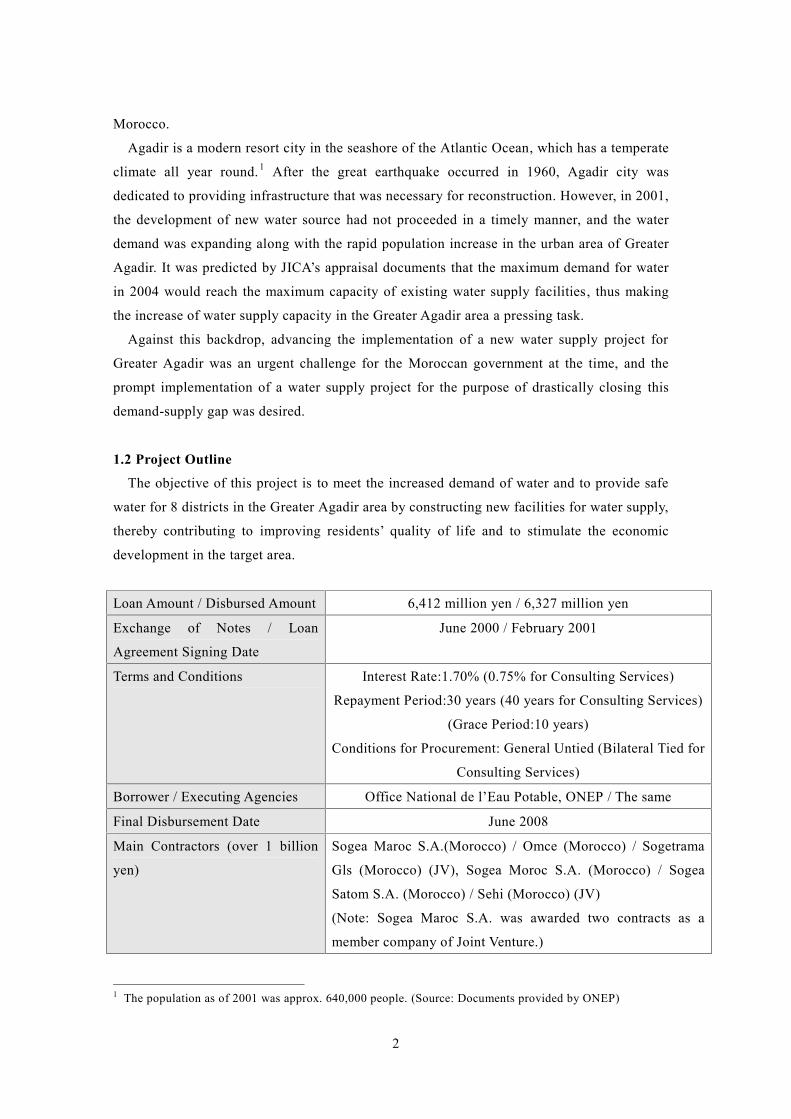
Location Map Tamri Water Purification Plant
1.1 Background
In Morocco where the majority of land is located in semi-arid areas, securing “water” for
the purposes of irrigation, daily life, etc. is highly prioritized in the government’s
development policies. At the same time however, water resource management for each river
system, as well as the use and reuse of water resources through the development of the water
supply and sewage system has made little progress, even after promulgation of the Water Law
in 1995 - and there have been similar problems in Agadir, located in the southwestern part of
2
Morocco.
Agadir is a modern resort city in the seashore of the Atlantic Ocean, which has a temperate
climate all year round.1 After the great earthquake occurred in 1960, Agadir city was
dedicated to providing infrastructure that was necessary for reconstruction. However, in 2001,
the development of new water source had not proceeded in a timely manner, and the water
demand was expanding along with the rapid population increase in the urban area of Greater
Agadir. It was predicted by JICA’s appraisal documents that the maximum demand for water
in 2004 would reach the maximum capacity of existing water supply facilities, thus making
the increase of water supply capacity in the Greater Agadir area a pressing task.
Against this backdrop, advancing the implementation of a new water supply project for
Greater Agadir was an urgent challenge for the Moroccan government at the time, and the
prompt implementation of a water supply project for the purpose of drastically closing this
demand-supply gap was desired.
1.2 Project Outline
The objective of this project is to meet the increased demand of water and to provide safe
water for 8 districts in the Greater Agadir area by constructing new facilities for water supply,
thereby contributing to improving residents’ quality of life and to stimulate the economic
development in the target area.
Loan Amount / Disbursed Amount 6,412 million yen / 6,327 million yen
Exchange of Notes / Loan
Agreement Signing Date
June 2000 / February 2001
Terms and Conditions Interest Rate:1.70% (0.75% for Consulting Services)
Repayment Period:30 years (40 years for Consulting Services)
(Grace Period:10 years)
Conditions for Procurement: General Untied (Bilateral Tied for
Consulting Services)
Borrower / Executing Agencies Office National de l’Eau Potable, ONEP / The same
Final Disbursement Date June 2008
Main Contractors (over 1 billion
yen)
Sogea Maroc S.A.(Morocco) / Omce (Morocco) / Sogetrama
Gls (Morocco) (JV), Sogea Moroc S.A. (Morocco) / Sogea
Satom S.A. (Morocco) / Sehi (Morocco) (JV)
(Note: Sogea Maroc S.A. was awarded two contracts as a
member company of Joint Venture.)
1 The population as of 2001 was approx. 640,000 people. (Source: Documents provided by ONEP)
3
Main Consultant (over 100 million
yen)
Nihon Jogesuido Sekkei Co., Ltd. (Japan) / Team Maroc, S.A.
(Morocco) (JV)
Feasibility Studies, etc. 1996 Master Plan Study (by ONEP)
1999 Feasibility Study (by ONEP)
Related Projects, etc. AFD: Water Supply Project at Agadir and Fez (1998 – 2003)
KfW: Rural Water Supply Project in Agadir (2008 – On going)
ONEP: Rural Water Supply Project (2009 – On going)
2.Outline of the Evaluation Study2.1 External Evaluator
Hajime Onishi (Mitsubishi UFJ Research & Consulting)
2.2 Duration of Evaluation Study
Duration of the Study: December, 2010 – December, 2011
Duration of the Field Study: April 20, 2011 – May 4, 2011 / August 15, 2011
– August 22, 2011
2.3 Constraints during the Evaluation Study
None.
3.Result of the Evaluation (Overall Rating: A2)3.1 Relevance (Rating:③3)
3.1.1 Relevance with the Development Plan of Morocco
Relevance with the national policies
At the time that the project appraisal was being carried out in 2001, the Moroccan
government had focused on water sector development as one of the major policies in the
Economic and Social Development Plan (2000-2004). In this plan, the population served by
water supply systems in the urban area and that in the rural area were 89% and 62%
respectively as target values, aiming at an increase in the percentage of the population served
both in urban and rural areas in Morocco.
Meanwhile, the enhancement of export competitiveness of the industrial sector and the
improvement in service delivery of basic infrastructure to strengthen domestic sectors have
been established as the policy goals of the present 2011 Finance Bill,4 which is the top
2 A: Highly satisfactory, B: Satisfactory, C: Partially satisfactory, D: Unsatisfactory3 ③: High, ②: Fair, ①: Low4 Following the completion of the Economic and Social Development Plan (2000-2004), no new five-yearlong-term development plan has been formulated in Morocco. For the immediate future, it has been decidedthat provisional development policies will be denoted through the Finance Bill/Finance Act of each year.

4
priority national plan. In order to achieve these goals, “to promote investment for water
supply and sanitation sector” as well as for energy and distribution sectors has been decided
upon as one of the priority fields. Additionally, the National Initiative on Human
Development, established in May 2005 by His Majesty King Mohamed VI, sought the
improvement in accessibility to the basic social services including those of water supply,
especially focusing on accelerating the provision of basic infrastructure such as water supply
facilities in rural areas.
Therefore, for both the project planning and the ex-post evaluation, water sector
development, especially the promotion of investment in the water supply and sewerage
projects in urban areas, has been assigned high priority in higher-level national policies. Thus,
consistency between this project’s objective of “to provide the safe water and to improve
resident’s quality of life by constructing new facilities for water supply” and national policy
is very high.
Relevance with the sector policies
At the time of appraisal in 2001, in both the Master Plan for the Potable Water Supply
Sector (approved by the Government of Morocco in 1999) and the Urban Portable Water
Supply Plan as part of the investment program 2000-2004 of ONEP, the provision and
improvement of water supply facilities in Greater Agadir was positioned as being of the
highest priority.
As of 2011 as well, ONEP’s next investment program for 2011-2015 continues to hold up
the “improvement in access to safe drinking water by the provision of water supply
infrastructure” as a mission of the utmost importance. In this program, it is planned that more
than 50% of the total budget for five years will be invested in water supply projects in urban
areas and the percentage of drinking water supplied by water piping will be targeted to 95% in
rural areas by 2015. As for the Greater Agadir area, a seawater desalination project is
currently ongoing in anticipation of the water supply shortage in a few years, making progress
in the prioritized development of water supply infrastructure.
Therefore, for both program planning and ex-post evaluation, water supply development in
the Greater Agadir has been highly prioritized in the objectives for sector policies, and the
direction of the project is completely relevant to those policies.
3.1.2 Relevance with the Development Needs of Morocco
In 2000, water demand in the Greater Agadir area had rapidly increased and it was
anticipated that the demand would reach the total supply capacity of 960 liter/sec. in 2004. As
shown in Table 1 below, the water supply capacity has been significantly strengthened by
approximately 35% in April 2007. This is as a result of the start of operation at the facilities
5
related to this project, including water treatment plants. On the other hand, the maximum
daily demand for water has increased at an average of 11% each year, again approaching the
maximum capacity of daily water supply. The demand-supply gap that had once been
mitigated by this project is again shortening.5
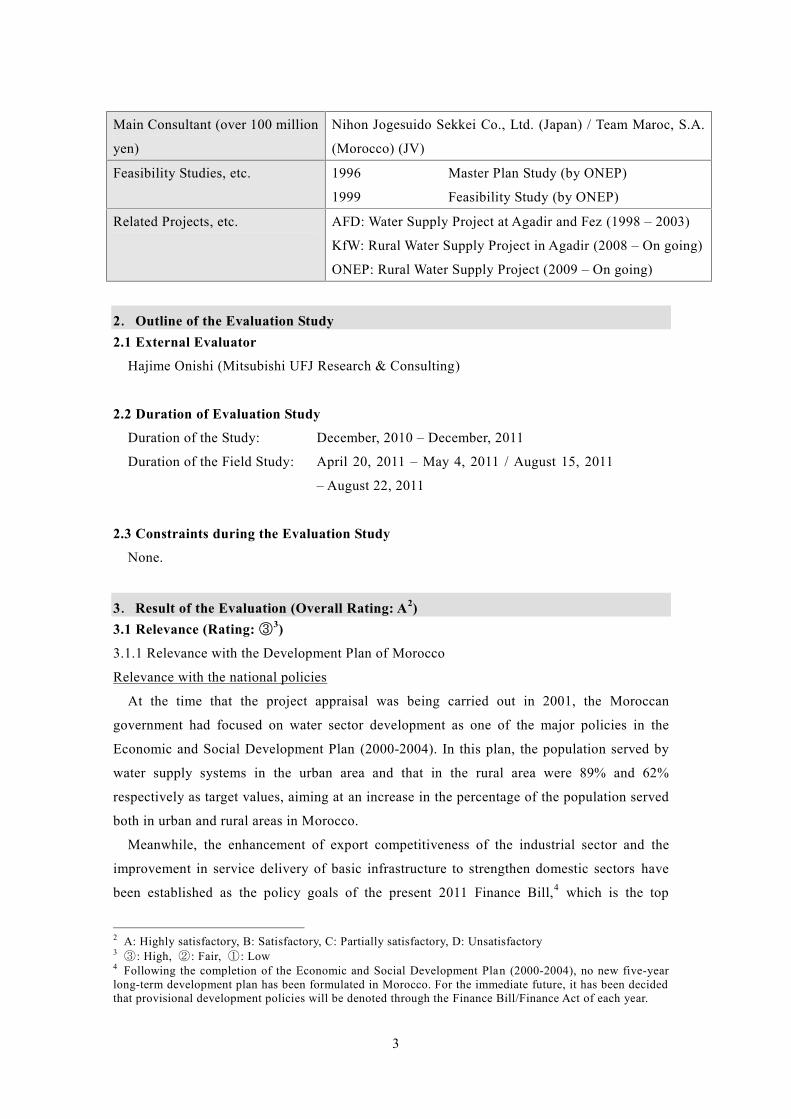
Table-1: Water Demand and Supply in Greater Agadir Area(Unit: liter/sec., not applied to water connection rate)
YearMaximum DailyWater Supply
a
Maximum DailyWater Demand
b
Demand -Supply Gap
b-a
WaterConnection Rate
%
2000 863 669 -194 732006 1,300 1,266 -34 84
20071) 1,760 1,427 -333 872008 1,760 1,588 -172 902009 1,960 1,749 -211 942010 1,960 1,910 -50 962014 3,000 2,500 -500 n.a.2020 3,000 2,800 -200 n.a.2022 3,000 3,000 0 n.a.
Source: Answers to the questionnaire to ONEP, documents provided by Régie AutonomeMulti-Services d'Agadir (RAMSA), JICA Mid-Term Review Report, etc.
Note-1): Italic figures show estimated ones.Note-2): The operation of the project facilities started in April 2007 and Phase-II
facilities of the project (Capacity: 200 liter/sec.) did in 2009.
Maximum demand is predicted to reach 3,000 liter/sec. in 2022, and the supply of safe
water through the expansion of water supply capacity continues to be a pressing task. Had this
project——which achieved a substantial increase of water supply capacity and greatly
contributed to bridging the supply-demand gap——not been implemented, the demand would
have exceeded the supply capacity after 2006. This would have resulted in inducing negative
impacts on the service delivery of water supply in the Greater Agadir area.
3.1.3 Relevance with Japan’s ODA Policy
At the time of the project appraisal in 2001, the former Japan Bank for International
Cooperation (JBIC) set the infrastructure for development which supports sustainable growth,
enhances global competitiveness and promotes private investments as one of the target sectors
on the Medium-Term Strategy for Overseas Economic Cooperation Operations to Morocco.
Under this strategy, JBIC undertook a course of assisting Morocco that centered on
5 Régie Autonome Multi-Services d'Agadir (RAMSA) which is in charge of water distribution in the GreaterAgadir area is now implementing a seawater desalination plant construction project with a public-privatepartnership (PPP). The operation of the plant with the water supply capacity of 1,000 liter/sec. willcommence in 2014. Although the demand-supply gap in Greater Agadir will be mitigated by this operation,it is also anticipated that the maximum water demand may exceed the maximum water supply from the latterhalf of 2011 to 2014. (For this critical situation, possible options such as the utilization of groundwater, anincrease in the amount of water intake from the Moulay Abdellah Dam, etc. were currently considered.) Asfor the seawater desalination project, it is feared that the production cost of water might be increased and itmay be passed on to the customers’ charge.
6
infrastructure development, especially on water supply development programs. Therefore,
this project was extremely consistent with Japan’s aid policies.
This project has been highly relevant with the country’s development plan, development
needs, as well as Japan’s ODA policy; therefore its relevance is high.
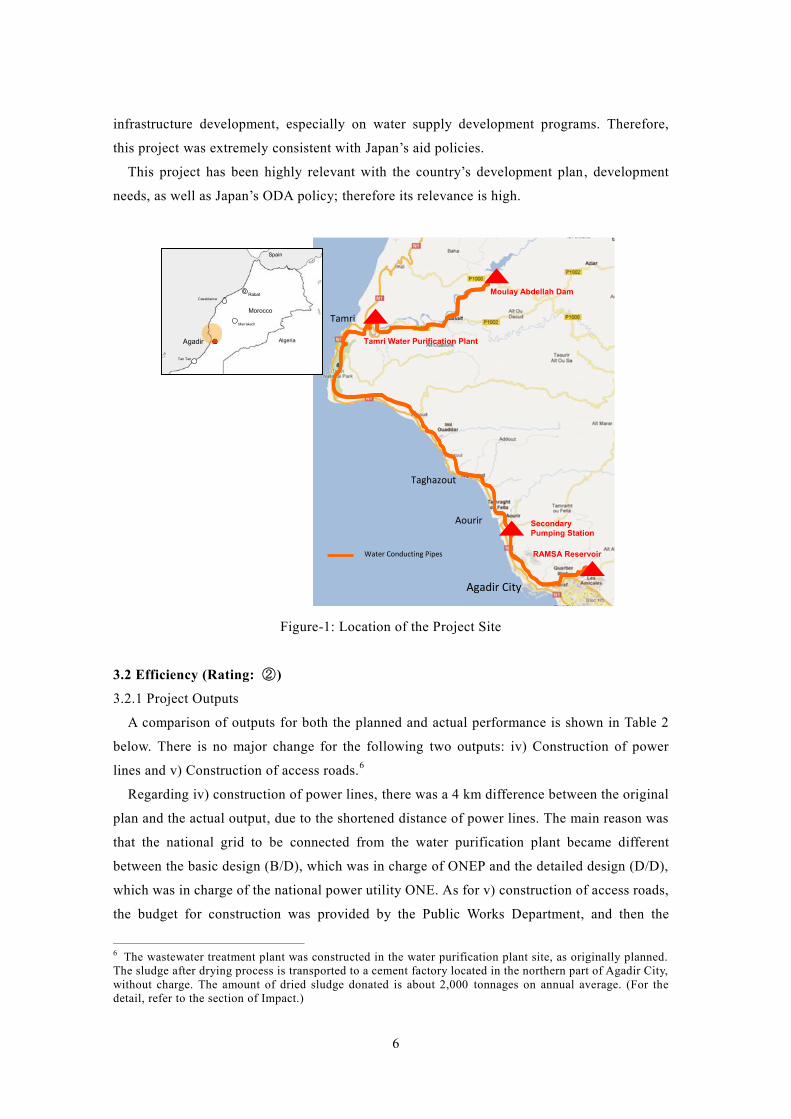
Agadir City
SecondaryPumping Station
Moulay Abdellah Dam
Tamri Water Purification Plant
RAMSA Reservoir
Aourir
Taghazout
Tamri
Water Conducting Pipes
Agadir City
SecondaryPumping Station
Moulay Abdellah Dam
Tamri Water Purification Plant
RAMSA Reservoir
Aourir
Taghazout
Tamri
Water Conducting Pipes
Morocco
Algeria
Spain
Rabat
Agadir
Casablanca
Marrakech
Tan Tan
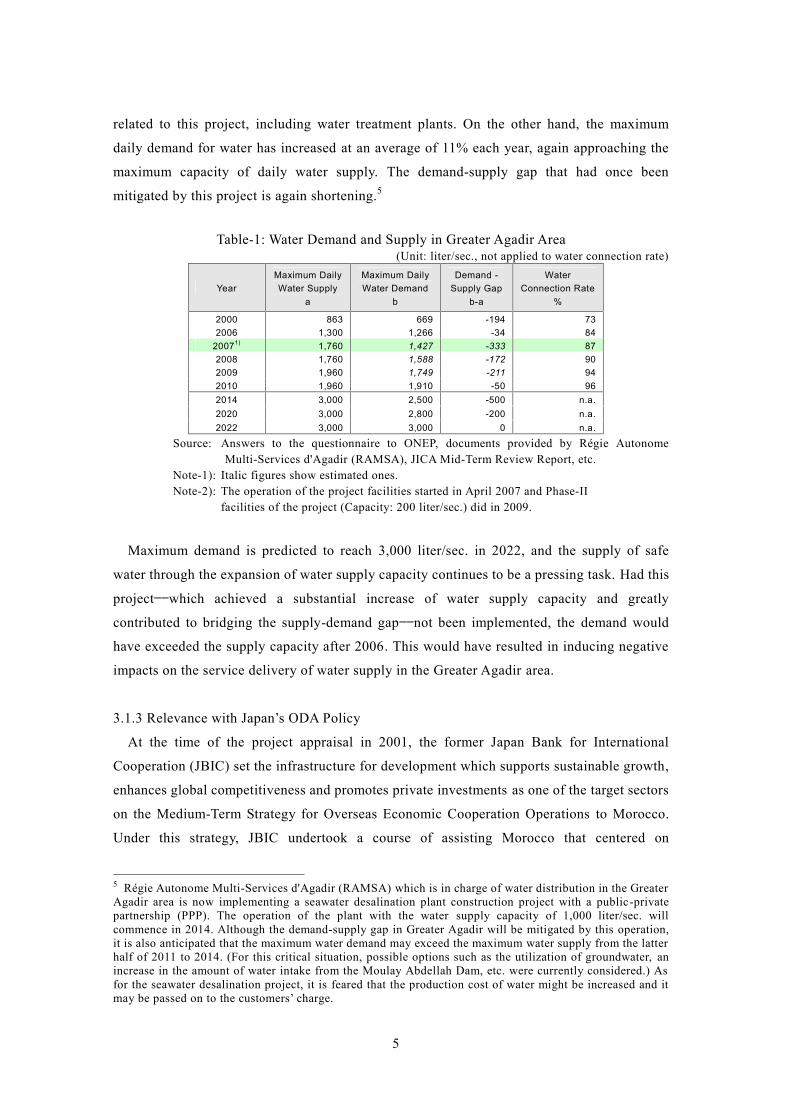
Figure-1: Location of the Project Site
3.2 Efficiency (Rating: ②)
3.2.1 Project Outputs
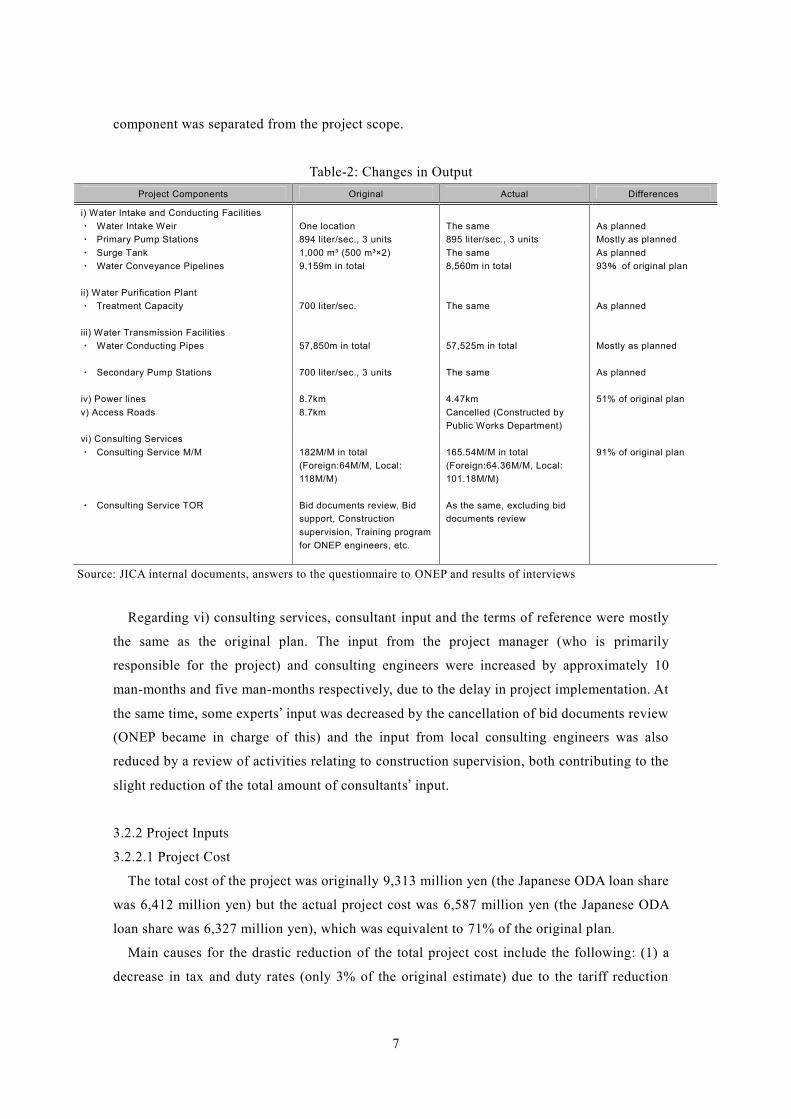
A comparison of outputs for both the planned and actual performance is shown in Table 2
below. There is no major change for the following two outputs: iv) Construction of power
lines and v) Construction of access roads.6
Regarding iv) construction of power lines, there was a 4 km difference between the original
plan and the actual output, due to the shortened distance of power lines. The main reason was
that the national grid to be connected from the water purification plant became different
between the basic design (B/D), which was in charge of ONEP and the detailed design (D/D),
which was in charge of the national power utility ONE. As for v) construction of access roads,
the budget for construction was provided by the Public Works Department, and then the
6 The wastewater treatment plant was constructed in the water purification plant site, as originally planned.The sludge after drying process is transported to a cement factory located in the northern part of Agadir City,without charge. The amount of dried sludge donated is about 2,000 tonnages on annual average. (For thedetail, refer to the section of Impact.)
7
component was separated from the project scope.
Table-2: Changes in OutputProject Components Original Actual Differences
i) Water Intake and Conducting Facilities・ Water Intake Weir・ Primary Pump Stations・ Surge Tank・ Water Conveyance Pipelines
ii) Water Purification Plant・ Treatment Capacity
iii) Water Transmission Facilities・ Water Conducting Pipes
・ Secondary Pump Stations
iv) Power linesv) Access Roads
One location894 liter/sec., 3 units1,000 m³ (500 m³×2)9,159m in total
700 liter/sec.
57,850m in total
700 liter/sec., 3 units
8.7km8.7km
The same895 liter/sec., 3 unitsThe same8,560m in total
The same
57,525m in total
The same
4.47kmCancelled (Constructed byPublic Works Department)
As plannedMostly as plannedAs planned93% of original plan
As planned
Mostly as planned
As planned
51% of original plan
vi) Consulting Services・ Consulting Service M/M
・ Consulting Service TOR
182M/M in total(Foreign:64M/M, Local:118M/M)
Bid documents review, Bidsupport, Constructionsupervision, Training programfor ONEP engineers, etc.
165.54M/M in total(Foreign:64.36M/M, Local:101.18M/M)
As the same, excluding biddocuments review
91% of original plan
Source: JICA internal documents, answers to the questionnaire to ONEP and results of interviews
Regarding vi) consulting services, consultant input and the terms of reference were mostly
the same as the original plan. The input from the project manager (who is primarily
responsible for the project) and consulting engineers were increased by approximately 10
man-months and five man-months respectively, due to the delay in project implementation. At
the same time, some experts’ input was decreased by the cancellation of bid documents review
(ONEP became in charge of this) and the input from local consulting engineers was also
reduced by a review of activities relating to construction supervision, both contributing to the
slight reduction of the total amount of consultants’ input.
3.2.2 Project Inputs
3.2.2.1 Project Cost
The total cost of the project was originally 9,313 million yen (the Japanese ODA loan share
was 6,412 million yen) but the actual project cost was 6,587 million yen (the Japanese ODA
loan share was 6,327 million yen), which was equivalent to 71% of the original plan.
Main causes for the drastic reduction of the total project cost include the following: (1) a
decrease in tax and duty rates (only 3% of the original estimate) due to the tariff reduction
8
after the commencement of the project, and (2) a decrease in land acquisition costs (28% of
the original estimate). As already stated in the Section 3.2.1 Project Outputs, the cancellation
of the construction of access roads did not affect the changes in project cost, mainly because
of its magnitude to the total project cost. (Note that the original estimate was lower than 100
million yen).
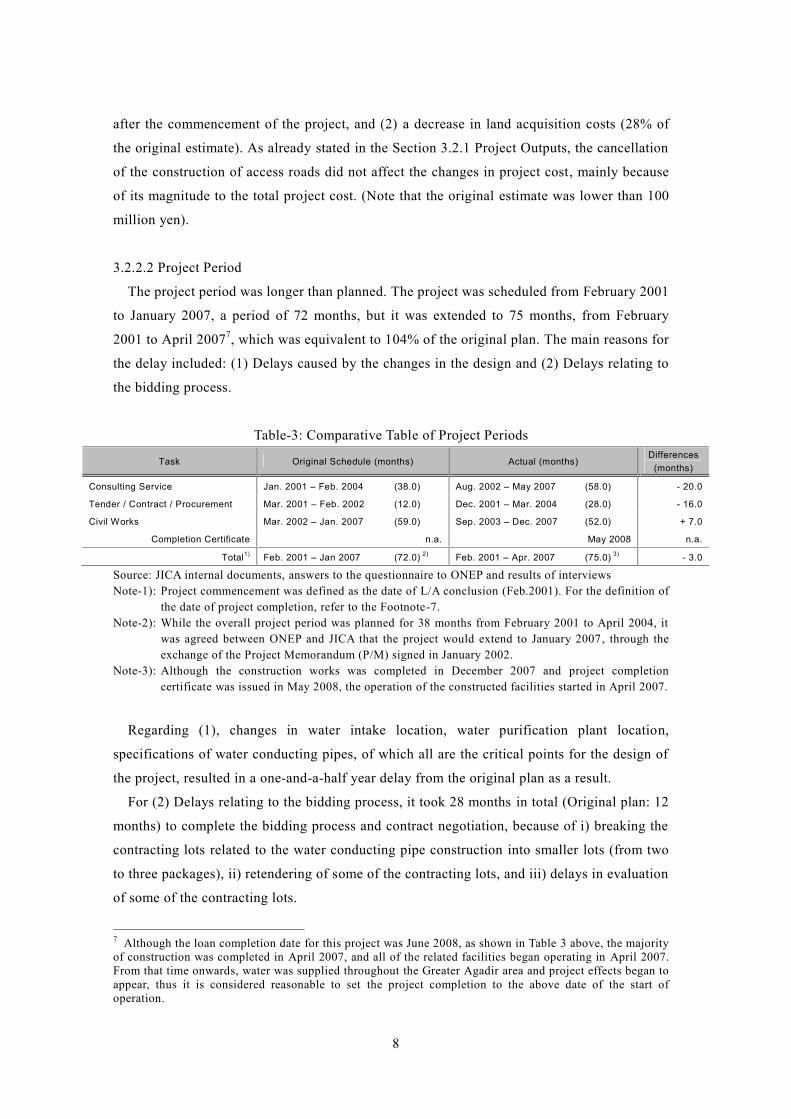
3.2.2.2 Project Period
The project period was longer than planned. The project was scheduled from February 2001
to January 2007, a period of 72 months, but it was extended to 75 months, from February
2001 to April 20077, which was equivalent to 104% of the original plan. The main reasons for
the delay included: (1) Delays caused by the changes in the design and (2) Delays relating to
the bidding process.
Table-3: Comparative Table of Project Periods
Task Original Schedule (months) Actual (months)Differences
(months)
Consulting Service Jan. 2001 – Feb. 2004 (38.0) Aug. 2002 – May 2007 (58.0) - 20.0
Tender / Contract / Procurement Mar. 2001 – Feb. 2002 (12.0) Dec. 2001 – Mar. 2004 (28.0) - 16.0
Civil Works Mar. 2002 – Jan. 2007 (59.0) Sep. 2003 – Dec. 2007 (52.0) + 7.0
Completion Certificate n.a. May 2008 n.a.
Total1) Feb. 2001 – Jan 2007 (72.0) 2) Feb. 2001 – Apr. 2007 (75.0) 3) - 3.0
Source: JICA internal documents, answers to the questionnaire to ONEP and results of interviewsNote-1): Project commencement was defined as the date of L/A conclusion (Feb.2001). For the definition of
the date of project completion, refer to the Footnote-7.Note-2): While the overall project period was planned for 38 months from February 2001 to April 2004, it
was agreed between ONEP and JICA that the project would extend to January 2007, through theexchange of the Project Memorandum (P/M) signed in January 2002.
Note-3): Although the construction works was completed in December 2007 and project completioncertificate was issued in May 2008, the operation of the constructed facilities started in April 2007.
Regarding (1), changes in water intake location, water purification plant location,
specifications of water conducting pipes, of which all are the critical points for the design of
the project, resulted in a one-and-a-half year delay from the original plan as a result.
For (2) Delays relating to the bidding process, it took 28 months in total (Original plan: 12
months) to complete the bidding process and contract negotiation, because of i) breaking the
contracting lots related to the water conducting pipe construction into smaller lots (from two
to three packages), ii) retendering of some of the contracting lots, and iii) delays in evaluation
of some of the contracting lots.
7 Although the loan completion date for this project was June 2008, as shown in Table 3 above, the majorityof construction was completed in April 2007, and all of the related facilities began operating in April 2007.From that time onwards, water was supplied throughout the Greater Agadir area and project effects began toappear, thus it is considered reasonable to set the project completion to the above date of the start ofoperation.
9
Construction work was made very difficult as a result of restrictions on construction work
due to topographical and geographical conditions along the construction sites.8 However, the
construction period was shortened by seven months compared with the original duration, due
to the strengthening of the construction supervision and the dedicated efforts taken by the
executing agency ONEP and the consultant team. In addition, the cancellation of the
construction of access roads did not affect the project period.
Although the project cost was lower than planned, the project period was longer than
planned (104% of the original plan), therefore efficiency of the project is fair.
3.3 Effectiveness (Rating: ③)
3.3.1 Quantitative Effects
3.3.1.1 Results from Operation and Effect Indicators
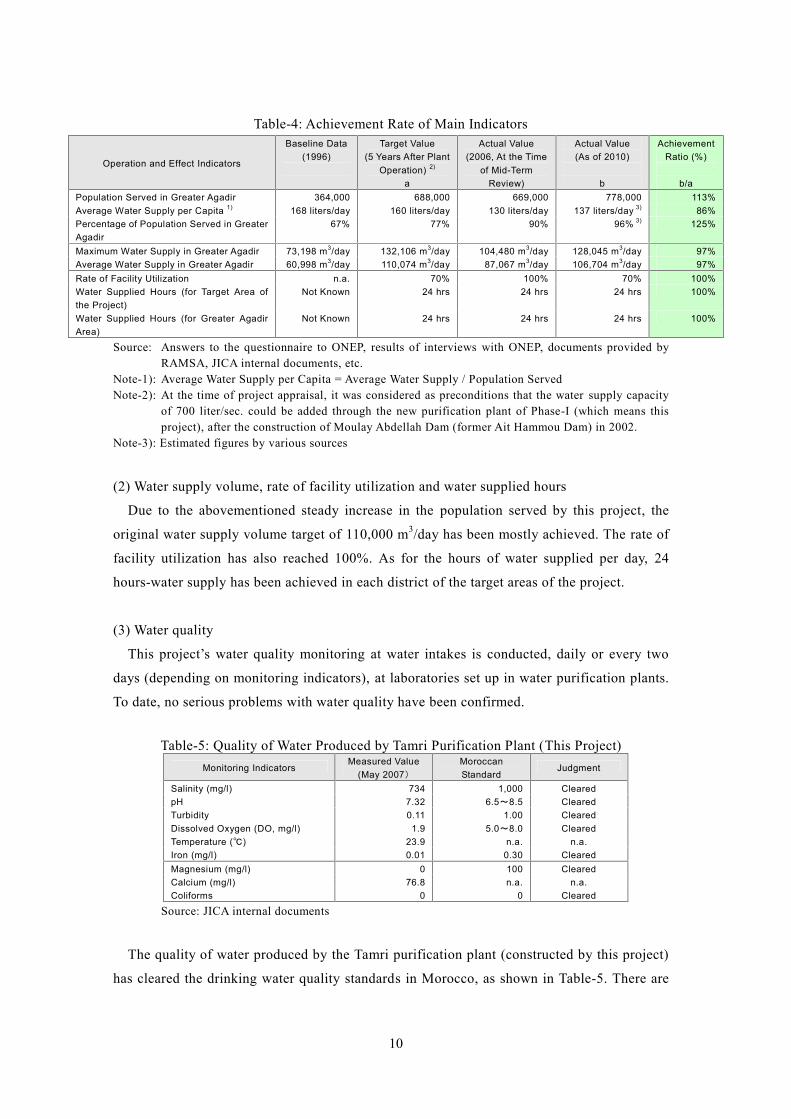
(1) Population served, average water supply per capita and percentage of population served
Population served by this project: As of the end of 2010, the population served by this
project within the target areas reached to approximately 780,000 people, which exceeded the
target value (as of five years after the plant operation) of 688,000. After completion of
facilities related to this project, various work 9 aimed at increasing connections led by
RAMSA has succeeded, and the number of households connected to the distribution network
has been steadily growing at an average of 7.6% a year since 2006.
Average water supply per capita: The per capita water volume supplied for Greater
Agadir, which includes the area in this project, was 137 liters/day (converted with an average
of 4.27 persons per household) as of the end of 2011, being slightly lower than the target
value (as of five years after the operation) of 160 liters/day. Two main factors are thought to
be behind the target: (1) The increase in the water tariff in 2006, and (2) The awareness
activities such as the water conservation campaign developed nationwide by ONEP and
environmental ministries and agencies.
Percentage of population served: The percentage of the population served by the water
supply in the Greater Agadir area has reached 96% as of 2010, which greatly exceeds the
original target of 77%, due to the aforementioned steady growth of the population served by
this project.
8 The contractor had a hard time securing the space for construction, transporting materials and equipmen t,and ensuring safety (especially in heavy rain) because approximately 50% of the pipe construction work,among the construction of water conducting pipeline of 57km in total, was implemented along the nationalhighway that was located on top of the cliff in a coastal terrace. (Source: Results of interview with ONEPAgadir Office)9 Customer service improvements through the removal of public taps, construction of distribution pipeline,appropriate operation and maintenance of distribution network, etc.
10
Table-4: Achievement Rate of Main Indicators
Operation and Effect Indicators
Baseline Data(1996)
Target Value(5 Years After Plant
Operation) 2)
a
Actual Value(2006, At the Time
of Mid-TermReview)
Actual Value(As of 2010)
b
AchievementRatio (%)
b/aPopulation Served in Greater Agadir 364,000 688,000 669,000 778,000 113%Average Water Supply per Capita 1) 168 liters/day 160 liters/day 130 liters/day 137 liters/day 3) 86%Percentage of Population Served in GreaterAgadir
67% 77% 90% 96% 3) 125%
Maximum Water Supply in Greater Agadir 73,198 m3/day 132,106 m3/day 104,480 m3/day 128,045 m3/day 97%Average Water Supply in Greater Agadir 60,998 m3/day 110,074 m3/day 87,067 m3/day 106,704 m3/day 97%Rate of Facility Utilization n.a. 70% 100% 70% 100%Water Supplied Hours (for Target Area ofthe Project)
Not Known 24 hrs 24 hrs 24 hrs 100%
Water Supplied Hours (for Greater AgadirArea)
Not Known 24 hrs 24 hrs 24 hrs 100%
Source: Answers to the questionnaire to ONEP, results of interviews with ONEP, documents provided byRAMSA, JICA internal documents, etc.
Note-1): Average Water Supply per Capita = Average Water Supply / Population ServedNote-2): At the time of project appraisal, it was considered as preconditions that the water supply capacity
of 700 liter/sec. could be added through the new purification plant of Phase-I (which means thisproject), after the construction of Moulay Abdellah Dam (former Ait Hammou Dam) in 2002.
Note-3): Estimated figures by various sources
(2) Water supply volume, rate of facility utilization and water supplied hours
Due to the abovementioned steady increase in the population served by this project, the
original water supply volume target of 110,000 m3/day has been mostly achieved. The rate of
facility utilization has also reached 100%. As for the hours of water supplied per day, 24
hours-water supply has been achieved in each district of the target areas of the project.
(3) Water quality
This project’s water quality monitoring at water intakes is conducted, daily or every two
days (depending on monitoring indicators), at laboratories set up in water purification plants.
To date, no serious problems with water quality have been confirmed.
Table-5: Quality of Water Produced by Tamri Purification Plant (This Project)Monitoring Indicators
Measured Value(May 2007)
MoroccanStandard
Judgment
Salinity (mg/l) 734 1,000 ClearedpH 7.32 6.5~8.5 ClearedTurbidity 0.11 1.00 ClearedDissolved Oxygen (DO, mg/l) 1.9 5.0~8.0 ClearedTemperature (℃) 23.9 n.a. n.a.Iron (mg/l) 0.01 0.30 ClearedMagnesium (mg/l) 0 100 ClearedCalcium (mg/l) 76.8 n.a. n.a.Coliforms 0 0 Cleared
Source: JICA internal documents
The quality of water produced by the Tamri purification plant (constructed by this project)
has cleared the drinking water quality standards in Morocco, as shown in Table-5. There are
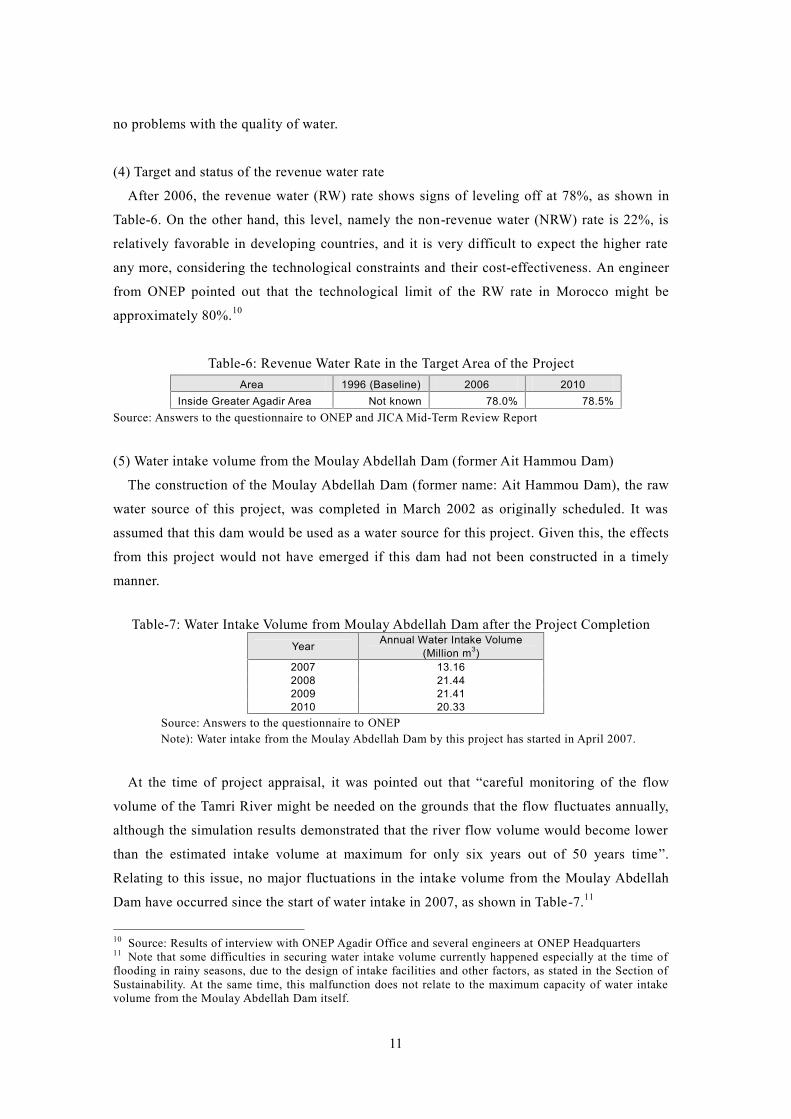
11
no problems with the quality of water.
(4) Target and status of the revenue water rate
After 2006, the revenue water (RW) rate shows signs of leveling off at 78%, as shown in
Table-6. On the other hand, this level, namely the non-revenue water (NRW) rate is 22%, is
relatively favorable in developing countries, and it is very difficult to expect the higher rate
any more, considering the technological constraints and their cost-effectiveness. An engineer
from ONEP pointed out that the technological limit of the RW rate in Morocco might be
approximately 80%.10
Table-6: Revenue Water Rate in the Target Area of the ProjectArea 1996 (Baseline) 2006 2010
Inside Greater Agadir Area Not known 78.0% 78.5%Source: Answers to the questionnaire to ONEP and JICA Mid-Term Review Report
(5) Water intake volume from the Moulay Abdellah Dam (former Ait Hammou Dam)
The construction of the Moulay Abdellah Dam (former name: Ait Hammou Dam), the raw
water source of this project, was completed in March 2002 as originally scheduled. It was
assumed that this dam would be used as a water source for this project. Given this, the effects
from this project would not have emerged if this dam had not been constructed in a timely
manner.
Table-7: Water Intake Volume from Moulay Abdellah Dam after the Project CompletionYear Annual Water Intake Volume
(Million m3)2007 13.162008 21.442009 21.412010 20.33
Source: Answers to the questionnaire to ONEPNote): Water intake from the Moulay Abdellah Dam by this project has started in April 2007.
At the time of project appraisal, it was pointed out that “careful monitoring of the flow
volume of the Tamri River might be needed on the grounds that the flow fluctuates annually,
although the simulation results demonstrated that the river flow volume would become lower
than the estimated intake volume at maximum for only six years out of 50 years time”.
Relating to this issue, no major fluctuations in the intake volume from the Moulay Abdellah
Dam have occurred since the start of water intake in 2007, as shown in Table-7.11
10 Source: Results of interview with ONEP Agadir Office and several engineers at ONEP Headquarters11 Note that some difficulties in securing water intake volume currently happened especially at the time offlooding in rainy seasons, due to the design of intake facilities and other factors, as stated in the Section ofSustainability. At the same time, this malfunction does not relate to the maximum capacity of water intakevolume from the Moulay Abdellah Dam itself.
12
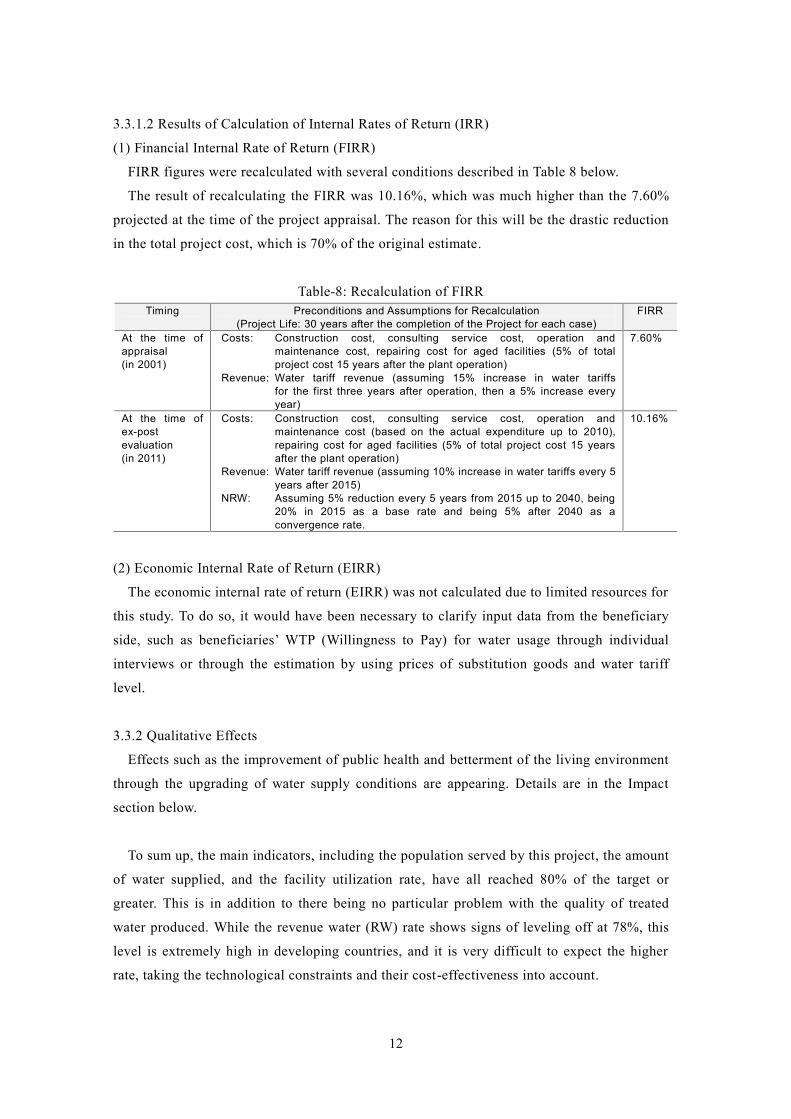
3.3.1.2 Results of Calculation of Internal Rates of Return (IRR)
(1) Financial Internal Rate of Return (FIRR)
FIRR figures were recalculated with several conditions described in Table 8 below.
The result of recalculating the FIRR was 10.16%, which was much higher than the 7.60%
projected at the time of the project appraisal. The reason for this will be the drastic reduction
in the total project cost, which is 70% of the original estimate.
Table-8: Recalculation of FIRRTiming Preconditions and Assumptions for Recalculation
(Project Life: 30 years after the completion of the Project for each case)FIRR
At the time ofappraisal(in 2001)
Costs: Construction cost, consulting service cost, operation andmaintenance cost, repairing cost for aged facilities (5% of totalproject cost 15 years after the plant operation)
Revenue: Water tariff revenue (assuming 15% increase in water tariffsfor the first three years after operation, then a 5% increase everyyear)
7.60%
At the time ofex-postevaluation(in 2011)
Costs: Construction cost, consulting service cost, operation andmaintenance cost (based on the actual expenditure up to 2010),repairing cost for aged facilities (5% of total project cost 15 yearsafter the plant operation)
Revenue: Water tariff revenue (assuming 10% increase in water tariffs every 5years after 2015)
NRW: Assuming 5% reduction every 5 years from 2015 up to 2040, being20% in 2015 as a base rate and being 5% after 2040 as aconvergence rate.
10.16%
(2) Economic Internal Rate of Return (EIRR)
The economic internal rate of return (EIRR) was not calculated due to limited resources for
this study. To do so, it would have been necessary to clarify input data from the beneficiary
side, such as beneficiaries’ WTP (Willingness to Pay) for water usage through individual
interviews or through the estimation by using prices of substitution goods and water tariff
level.
3.3.2 Qualitative Effects
Effects such as the improvement of public health and betterment of the living environment
through the upgrading of water supply conditions are appearing. Details are in the Impact
section below.
To sum up, the main indicators, including the population served by this project, the amount
of water supplied, and the facility utilization rate, have all reached 80% of the target or
greater. This is in addition to there being no particular problem with the quality of treated
water produced. While the revenue water (RW) rate shows signs of leveling off at 78%, this
level is extremely high in developing countries, and it is very difficult to expect the higher
rate, taking the technological constraints and their cost-effectiveness into account.
13
This project has largely achieved its objectives; therefore its effectiveness is high.
3.4 Impact
3.4.1 Intended Impacts
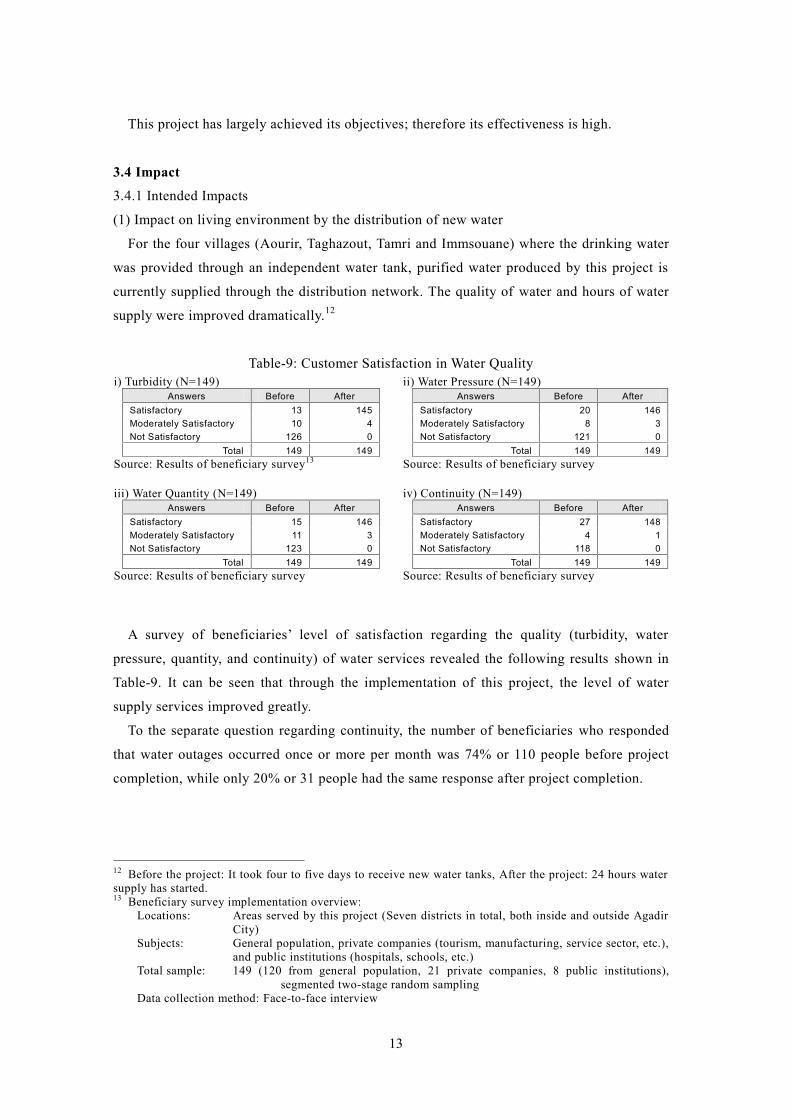
(1) Impact on living environment by the distribution of new water
For the four villages (Aourir, Taghazout, Tamri and Immsouane) where the drinking water
was provided through an independent water tank, purified water produced by this project is
currently supplied through the distribution network. The quality of water and hours of water
supply were improved dramatically.12
Table-9: Customer Satisfaction in Water Qualityi) Turbidity (N=149)
Answers Before AfterSatisfactory 13 145Moderately Satisfactory 10 4Not Satisfactory 126 0
Total 149 149Source: Results of beneficiary survey13
ii) Water Pressure (N=149)Answers Before After
Satisfactory 20 146Moderately Satisfactory 8 3Not Satisfactory 121 0
Total 149 149Source: Results of beneficiary survey
iii) Water Quantity (N=149)Answers Before After
Satisfactory 15 146Moderately Satisfactory 11 3Not Satisfactory 123 0
Total 149 149Source: Results of beneficiary survey
iv) Continuity (N=149)Answers Before After
Satisfactory 27 148Moderately Satisfactory 4 1Not Satisfactory 118 0
Total 149 149Source: Results of beneficiary survey
A survey of beneficiaries’ level of satisfaction regarding the quality (turbidity, water
pressure, quantity, and continuity) of water services revealed the following results shown in
Table-9. It can be seen that through the implementation of this project, the level of water
supply services improved greatly.
To the separate question regarding continuity, the number of beneficiaries who responded
that water outages occurred once or more per month was 74% or 110 people before project
completion, while only 20% or 31 people had the same response after project completion.
12 Before the project: It took four to five days to receive new water tanks, After the project: 24 hours watersupply has started.13 Beneficiary survey implementation overview:
Locations: Areas served by this project (Seven districts in total, both inside and outside AgadirCity)
Subjects: General population, private companies (tourism, manufacturing, service sector, etc.),and public institutions (hospitals, schools, etc.)
Total sample: 149 (120 from general population, 21 private companies, 8 public institutions),segmented two-stage random sampling
Data collection method: Face-to-face interview
14
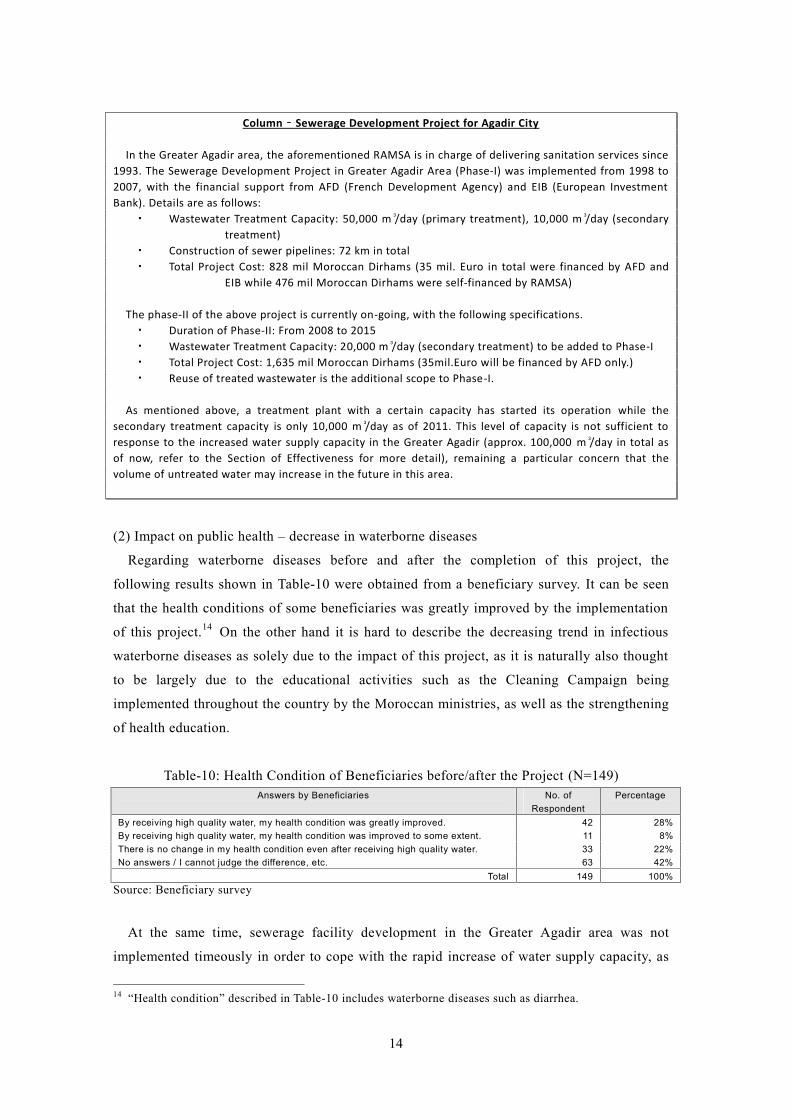
Column – Sewerage Development Project for Agadir City
In the Greater Agadir area, the aforementioned RAMSA is in charge of delivering sanitation services since1993. The Sewerage Development Project in Greater Agadir Area (Phase-I) was implemented from 1998 to2007, with the financial support from AFD (French Development Agency) and EIB (European InvestmentBank). Details are as follows:
Wastewater Treatment Capacity: 50,000 m³/day (primary treatment), 10,000 m³/day (secondarytreatment)
Construction of sewer pipelines: 72 km in totalTotal Project Cost: 828 mil Moroccan Dirhams (35 mil. Euro in total were financed by AFD and
EIB while 476 mil Moroccan Dirhams were self-financed by RAMSA)
The phase-II of the above project is currently on-going, with the following specifications.Duration of Phase-II: From 2008 to 2015Wastewater Treatment Capacity: 20,000 m³/day (secondary treatment) to be added to Phase-ITotal Project Cost: 1,635 mil Moroccan Dirhams (35mil.Euro will be financed by AFD only.)Reuse of treated wastewater is the additional scope to Phase-I.
As mentioned above, a treatment plant with a certain capacity has started its operation while thesecondary treatment capacity is only 10,000 m³/day as of 2011. This level of capacity is not sufficient toresponse to the increased water supply capacity in the Greater Agadir (approx. 100,000 m³/day in total asof now, refer to the Section of Effectiveness for more detail), remaining a particular concern that thevolume of untreated water may increase in the future in this area.
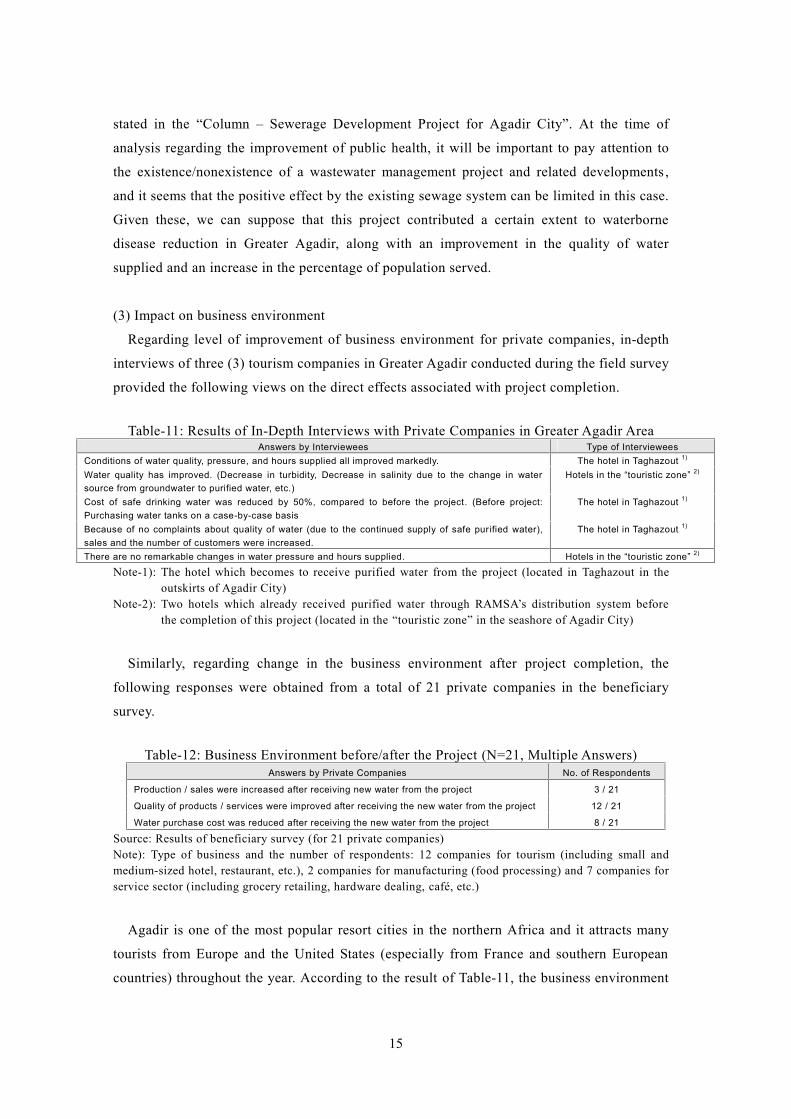
(2) Impact on public health – decrease in waterborne diseases
Regarding waterborne diseases before and after the completion of this project, the
following results shown in Table-10 were obtained from a beneficiary survey. It can be seen
that the health conditions of some beneficiaries was greatly improved by the implementation
of this project.14 On the other hand it is hard to describe the decreasing trend in infectious
waterborne diseases as solely due to the impact of this project, as it is naturally also thought
to be largely due to the educational activities such as the Cleaning Campaign being
implemented throughout the country by the Moroccan ministries, as well as the strengthening
of health education.
Table-10: Health Condition of Beneficiaries before/after the Project (N=149)Answers by Beneficiaries No. of
RespondentPercentage
By receiving high quality water, my health condition was greatly improved. 42 28%By receiving high quality water, my health condition was improved to some extent. 11 8%There is no change in my health condition even after receiving high quality water. 33 22%No answers / I cannot judge the difference, etc. 63 42%
Total 149 100%Source: Beneficiary survey
At the same time, sewerage facility development in the Greater Agadir area was not
implemented timeously in order to cope with the rapid increase of water supply capacity, as
14 “Health condition” described in Table-10 includes waterborne diseases such as diarrhea.
15
stated in the “Column – Sewerage Development Project for Agadir City”. At the time of
analysis regarding the improvement of public health, it will be important to pay attention to
the existence/nonexistence of a wastewater management project and related developments ,
and it seems that the positive effect by the existing sewage system can be limited in this case.
Given these, we can suppose that this project contributed a certain extent to waterborne
disease reduction in Greater Agadir, along with an improvement in the quality of water
supplied and an increase in the percentage of population served.
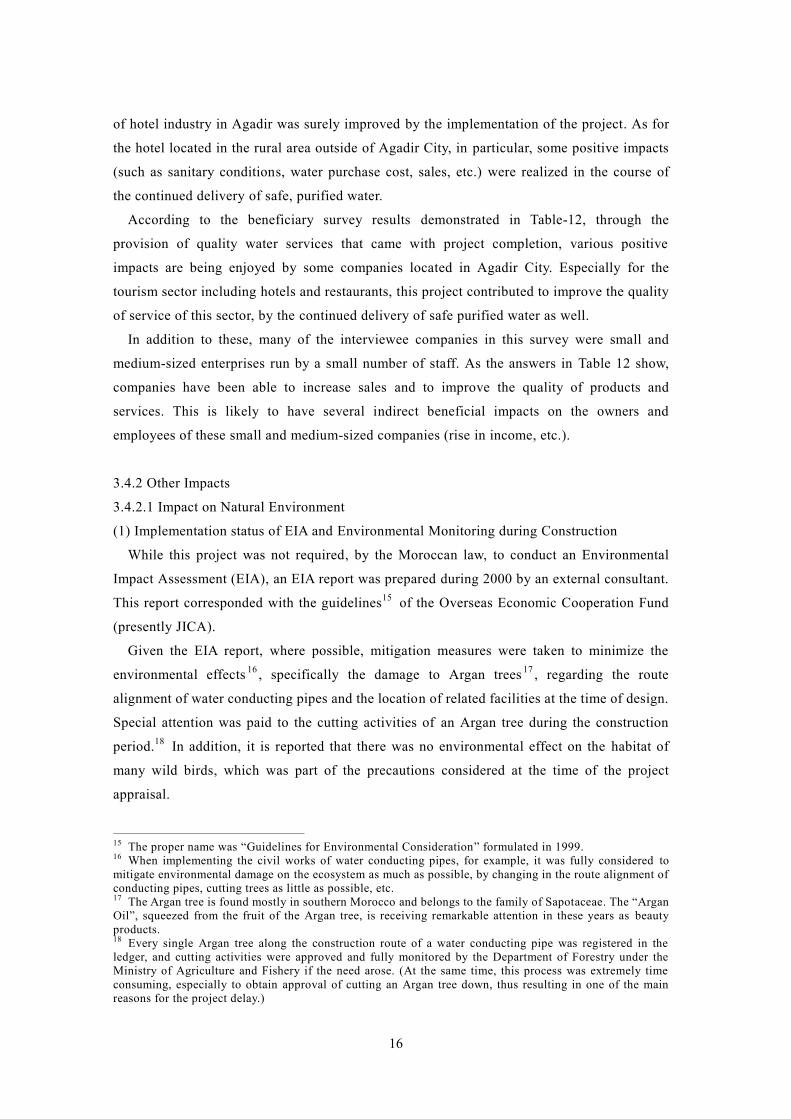
(3) Impact on business environment
Regarding level of improvement of business environment for private companies, in-depth
interviews of three (3) tourism companies in Greater Agadir conducted during the field survey
provided the following views on the direct effects associated with project completion.
Table-11: Results of In-Depth Interviews with Private Companies in Greater Agadir AreaAnswers by Interviewees Type of Interviewees
Conditions of water quality, pressure, and hours supplied all improved markedly. The hotel in Taghazout 1)
Water quality has improved. (Decrease in turbidity, Decrease in salinity due to the change in watersource from groundwater to purified water, etc.)
Hotels in the “touristic zone” 2)
Cost of safe drinking water was reduced by 50%, compared to before the project. (Before project:Purchasing water tanks on a case-by-case basis
The hotel in Taghazout 1)
Because of no complaints about quality of water (due to the continued supply of safe purified water),sales and the number of customers were increased.
The hotel in Taghazout 1)
There are no remarkable changes in water pressure and hours supplied. Hotels in the “touristic zone” 2)
Note-1): The hotel which becomes to receive purified water from the project (located in Taghazout in theoutskirts of Agadir City)
Note-2): Two hotels which already received purified water through RAMSA’s distribution system beforethe completion of this project (located in the “touristic zone” in the seashore of Agadir City)
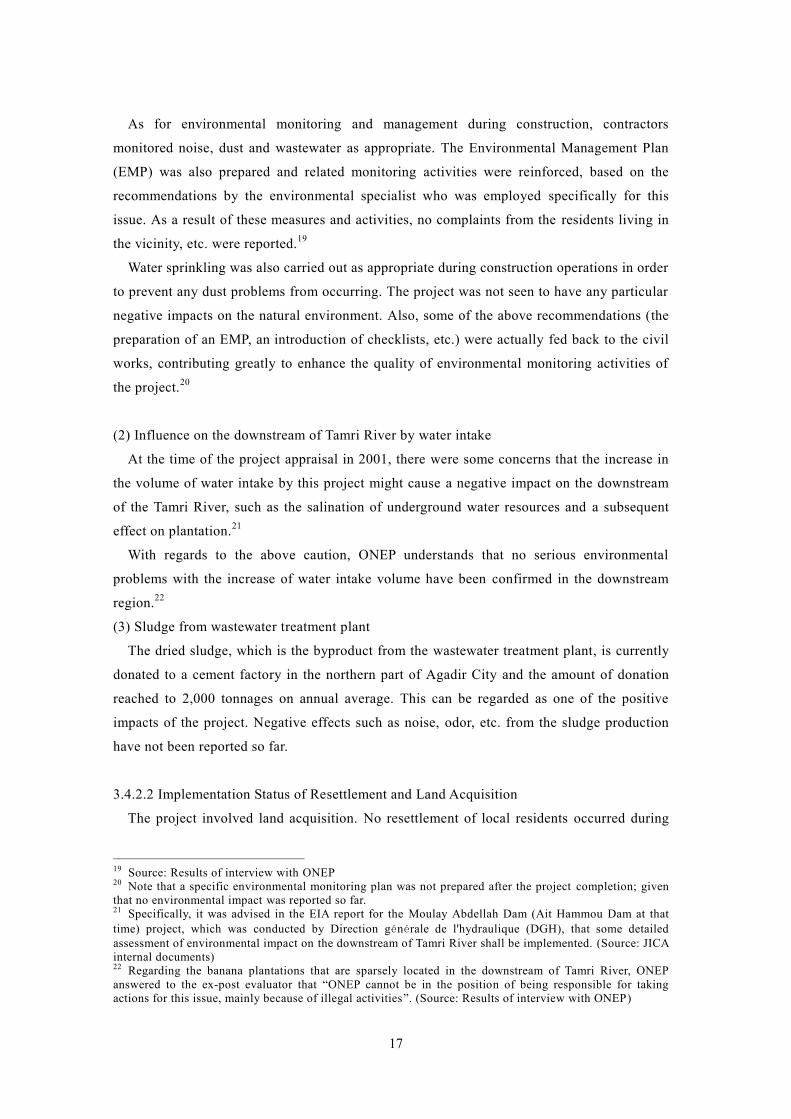
Similarly, regarding change in the business environment after project completion, the
following responses were obtained from a total of 21 private companies in the beneficiary
survey.
Table-12: Business Environment before/after the Project (N=21, Multiple Answers)Answers by Private Companies No. of Respondents
Production / sales were increased after receiving new water from the project 3 / 21
Quality of products / services were improved after receiving the new water from the project 12 / 21
Water purchase cost was reduced after receiving the new water from the project 8 / 21
Source: Results of beneficiary survey (for 21 private companies)Note): Type of business and the number of respondents: 12 companies for tourism (including small andmedium-sized hotel, restaurant, etc.), 2 companies for manufacturing (food processing) and 7 companies forservice sector (including grocery retailing, hardware dealing, café, etc.)
Agadir is one of the most popular resort cities in the northern Africa and it attracts many
tourists from Europe and the United States (especially from France and southern European
countries) throughout the year. According to the result of Table-11, the business environment
16
of hotel industry in Agadir was surely improved by the implementation of the project. As for
the hotel located in the rural area outside of Agadir City, in particular, some positive impacts
(such as sanitary conditions, water purchase cost, sales, etc.) were realized in the course of
the continued delivery of safe, purified water.
According to the beneficiary survey results demonstrated in Table-12, through the
provision of quality water services that came with project completion, various positive
impacts are being enjoyed by some companies located in Agadir City. Especially for the
tourism sector including hotels and restaurants, this project contributed to improve the quality
of service of this sector, by the continued delivery of safe purified water as well.
In addition to these, many of the interviewee companies in this survey were small and
medium-sized enterprises run by a small number of staff. As the answers in Table 12 show,
companies have been able to increase sales and to improve the quality of products and
services. This is likely to have several indirect beneficial impacts on the owners and
employees of these small and medium-sized companies (rise in income, etc.).
3.4.2 Other Impacts
3.4.2.1 Impact on Natural Environment
(1) Implementation status of EIA and Environmental Monitoring during Construction
While this project was not required, by the Moroccan law, to conduct an Environmental
Impact Assessment (EIA), an EIA report was prepared during 2000 by an external consultant.
This report corresponded with the guidelines15 of the Overseas Economic Cooperation Fund
(presently JICA).
Given the EIA report, where possible, mitigation measures were taken to minimize the
environmental effects 16 , specifically the damage to Argan trees 17 , regarding the route
alignment of water conducting pipes and the location of related facilities at the time of design.
Special attention was paid to the cutting activities of an Argan tree during the construction
period.18 In addition, it is reported that there was no environmental effect on the habitat of
many wild birds, which was part of the precautions considered at the time of the project
appraisal.
15 The proper name was “Guidelines for Environmental Consideration” formulated in 1999.16 When implementing the civil works of water conducting pipes, for example, it was fully considered tomitigate environmental damage on the ecosystem as much as possible, by changing in the route alignment ofconducting pipes, cutting trees as little as possible, etc.17 The Argan tree is found mostly in southern Morocco and belongs to the family of Sapotaceae. The “ArganOil”, squeezed from the fruit of the Argan tree, is receiving remarkable attention in these years as beautyproducts.18 Every single Argan tree along the construction route of a water conducting pipe was registered in theledger, and cutting activities were approved and fully monitored by the Department of Forestry under theMinistry of Agriculture and Fishery if the need arose. (At the same time, this process was extremely timeconsuming, especially to obtain approval of cutting an Argan tree down, thus resulting in one of the mainreasons for the project delay.)
17
As for environmental monitoring and management during construction, contractors
monitored noise, dust and wastewater as appropriate. The Environmental Management Plan
(EMP) was also prepared and related monitoring activities were reinforced, based on the
recommendations by the environmental specialist who was employed specifically for this
issue. As a result of these measures and activities, no complaints from the residents living in
the vicinity, etc. were reported.19
Water sprinkling was also carried out as appropriate during construction operations in order
to prevent any dust problems from occurring. The project was not seen to have any particular
negative impacts on the natural environment. Also, some of the above recommendations (the
preparation of an EMP, an introduction of checklists, etc.) were actually fed back to the civil
works, contributing greatly to enhance the quality of environmental monitoring activities of
the project.20
(2) Influence on the downstream of Tamri River by water intake
At the time of the project appraisal in 2001, there were some concerns that the increase in
the volume of water intake by this project might cause a negative impact on the downstream
of the Tamri River, such as the salination of underground water resources and a subsequent
effect on plantation.21
With regards to the above caution, ONEP understands that no serious environmental
problems with the increase of water intake volume have been confirmed in the downstream
region.22
(3) Sludge from wastewater treatment plant
The dried sludge, which is the byproduct from the wastewater treatment plant, is currently
donated to a cement factory in the northern part of Agadir City and the amount of donation
reached to 2,000 tonnages on annual average. This can be regarded as one of the positive
impacts of the project. Negative effects such as noise, odor, etc. from the sludge production
have not been reported so far.
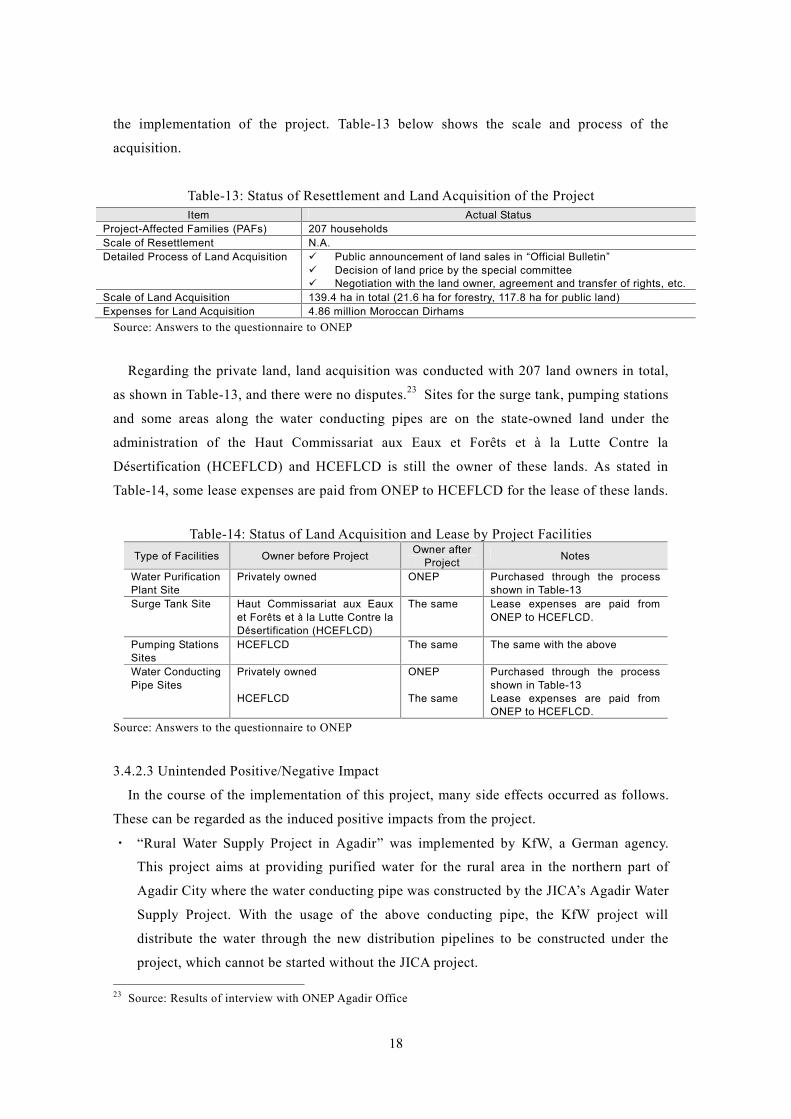
3.4.2.2 Implementation Status of Resettlement and Land Acquisition
The project involved land acquisition. No resettlement of local residents occurred during
19 Source: Results of interview with ONEP20 Note that a specific environmental monitoring plan was not prepared after the project completion; giventhat no environmental impact was reported so far.21 Specifically, it was advised in the EIA report for the Moulay Abdellah Dam (Ait Hammou Dam at thattime) project, which was conducted by Direction générale de l'hydraulique (DGH), that some detailedassessment of environmental impact on the downstream of Tamri River shall be implemented. (Source: JICAinternal documents)22 Regarding the banana plantations that are sparsely located in the downstream of Tamri River, ONEPanswered to the ex-post evaluator that “ONEP cannot be in the position of being responsible for takingactions for this issue, mainly because of illegal activities”. (Source: Results of interview with ONEP)
18
the implementation of the project. Table-13 below shows the scale and process of the
acquisition.
Table-13: Status of Resettlement and Land Acquisition of the ProjectItem Actual Status
Project-Affected Families (PAFs) 207 householdsScale of Resettlement N.A.Detailed Process of Land Acquisition Public announcement of land sales in “Official Bulletin”
Decision of land price by the special committee Negotiation with the land owner, agreement and transfer of rights, etc.
Scale of Land Acquisition 139.4 ha in total (21.6 ha for forestry, 117.8 ha for public land)Expenses for Land Acquisition 4.86 million Moroccan Dirhams
Source: Answers to the questionnaire to ONEP
Regarding the private land, land acquisition was conducted with 207 land owners in total,
as shown in Table-13, and there were no disputes.23 Sites for the surge tank, pumping stations
and some areas along the water conducting pipes are on the state-owned land under the
administration of the Haut Commissariat aux Eaux et Forêts et à la Lutte Contre la
Désertification (HCEFLCD) and HCEFLCD is still the owner of these lands. As stated in
Table-14, some lease expenses are paid from ONEP to HCEFLCD for the lease of these lands.
Table-14: Status of Land Acquisition and Lease by Project FacilitiesType of Facilities Owner before Project Owner after
Project Notes
Water PurificationPlant Site
Privately owned ONEP Purchased through the processshown in Table-13
Surge Tank Site Haut Commissariat aux Eauxet Forêts et à la Lutte Contre laDésertification (HCEFLCD)
The same Lease expenses are paid fromONEP to HCEFLCD.
Pumping StationsSites
HCEFLCD The same The same with the above
Water ConductingPipe Sites
Privately owned
HCEFLCD
ONEP
The same
Purchased through the processshown in Table-13Lease expenses are paid fromONEP to HCEFLCD.
Source: Answers to the questionnaire to ONEP
3.4.2.3 Unintended Positive/Negative Impact
In the course of the implementation of this project, many side effects occurred as follows.
These can be regarded as the induced positive impacts from the project.
・ “Rural Water Supply Project in Agadir” was implemented by KfW, a German agency.
This project aims at providing purified water for the rural area in the northern part of
Agadir City where the water conducting pipe was constructed by the JICA’s Agadir Water
Supply Project. With the usage of the above conducting pipe, the KfW project will
distribute the water through the new distribution pipelines to be constructed under the
project, which cannot be started without the JICA project.
23 Source: Results of interview with ONEP Agadir Office
19
・ Similarly, the rural water supply project, which is currently implemented by ONEP in the
vicinity of the target areas of the KfW project, also plans to utilize the JICA’s conducting
pipe for distributing the water. If the JICA project had not been implemented, this project
could not have been launched as well.
To sum up, in addition to making contributions to improving the living environment of
beneficiaries, this project, through its implementation, has significantly improved water
supply services and service levels, and is contributing to the amelioration of the business
environment for local companies. One can say that many positive impacts have been
generated through this project’s implementation.
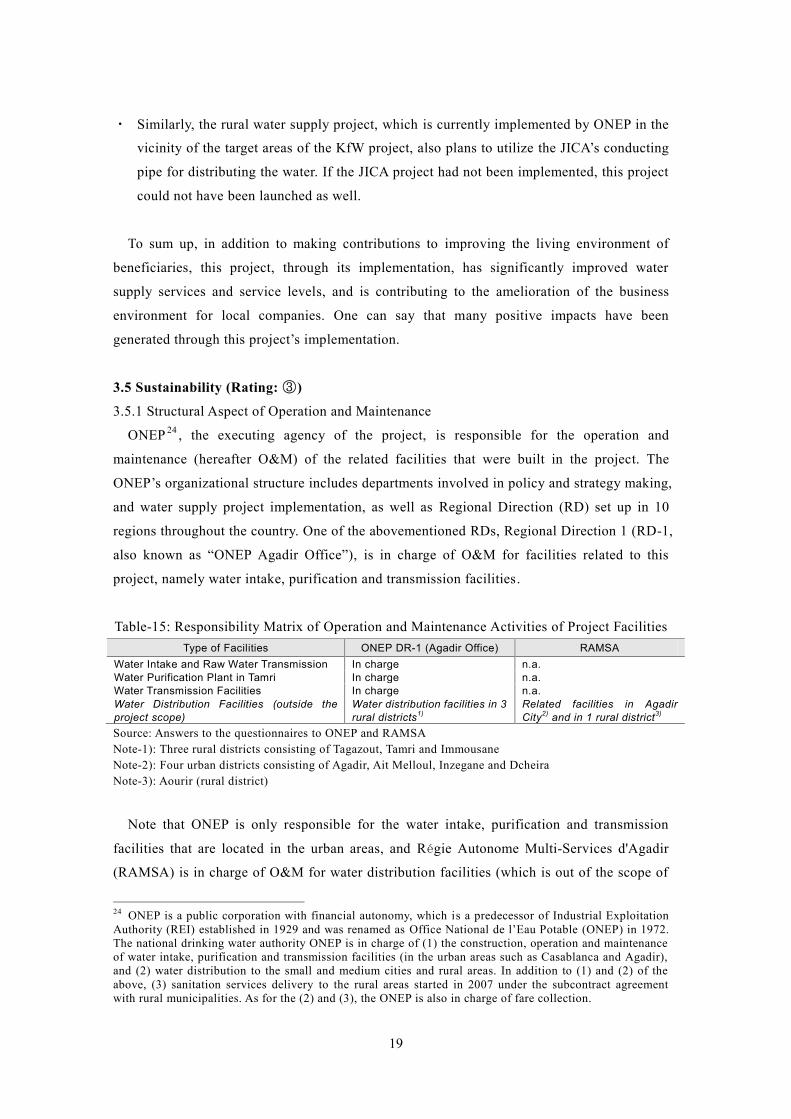
3.5 Sustainability (Rating: ③)
3.5.1 Structural Aspect of Operation and Maintenance
ONEP 24 , the executing agency of the project, is responsible for the operation and
maintenance (hereafter O&M) of the related facilities that were built in the project. The
ONEP’s organizational structure includes departments involved in policy and strategy making,
and water supply project implementation, as well as Regional Direction (RD) set up in 10
regions throughout the country. One of the abovementioned RDs, Regional Direction 1 (RD-1,
also known as “ONEP Agadir Office”), is in charge of O&M for facilities related to this
project, namely water intake, purification and transmission facilities.
Table-15: Responsibility Matrix of Operation and Maintenance Activities of Project FacilitiesType of Facilities ONEP DR-1 (Agadir Office) RAMSA
Water Intake and Raw Water Transmission In charge n.a.Water Purification Plant in Tamri In charge n.a.Water Transmission Facilities In charge n.a.Water Distribution Facilities (outside theproject scope)
Water distribution facilities in 3rural districts1)
Related facilities in AgadirCity2) and in 1 rural district3)
Source: Answers to the questionnaires to ONEP and RAMSANote-1): Three rural districts consisting of Tagazout, Tamri and ImmousaneNote-2): Four urban districts consisting of Agadir, Ait Melloul, Inzegane and DcheiraNote-3): Aourir (rural district)
Note that ONEP is only responsible for the water intake, purification and transmission
facilities that are located in the urban areas, and Régie Autonome Multi-Services d'Agadir
(RAMSA) is in charge of O&M for water distribution facilities (which is out of the scope of
24 ONEP is a public corporation with financial autonomy, which is a predecessor of Industrial ExploitationAuthority (REI) established in 1929 and was renamed as Office National de l’Eau Potable (ONEP) in 1972.The national drinking water authority ONEP is in charge of (1) the construction, operation and maintenanceof water intake, purification and transmission facilities (in the urban areas such as Casablanca and Agadir),and (2) water distribution to the small and medium cities and rural areas. In addition to (1) and (2) of theabove, (3) sanitation services delivery to the rural areas started in 2007 under the subcontract agreementwith rural municipalities. As for the (2) and (3), the ONEP is also in charge of fare collection.
20
this project) located in the target areas of this project. Moreover, RAMSA is also responsible
for the water tariff collection from customers and ONEP is just selling purified water to
RAMSA. With regard to the service delivery in the rural areas, the responsibility between
ONEP and RAMSA is complicated as shown in Table-15.
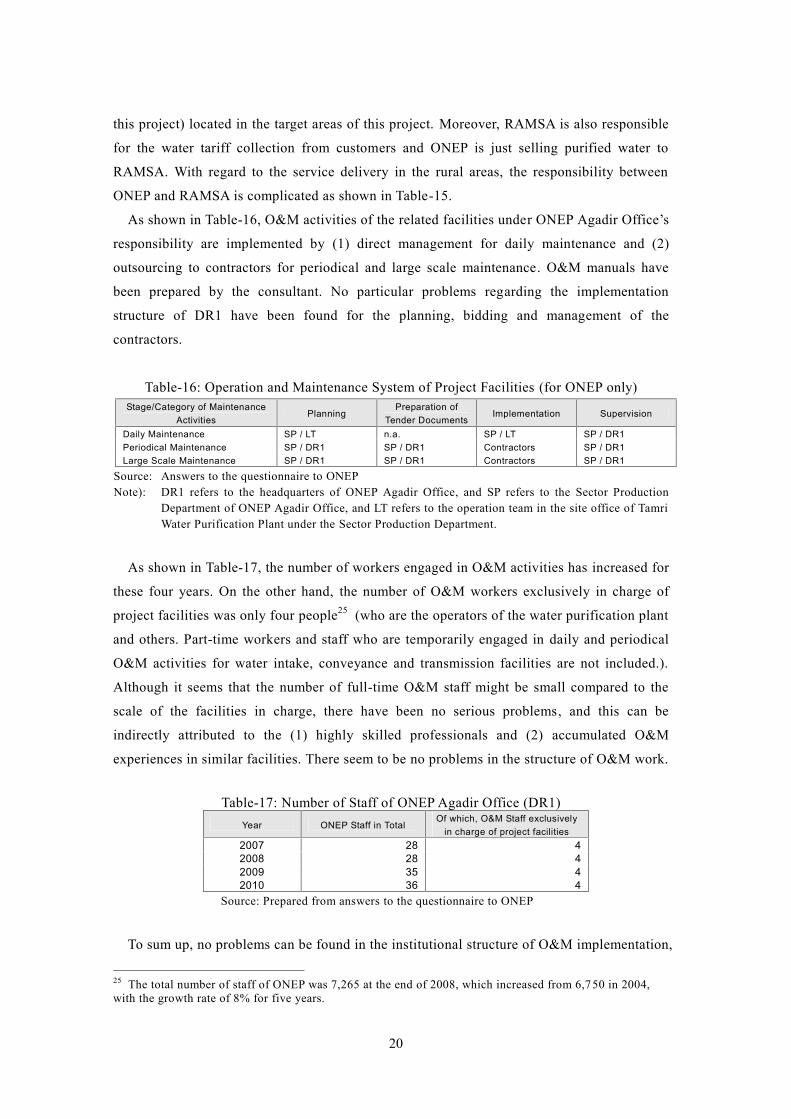
As shown in Table-16, O&M activities of the related facilities under ONEP Agadir Office’s
responsibility are implemented by (1) direct management for daily maintenance and (2)
outsourcing to contractors for periodical and large scale maintenance. O&M manuals have
been prepared by the consultant. No particular problems regarding the implementation
structure of DR1 have been found for the planning, bidding and management of the
contractors.
Table-16: Operation and Maintenance System of Project Facilities (for ONEP only)Stage/Category of Maintenance
ActivitiesPlanning
Preparation ofTender Documents
Implementation Supervision
Daily Maintenance SP / LT n.a. SP / LT SP / DR1Periodical Maintenance SP / DR1 SP / DR1 Contractors SP / DR1Large Scale Maintenance SP / DR1 SP / DR1 Contractors SP / DR1
Source: Answers to the questionnaire to ONEPNote): DR1 refers to the headquarters of ONEP Agadir Office, and SP refers to the Sector Production
Department of ONEP Agadir Office, and LT refers to the operation team in the site office of TamriWater Purification Plant under the Sector Production Department.
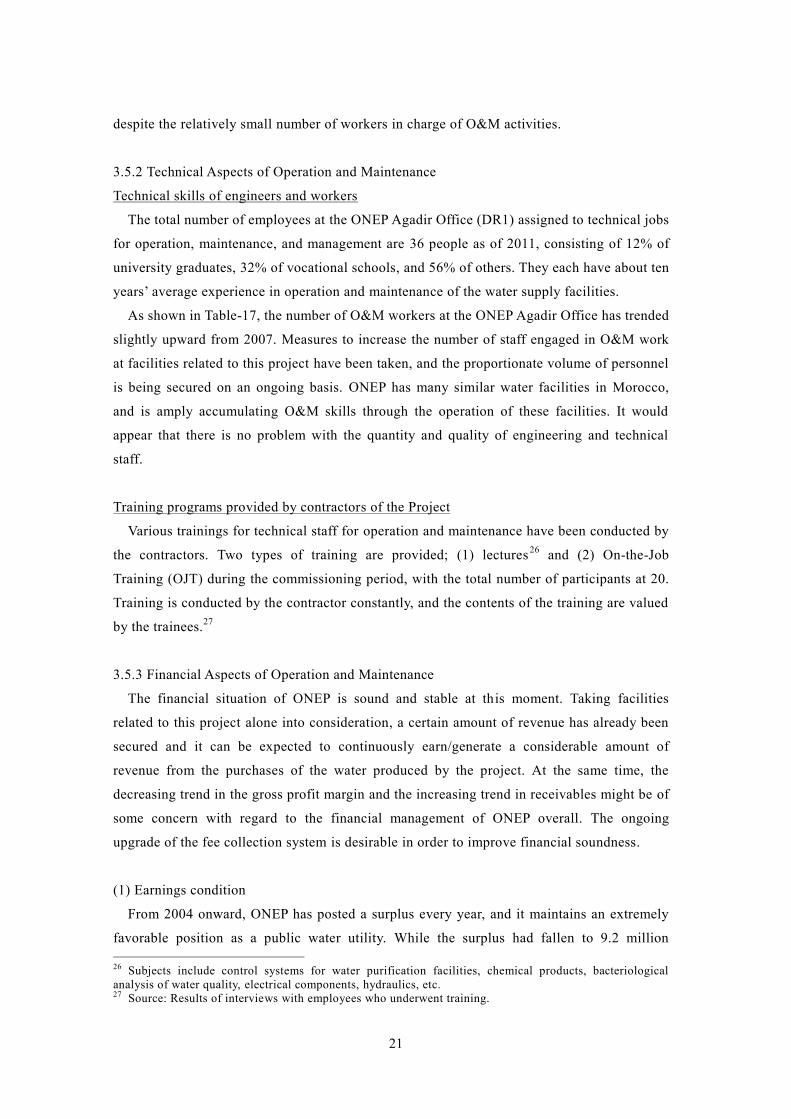
As shown in Table-17, the number of workers engaged in O&M activities has increased for
these four years. On the other hand, the number of O&M workers exclusively in charge of
project facilities was only four people25 (who are the operators of the water purification plant
and others. Part-time workers and staff who are temporarily engaged in daily and periodical
O&M activities for water intake, conveyance and transmission facilities are not included.).
Although it seems that the number of full-time O&M staff might be small compared to the
scale of the facilities in charge, there have been no serious problems, and this can be
indirectly attributed to the (1) highly skilled professionals and (2) accumulated O&M
experiences in similar facilities. There seem to be no problems in the structure of O&M work.
Table-17: Number of Staff of ONEP Agadir Office (DR1)Year ONEP Staff in Total
Of which, O&M Staff exclusivelyin charge of project facilities
2007 28 42008 28 42009 35 42010 36 4
Source: Prepared from answers to the questionnaire to ONEP
To sum up, no problems can be found in the institutional structure of O&M implementation,
25 The total number of staff of ONEP was 7,265 at the end of 2008, which increased from 6,750 in 2004,with the growth rate of 8% for five years.
21
despite the relatively small number of workers in charge of O&M activities.
3.5.2 Technical Aspects of Operation and Maintenance
Technical skills of engineers and workers
The total number of employees at the ONEP Agadir Office (DR1) assigned to technical jobs
for operation, maintenance, and management are 36 people as of 2011, consisting of 12% of
university graduates, 32% of vocational schools, and 56% of others. They each have about ten
years’ average experience in operation and maintenance of the water supply facilities.
As shown in Table-17, the number of O&M workers at the ONEP Agadir Office has trended
slightly upward from 2007. Measures to increase the number of staff engaged in O&M work
at facilities related to this project have been taken, and the proportionate volume of personnel
is being secured on an ongoing basis. ONEP has many similar water facilities in Morocco,
and is amply accumulating O&M skills through the operation of these facilities. It would
appear that there is no problem with the quantity and quality of engineering and technical
staff.
Training programs provided by contractors of the Project
Various trainings for technical staff for operation and maintenance have been conducted by
the contractors. Two types of training are provided; (1) lectures 26 and (2) On-the-Job
Training (OJT) during the commissioning period, with the total number of participants at 20.
Training is conducted by the contractor constantly, and the contents of the training are valued
by the trainees.27
3.5.3 Financial Aspects of Operation and Maintenance
The financial situation of ONEP is sound and stable at this moment. Taking facilities
related to this project alone into consideration, a certain amount of revenue has already been
secured and it can be expected to continuously earn/generate a considerable amount of
revenue from the purchases of the water produced by the project. At the same time, the
decreasing trend in the gross profit margin and the increasing trend in receivables might be of
some concern with regard to the financial management of ONEP overall. The ongoing
upgrade of the fee collection system is desirable in order to improve financial soundness.
(1) Earnings condition
From 2004 onward, ONEP has posted a surplus every year, and it maintains an extremely
favorable position as a public water utility. While the surplus had fallen to 9.2 million
26 Subjects include control systems for water purification facilities, chemical products, bacteriologicalanalysis of water quality, electrical components, hydraulics, etc.27 Source: Results of interviews with employees who underwent training.
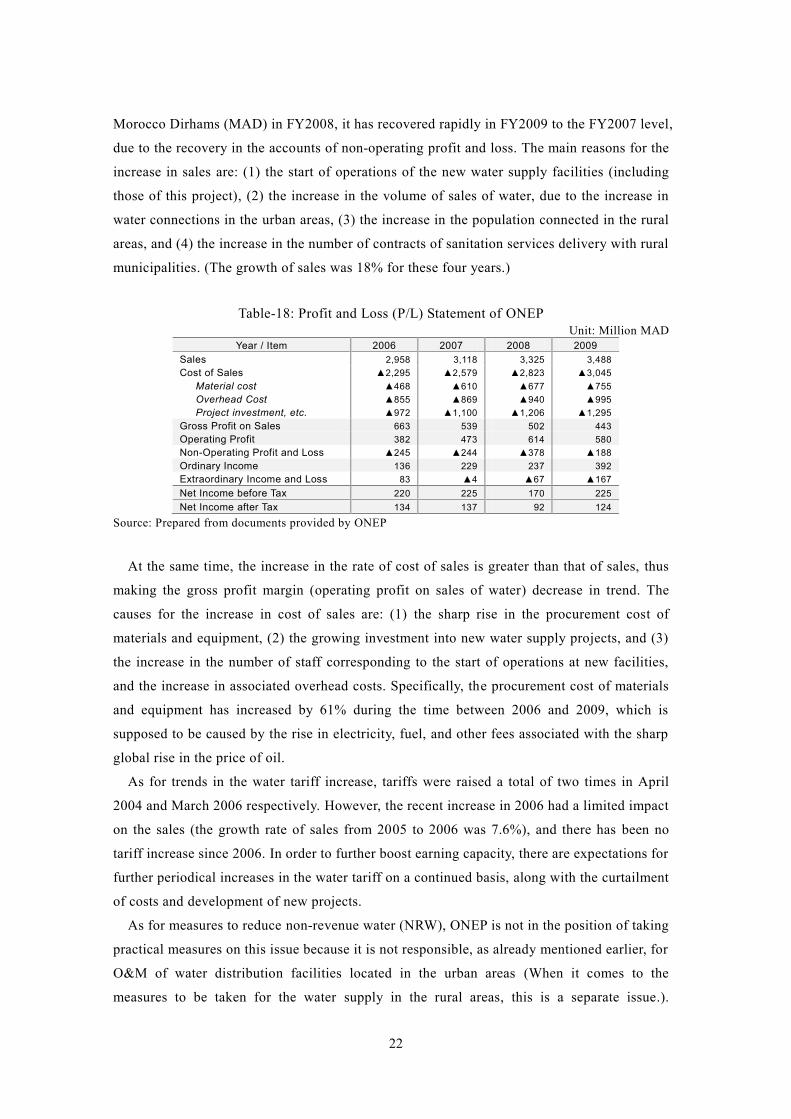
22
Morocco Dirhams (MAD) in FY2008, it has recovered rapidly in FY2009 to the FY2007 level,
due to the recovery in the accounts of non-operating profit and loss. The main reasons for the
increase in sales are: (1) the start of operations of the new water supply facilities (including
those of this project), (2) the increase in the volume of sales of water, due to the increase in
water connections in the urban areas, (3) the increase in the population connected in the rural
areas, and (4) the increase in the number of contracts of sanitation services delivery with rural
municipalities. (The growth of sales was 18% for these four years.)
Table-18: Profit and Loss (P/L) Statement of ONEPUnit: Million MAD
Year / Item 2006 2007 2008 2009Sales 2,958 3,118 3,325 3,488Cost of Sales
Material costOverhead CostProject investment, etc.
▲2,295▲468▲855▲972
▲2,579▲610▲869
▲1,100
▲2,823▲677▲940
▲1,206
▲3,045▲755▲995
▲1,295Gross Profit on Sales 663 539 502 443Operating Profit 382 473 614 580Non-Operating Profit and Loss ▲245 ▲244 ▲378 ▲188Ordinary Income 136 229 237 392Extraordinary Income and Loss 83 ▲4 ▲67 ▲167Net Income before Tax 220 225 170 225Net Income after Tax 134 137 92 124
Source: Prepared from documents provided by ONEP
At the same time, the increase in the rate of cost of sales is greater than that of sales, thus
making the gross profit margin (operating profit on sales of water) decrease in trend. The
causes for the increase in cost of sales are: (1) the sharp rise in the procurement cost of
materials and equipment, (2) the growing investment into new water supply projects, and (3)
the increase in the number of staff corresponding to the start of operations at new facilities,
and the increase in associated overhead costs. Specifically, the procurement cost of materials
and equipment has increased by 61% during the time between 2006 and 2009, which is
supposed to be caused by the rise in electricity, fuel, and other fees associated with the sharp
global rise in the price of oil.
As for trends in the water tariff increase, tariffs were raised a total of two times in April
2004 and March 2006 respectively. However, the recent increase in 2006 had a limited impact
on the sales (the growth rate of sales from 2005 to 2006 was 7.6%), and there has been no
tariff increase since 2006. In order to further boost earning capacity, there are expectations for
further periodical increases in the water tariff on a continued basis, along with the curtailment
of costs and development of new projects.
As for measures to reduce non-revenue water (NRW), ONEP is not in the position of taking
practical measures on this issue because it is not responsible, as already mentioned earlier, for
O&M of water distribution facilities located in the urban areas (When it comes to the
measures to be taken for the water supply in the rural areas, this is a separate issue.).
23
Measures to prevent water leakage from water conveyance and transmission pipes of the
project are operated successfully and are monitored by ONEP without any issues, given
that.the rate of leakage is maintained at about 2%.
(2) Financial status
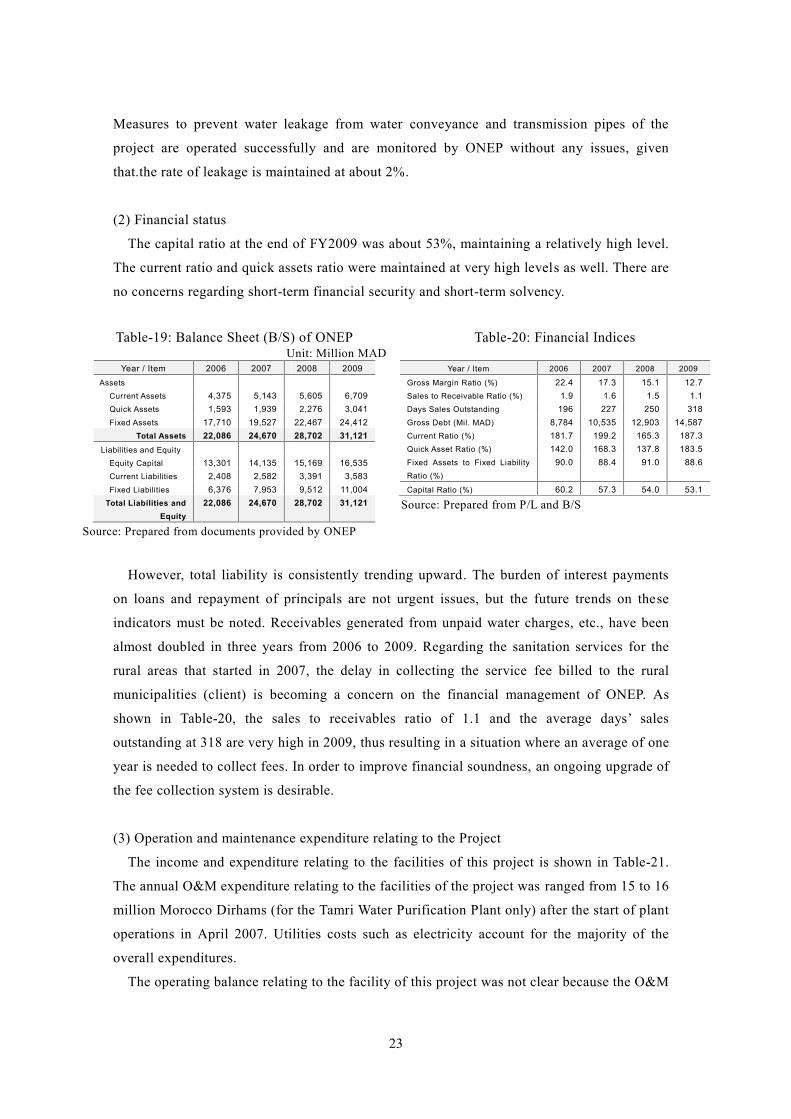
The capital ratio at the end of FY2009 was about 53%, maintaining a relatively high level.
The current ratio and quick assets ratio were maintained at very high levels as well. There are
no concerns regarding short-term financial security and short-term solvency.
Table-19: Balance Sheet (B/S) of ONEPUnit: Million MAD
Year / Item 2006 2007 2008 2009Assets
Current Assets 4,375 5,143 5,605 6,709Quick Assets 1,593 1,939 2,276 3,041Fixed Assets 17,710 19,527 22,467 24,412
Total Assets 22,086 24,670 28,702 31,121Liabilities and Equity
Equity Capital 13,301 14,135 15,169 16,535Current Liabilities 2,408 2,582 3,391 3,583Fixed Liabilities 6,376 7,953 9,512 11,004
Total Liabilities andEquity
22,086 24,670 28,702 31,121
Source: Prepared from documents provided by ONEP
Table-20: Financial Indices
Year / Item 2006 2007 2008 2009
Gross Margin Ratio (%) 22.4 17.3 15.1 12.7Sales to Receivable Ratio (%) 1.9 1.6 1.5 1.1Days Sales Outstanding 196 227 250 318Gross Debt (Mil. MAD) 8,784 10,535 12,903 14,587Current Ratio (%) 181.7 199.2 165.3 187.3Quick Asset Ratio (%) 142.0 168.3 137.8 183.5Fixed Assets to Fixed LiabilityRatio (%)
90.0 88.4 91.0 88.6
Capital Ratio (%) 60.2 57.3 54.0 53.1
Source: Prepared from P/L and B/S
However, total liability is consistently trending upward. The burden of interest payments
on loans and repayment of principals are not urgent issues, but the future trends on these
indicators must be noted. Receivables generated from unpaid water charges, etc., have been
almost doubled in three years from 2006 to 2009. Regarding the sanitation services for the
rural areas that started in 2007, the delay in collecting the service fee billed to the rural
municipalities (client) is becoming a concern on the financial management of ONEP. As
shown in Table-20, the sales to receivables ratio of 1.1 and the average days’ sales
outstanding at 318 are very high in 2009, thus resulting in a situation where an average of one
year is needed to collect fees. In order to improve financial soundness, an ongoing upgrade of
the fee collection system is desirable.
(3) Operation and maintenance expenditure relating to the Project
The income and expenditure relating to the facilities of this project is shown in Table-21.
The annual O&M expenditure relating to the facilities of the project was ranged from 15 to 16
million Morocco Dirhams (for the Tamri Water Purification Plant only) after the start of plant
operations in April 2007. Utilities costs such as electricity account for the majority of the
overall expenditures.
The operating balance relating to the facility of this project was not clear because the O&M
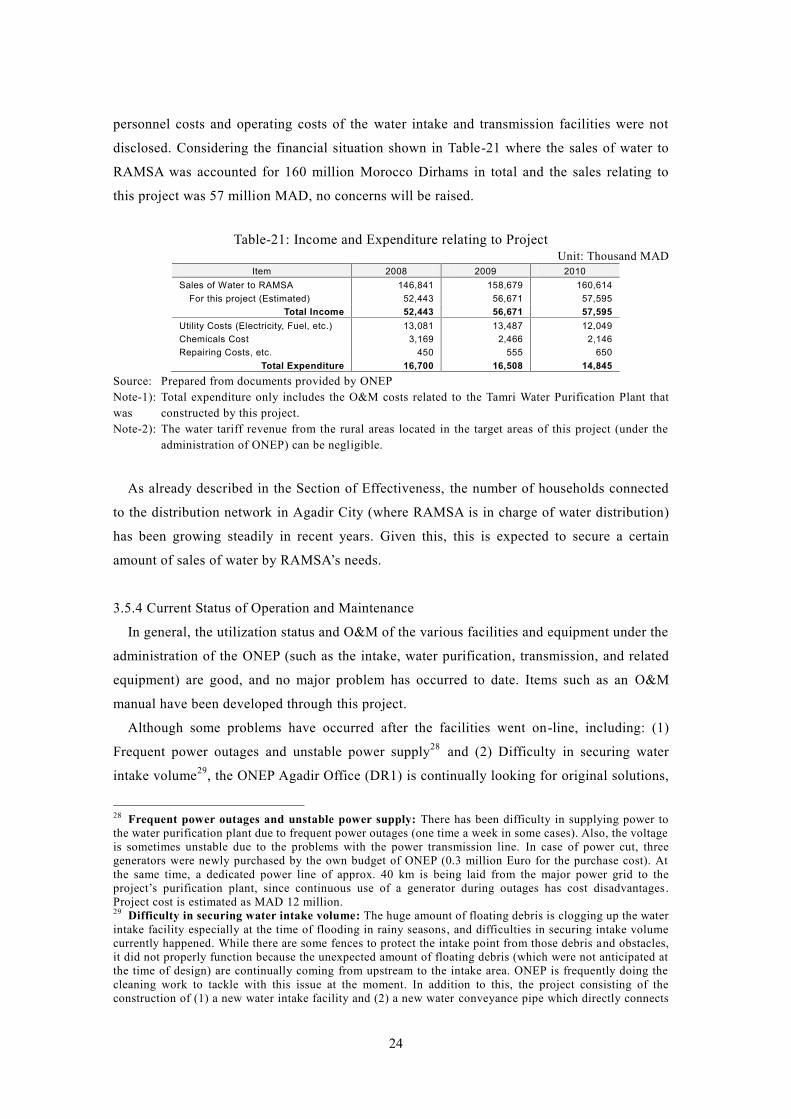
24
personnel costs and operating costs of the water intake and transmission facilities were not
disclosed. Considering the financial situation shown in Table-21 where the sales of water to
RAMSA was accounted for 160 million Morocco Dirhams in total and the sales relating to
this project was 57 million MAD, no concerns will be raised.
Table-21: Income and Expenditure relating to ProjectUnit: Thousand MAD
Item 2008 2009 2010Sales of Water to RAMSA
For this project (Estimated)146,841
52,443158,679
56,671160,614
57,595Total Income 52,443 56,671 57,595
Utility Costs (Electricity, Fuel, etc.)Chemicals CostRepairing Costs, etc.
13,0813,169
450
13,4872,466
555
12,0492,146
650Total Expenditure 16,700 16,508 14,845
Source: Prepared from documents provided by ONEPNote-1): Total expenditure only includes the O&M costs related to the Tamri Water Purification Plant thatwas constructed by this project.Note-2): The water tariff revenue from the rural areas located in the target areas of this project (under the
administration of ONEP) can be negligible.
As already described in the Section of Effectiveness, the number of households connected
to the distribution network in Agadir City (where RAMSA is in charge of water distribution)
has been growing steadily in recent years. Given this, this is expected to secure a certain
amount of sales of water by RAMSA’s needs.
3.5.4 Current Status of Operation and Maintenance
In general, the utilization status and O&M of the various facilities and equipment under the
administration of the ONEP (such as the intake, water purification, transmission, and related
equipment) are good, and no major problem has occurred to date. Items such as an O&M
manual have been developed through this project.
Although some problems have occurred after the facilities went on-line, including: (1)
Frequent power outages and unstable power supply28 and (2) Difficulty in securing water
intake volume29, the ONEP Agadir Office (DR1) is continually looking for original solutions,
28 Frequent power outages and unstable power supply: There has been difficulty in supplying power tothe water purification plant due to frequent power outages (one time a week in some cases). Also, the voltageis sometimes unstable due to the problems with the power transmission line. In case of power cut, threegenerators were newly purchased by the own budget of ONEP (0.3 million Euro for the purchase cost). Atthe same time, a dedicated power line of approx. 40 km is being laid from the major power grid to theproject’s purification plant, since continuous use of a generator during outages has cost disadvantages.Project cost is estimated as MAD 12 million.29 Difficulty in securing water intake volume: The huge amount of floating debris is clogging up the waterintake facility especially at the time of flooding in rainy seasons, and difficulties in securing intake volumecurrently happened. While there are some fences to protect the intake point from those debris and obstacles,it did not properly function because the unexpected amount of floating debris (which were not anticipated atthe time of design) are continually coming from upstream to the intake area. ONEP is frequently doing thecleaning work to tackle with this issue at the moment. In addition to this, the project consisting of theconstruction of (1) a new water intake facility and (2) a new water conveyance pipe which directly connects
25
which it is steadily putting into practice. This development is the fruit of the technical
capacity and ability of the relevant personnel of DR1 to act on them, as well as the sufficient
O&M budget for the project facilities, and is highly commendable as a timely and pioneering
response by the implementing agency.
Regarding the generators, as described in Footnote-28, these machines were not procured
under the project but purchased by the ONEP’s own budget after the completion of the project.
Although the situation of frequent power outages and unstable power supply cannot be
anticipated at the time of project planning, it might have been necessary to plan to install the
generators at least for the purification plant, as a part of the contingency plan.
As for the issues of difficulty in securing the water intake volume, it seems that the
situation of floating obstacles might have been easily anticipated from the beginning,
although its amount was higher than initially estimated. It would have been more necessary to
have considered some appropriate measures at the time of detailed design and other stages.
No major problems have been observed in the operation and maintenance system, therefore
sustainability of the project is high.
4.Conclusion, Lessons Learned and Recommendations4.1 Conclusion
This project is highly consistent with government policies and no problems with operation
and maintenance (O&M) systems can be found. The financial situation of ONEP is in
favorable conditions at the moment. Major indicators such as the population served by this
project, the amount of water supplied, and the facility utilization rate have exceeded 80% of
the target value, and there is no particular problem with the quality of the purified water
produced. Furthermore, the project contributes to improving the living environment of the
beneficiaries to some extent, and numerous positive impacts have emerged, including the
improvement of the service level of the water supply and the business environment in the
target areas. In addition, in terms of efficiency, although the project period was longer than
planned, the project cost was kept within the planned amount.
In light of the above, this project is evaluated to be highly satisfactory.
4.2 Recommendations
4.2.1 Recommendations for Executing Agency
Receivables generated from unpaid water charges, etc., have been increasing in these years,
making for a situation where an average of one year is needed to collect these outstanding
between the intake and Tamri Water Purification Plant is currently ongoing, as a fundamental solution. As ofAugust 2011, the project is in the tender stage and the African Development Bank (AfDB) will co -finance tothis project. Project cost is estimated as MAD 16 million.
26
fees (the average days’ sales outstanding is 318 days). The soundness of the financial position
of ONEP may not be questioned by this situation, at the same time, however, it must be
especially noted that the delay in collecting the sanitation services’ fee billed to the rural
municipalities is becoming a concern for the financial management. From the long-term
perspective, it is critical at an early stage to prevent the occurrence of a “possible influential
factor” with regard to the financial sustainability, and it is desirable to take the necessary
measures to encourage the client to pay service fees. More specifically, some practical options
such as urging the central government to solve the issue, the case of violations of laws (i.e.
payment in arrears to a municipal council, etc.) for example, should be considered.
4.2.2 Recommendations for JICA
Regarding the sewage system development in the Greater Agadir area, a treatment plant
with a certain capacity has started operations, thanks to the financial support by the AFD and
the EIB. On the other hand, the secondary treatment capacity is 10,000 m³/day and this level
of capacity is not a sufficient response to the increased water supply capacity. The water
supply capacity is approximately 100,000 m³/day in this region, thus the concern remains that
the volume of untreated water may increase in the future. Moreover, the secondary treatment
capacity may not be enough, even after the completion of the second phase of “The Sewerage
Development Project in Greater Agadir Area” which is currently implemented by RAMSA.
Because water supply development will impose an increased burden on the environment,
for example indirectly through the increasing wastewater, it is vital to advance measures for
wastewater treatment concurrently with water supply development. It may be necessary for
JICA to consider the possibility of cooperation in the sewage system development in the
Greater Agadir area, under the donor coordination structure in Morocco. If the situation
allows, exploration should commence with the possible cooperation with the AFD and the
EIB, including the possibility of co-finance.
4.3 Lessons Learned
As for the issues of difficulty in securing the water intake volume at the Moulay Abdellah
Dam, it seems that the situation of floating debris and obstacles during the flooding and rainy
seasons might have been anticipated from the beginning, although its amount was much more
than estimated. It would have been more necessary to have considered some appropriate
measures at the time of detailed design and other stages.
Because it is one of the critical factors for a water supply project to continuously secure the
stable quantity of water intake, some countermeasures to protect intake facilities from
floating obstacles should be considered, with some detailed and appropriate technical studies,
at the time of both basic and detailed design stages.
27
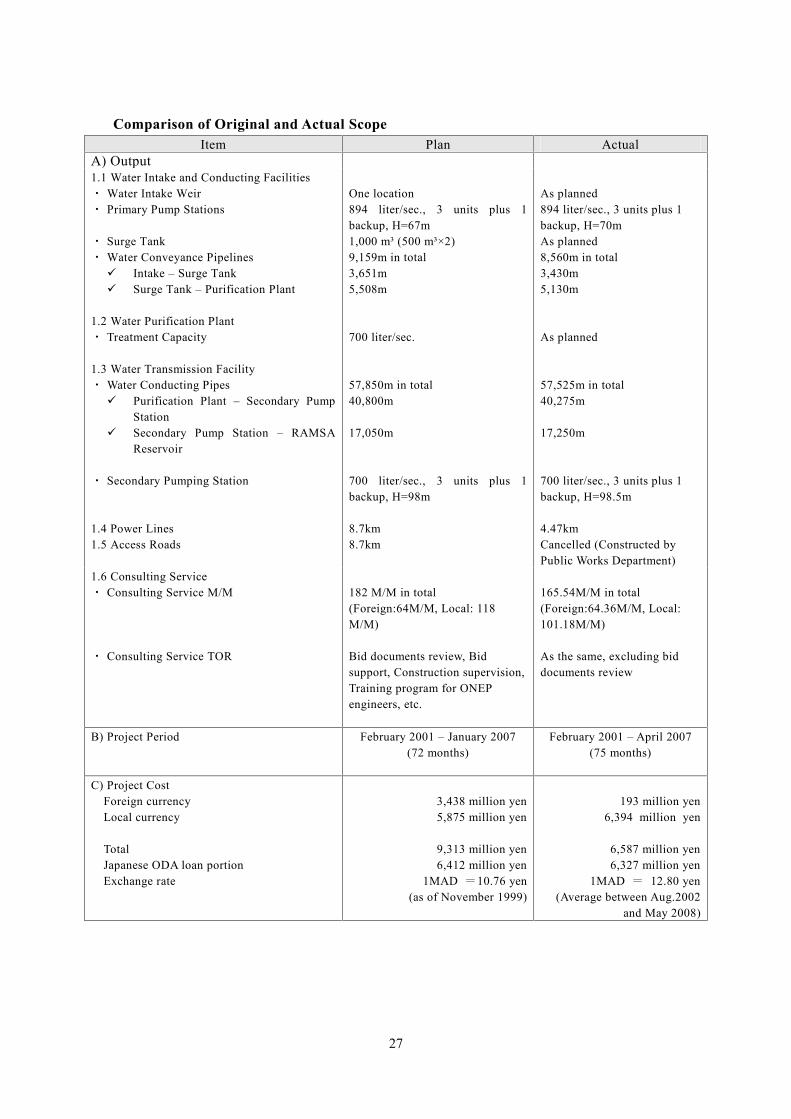
Comparison of Original and Actual ScopeItem Plan Actual
A) Output1.1 Water Intake and Conducting Facilities・ Water Intake Weir・ Primary Pump Stations
・ Surge Tank・ Water Conveyance Pipelines Intake – Surge Tank Surge Tank – Purification Plant
1.2 Water Purification Plant・ Treatment Capacity
1.3 Water Transmission Facility・ Water Conducting Pipes Purification Plant – Secondary Pump
Station Secondary Pump Station – RAMSA
Reservoir
・ Secondary Pumping Station
1.4 Power Lines1.5 Access Roads
One location894 liter/sec., 3 units plus 1backup, H=67m1,000 m³ (500 m³×2)9,159m in total3,651m5,508m
700 liter/sec.
57,850m in total40,800m
17,050m
700 liter/sec., 3 units plus 1backup, H=98m
8.7km8.7km
As planned894 liter/sec., 3 units plus 1backup, H=70mAs planned8,560m in total3,430m5,130m
As planned
57,525m in total40,275m
17,250m
700 liter/sec., 3 units plus 1backup, H=98.5m
4.47kmCancelled (Constructed byPublic Works Department)
1.6 Consulting Service・ Consulting Service M/M
・ Consulting Service TOR
182 M/M in total(Foreign:64M/M, Local: 118M/M)
Bid documents review, Bidsupport, Construction supervision,Training program for ONEPengineers, etc.
165.54M/M in total(Foreign:64.36M/M, Local:101.18M/M)
As the same, excluding biddocuments review
B) Project Period February 2001 – January 2007(72 months)
February 2001 – April 2007(75 months)
C) Project CostForeign currencyLocal currency
TotalJapanese ODA loan portionExchange rate
3,438 million yen5,875 million yen
9,313 million yen6,412 million yen
1MAD =10.76 yen(as of November 1999)
193 million yen6,394 million yen
6,587 million yen6,327 million yen
1MAD = 12.80 yen(Average between Aug.2002
and May 2008)