more creek hydroelectric project prefeasibility study final.pdf · more creek hydroelectric project...
TRANSCRIPT
Alaska Hydro Corporation
More Creek Hydroelectric Project
Prefeasibility Study
June 2015
E6348
SIGMA ENGINEERING LTD 1444 Alberni Street, 4th Floor, Vancouver, BC, Canada V6G 2Z4 Phone: (604) 688-8271 Fax: (604) 688-1286
More Creek Hydroelectric Project Prefeasibility Study
Sigma Engineering Ltd. ii May 2015
TABLE OF CONTENTS
Table of Contents .............................................................................................................. ii List of Tables ..................................................................................................................... ii List of Figures.................................................................................................................... ii Preface .............................................................................................................................. 3 1. Background ................................................................................................................ 3 2. Hydrology ................................................................................................................... 3 3. Generation and Revenue Estimates .......................................................................... 4 4. Construction Cost Estimate ....................................................................................... 6 5. Financial Analysis ...................................................................................................... 8
LIST OF TABLES
Table 1 Mean Monthly and Annual Flows at proposed intake Table 2 Monthly targets for design flow Table 3 Generation estimates (GWh) Table 4 Prefeasibility Cost Estimate
LIST OF FIGURES
Figure 1 Location Plan Figure 2 Project Layout Figure 3
More Creek Storage Curve
APPENDIX A Financial Analysis
More Creek Hydroelectric Project Prefeasibility Study
Sigma Engineering Ltd. 3 June 2015
PREFACE
This study has been prepared exclusively for Alaska Hydro Corporation for the purposes of assessing the proposed More Creek hydroelectric project. No third party is entitled to rely on this analysis without the express written permission of Sigma Engineering Ltd and Alaska Hydro Corporation.
1. BACKGROUND
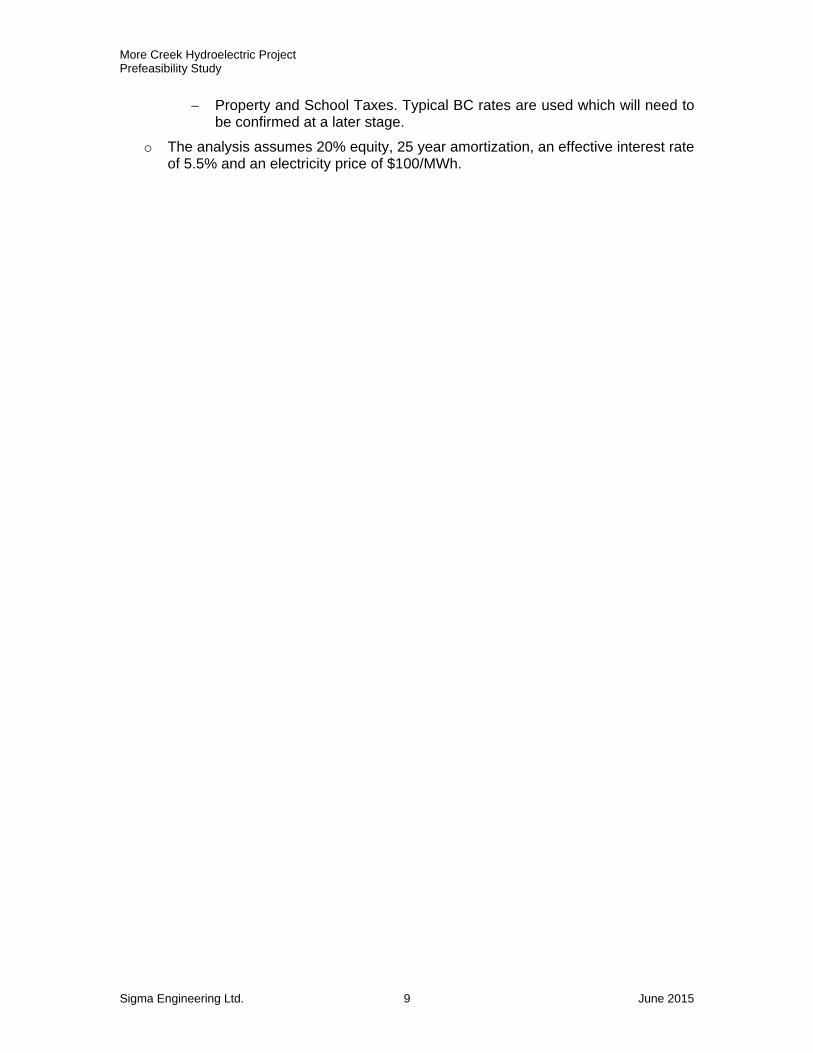
Alaska Hydro Corp. (AHC) is interested in a prefeasibility study for the proposed More Creek hydroelectric project, located approximately 10 km northwest from Bob Quinn Lake in the Skeena region of British Columbia.
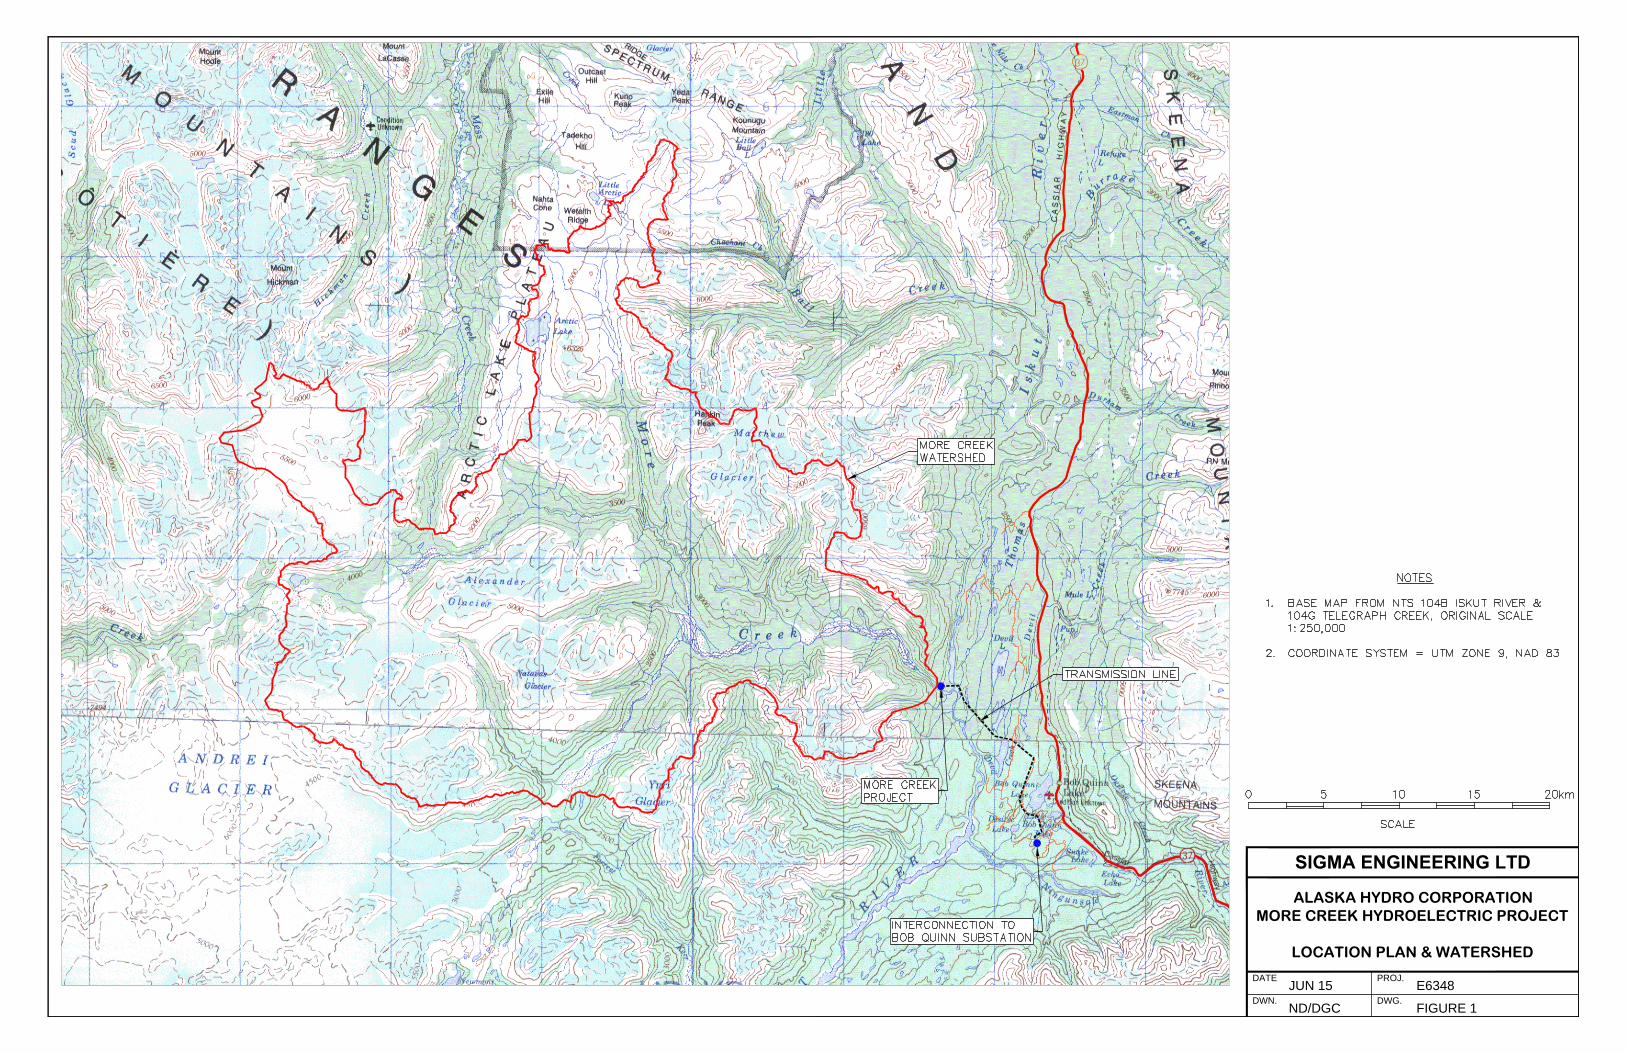
The present study will use the existing project layout and characteristics, as described in the submitted Water License Application. The 75 MW project consists of access roads, an intake, a dam, a tunnel and penstock, powerhouse and generating equipment, transmission line and interconnection to the Bob Quinn BC Hydro substation (see Figures 1 and 2).
Below we describe our methodology and assumptions in developing a model to estimate the projected revenues (hydrology and generation model), and our considerations for developing prefeasibility cost estimates for the project.
2. HYDROLOGY
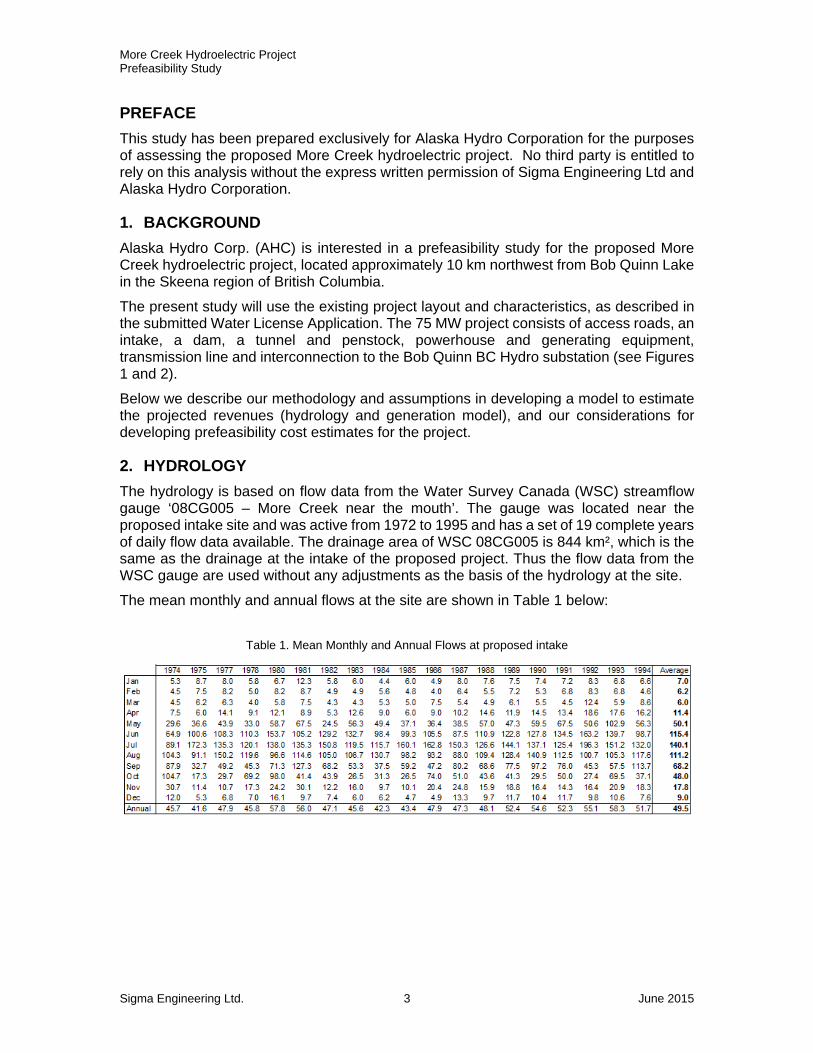
The hydrology is based on flow data from the Water Survey Canada (WSC) streamflow gauge ‘08CG005 – More Creek near the mouth’. The gauge was located near the proposed intake site and was active from 1972 to 1995 and has a set of 19 complete years of daily flow data available. The drainage area of WSC 08CG005 is 844 km², which is the same as the drainage at the intake of the proposed project. Thus the flow data from the WSC gauge are used without any adjustments as the basis of the hydrology at the site.
The mean monthly and annual flows at the site are shown in Table 1 below:
Table 1. Mean Monthly and Annual Flows at proposed intake
More Creek Hydroelectric Project Prefeasibility Study
Sigma Engineering Ltd. 4 June 2015
3. GENERATION AND REVENUE ESTIMATES
A spreadsheet model is used to calculate the monthly and annual generation at the site. The model uses 19 complete years of daily flows as the basis of the calculations.
Assumptions
The basic assumptions used in the model are:
Design flow 80 m³/s
Dam crest elevation 498 m Minimum lake level 468 m Mean tailwater level 380 m Gross head 88 - 118 m
Instream flow release 2.476 m³/s (5% of mean annual flow) Minimum turbine flow 20 m³/s
Installed Capacity 75.2 MW Generating equipment efficiency 86.45% Friction head loss (waterway) 6%
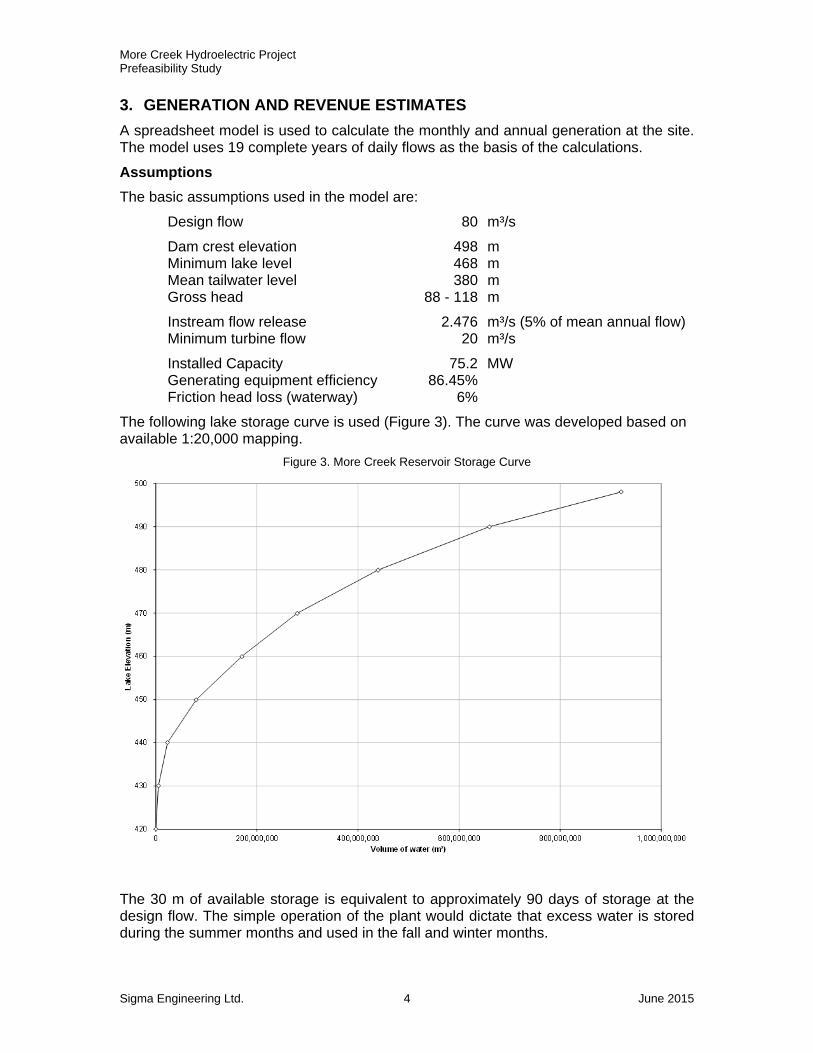
The following lake storage curve is used (Figure 3). The curve was developed based on available 1:20,000 mapping.
Figure 3. More Creek Reservoir Storage Curve
The 30 m of available storage is equivalent to approximately 90 days of storage at the design flow. The simple operation of the plant would dictate that excess water is stored during the summer months and used in the fall and winter months.
More Creek Hydroelectric Project Prefeasibility Study
Sigma Engineering Ltd. 5 June 2015
However, this operation assumes that the electricity price is the same throughout the year. Since at this stage, the electricity pricing scheme is not known, the model used the current BC Standing Offer Program (SOP) monthly delivery time adjustments to vary the electricity price through the year.
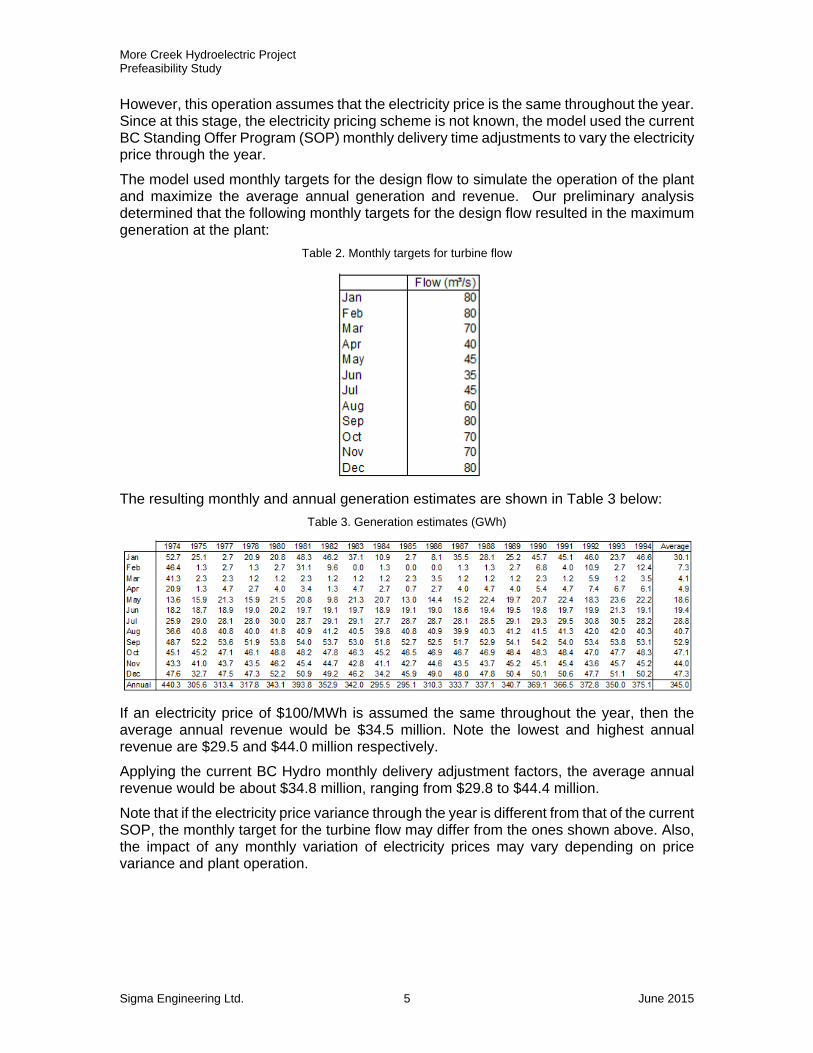
The model used monthly targets for the design flow to simulate the operation of the plant and maximize the average annual generation and revenue. Our preliminary analysis determined that the following monthly targets for the design flow resulted in the maximum generation at the plant:
Table 2. Monthly targets for turbine flow
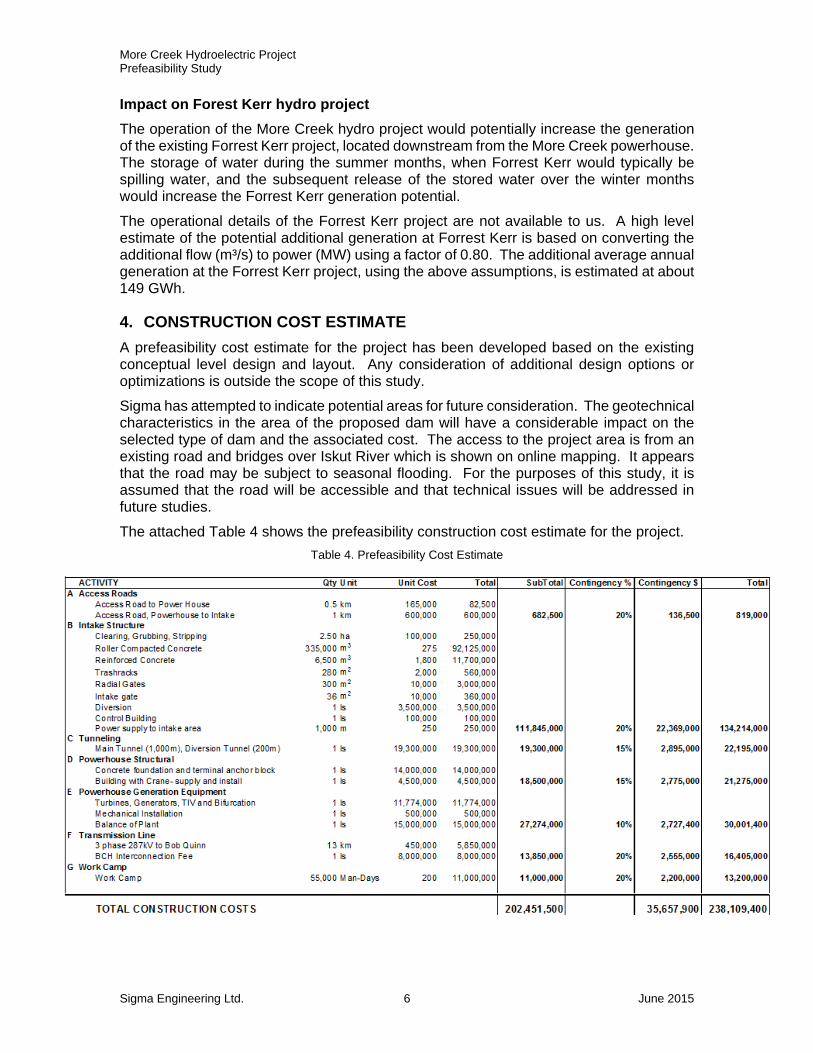
The resulting monthly and annual generation estimates are shown in Table 3 below:
Table 3. Generation estimates (GWh)
If an electricity price of $100/MWh is assumed the same throughout the year, then the average annual revenue would be $34.5 million. Note the lowest and highest annual revenue are $29.5 and $44.0 million respectively.
Applying the current BC Hydro monthly delivery adjustment factors, the average annual revenue would be about $34.8 million, ranging from $29.8 to $44.4 million.
Note that if the electricity price variance through the year is different from that of the current SOP, the monthly target for the turbine flow may differ from the ones shown above. Also, the impact of any monthly variation of electricity prices may vary depending on price variance and plant operation.
More Creek Hydroelectric Project Prefeasibility Study
Sigma Engineering Ltd. 6 June 2015
Impact on Forest Kerr hydro project
The operation of the More Creek hydro project would potentially increase the generation of the existing Forrest Kerr project, located downstream from the More Creek powerhouse. The storage of water during the summer months, when Forrest Kerr would typically be spilling water, and the subsequent release of the stored water over the winter months would increase the Forrest Kerr generation potential.
The operational details of the Forrest Kerr project are not available to us. A high level estimate of the potential additional generation at Forrest Kerr is based on converting the additional flow (m³/s) to power (MW) using a factor of 0.80. The additional average annual generation at the Forrest Kerr project, using the above assumptions, is estimated at about 149 GWh.
4. CONSTRUCTION COST ESTIMATE
A prefeasibility cost estimate for the project has been developed based on the existing conceptual level design and layout. Any consideration of additional design options or optimizations is outside the scope of this study.
Sigma has attempted to indicate potential areas for future consideration. The geotechnical characteristics in the area of the proposed dam will have a considerable impact on the selected type of dam and the associated cost. The access to the project area is from an existing road and bridges over Iskut River which is shown on online mapping. It appears that the road may be subject to seasonal flooding. For the purposes of this study, it is assumed that the road will be accessible and that technical issues will be addressed in future studies.
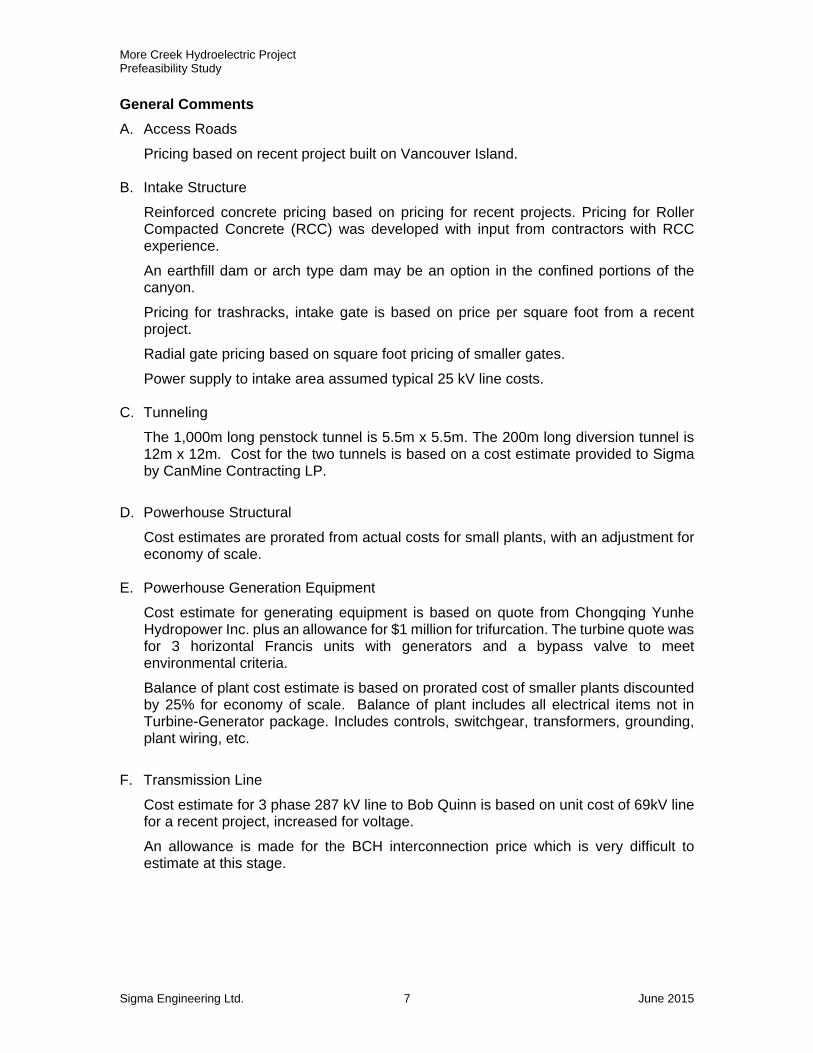
The attached Table 4 shows the prefeasibility construction cost estimate for the project.
Table 4. Prefeasibility Cost Estimate
More Creek Hydroelectric Project Prefeasibility Study
Sigma Engineering Ltd. 7 June 2015
General Comments
A. Access Roads
Pricing based on recent project built on Vancouver Island.
B. Intake Structure
Reinforced concrete pricing based on pricing for recent projects. Pricing for Roller Compacted Concrete (RCC) was developed with input from contractors with RCC experience.
An earthfill dam or arch type dam may be an option in the confined portions of the canyon.
Pricing for trashracks, intake gate is based on price per square foot from a recent project.
Radial gate pricing based on square foot pricing of smaller gates.
Power supply to intake area assumed typical 25 kV line costs.
C. Tunneling
The 1,000m long penstock tunnel is 5.5m x 5.5m. The 200m long diversion tunnel is 12m x 12m. Cost for the two tunnels is based on a cost estimate provided to Sigma by CanMine Contracting LP.
D. Powerhouse Structural
Cost estimates are prorated from actual costs for small plants, with an adjustment for economy of scale.
E. Powerhouse Generation Equipment
Cost estimate for generating equipment is based on quote from Chongqing Yunhe Hydropower Inc. plus an allowance for $1 million for trifurcation. The turbine quote was for 3 horizontal Francis units with generators and a bypass valve to meet environmental criteria.
Balance of plant cost estimate is based on prorated cost of smaller plants discounted by 25% for economy of scale. Balance of plant includes all electrical items not in Turbine-Generator package. Includes controls, switchgear, transformers, grounding, plant wiring, etc.
F. Transmission Line
Cost estimate for 3 phase 287 kV line to Bob Quinn is based on unit cost of 69kV line for a recent project, increased for voltage.
An allowance is made for the BCH interconnection price which is very difficult to estimate at this stage.
More Creek Hydroelectric Project Prefeasibility Study
Sigma Engineering Ltd. 8 June 2015
G. Work Camp
Pricing per man-day is based on quote from full service camp provider. Estimate of number of man-days is based on the total project construction cost.
Limitations
The estimates presented in Table 4 do not include or allow costs for the following:
o Possible fish screens
o Trashrack automatic racking
o A seepage blanket, or grouting, to prevent leakage around the dam
o Plunge pool construction for spillway (may be required depending on site conditions)
o Wildlife and First Nations compensation
o Clearing of reservoir. It is assumed to be zero (trees sold for value equal to clearing cost)
o Potential relocation of a Nova Gold (Galore Creek) road that may be flooded. This road may not be needed beyond the More Creek dam location, unless the mine project is restarted.
5. FINANCIAL ANALYSIS
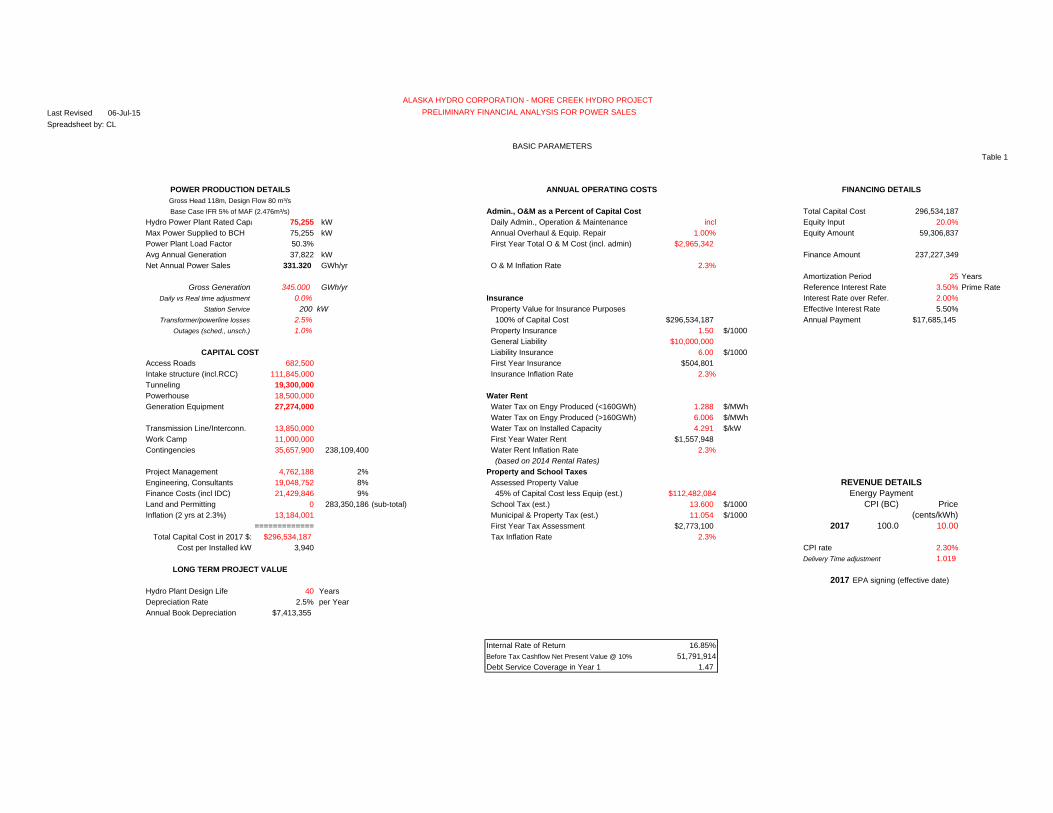
The financial analysis of the project is based on a 40-year period. Sigma used a spreadsheet financial analysis model that has been developed and used for hydroelectric projects in BC. The analysis takes into account the estimated construction costs and escalating annual operating costs (O&M, administration, property/liability insurance, water rent, property and school taxes).
The analysis does not include any land acquisition and permitting costs, royalty payments or wheeling fees. The analysis indicates the expected net present value (NPV) and internal rate of return (IRR) for the project (see Appendix A).
Assumptions
o The annual gross generation from Table 3 is used.
o The construction cost from the previous sections is used.
o The capital cost of the project includes cost estimates for Project Management, Engineering and Finance costs, expressed as a percentage of the construction cost. The estimates are based on typical costs for hydroelectric project in BC. The capital cost also includes an inflation adjustment from 2015 to 2017.
o The annual operating costs include the following, all adjusted annually for inflation:
Administration and Operation and Maintenance Cost as 1% of the Capital Cost
Insurance cost. Based on typical industry rates, which need to be confirmed by insurance professionals.
Water Rent based on 2014 rates.
More Creek Hydroelectric Project Prefeasibility Study
Sigma Engineering Ltd. 9 June 2015
Property and School Taxes. Typical BC rates are used which will need to be confirmed at a later stage.
o The analysis assumes 20% equity, 25 year amortization, an effective interest rate of 5.5% and an electricity price of $100/MWh.
ALASKA HYDRO CORPORATIONMORE CREEK HYDROELECTRIC PROJECT
LOCATION PLAN & WATERSHED
DATE
SIGMA ENGINEERING LTD
JUN 15
PROJ.
E6348
DWN.
ND/DGC
DWG.
FIGURE 1
ALASKA HYDRO CORPORATIONMORE CREEK HYDROELECTRIC PROJECT
GENERAL ARRANGEMENT
DATE
SIGMA ENGINEERING LTD
AUG 14
PROJ.
E6348
DWN.
DGC
DWG.
FIGURE 2
More Creek Hydroelectric Project DRAFT Prefeasibility Study
Sigma Engineering Ltd. 10 June 2015
APPENDIX A
Financial Analysis
Last Revised 06-Jul-15 PRELIMINARY FINANCIAL ANALYSIS FOR POWER SALES
Spreadsheet by: CL
BASIC PARAMETERSTable 1
POWER PRODUCTION DETAILS ANNUAL OPERATING COSTS FINANCING DETAILS
Admin., O&M as a Percent of Capital Cost Total Capital Cost 296,534,187Hydro Power Plant Rated Capa 75,255 kW Daily Admin., Operation & Maintenance incl Equity Input 20.0%Max Power Supplied to BCH 75,255 kW Annual Overhaul & Equip. Repair 1.00% Equity Amount 59,306,837Power Plant Load Factor 50.3% First Year Total O & M Cost (incl. admin) $2,965,342Avg Annual Generation 37,822 kW Finance Amount 237,227,349Net Annual Power Sales 331.320 GWh/yr O & M Inflation Rate 2.3%
Amortization Period 25 YearsGross Generation 345.000 GWh/yr Reference Interest Rate 3.50% Prime Rate
Daily vs Real time adjustment 0.0% Insurance Interest Rate over Refer. 2.00%Station Service 200 kW Property Value for Insurance Purposes Effective Interest Rate 5.50%
Transformer/powerline losses 2.5% 100% of Capital Cost $296,534,187 Annual Payment $17,685,145Outages (sched., unsch.) 1.0% Property Insurance 1.50 $/1000
General Liability $10,000,000 Liability Insurance 6.00 $/1000
Access Roads 682,500 First Year Insurance $504,801 TAXATION DETAILSIntake structure (incl.RCC) 111,845,000 Insurance Inflation Rate 2.3%Tunneling 19,300,000 Corporate Taxation Rate 42.8%Powerhouse 18,500,000 Water RentGeneration Equipment 27,274,000 Water Tax on Engy Produced (<160GWh) 1.288 $/MWh Percent of Capital Cost 90.0%
Water Tax on Engy Produced (>160GWh) 6.006 $/MWh taken as CCA type 34 266,880,768Transmission Line/Interconn. 13,850,000 Water Tax on Installed Capacity 4.291 $/kWWork Camp 11,000,000 First Year Water Rent $1,557,948 Percent of Capital Cost 10.0%Contingencies 35,657,900 238,109,400 Water Rent Inflation Rate 2.3% taken as CCA type 2 29,653,419
(based on 2014 Rental Rates) (6% declining balance)Project Management 4,762,188 2% Property and School TaxesEngineering, Consultants 19,048,752 8% Assessed Property Value REVENUE DETAILSFinance Costs (incl IDC) 21,429,846 9% 45% of Capital Cost less Equip (est.) $112,482,084Land and Permitting 0 283,350,186 (sub-total) School Tax (est.) 13.600 $/1000 CPI (BC) PriceInflation (2 yrs at 2.3%) 13,184,001 Municipal & Property Tax (est.) 11.054 $/1000 (cents/kWh)
============= First Year Tax Assessment $2,773,100 2017 100.0 10.00 Total Capital Cost in 2017 $: $296,534,187 Tax Inflation Rate 2.3%
Cost per Installed kW 3,940 CPI rate 2.30%Delivery Time adjustment 1.019
LONG TERM PROJECT VALUE2017 EPA signing (effective date)
Hydro Plant Design Life 40 YearsDepreciation Rate 2.5% per YearAnnual Book Depreciation $7,413,355
Internal Rate of Return 16.85%Before Tax Cashflow Net Present Value @ 10% 51,791,914Debt Service Coverage in Year 1 1.47
ALASKA HYDRO CORPORATION - MORE CREEK HYDRO PROJECT
Gross Head 118m, Design Flow 80 m³/s
Base Case IFR 5% of MAF (2.476m³/s)
CAPITAL COST
Energy Payment
Last Revised 06-Jul-15 PRELIMINARY FINANCIAL ANALYSIS FOR POWER SALES
Spreadsheet by: CL
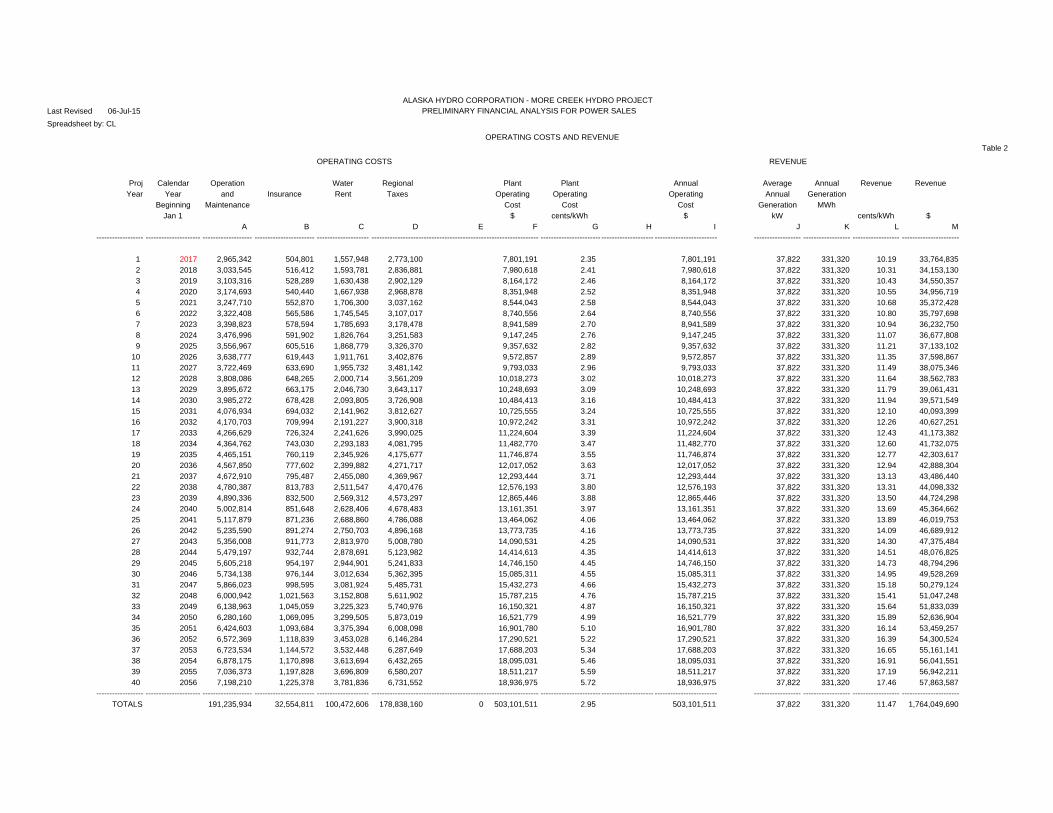
OPERATING COSTS AND REVENUETable 2
OPERATING COSTS REVENUE
Proj Calendar Operation Water Regional Plant Plant Annual Average Annual Revenue RevenueYear Year and Insurance Rent Taxes Operating Operating Operating Annual Generation
Beginning Maintenance Cost Cost Cost Generation MWhJan 1 $ cents/kWh $ kW cents/kWh $
A B C D E F G H I J K L M------------------ --------------------- ------------------- ----------------------- -------------------- ---------------------------------------------------------------- ----------------------- -------------------- ------------------------ ------------------ ------------------ ------------------ ----------------------
1 2017 2,965,342 504,801 1,557,948 2,773,100 7,801,191 2.35 7,801,191 37,822 331,320 10.19 33,764,8352 2018 3,033,545 516,412 1,593,781 2,836,881 7,980,618 2.41 7,980,618 37,822 331,320 10.31 34,153,1303 2019 3,103,316 528,289 1,630,438 2,902,129 8,164,172 2.46 8,164,172 37,822 331,320 10.43 34,550,3574 2020 3,174,693 540,440 1,667,938 2,968,878 8,351,948 2.52 8,351,948 37,822 331,320 10.55 34,956,7195 2021 3,247,710 552,870 1,706,300 3,037,162 8,544,043 2.58 8,544,043 37,822 331,320 10.68 35,372,4286 2022 3,322,408 565,586 1,745,545 3,107,017 8,740,556 2.64 8,740,556 37,822 331,320 10.80 35,797,6987 2023 3,398,823 578,594 1,785,693 3,178,478 8,941,589 2.70 8,941,589 37,822 331,320 10.94 36,232,7508 2024 3,476,996 591,902 1,826,764 3,251,583 9,147,245 2.76 9,147,245 37,822 331,320 11.07 36,677,8089 2025 3,556,967 605,516 1,868,779 3,326,370 9,357,632 2.82 9,357,632 37,822 331,320 11.21 37,133,102
10 2026 3,638,777 619,443 1,911,761 3,402,876 9,572,857 2.89 9,572,857 37,822 331,320 11.35 37,598,86711 2027 3,722,469 633,690 1,955,732 3,481,142 9,793,033 2.96 9,793,033 37,822 331,320 11.49 38,075,34612 2028 3,808,086 648,265 2,000,714 3,561,209 10,018,273 3.02 10,018,273 37,822 331,320 11.64 38,562,78313 2029 3,895,672 663,175 2,046,730 3,643,117 10,248,693 3.09 10,248,693 37,822 331,320 11.79 39,061,43114 2030 3,985,272 678,428 2,093,805 3,726,908 10,484,413 3.16 10,484,413 37,822 331,320 11.94 39,571,54915 2031 4,076,934 694,032 2,141,962 3,812,627 10,725,555 3.24 10,725,555 37,822 331,320 12.10 40,093,39916 2032 4,170,703 709,994 2,191,227 3,900,318 10,972,242 3.31 10,972,242 37,822 331,320 12.26 40,627,25117 2033 4,266,629 726,324 2,241,626 3,990,025 11,224,604 3.39 11,224,604 37,822 331,320 12.43 41,173,38218 2034 4,364,762 743,030 2,293,183 4,081,795 11,482,770 3.47 11,482,770 37,822 331,320 12.60 41,732,07519 2035 4,465,151 760,119 2,345,926 4,175,677 11,746,874 3.55 11,746,874 37,822 331,320 12.77 42,303,61720 2036 4,567,850 777,602 2,399,882 4,271,717 12,017,052 3.63 12,017,052 37,822 331,320 12.94 42,888,30421 2037 4,672,910 795,487 2,455,080 4,369,967 12,293,444 3.71 12,293,444 37,822 331,320 13.13 43,486,44022 2038 4,780,387 813,783 2,511,547 4,470,476 12,576,193 3.80 12,576,193 37,822 331,320 13.31 44,098,33223 2039 4,890,336 832,500 2,569,312 4,573,297 12,865,446 3.88 12,865,446 37,822 331,320 13.50 44,724,29824 2040 5,002,814 851,648 2,628,406 4,678,483 13,161,351 3.97 13,161,351 37,822 331,320 13.69 45,364,66225 2041 5,117,879 871,236 2,688,860 4,786,088 13,464,062 4.06 13,464,062 37,822 331,320 13.89 46,019,75326 2042 5,235,590 891,274 2,750,703 4,896,168 13,773,735 4.16 13,773,735 37,822 331,320 14.09 46,689,91227 2043 5,356,008 911,773 2,813,970 5,008,780 14,090,531 4.25 14,090,531 37,822 331,320 14.30 47,375,48428 2044 5,479,197 932,744 2,878,691 5,123,982 14,414,613 4.35 14,414,613 37,822 331,320 14.51 48,076,82529 2045 5,605,218 954,197 2,944,901 5,241,833 14,746,150 4.45 14,746,150 37,822 331,320 14.73 48,794,29630 2046 5,734,138 976,144 3,012,634 5,362,395 15,085,311 4.55 15,085,311 37,822 331,320 14.95 49,528,26931 2047 5,866,023 998,595 3,081,924 5,485,731 15,432,273 4.66 15,432,273 37,822 331,320 15.18 50,279,12432 2048 6,000,942 1,021,563 3,152,808 5,611,902 15,787,215 4.76 15,787,215 37,822 331,320 15.41 51,047,24833 2049 6,138,963 1,045,059 3,225,323 5,740,976 16,150,321 4.87 16,150,321 37,822 331,320 15.64 51,833,03934 2050 6,280,160 1,069,095 3,299,505 5,873,019 16,521,779 4.99 16,521,779 37,822 331,320 15.89 52,636,90435 2051 6,424,603 1,093,684 3,375,394 6,008,098 16,901,780 5.10 16,901,780 37,822 331,320 16.14 53,459,25736 2052 6,572,369 1,118,839 3,453,028 6,146,284 17,290,521 5.22 17,290,521 37,822 331,320 16.39 54,300,52437 2053 6,723,534 1,144,572 3,532,448 6,287,649 17,688,203 5.34 17,688,203 37,822 331,320 16.65 55,161,14138 2054 6,878,175 1,170,898 3,613,694 6,432,265 18,095,031 5.46 18,095,031 37,822 331,320 16.91 56,041,55139 2055 7,036,373 1,197,828 3,696,809 6,580,207 18,511,217 5.59 18,511,217 37,822 331,320 17.19 56,942,21140 2056 7,198,210 1,225,378 3,781,836 6,731,552 18,936,975 5.72 18,936,975 37,822 331,320 17.46 57,863,587
------------------ --------------------- ------------------- ----------------------- -------------------- ---------------------------------------------------------------- ----------------------- -------------------- ------------------------ ------------------ ------------------ ------------------ ----------------------TOTALS 191,235,934 32,554,811 100,472,606 178,838,160 0 503,101,511 2.95 503,101,511 37,822 331,320 11.47 1,764,049,690
ALASKA HYDRO CORPORATION - MORE CREEK HYDRO PROJECT
Spreadsheet b 06-Jul-15 PRELIMINARY FINANCIAL ANALYSIS FOR POWER SALES
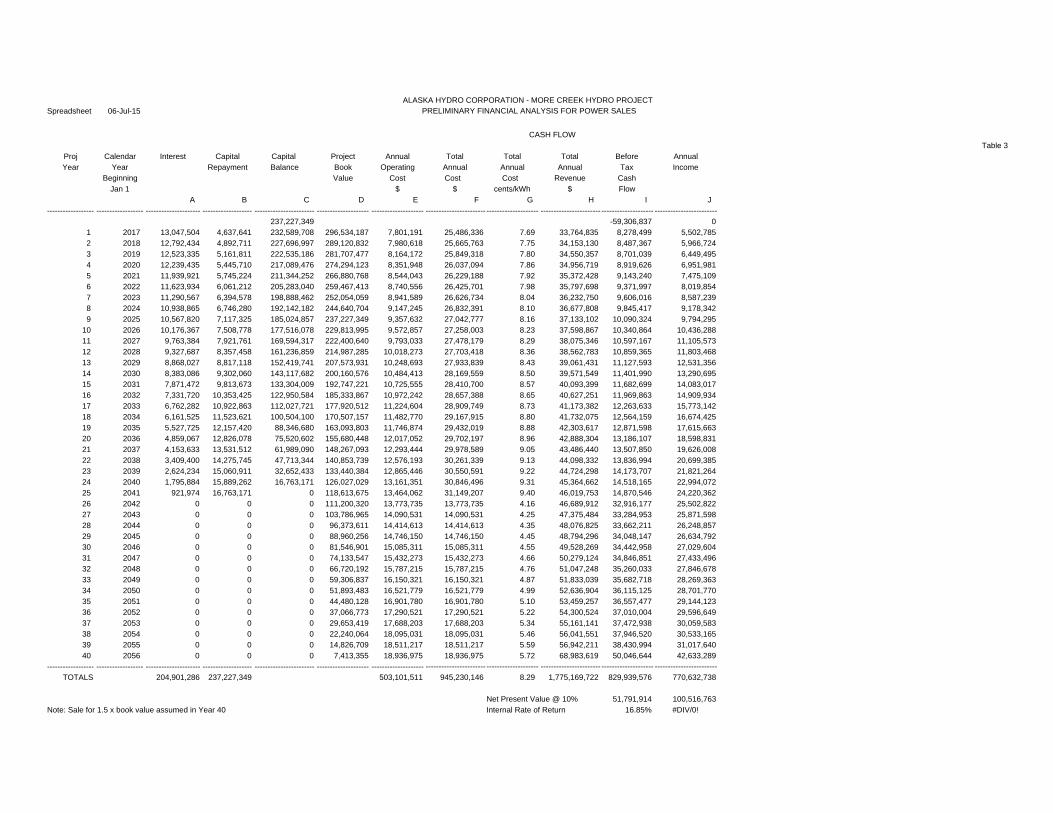
CASH FLOWTable 3
Proj Calendar Interest Capital Capital Project Annual Total Total Total Before Annual CCA CCA CCA Total Annual AfterYear Year Repayment Balance Book Operating Annual Annual Annual Tax Income Type 34 Type 34 Type 2 Taxable Tax Tax
Beginning Value Cost Cost Cost Revenue Cash Annual Income Payable CashJan 1 $ $ cents/kWh $ Flow % Flow
A B C D E F G H I J K L M N O P ------------------ ------------------ --------------------- ------------------- ----------------------- -------------------- -------------------- ----------------------- -------------------- ----------------------- -------------------- ------------------------ K L M N O P
237,227,349 -59,306,837 0 K L M N O P 1 2017 13,047,504 4,637,641 232,589,708 296,534,187 7,801,191 25,486,336 7.69 33,764,835 8,278,499 5,502,785 K L M N O P 2 2018 12,792,434 4,892,711 227,696,997 289,120,832 7,980,618 25,665,763 7.75 34,153,130 8,487,367 5,966,724 K L M N O P 3 2019 12,523,335 5,161,811 222,535,186 281,707,477 8,164,172 25,849,318 7.80 34,550,357 8,701,039 6,449,495 K L M N O P 4 2020 12,239,435 5,445,710 217,089,476 274,294,123 8,351,948 26,037,094 7.86 34,956,719 8,919,626 6,951,981 K L M N O P 5 2021 11,939,921 5,745,224 211,344,252 266,880,768 8,544,043 26,229,188 7.92 35,372,428 9,143,240 7,475,109 K L M N O P 6 2022 11,623,934 6,061,212 205,283,040 259,467,413 8,740,556 26,425,701 7.98 35,797,698 9,371,997 8,019,854 K L M N O P 7 2023 11,290,567 6,394,578 198,888,462 252,054,059 8,941,589 26,626,734 8.04 36,232,750 9,606,016 8,587,239 K L M N O P 8 2024 10,938,865 6,746,280 192,142,182 244,640,704 9,147,245 26,832,391 8.10 36,677,808 9,845,417 9,178,342 K L M N O P 9 2025 10,567,820 7,117,325 185,024,857 237,227,349 9,357,632 27,042,777 8.16 37,133,102 10,090,324 9,794,295 K L M N O P
10 2026 10,176,367 7,508,778 177,516,078 229,813,995 9,572,857 27,258,003 8.23 37,598,867 10,340,864 10,436,288 K L M N O P 11 2027 9,763,384 7,921,761 169,594,317 222,400,640 9,793,033 27,478,179 8.29 38,075,346 10,597,167 11,105,573 K L M N O P 12 2028 9,327,687 8,357,458 161,236,859 214,987,285 10,018,273 27,703,418 8.36 38,562,783 10,859,365 11,803,468 K L M N O P 13 2029 8,868,027 8,817,118 152,419,741 207,573,931 10,248,693 27,933,839 8.43 39,061,431 11,127,593 12,531,356 K L M N O P 14 2030 8,383,086 9,302,060 143,117,682 200,160,576 10,484,413 28,169,559 8.50 39,571,549 11,401,990 13,290,695 K L M N O P 15 2031 7,871,472 9,813,673 133,304,009 192,747,221 10,725,555 28,410,700 8.57 40,093,399 11,682,699 14,083,017 K L M N O P 16 2032 7,331,720 10,353,425 122,950,584 185,333,867 10,972,242 28,657,388 8.65 40,627,251 11,969,863 14,909,934 K L M N O P 17 2033 6,762,282 10,922,863 112,027,721 177,920,512 11,224,604 28,909,749 8.73 41,173,382 12,263,633 15,773,142 K L M N O P 18 2034 6,161,525 11,523,621 100,504,100 170,507,157 11,482,770 29,167,915 8.80 41,732,075 12,564,159 16,674,425 K L M N O P 19 2035 5,527,725 12,157,420 88,346,680 163,093,803 11,746,874 29,432,019 8.88 42,303,617 12,871,598 17,615,663 K L M N O P 20 2036 4,859,067 12,826,078 75,520,602 155,680,448 12,017,052 29,702,197 8.96 42,888,304 13,186,107 18,598,831 K L M N O P 21 2037 4,153,633 13,531,512 61,989,090 148,267,093 12,293,444 29,978,589 9.05 43,486,440 13,507,850 19,626,008 K L M N O P 22 2038 3,409,400 14,275,745 47,713,344 140,853,739 12,576,193 30,261,339 9.13 44,098,332 13,836,994 20,699,385 K L M N O P 23 2039 2,624,234 15,060,911 32,652,433 133,440,384 12,865,446 30,550,591 9.22 44,724,298 14,173,707 21,821,264 K L M N O P 24 2040 1,795,884 15,889,262 16,763,171 126,027,029 13,161,351 30,846,496 9.31 45,364,662 14,518,165 22,994,072 K L M N O P 25 2041 921,974 16,763,171 0 118,613,675 13,464,062 31,149,207 9.40 46,019,753 14,870,546 24,220,362 K L M N O P 26 2042 0 0 0 111,200,320 13,773,735 13,773,735 4.16 46,689,912 32,916,177 25,502,822 K L M N O P 27 2043 0 0 0 103,786,965 14,090,531 14,090,531 4.25 47,375,484 33,284,953 25,871,598 K L M N O P 28 2044 0 0 0 96,373,611 14,414,613 14,414,613 4.35 48,076,825 33,662,211 26,248,857 K L M N O P 29 2045 0 0 0 88,960,256 14,746,150 14,746,150 4.45 48,794,296 34,048,147 26,634,792 K L M N O P 30 2046 0 0 0 81,546,901 15,085,311 15,085,311 4.55 49,528,269 34,442,958 27,029,604 K L M N O P 31 2047 0 0 0 74,133,547 15,432,273 15,432,273 4.66 50,279,124 34,846,851 27,433,496 K L M N O P 32 2048 0 0 0 66,720,192 15,787,215 15,787,215 4.76 51,047,248 35,260,033 27,846,678 K L M N O P 33 2049 0 0 0 59,306,837 16,150,321 16,150,321 4.87 51,833,039 35,682,718 28,269,363 K L M N O P 34 2050 0 0 0 51,893,483 16,521,779 16,521,779 4.99 52,636,904 36,115,125 28,701,770 K L M N O P 35 2051 0 0 0 44,480,128 16,901,780 16,901,780 5.10 53,459,257 36,557,477 29,144,123 K L M N O P 36 2052 0 0 0 37,066,773 17,290,521 17,290,521 5.22 54,300,524 37,010,004 29,596,649 K L M N O P 37 2053 0 0 0 29,653,419 17,688,203 17,688,203 5.34 55,161,141 37,472,938 30,059,583 K L M N O P 38 2054 0 0 0 22,240,064 18,095,031 18,095,031 5.46 56,041,551 37,946,520 30,533,165 K L M N O P 39 2055 0 0 0 14,826,709 18,511,217 18,511,217 5.59 56,942,211 38,430,994 31,017,640 K L M N O P 40 2056 0 0 0 7,413,355 18,936,975 18,936,975 5.72 68,983,619 50,046,644 42,633,289 K L M N O P
------------------ ------------------ --------------------- ------------------- ----------------------- -------------------- -------------------- ----------------------- -------------------- ----------------------- -------------------- ------------------------ K L M N O P TOTALS 204,901,286 237,227,349 503,101,511 945,230,146 8.29 1,775,169,722 829,939,576 770,632,738 K L M N O P
K L M N O P Net Present Value @ 10% 51,791,914 100,516,763 L M N O P
Note: Sale for 1.5 x book value assumed in Year 40 Internal Rate of Return 16.85% #DIV/0! L M N O P
ALASKA HYDRO CORPORATION - MORE CREEK HYDRO PROJECT