moody’s global credit policy march 2009 special comment moody’s global credit policy - sovereign...
TRANSCRIPT
www.moodys.com
Credit PolicyMoody’s Global
Special Comment
Table of Contents: Summary 1
Introduction 2 Data and Methodology 3 Trends in Credit Quality: The Distribution of Sovereign Ratings 4 Trends in Credit Quality: Rating Actions and Migration Rates 5 Historical Sovereign Defaults 7 Sovereign Cumulative Default Rates 8 Recovery Rates of Defaulted Sovereign Issuers 10 Rating Performance Measures 11 Moody’s Related Research 13 Appendix I – Circumstances Surrounding Individual Sovereign Bond Defaults 14 Appendix II – Prices of Defaulted Sovereign Bonds 20 Appendix III – Sovereign Bond Rating Histories 22
Analyst Contacts:
New York 1.212.553.1653
Elena Duggar Analyst
Kenneth Emery Senior Vice President Bart Oosterveld Chief Credit Officer, Global Public, Project and Infrastructure Finance
Naomi Richman Senior Vice President and Team Leader, Sovereign Risk Group
London 44.20.7772.8735
Pierre Cailleteau Team Managing Director
March 2009
Sovereign Default and Recovery Rates, 1983-2008
Summary
This report is Moody’s fifth annual study of sovereign bond issuers and their default experience. Broad conclusions include the following:
There were two sovereign defaults during 2008 – Ecuador and the Seychelles both missed interest payments on their global bonds in the second half of the year.
As the financial crises spread to emerging markets and global economic growth slowed, we saw a reversal in sovereign credit trends as rating downgrades exceeded upgrades in 2008 for the first time in several years.
Recoveries during 2008 were significantly below historical trends, at 26% for Ecuador and 29% for the Seychelles. Historically, issuer-weighted recovery rates on defaulted sovereign bonds, as measured by trading prices observed at the time of default, have averaged 50%.
Historically, sovereign ratings have been more stable at higher rating levels and modestly more stable than their corporate counterparts.
Sovereign default rates have generally been lower than corporate default rates, with the differences widening at lower rating categories and at longer time horizons. However, the differences are not likely significant as the overall size of the sovereign sample is small and as default risk is highly correlated across emerging market sovereigns.
Historically, sovereign ratings have proved to be accurate predictors of relative default risk, providing consistent relative rank ordering. All sovereign defaulters have had ratings of Ba2 or less within one year prior to default. The historical average one-year accuracy ratio for the sovereign ratings is 94.4 percent for the period 1983-2008.
2 March 2009 Special Comment Moody’s Global Credit Policy - Sovereign Default and Recovery Rates, 1983-2008
Special Comment Moody’s Global Credit Policy
Sovereign Default and Recovery Rates, 1983-2008
Introduction
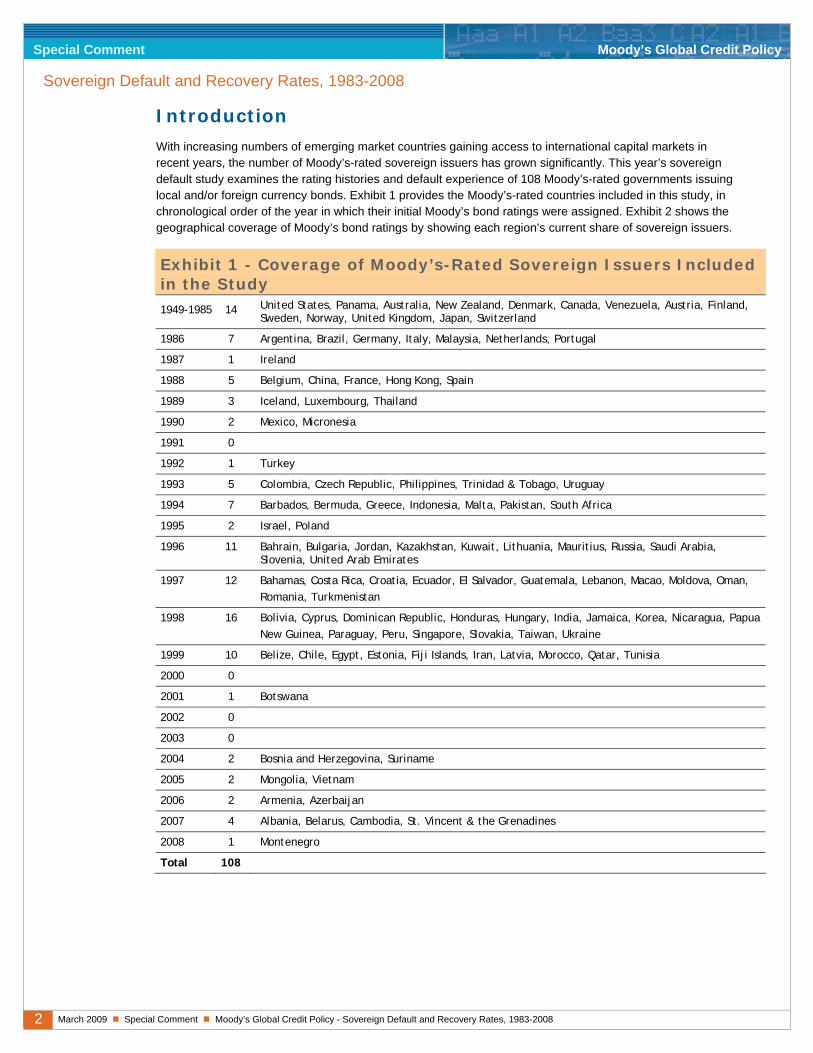
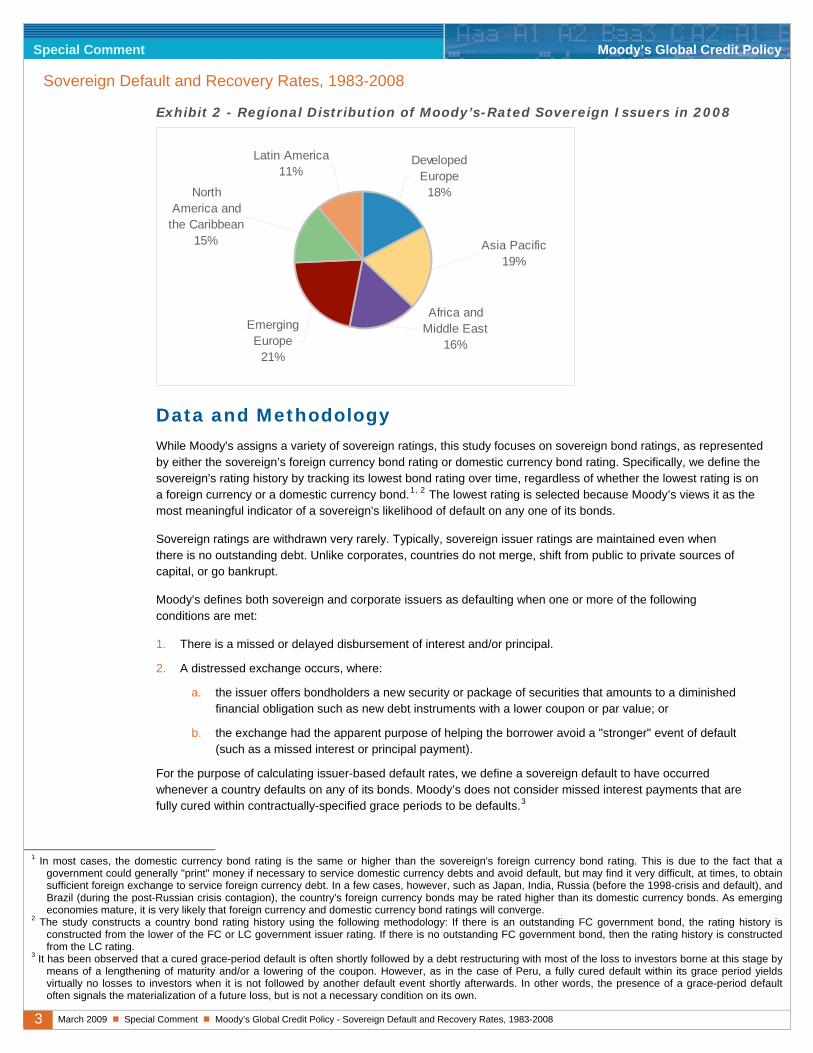
With increasing numbers of emerging market countries gaining access to international capital markets in recent years, the number of Moody’s-rated sovereign issuers has grown significantly. This year’s sovereign default study examines the rating histories and default experience of 108 Moody’s-rated governments issuing local and/or foreign currency bonds. Exhibit 1 provides the Moody’s-rated countries included in this study, in chronological order of the year in which their initial Moody’s bond ratings were assigned. Exhibit 2 shows the geographical coverage of Moody’s bond ratings by showing each region’s current share of sovereign issuers.
Exhibit 1 - Coverage of Moody’s-Rated Sovereign Issuers Included in the Study 1949-1985 14 United States, Panama, Australia, New Zealand, Denmark, Canada, Venezuela, Austria, Finland,
Sweden, Norway, United Kingdom, Japan, Switzerland
1986 7 Argentina, Brazil, Germany, Italy, Malaysia, Netherlands, Portugal
1987 1 Ireland
1988 5 Belgium, China, France, Hong Kong, Spain
1989 3 Iceland, Luxembourg, Thailand
1990 2 Mexico, Micronesia
1991 0
1992 1 Turkey
1993 5 Colombia, Czech Republic, Philippines, Trinidad & Tobago, Uruguay
1994 7 Barbados, Bermuda, Greece, Indonesia, Malta, Pakistan, South Africa
1995 2 Israel, Poland
1996 11 Bahrain, Bulgaria, Jordan, Kazakhstan, Kuwait, Lithuania, Mauritius, Russia, Saudi Arabia, Slovenia, United Arab Emirates
1997 12 Bahamas, Costa Rica, Croatia, Ecuador, El Salvador, Guatemala, Lebanon, Macao, Moldova, Oman, Romania, Turkmenistan
1998 16 Bolivia, Cyprus, Dominican Republic, Honduras, Hungary, India, Jamaica, Korea, Nicaragua, Papua New Guinea, Paraguay, Peru, Singapore, Slovakia, Taiwan, Ukraine
1999 10 Belize, Chile, Egypt, Estonia, Fiji Islands, Iran, Latvia, Morocco, Qatar, Tunisia
2000 0
2001 1 Botswana
2002 0
2003 0
2004 2 Bosnia and Herzegovina, Suriname
2005 2 Mongolia, Vietnam
2006 2 Armenia, Azerbaijan
2007 4 Albania, Belarus, Cambodia, St. Vincent & the Grenadines
2008 1 Montenegro
Total 108
3 March 2009 Special Comment Moody’s Global Credit Policy - Sovereign Default and Recovery Rates, 1983-2008
Special Comment Moody’s Global Credit Policy
Sovereign Default and Recovery Rates, 1983-2008
Exhibit 2 - Regional Distribution of Moody’s-Rated Sovereign Issuers in 2008
Africa and Middle East
16%
Asia Pacific19%
Developed Europe
18%
Emerging Europe
21%
North America and
the Caribbean15%
Latin America11%
Data and Methodology
While Moody's assigns a variety of sovereign ratings, this study focuses on sovereign bond ratings, as represented by either the sovereign’s foreign currency bond rating or domestic currency bond rating. Specifically, we define the sovereign's rating history by tracking its lowest bond rating over time, regardless of whether the lowest rating is on a foreign currency or a domestic currency bond.1, 2 The lowest rating is selected because Moody’s views it as the most meaningful indicator of a sovereign's likelihood of default on any one of its bonds.
Sovereign ratings are withdrawn very rarely. Typically, sovereign issuer ratings are maintained even when there is no outstanding debt. Unlike corporates, countries do not merge, shift from public to private sources of capital, or go bankrupt.
Moody's defines both sovereign and corporate issuers as defaulting when one or more of the following conditions are met:
1. There is a missed or delayed disbursement of interest and/or principal.
2. A distressed exchange occurs, where:
a. the issuer offers bondholders a new security or package of securities that amounts to a diminished financial obligation such as new debt instruments with a lower coupon or par value; or
b. the exchange had the apparent purpose of helping the borrower avoid a "stronger" event of default (such as a missed interest or principal payment).
For the purpose of calculating issuer-based default rates, we define a sovereign default to have occurred whenever a country defaults on any of its bonds. Moody’s does not consider missed interest payments that are fully cured within contractually-specified grace periods to be defaults.3
1 In most cases, the domestic currency bond rating is the same or higher than the sovereign's foreign currency bond rating. This is due to the fact that a
government could generally "print" money if necessary to service domestic currency debts and avoid default, but may find it very difficult, at times, to obtain sufficient foreign exchange to service foreign currency debt. In a few cases, however, such as Japan, India, Russia (before the 1998-crisis and default), and Brazil (during the post-Russian crisis contagion), the country's foreign currency bonds may be rated higher than its domestic currency bonds. As emerging economies mature, it is very likely that foreign currency and domestic currency bond ratings will converge.
2 The study constructs a country bond rating history using the following methodology: If there is an outstanding FC government bond, the rating history is constructed from the lower of the FC or LC government issuer rating. If there is no outstanding FC government bond, then the rating history is constructed from the LC rating.
3 It has been observed that a cured grace-period default is often shortly followed by a debt restructuring with most of the loss to investors borne at this stage by means of a lengthening of maturity and/or a lowering of the coupon. However, as in the case of Peru, a fully cured default within its grace period yields virtually no losses to investors when it is not followed by another default event shortly afterwards. In other words, the presence of a grace-period default often signals the materialization of a future loss, but is not a necessary condition on its own.

4 March 2009 Special Comment Moody’s Global Credit Policy - Sovereign Default and Recovery Rates, 1983-2008
Special Comment Moody’s Global Credit Policy
Sovereign Default and Recovery Rates, 1983-2008
Trends in Credit Quality: The Distribution of Sovereign Ratings
As shown in Exhibit 3, by end-2008 the share of investment-grade sovereign issuers had declined to a little over 60 percent. While all rated sovereign issuers in 1983 were investment-grade, recently riskier emerging market countries have gained access to debt markets. Indeed, as more sovereign issuers have obtained Moody’s ratings, the rating distribution for sovereign issuers has become more similar to that of the corporate bond issuers. The sovereign rating mix had drifted upward between 2000 and 2005-2006, as the share of sovereigns rated investment grade had climbed modestly. However, in 2007-2008 the share of Aaa and A-rated sovereigns declined slightly. In 2008, the mode of the rating distribution is at Baa.
Exhibit 3 – Rating Distribution of Sovereign Issuers on Selected Dates
1983 1990 1995 2000 2005 2008 Aaa 75% 40% 20% 14% 20% 18%
Aa 25% 30% 26% 14% 5% 11%
A 0% 17% 20% 13% 24% 19%
Baa 0% 3% 13% 21% 14% 13%
Ba 0% 7% 15% 17% 15% 16%
B 0% 3% 7% 16% 17% 20%
Caa-C 0% 0% 0% 5% 4% 3%
Investment-Grade 100% 90% 78% 62% 64% 61%
Speculative-Grade 0% 10% 22% 38% 36% 39%
The ratings distributions of sovereign and corporate bond issuers as of December 2008 are compared in Exhibit 4. The share of issuers rated Aaa is substantially larger for sovereigns than for corporates, while the proportion of sovereigns rated Aa-Baa is smaller. Otherwise, the distributions of sovereign and corporate ratings are fairly similar.
Exhibit 4 – Rating Distribution of Sovereign and Corporate Issuers in December 2008
0%
5%
10%
15%
20%
25%
Aaa Aa A Baa Ba B Caa-CSovereign Corporate
5 March 2009 Special Comment Moody’s Global Credit Policy - Sovereign Default and Recovery Rates, 1983-2008
Special Comment Moody’s Global Credit Policy
Sovereign Default and Recovery Rates, 1983-2008
Trends in Credit Quality: Rating Actions and Migration Rates
Changes in the distribution of ratings over time can occur because issuers with higher or lower-than-average ratings enter or leave the sample and/or because of shifts in the credit quality of individual issuers. This section focuses exclusively on rating changes.
In 2008, 15 sovereigns had their local or foreign currency bond ratings changed, representing 14 percent of the total rated sample. Eight sovereigns experienced upgrades, mainly concentrated in the first half of 2008. Malta and Cyprus were upgraded following their entry into the Euro zone. Russia, Japan, Paraguay, and Peru were upgraded following a reduction in government debt vulnerabilities and a strengthening of the government balance sheet. Colombia and Israel were also upgraded following the sustained economic recovery in Colombia resulting from the improved security situation, and Israel’s established fiscal discipline and resiliency in the face of repeated economic and political shocks. Further, seven countries were downgraded, mostly during the second half of the year as the global financial crises spread to: Iceland; emerging Europe – Hungary, Latvia, and Croatia; and other emerging markets – Egypt, Pakistan, and Ecuador. We saw a reversal in sovereign credit trends in 2008 as rating downgrades exceeded upgrades for the first time in several years – the above rating actions represented 9 upgrades and 11 downgrades.
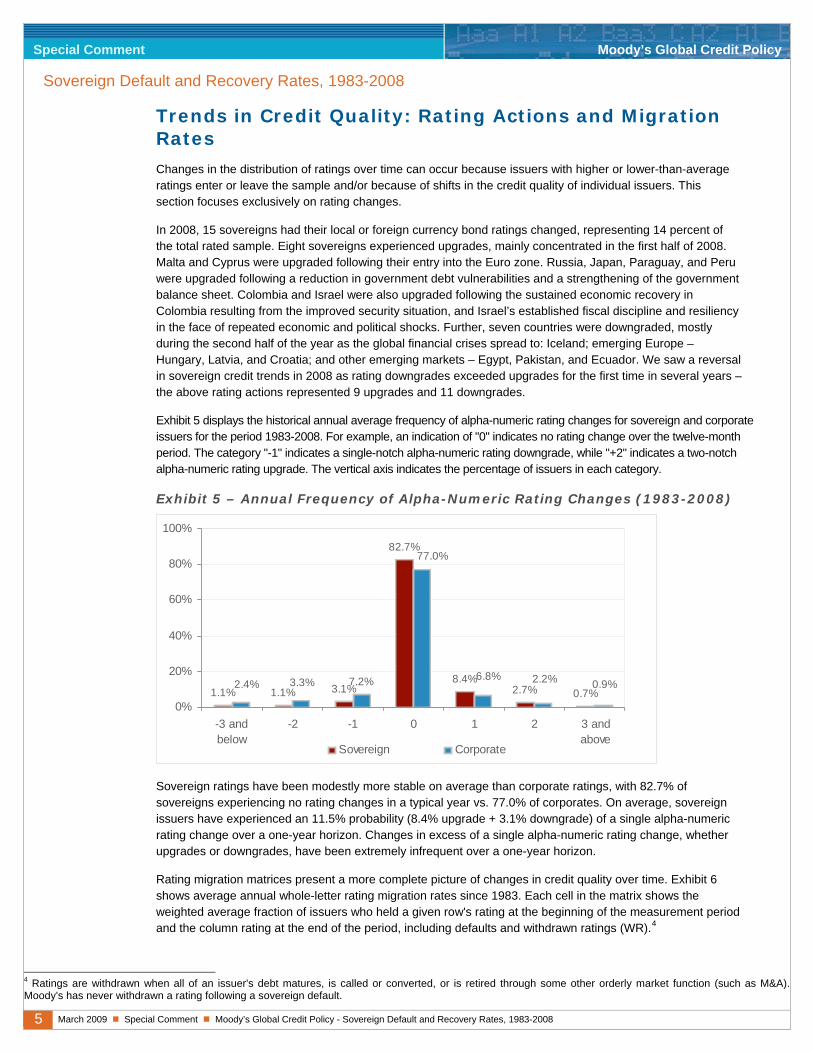
Exhibit 5 displays the historical annual average frequency of alpha-numeric rating changes for sovereign and corporate issuers for the period 1983-2008. For example, an indication of "0" indicates no rating change over the twelve-month period. The category "-1" indicates a single-notch alpha-numeric rating downgrade, while "+2" indicates a two-notch alpha-numeric rating upgrade. The vertical axis indicates the percentage of issuers in each category.
Exhibit 5 – Annual Frequency of Alpha-Numeric Rating Changes (1983-2008)
1.1% 1.1% 3.1%
82.7%
8.4%2.7% 0.7%
7.2%
77.0%
6.8% 2.2% 0.9%3.3%2.4%
0%
20%
40%
60%
80%
100%
-3 andbelow
-2 -1 0 1 2 3 andabove
Sovereign Corporate
Sovereign ratings have been modestly more stable on average than corporate ratings, with 82.7% of sovereigns experiencing no rating changes in a typical year vs. 77.0% of corporates. On average, sovereign issuers have experienced an 11.5% probability (8.4% upgrade + 3.1% downgrade) of a single alpha-numeric rating change over a one-year horizon. Changes in excess of a single alpha-numeric rating change, whether upgrades or downgrades, have been extremely infrequent over a one-year horizon.
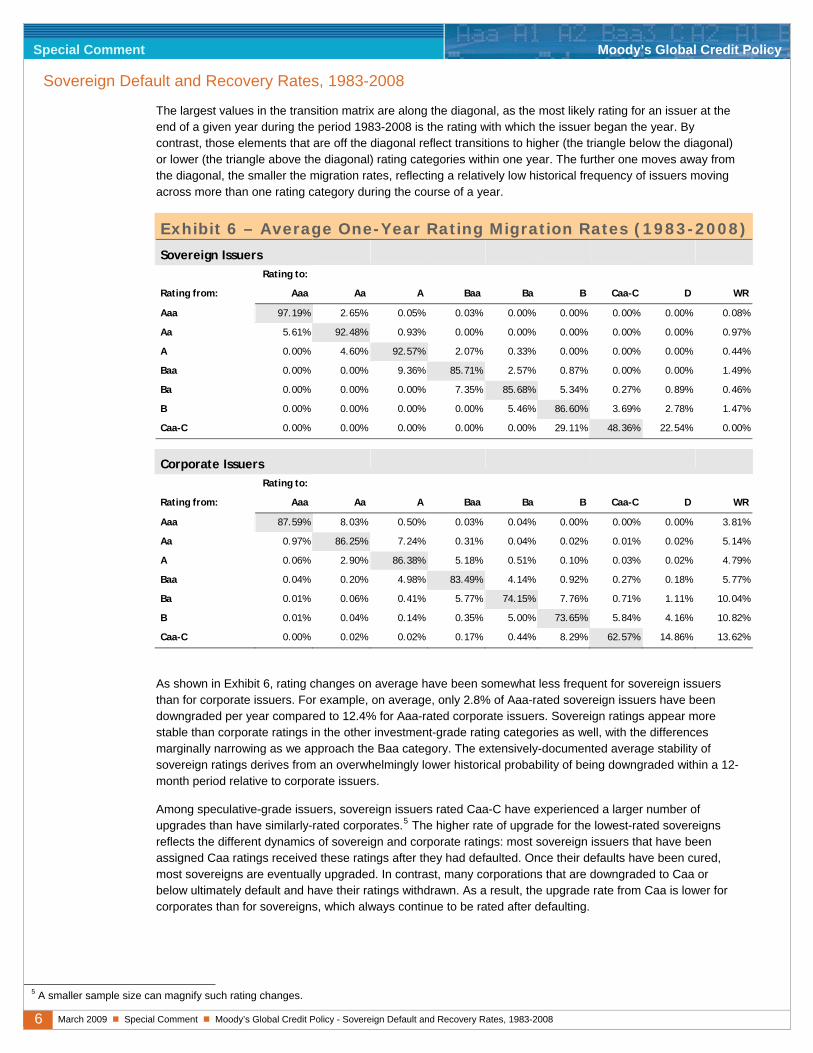
Rating migration matrices present a more complete picture of changes in credit quality over time. Exhibit 6 shows average annual whole-letter rating migration rates since 1983. Each cell in the matrix shows the weighted average fraction of issuers who held a given row's rating at the beginning of the measurement period and the column rating at the end of the period, including defaults and withdrawn ratings (WR).4
4 Ratings are withdrawn when all of an issuer's debt matures, is called or converted, or is retired through some other orderly market function (such as M&A). Moody's has never withdrawn a rating following a sovereign default.
6 March 2009 Special Comment Moody’s Global Credit Policy - Sovereign Default and Recovery Rates, 1983-2008
Special Comment Moody’s Global Credit Policy
Sovereign Default and Recovery Rates, 1983-2008
The largest values in the transition matrix are along the diagonal, as the most likely rating for an issuer at the end of a given year during the period 1983-2008 is the rating with which the issuer began the year. By contrast, those elements that are off the diagonal reflect transitions to higher (the triangle below the diagonal) or lower (the triangle above the diagonal) rating categories within one year. The further one moves away from the diagonal, the smaller the migration rates, reflecting a relatively low historical frequency of issuers moving across more than one rating category during the course of a year.
Exhibit 6 – Average One-Year Rating Migration Rates (1983-2008)
Sovereign Issuers
Rating to:
Rating from: Aaa Aa A Baa Ba B Caa-C D WR
Aaa 97.19% 2.65% 0.05% 0.03% 0.00% 0.00% 0.00% 0.00% 0.08%
Aa 5.61% 92.48% 0.93% 0.00% 0.00% 0.00% 0.00% 0.00% 0.97%
A 0.00% 4.60% 92.57% 2.07% 0.33% 0.00% 0.00% 0.00% 0.44%
Baa 0.00% 0.00% 9.36% 85.71% 2.57% 0.87% 0.00% 0.00% 1.49%
Ba 0.00% 0.00% 0.00% 7.35% 85.68% 5.34% 0.27% 0.89% 0.46%
B 0.00% 0.00% 0.00% 0.00% 5.46% 86.60% 3.69% 2.78% 1.47%
Caa-C 0.00% 0.00% 0.00% 0.00% 0.00% 29.11% 48.36% 22.54% 0.00%
Corporate Issuers
Rating to:
Rating from: Aaa Aa A Baa Ba B Caa-C D WR
Aaa 87.59% 8.03% 0.50% 0.03% 0.04% 0.00% 0.00% 0.00% 3.81%
Aa 0.97% 86.25% 7.24% 0.31% 0.04% 0.02% 0.01% 0.02% 5.14%
A 0.06% 2.90% 86.38% 5.18% 0.51% 0.10% 0.03% 0.02% 4.79%
Baa 0.04% 0.20% 4.98% 83.49% 4.14% 0.92% 0.27% 0.18% 5.77%
Ba 0.01% 0.06% 0.41% 5.77% 74.15% 7.76% 0.71% 1.11% 10.04%
B 0.01% 0.04% 0.14% 0.35% 5.00% 73.65% 5.84% 4.16% 10.82%
Caa-C 0.00% 0.02% 0.02% 0.17% 0.44% 8.29% 62.57% 14.86% 13.62%
As shown in Exhibit 6, rating changes on average have been somewhat less frequent for sovereign issuers than for corporate issuers. For example, on average, only 2.8% of Aaa-rated sovereign issuers have been downgraded per year compared to 12.4% for Aaa-rated corporate issuers. Sovereign ratings appear more stable than corporate ratings in the other investment-grade rating categories as well, with the differences marginally narrowing as we approach the Baa category. The extensively-documented average stability of sovereign ratings derives from an overwhelmingly lower historical probability of being downgraded within a 12-month period relative to corporate issuers.
Among speculative-grade issuers, sovereign issuers rated Caa-C have experienced a larger number of upgrades than have similarly-rated corporates.5 The higher rate of upgrade for the lowest-rated sovereigns reflects the different dynamics of sovereign and corporate ratings: most sovereign issuers that have been assigned Caa ratings received these ratings after they had defaulted. Once their defaults have been cured, most sovereigns are eventually upgraded. In contrast, many corporations that are downgraded to Caa or below ultimately default and have their ratings withdrawn. As a result, the upgrade rate from Caa is lower for corporates than for sovereigns, which always continue to be rated after defaulting.
5 A smaller sample size can magnify such rating changes.
7 March 2009 Special Comment Moody’s Global Credit Policy - Sovereign Default and Recovery Rates, 1983-2008
Special Comment Moody’s Global Credit Policy
Sovereign Default and Recovery Rates, 1983-2008
Historical Sovereign Defaults
As the global financial crises spread to emerging markets and global economic growth slowed, there were two sovereign defaults in the second half of 2008 – Ecuador (rated) and the Seychelles (not rated by Moody’s).
Ecuador’s default in December 2008 represented a problem of “willingness to pay” rather than “capacity to pay” as the government’s decision to default was based on ideological and political grounds and was not related to liquidity and solvency issues. The default followed the government’s announcement that it considered the debt “illegal” and “illegitimate”, and occurred in a situation of relative macroeconomic strength, despite the recent downturn in commodity prices. As of this writing, the government has announced that it would formulate a debt restructuring plan, which is expected to include a severe haircut on bond holders.
The Seychelles’ default, on the other hand, occurred in the context of a difficult economic environment, severe fiscal and balance-of-payments constraints, an unsustainable debt burden (Seychelles’ debt burden is among the highest in the world relative to the size of its economy), and depleted international reserves. Several previous years of moribund economic growth, expansionary fiscal policy, and increased indebtedness, combined with a fall in tourism, on which the country is heavily dependent, exacerbated the situation in 2008. The government has announced that it is to seek a restructuring of its external debt stock of approximately US$800 million and has embarked on its first-ever IMF-supported economic and financial program.6
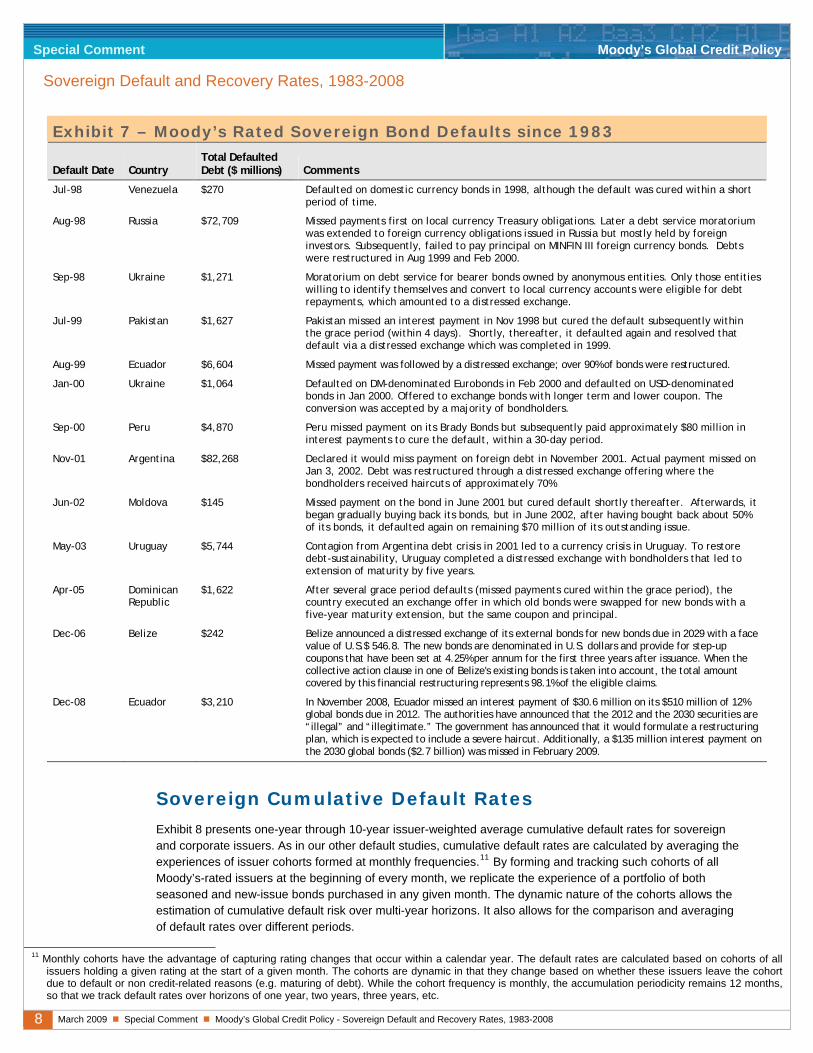
Exhibit 7 provides a chronological summary of historical Moody’s-rated sovereign defaults, the bond-default volumes associated with these defaults, and the circumstances surrounding the defaults.7
Although our sample begins in 1983, there were no Moody’s-rated sovereign bond defaults until 1998.8 A mixture of cooling global economic conditions, unfavorable market sentiment after the Asian crisis, and external shocks, as well as an increase in the share of speculative-grade sovereign bond issuers in the mid-1990s, produced five Moody's-rated sovereign bond defaults in 1998-1999: Russia, Pakistan, Ukraine, Venezuela, and Ecuador. Interestingly, even though many countries were battered by the currency crisis of 1998, not one Asian country actually defaulted on its government bonds.9 The largest default of 1998 was that of Russia as the country suffered a currency, banking and fiscal crisis, as a result of external shocks in the form of weak oil and nonferrous metals prices, unfavorable market sentiment after the Asian crisis, and unsustainable government budget policies.
During 2000-2006, there have been seven additional defaults, led by Argentina's US$82 billion default in 2001, which spilled over to Uruguay two years later. Appendix I provides more details on events leading to the defaults listed in Exhibit 7, as well as their eventual resolutions.10 Appendix I also provides details on recent unrated defaults.
6 More details on the defaults are presented in Appendix I. 7 While countries may have defaulted on bilateral loans or agency loans, our focus is on sovereign bond defaults. 8 Moody’s-rated sovereign bond defaults represent about one third of all sovereign bond defaults. Additionally, sovereign defaults on official debt and
commercial bank loans have been far more frequent than bond defaults. 9 Indonesia came closest to default as it restructured its syndicated London Club bank debt in line with Paris Club comparability of treatment requirements, but
its bonds continued to be serviced. 10 For the sake of completeness, both Exhibit 7 and Appendix I include the default of Peru which was fully cured within its grace period, but the event does not
enter any of the subsequent default calculations.
8 March 2009 Special Comment Moody’s Global Credit Policy - Sovereign Default and Recovery Rates, 1983-2008
Special Comment Moody’s Global Credit Policy
Sovereign Default and Recovery Rates, 1983-2008
Exhibit 7 – Moody’s Rated Sovereign Bond Defaults since 1983
Default Date Country Total Defaulted Debt ($ millions) Comments
Jul-98 Venezuela $270 Defaulted on domestic currency bonds in 1998, although the default was cured within a short period of time.
Aug-98 Russia $72,709 Missed payments first on local currency Treasury obligations. Later a debt service moratorium was extended to foreign currency obligations issued in Russia but mostly held by foreign investors. Subsequently, failed to pay principal on MINFIN III foreign currency bonds. Debts were restructured in Aug 1999 and Feb 2000.
Sep-98 Ukraine $1,271 Moratorium on debt service for bearer bonds owned by anonymous entities. Only those entities willing to identify themselves and convert to local currency accounts were eligible for debt repayments, which amounted to a distressed exchange.
Jul-99 Pakistan $1,627 Pakistan missed an interest payment in Nov 1998 but cured the default subsequently within the grace period (within 4 days). Shortly, thereafter, it defaulted again and resolved that default via a distressed exchange which was completed in 1999.
Aug-99 Ecuador $6,604 Missed payment was followed by a distressed exchange; over 90% of bonds were restructured.
Jan-00 Ukraine $1,064 Defaulted on DM-denominated Eurobonds in Feb 2000 and defaulted on USD-denominated bonds in Jan 2000. Offered to exchange bonds with longer term and lower coupon. The conversion was accepted by a majority of bondholders.
Sep-00 Peru $4,870 Peru missed payment on its Brady Bonds but subsequently paid approximately $80 million in interest payments to cure the default, within a 30-day period.
Nov-01 Argentina $82,268 Declared it would miss payment on foreign debt in November 2001. Actual payment missed on Jan 3, 2002. Debt was restructured through a distressed exchange offering where the bondholders received haircuts of approximately 70%
Jun-02 Moldova $145 Missed payment on the bond in June 2001 but cured default shortly thereafter. Afterwards, it began gradually buying back its bonds, but in June 2002, after having bought back about 50% of its bonds, it defaulted again on remaining $70 million of its outstanding issue.
May-03 Uruguay $5,744 Contagion from Argentina debt crisis in 2001 led to a currency crisis in Uruguay. To restore debt-sustainability, Uruguay completed a distressed exchange with bondholders that led to extension of maturity by five years.
Apr-05 Dominican Republic
$1,622 After several grace period defaults (missed payments cured within the grace period), the country executed an exchange offer in which old bonds were swapped for new bonds with a five-year maturity extension, but the same coupon and principal.
Dec-06 Belize $242 Belize announced a distressed exchange of its external bonds for new bonds due in 2029 with a face value of U.S.$ 546.8. The new bonds are denominated in U.S. dollars and provide for step-up coupons that have been set at 4.25% per annum for the first three years after issuance. When the collective action clause in one of Belize's existing bonds is taken into account, the total amount covered by this financial restructuring represents 98.1% of the eligible claims.
Dec-08 Ecuador $3,210 In November 2008, Ecuador missed an interest payment of $30.6 million on its $510 million of 12% global bonds due in 2012. The authorities have announced that the 2012 and the 2030 securities are “illegal” and “illegitimate.” The government has announced that it would formulate a restructuring plan, which is expected to include a severe haircut. Additionally, a $135 million interest payment on the 2030 global bonds ($2.7 billion) was missed in February 2009.
Sovereign Cumulative Default Rates
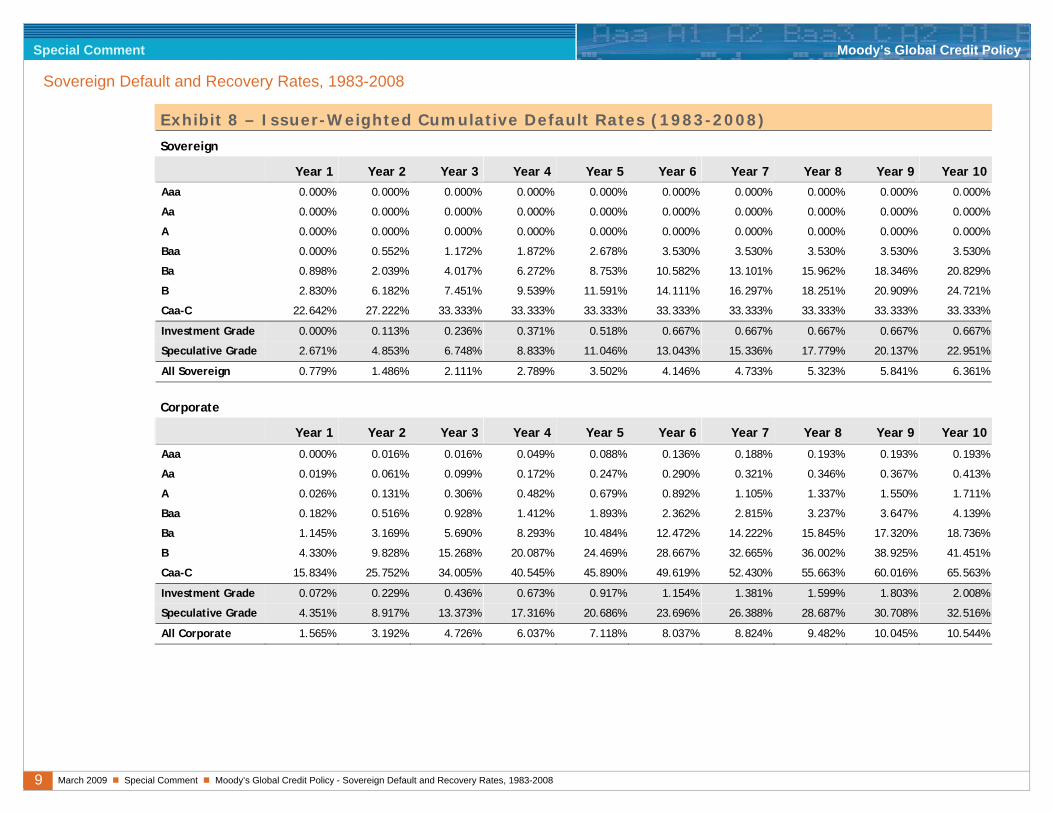
Exhibit 8 presents one-year through 10-year issuer-weighted average cumulative default rates for sovereign and corporate issuers. As in our other default studies, cumulative default rates are calculated by averaging the experiences of issuer cohorts formed at monthly frequencies.11 By forming and tracking such cohorts of all Moody’s-rated issuers at the beginning of every month, we replicate the experience of a portfolio of both seasoned and new-issue bonds purchased in any given month. The dynamic nature of the cohorts allows the estimation of cumulative default risk over multi-year horizons. It also allows for the comparison and averaging of default rates over different periods.
11 Monthly cohorts have the advantage of capturing rating changes that occur within a calendar year. The default rates are calculated based on cohorts of all
issuers holding a given rating at the start of a given month. The cohorts are dynamic in that they change based on whether these issuers leave the cohort due to default or non credit-related reasons (e.g. maturing of debt). While the cohort frequency is monthly, the accumulation periodicity remains 12 months, so that we track default rates over horizons of one year, two years, three years, etc.
9 March 2009 Special Comment Moody’s Global Credit Policy - Sovereign Default and Recovery Rates, 1983-2008
Special Comment Moody’s Global Credit Policy
Sovereign Default and Recovery Rates, 1983-2008
Exhibit 8 – Issuer-Weighted Cumulative Default Rates (1983-2008)
Sove reign
Year 1 Year 2 Year 3 Year 4 Year 5 Year 6 Year 7 Year 8 Year 9 Year 10
Aaa 0.000% 0.000% 0.000% 0.000% 0.000% 0.000% 0.000% 0.000% 0.000% 0.000%
Aa 0.000% 0.000% 0.000% 0.000% 0.000% 0.000% 0.000% 0.000% 0.000% 0.000%
A 0.000% 0.000% 0.000% 0.000% 0.000% 0.000% 0.000% 0.000% 0.000% 0.000%
Baa 0.000% 0.552% 1.172% 1.872% 2.678% 3.530% 3.530% 3.530% 3.530% 3.530%
Ba 0.898% 2.039% 4.017% 6.272% 8.753% 10.582% 13.101% 15.962% 18.346% 20.829%
B 2.830% 6.182% 7.451% 9.539% 11.591% 14.111% 16.297% 18.251% 20.909% 24.721%
Caa-C 22.642% 27.222% 33.333% 33.333% 33.333% 33.333% 33.333% 33.333% 33.333% 33.333%
Investment Grade 0.000% 0.113% 0.236% 0.371% 0.518% 0.667% 0.667% 0.667% 0.667% 0.667%
Speculative Grade 2.671% 4.853% 6.748% 8.833% 11.046% 13.043% 15.336% 17.779% 20.137% 22.951%
All Sovereign 0.779% 1.486% 2.111% 2.789% 3.502% 4.146% 4.733% 5.323% 5.841% 6.361%
Corpo rate
Year 1 Year 2 Year 3 Year 4 Year 5 Year 6 Year 7 Year 8 Year 9 Year 10
Aaa 0.000% 0.016% 0.016% 0.049% 0.088% 0.136% 0.188% 0.193% 0.193% 0.193%
Aa 0.019% 0.061% 0.099% 0.172% 0.247% 0.290% 0.321% 0.346% 0.367% 0.413%
A 0.026% 0.131% 0.306% 0.482% 0.679% 0.892% 1.105% 1.337% 1.550% 1.711%
Baa 0.182% 0.516% 0.928% 1.412% 1.893% 2.362% 2.815% 3.237% 3.647% 4.139%
Ba 1.145% 3.169% 5.690% 8.293% 10.484% 12.472% 14.222% 15.845% 17.320% 18.736%
B 4.330% 9.828% 15.268% 20.087% 24.469% 28.667% 32.665% 36.002% 38.925% 41.451%
Caa-C 15.834% 25.752% 34.005% 40.545% 45.890% 49.619% 52.430% 55.663% 60.016% 65.563%
Investment Grade 0.072% 0.229% 0.436% 0.673% 0.917% 1.154% 1.381% 1.599% 1.803% 2.008%
Speculative Grade 4.351% 8.917% 13.373% 17.316% 20.686% 23.696% 26.388% 28.687% 30.708% 32.516%
All Corporate 1.565% 3.192% 4.726% 6.037% 7.118% 8.037% 8.824% 9.482% 10.045% 10.544%

10 March 2009 Special Comment Moody’s Global Credit Policy - Sovereign Default and Recovery Rates, 1983-2008
Special Comment Moody’s Global Credit Policy
Sovereign Default and Recovery Rates, 1983-2008
Importantly, the historical default rates in Exhibit 8 show that Moody’s ratings clearly rank-order default risk at any given horizon for both sovereigns and corporates, as the probability of default rises with lower ratings. A comparison between sovereign and corporate default rates shows that sovereign default rates have been, on average, modestly lower than those for their corporate counterparts, except for Caa-C rated issuers at 1-2 year horizons and Baa-rated issuers at 2-year or longer horizons.
Recovery Rates of Defaulted Sovereign Issuers
Moody’s ratings are statements about the probability of default and the expected loss severity rate (i.e. one minus the expected recovery rate) in case of default. As such, expectations of potential losses in the event of default are an important discriminating factor when comparing similarly rated sovereigns, particularly in the lower end of the rating scale.
Exhibit 9 presents two types of estimates of recovery rates on defaulted sovereign bonds. The first method reports the average, issuer-weighted, trading price on a sovereign's bonds thirty days after its initial missed interest payment. In cases in which the initial default event was the distressed exchange itself, we report the average price shortly before the distressed exchange. Appendix II provides more detail on the sovereign bond prices used to estimate the recovery rates.
Exhibit 9 – Recovery Rates on Defaulted Sovereign Bond Issuers
Year of Default Defaulting Country Average Trading Price**
(% of par) PV*** Ratio of Cash Flows
(ratio in %)
1998 Russia 18 50
1999 Pakistan 52 65
1999 Ecuador 44 60
2000 Ukraine 69 60
2000 Ivory Coast* 18 NA
2001 Argentina 27 30
2002 Moldova 60 95
2003 Uruguay 66 85
2004 Grenada* 65 NA
2005 Dominican Republic 95 95
2006 Belize 76 NA
2008 Seychelles* 29 NA
2008 Ecuador 26 NA
Issuer-Weighted Recovery Rates 50 68
Value-Weighted Recovery Rates 31 38
*Not rated by Moody’s at the time of default. ** 30-day post-default price or pre-distressed exchange trading price. *** Ratio of the present value of cash flows received as a result of the distressed exchange versus those initially promised, discounted using yield to maturity immediately prior to default (Source: Bank of England (2005)).
The second method is based on the ratio of the value of the old securities to the value of the new securities received in exchange, obtained by discounting the promised cash flows using the yield to maturity implicit in the old securities at the time of the announcement of the exchange offer.12 Additionally, we present the average value-weighted recovery rates for the sovereign sample using both methods.
12 The method of estimated recovery rates is discussed in "Resolving Sovereign Debt Crises: The Market-based Approach and the Role of the IMF," Financial
Stability Review, Bank of England, June 2005. Other methods are also discussed in Stuzenneger, F. and J. Zettelmeyer (2005), "Haircuts: Estimating Investor Losses in Sovereign Debt Restructurings, 1998-2005", IMF Working Paper (WP/05/137).
11 March 2009 Special Comment Moody’s Global Credit Policy - Sovereign Default and Recovery Rates, 1983-2008
Special Comment Moody’s Global Credit Policy
Sovereign Default and Recovery Rates, 1983-2008
The sample presents recovery estimates for all rated bond defaulters, except Venezuela as market quotes on its defaulted domestic currency bonds are not available. The sample also includes estimated recovery rates on three defaulting issuers, Grenada, Ivory Coast, and the Seychelles whose bonds were not rated by Moody's.
The two highest recovery rates in our sample follow the Dominican Republic and Belize defaults in 2005 and 2006, respectively, when corporate recovery rates were generally high and corporate default rates were low.13 The recovery rates on the 2008 defaults of the Seychelles and Ecuador are low, at 29% and 26% respectively, and below the average historical sovereign recovery rate of 50% during the 1983-2008 period. The 2008 sovereign recovery rates are similar to the 33.9% average corporate recovery rates observed in 2008 and reflect the challenging economic environment in 2008 and the negative correlation between rising corporate default rates and the observed drop in recovery rates.
The value-weighted recovery rate estimate is significantly lower than the issuer-weighted recovery rate due to the large Argentinean and Russian defaults that garnered low recovery rates.
While there are some cases where the differences between the two recovery-rate methods (30-day post default price and the PV of cash flows) are significant, the two approaches to estimating recovery values generally produce similar estimates. The material differences in the estimates of recovery rates, wherever present, are mainly caused by the timing of the recovery estimate. For example, in Russia's case, Moody's recorded the default when the payment was missed, whereas the distressed exchange was announced more than a year later, when the yield on the existing bonds was used to estimate net present value reduction. With the announcement of an exchange offer, some uncertainty is resolved and the yield on existing instruments may change, which will affect the present value of the new instruments. Another difference arises because the present value method makes the implicit assumption that the yield curve facing the sovereign is flat (it will have a constant discount rate); whereas, the trading price at default may reflect different expectations.
Rating Performance Measures
One of the desirable properties of an effective rating system is its ability to separate low risk from high credit risk issuers. A key metric used by Moody’s to measure the relative accuracy of a rating system is the cumulative accuracy profile (CAP). The CAP curve is constructed by plotting, for each rating category, the proportion of defaults accounted for by issuers with the same or lower rating against the proportion of all issuers with the same of lower rating.
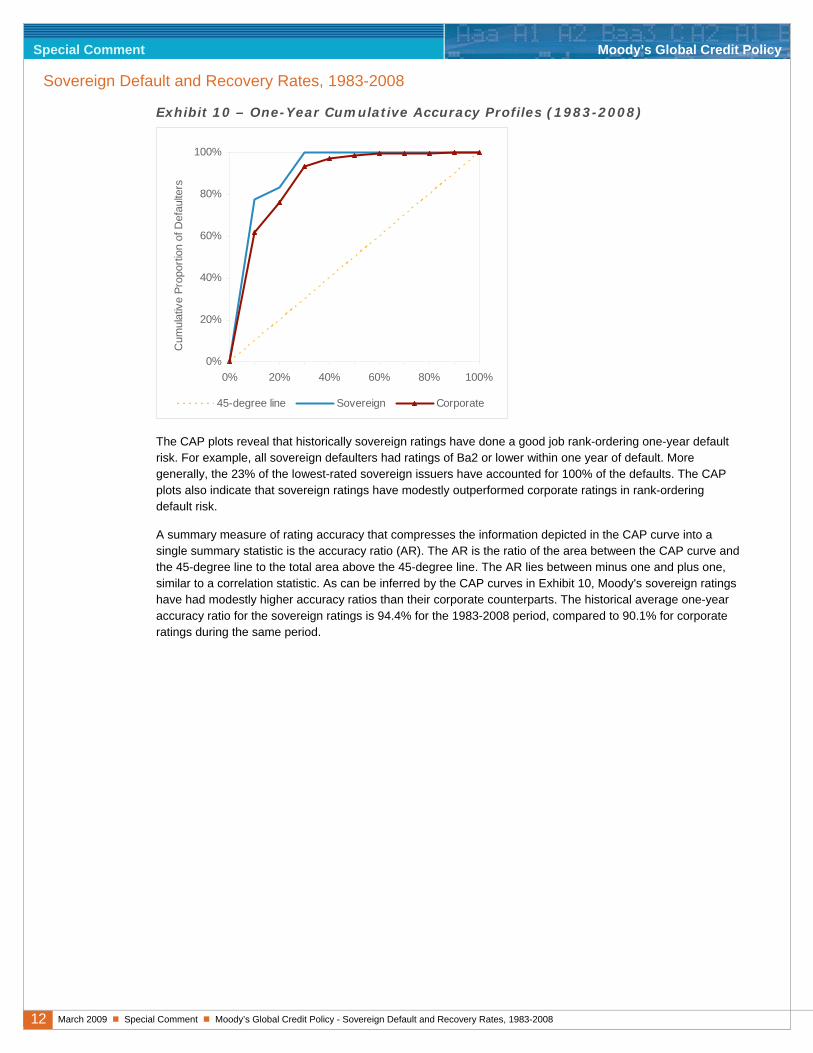
Exhibit 10 presents the one-year-ahead horizon CAP curves for sovereign and corporate ratings observed between 1983 and 2008. The CAP curve is useful for making visual assessment of the information content embedded in the relative ranking of credit risk provided by a set of ratings. A rating system that conveyed no information about default risk would lie on the 45-degree line. The further the CAP curve bows toward the top left corner, the greater the fraction of all defaults that can be accounted for by the lowest rating categories.
13 Please see Moody's Special Comment, "Corporate Default and Recovery Study, 1920-2008”, February 2009 for a summary of corporate recovery rates.
12 March 2009 Special Comment Moody’s Global Credit Policy - Sovereign Default and Recovery Rates, 1983-2008
Special Comment Moody’s Global Credit Policy
Sovereign Default and Recovery Rates, 1983-2008
Exhibit 10 – One-Year Cumulative Accuracy Profiles (1983-2008)
0%
20%
40%
60%
80%
100%
0% 20% 40% 60% 80% 100%
Cumulative Proportion of Issuers
Cum
ulat
ive
Prop
ortio
n of
Def
aulte
rs
45-degree line Sovereign Corporate
The CAP plots reveal that historically sovereign ratings have done a good job rank-ordering one-year default risk. For example, all sovereign defaulters had ratings of Ba2 or lower within one year of default. More generally, the 23% of the lowest-rated sovereign issuers have accounted for 100% of the defaults. The CAP plots also indicate that sovereign ratings have modestly outperformed corporate ratings in rank-ordering default risk.
A summary measure of rating accuracy that compresses the information depicted in the CAP curve into a single summary statistic is the accuracy ratio (AR). The AR is the ratio of the area between the CAP curve and the 45-degree line to the total area above the 45-degree line. The AR lies between minus one and plus one, similar to a correlation statistic. As can be inferred by the CAP curves in Exhibit 10, Moody's sovereign ratings have had modestly higher accuracy ratios than their corporate counterparts. The historical average one-year accuracy ratio for the sovereign ratings is 94.4% for the 1983-2008 period, compared to 90.1% for corporate ratings during the same period.
13 March 2009 Special Comment Moody’s Global Credit Policy - Sovereign Default and Recovery Rates, 1983-2008
Special Comment Moody’s Global Credit Policy
Sovereign Default and Recovery Rates, 1983-2008
Moody’s Related Research
Corporate Default and Recovery Rates, 1920-2008, February 2009 (114385)
Emerging Market Corporate and Sub-Sovereign Defaults and Sovereign Crises: Perspectives on Country Risk, February 2009 (113931)
Migration of Debt Structures and Revolver Usage as Firms Approach Default, December 2008 (112490)
Strong Loan Issuance in Recent Years Signals Low Recovery Prospects for Loans and Bonds of Defaulted U.S. Corporate Issuers, June 2008 (109457)
Sovereign Defaults and Interference: Perspectives on Government Risks, August 2008 (110114)
Rating Migration and Default Rates of Non-U.S. Sub-Sovereign Debt Issuers, 1983-2007, September 2008 (110252)
Default and Recovery Rates of Canadian Corporate Issuers, 1989-2007, June 2008 (109575)
European Corporate Default and Recovery Rates, 1985-2007, March 2008 (108072)
Latin American Corporate Default and Recovery Rates, 1990-H1 200, November 2007 (105750)
Default and Recovery Rates of Asia-Pacific Corporate Bond and Loan Issuers, Excluding Japan, 1990-1H2007, September 2007 (104737)
Measuring Corporate Default Rates, November 2006 (100779)
Determinants of Recovery Rates on Defaulted Bonds and Loans for North American Corporate Issuers: 1983-2003, December 2004 (90593)
Guide to Moody's Default Research: October 2008 Update, November 2008 (112205)
To access any of these reports, click on the entry above. Note that these references are current as of the date of publication of this report and that more recent reports may be available. All research may not be available to all clients.
14 March 2009 Special Comment Moody’s Global Credit Policy - Sovereign Default and Recovery Rates, 1983-2008
Special Comment Moody’s Global Credit Policy
Sovereign Default and Recovery Rates, 1983-2008
Appendix I – Circumstances Surrounding Individual Sovereign Bond Defaults
ARGENTINA 2001
Argentina defaulted in 2002 by missing an interest payment on 3 January 2002. While the actual default occurred in 2002, Moody's had already downgraded the long-term foreign currency sovereign credit rating to Ca on 20 December 2001, reflecting a very high probability of default.
Three factors led to the default. In 1989, then President Menem agreed to peg the Argentine peso to the dollar on a parity basis by establishing a currency board. However, when Brazil devalued its real in 1999, foreign investors and buyers found their dollars could buy more in Brazil than in Argentina. As a result, Argentina's foreign investment and exports dried up — buyers of Argentine products could get more for the same price in other countries, particularly in neighboring Brazil.
Secondly, the Menem government accrued a significant amount of debt, both domestic and foreign, sending domestic interest rates up. This led to the squeezing of private investment out of the market, forcing many companies to close and pushing up unemployment. Many of the privatized companies were utilities, which raised prices for such basic services as electricity and phones. Argentina's recession grew steadily worse.
Thirdly, the IMF declined to bail Argentina out by making an advance payment on a previously agreed loan.
These three factors converged to the point that, in December 2001 and early January 2002, there was a rush on the banks to convert pesos into dollars at the one-to-one rate. Argentina, subsequently, defaulted on its foreign debt.
After prolonged negotiations with its lenders and multilateral institutions to restructure the debt, Argentina completed several exchange offers covering various series of defaulted bonds. By some estimates, the ultimate haircut taken by investors was as high as 65 percent.
BELIZE 2006
A period of modest economic growth in the late 1990s prompted the government to stimulate economic activity through aggressive policies largely financed by foreign borrowing. As a result, the fiscal balance quickly swelled to a deficit in excess of 10 percent of GDP. In 2005, the government embarked on a series of stabilization policies by rising taxes, cutting expenditure and tightening monetary conditions. During the 2005 fiscal year, the deficit was reduced to 3 percent of GDP. The debt restructuring is part of the efforts aimed at placing Belize on a more sustainable economic path.
The government announced in August 2006 its intention to reach an agreement with external commercial creditors and, in mid-December, a debt exchange was launched to which over 98 percent of bondholders had subscribed by its conclusion in February 2007. The exchange did not decrease the overall amount owed by Belize, although its servicing has been made easier by a lengthening in the maturity and a lower coupon. Specifically, the new dollar-denominated bonds will mature in 2029 and they will not start amortizing before 2019 - providing a 12-year grace period to the government. The new debt carries a lower coupon of 4.25 percent for the first three years that gradually increases up to 8.5 percent.
DOMINICAN REPUBLIC 2005
The Dominican Republic missed a bond payment in January 2004, but cured that default within the 30-day grace period. After a number of additional late interest payments over the following year, in April 2005, the country proposed a debt exchange to investors which would extend the existing maturities on its two outstanding foreign currency bond issues and defer their cash interest payments for two years. In May 2005, roughly 95 percent of the investors in the bond coming due in 2006 and one coming due in 2013 had agreed to extend the maturity dates by an additional five years at the original coupon rate and accept payment-in-kind (additional bonds) in lieu of all the interest due in 2005 and half of the interest due in 2006.
15 March 2009 Special Comment Moody’s Global Credit Policy - Sovereign Default and Recovery Rates, 1983-2008
Special Comment Moody’s Global Credit Policy
Sovereign Default and Recovery Rates, 1983-2008
Moody's views the exchange as "distressed" and hence tantamount to a default, both because the maturity extension and the interest deferral were needed to avoid outright default and because the terms of the new securities (maintaining the original coupon rate) were insufficiently attractive to induce new investor participation. The date of the actual default for the purpose of this study is set at April 2005.
The issuer's foreign-currency bond rating was B3 before the exchange and remained at B3 following the exchange because the realized loss severity of the exchange was modest, yet the potential for further losses going forward remains material.
ECUADOR 1999
Ecuador's rating was lowered to Caa1 in September 1999, indicating imminent default. On 1 October 1999, Ecuador officially suspended payment on almost half of the interest due on its Brady bonds. The rating was lowered two notches to Caa3 later that month to indicate further deterioration of credit quality and deepening fiscal crisis. The US and the IMF publicly backed Ecuador's efforts to restructure its US$13 billion in foreign debt. About half of this debt was in the form of Brady Bonds. With the support of the US, Ecuador renegotiated its US$1 billion of debt outstanding with the Paris Club of creditor nations and was able to restructure over 98 percent of the bonds into new bonds. Ecuador also defaulted on its domestic debt by unilaterally changing the interest rates on domestic bonds after it had defaulted on its foreign currency bonds.
ECUADOR 2008
In November 2008, Ecuador announced that it will not honor the payments due on its 2012 and 2030 global bonds, after the findings of an audit declared these debts “illegal” and “illegitimate”. The government’s decision to default was based on ideological and political grounds and was not related to liquidity and solvency issues – the default thus represents a problem of “willingness to pay” rather than “capacity to pay”. The default occurred in a situation of relative macroeconomic strength, despite the recent downturn in commodity prices. The country's debt-to-GDP ratio stands at around 23%, well below the 85% level during its previous default in 1999. Measured against central government revenues, Ecuador's debt burden is at 100%, compared to over 500% in 1999.
In November 2008, Ecuador missed an interest payment of $30.6 million on its $510 million of 12% global bonds due in 2012; then in February 2009, it missed an interest payment of $135 million on its $2.7 billion of 10% global bonds due in 2030. It continued to pay on its 2015 global bonds. The government has announced that it would seek a restructuring of about $4 billion in bonds, which is expected to include a severe haircut. The fall in oil prices is further aggravating the economic downturn as oil is Ecuador’s main export and finances 40% of its federal budget.
GRENADA 2004
Moody's does not rate Grenada.
Grenada incurred arrears on most of its commercial debt after the authorities declared public debt to be unsustainable after Hurricane Ivan struck in September 2004. Damage from the hurricane exceeded 200 percent of GDP. In October 2004, the authorities announced that the public debt was unsustainable and they intent to seek a cooperative solution with creditors and donors. In late December, interest payments on two large international bonds were missed.
Almost a year after Ivan, Grenada launched an exchange offer for its commercial debt. The offer covered about half of the country’s total public sector debt, and sought to restructure approximately US$190 million of external debt – including one global bond of US$100 million – as well as US$86 million of domestic debt. (The authorities reached a separate settlement on US$17 million claims by domestic banks in October, ahead of the closing of the general offer.)
On 15 November 2005, Grenada successfully completed a distressed debt exchange and debt rescheduling affecting about US$276 million of local and foreign currency bonds and bank loans. The debt exchange did not involve any write down of principal, and past-due interest was fully capitalized. The new bonds have a 20-year maturity and interest rates of one percent for the first three years, which gradually increases thereafter. The
16 March 2009 Special Comment Moody’s Global Credit Policy - Sovereign Default and Recovery Rates, 1983-2008
Special Comment Moody’s Global Credit Policy
Sovereign Default and Recovery Rates, 1983-2008
lower interest rates in the near to medium term imply that creditors accepted a haircut in NPV terms of 40-45 percent for exit yields in the 9-10 percent range.
IVORY COAST 2000
Ivory Coast defaulted on its Brady Bonds obligation in March 2000. Moody's does not rate Ivory Coast.
General Guei, after proclaiming himself the new leader, suspended payment of the country's external debt (estimated in 1997 at US$15.6 billion). When the IMF stressed the severity of the consequences of this unilateral moratorium, he resumed payments on 8 January 1998. His administration nevertheless had to go into technical default on CI Brady Bonds in April 2000 and into arrears, yet again, on debt in September 2000.
Ivory Coast was successful at obtaining restructuring of its Paris Club debts. The restructuring means that debt servicing requirements have been reduced to around 23 percent of exports, compared to 28 percent before the default. With the restructuring, the short-term debt component has been reduced, but it is still at well over 100 percent as a proportion of foreign exchange reserves.
MOLDOVA 2002
In 1990, the Moldovan parliament voted to issue a declaration of sovereignty and secession from the USSR, establishing the supremacy of the Moldovan constitution and legislation throughout the country.
In 1998, Moldova was especially affected by the Russian economic crisis as exports in hard currency and in rubles almost dried up. The country faced a significant shortfall in its foreign reserves, which made servicing of foreign currency-denominated debt extremely difficult. However, it avoided default until June 2001 when it missed a payment on a foreign currency bond. It subsequently cured the default in July within the grace period.
Moldova started buying back its bonds some time after July 2001 and was successful in repurchasing approximately 50 percent of the outstanding amount. However, on 13 June 2002, it defaulted on the same bond, which matured that day. It was not able to cure the default within the grace period, which expired on 27 June 2002.
The country successfully negotiated with its bondholders to restructure and roll over the matured bond into a new debt instrument with a maturity date of 2009 and face value of US$39.6 million. The annual coupon was 6.8 percent with the first payment due by the end of 2002. For the purposes of this study, the cured grace period default is not considered as an actual default event and only the final 2002 default counts.
PAKISTAN 1999
A serious balance of payments crisis in 1998 was exacerbated as international sanctions were tightened following a military coup. Pakistan sought a new IMF agreement and then a restructuring of its bilateral debt obligations with the Paris Club of lenders but, even in the midst of these negotiations, the government was intermittently late in making payments on commercial, bilateral and some multilateral debt. In this situation, the possibility increased that payments would eventually be missed on the country's Eurobonds and euro notes.
In an attempt to "bail in" private lenders, Pakistan's official bilateral creditors imposed unprecedented conditions on the country before they would grant a Paris Club restructuring. Namely, they required that Pakistan obtain a multi-year debt refinancing from private creditors, including bondholders. Upon agreeing to these conditions, the Paris Club rescheduled in March 1999 some US$3.25 billion of Pakistan's bilateral obligations (including arrears) over 18 years with three years' grace. In December 1999, bondholders received a new Eurobond, with a coupon of 10 percent and maturity of six years with three years' grace, in exchange for US$608 million in existing bonds and notes carrying coupons of 6 percent, 11.5 percent, and LIBOR plus 3.95 percent with original maturity dates between December 1999 and February 2002.
The 1999 Paris Club agreement was not fully implemented because Pakistan failed to comply with the terms of its concurrent IMF agreement. However, subsequent IMF programs - a stand-by agreement and the current Poverty Reduction and Growth Facility - have achieved better results. A new Paris Club agreement was reached in January 2001 that restructured US$1.75 billion in debt and payment arrears on extremely favorable ("Houston") terms.
17 March 2009 Special Comment Moody’s Global Credit Policy - Sovereign Default and Recovery Rates, 1983-2008
Special Comment Moody’s Global Credit Policy
Sovereign Default and Recovery Rates, 1983-2008
PERU 2000
On 7 September 2000, Peru decided not to pay US$80 million in interest payments on four of its Brady Bonds. Peru had been trying to renegotiate its commercial loans with Elliott and Associates ("Elliott"), a fund specializing in sovereign and distressed debt. Peru had offered to restructure the commercial debt into Brady Bonds, which the lender had refused. Additionally, Elliott filed a lawsuit against the government of President Alberto Fujimori and a US judge granted an injunction authorizing Elliott to attach any financial assets owned by the Peruvian government in the United States. The government of Peru was concerned that Elliott would attach the US$80 million debt service payment.
After tense negotiations that lasted four weeks and failure to find a safe depository for the US$80 million, Peru settled the dispute with Elliott through a multimillion-dollar payment. This settlement allowed the Peruvian government to make the interest payments through its fiscal agent in the United States. The payment was made on 4 October 2000 and the default thus fully cured within its grace period. Peru's grace-period default is reported in this appendix for the sake of completeness, but it is excluded from all formal calculations found in this study.
RUSSIA 1998
A significant drop in oil prices in late 1997 and early 1998 led to a serious shortfall in exports. This decline significantly reduced federal budget revenues even in nominal terms in the spring of 1998, while the stock of short-term Russian T-bills (GKOs) grew rapidly. Faced with the high cost of domestic debt service (almost 5 percent of GDP in 1996), the government sped up liberalization of the T-bill market. Restrictions on non-residents' participation were gradually reduced and then eliminated at the beginning of 1998. The Russian market benefited from the inflow in 1997, with the interest rate on short-term debt (GKOs) reaching its historic floor of 13 percent in August 1997, a time when consumer price inflation was at an annual 15 percent.
With East Asian economies in crisis, non-resident investors decided to pull out money from the Russian T-Bill market as evidenced by a reduction of almost US$1 billion in foreign exchange reserves per week. The uncertainty over the July 1998 emergency loan from the IMF also resulted in large swings in foreign flows to the T-bill market. The IMF loan was intended to boost confidence among foreigners and, for a while, it had the intended effect. However, Russia stopped payments first on local currency Treasury obligations and later defaulted on its foreign currency obligations that were issued locally but held mostly by foreign investors. Subsequently, it also failed to pay principal on MINFIN III foreign currency bonds.
Debts were restructured in August 1999 and February 2000.
SEYCHELLES 2008
Moody’s does not rate the Seychelles.
In July 2008, the Seychelles failed to pay the principal due on a privately placed Euro 54.75 million amortizing note due 2011. Then in October 2008, it missed an interest payment on its $230 million global bond due 2011.
The Seychelles’ default occurred in the context of a difficult economic environment, severe fiscal and balance-of-payments constraints, an unsustainable debt burden, and a depleted international reserves position. Several previous years of moribund economic growth, expansionary fiscal policy, and increased indebtedness, combined with fall in tourism, on which the country is heavily dependent, and exacerbated the situation in 2008.
The country had embarked on a reform process in 2004, which although having positive results, had put significant pressure on the country’s fiscal and external balances. Due to the accrual of arrears with multilateral creditors, commercial borrowing was pursued instead. The expansionary fiscal policy combined with a restrictive currency regime, low foreign exchange reserves, and rapid import growth. The liquidity pressures culminated in a balance-of-payments crisis in November 2008, when the currency was floated and depreciated by 50%. The rise in interest rate up to 30% has helped stabilize the currency.
18 March 2009 Special Comment Moody’s Global Credit Policy - Sovereign Default and Recovery Rates, 1983-2008
Special Comment Moody’s Global Credit Policy
Sovereign Default and Recovery Rates, 1983-2008
At almost 175% of GDP, the Seychelles’ debt burden is among the highest in the world. The government has announced that it is seeking a restructuring of its external debt stock of approximately US$800 million and has embarked on its first-ever IMF-supported economic and financial program. A two-year Stand-by arrangement was approved by the IMF in November 2008, for about US$ 24 million. Debt restructuring discussions with Paris Club creditors are under way.
UKRAINE 1998, 2000
In 1998, the Government of Ukraine issued a decree whereby all anonymous "non-person" saving accounts in foreign currency were “frozen”. The only recourse for account holders was to identify themselves and "transfer" the accounts to local-currency accounts.
Since independence, Ukraine has remained dependent upon imported energy and foreign loans. Approximately, US$3 billion of these foreign loans came due in 2000. The IMF's US$ 2.6 billion extended fund facility (EFF) was suspended in September 1999, and the World Bank postponed all its lending to Ukraine in October 1999.
On 28 February 2000, Ukraine's Finance Ministry confirmed that it had missed the scheduled coupon repayment for its 16 percent DM-nominated Eurobonds, which were to mature in 2001. With over US$13 billion in foreign debt, Ukraine had already announced in January 2000 that it would miss the scheduled repayment for dollar-nominated 16.75 percent bonds and offered to include them in an exchange proposal. Bondholders were offered seven-year coupon amortization bonds which would be issued by Ukraine and nominated in the euro or U.S. dollar. In euro, the bond coupon amounted to 10 percent, while in U.S. dollars the coupon represented 11 percent with no grace period.
The bulk of the debt was amortized in the new euro bonds every six months, with the first six months as a grace period. The average term of the bonds was 4.5 years. While exchanging, investors were able to choose the currency in which the bonds would be denominated.
By the end of March 2000, over 90 percent of holders of Ukrainian government bonds had agreed to the restructuring and accepted new bonds with a face value of approximately 50 percent of the debt they replaced.
URUGUAY 2003
Prior to May 2002, Uruguay had been rated investment grade (Baa3) since the middle of 1997. However, Argentina's severe currency crisis led to concurrent debt servicing problems for Uruguay in 2002. Uruguay's total debt had escalated to about 100 percent of GDP, or roughly US$11 billion, with a significant amount of bonds coming due in 2003 and 2004. To help restore debt sustainability, the authorities launched in April 2003 a debt exchange aiming at lengthening the average maturity on the bonds with no principal reduction. The exchange was completed fairly soon after (at the end of May) and participation rates averaged about 93 percent.
The debt restructuring involved three components: an international component, covering mainly bonds issued in Europe and the US (amounting to some US$3.6 billion), a Japanese component (covering Samurai bonds worth about US$250 million) and a domestic component (covering domestic currency bonds worth about US$1.6 billion).
As a result of the maturity extension but no principal reduction, Moody's classified the offer as a distressed exchange / default. The foreign-currency issuer rating for Uruguay was B3 when the offer was first proposed and was maintained after the exchange was complete.
VENEZUELA 1998
In the first week of July 1998, the government of Venezuela did not pay the coupon on local currency bonds that were held by local residents. The payments were made a week later. Since these bonds had no grace period, this delay in payment amounted to a technical default.
The government claimed that the person who was supposed to sign the checks was unavailable at the time but that the checks were later issued from the appropriate office. It was the type of episode that seems to have
19 March 2009 Special Comment Moody’s Global Credit Policy - Sovereign Default and Recovery Rates, 1983-2008
Special Comment Moody’s Global Credit Policy
Sovereign Default and Recovery Rates, 1983-2008
happened more than once in Venezuela, where the government did not pay the coupon on local currency bonds on time. However, the government has always claimed that there was no "intentional" delay.
After this default, Venezuela installed state-of-the-art payment machinery that reduced or eliminated the need for human intervention in the payment processes.
Moody's subsequently changed the issuer ratings to Caa1 from B2 due to the fact that the government, although fully capable of paying domestic coupons and principal, had shown unwillingness to pay its domestic obligations from time to time.
20 March 2009 Special Comment Moody’s Global Credit Policy - Sovereign Default and Recovery Rates, 1983-2008
Special Comment Moody’s Global Credit Policy
Sovereign Default and Recovery Rates, 1983-2008
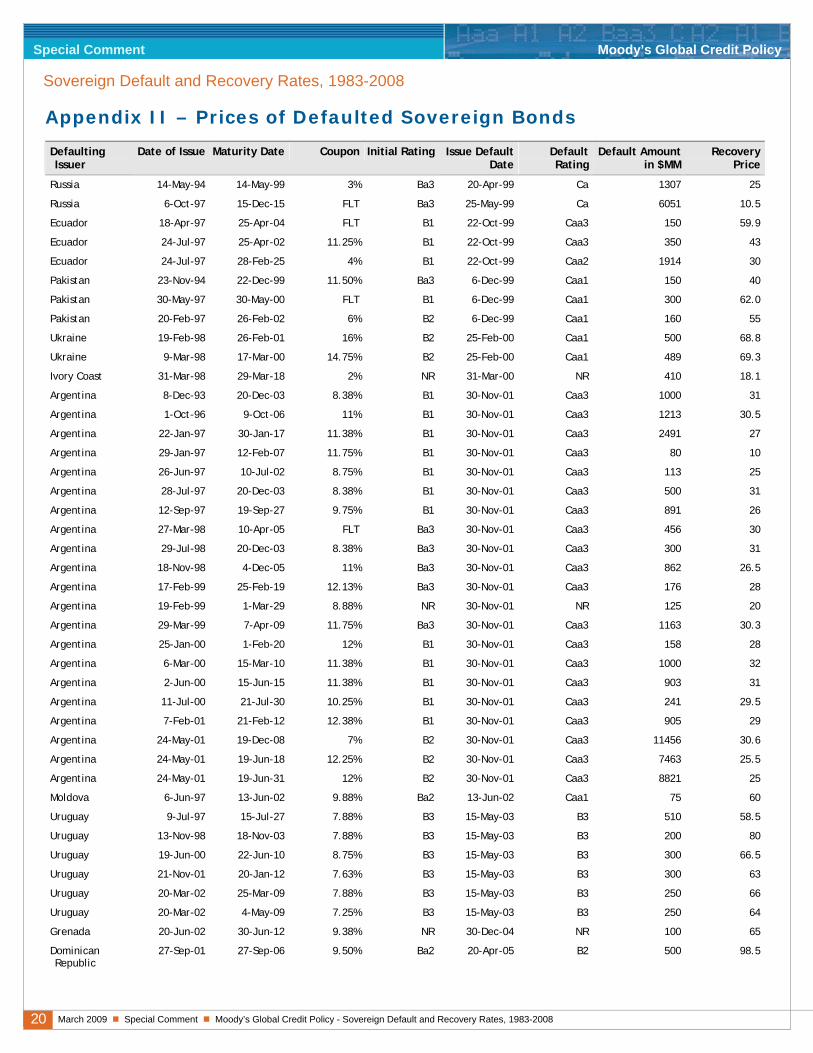
Appendix II – Prices of Defaulted Sovereign Bonds
Defaulting Issuer
Date of Issue Maturity Date Coupon Initial Rating Issue Default Date
Default Rating
Default Amount in $MM
Recovery Price
Russia 14-May-94 14-May-99 3% Ba3 20-Apr-99 Ca 1307 25
Russia 6-Oct-97 15-Dec-15 FLT Ba3 25-May-99 Ca 6051 10.5
Ecuador 18-Apr-97 25-Apr-04 FLT B1 22-Oct-99 Caa3 150 59.9
Ecuador 24-Jul-97 25-Apr-02 11.25% B1 22-Oct-99 Caa3 350 43
Ecuador 24-Jul-97 28-Feb-25 4% B1 22-Oct-99 Caa2 1914 30
Pakistan 23-Nov-94 22-Dec-99 11.50% Ba3 6-Dec-99 Caa1 150 40
Pakistan 30-May-97 30-May-00 FLT B1 6-Dec-99 Caa1 300 62.0
Pakistan 20-Feb-97 26-Feb-02 6% B2 6-Dec-99 Caa1 160 55
Ukraine 19-Feb-98 26-Feb-01 16% B2 25-Feb-00 Caa1 500 68.8
Ukraine 9-Mar-98 17-Mar-00 14.75% B2 25-Feb-00 Caa1 489 69.3
Ivory Coast 31-Mar-98 29-Mar-18 2% NR 31-Mar-00 NR 410 18.1
Argentina 8-Dec-93 20-Dec-03 8.38% B1 30-Nov-01 Caa3 1000 31
Argentina 1-Oct-96 9-Oct-06 11% B1 30-Nov-01 Caa3 1213 30.5
Argentina 22-Jan-97 30-Jan-17 11.38% B1 30-Nov-01 Caa3 2491 27
Argentina 29-Jan-97 12-Feb-07 11.75% B1 30-Nov-01 Caa3 80 10
Argentina 26-Jun-97 10-Jul-02 8.75% B1 30-Nov-01 Caa3 113 25
Argentina 28-Jul-97 20-Dec-03 8.38% B1 30-Nov-01 Caa3 500 31
Argentina 12-Sep-97 19-Sep-27 9.75% B1 30-Nov-01 Caa3 891 26
Argentina 27-Mar-98 10-Apr-05 FLT Ba3 30-Nov-01 Caa3 456 30
Argentina 29-Jul-98 20-Dec-03 8.38% Ba3 30-Nov-01 Caa3 300 31
Argentina 18-Nov-98 4-Dec-05 11% Ba3 30-Nov-01 Caa3 862 26.5
Argentina 17-Feb-99 25-Feb-19 12.13% Ba3 30-Nov-01 Caa3 176 28
Argentina 19-Feb-99 1-Mar-29 8.88% NR 30-Nov-01 NR 125 20
Argentina 29-Mar-99 7-Apr-09 11.75% Ba3 30-Nov-01 Caa3 1163 30.3
Argentina 25-Jan-00 1-Feb-20 12% B1 30-Nov-01 Caa3 158 28
Argentina 6-Mar-00 15-Mar-10 11.38% B1 30-Nov-01 Caa3 1000 32
Argentina 2-Jun-00 15-Jun-15 11.38% B1 30-Nov-01 Caa3 903 31
Argentina 11-Jul-00 21-Jul-30 10.25% B1 30-Nov-01 Caa3 241 29.5
Argentina 7-Feb-01 21-Feb-12 12.38% B1 30-Nov-01 Caa3 905 29
Argentina 24-May-01 19-Dec-08 7% B2 30-Nov-01 Caa3 11456 30.6
Argentina 24-May-01 19-Jun-18 12.25% B2 30-Nov-01 Caa3 7463 25.5
Argentina 24-May-01 19-Jun-31 12% B2 30-Nov-01 Caa3 8821 25
Moldova 6-Jun-97 13-Jun-02 9.88% Ba2 13-Jun-02 Caa1 75 60
Uruguay 9-Jul-97 15-Jul-27 7.88% B3 15-May-03 B3 510 58.5
Uruguay 13-Nov-98 18-Nov-03 7.88% B3 15-May-03 B3 200 80
Uruguay 19-Jun-00 22-Jun-10 8.75% B3 15-May-03 B3 300 66.5
Uruguay 21-Nov-01 20-Jan-12 7.63% B3 15-May-03 B3 300 63
Uruguay 20-Mar-02 25-Mar-09 7.88% B3 15-May-03 B3 250 66
Uruguay 20-Mar-02 4-May-09 7.25% B3 15-May-03 B3 250 64
Grenada 20-Jun-02 30-Jun-12 9.38% NR 30-Dec-04 NR 100 65
Dominican Republic
27-Sep-01 27-Sep-06 9.50% Ba2 20-Apr-05 B2 500 98.5
21 March 2009 Special Comment Moody’s Global Credit Policy - Sovereign Default and Recovery Rates, 1983-2008
Special Comment Moody’s Global Credit Policy
Sovereign Default and Recovery Rates, 1983-2008
Defaulting Issuer
Date of Issue Maturity Date Coupon Initial Rating Issue Default Date
Default Rating
Default Amount in $MM
Recovery Price
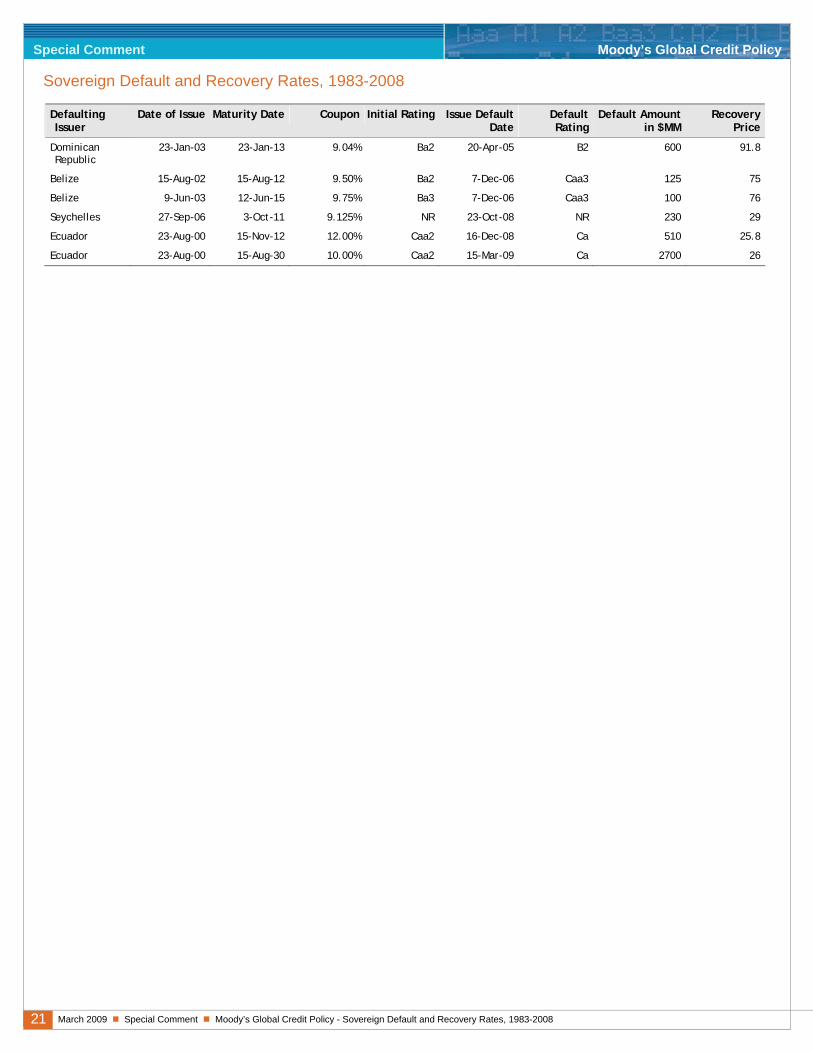
Dominican Republic
23-Jan-03 23-Jan-13 9.04% Ba2 20-Apr-05 B2 600 91.8
Belize 15-Aug-02 15-Aug-12 9.50% Ba2 7-Dec-06 Caa3 125 75
Belize 9-Jun-03 12-Jun-15 9.75% Ba3 7-Dec-06 Caa3 100 76
Seychelles 27-Sep-06 3-Oct-11 9.125% NR 23-Oct-08 NR 230 29
Ecuador 23-Aug-00 15-Nov-12 12.00% Caa2 16-Dec-08 Ca 510 25.8
Ecuador 23-Aug-00 15-Aug-30 10.00% Caa2 15-Mar-09 Ca 2700 26
22 March 2009 Special Comment Moody’s Global Credit Policy - Sovereign Default and Recovery Rates, 1983-2008
Special Comment Moody’s Global Credit Policy
Sovereign Default and Recovery Rates, 1983-2008
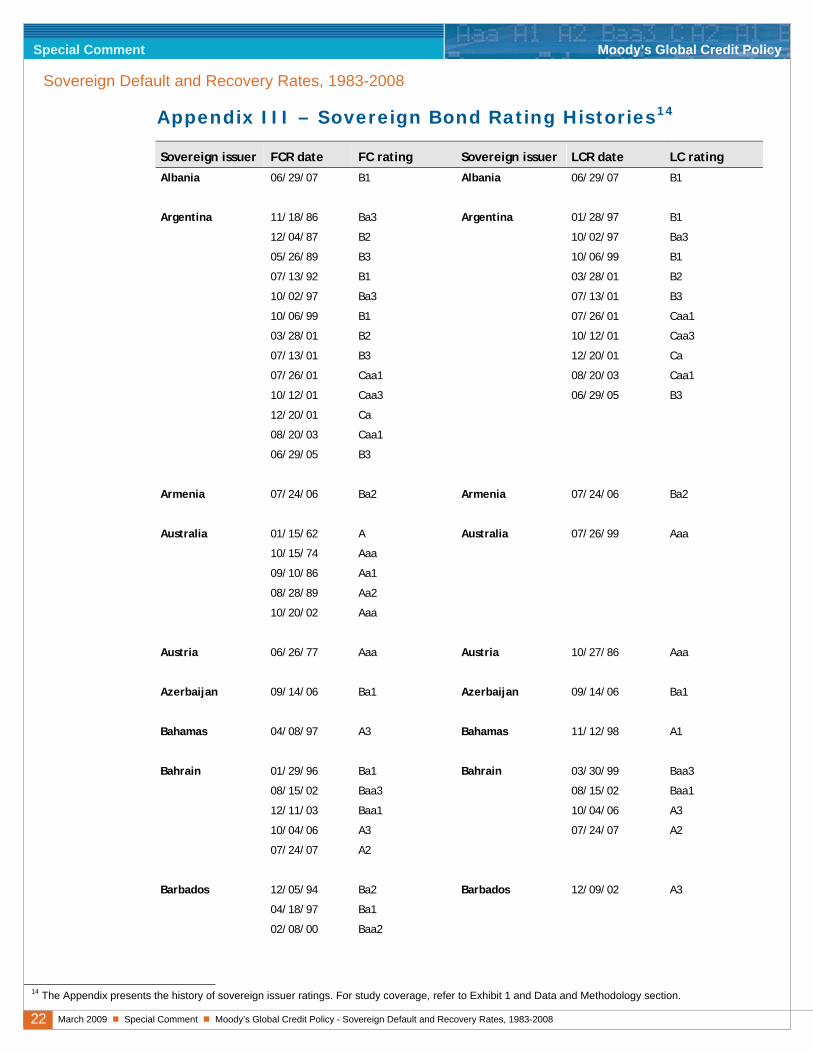
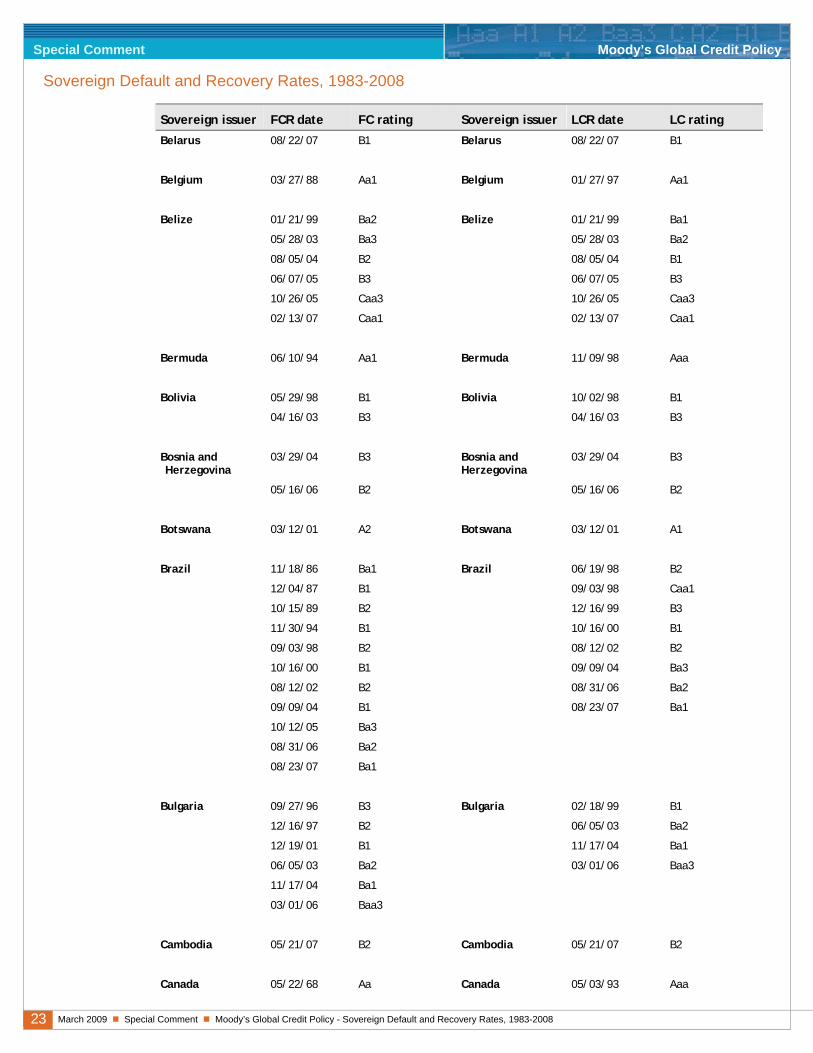
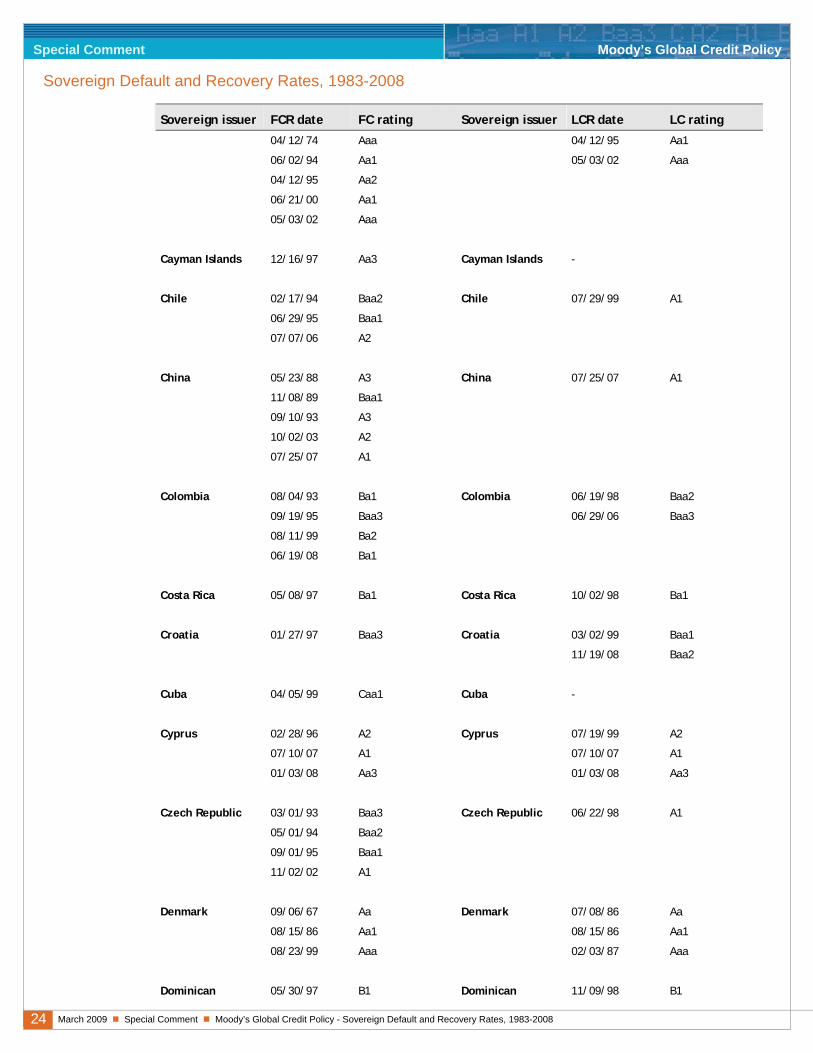
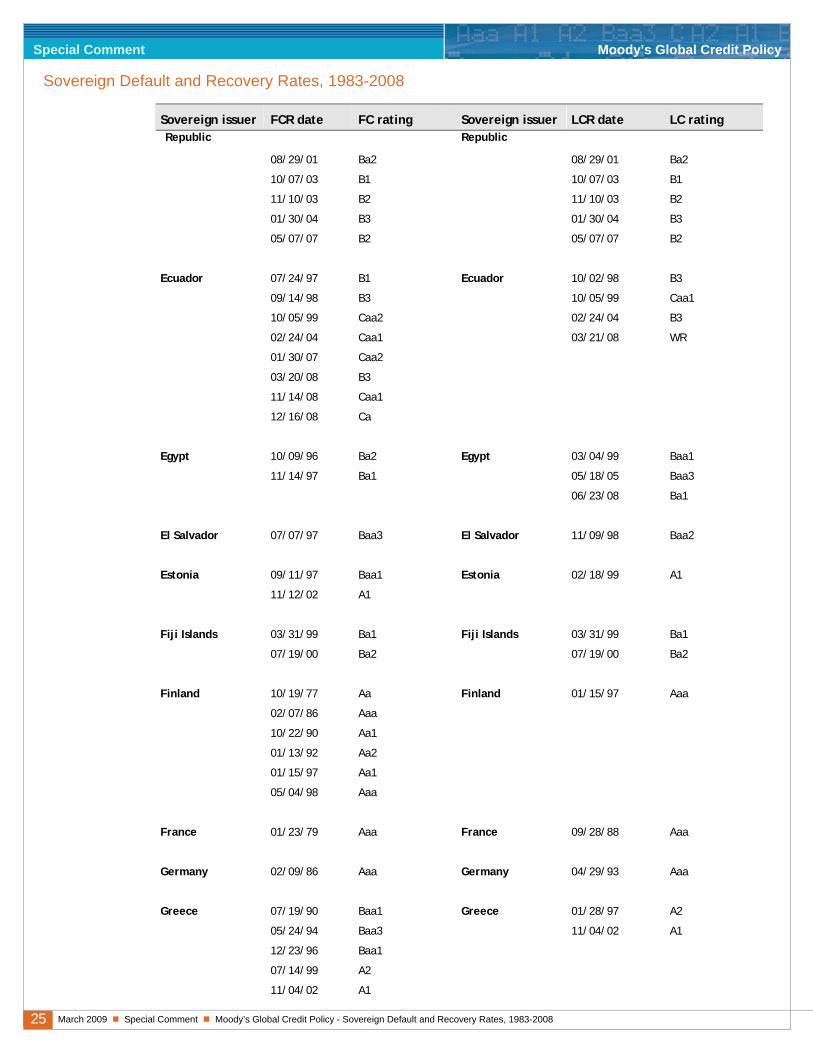
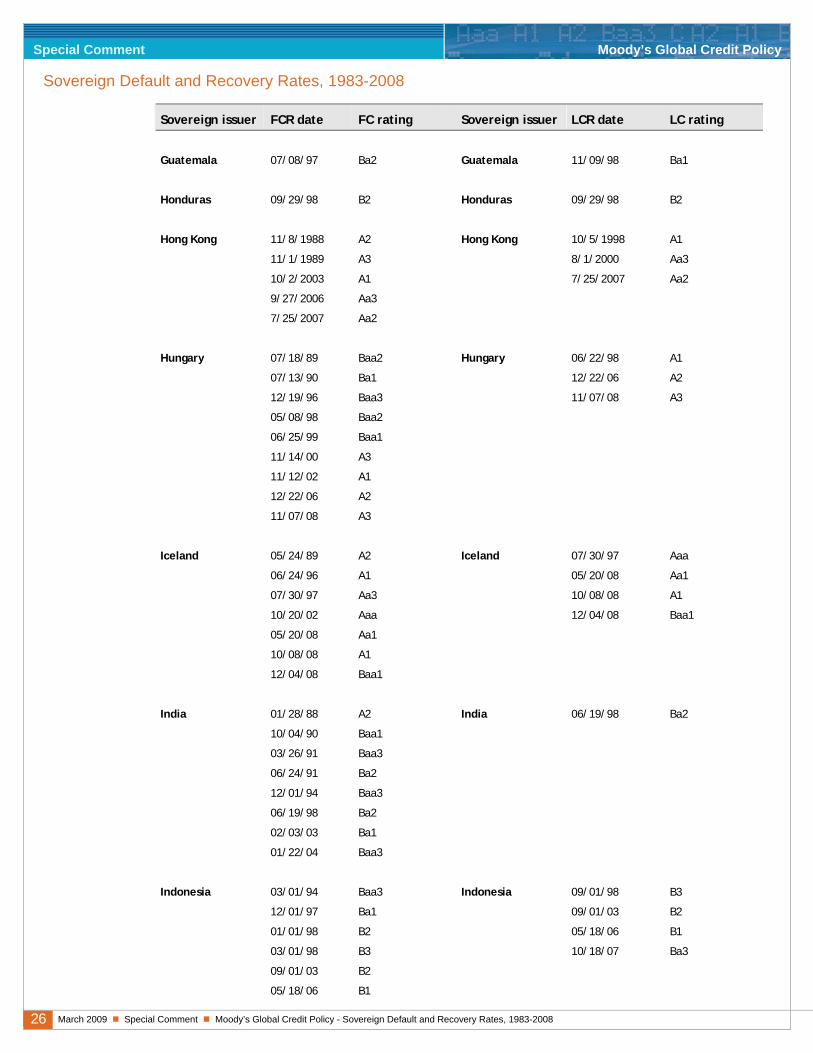
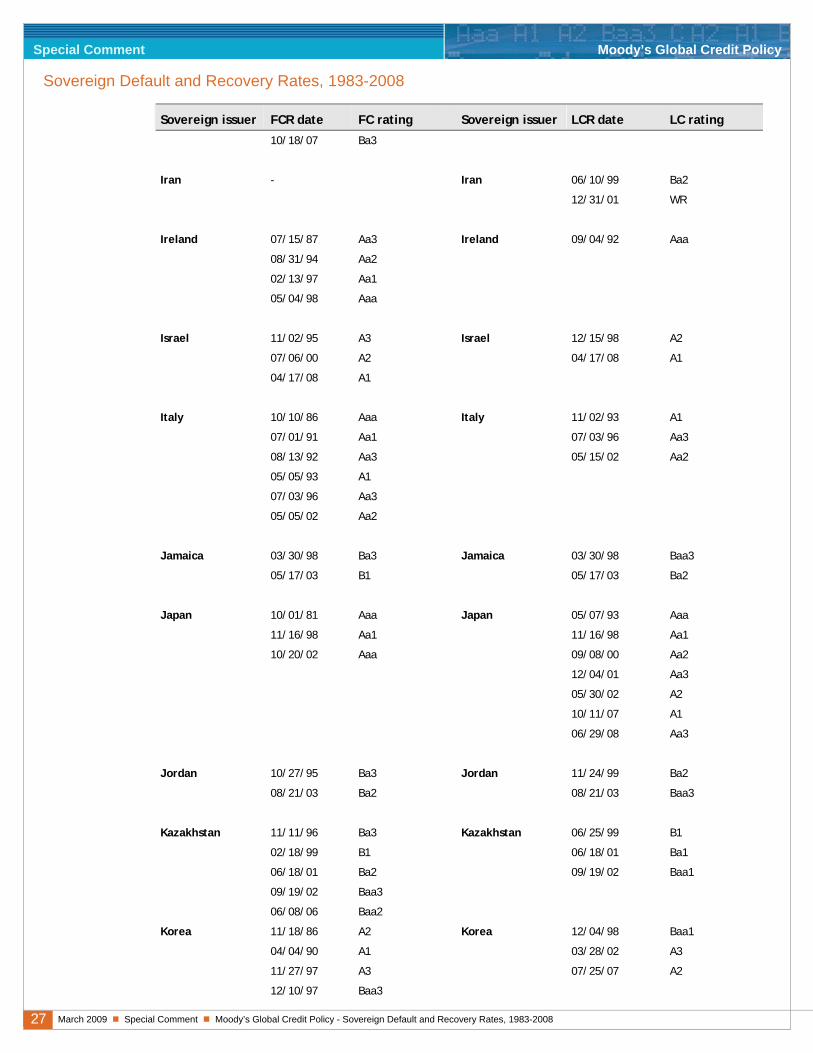
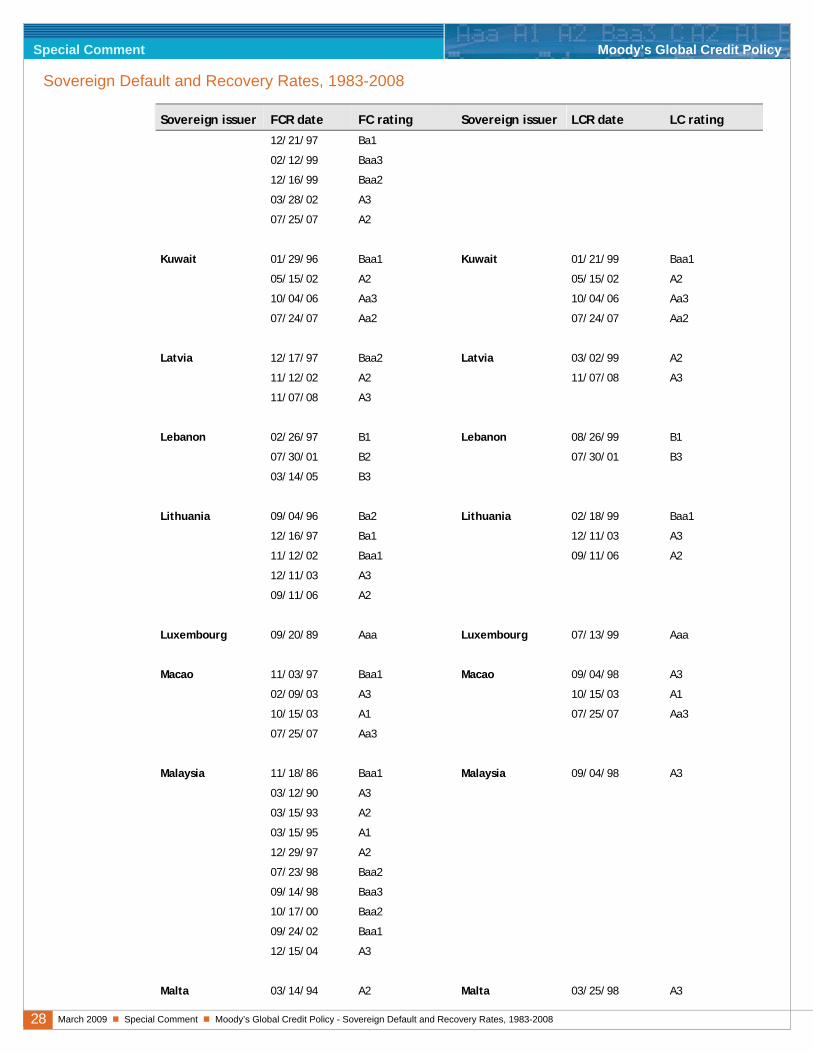
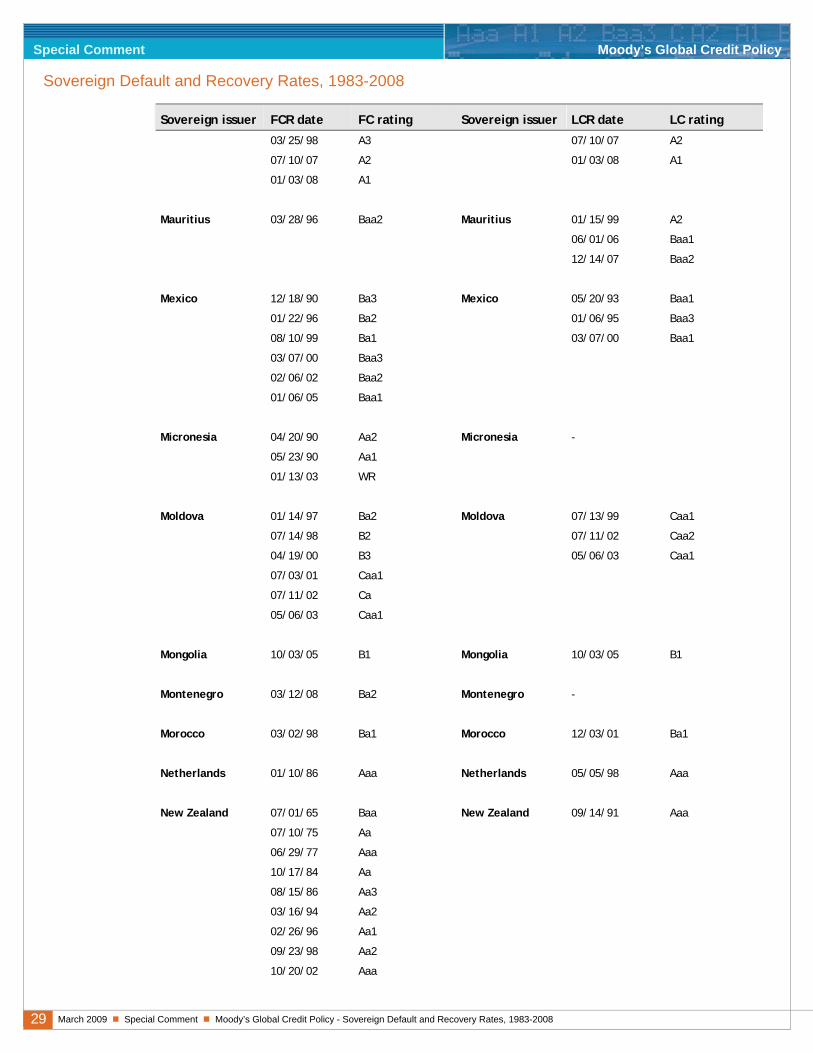
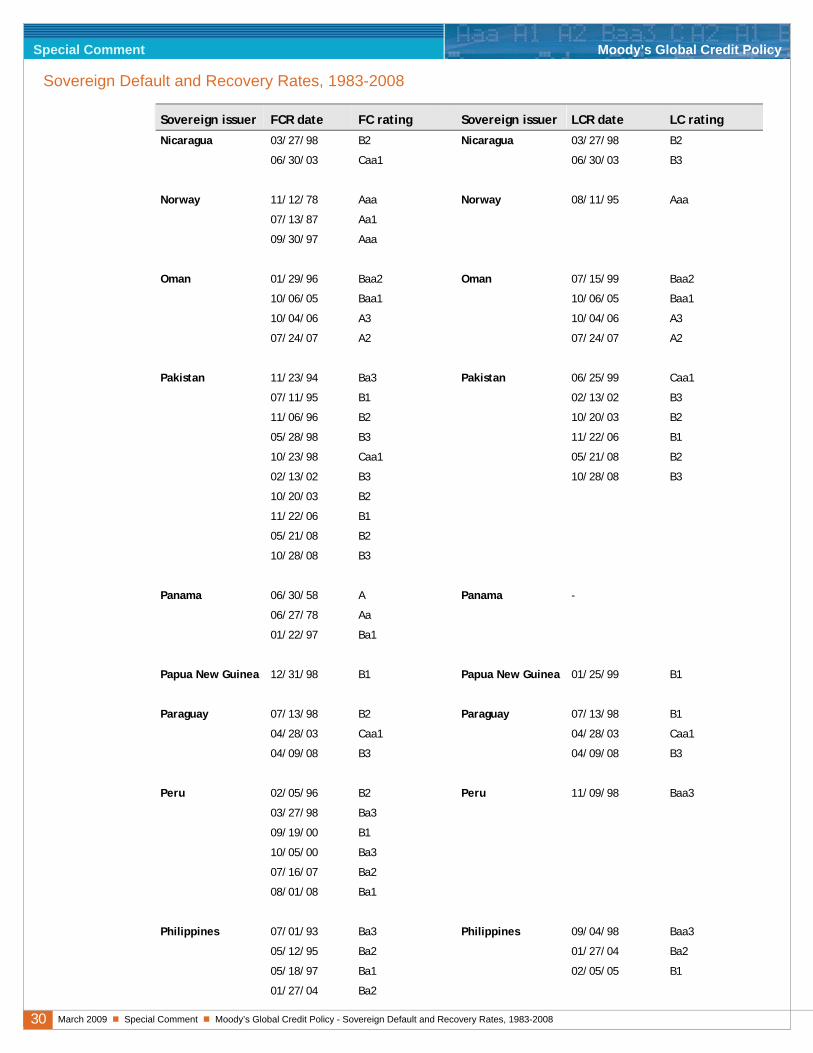
Appendix III – Sovereign Bond Rating Histories14
Sovereign issuer FCR date FC rating Sovereign issuer LCR date LC rating
Albania 06/29/07 B1 Albania 06/29/07 B1
Argentina 11/18/86 Ba3 Argentina 01/28/97 B1
12/04/87 B2 10/02/97 Ba3
05/26/89 B3 10/06/99 B1
07/13/92 B1 03/28/01 B2
10/02/97 Ba3 07/13/01 B3
10/06/99 B1 07/26/01 Caa1
03/28/01 B2 10/12/01 Caa3
07/13/01 B3 12/20/01 Ca
07/26/01 Caa1 08/20/03 Caa1
10/12/01 Caa3 06/29/05 B3
12/20/01 Ca
08/20/03 Caa1
06/29/05 B3
Armenia 07/24/06 Ba2 Armenia 07/24/06 Ba2
Australia 01/15/62 A Australia 07/26/99 Aaa
10/15/74 Aaa
09/10/86 Aa1
08/28/89 Aa2
10/20/02 Aaa
Austria 06/26/77 Aaa Austria 10/27/86 Aaa
Azerbaijan 09/14/06 Ba1 Azerbaijan 09/14/06 Ba1
Bahamas 04/08/97 A3 Bahamas 11/12/98 A1
Bahrain 01/29/96 Ba1 Bahrain 03/30/99 Baa3
08/15/02 Baa3 08/15/02 Baa1
12/11/03 Baa1 10/04/06 A3
10/04/06 A3 07/24/07 A2
07/24/07 A2
Barbados 12/05/94 Ba2 Barbados 12/09/02 A3
04/18/97 Ba1
02/08/00 Baa2
14 The Appendix presents the history of sovereign issuer ratings. For study coverage, refer to Exhibit 1 and Data and Methodology section.
23 March 2009 Special Comment Moody’s Global Credit Policy - Sovereign Default and Recovery Rates, 1983-2008
Special Comment Moody’s Global Credit Policy
Sovereign Default and Recovery Rates, 1983-2008
Sovereign issuer FCR date FC rating Sovereign issuer LCR date LC rating
Belarus 08/22/07 B1 Belarus 08/22/07 B1
Belgium 03/27/88 Aa1 Belgium 01/27/97 Aa1
Belize 01/21/99 Ba2 Belize 01/21/99 Ba1
05/28/03 Ba3 05/28/03 Ba2
08/05/04 B2 08/05/04 B1
06/07/05 B3 06/07/05 B3
10/26/05 Caa3 10/26/05 Caa3
02/13/07 Caa1 02/13/07 Caa1
Bermuda 06/10/94 Aa1 Bermuda 11/09/98 Aaa
Bolivia 05/29/98 B1 Bolivia 10/02/98 B1
04/16/03 B3 04/16/03 B3
Bosnia and Herzegovina
03/29/04 B3 Bosnia and Herzegovina
03/29/04 B3
05/16/06 B2 05/16/06 B2
Botswana 03/12/01 A2 Botswana 03/12/01 A1
Brazil 11/18/86 Ba1 Brazil 06/19/98 B2
12/04/87 B1 09/03/98 Caa1
10/15/89 B2 12/16/99 B3
11/30/94 B1 10/16/00 B1
09/03/98 B2 08/12/02 B2
10/16/00 B1 09/09/04 Ba3
08/12/02 B2 08/31/06 Ba2
09/09/04 B1 08/23/07 Ba1
10/12/05 Ba3
08/31/06 Ba2
08/23/07 Ba1
Bulgaria 09/27/96 B3 Bulgaria 02/18/99 B1
12/16/97 B2 06/05/03 Ba2
12/19/01 B1 11/17/04 Ba1
06/05/03 Ba2 03/01/06 Baa3
11/17/04 Ba1
03/01/06 Baa3
Cambodia 05/21/07 B2 Cambodia 05/21/07 B2
Canada 05/22/68 Aa Canada 05/03/93 Aaa
24 March 2009 Special Comment Moody’s Global Credit Policy - Sovereign Default and Recovery Rates, 1983-2008
Special Comment Moody’s Global Credit Policy
Sovereign Default and Recovery Rates, 1983-2008
Sovereign issuer FCR date FC rating Sovereign issuer LCR date LC rating
04/12/74 Aaa 04/12/95 Aa1
06/02/94 Aa1 05/03/02 Aaa
04/12/95 Aa2
06/21/00 Aa1
05/03/02 Aaa
Cayman Islands 12/16/97 Aa3 Cayman Islands -
Chile 02/17/94 Baa2 Chile 07/29/99 A1
06/29/95 Baa1
07/07/06 A2
China 05/23/88 A3 China 07/25/07 A1
11/08/89 Baa1
09/10/93 A3
10/02/03 A2
07/25/07 A1
Colombia 08/04/93 Ba1 Colombia 06/19/98 Baa2
09/19/95 Baa3 06/29/06 Baa3
08/11/99 Ba2
06/19/08 Ba1
Costa Rica 05/08/97 Ba1 Costa Rica 10/02/98 Ba1
Croatia 01/27/97 Baa3 Croatia 03/02/99 Baa1
11/19/08 Baa2
Cuba 04/05/99 Caa1 Cuba -
Cyprus 02/28/96 A2 Cyprus 07/19/99 A2
07/10/07 A1 07/10/07 A1
01/03/08 Aa3 01/03/08 Aa3
Czech Republic 03/01/93 Baa3 Czech Republic 06/22/98 A1
05/01/94 Baa2
09/01/95 Baa1
11/02/02 A1
Denmark 09/06/67 Aa Denmark 07/08/86 Aa
08/15/86 Aa1 08/15/86 Aa1
08/23/99 Aaa 02/03/87 Aaa
Dominican 05/30/97 B1 Dominican 11/09/98 B1
25 March 2009 Special Comment Moody’s Global Credit Policy - Sovereign Default and Recovery Rates, 1983-2008
Special Comment Moody’s Global Credit Policy
Sovereign Default and Recovery Rates, 1983-2008
Sovereign issuer FCR date FC rating Sovereign issuer LCR date LC rating Republic Republic
08/29/01 Ba2 08/29/01 Ba2
10/07/03 B1 10/07/03 B1
11/10/03 B2 11/10/03 B2
01/30/04 B3 01/30/04 B3
05/07/07 B2 05/07/07 B2
Ecuador 07/24/97 B1 Ecuador 10/02/98 B3
09/14/98 B3 10/05/99 Caa1
10/05/99 Caa2 02/24/04 B3
02/24/04 Caa1 03/21/08 WR
01/30/07 Caa2
03/20/08 B3
11/14/08 Caa1
12/16/08 Ca
Egypt 10/09/96 Ba2 Egypt 03/04/99 Baa1
11/14/97 Ba1 05/18/05 Baa3
06/23/08 Ba1
El Salvador 07/07/97 Baa3 El Salvador 11/09/98 Baa2
Estonia 09/11/97 Baa1 Estonia 02/18/99 A1
11/12/02 A1
Fiji Islands 03/31/99 Ba1 Fiji Islands 03/31/99 Ba1
07/19/00 Ba2 07/19/00 Ba2
Finland 10/19/77 Aa Finland 01/15/97 Aaa
02/07/86 Aaa
10/22/90 Aa1
01/13/92 Aa2
01/15/97 Aa1
05/04/98 Aaa
France 01/23/79 Aaa France 09/28/88 Aaa
Germany 02/09/86 Aaa Germany 04/29/93 Aaa
Greece 07/19/90 Baa1 Greece 01/28/97 A2
05/24/94 Baa3 11/04/02 A1
12/23/96 Baa1
07/14/99 A2
11/04/02 A1
26 March 2009 Special Comment Moody’s Global Credit Policy - Sovereign Default and Recovery Rates, 1983-2008
Special Comment Moody’s Global Credit Policy
Sovereign Default and Recovery Rates, 1983-2008
Sovereign issuer FCR date FC rating Sovereign issuer LCR date LC rating
Guatemala 07/08/97 Ba2 Guatemala 11/09/98 Ba1
Honduras 09/29/98 B2 Honduras 09/29/98 B2
Hong Kong 11/8/1988 A2 Hong Kong 10/5/1998 A1
11/1/1989 A3 8/1/2000 Aa3
10/2/2003 A1 7/25/2007 Aa2
9/27/2006 Aa3
7/25/2007 Aa2
Hungary 07/18/89 Baa2 Hungary 06/22/98 A1
07/13/90 Ba1 12/22/06 A2
12/19/96 Baa3 11/07/08 A3
05/08/98 Baa2
06/25/99 Baa1
11/14/00 A3
11/12/02 A1
12/22/06 A2
11/07/08 A3
Iceland 05/24/89 A2 Iceland 07/30/97 Aaa
06/24/96 A1 05/20/08 Aa1
07/30/97 Aa3 10/08/08 A1
10/20/02 Aaa 12/04/08 Baa1
05/20/08 Aa1
10/08/08 A1
12/04/08 Baa1
India 01/28/88 A2 India 06/19/98 Ba2
10/04/90 Baa1
03/26/91 Baa3
06/24/91 Ba2
12/01/94 Baa3
06/19/98 Ba2
02/03/03 Ba1
01/22/04 Baa3
Indonesia 03/01/94 Baa3 Indonesia 09/01/98 B3
12/01/97 Ba1 09/01/03 B2
01/01/98 B2 05/18/06 B1
03/01/98 B3 10/18/07 Ba3
09/01/03 B2
05/18/06 B1
27 March 2009 Special Comment Moody’s Global Credit Policy - Sovereign Default and Recovery Rates, 1983-2008
Special Comment Moody’s Global Credit Policy
Sovereign Default and Recovery Rates, 1983-2008
Sovereign issuer FCR date FC rating Sovereign issuer LCR date LC rating
10/18/07 Ba3
Iran - Iran 06/10/99 Ba2
12/31/01 WR
Ireland 07/15/87 Aa3 Ireland 09/04/92 Aaa
08/31/94 Aa2
02/13/97 Aa1
05/04/98 Aaa
Israel 11/02/95 A3 Israel 12/15/98 A2
07/06/00 A2 04/17/08 A1
04/17/08 A1
Italy 10/10/86 Aaa Italy 11/02/93 A1
07/01/91 Aa1 07/03/96 Aa3
08/13/92 Aa3 05/15/02 Aa2
05/05/93 A1
07/03/96 Aa3
05/05/02 Aa2
Jamaica 03/30/98 Ba3 Jamaica 03/30/98 Baa3
05/17/03 B1 05/17/03 Ba2
Japan 10/01/81 Aaa Japan 05/07/93 Aaa
11/16/98 Aa1 11/16/98 Aa1
10/20/02 Aaa 09/08/00 Aa2
12/04/01 Aa3
05/30/02 A2
10/11/07 A1
06/29/08 Aa3
Jordan 10/27/95 Ba3 Jordan 11/24/99 Ba2
08/21/03 Ba2 08/21/03 Baa3
Kazakhstan 11/11/96 Ba3 Kazakhstan 06/25/99 B1
02/18/99 B1 06/18/01 Ba1
06/18/01 Ba2 09/19/02 Baa1
09/19/02 Baa3
06/08/06 Baa2
Korea 11/18/86 A2 Korea 12/04/98 Baa1
04/04/90 A1 03/28/02 A3
11/27/97 A3 07/25/07 A2
12/10/97 Baa3
28 March 2009 Special Comment Moody’s Global Credit Policy - Sovereign Default and Recovery Rates, 1983-2008
Special Comment Moody’s Global Credit Policy
Sovereign Default and Recovery Rates, 1983-2008
Sovereign issuer FCR date FC rating Sovereign issuer LCR date LC rating
12/21/97 Ba1
02/12/99 Baa3
12/16/99 Baa2
03/28/02 A3
07/25/07 A2
Kuwait 01/29/96 Baa1 Kuwait 01/21/99 Baa1
05/15/02 A2 05/15/02 A2
10/04/06 Aa3 10/04/06 Aa3
07/24/07 Aa2 07/24/07 Aa2
Latvia 12/17/97 Baa2 Latvia 03/02/99 A2
11/12/02 A2 11/07/08 A3
11/07/08 A3
Lebanon 02/26/97 B1 Lebanon 08/26/99 B1
07/30/01 B2 07/30/01 B3
03/14/05 B3
Lithuania 09/04/96 Ba2 Lithuania 02/18/99 Baa1
12/16/97 Ba1 12/11/03 A3
11/12/02 Baa1 09/11/06 A2
12/11/03 A3
09/11/06 A2
Luxembourg 09/20/89 Aaa Luxembourg 07/13/99 Aaa
Macao 11/03/97 Baa1 Macao 09/04/98 A3
02/09/03 A3 10/15/03 A1
10/15/03 A1 07/25/07 Aa3
07/25/07 Aa3
Malaysia 11/18/86 Baa1 Malaysia 09/04/98 A3
03/12/90 A3
03/15/93 A2
03/15/95 A1
12/29/97 A2
07/23/98 Baa2
09/14/98 Baa3
10/17/00 Baa2
09/24/02 Baa1
12/15/04 A3
Malta 03/14/94 A2 Malta 03/25/98 A3
29 March 2009 Special Comment Moody’s Global Credit Policy - Sovereign Default and Recovery Rates, 1983-2008
Special Comment Moody’s Global Credit Policy
Sovereign Default and Recovery Rates, 1983-2008
Sovereign issuer FCR date FC rating Sovereign issuer LCR date LC rating
03/25/98 A3 07/10/07 A2
07/10/07 A2 01/03/08 A1
01/03/08 A1
Mauritius 03/28/96 Baa2 Mauritius 01/15/99 A2
06/01/06 Baa1
12/14/07 Baa2
Mexico 12/18/90 Ba3 Mexico 05/20/93 Baa1
01/22/96 Ba2 01/06/95 Baa3
08/10/99 Ba1 03/07/00 Baa1
03/07/00 Baa3
02/06/02 Baa2
01/06/05 Baa1
Micronesia 04/20/90 Aa2 Micronesia -
05/23/90 Aa1
01/13/03 WR
Moldova 01/14/97 Ba2 Moldova 07/13/99 Caa1
07/14/98 B2 07/11/02 Caa2
04/19/00 B3 05/06/03 Caa1
07/03/01 Caa1
07/11/02 Ca
05/06/03 Caa1
Mongolia 10/03/05 B1 Mongolia 10/03/05 B1
Montenegro 03/12/08 Ba2 Montenegro -
Morocco 03/02/98 Ba1 Morocco 12/03/01 Ba1
Netherlands 01/10/86 Aaa Netherlands 05/05/98 Aaa
New Zealand 07/01/65 Baa New Zealand 09/14/91 Aaa
07/10/75 Aa
06/29/77 Aaa
10/17/84 Aa
08/15/86 Aa3
03/16/94 Aa2
02/26/96 Aa1
09/23/98 Aa2
10/20/02 Aaa
30 March 2009 Special Comment Moody’s Global Credit Policy - Sovereign Default and Recovery Rates, 1983-2008
Special Comment Moody’s Global Credit Policy
Sovereign Default and Recovery Rates, 1983-2008
Sovereign issuer FCR date FC rating Sovereign issuer LCR date LC rating
Nicaragua 03/27/98 B2 Nicaragua 03/27/98 B2
06/30/03 Caa1 06/30/03 B3
Norway 11/12/78 Aaa Norway 08/11/95 Aaa
07/13/87 Aa1
09/30/97 Aaa
Oman 01/29/96 Baa2 Oman 07/15/99 Baa2
10/06/05 Baa1 10/06/05 Baa1
10/04/06 A3 10/04/06 A3
07/24/07 A2 07/24/07 A2
Pakistan 11/23/94 Ba3 Pakistan 06/25/99 Caa1
07/11/95 B1 02/13/02 B3
11/06/96 B2 10/20/03 B2
05/28/98 B3 11/22/06 B1
10/23/98 Caa1 05/21/08 B2
02/13/02 B3 10/28/08 B3
10/20/03 B2
11/22/06 B1
05/21/08 B2
10/28/08 B3
Panama 06/30/58 A Panama -
06/27/78 Aa
01/22/97 Ba1
Papua New Guinea 12/31/98 B1 Papua New Guinea 01/25/99 B1
Paraguay 07/13/98 B2 Paraguay 07/13/98 B1
04/28/03 Caa1 04/28/03 Caa1
04/09/08 B3 04/09/08 B3
Peru 02/05/96 B2 Peru 11/09/98 Baa3
03/27/98 Ba3
09/19/00 B1
10/05/00 Ba3
07/16/07 Ba2
08/01/08 Ba1
Philippines 07/01/93 Ba3 Philippines 09/04/98 Baa3
05/12/95 Ba2 01/27/04 Ba2
05/18/97 Ba1 02/05/05 B1
01/27/04 Ba2
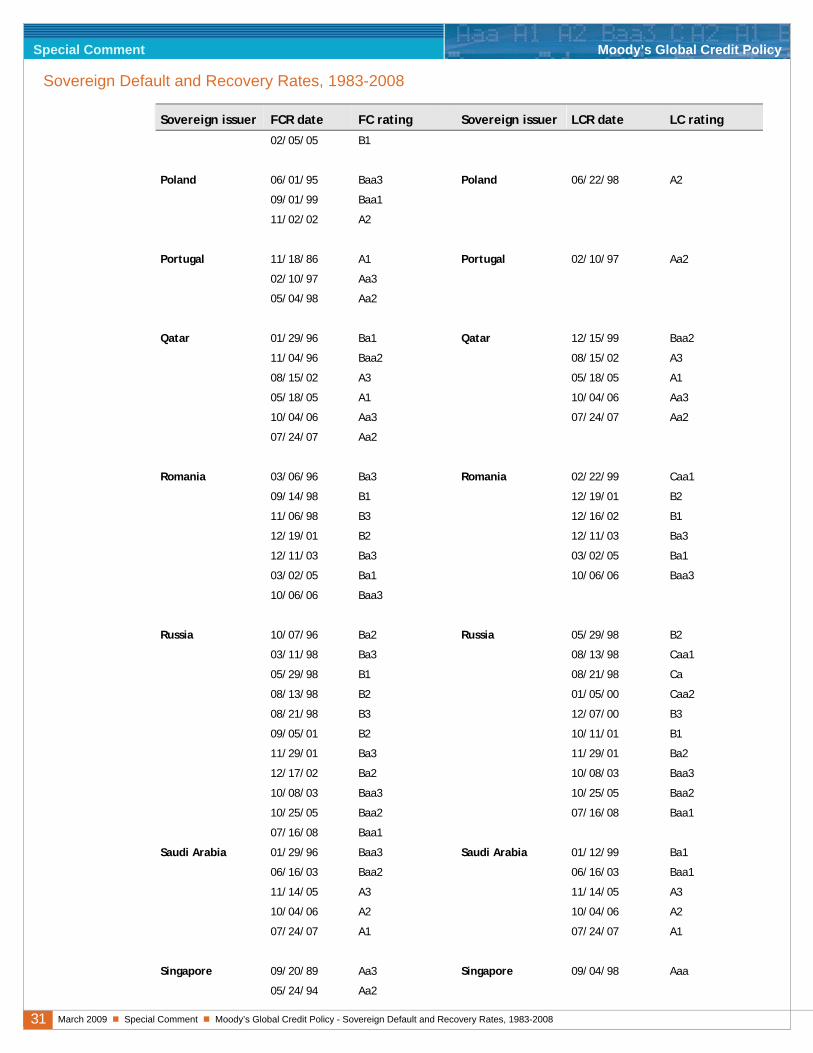
31 March 2009 Special Comment Moody’s Global Credit Policy - Sovereign Default and Recovery Rates, 1983-2008
Special Comment Moody’s Global Credit Policy
Sovereign Default and Recovery Rates, 1983-2008
Sovereign issuer FCR date FC rating Sovereign issuer LCR date LC rating
02/05/05 B1
Poland 06/01/95 Baa3 Poland 06/22/98 A2
09/01/99 Baa1
11/02/02 A2
Portugal 11/18/86 A1 Portugal 02/10/97 Aa2
02/10/97 Aa3
05/04/98 Aa2
Qatar 01/29/96 Ba1 Qatar 12/15/99 Baa2
11/04/96 Baa2 08/15/02 A3
08/15/02 A3 05/18/05 A1
05/18/05 A1 10/04/06 Aa3
10/04/06 Aa3 07/24/07 Aa2
07/24/07 Aa2
Romania 03/06/96 Ba3 Romania 02/22/99 Caa1
09/14/98 B1 12/19/01 B2
11/06/98 B3 12/16/02 B1
12/19/01 B2 12/11/03 Ba3
12/11/03 Ba3 03/02/05 Ba1
03/02/05 Ba1 10/06/06 Baa3
10/06/06 Baa3
Russia 10/07/96 Ba2 Russia 05/29/98 B2
03/11/98 Ba3 08/13/98 Caa1
05/29/98 B1 08/21/98 Ca
08/13/98 B2 01/05/00 Caa2
08/21/98 B3 12/07/00 B3
09/05/01 B2 10/11/01 B1
11/29/01 Ba3 11/29/01 Ba2
12/17/02 Ba2 10/08/03 Baa3
10/08/03 Baa3 10/25/05 Baa2
10/25/05 Baa2 07/16/08 Baa1
07/16/08 Baa1
Saudi Arabia 01/29/96 Baa3 Saudi Arabia 01/12/99 Ba1
06/16/03 Baa2 06/16/03 Baa1
11/14/05 A3 11/14/05 A3
10/04/06 A2 10/04/06 A2
07/24/07 A1 07/24/07 A1
Singapore 09/20/89 Aa3 Singapore 09/04/98 Aaa
05/24/94 Aa2
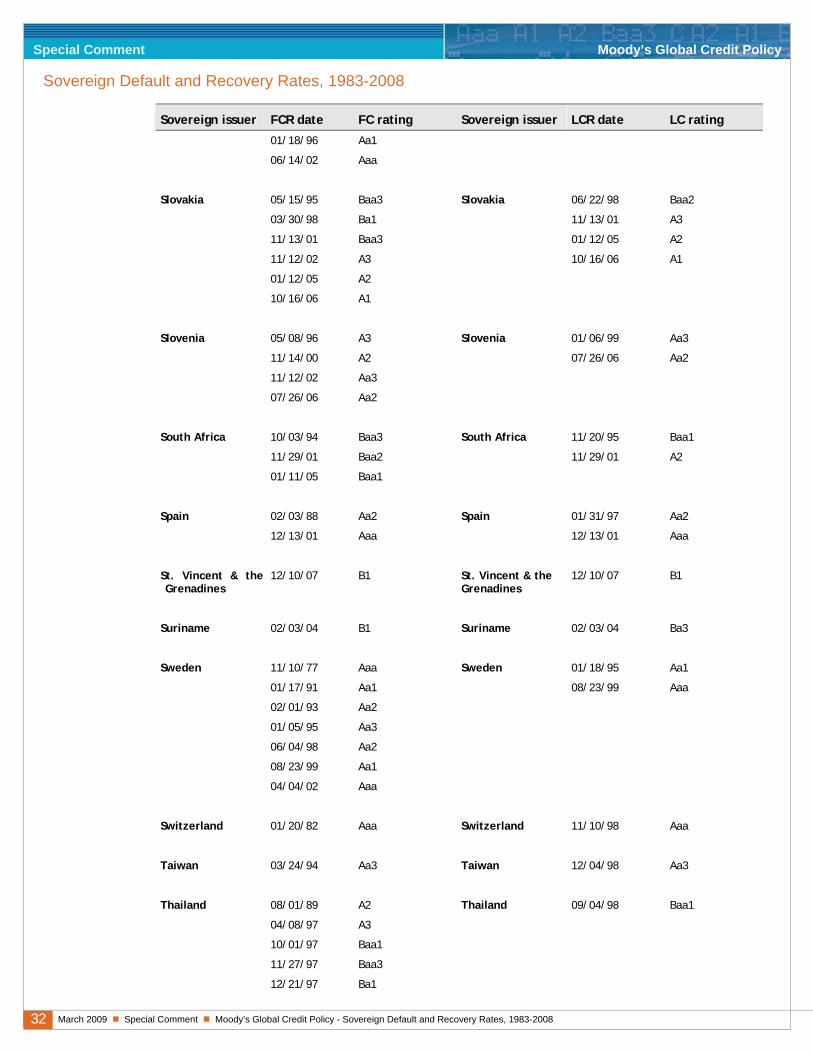
32 March 2009 Special Comment Moody’s Global Credit Policy - Sovereign Default and Recovery Rates, 1983-2008
Special Comment Moody’s Global Credit Policy
Sovereign Default and Recovery Rates, 1983-2008
Sovereign issuer FCR date FC rating Sovereign issuer LCR date LC rating
01/18/96 Aa1
06/14/02 Aaa
Slovakia 05/15/95 Baa3 Slovakia 06/22/98 Baa2
03/30/98 Ba1 11/13/01 A3
11/13/01 Baa3 01/12/05 A2
11/12/02 A3 10/16/06 A1
01/12/05 A2
10/16/06 A1
Slovenia 05/08/96 A3 Slovenia 01/06/99 Aa3
11/14/00 A2 07/26/06 Aa2
11/12/02 Aa3
07/26/06 Aa2
South Africa 10/03/94 Baa3 South Africa 11/20/95 Baa1
11/29/01 Baa2 11/29/01 A2
01/11/05 Baa1
Spain 02/03/88 Aa2 Spain 01/31/97 Aa2
12/13/01 Aaa 12/13/01 Aaa
St. Vincent & theGrenadines
12/10/07 B1 St. Vincent & the Grenadines
12/10/07 B1
Suriname 02/03/04 B1 Suriname 02/03/04 Ba3
Sweden 11/10/77 Aaa Sweden 01/18/95 Aa1
01/17/91 Aa1 08/23/99 Aaa
02/01/93 Aa2
01/05/95 Aa3
06/04/98 Aa2
08/23/99 Aa1
04/04/02 Aaa
Switzerland 01/20/82 Aaa Switzerland 11/10/98 Aaa
Taiwan 03/24/94 Aa3 Taiwan 12/04/98 Aa3
Thailand 08/01/89 A2 Thailand 09/04/98 Baa1
04/08/97 A3
10/01/97 Baa1
11/27/97 Baa3
12/21/97 Ba1
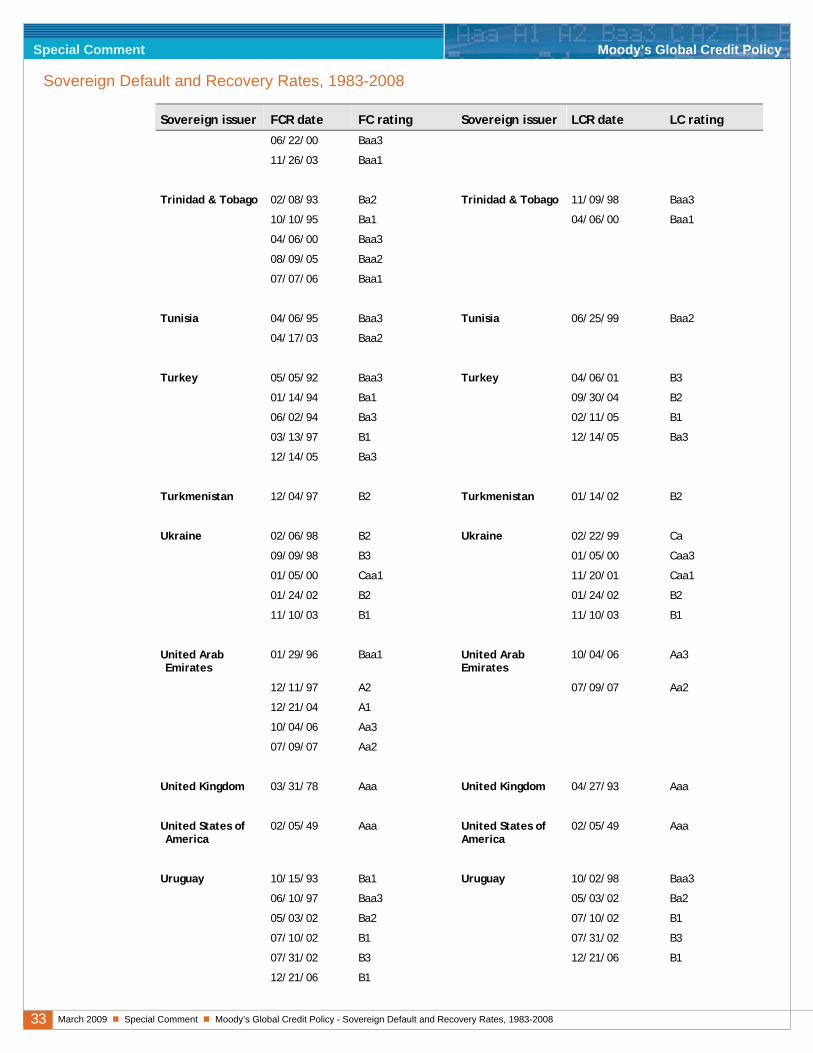
33 March 2009 Special Comment Moody’s Global Credit Policy - Sovereign Default and Recovery Rates, 1983-2008
Special Comment Moody’s Global Credit Policy
Sovereign Default and Recovery Rates, 1983-2008
Sovereign issuer FCR date FC rating Sovereign issuer LCR date LC rating
06/22/00 Baa3
11/26/03 Baa1
Trinidad & Tobago 02/08/93 Ba2 Trinidad & Tobago 11/09/98 Baa3
10/10/95 Ba1 04/06/00 Baa1
04/06/00 Baa3
08/09/05 Baa2
07/07/06 Baa1
Tunisia 04/06/95 Baa3 Tunisia 06/25/99 Baa2
04/17/03 Baa2
Turkey 05/05/92 Baa3 Turkey 04/06/01 B3
01/14/94 Ba1 09/30/04 B2
06/02/94 Ba3 02/11/05 B1
03/13/97 B1 12/14/05 Ba3
12/14/05 Ba3
Turkmenistan 12/04/97 B2 Turkmenistan 01/14/02 B2
Ukraine 02/06/98 B2 Ukraine 02/22/99 Ca
09/09/98 B3 01/05/00 Caa3
01/05/00 Caa1 11/20/01 Caa1
01/24/02 B2 01/24/02 B2
11/10/03 B1 11/10/03 B1
United Arab Emirates
01/29/96 Baa1 United Arab Emirates
10/04/06 Aa3
12/11/97 A2 07/09/07 Aa2
12/21/04 A1
10/04/06 Aa3
07/09/07 Aa2
United Kingdom 03/31/78 Aaa United Kingdom 04/27/93 Aaa
United States of America
02/05/49 Aaa United States of America
02/05/49 Aaa
Uruguay 10/15/93 Ba1 Uruguay 10/02/98 Baa3
06/10/97 Baa3 05/03/02 Ba2
05/03/02 Ba2 07/10/02 B1
07/10/02 B1 07/31/02 B3
07/31/02 B3 12/21/06 B1
12/21/06 B1
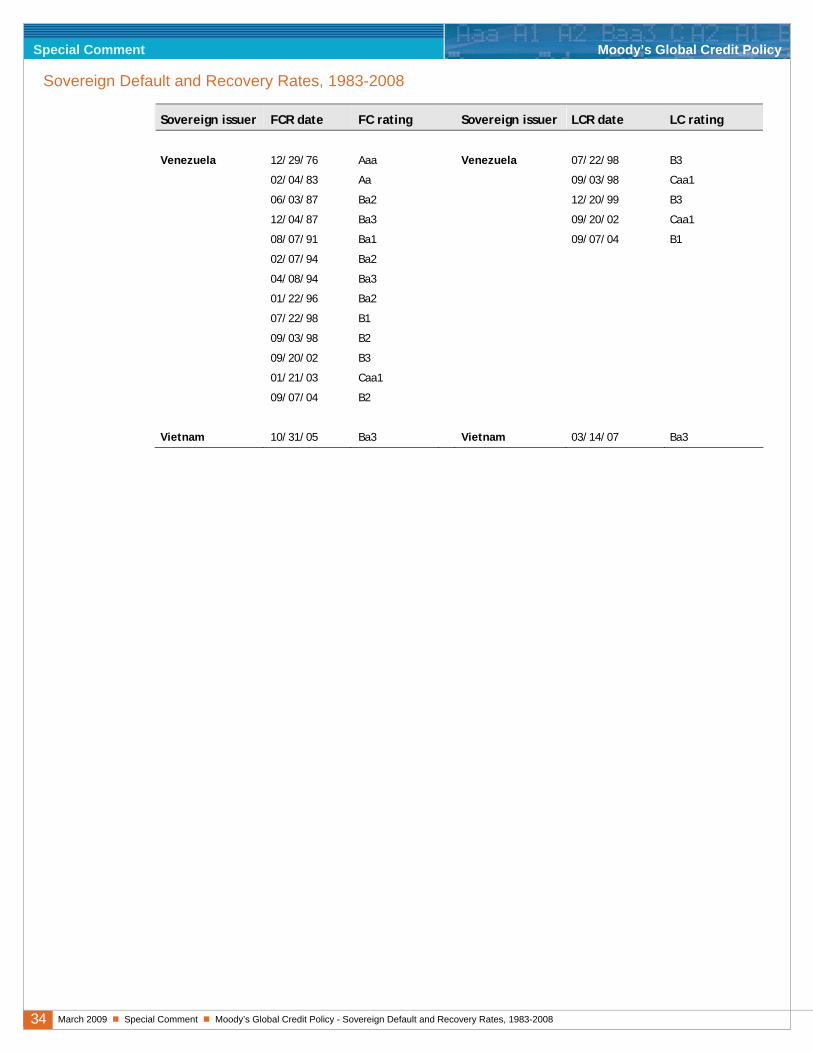
34 March 2009 Special Comment Moody’s Global Credit Policy - Sovereign Default and Recovery Rates, 1983-2008
Special Comment Moody’s Global Credit Policy
Sovereign Default and Recovery Rates, 1983-2008
Sovereign issuer FCR date FC rating Sovereign issuer LCR date LC rating
Venezuela 12/29/76 Aaa Venezuela 07/22/98 B3
02/04/83 Aa 09/03/98 Caa1
06/03/87 Ba2 12/20/99 B3
12/04/87 Ba3 09/20/02 Caa1
08/07/91 Ba1 09/07/04 B1
02/07/94 Ba2
04/08/94 Ba3
01/22/96 Ba2
07/22/98 B1
09/03/98 B2
09/20/02 B3
01/21/03 Caa1
09/07/04 B2
Vietnam 10/31/05 Ba3 Vietnam 03/14/07 Ba3
35 March 2009 Special Comment Moody’s Global Credit Policy - Sovereign Default and Recovery Rates, 1983-2008
Special Comment Moody’s Global Credit Policy
Sovereign Default and Recovery Rates, 1983-2008
CREDIT RATINGS ARE MOODY'S INVESTORS SERVICE, INC.'S (MIS) CURRENT OPINIONS OF THE RELATIVE FUTURE CREDIT RISK OF ENTITIES, CREDIT COMMITMENTS, OR DEBT OR DEBT-LIKE SECURITIES. MIS DEFINES CREDIT RISK AS THE RISK THAT AN ENTITY MAY NOT MEET ITS CONTRACTUAL, FINANCIAL OBLIGATIONS AS THEY COME DUE AND ANY ESTIMATED FINANCIAL LOSS IN THE EVENT OF DEFAULT. CREDIT RATINGS DO NOT ADDRESS ANY OTHER RISK, INCLUDING BUT NOT LIMITED TO: LIQUIDITY RISK, MARKET VALUE RISK, OR PRICE VOLATILITY. CREDIT RATINGS ARE NOT STATEMENTS OF CURRENT OR HISTORICAL FACT. CREDIT RATINGS DO NOT CONSTITUTE INVESTMENT OR FINANCIAL ADVICE, AND CREDIT RATINGS ARE NOT RECOMMENDATIONS TO PURCHASE, SELL, OR HOLD PARTICULAR SECURITIES. CREDIT RATINGS DO NOT COMMENT ON THE SUITABILITY OF AN INVESTMENT FOR ANY PARTICULAR INVESTOR. MIS ISSUES ITS CREDIT RATINGS WITH THE EXPECTATION AND UNDERSTANDING THAT EACH INVESTOR WILL MAKE ITS OWN STUDY AND EVALUATION OF EACH SECURITY THAT IS UNDER CONSIDERATION FOR PURCHASE, HOLDING, OR SALE. © Copyright 2009, Moody’s Investors Service, Inc., and/or its licensors and affiliates (together, "MOODY'S”). All rights reserved. ALL INFORMATION CONTAINED HEREIN IS PROTECTED BY COPYRIGHT LAW AND NONE OF SUCH INFORMATION MAY BE COPIED OR OTHERWISE REPRODUCED, REPACKAGED, FURTHER TRANSMITTED, TRANSFERRED, DISSEMINATED, REDISTRIBUTED OR RESOLD, OR STORED FOR SUBSEQUENT USE FOR ANY SUCH PURPOSE, IN WHOLE OR IN PART, IN ANY FORM OR MANNER OR BY ANY MEANS WHATSOEVER, BY ANY PERSON WITHOUT MOODY’S PRIOR WRITTEN CONSENT. All information contained herein is obtained by MOODY’S from sources believed by it to be accurate and reliable. Because of the possibility of human or mechanical error as well as other factors, however, such information is provided “as is” without warranty of any kind and MOODY’S, in particular, makes no representation or warranty, express or implied, as to the accuracy, timeliness, completeness, merchantability or fitness for any particular purpose of any such information. Under no circumstances shall MOODY’S have any liability to any person or entity for (a) any loss or damage in whole or in part caused by, resulting from, or relating to, any error (negligent or otherwise) or other circumstance or contingency within or outside the control of MOODY’S or any of its directors, officers, employees or agents in connection with the procurement, collection, compilation, analysis, interpretation, communication, publication or delivery of any such information, or (b) any direct, indirect, special, consequential, compensatory or incidental damages whatsoever (including without limitation, lost profits), even if MOODY’S is advised in advance of the possibility of such damages, resulting from the use of or inability to use, any such information. The credit ratings and financial reporting analysis observations, if any, constituting part of the information contained herein are, and must be construed solely as, statements of opinion and not statements of fact or recommendations to purchase, sell or hold any securities. NO WARRANTY, EXPRESS OR IMPLIED, AS TO THE ACCURACY, TIMELINESS, COMPLETENESS, MERCHANTABILITY OR FITNESS FOR ANY PARTICULAR PURPOSE OF ANY SUCH RATING OR OTHER OPINION OR INFORMATION IS GIVEN OR MADE BY MOODY’S IN ANY FORM OR MANNER WHATSOEVER. Each rating or other opinion must be weighed solely as one factor in any investment decision made by or on behalf of any user of the information contained herein, and each such user must accordingly make its own study and evaluation of each security and of each issuer and guarantor of, and each provider of credit support for, each security that it may consider purchasing, holding or selling. MOODY’S hereby discloses that most issuers of debt securities (including corporate and municipal bonds, debentures, notes and commercial paper) and preferred stock rated by MOODY’S have, prior to assignment of any rating, agreed to pay to MOODY’S for appraisal and rating services rendered by it fees ranging from $1,500 to approximately $2,400,000. Moody’s Corporation (MCO) and its wholly-owned credit rating agency subsidiary, Moody’s Investors Service (MIS), also maintain policies and procedures to address the independence of MIS’s ratings and rating processes. Information regarding certain affiliations that may exist between directors of MCO and rated entities, and between entities who hold ratings from MIS and have also publicly reported to the SEC an ownership interest in MCO of more than 5%, is posted annually on Moody’s website at www.moodys.com under the heading “Shareholder Relations — Corporate Governance — Director and Shareholder Affiliation Policy.”
Report Number: 115232
Author Senior Production Associate Elena Duggar Shubhra Bhatnagar