monthly market snapshot - frontieradvisors.com.au · frontier advisors level 16, 222 exhibition...
TRANSCRIPT
© Frontier Advisors
Monthly MarketSnapshot
The Monthly Market Snapshot publication provides commentary on the global economy and the performance of financial markets
APRIL 2018
© Frontier Advisors
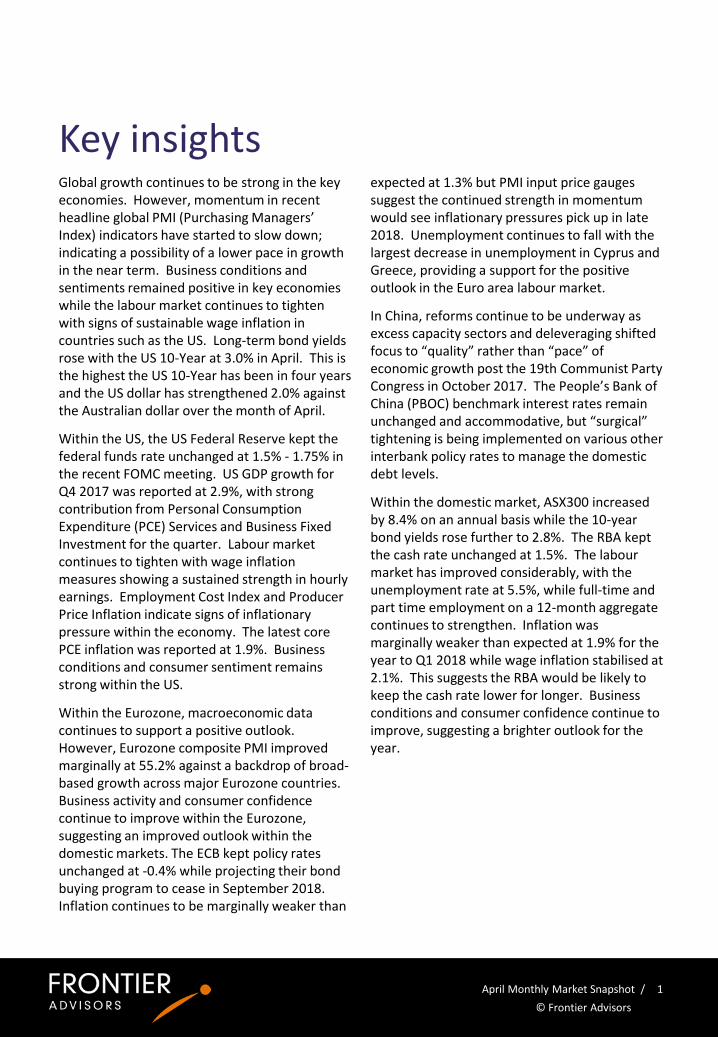
Key insightsGlobal growth continues to be strong in the key economies. However, momentum in recent headline global PMI (Purchasing Managers’ Index) indicators have started to slow down; indicating a possibility of a lower pace in growth in the near term. Business conditions and sentiments remained positive in key economies while the labour market continues to tighten with signs of sustainable wage inflation in countries such as the US. Long-term bond yields rose with the US 10-Year at 3.0% in April. This is the highest the US 10-Year has been in four years and the US dollar has strengthened 2.0% against the Australian dollar over the month of April.
Within the US, the US Federal Reserve kept the federal funds rate unchanged at 1.5% - 1.75% in the recent FOMC meeting. US GDP growth for Q4 2017 was reported at 2.9%, with strong contribution from Personal Consumption Expenditure (PCE) Services and Business Fixed Investment for the quarter. Labour market continues to tighten with wage inflation measures showing a sustained strength in hourly earnings. Employment Cost Index and Producer Price Inflation indicate signs of inflationary pressure within the economy. The latest core PCE inflation was reported at 1.9%. Business conditions and consumer sentiment remains strong within the US.
Within the Eurozone, macroeconomic data continues to support a positive outlook. However, Eurozone composite PMI improved marginally at 55.2% against a backdrop of broad-based growth across major Eurozone countries. Business activity and consumer confidence continue to improve within the Eurozone, suggesting an improved outlook within the domestic markets. The ECB kept policy rates unchanged at -0.4% while projecting their bond buying program to cease in September 2018. Inflation continues to be marginally weaker than
expected at 1.3% but PMI input price gauges suggest the continued strength in momentum would see inflationary pressures pick up in late 2018. Unemployment continues to fall with the largest decrease in unemployment in Cyprus and Greece, providing a support for the positive outlook in the Euro area labour market.
In China, reforms continue to be underway as excess capacity sectors and deleveraging shifted focus to “quality” rather than “pace” of economic growth post the 19th Communist Party Congress in October 2017. The People’s Bank of China (PBOC) benchmark interest rates remain unchanged and accommodative, but “surgical” tightening is being implemented on various other interbank policy rates to manage the domestic debt levels.
Within the domestic market, ASX300 increased by 8.4% on an annual basis while the 10-year bond yields rose further to 2.8%. The RBA kept the cash rate unchanged at 1.5%. The labour market has improved considerably, with the unemployment rate at 5.5%, while full-time and part time employment on a 12-month aggregate continues to strengthen. Inflation was marginally weaker than expected at 1.9% for the year to Q1 2018 while wage inflation stabilised at 2.1%. This suggests the RBA would be likely to keep the cash rate lower for longer. Business conditions and consumer confidence continue to improve, suggesting a brighter outlook for the year.
April Monthly Market Snapshot / 1
© Frontier Advisors
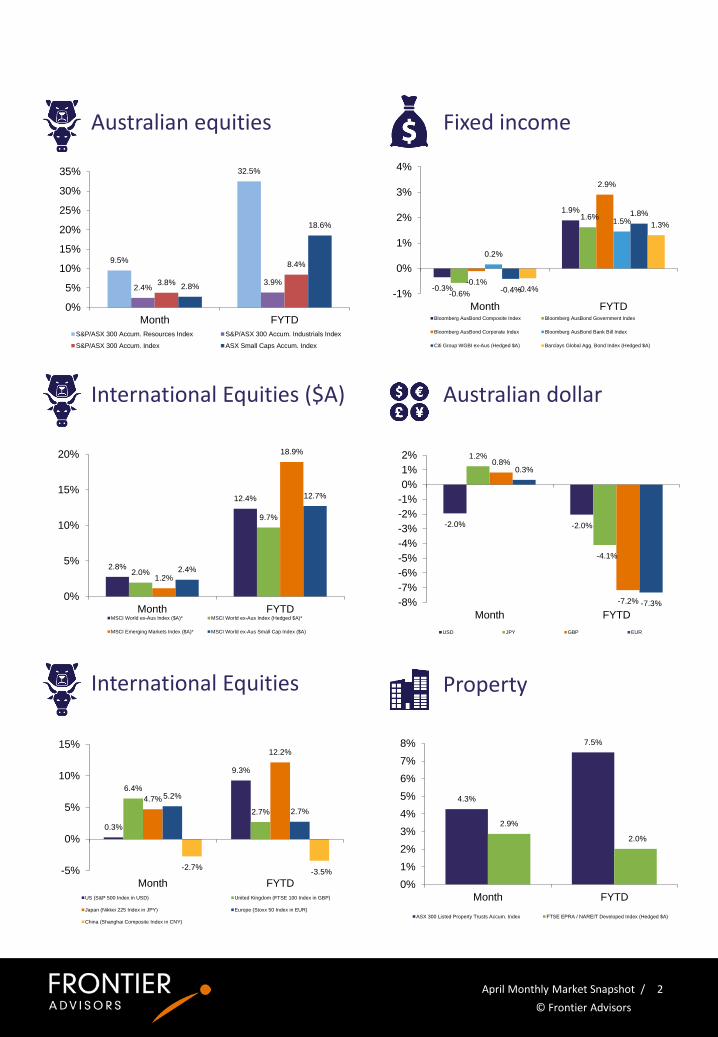
Australian equities
International Equities ($A)
International Equities
Fixed income
Property
Australian dollar
April Monthly Market Snapshot / 2
4.3%
7.5%
2.9%
2.0%
0%
1%
2%
3%
4%
5%
6%
7%
8%
Month FYTD
ASX 300 Listed Property Trusts Accum. Index FTSE EPRA / NAREIT Developed Index (Hedged $A)
9.5%
32.5%
2.4%3.9%3.8%
8.4%
2.8%
18.6%
0%
5%
10%
15%
20%
25%
30%
35%
Month FYTD
S&P/ASX 300 Accum. Resources Index S&P/ASX 300 Accum. Industrials Index
S&P/ASX 300 Accum. Index ASX Small Caps Accum. Index
2.8%
12.4%
2.0%
9.7%
1.2%
18.9%
2.4%
12.7%
0%
5%
10%
15%
20%
Month FYTDMSCI World ex-Aus Index ($A)* MSCI World ex-Aus Index (Hedged $A)*
MSCI Emerging Markets Index ($A)* MSCI World ex-Aus Small Cap Index ($A)
0.3%
9.3%
6.4%
2.7%
4.7%
12.2%
5.2%
2.7%
-2.7%-3.5%-5%
0%
5%
10%
15%
Month FYTD
US (S&P 500 Index in USD) United Kingdom (FTSE 100 Index in GBP)
Japan (Nikkei 225 Index in JPY) Europe (Stoxx 50 Index in EUR)
China (Shanghai Composite Index in CNY)
-0.3%
1.9%
-0.6%
1.6%
-0.1%
2.9%
0.2%
1.5%
-0.4%
1.8%
-0.4%
1.3%
-1%
0%
1%
2%
3%
4%
Month FYTDBloomberg AusBond Composite Index Bloomberg AusBond Government Index
Bloomberg AusBond Corporate Index Bloomberg AusBond Bank Bill Index
Citi Group WGBI ex-Aus (Hedged $A) Barclays Global Agg. Bond Index (Hedged $A)
-2.0% -2.0%
1.2%
-4.1%
0.8%
-7.2%
0.3%
-7.3%-8%
-7%
-6%
-5%
-4%
-3%
-2%
-1%
0%
1%
2%
Month FYTD
USD JPY GBP EUR
© Frontier Advisors
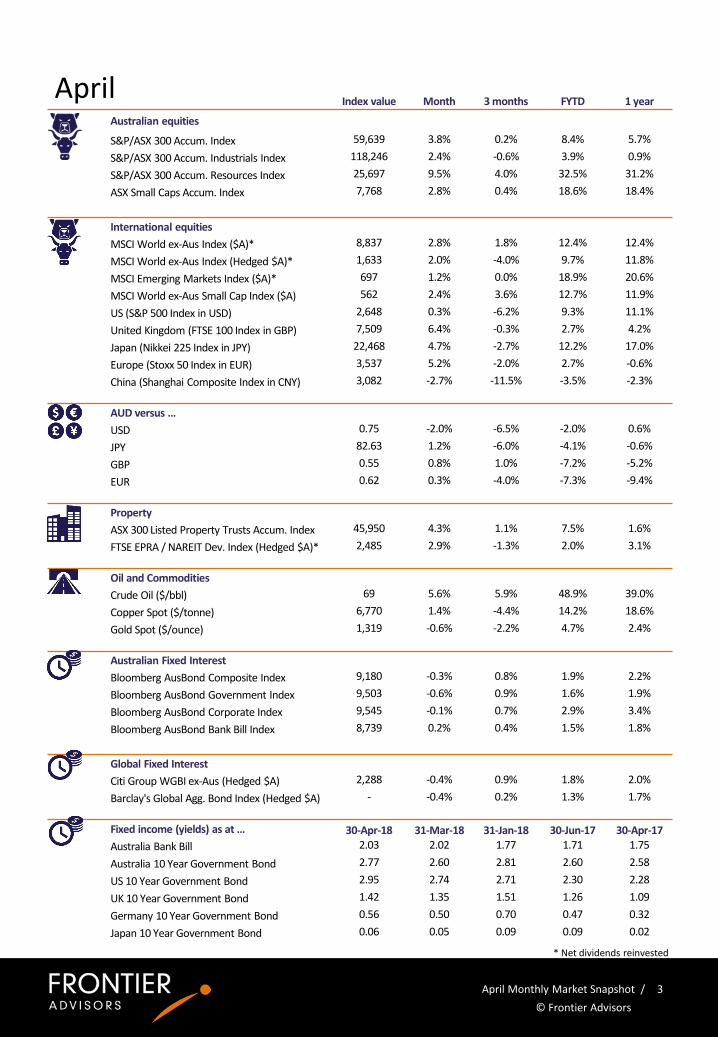
AprilIndex value Month 3 months FYTD 1 year
Australian equities
S&P/ASX 300 Accum. Index 59,639 3.8% 0.2% 8.4% 5.7%
S&P/ASX 300 Accum. Industrials Index 118,246 2.4% -0.6% 3.9% 0.9%
S&P/ASX 300 Accum. Resources Index 25,697 9.5% 4.0% 32.5% 31.2%
ASX Small Caps Accum. Index 7,768 2.8% 0.4% 18.6% 18.4%
International equities
MSCI World ex-Aus Index ($A)* 8,837 2.8% 1.8% 12.4% 12.4%
MSCI World ex-Aus Index (Hedged $A)* 1,633 2.0% -4.0% 9.7% 11.8%
MSCI Emerging Markets Index ($A)* 697 1.2% 0.0% 18.9% 20.6%
MSCI World ex-Aus Small Cap Index ($A) 562 2.4% 3.6% 12.7% 11.9%
US (S&P 500 Index in USD) 2,648 0.3% -6.2% 9.3% 11.1%
United Kingdom (FTSE 100 Index in GBP) 7,509 6.4% -0.3% 2.7% 4.2%
Japan (Nikkei 225 Index in JPY) 22,468 4.7% -2.7% 12.2% 17.0%
Europe (Stoxx 50 Index in EUR) 3,537 5.2% -2.0% 2.7% -0.6%
China (Shanghai Composite Index in CNY) 3,082 -2.7% -11.5% -3.5% -2.3%
AUD versus …
USD 0.75 -2.0% -6.5% -2.0% 0.6%
JPY 82.63 1.2% -6.0% -4.1% -0.6%
GBP 0.55 0.8% 1.0% -7.2% -5.2%
EUR 0.62 0.3% -4.0% -7.3% -9.4%
Property
ASX 300 Listed Property Trusts Accum. Index 45,950 4.3% 1.1% 7.5% 1.6%
FTSE EPRA / NAREIT Dev. Index (Hedged $A)* 2,485 2.9% -1.3% 2.0% 3.1%
Oil and Commodities
Crude Oil ($/bbl) 69 5.6% 5.9% 48.9% 39.0%
Copper Spot ($/tonne) 6,770 1.4% -4.4% 14.2% 18.6%
Gold Spot ($/ounce) 1,319 -0.6% -2.2% 4.7% 2.4%
Australian Fixed Interest
Bloomberg AusBond Composite Index 9,180 -0.3% 0.8% 1.9% 2.2%
Bloomberg AusBond Government Index 9,503 -0.6% 0.9% 1.6% 1.9%
Bloomberg AusBond Corporate Index 9,545 -0.1% 0.7% 2.9% 3.4%
Bloomberg AusBond Bank Bill Index 8,739 0.2% 0.4% 1.5% 1.8%
Global Fixed Interest
Citi Group WGBI ex-Aus (Hedged $A) 2,288 -0.4% 0.9% 1.8% 2.0%
Barclay's Global Agg. Bond Index (Hedged $A) - -0.4% 0.2% 1.3% 1.7%
Fixed income (yields) as at … 30-Apr-18 31-Mar-18 31-Jan-18 30-Jun-17 30-Apr-17
Australia Bank Bill 2.03 2.02 1.77 1.71 1.75
Australia 10 Year Government Bond 2.77 2.60 2.81 2.60 2.58
US 10 Year Government Bond 2.95 2.74 2.71 2.30 2.28
UK 10 Year Government Bond 1.42 1.35 1.51 1.26 1.09
Germany 10 Year Government Bond 0.56 0.50 0.70 0.47 0.32
Japan 10 Year Government Bond 0.06 0.05 0.09 0.09 0.02
April Monthly Market Snapshot / 3
* Net dividends reinvested
© Frontier Advisors
April Monthly Market Snapshot / 4
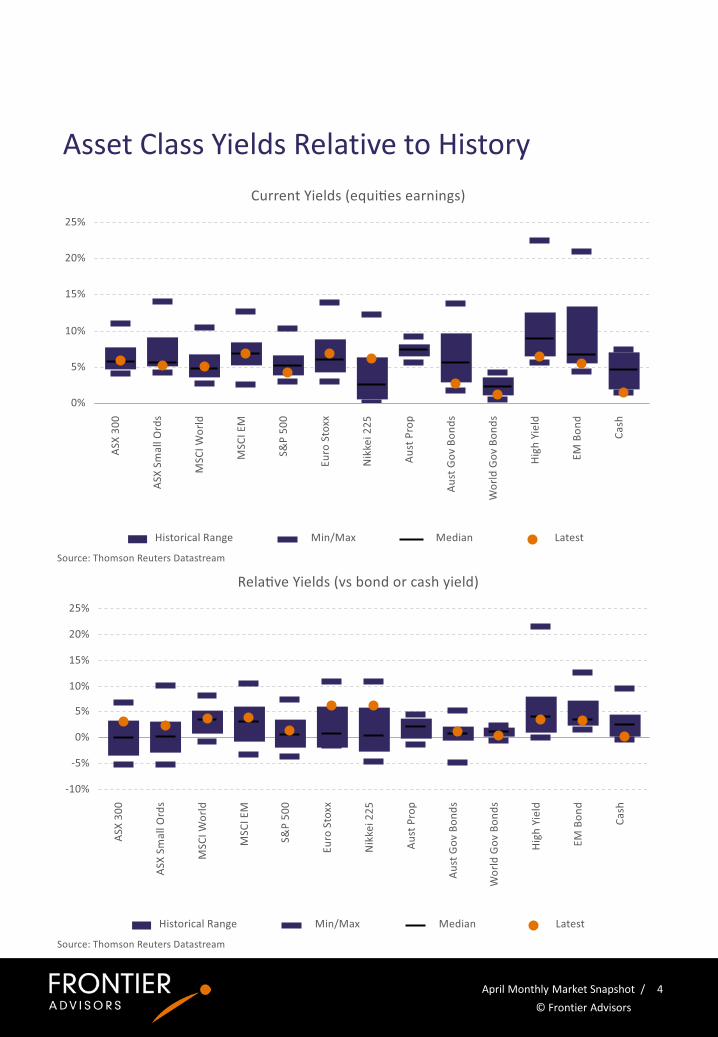
Asset Class Yields Relative to History
© Frontier Advisors
April Monthly Market Snapshot / 5
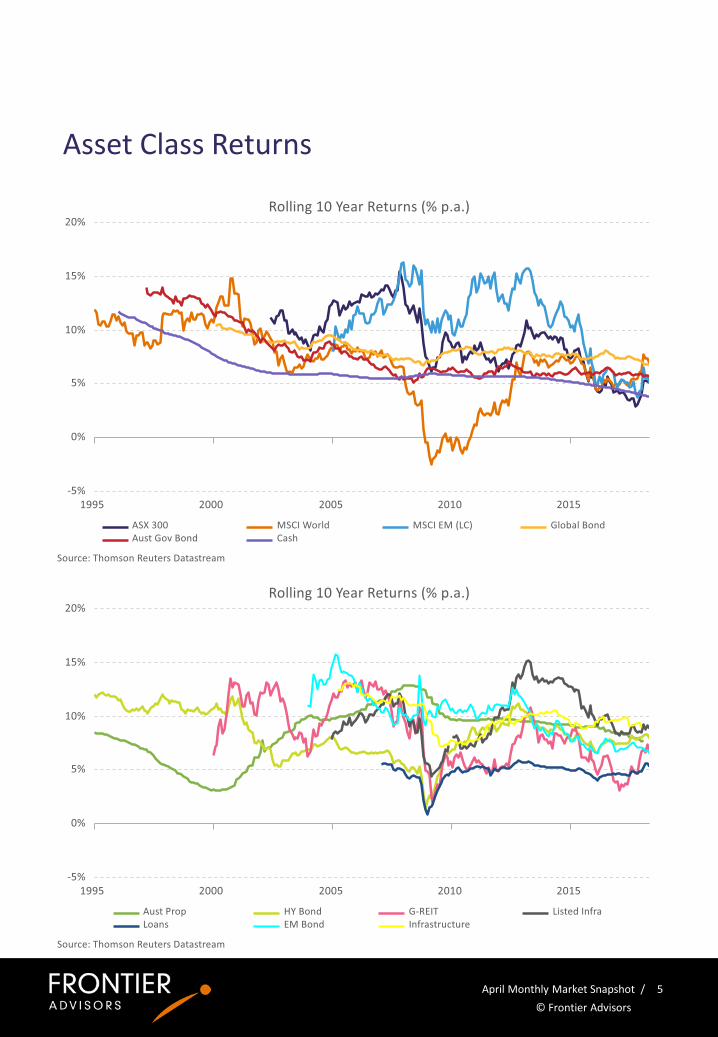
Asset Class Returns
© Frontier Advisors
April Monthly Market Snapshot / 6
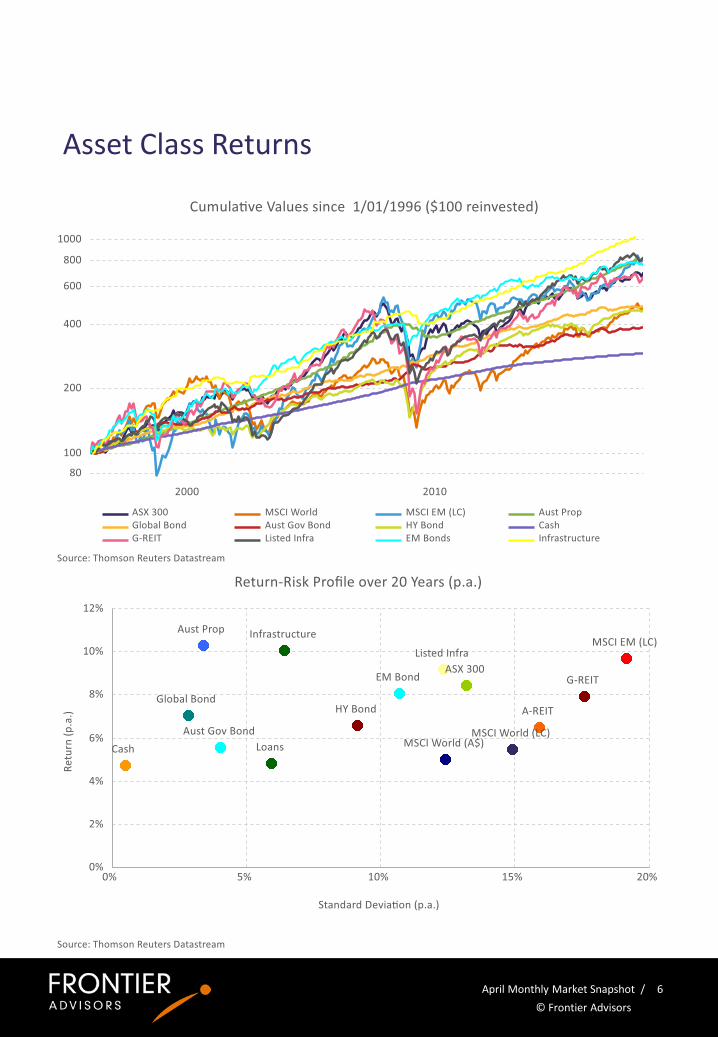
Asset Class Returns
Frontier Advisors
Level 16, 222 Exhibition Street
Melbourne, Victoria 3000
Tel: +61 3 8648 4300
www.frontieradvisors.com.au
@frontier_adv
Frontier does not warrant the accuracy of any information or projections in this paper and does not undertake to publishany new information that may become available. While this information is believed to be reliable, no responsibility forerrors or omissions is accepted by Frontier or any director or employee of the company.The advice in this paper does not take into account investors’ particular objectives, financial situation or needs. Investorsshould consider the appropriateness of the contents of this paper in light of these matters and seek individual advice priorto taking action on any of the issues raised in this paper or making any investment decisions. Investors should obtain andread the applicable Product Disclosure or Information Statement before making a decision on acquiring any financialproducts. Frontier Advisors Pty Ltd does not provide taxation advice and investors should seek their own independenttaxation advice from a registered tax agent.
ACN 074 287 406 AFS Licence No. 241266 © Frontier Advisors
7