monte carlo simulation of a gas-sampled hadron calorimeter
TRANSCRIPT
194 Nuclear Instruments and Methods in Physics Research A264 (1988) ] 94-201 North-Holland, Amsterdam
M O N T E C A R L O S I M U L A T I O N O F A G A S - S A M P L E D H A D R O N C A L O R I M E T E R *
C.Y. CHANG, S. KUNORI , P. RAPP, R. TALAG A , P. STEINBERG, A.J. T Y L K A * * and Z.M. W A N G ***
Department of Physics and Astronomy, High Energy Physics Group, University of Maryland, College Park, MD 20742, USA
Received 18 March 1987 and in revised form 30 June 1987
A prototype of the OPAL barrel hadron calorimeter, which is a gas-sampled calorimeter using plastic streamer tubes, was exposed to pions at energies between 1 and 7 GeV. The response of the detector was simulated using the CERN GEANT3 Monte Carlo program. By using the observed high energy muon signals to deduce details of the streamer formation, the Monte Carlo program was able to reproduce the observed calorimeter response. The behavior of the hadron calorimeter when placed behind a lead glass electromagnetic calorimeter was also investigated.
1. Introduction
Due to their reliability and relatively low cost, plas- tic s t reamer tubes have been employed in many high energy experiments in which a calorimeter of very large volume is needed [1,2]. In this report, we present the response of a pro to type of the h a d r o n calorimeter (HCAL) being bui l t for the OPAL detector at LEP at C E R N [3]. The calorimeter was exposed to pions over the energy range expected at O P A L (1 -7 GeV), with and without a lead glass electromagnetic calorimeter (EMCAL) in front of it. A Mon te Carlo s imulat ion of the experimental results has been carried out in the f ramework of the C E R N - G E A N T 3 system [4]. We re- port here on the response of these calorimeters and make comparisons between the data and the simula- tions.
This reports is organized as follows: In section 2, we briefly describe the exper imental setup and the calorim- eter design. In section 3, we discuss some of the im- por tan t features of the data and compar isons to the Mon te Carlo simulat ions of the calorimeter response. Section 4 describes in more detail the calorimeter simu- lation. Finally, section 5 discusses the reconst ruct ion of the energy of an isolated had ron deposi ted inside the E M C A L + H C A L combined system.
* Work supported by Department of Energy Contract DE- AC05-76ERO-2504.
* * Present address: Cosmic Ray Astrophysics Section, Naval Research Lab., Washington, DC 20375, USA.
* * * Present address: Department of Modern Physics, Univer- sity of Science and Technology of China, The People's Republic of China.
0168-9002 /88 /$03 .50 © Elsevier Science Publishers B.V. (Nor th -Hol land Physics Publ ishing Division)
2. The experimental setup
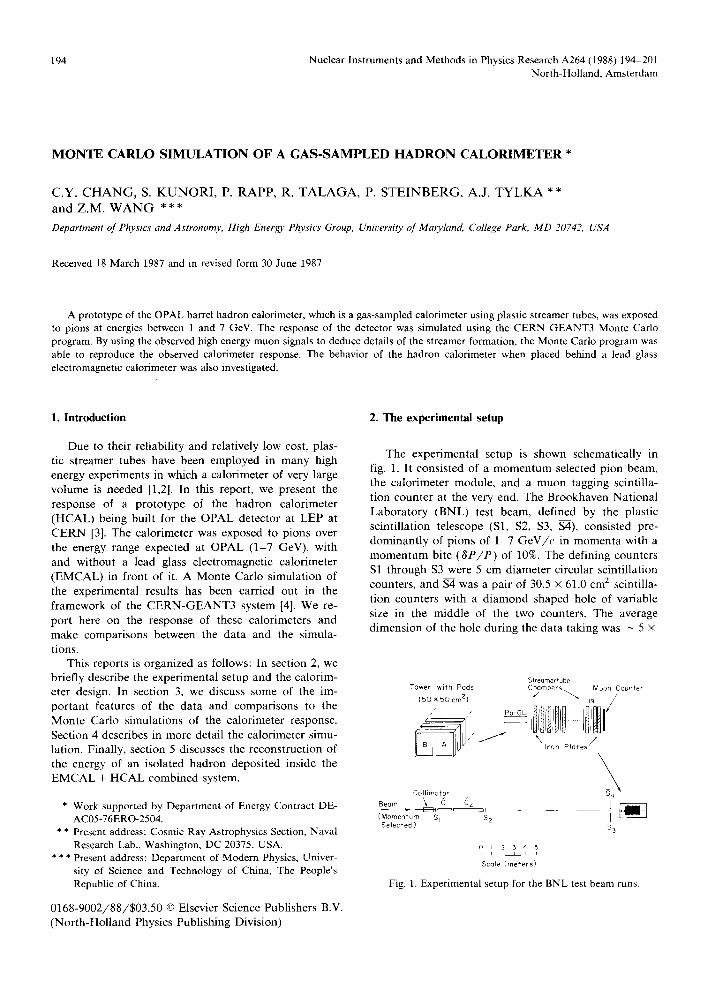
The exper imenta l setup is shown schematically in fig. 1. I t consisted of a m o m e n t u m selected pion beam, the calor imeter module, and a muon tagging scintilla- t ion counter at the very end. The Brookhaven Nat iona l Labora to ry (BNL) test beam, defined by the plastic scint i l lat ion telescope (S1, $2, $3, $4), consisted pre- dominan t ly of p ions of 1 - 7 G e V / c in m o m e n t a with a m o m e n t u m bite ( 6 P / P ) of 10%. The defining counters S1 through $3 were 5 cm d iameter circular scinti l lat ion counters, and S-4 was a pair of 30.5 X 61.0 cm 2 scintilla- t ion counters with a d i amond shaped hole of variable size in the middle of the two counters. The average d imens ion of the hole dur ing the data taking was - 5 x
Tower with Pads (50 x 50 cm 2 )
~ I Pb GL
Collimator Beam \ Ci C2
(Momentum S I S 2 Selected )
0 I 2 3 4 5 i r i i J r ScaFe (meters)
Streamertube Chambers Muon Counter
11101 ..... lilt" ~lron Plates ~ '
S 3
Fig. 1. Experimental setup for the BNL test beam runs.
C Y. Chang et al. / Monte Carlo simulation o fa hadron calorimeter 195
5 cm 2. Two Cherenkov counters I~1 and (~2, filled respectively with air and CO 2 at 1 a tm pressure, were used to identify the electrons in the p ion b e a m at m o m e n t a below 6 G e V / c .
The had ron calorimeter (HCAL) consisted of eigh- teen i ron plates each 5 cm thick. In f ront of the first p la te and sandwiched between each pair of the plates, there was a p lane of plastic s t reamer tubes in an array measur ing 50 × 100 cm 2. The chamber tubes had a cell size of 1 × 1 cm 2 and were covered with plastic top plates. All four inner walls of the tubes were coated with graphi te so tha t the efficiency plateau for the sa tura ted s t reamer mode started at - 4 . 1 . kV. (Note tha t when only three walls are graphite-coated, as is generally done, the pla teau begins at about 4.25 kV [5].) Since we had no access to the control of the BNL test b e a m intensity, which is very high, the chambers were ordinar i ly f looded with too many beam particles (>_ 1 MHz). In order to reduce the current d rawn by the chambers to a negligible level, only 4.2 kV of high voltage was applied to the anode wires of the chambers . The charge avalanche in the s t reamer tube, due to the passage of charged particles, induced an image charge on the (double sided) pickup pads external to the s t reamber tubes. The pads had the same size as the chambers and they were summed together into two towers (referred to as tower A and tower B as shown in fig. 1). Each tower thus consisted of n ineteen 50 × 50 cm 2 pads. In this experiment , the induced charge on each individual pad in each tower was separately re- corded by its own LeCroy 2249 ADC. However, for the last 4 chambers , chambers 16 and 18 and chambers 17 and 19, the pads were added together, thereby el iminat- ing four ADCs. The chamber gas was a 1 : 3 a rgon- i so - b u t a n e mixture at 1 a tm pressure.
Table 1 Composition and optical properties of the lead glass blocks
Type of lead glass F8 Dimensions 10 x 10 × 42 cm 3 Absorption length a~ 42 cm Radiation length 3.02 cm Weight of a module 20 kg Wrapping thickness 1.0 mm Photocathode diameter 70 mm Number of phototube stages 12 Energy resolution (fwhm) 0.03 ± 0.15/v/E
Composition: SiO 2 0.46 PbO 0.45 K20 0.04 Na20 0.05
a) According to our observation (fig. 7), we feel that the lead glass blocks (F8) used in this test beam experiment may have an absorption length of 37 cm.
The electromagnetic calorimeter (EMCAL) consisted of a square array of nine lead glass blocks. Each block was 1 0 × 10 cm 2 in cross section and 42 cm deep, cor responding to approximate ly 14 radia t ion lengths. Each lead glass block was viewed by its own pho tomul - tiplier tube. More details abou t the composi t ion and optical propert ies of the lead glass are summarized in table 1.
The m u o n identif ier consisted of an extra 10 cm of i ron followed by a scinti l lat ion counter located beh ind the calor imeter module.
3. The experimental data
The test beam da ta were taken in two separate groups of runs: the bare HCAL, and the E M C A L + H C A L runs. In the bare H C A L runs, pions of momen ta 1, 2, 5 and 7 G e V / c were normal ly incident onto the bare had ron calorimeter. The beam was focused on to a spot at slightly off the center of tower A. For the combined run, the E M C A L was placed in front of the HCAL. Beams at 2 G e V / c enriched with electrons were first used to cal ibrate the lead glass. Da ta f rom pions of m o m e n t a 2, 3, 5 and 7 G e V / c were then collected to s tudy the E M C A L response. Typically a few thousand events were accumulated for each run (see table 2).
Parameters character iz ing the runn ing condi t ions were wri t ten on magnet ic tape, together with the con- tents of the A D C s which recorded the charge ou tpu t of the pads and the towers, and the pulse heights of the photomul t ip l iers of the lead glass counters. The signal of the muon counter was tagged as a y e s / n o bi t in the event in format ion record.
We analyzed the response of the H C A L in two ways. By summing the signals f rom all 19 chambers , we sampled the hadronic shower at 5 cm intervals. We also summed the response of the odd-numbered chambers
Table 2 Summary of the test beam data
E [GeV] Number of events (ADC) HeAL [channels] (after muon (excluding chamber 1) substraction)
7r- on bare HCAL 1 3010 61.9 + 1.1 2 1774 116.2+2.2 5 1843 274.3 + 3.6 7 2952 379.8 + 3.8
~-- on EMCAL + HCAL 2 3017 34_+ 66 3 4758 51 _+ 89 5 8364 113 + 146 7 3861 169_+ 201
196 C.Y. Chang et al. / Monte Carlo simulation of a hadron calorimeter
400
8 3oo
g 200
I00
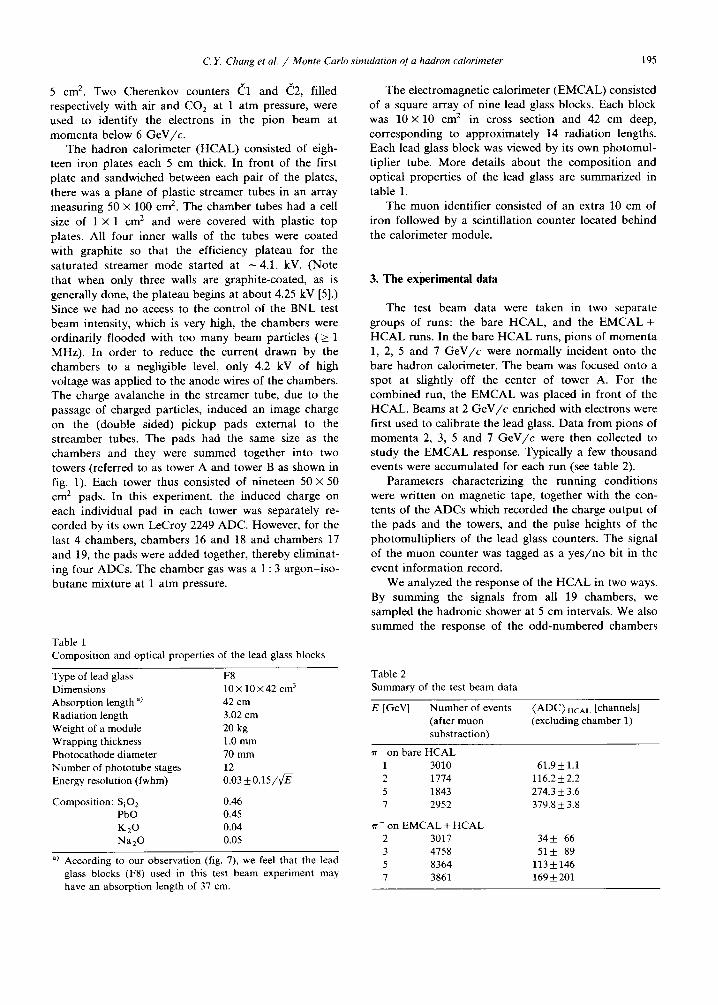
- - Linear fit to data
. . . . MC Prediction
5 cm Samplings
H C A L corresponds to 142 MeV hadronic energy de- posited in the calorimeter or 1.9 pC/ s t r eamer at normal incidence. This number and its rms deviation have been used in the subsequent Monte Carlo simulations.
Fig. 3 shows the shower profiles in the H C A L along the beam direction. Due to the random background caused by the beam halo, the response of chamber 1 (in front of the HCAL) was very often unstable. We have therefore omitted chamber 1 in the subsequent analyses for the bare H C A L data.
The energy resolution obtained with 5 cm iron plates sampling is shown in fig. 4. The solid curve superim- posed on the data points corresponds to the Monte Carlo predicted a / E , where o is one rms deviation from the mean of the observed spectrum, and E is the energy of the incident pion beam in GeV. The dashed curve represents the Monte Carlo prediction of the energy resolution of the calorimeter due to the fluctua- tion of the number of shower secondaries crossing the chambers for an incident beam particle with 10% momentum spread. If the resolution of the H C A L is
r ~ J J I I I l I I I
2 3 4 5 6 7 8 9
Pion Beam Energy (GeV)
Fig. 2. The average responses of HCAL to single particle pion beams. The data points shown in the figure correspond to the 5 cm (dots) and 10 cm (triangles) samplings respectively. The curves superimposed on the data points are the results from a linear fit to corresponding data points. The square point with error bar at 5 GeV is the average HCAL response and its rms
to 5 GeV muons with 5 cm sampling.
only, so as to sample at 10 cm intervals just as will be done in the OPAL hadron calorimeter.
Fig. 2 shows the linearity of the bare H C A L re- sponse to the pions for both 5 and 10 cm samplings, and it indicates no energy saturation at these energies. The solid lines in fig. 2 show the curves best fitted to the data points. The slopes of these lines convert the A D C channels to the equivalent measured energies of the incident particles in GeV. For instance, using the 5 cm sampling data, a linear fit to the data points yields ( A D C ) = 5 3 E + 9 with a reduced X 2 of x 2 / N D F = 0.143, where N D F = 2 is the number of degrees of freedom. It indicates that we have 53 A D C - c h a n n e l s / GeV, which corresponds to an equivalent of 13.5 p C / G e V . Similarly, with 10 cm sampling we obtain 25 ADC-channe l s /GeV or 6.3 p C / G e V in the HCAL. In fig. 2, we also show the average pulse height of the 5 GeV muons in the 5 cm sampling runs. Since there are 19 chambers, a 5 GeV muon at normal incidence should have produced 19 streamers in HCAL, which is equiv- alent to the energy deposit in H C A L by a 2.7 GeV pion. We conclude that each hit or streamer measured in
I00
0
(..)
g E
I00
8
6 o 10,
g
, i i , p F , , , i , , ,
(a) I GeV
x DATA MC Prediction
2 GeV
X
x
i i
x
X X
2 6 8 I0 I
Chamber No.
X
I *
(b)
X
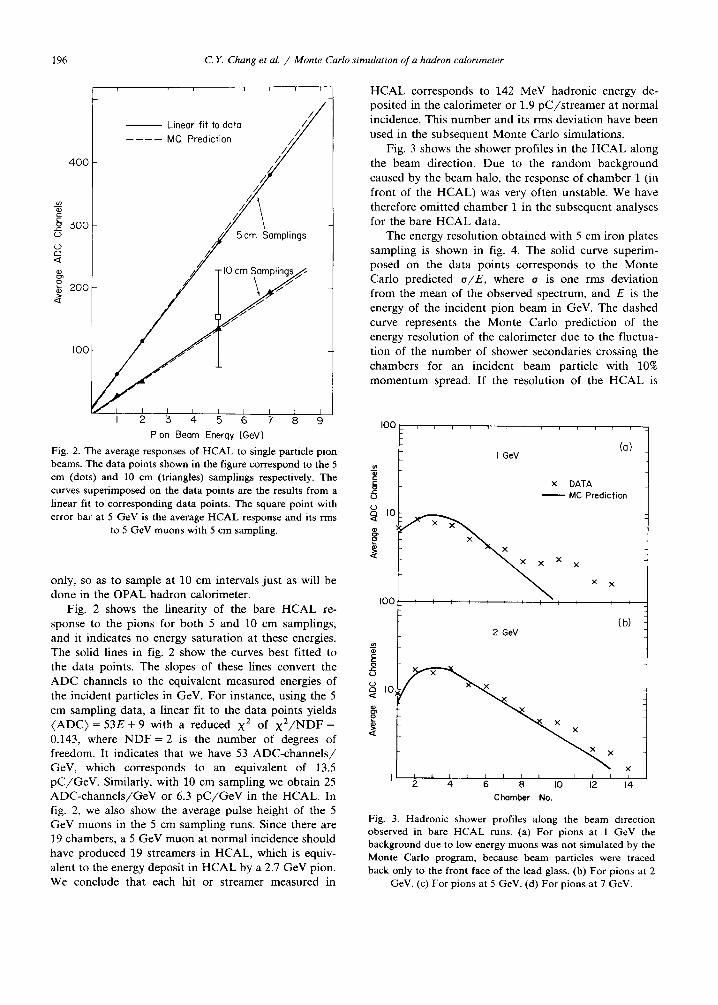
Fig. 3. Hadronic shower profiles along the beam direction observed in bare HCAL runs. (a) For pions at 1 GeV the background due to low energy muons was not simulated by the Monte Carlo program, because beam particles were traced back only to the front face of the lead glass. (b) For pions at 2
GeV. (c) For pions at 5 GeV. (d) For pions at 7 GeV.
C.Y. Chang et al. / Monte Carlo simulation of a hadron calorimeter 197
[ 0 0 } _ ~ , , ~ , , , , ~ , , i i
F I 5 GeV (C)
I00 I i I I I t I I 1 I P I I
7 GeV (d)
u~ x x x )., (_) c~ Io
2 4 6 B I0 12 14
C h a m b e r No.
Fig. 3 (continued)•
120
I00
75
blw
0
5O
25
i [ i 1 i i r
~k • Dal-a ~ MC ( F u l l E f f e c t )
_\\\\ , , x . \ ~ """ ~ ~ ~ ~ a r i e s on ly )
I J I I I I I I 2 5 4 5 G 7
E beam (GeV)
Fig. 4. Energy resolutions for HCAL to single particle beam of pions.
4.0
~ 3.0
w 2.0
uJ ~ I.O 0
0.0
.~,,? . , ..
'i~:;~: : ' ~ - ¢o) Do~o "~-~;::..~..~. '
0 O. 5. I0. 15.
ii;ii • i?-.L .. • (b) MC
" ~ L ~ : ' . " • ~ . ~,
!'L~[.!/: ? :
O. 5. I0. 15.
Observed H C A L Energy (GeV)
IBO0 f
>
1200 I
ooo I
R (c) Oolo
400 -5 5 10
HCAL (GeV)
~00
500
¢00
300
I i 200
I 100
I 15 5
(d) MC
0 5 I0 15 HCAL (GeV)
Fig. 5. Energy measured by lead glass vs that by HCAL. (a) For 5 GeV pion data. (b) The Monte Carlo simulated results.
(c, d) are the corresponding projections on the HCAL axis.
parametrized as o / E = ( A / f E + B ) % , the data and the curves may be described as follows:
data and full effect
MC: o / E = ( 8 9 / v r E - + 21)%; shower fluctuation and beam spread
M C only: o / E = ( 5 1 / v ~ + 21)%.
We have thus demonstrated that the bare H C A L is satisfactory in its l inearity and that its energy resolution includes both the f luctuations of the showering par- ticles, beam spread, and other sources, which we shall discuss in detail in section 4. We now turn to the response of the combined E M C A L and HCAL.
Fig. 5a shows a scatter plot of the response of the lead glass versus that of the H C A L to 5 G e V pions. O n e of the most striking features of the distribution is the sharp horizontal band corresponding to E~m = 400 Mev. This feature is evidently due to pions penetrating the lead glass without inelastic col l is ions and hence deposit- ing virtually all of their energy in the HCAL. About
198 C.Y. Chang et al. / Monte Carlo simulation of a hadron calorimeter
6 o e3
IOOI 5 GeV
-- . . .
•, x DATA "~ MC Prediction x '~ ,x
I i IOI i 201 i 510 L 401 J 501 i 6JO i Cm of Iron
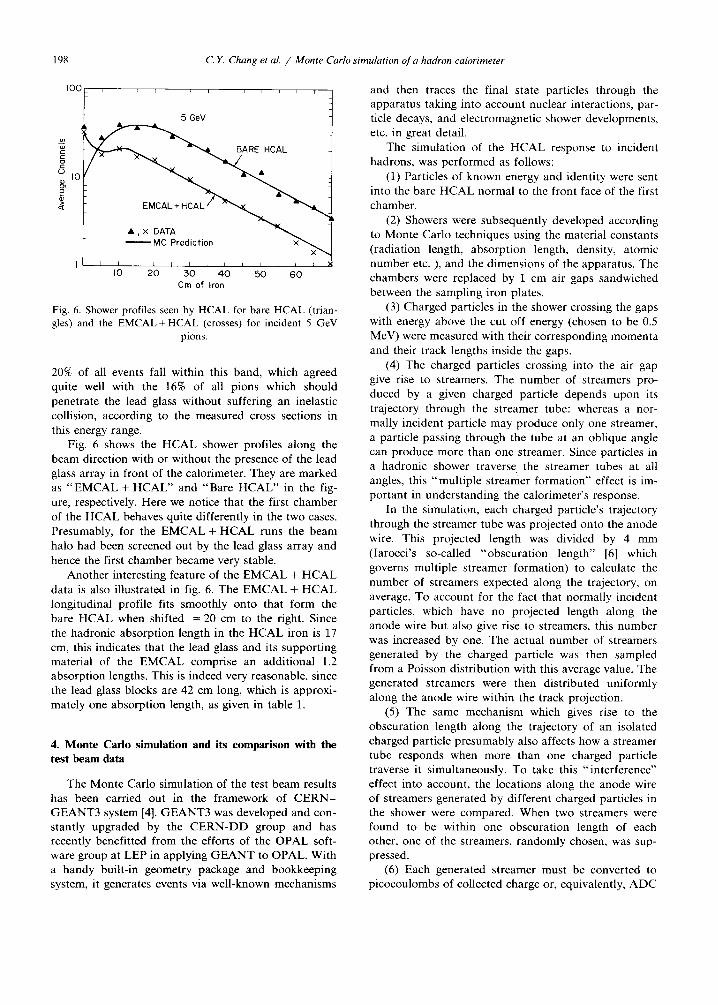
Fig. 6. Shower profiles seen by HCAL for bare HCAL (trian- gles) and the EMCAL+ HCAL (crosses) for incident 5 GeV
pions.
20% of all events fall within this band, which agreed quite well with the 16% of all pions which should penetrate the lead glass without suffering an inelastic collision, according to the measured cross sections in this energy range.
Fig. 6 shows the H C A L shower profiles along the beam direction with or without the presence of the lead glass array in front of the calorimeter. They are marked as " E M C A L + H C A L " and "Bare H C A L " in the fig- ure, respectively. Here we notice that the first chamber of the H C A L behaves quite differently in the two cases. Presumably, for the E M C A L + H C A L runs the beam halo had been screened out by the lead glass array and hence the first chamber became very stable.
Another interesting feature of the E M C A L + H C A L data is also illustrated in fig. 6. The E M C A L + H C A L longitudinal profile fits smoothly onto that form the bare H C A L when shifted = 20 cm to the right. Since the hadronic absorption length in the H C A L iron is 17 cm, this indicates that the lead glass and its supporting material of the E M C A L comprise an additional 1.2 absorption lengths. This is indeed very reasonable, since the lead glass blocks are 42 cm long, which is approxi- mately one absorption length, as given in table 1.
4. Monte Carlo simulation and its comparison with the test beam data
The Monte Carlo simulation of the test beam results has been carried out in the framework of C E R N - GEANT3 system [4]. G E A N T 3 was developed and con- stantly upgraded by the C E R N - D D group and has recently benefitted from the efforts of the OPAL soft- ware group at LEP in applying G E A N T to OPAL. With a handy built-in geometry package and bookkeeping system, it generates events via well-known mechanisms
and then traces the final state particles through the apparatus taking into account nuclear interactions, par- ticle decays, and electromagnetic shower developments, etc. in great detail.
The simulation of the H C A L response to incident hadrons, was performed as follows:
(1) Particles of known energy and identity were sent into the bare H C A L normal to the front face of the first chamber.
(2) Showers were subsequently developed according to Monte Carlo techniques using the material constants (radiation length, absorption length, density, atomic number etc. ), and the dimensions of the apparatus. The chambers were replaced by 1 cm air gaps sandwiched between the sampling iron plates.
(3) Charged particles in the shower crossing the gaps with energy above the cut off energy (chosen to be 0.5 MeV) were measured with their corresponding momenta and their track lengths inside the gaps.
(4) The charged particles crossing into the air gap give rise to streamers. The number of streamers pro- duced by a given charged particle depends upon its trajectory through the streamer tube: whereas a nor- mally incident particle may produce only one streamer, a particle passing through the tube at an oblique angle can produce more than one streamer. Since particles in a hadronic shower traverse the streamer tubes at all angles, this "mul t ip le streamer formation" effect is im- portant in understanding the calorimeter 's response.
In the simulation, each charged particle's trajectory through the streamer tube was projected onto the anode wire. This projected length was divided by 4 mm (Iarocci's so-called "obscurat ion length" [6] which governs multiple streamer formation) to calculate the number of streamers expected along the trajectory, on average. To account for the fact that normally incident particles, which have no projected length along the anode wire but also give rise to streamers, this number was increased by one. The actual number of streamers generated by the charged particle was then sampled from a Poisson distribution with this average value. The generated streamers were then distributed uniformly along the anode wire within the track projection.
(5) The same mechanism which gives rise to the obscuration length along the trajectory of an isolated charged particle presumably also affects how a streamer tube responds when more than one charged particle traverse it simultaneously. To take this " interference" effect into account, the locations along the anode wire of streamers generated by different charged particles in the shower were compared. When two streamers were found to be within one obscuration length of each other, one of the streamers, randomly chosen, was sup- pressed.
(6) Each generated streamer must be converted to picocoulombs of collected charge or, equivalently, A D C
C. Y. Chang et aL / Monte Carlo simulation of a hadron calorimeter 199
counts. The distribution of charge per streamer was deduced from the 5 GeV muon events.
(7) Finally, the summed ADC for each chamber was smeared according to the observed spectra of the pedestals. This final step took care of fluctuations con- tributed from electronic and environmental noise in the experiment.
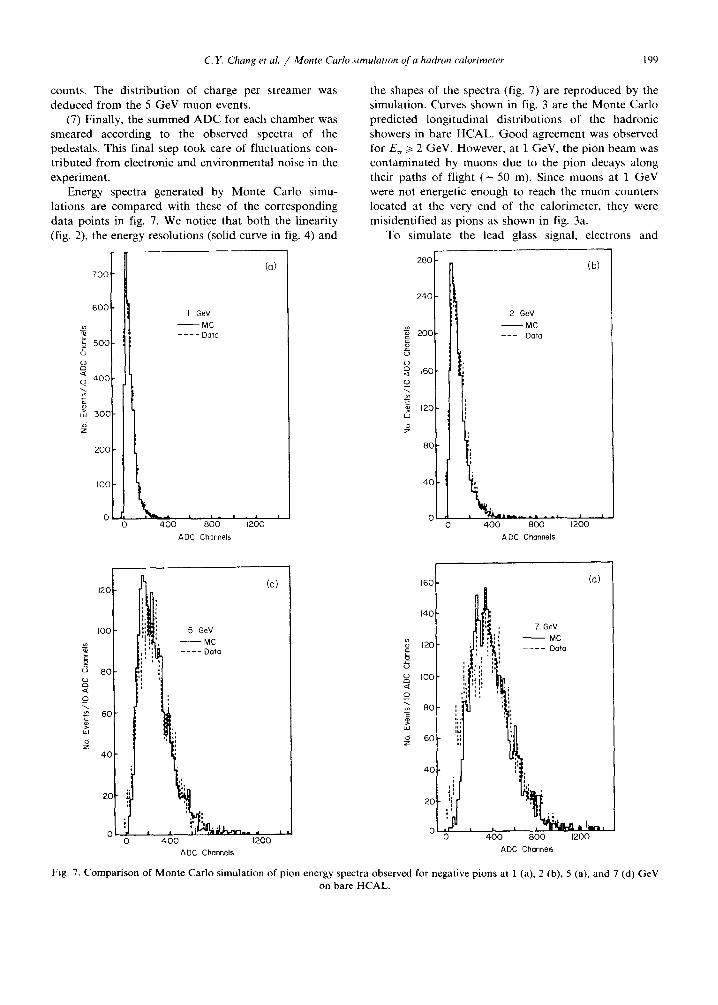
Energy spectra generated by Monte Carlo simu- lations are compared with these of the corresponding data points in fig. 7. We notice that both the linearity (fig. 2), the energy resolutions (solid curve in fig. 4) and
l ., - -MC . . . . Dola
500
<
~ ~ 3 ° ° I I l
2 ° ° I t t '°°I] \_ O 4 0 0 800 1200
ADC Channels
the shapes of the spectra (fig. 7) are reproduced by the simulation. Curves shown in fig, 3 are the Monte Carlo predicted longitudinal distributions of the hadronic showers in bare H C A L Good agreement was observed for E~ >~ 2 GeV. However, at 1 GeV, the pion beam was contaminated by muons due to the pion decays along their paths of flight ( - 50 m). Since muons at 1 GeV were not energetic enough to reach the muon counters located at the very end of the calorimeter, they were misidentified as pions as shown in fig. 3a.
To simulate the lead glass signal, electrons and
2 8 0 i /b/
2401-
~t 2 GeV - - - M C
200
6
160 o
*E >~ 12o t.d
80
4O
0 0 4 0 0 800 1200
A DC Channels
IOO
80
60 i
40
20
0 I o
12c (c)
° . . . . D a t a
'"ii ,
;, ,~ ~ . . , ,
4 0 0 1200 ADC Channels
160
140
=~ 12o 8 6
ioo
o
80
60
40
2c
:!
o
,, 7 GeV ;', MC
; , , , i , ~ . . . . Data l
,,
|
4 0 0 800
ADC Channels
(d)
i~ t i . t -a ,
1200
Fig. 7. Comparison of Monte Carlo simulation of pion energy spectra observed for negative pions at 1 (a), 2 (b), 5 (a), and 7 (d) GeV on bare HCAL.
200 C. Y. Chang et al. / Monte Carlo simulation of a hadron calorimeter
positrons down to their threshold energy (121 keV kinetic energy) were tracked through the glass. The tracking processes were done by GEANT, which in- cludes bremsstrahlung, pair production, Compton scattering, photoelectric effect, MSller and Bhabha scattering, e + e - annihilation, Coulomb multiple scatter- ing and ionization energy losses. Subsequently, for each step of a charged particle with B > 1 / n , photoelectrons were generated, where fl is the velocity of the particle divided by speed of light, and n is the index of refrac- tion of the lead glass. To do this, the high energy muon going through lead glass pieces at different angles and positions relative to the block axis were used to obtain the number of photoelectrons measured by the photo- multipliers. An empirical parametrization of these processes was developed and adopted [7]. Fig. 5b shows the simulated response of E M C A L + H C A L to 5 GeV pions. The corresponding scatter plot for the data is shown in fig. 5a, and their H C A L projections are also shown in figs. 5c and d. The most important features of the combined-calorimeter responses are satisfactorily reproduced by the Monte Carlo simulations.
5. Measurement of hadronic energy with the combined calorimeter
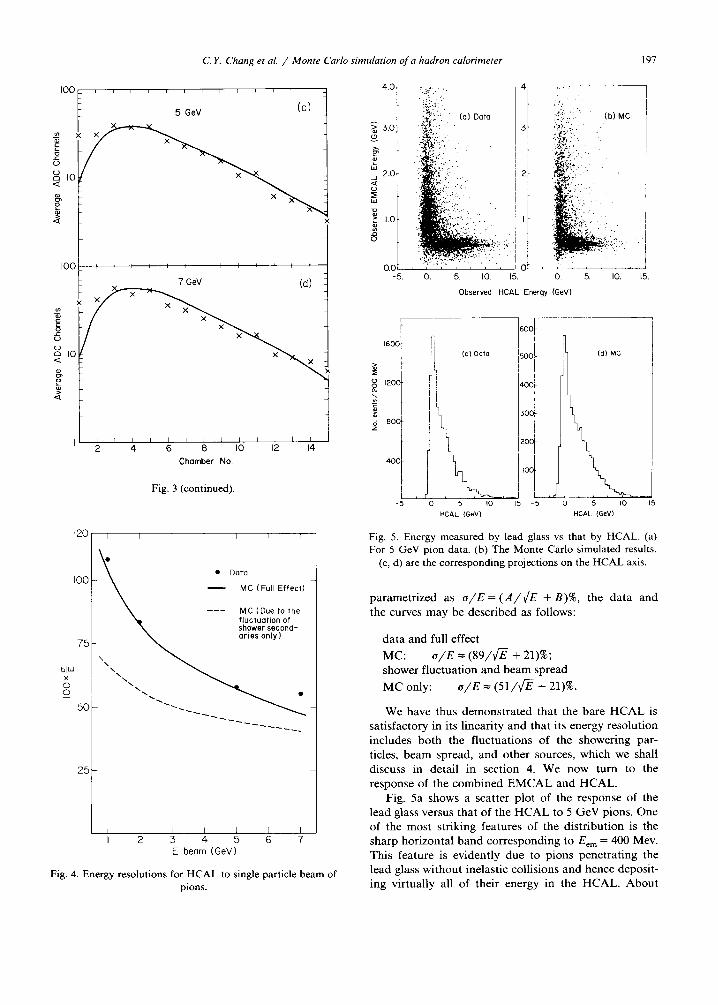
Lead glass is sensitive only to the Cherenkov light generated by fast moving charged particles. It is there- fore insensitive to the slow moving nucleon fragments in the hadronic showers, and thus provides a poor calorimeter for measuring hadronic energy at high en- ergies. However, at low energies the hadronic shower development is limited in the first few interaction lengths of the calorimeter, resulting in a poor energy resolution for a bare H C A L due to the lack of calorimetry sam- plings. Since lead glass can always measure the electro-
600
>~ 500
" - 400
500
2O0
I00
- I
o 5 ,'o ,; Ereconstructe d (6eV)
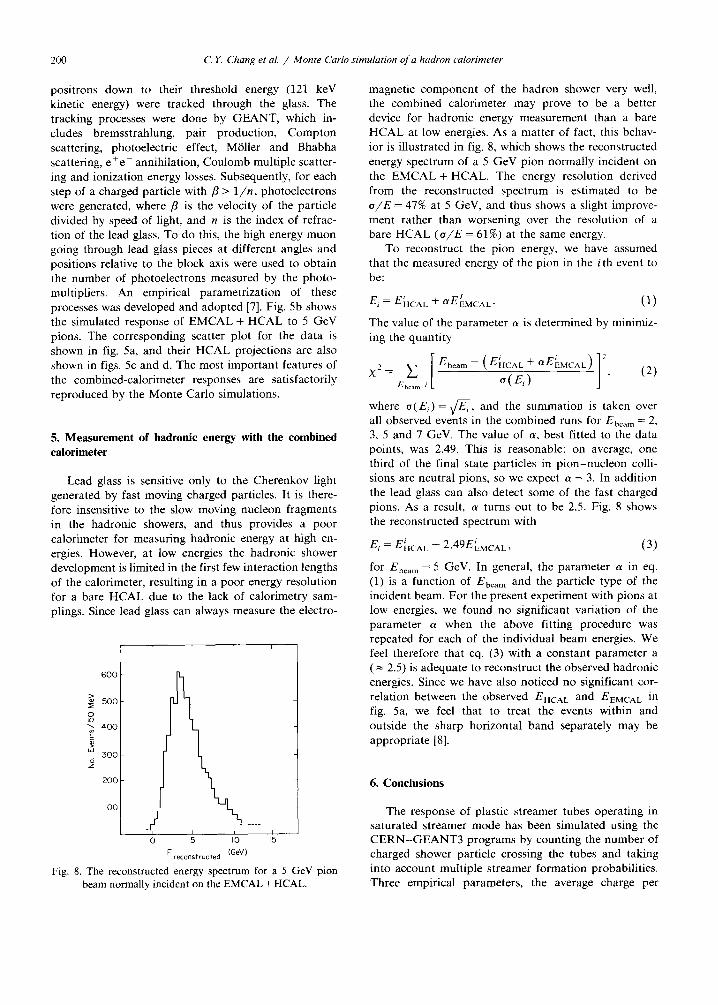
Fig. 8. The reconstructed energy spectrum for a 5 GeV pion beam normally incident on the EMCAL + HCAL.
magnetic component of the hadron shower very well, the combined calorimeter may prove to be a better device for hadronic energy measurement than a bare H C A L at low energies. As a matter of fact, this behav- ior is illustrated in fig. 8, which shows the reconstructed energy spectrum of a 5 GeV pion normally incident on the E M C A L + HCAL. The energy resolution derived from the reconstructed spectrum is estimated to be o / E = 47% at 5 GeV, and thus shows a slight improve- ment rather than worsening over the resolution of a bare H C A L ( o / E = 61%) at the same energy.
To reconstruct the pion energy, we have assumed that the measured energy of the pion in the i th event to be:
l l E i = EHCAL + a E E M c A L. (1)
The value of the parameter a is determined by minimiz- ing the quanti ty
where o ( E , ) = 7;~- ~ , and the summation is taken over all observed events in the combined runs for Ebeam = 2, 3, 5 and 7 GeV. The value of a, best fitted to the data points, was 2.49. This is reasonable: on average, one third of the final state particles in p ion-nuc leon colli- sions are neutral pions, so we expect a = 3. In addition the lead glass can also detect some of the fast charged pions. As a result, a turns out to be 2.5. Fig. 8 shows the reconstructed spectrum with
_ _ i i E i - EHCAL + 2 .4 9 EEMCAL, (3)
for Ebeam = 5 GeV. In general, the parameter a in eq. (1) is a function of Ebeam and the particle type of the incident beam. For the present experiment with pions at low energies, we found no significant variation of the parameter a when the above fitting procedure was repeated for each of the individual beam energies. We feel therefore that eq. (3) with a constant parameter a ( = 2.5) is adequate to reconstruct the observed hadronic energies. Since we have also noticed no significant cor- relation between the observed EHCAL and EEMCA L in fig. 5a, we feel that to treat the events within and outside the sharp horizontal band separately may be appropriate [8].
6. Conclusions
The response of plastic streamer tubes operating in saturated streamer mode has been simulated using the C E R N - G E A N T 3 programs by counting the number of charged shower particle crossing the tubes and taking into account multiple streamer formation probabilities. Three empirical parameters, the average charge per
C. Y. Chang et al. / Monte Carlo simulation of a hadron calorimeter 201
streamer induced on the pads, the corresponding rms deviation of charge per streamer, and the obscuration length which governs multiple streamer formation are most essential to the simulation. These parameters are obtainable from the analysis of the high energy muon spectra at normal and large angle incidence. The param- eters depend on the experimental setup and the oper- ating conditions of the chambers. Our simulation shows satisfactory agreement with the test beam data. For a combined calorimeter with lead glass and HCAL, we found that a linear combination of the two responses improves the hadronic energy resolution, at least over a limited energy range.
Acknowledgements
We would like to thank Dr. T.A. Gabriel of Oak Ridge National Laboratory, Dr. Rene Brun of CERN, and Professors Gus Zorn, G.A. Snow and R.G. Glasser of the high energy physics group at the University of Maryland for valuable discussions. We thank Brookha- ven National Laboratory for providing us with the test
beam, facilities, and the assistance of its personnel. We also thank Prof. V. Glebov et al. of the Insitute for High Energy Physics, Serpukov, USSR, for lending us the lead glass blocks used in this experiment.
References
[1] G. Battistoni et al., Phys. Lett. Bl18 (1982) 461; G. Bat- tistoni et al., Nucl. Instr. and Meth. 202 (1982) 459.
[2] G. Bauer et al., Nucl. Instr. and meth. A253 (1987) 179; R. Baldini et al., Nucl. Instr. and Meth. A251 (1986) 449.
[3] OPAL Technical Proposal, CERN/LEPC/83-4, unpub- lished; Simulation of the OPAL Hadron Calorimeter, CERN/LEPC/85-8 (7 March, 1985) unpublished; A.A. Carter et al., Nucl. Instr. and Meth. A250 (1986) 503.
[4] R. Brunet al., GEANT3, CERN DD/EE/84-1, unpub- lished.
[5] See for instance: M.Q. Catanesi et al., Nucl. Instr. and Meth. A247 (1986) 438.
[6] E. Iarocci, Nucl. Instr. and Meth. 217 (1983) 30. [7] D.R. Ward et al., private communication. [8] C.Y. Chang, Workshop on Shower Simulation for LEP
Experiments, part 2, CERN (1985) unpublished.