monitoring the activities of the eu platform for action on ... · monitoring the activities of the...
TRANSCRIPT

Written by ICF Consulting Services Ltd
May 2016
Monitoring the activities of the EU Platform for Action on
Diet, Physical Activity and Health
Annexes 1-3 to Annual Monitoring Report 2016

EUROPEAN COMMISSION
Directorate-General for Health and Food Safety
Directorate C — Public Health
Unit C4 — Health Determinants and inequality
Contact: Artur Furtado
E-mail: [email protected]
European Commission

Monitoring the activities of the EU Platform for Action on Diet, Physical Activity and Health – Annexes 1-3
May, 2016 3
Table of Contents
Annex 1: Analysis of Platform commitments 2015 by activity type ........................... 4 1 Marketing and advertising ............................................................................. 5
1.1 Design and intent of action ..................................................................... 7 1.2 Implementation and results ...................................................................12 1.3 Overall assessment of the quality of reporting ..........................................17 1.4 Synergies, joint commitments and transferability .....................................18 1.5 Conclusions and recommendations .........................................................19
2 Composition of foods (reformulation), availability of healthy food options and
portion sizes ....................................................................................................22
2.1 Design and intent of action ....................................................................24 2.2 Implementation and results ...................................................................28 2.3 Overall assessment of the quality of reporting ..........................................34 2.4 Synergies, joint commitments and transferability .....................................34 2.5 Conclusions and recommendations .........................................................36
3 Consumer information, including labelling ......................................................39
3.1 Design and intent of action ....................................................................41 3.2 Implementation and results ...................................................................45 3.3 Overall assessment of the quality of reporting ..........................................52 3.4 Synergies, joint commitments and transferability .....................................52 3.5 Conclusions and recommendations .........................................................54
4 Education, including lifestyle modification ......................................................56
4.1 Design and intent of action ....................................................................59 4.2 Implementation and results ...................................................................63 4.3 Overall assessment ..............................................................................69 4.4 Synergies, joint commitments and transferability .....................................70 4.5 Conclusions and recommendations .........................................................71
5 Physical activity promotion ...........................................................................73
5.1 Design and intent of action ....................................................................75 5.2 Implementation and results ...................................................................80 5.3 Overall assessment of the quality of reporting ..........................................87 5.4 Synergies, joint commitments and transferability .....................................88 5.5 Conclusions and recommendations .........................................................89
6 Advocacy and information exchange ..............................................................92
6.1 Design and intent of action ....................................................................94 6.2 Implementation and results ...................................................................99 6.3 Overall assessment of the quality of reporting ........................................ 105 6.4 Synergies, joint commitments and transferability ................................... 106 6.5 Conclusions and recommendations ....................................................... 107
Annex 2: Platform commitments 2015 by status ................................................. 110 Annex 3: Breakdown of commitments 2015 per activity type ............................... 124

Monitoring the activities of the EU Platform for Action on Diet, Physical Activity and Health – Annexes 1-3
May, 2016 4
Annex 1: Analysis of Platform commitments 2015 by activity
type
This Annex provides an analysis of platform commitment monitoring reports submitted
for 2015 by activity type. It is broken down as follows:
1. Marketing and advertising;
2. Composition of foods (reformulation), availability of healthy food options,
portion sizes;
3. Consumer information, including labelling;
4. Education, including lifestyle modification;
5. Physical activity promotion; and
6. Advocacy and information exchange.
The section provides a description of the number of actions in each activity type, the
geographical coverage and target audience. Furthermore, an analysis is given on each
of the following areas:
Design and intent of the action;
Implementation and results;
Dissemination;
Additionality;
EU-added value;
Overall assessment; and
Synergies, joint commitments and transferability.
Finally, and on the basis of the above-mentioned analysis, conclusions and
recommendations are made per activity area, in view of further improving the
relevance, monitoring and reporting of commitments in the next annual monitoring
cycle.
Monitoring the activities of the EU Platform for Action on Diet, Physical Activity and Health – Annexes 1-3
May, 2016 5
1 Marketing and advertising
The area of marketing and advertising allows Platform members to put forward
commitments that relate to marketing, media literacy and advertising.
In 2015, 14 commitments in this area were implemented and two were completed
(commitment n°1118, ‘International standards for marketing food to children’, and
n°619, ‘Product development, consumer information, marketing/advertising and the
promotion of healthy lifestyles’). One new commitment was launched, entitled
‘FoodDrinkEurope Framework for commitments – responsible marketing and
advertising’ (commitment n°1711). This initiative aims at encouraging
FoodDrinkEurope members to propose new commitments in this activity area and to
support them in the implementation and monitoring.
As can be observed in the table below, 12 commitments in this activity area are being
implemented by industry and industry representations, and two by non-for profit
organisations (Confederation of Family Organisations in the European Union (COFACE)
and IASO/World Obesity Federation).
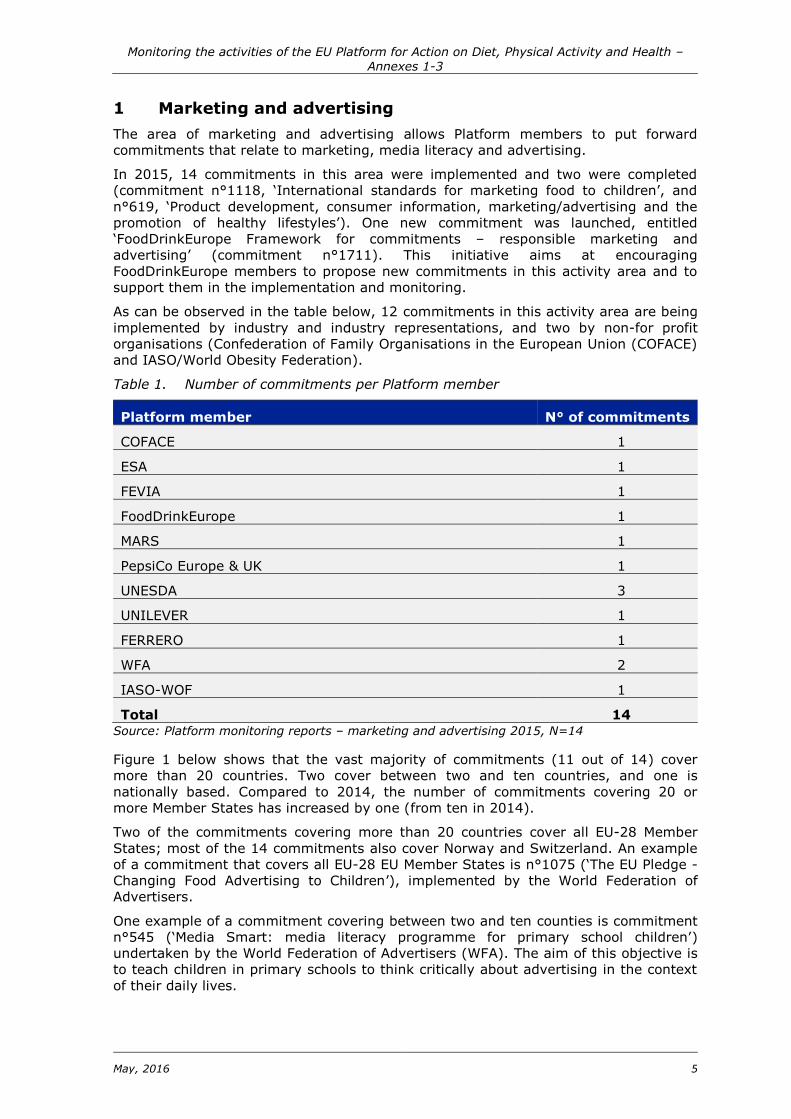
Table 1. Number of commitments per Platform member
Platform member N° of commitments
COFACE 1
ESA 1
FEVIA 1
FoodDrinkEurope 1
MARS 1
PepsiCo Europe & UK 1
UNESDA 3
UNILEVER 1
FERRERO 1
WFA 2
IASO-WOF 1
Total 14 Source: Platform monitoring reports – marketing and advertising 2015, N=14
Figure 1 below shows that the vast majority of commitments (11 out of 14) cover
more than 20 countries. Two cover between two and ten countries, and one is
nationally based. Compared to 2014, the number of commitments covering 20 or
more Member States has increased by one (from ten in 2014).
Two of the commitments covering more than 20 countries cover all EU-28 Member
States; most of the 14 commitments also cover Norway and Switzerland. An example
of a commitment that covers all EU-28 EU Member States is n°1075 (‘The EU Pledge -
Changing Food Advertising to Children’), implemented by the World Federation of
Advertisers.
One example of a commitment covering between two and ten counties is commitment
n°545 (‘Media Smart: media literacy programme for primary school children’)
undertaken by the World Federation of Advertisers (WFA). The aim of this objective is
to teach children in primary schools to think critically about advertising in the context
of their daily lives.

Monitoring the activities of the EU Platform for Action on Diet, Physical Activity and Health – Annexes 1-3
May, 2016 6
The nationally based commitment is implemented in Belgium (n°265 - ‘The self-
regulatory code for advertising’). Under this commitment FEVIA works to ensure that
member companies continue to respect the self-regulatory code for advertising
compiled in 2005. Its other objective is to increase the number of companies engaged
in limiting advertising.
Figure 1. Geographic coverage of commitments in the area of marketing and
advertising1
Source: Platform monitoring reports – marketing and advertising 2015, N=14
As illustrated in Figure 2, EU-28 countries were covered by an average of 11 different
marketing and advertising commitments, with most countries covered by either ten or
11 commitments. The countries most covered were Belgium and France (covered by
14 and 13 commitments respectively).
Figure 2. Geographic coverage of commitments in the area of marketing and
advertising
1 The categories 2-5 countries, 6-10 countries and more than 20 countries may count non-Member States (i.e.
Iceland, Norway and/or Switzerland)
11
14
11
10 11
12 11 11
10
12 12 13
3
10 11 11
10 11
10 10
12 11 11 11
10
12
10
12
8
AT
BE
BG CY
CZ
DE
DK EE EL ES FI FR HR
HU IE IT LV LT LU MT
NL
PL
PT
RO SK SE SI UK
Othe…

Monitoring the activities of the EU Platform for Action on Diet, Physical Activity and Health – Annexes 1-3
May, 2016 7
Source: Platform monitoring reports – marketing and advertising 2015, N=14
As shown in Figure 3 below, the most common target audience for commitments in
this activity area was children and young people (seven out of 14), followed by the
general public (four out of 14). The remaining commitments target policy makers,
industry, educators, and parents. None of the commitments set out to target health
professionals, employees or any special groups.
Results were similar in 2014, therefore there has been little change in targeting of
marketing and advertising commitments.
An example of commitment targeting children is n°833 (‘Responsible marketing and
advertising’) undertaken by UNILEVER. This commitment aims at implementing the
company’s marketing and advertising principles, through the independent monitoring
of implementation of the principles, and providing training to ensure understanding of
those principles.
Figure 3. Target audiences of commitments in the area of marketing and advertising
Source: Platform monitoring reports – marketing and advertising 2015, N=14
One of the commitments targeting the general public is entitled ‘Product development,
consumer information, marketing/advertising and the promotion of healthy lifestyles’
(commitment n°619), implemented by PepsiCo Europe & UK. Its aims are:
accelerating the roll-out of healthier snacks, beverages and breakfast cereals;
continuing to build on and strengthen responsible advertising & marketing guidelines;
and promoting healthy lifestyles among employees.
1.1 Design and intent of action
1.1.1 S.M.A.R.T. objectives
Figure 4 below shows that three commitments set fully S.M.A.R.T. objectives, and the
remaining 11 set mostly S.M.A.R.T. objectives. This is an improvement on the
previous year’s commitments, where two commitments had fully, five had mostly and
six had partially S.M.A.R.T. objectives.
The objectives set for 2015 were all specific, achievable and relevant. As with
commitments from 2014, the main issues around setting S.M.A.R.T. objectives relate
to commitments not setting measurable targets or specifying timeframes for taking
actions and achieving objectives (beyond objectives being annual).

Monitoring the activities of the EU Platform for Action on Diet, Physical Activity and Health – Annexes 1-3
May, 2016 8
Figure 4. S.M.A.R.T. objectives
Source: Platform monitoring reports – marketing and advertising 2015, N=14
An example of a commitment with fully S.M.A.R.T. objectives is commitment n°1203
(‘not to market to children under 12 years in the Digisphere’) by UNESDA. This set
targets of specific compliance rates per type of advertising objective and ensured that
an independent organisation audited this compliance.
1.1.2 Relevance of commitments
1.1.2.1 Link to EU Platform and EU policy goals
Similar to 2014, all commitments implemented in 2015 demonstrated relevance to the
Platform, with six of them making an explicit reference to the Platform’s objectives. An
example of this is FoodDrinkEurope’s commitment n°1711 (‘Framework for
commitments – responsible marketing and advertising’), which makes an explicit
reference to the Platform’s objectives of “tackling nutrition challenges, promoting
physical activity and fighting against obesity”. The remaining eight commitments
implicitly demonstrated relevance to the priorities of the Platform. For instance, the
commitment entitled ‘No advertising in cinemas during films aimed at children under
12 years’, by UNESDA, has an implicit link with the Platform’s objective on healthy
nutrition and responsible advertising to children, although does not make an explicit
reference to this objective.

Monitoring the activities of the EU Platform for Action on Diet, Physical Activity and Health – Annexes 1-3
May, 2016 9
Figure 5. Relevance of commitments to Platform priorities
Source: Platform monitoring reports – marketing and advertising 2015, N=14
Exploring the link with EU priorities in the areas of nutrition and physical activity,
Figure 6 below shows that nine commitments had an implicit link and the remaining
five made an explicit link to EU priorities in this policy area.
For instance, the commitment entitled ‘European savoury snacks industry commitment
in the area of marketing and advertising’ (commitment n°1515), from the European
Snacks Association (ESA), makes an explicit reference to the European Commission
White Paper on ‘A Strategy for Europe on Nutrition, Overweight and Obesity related
health issues’ (May 2007).
An example of a commitment with an implicit link with EU priorities is n°1018, ’Mars
Marketing Commitments (MMC)’, which is connected to the EU Action Plan on
Childhood Obesity 2014-2020, although it does not explicitly mention the Action Plan
or its objectives.
Figure 6. Relevance of commitments to wider EU priorities
Source: Platform monitoring reports – marketing and advertising 2015, N=14

Monitoring the activities of the EU Platform for Action on Diet, Physical Activity and Health – Annexes 1-3
May, 2016 10
1.1.2.2 Link to WHO targets
This year a new element of analysis was introduced in the assessment of the
commitment monitoring reports: the link to WHO targets for non-communicable
diseases (NCDs) for 2025. In the area of marketing and advertising, none of the
commitments made an explicit link to these objectives, however some of them had an
implicit link to one or more of the targets, as illustrated in Table 2 below.
One commitment (n°619, ‘Product development, consumer information,
marketing/advertising and the promotion of healthy lifestyles’, by PepsiCo Europe &
UK) had an implicit link with Target 1 (A 25 per cent relative reduction in the overall
mortality from cardiovascular diseases, cancer, diabetes, or chronic respiratory
diseases). It aimed at accelerating the roll-out of healthier snacks, beverages and
breakfast cereals and promoting healthy lifestyles. Five commitments were related to
Target 4 (A 30 per cent relative reduction in mean population intake of salt/sodium)
and 13 commitments had an implicit link with Target 7 (Halt the rise in diabetes and
obesity).
Table 2. Links to WHO targets
Explicit link Implicit link No apparent
link
Target 1: 5% relative reduction in
the overall mortality from
cardiovascular diseases, cancer,
diabetes, or chronic respiratory
diseases
0 1 13
Target 2: At least 10% relative
reduction in the harmful use of
alcohol
0 0 14
Target 3: 10% relative reduction in
prevalence of insufficient physical
activity
0 0 14
Target 4: 30% relative reduction in
mean population intake of
salt/sodium
0 5 9
Target 5: 30% relative reduction in
prevalence of current tobacco use in
persons aged 15+ years
0 0 14
Target 6: 25% relative reduction in
the prevalence of raised blood
pressure or contain the prevalence
of raised blood pressure
0 0 14
Target 7: Halt the rise in diabetes
and obesity
0 13 1
Target 8: At least 50% of eligible
people receive drug therapy and
counselling to prevent heart attacks
and strokes
0 0 14
Target 9: 80% availability of the
affordable basic technologies and
essential medicines, including
generics, required to treat major
0 0 14

Monitoring the activities of the EU Platform for Action on Diet, Physical Activity and Health – Annexes 1-3
May, 2016 11
NCDs
Source: Platform monitoring reports – marketing and advertising 2015, N=14
1.1.3 Actions to reduce health inequalities
Only one commitment out of 14 sets out to reduce health inequalities in the area of
marketing and advertising: commitment n°1118, entitled ‘International standards for
marketing food to children’ and undertaken by the World Obesity Federation. It aims
to assess current evidence on the relationship between promotional marketing and
diet, with a specific focus on health inequalities. The remaining 13 commitments did
not set out to reduce health inequalities.
Figure 7. Commitments set out to reduce health inequalities
Source: Platform monitoring reports – marketing and advertising 2015, N=14
1.1.4 Using evidence in design
Figure 8 below shows that just over half of the commitments in this area (eight out of
14) provided evidence of need in their design (i.e. they referred to facts or studies
that showed the need for action). The remaining six commitments neither referred to
any reports or studies, nor aimed to generate data or information.
Figure 8. Use of evidence in commitment design

Monitoring the activities of the EU Platform for Action on Diet, Physical Activity and Health – Annexes 1-3
May, 2016 12
Source: Platform monitoring reports – marketing and advertising 2015, N=14
One example of a commitment which demonstrated evidence of need is ‘Media Smart,
media literacy programme for primary school children’ (commitment n°545)
implemented by the World Federation of Advertisers. In its report, reference is made
to the European Commission ‘Recommendation on media literacy in the digital
environment for a more competitive audio-visual and content industry and an inclusive
knowledge society’ (August 2009), which highlights the need to increase people’s
awareness of media messages, including advertisements.
This means there has been little change since last year – in 2014, seven commitments
showed evidence of need, two provided evidence of need and of likely effectiveness,
one showed evidence of likely effectiveness only and three did not provide any
information (non-applicable).
1.2 Implementation and results
1.2.1 Level of implementation
Figure 9 shows the level of implementation of the actions. The majority of the
commitments (11 out of 14) were fully implemented. One was mostly implemented
and two were assessed to have been partially implemented. Commitments assessed
as not fully implemented either explicitly stated so, or did not include sufficient
information about outputs and outcomes for commitments to be able to demonstrate
full implementation. Nonetheless, the level of implementation in this activity area
increased from 2014, when seven actions out of 13 were fully implemented.
Figure 9. Level of commitment implementation
Source: Platform monitoring reports – marketing and advertising 2015, N=14
1.2.2 Main inputs reported (human and financial)
In the area of marketing and advertising, the level of information provided on human
and financial resources used to implement the commitments varied considerably.
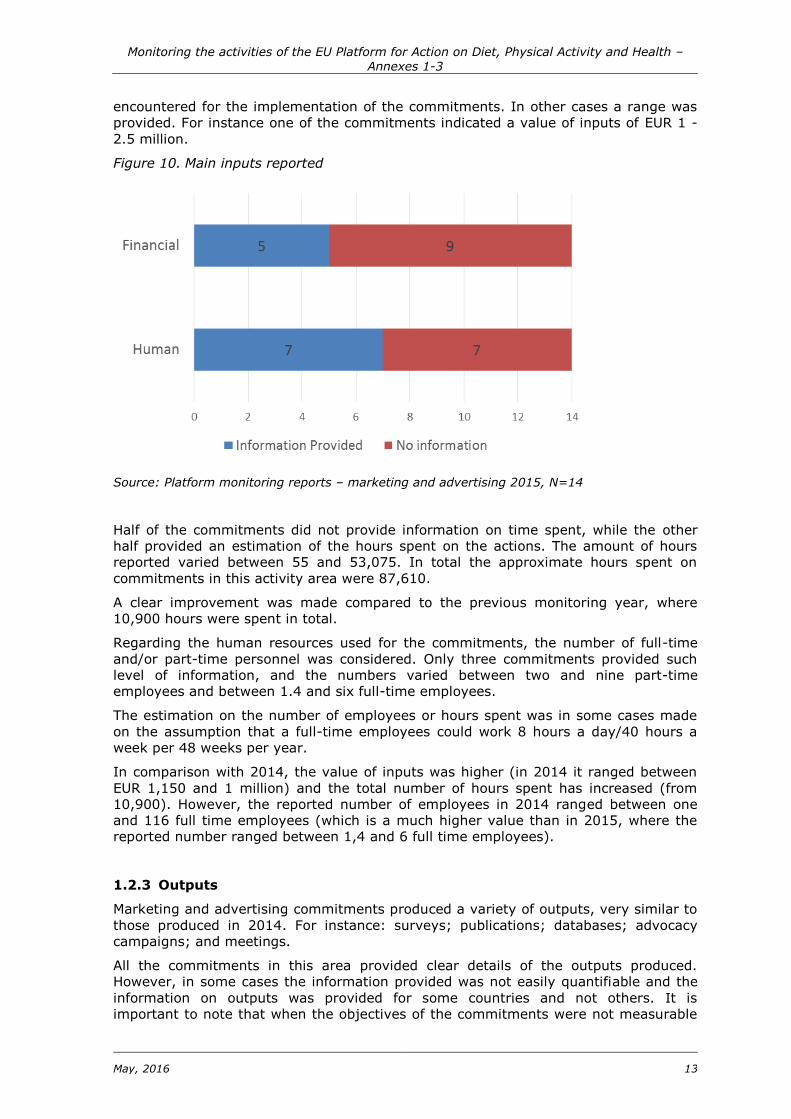
With regards to the financial information provided (Figure 10 below), five
commitments did not provide information on the value of the inputs, while nine
commitments provided relevant information. Compared to 2014 this is an increase in
both financial reporting (up from six out of 13 commitments to nine out of 14) and in
reporting on human resource inputs.
The value of inputs, when indicated, varied between EUR 4,000 and EUR 2.25 million.
However, in some case the value provided included also other costs than the ones
Monitoring the activities of the EU Platform for Action on Diet, Physical Activity and Health – Annexes 1-3
May, 2016 13
encountered for the implementation of the commitments. In other cases a range was
provided. For instance one of the commitments indicated a value of inputs of EUR 1 -
2.5 million.
Figure 10. Main inputs reported
Source: Platform monitoring reports – marketing and advertising 2015, N=14
Half of the commitments did not provide information on time spent, while the other
half provided an estimation of the hours spent on the actions. The amount of hours
reported varied between 55 and 53,075. In total the approximate hours spent on
commitments in this activity area were 87,610.
A clear improvement was made compared to the previous monitoring year, where
10,900 hours were spent in total.
Regarding the human resources used for the commitments, the number of full-time
and/or part-time personnel was considered. Only three commitments provided such
level of information, and the numbers varied between two and nine part-time
employees and between 1.4 and six full-time employees.
The estimation on the number of employees or hours spent was in some cases made
on the assumption that a full-time employees could work 8 hours a day/40 hours a
week per 48 weeks per year.
In comparison with 2014, the value of inputs was higher (in 2014 it ranged between
EUR 1,150 and 1 million) and the total number of hours spent has increased (from
10,900). However, the reported number of employees in 2014 ranged between one
and 116 full time employees (which is a much higher value than in 2015, where the
reported number ranged between 1,4 and 6 full time employees).
1.2.3 Outputs
Marketing and advertising commitments produced a variety of outputs, very similar to
those produced in 2014. For instance: surveys; publications; databases; advocacy
campaigns; and meetings.
All the commitments in this area provided clear details of the outputs produced.
However, in some cases the information provided was not easily quantifiable and the
information on outputs was provided for some countries and not others. It is
important to note that when the objectives of the commitments were not measurable

Monitoring the activities of the EU Platform for Action on Diet, Physical Activity and Health – Annexes 1-3
May, 2016 14
it was less clear for the research team to relate reported outputs with the initial
commitment objectives.
1.2.4 Outcomes and dissemination
In 2015, five out of 14 commitments provided clear details on outcomes. Six provided
minimal details, and three did not provide any information on outcomes.
In general, when minimal details were provided, very little or no quantifiable
information on outcomes was provided. Seven commitments concerning advertising
provided compliance rates of members, with six of them providing the actual
compliance rate achieved. However for three of them it was difficult to evaluate the
success of the actions, given that no compliance rates was mentioned in the annual
objectives (i.e. the objectives were not S.M.A.R.T.). These results were similar to
2014, where the majority of outcomes related to compliance rates.
An example of commitment reporting correctly and in detail on outcomes is n°619
(’Product development, consumer information, marketing/advertising and the
promotion of healthy lifestyles’) implemented by PepsiCo Europe & UK, in which the
outcomes refer to measurable results (e.g. ‘PepsiCo Spain eliminated 98,000 kg salt
across 8 products and three brands in Spain’).
Figure 11. Reporting on outcomes
Source: Platform monitoring reports – marketing and advertising 2015, N=14
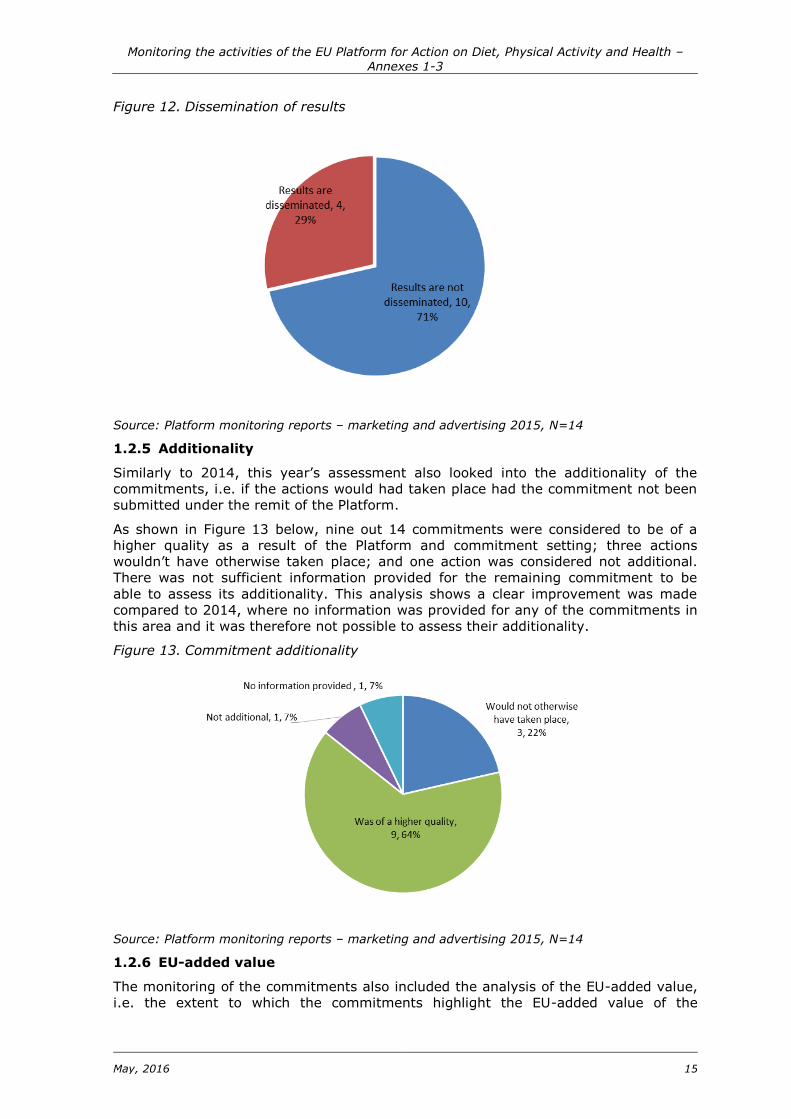
The dissemination activities of commitments were also analysed. Figure 12 below
shows that four commitments out of 14 reported that dissemination activities were
carried out; with the ten remaining commitments not reporting any dissemination
activities. This shows a significant improvement in comparison with the results of
2014, where none of the commitments in this area reported on dissemination
activities.
An example where a commitment provided clear details on dissemination is n°1106
(‘Media, advertising and nutrition: media literacy educational package’), undertaken
by COFACE. This included details on the dissemination of the learning material
produced through the action.
Monitoring the activities of the EU Platform for Action on Diet, Physical Activity and Health – Annexes 1-3
May, 2016 15
Figure 12. Dissemination of results
Source: Platform monitoring reports – marketing and advertising 2015, N=14
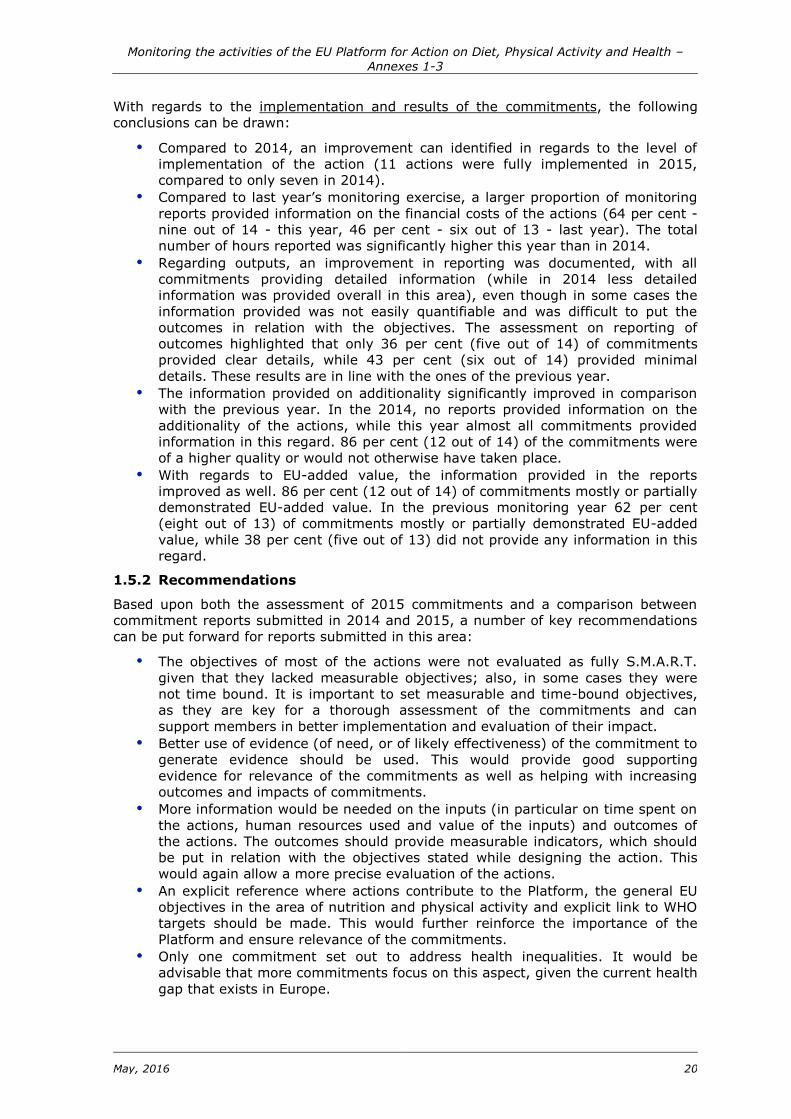
1.2.5 Additionality
Similarly to 2014, this year’s assessment also looked into the additionality of the
commitments, i.e. if the actions would had taken place had the commitment not been
submitted under the remit of the Platform.
As shown in Figure 13 below, nine out 14 commitments were considered to be of a
higher quality as a result of the Platform and commitment setting; three actions
wouldn’t have otherwise taken place; and one action was considered not additional.
There was not sufficient information provided for the remaining commitment to be
able to assess its additionality. This analysis shows a clear improvement was made
compared to 2014, where no information was provided for any of the commitments in
this area and it was therefore not possible to assess their additionality.
Figure 13. Commitment additionality
Source: Platform monitoring reports – marketing and advertising 2015, N=14
1.2.6 EU-added value
The monitoring of the commitments also included the analysis of the EU-added value,
i.e. the extent to which the commitments highlight the EU-added value of the

Monitoring the activities of the EU Platform for Action on Diet, Physical Activity and Health – Annexes 1-3
May, 2016 16
Platform. Figure 14 shows that six out of 14 commitments mostly demonstrated EU-
added value, six partially demonstrated EU-added value and two did not.
A slight improvement can be highlighted in comparison with 2014, where only two
commitments out of 13 had mostly demonstrated EU-added value, six partially
demonstrated EU-added value and five did not provide any information in this regard.
Figure 14. EU-added value
Source: Platform monitoring reports – marketing and advertising 2015, N=14
An example of a commitment demonstrating EU-added value is n°581 (‘Advertising
and Commercial Communications, including school vending’), implemented by
UNESDA. Indeed these activities, undertaken in all Member States, have taken place
thanks to the fact that they are part of the Platform.
1.2.7 Recommendations for additional actions
In relation to suggesting additional actions, only two commitments provided such
information, with the remainder (12) not recommending them. This echoes the results
from 2014, where only two commitments provided recommendations for additional
actions.
For instance, the commitment titled ‘The EU Pledge - Changing Food Advertising to
Children’, implemented the World Federation of Advertisers (n°1075) indicated that an
additional monitoring report would be produced in 2016 providing the results on the
compliance levels with the Pledge.

Monitoring the activities of the EU Platform for Action on Diet, Physical Activity and Health – Annexes 1-3
May, 2016 17
Figure 15. Recommendations for additional actions
Source: Platform monitoring reports – marketing and advertising 2015, N=14
1.3 Overall assessment of the quality of reporting
1.3.1 Overall assessment
An overall assessment of the actions in this area was made, on the basis of previous
evaluation areas and evaluating whether commitments’ reports provided sufficient and
accurate information.
Figure 16. Overall assessment of reporting
Source: Platform monitoring reports – Marketing and advertising 2014, N=13; 2015, N=14
Figure 16 shows that only four out of 14 actions were highly satisfactory, and the
remaining 10 were satisfactory. No commitments were seen as non-satisfactory. The
commitments that were considered as highly satisfactory had mostly or fully
S.M.A.R.T. objectives and provided a detailed report of inputs, outputs and outcomes.

Monitoring the activities of the EU Platform for Action on Diet, Physical Activity and Health – Annexes 1-3
May, 2016 18
This assessment demonstrates an improvement in reporting, in comparison with 2014,
where five out of 13 commitments in this area were assessed as non-satisfactory,
seven satisfactory and only one was highly satisfactory.
The primary reasons for improvements in reporting were that the objectives were at
least mostly S.M.A.R.T. (i.e. they provided specific, achievable and realistic) and they
provided sufficiently clear information on inputs and outputs.
However, in many cases the objectives of the actions were not measurable and the
description of outcomes and impact was quite limited. For this reason these
commitments were not rated as ‘highly satisfactory’, and were given recommendations
for future reporting improvements.
One example of report rated as highly satisfactory was the one submitted for ‘Mars
Marketing Commitments (MMC)’, which had clear objectives and provided clear
information on inputs, outputs and outcomes.
1.4 Synergies, joint commitments and transferability
1.4.1 Synergies and joint commitments
As a final part of this assessment, analysis was conducted on possible synergies and
joint commitments between different commitments, as well as the transferability of
commitment actions to other geographical or organisational contexts. This was done
using information included in the monitoring reports, and does not take into
consideration external or internal factors related to design and implementation of the
actions.
For marketing and advertising commitments, a number of possible synergies were
identified between actions having similar objectives. For example, commitment n°545
(‘Media Smart - media literacy programme for primary school children’) could find
synergies with n°1106 (‘Media, advertising and nutrition: media literacy educational
package’, implemented by the Confederation of Family Organisations in the European
Union (COFACE)). Given the similarity of the objectives of their actions, in that they
both aimed at developing media literacy tools on advertising techniques for children,
there are clear links. Regarding possible joint commitments, a number of actions
related to the EU Pledge were submitted in this activity area. Given the similarity of
the actions, in terms of aims, activities and type of members undertaking them,
consideration could be given to creating an overarching joint action which aligns and
creates strong synergies amongst all these commitments (n°1711, n°427, n°619,
n°833, n°1075 and n°1515) and monitor their impact.
1.4.2 Transferability
This year’s analysis also assessed for the first time, the transferability of the
commitments to another setting (e.g. organisational, geographical). In this context,
transferability means that the design and intent of an action could be replicated in
another setting (e.g. organisational, geographical) or that the action could be
replicated by another organisation in another locality or by the same organisation in
another locality.
The majority of commitments (13 out of 14) submitted in 2015 were deemed to be
transferrable, having given enough detail about the actions undertaken that the
commitment’s delivery model could be replicated in a different thematic or
geographical context.
An example of a commitment which could be transferred is entitled ’Media, advertising
and nutrition: media literacy educational package’, undertaken by the Confederation
of Family Organisations in the European Union (COFACE). It consisted mainly of
developing learning materials and organising workshops to teachers from all over

Monitoring the activities of the EU Platform for Action on Diet, Physical Activity and Health – Annexes 1-3
May, 2016 19
Europe. Given their nature, the learning materials could be translated in other
languages and the workshops organised in new countries.
The remaining commitment seen as non-transferable was the action entitled ‘No
advertising in cinemas during films aimed at children under 12 years’, undertaken by
UNESDA, which already covers the EU market (with the exception of Croatia), plus two
non-EU countries.
Figure 17. Transferability of actions
Source: Platform monitoring reports – marketing and advertising 2015, N=14
1.5 Conclusions and recommendations
1.5.1 Conclusions
Overall, an improvement can be documented in terms of quality of reporting,
compared to 2014. This is demonstrated by the improved results in the overall
assessment of the action, where 21 per cent of the actions were considered highly
satisfactory and 79 per cent satisfactory. None of the actions’ reporting was
considered as non-satisfactory.
The main findings regarding the design of the commitments submitted in this area
were as follows:
The setting of S.M.A.R.T. objectives has significantly improved from 2014 to
2015. 21 per cent of commitments had fully S.M.A.R.T. objectives and 79 per
cent had mostly S.M.A.R.T. objectives. This is a clear improvement compared to
the previous year’s monitoring exercise, where 43 per cent of commitments had
only partially S.M.A.R.T. objectives.
All of the commitments were assessed as being relevant to the stated priorities
of the Platform and EU, as in the previous year.
There was a slight decrease in the use of evidence in the design of
commitments for 2015. Around half of the commitments (57 per cent) showed
evidence of need while the remaining commitments did not provide any
evidence in the design of the action. In the previous monitoring exercise 69 per
cent of the actions had showed evidence of need or likely effectiveness.
Geographical coverage of commitments continues to be well spread across EU-
28 Member States (and beyond), with the majority of commitments (11 out of
14) covering more than 20 countries. This is an increase of one compared to
2014.
Monitoring the activities of the EU Platform for Action on Diet, Physical Activity and Health – Annexes 1-3
May, 2016 20
With regards to the implementation and results of the commitments, the following
conclusions can be drawn:
Compared to 2014, an improvement can identified in regards to the level of
implementation of the action (11 actions were fully implemented in 2015,
compared to only seven in 2014).
Compared to last year’s monitoring exercise, a larger proportion of monitoring
reports provided information on the financial costs of the actions (64 per cent -
nine out of 14 - this year, 46 per cent - six out of 13 - last year). The total
number of hours reported was significantly higher this year than in 2014.
Regarding outputs, an improvement in reporting was documented, with all
commitments providing detailed information (while in 2014 less detailed
information was provided overall in this area), even though in some cases the
information provided was not easily quantifiable and was difficult to put the
outcomes in relation with the objectives. The assessment on reporting of
outcomes highlighted that only 36 per cent (five out of 14) of commitments
provided clear details, while 43 per cent (six out of 14) provided minimal
details. These results are in line with the ones of the previous year.
The information provided on additionality significantly improved in comparison
with the previous year. In the 2014, no reports provided information on the
additionality of the actions, while this year almost all commitments provided
information in this regard. 86 per cent (12 out of 14) of the commitments were
of a higher quality or would not otherwise have taken place.
With regards to EU-added value, the information provided in the reports
improved as well. 86 per cent (12 out of 14) of commitments mostly or partially
demonstrated EU-added value. In the previous monitoring year 62 per cent
(eight out of 13) of commitments mostly or partially demonstrated EU-added
value, while 38 per cent (five out of 13) did not provide any information in this
regard.
1.5.2 Recommendations
Based upon both the assessment of 2015 commitments and a comparison between
commitment reports submitted in 2014 and 2015, a number of key recommendations
can be put forward for reports submitted in this area:
The objectives of most of the actions were not evaluated as fully S.M.A.R.T.
given that they lacked measurable objectives; also, in some cases they were
not time bound. It is important to set measurable and time-bound objectives,
as they are key for a thorough assessment of the commitments and can
support members in better implementation and evaluation of their impact.
Better use of evidence (of need, or of likely effectiveness) of the commitment to
generate evidence should be used. This would provide good supporting
evidence for relevance of the commitments as well as helping with increasing
outcomes and impacts of commitments.
More information would be needed on the inputs (in particular on time spent on
the actions, human resources used and value of the inputs) and outcomes of
the actions. The outcomes should provide measurable indicators, which should
be put in relation with the objectives stated while designing the action. This
would again allow a more precise evaluation of the actions.
An explicit reference where actions contribute to the Platform, the general EU
objectives in the area of nutrition and physical activity and explicit link to WHO
targets should be made. This would further reinforce the importance of the
Platform and ensure relevance of the commitments.
Only one commitment set out to address health inequalities. It would be
advisable that more commitments focus on this aspect, given the current health
gap that exists in Europe.

Monitoring the activities of the EU Platform for Action on Diet, Physical Activity and Health – Annexes 1-3
May, 2016 21
As regards the additionality of the actions, in general the commitments should
in principle be additional actions and not consist of activities that would have
taken place anyway. By highlighting the additionality of actions, the relevance
to the Platform and its impact can be further evidenced.
As this area is one of the priorities of the Platform, a greater number of and
more ambitious actions from all relevant and major Platform members are
welcomed.

Monitoring the activities of the EU Platform for Action on Diet, Physical Activity and Health – Annexes 1-3
May, 2016 22
2 Composition of foods (reformulation), availability of
healthy food options and portion sizes
This area includes actions on food reformulation, including the composition of foods,
availability of healthy food options and portion sizes.
Of the active 18 commitments in this area, three commitments began in 2015, and
two were completed in 20152. As can be observed in Table 3, most of the
commitments (17) have been submitted by industry representations FoodDrinkEurope,
Serving Europe, COPA-COGECA, EVA, Euro Coop and FoodServiceEurope) and one by
a professional association (CPME).
Table 3. Number of commitments per Platform member
Platform member N° of commitments
FoodDrinkEurope 11
Serving Europe 2
Euro Coop 1
EVA 1
COPA-COGECA 1
CPME 1
FSE 1
Total 18
Platform monitoring reports 2015
As shown in Figure 1 below, the majority of commitments covered more than 20
countries. Of those which covered fewer, three were nationally based and the other
two varied in size. This is almost exactly the same as the commitments presented for
2014, although with a slight increase in the proportion of commitments covering 20 or
more countries.
The majority of commitments covering more than 20 countries covered all EU-28
countries (seven out of 13), with a significant majority of also covering Switzerland
(11), Norway (10), and a few covering Iceland (four). Where commitments covered
more than 20 countries but did not cover all EU-28 countries, in most cases (four out
of six) this was because they did not cover Croatia. In the other two cases there were
multiple EU-28 countries not covered by the commitment.
Those commitments which were nationally based were located in Belgium, Denmark
and Italy, each implemented by organisations whose remits were specific to those
countries3. An example of one such commitment is n°263 (‘Nutrition Policy Charter’),
for which FEVIA4 signed Belgian companies up to a Nutrition Policy Charter committing
to improve the nutritional content of their products.
2 Commitments n°1305 (‘Healthy choices at work’) and n°1314 (‘Increased vending choice to promote health
eating habits’). 3 FEVIA (Belgium), Danish Agriculture & Food Council (Denmark), and Coop Italia (Italy).
4 Fédération de l’Industrie Alimentaire/Federatie Voedingsindustrie.

Monitoring the activities of the EU Platform for Action on Diet, Physical Activity and Health – Annexes 1-3
May, 2016 23
Figure 18. Geographic coverage of Platform commitments in the area of food
reformulation
Source: Platform monitoring reports – food reformulation 2015, N=18
On average, EU-28 countries were covered by 13 different reformulation
commitments, with countries mostly being covered by between 12 and 15. Those most
covered were Belgium, France, Italy and the United Kingdom (each covered by 15),
and while Croatia remains the least covered5, there was a notable increase in
commitments covering it between 2014 and 2015 (from five to eight).
Figure 19. Geographic coverage of Platform commitments in the area of food
reformulation
Source: Platform monitoring reports – food reformulation 2015, N=18
5 Croatia is the newest member state, having become a member on 1 July 2013.
Monitoring the activities of the EU Platform for Action on Diet, Physical Activity and Health – Annexes 1-3
May, 2016 24
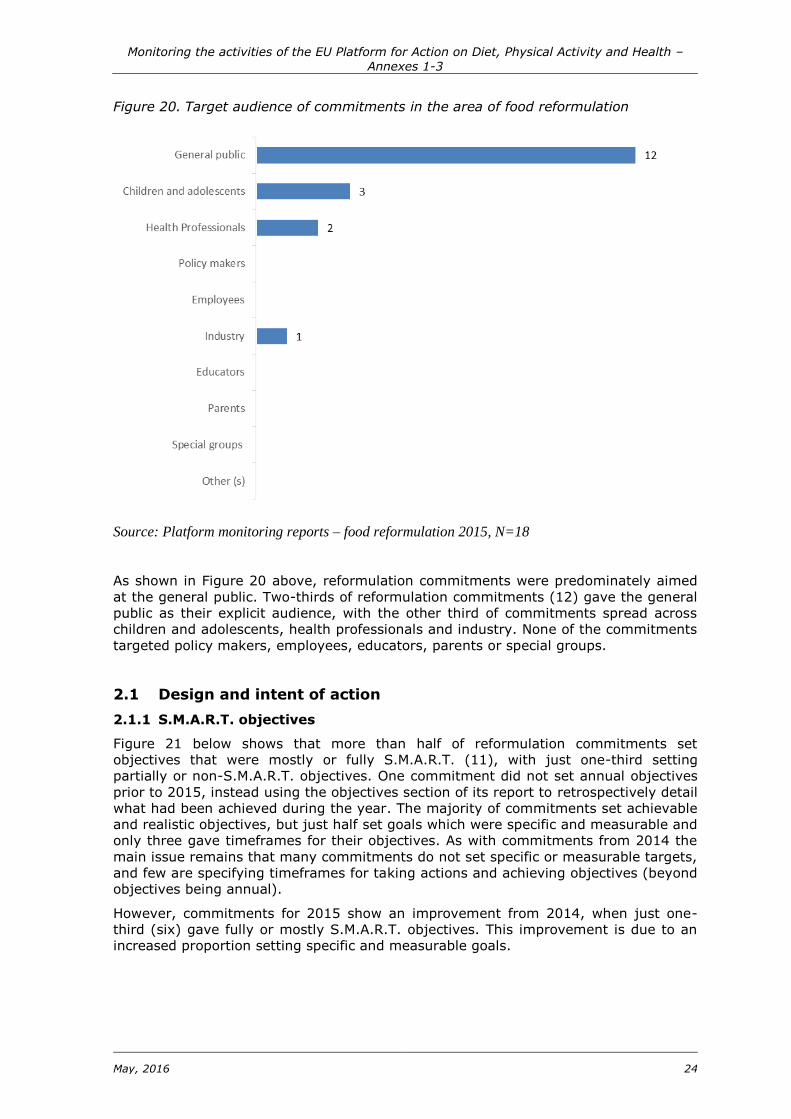
Figure 20. Target audience of commitments in the area of food reformulation
Source: Platform monitoring reports – food reformulation 2015, N=18
As shown in Figure 20 above, reformulation commitments were predominately aimed
at the general public. Two-thirds of reformulation commitments (12) gave the general
public as their explicit audience, with the other third of commitments spread across
children and adolescents, health professionals and industry. None of the commitments
targeted policy makers, employees, educators, parents or special groups.
2.1 Design and intent of action
2.1.1 S.M.A.R.T. objectives
Figure 21 below shows that more than half of reformulation commitments set
objectives that were mostly or fully S.M.A.R.T. (11), with just one-third setting
partially or non-S.M.A.R.T. objectives. One commitment did not set annual objectives
prior to 2015, instead using the objectives section of its report to retrospectively detail
what had been achieved during the year. The majority of commitments set achievable
and realistic objectives, but just half set goals which were specific and measurable and
only three gave timeframes for their objectives. As with commitments from 2014 the
main issue remains that many commitments do not set specific or measurable targets,
and few are specifying timeframes for taking actions and achieving objectives (beyond
objectives being annual).
However, commitments for 2015 show an improvement from 2014, when just one-
third (six) gave fully or mostly S.M.A.R.T. objectives. This improvement is due to an
increased proportion setting specific and measurable goals.

Monitoring the activities of the EU Platform for Action on Diet, Physical Activity and Health – Annexes 1-3
May, 2016 25
Figure 21. S.M.A.R.T. objectives
Source: Platform monitoring reports – food reformulation 2015, N=18
An example of a commitment setting fully S.M.A.R.T. objectives is n°1305 (CPME’s
‘Healthy choices at work’), which gave numeric targets for hosting events and
distributing fruit at those events, including the amount of fruit to be handed out and
the number of intended recipients.
2.1.2 Relevance of commitments
2.1.2.1 Links to EU Platform and EU policy goals
Almost all commitments displayed relevance to the aims of the Platform, with just one
giving no information to evidence such a link. Just over one-third (eight) made explicit
reference to the aims of the Platform. This is a slightly change compared to 2014,
when half of commitments made explicit links. An example of a commitment which
made explicit links to the Platform is n°807 (‘Product formulation and portion sizes’) in
the design section of which Ferrero states that “reformulation of products is one of the
main areas of action identified in the European Platform for Action on Diet, Physical
Activity and Health”.
Figure 22. Relevance of commitments to Platform priorities
Source: Platform monitoring reports – food reformulation 2015, N=18

Monitoring the activities of the EU Platform for Action on Diet, Physical Activity and Health – Annexes 1-3
May, 2016 26
As in 2014, half of reformulation commitments carried out in 2015 contained implicit
links to Platform priorities. An example of one such commitment is n°263 (‘Nutrition
Policy Charter’), in which FEVIA states that the purpose of commitment n°263 is to
improve the nutritional content and labelling of products on the market on Belgium.
The commitment does not make an explicit link between these aims and those of the
Platform, but they are clearly relevant.
The vast majority of commitments contained an implicit link to wider EU objectives,
with just one displaying no apparent link and one making explicit reference to other
EU objectives. Relevance to wider EU policy goals was not assessed separately in
2014, so no comparison can be made between the two years.
Figure 23. Relevance of commitments to wider EU priorities
Source: Platform monitoring reports – food reformulation 2015, N=18
The commitment which made explicit links to EU priorities was n°1707
(FoodServiceEurope’s ‘Definition of Model School Food Policy and follow-up national
actions’). The purpose of this commitment was to create a Model School Food Policy,
which can be used as guidance for schools and/or parents in the EU to influence
national policies on school food. This commitment made specific reference to the EU
Action Plan on Childhood Obesity being taken into account in its design.
2.1.2.2 Link to WHO targets
In general, links between commitments and WHO targets were implicit rather than
explicit. More than half (ten) of commitments contained an implicit link to WHO’s
target on reducing mean population intake of salt, with a little under half (seven)
being implicitly linked to WHO’s target of halting the rise in diabetes and obesity.
Where these links existed but were deemed to be implicit, this was because
commitments stated an aim of reducing salt levels in food or contributing to the fight
against obesity, but did not make reference to WHO goals in these areas.
One commitment made an explicit reference to WHO targets on salt reduction was
n°1709 (‘Breakfast cereal industry commitment in the area of product formulation and
innovation’), under which the European Breakfast Cereal Association (CEEREAL) has
an objective of encouraging its members to reduce sugar and salt in their products
and makes direct reference to the WHO target in relation to this.

Monitoring the activities of the EU Platform for Action on Diet, Physical Activity and Health – Annexes 1-3
May, 2016 27
Table 4. Links to WHO targets
Explicit link Implicit link No apparent
link
Target 1: 5% relative reduction in
the overall mortality from
cardiovascular diseases, cancer,
diabetes, or chronic respiratory
diseases
0 2 16
Target 2: At least 10% relative
reduction in the harmful use of
alcohol
0 0 18
Target 3: 10% relative reduction in
prevalence of insufficient physical
activity
0 1 17
Target 4: 30% relative reduction in
mean population intake of
salt/sodium
1 10 7
Target 5: 30% relative reduction in
prevalence of current tobacco use in
persons aged 15+ years
0 0 18
Target 6: 25% relative reduction in
the prevalence of raised blood
pressure or contain the prevalence
of raised blood pressure
0 2 16
Target 7: Halt the rise in diabetes
and obesity
0 7 11
Target 8: At least 50% of eligible
people receive drug therapy and
counselling to prevent heart attacks
and strokes
0 0 18
Target 9: 80% availability of the
affordable basic technologies and
essential medicines, including
generics, required to treat major
NCDs
0 0 18
Source: Platform monitoring reports – food reformulation 2015, N=18
As with wider EU relevance, links with WHO targets were not assessed for 2014
commitments and so a comparison between the two years is not possible.
2.1.3 Actions to reduce health inequalities
Of the reformulation commitments which covered 2015, none stated that they set out
to reduce health inequalities.

Monitoring the activities of the EU Platform for Action on Diet, Physical Activity and Health – Annexes 1-3
May, 2016 28
2.1.4 Using evidence in design
61 per cent of commitments (11) addressed need and/or likely effectiveness in some
way. Where commitments did make reference to evidence, most (seven) gave
evidence of potential impact or made a commitment to generate data/information,
while a lower but still significant proportion (six) gave evidence of need.
Figure 24. Use of evidence in commitment design
Source: Platform monitoring reports – food reformulation 2015, N=18
One commitment which addressed both need and likely effectiveness was n°1420
(‘Dietary habits and nutrient intakes in infants and toddlers’), which framed the need
for the intervention in relation to current dietary habits and also committed to produce
information which can be used to advise parents and improve products’ nutritional
content. One commitment which provided evidence of need only is n°1317 (COPA-
COGECA’s ‘Partnership on the reduction of salt content in food’), which gave evidence
of the need to reduce salt intake among the general population but did not give an
idea of the impact the commitment might anticipate having.
Compared to 2014 commitments this shows a slight increase in the number of
commitments which neither refer to evidence of need/effectiveness nor (in the case of
innovative commitments) state that they intend to generate evidence or information.
There were seven such reports in 2015, compared to four in 2014. This change was
accompanied by a slight drop in the number of commitments stating evidence of need
and likely effectiveness and evidence of need only.
2.2 Implementation and results
2.2.1 Level of implementation
The majority (12) of commitments mostly or fully implemented the actions set out in
their commitment design. A small number (three) were only partially implemented,
with the remainder not providing enough information for an assessment to be
possible. This was a slight drop from 2014, when 15 out of 18 commitments were
deemed to have mostly or fully implemented their actions.
The number deemed to have been mostly implemented actually rose in 2015 (from
four to seven), but this was offset by a significant drop in the number fully
implemented (from eleven to five). This drop was due to reports not including
sufficient information about outputs and outcomes for commitments to be able to
demonstrate full implementation. The number of commitments which did not provide

Monitoring the activities of the EU Platform for Action on Diet, Physical Activity and Health – Annexes 1-3
May, 2016 29
sufficient information about implementation rose from two to three, also reflecting a
need for greater detail on implementation in some reports.
Figure 25. Level of commitment implementation
Source: Platform monitoring reports – food reformulation 2015, N=18
One example of a commitment which fully implemented the actions set out in its
annual objectives was n°1709 (‘Breakfast cereal industry commitment in the area of
product formulation and innovation’), under which CEEREAL set objectives of running
an internal survey and addressing commitment-relevant topics at their own working
groups. Both were clearly detailed as having been delivered as commitment outputs.
2.2.2 Main inputs reported (human and financial)
Reporting on the inputs of each commitment was mixed, with half of commitments
detailing the financial cost of implementation and a slightly larger number giving clear
details on staff time spent on implementing commitments. Compared to 2014 this is
an increase in both financial reporting (up from seven commitments to nine) and in
reporting on human inputs (up from eight to eleven).
Figure 26. Main inputs reported

Monitoring the activities of the EU Platform for Action on Diet, Physical Activity and Health – Annexes 1-3
May, 2016 30
Source: Platform monitoring reports – food reformulation 2015, N=18
In general, staff time was detailed in commitment reports as either number of full-
time employees (FTE) or number of hours, but not both. Where information on staff
input was given, calculations were made based on the assumption that a full time
employee could work 1,920 hours in a year6. For the 11 commitments where
information on staff input was provided, the annual number of hours ranged from 3 to
268,800. In total, the approximate number of hours spent on reformulation
commitments was of 321,544, or 167 FTE.
In the nine reports where financial input was detailed, values ranged from EUR 1,100
to EUR 45,948,927, with a sum total of EUR 53,259,527 spent on commitments for
reformulation. Most (seven) gave input values of EUR 250,000 or lower, with the
overall average lifted significantly by two high-expenditure commitments (which spent
EUR 6.8 million and EUR 45.9 million).
The level of detail given for financial inputs was mixed. In two reports the estimated
value of staff time was included in the figures for financial inputs, while the other
seven only recorded monetary inputs other than staff costs in their reporting on
financial input. One commitment which reported inputs particularly clearly was n°1420
(‘Dietary habits and nutrient intakes in infants and toddlers’), which broke down the
inputs made in relation to each annual objective, giving FTE and financial costs for
each.
2.2.3 Outputs
Almost all commitments gave at least some information on outputs, with all but one
giving either minimal or clear details. A variety of different outputs were delivered by
the various commitments during 2015, including: a new website; the launching of new
products; surveys of companies and body members; the organisation of working
groups; campaigning activities; and informational materials such as brochures and
videos.
Figure 27. Commitment outputs
Source: Platform monitoring reports – food reformulation 2015, N=18
In some cases, clear details on outputs were given but appeared to only relate to
some of the commitment’s objectives or to some but not all commitment members.
This made it difficult to determine outputs from each action or the outputs of each
organisation involved in the commitment, resulting in those commitments being
judged to have provided minimal details rather than clear details.
6 8 hours per day, 5 days per week, 48 weeks per year.
Monitoring the activities of the EU Platform for Action on Diet, Physical Activity and Health – Annexes 1-3
May, 2016 31
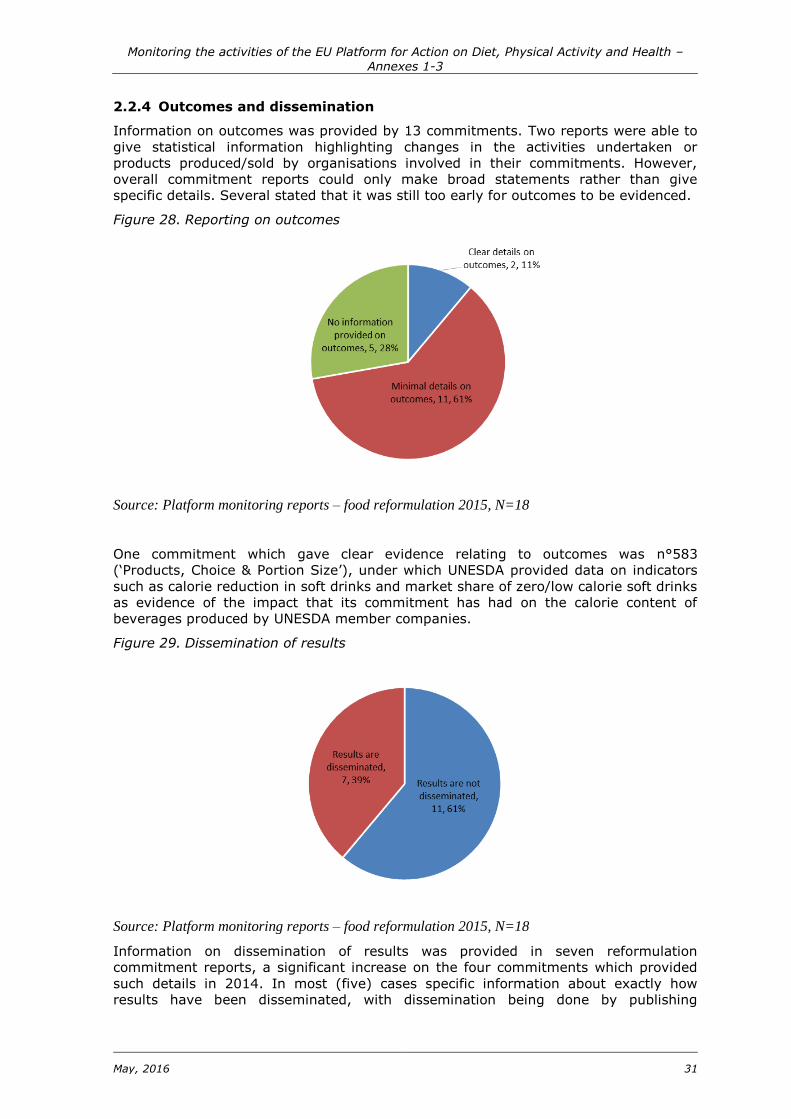
2.2.4 Outcomes and dissemination
Information on outcomes was provided by 13 commitments. Two reports were able to
give statistical information highlighting changes in the activities undertaken or
products produced/sold by organisations involved in their commitments. However,
overall commitment reports could only make broad statements rather than give
specific details. Several stated that it was still too early for outcomes to be evidenced.
Figure 28. Reporting on outcomes
Source: Platform monitoring reports – food reformulation 2015, N=18
One commitment which gave clear evidence relating to outcomes was n°583
(‘Products, Choice & Portion Size’), under which UNESDA provided data on indicators
such as calorie reduction in soft drinks and market share of zero/low calorie soft drinks
as evidence of the impact that its commitment has had on the calorie content of
beverages produced by UNESDA member companies.
Figure 29. Dissemination of results
Source: Platform monitoring reports – food reformulation 2015, N=18
Information on dissemination of results was provided in seven reformulation
commitment reports, a significant increase on the four commitments which provided
such details in 2014. In most (five) cases specific information about exactly how
results have been disseminated, with dissemination being done by publishing

Monitoring the activities of the EU Platform for Action on Diet, Physical Activity and Health – Annexes 1-3
May, 2016 32
information on organisations’ websites, inclusion of results in newsletters, publication
in journals, and dissemination of brochures at industry events.
2.2.5 Additionality
Overall, two commitments provided information which showed that they would not
have taken place without the existence of the Platform, and one appeared to have
taken place at a great scale. The commitment which took place at a greater scale was
n°1305 (CPME’s ‘Healthy choices at work’), which promoted and encouraged the
consumption of healthier snacks at work. The report from this commitment stated that
promotion of this commitment was used as a vehicle for promoting the Platform and
included information from other reformulation commitments, although does not
specify what form this promotion took.
The other commitments submitted under reformulation involved actions which looked
like they would likely have taken place without the Platform, and which did not
mention interaction with the Platform in their reports. This is a slight improvement
compared to last year: two commitments running in 2014 demonstrated that they
were of higher quality due to their belonging to the Platform, although would have
gone ahead anyway.
Figure 30. Commitment additionality
Source: Platform monitoring reports – food reformulation 2015, N=18
2.2.6 EU-added value
Overall, most commitments submitted under reformulation evidenced no interaction
with the Platform7, and so could not be said to have demonstrated the EU-added value
of their relationship with the Platform. Two commitments partially demonstrated EU-
added value, either by incorporating information about the Platform into their
dissemination activities or via the Platform’s stimulation of the creation of another
European network for information sharing. This is a decrease from 2014, when eight
commitments provided information which demonstrated EU-added value.
One commitment that partially demonstrated EU-added value was n°1305 (CPME’s
‘Healthy choices at work’). It states that CPME’s activities under this commitment were
used as an opportunity to promote the Platform and raise awareness of other Platform
commitments, although it doesn’t specify exactly how this was done.
7 For example, disseminating results via the Platform, collaborating with other Platform members, or utilising
information provided by the Platform/other Platform members.

Monitoring the activities of the EU Platform for Action on Diet, Physical Activity and Health – Annexes 1-3
May, 2016 33
Figure 31. EU-added value
Source: Platform monitoring reports – food reformulation 2015, N=18
2.2.7 Recommendations for additional actions
A relatively small number (four) of commitments made recommendations for
additional actions, with the majority not recommending that additional actions be
taken during or after the commitment. One of those four which did make
recommendations was a commitment that was completed in 2015, while the other
three are ongoing. There was no change between 2014 and 2015, with four
commitments recommending additional actions in 2014 as well.
Figure 32. Recommendations for additional actions
Source: Platform monitoring reports – food reformulation 2015, N=18
The commitment which completed in 2015 but recommended additional actions was
n°1314 (EVA’s ‘Increasing vending choice to promote healthy eating habits’). This
commitment, which aims to increase the diversity of snacks offered in vending
machines, stated that beyond the actions undertaken by EVA and its members there
needs to be a range of general measures in all aspects of life for cultural change if
consumers are to be encouraged to choose healthier options from vending machines.

Monitoring the activities of the EU Platform for Action on Diet, Physical Activity and Health – Annexes 1-3
May, 2016 34
2.3 Overall assessment of the quality of reporting
2.3.1 Overall assessment
Overall analysis of the commitments submitted for reformulation found a fairly even
split in report quality, with half judged to be either satisfactory or highly satisfactory
and the other half deemed to be non-satisfactory.
Figure 33. Overall assessment of reporting
Source: Platform monitoring reports – food reformulation 2014, N=18; 2015, N=18
While this means there was a slight increase in the level of non-satisfactory reports
submitted between 2014 and 2015 (up from seven to nine), there was also a slight
increase in highly satisfactory reporting, up from zero to two between 2014 and 2015.
The primary reasons for reports being rated as non-satisfactory were: a lack of detail
given for inputs and outputs; objectives which were not S.M.A.R.T.; and a lack of
information addressing the commitment’s relevance to or interaction with the
Platform. Many reports also confused inputs, outputs and outcomes with each other to
varying degrees, leading some to write outcomes sections that focused on outputs.
One report that was rated as highly satisfactory was n°1709 (‘Breakfast cereal
industry commitment in the area of product formulation and innovation’). Strengths of
this report included that its design and rationale were clearly presented, and it
provided clear detail on inputs and outputs, with a breakdown of how inputs related to
each action undertaken.
2.4 Synergies, joint commitments and transferability
As a final part of this assessment, analysis was conducted on possible synergies and
joint commitments, as well as the transferability of commitment actions to other
geographical or organisational contexts. This was done using information included in
the monitoring reports, and does not take into consideration external or internal
factors related to design and implementation of the actions.

Monitoring the activities of the EU Platform for Action on Diet, Physical Activity and Health – Annexes 1-3
May, 2016 35
2.4.1 Synergies and joint commitments
In terms of synergies, two commitments submitted in the area of reformulation had
the potential to strengthen the offer of other commitments if they were to interact
with each other in some way. For example, commitment n°1707 (FoodServiceEurope’s
‘Definition of Model School Food Policy and follow-up national actions’) is creating
guidelines for the nutritional content of school meals. Development of these guidelines
could benefit from utilising information being produced under commitments such as
n°1317 (COPA-COGECA’s ‘Partnership on the reduction of salt content in food’), which
produced guidelines for the lower-salt production of food by industry.
Potential was also found for synergies between commitment n°1110 (EuroCoop’s ‘Club
4-10’) and other commitments. One of commitment n°1110’s objectives has been to
create an online portal where scientific advice and information on child nutrition and
obesity prevention can be made accessible. Commitments such as n°1605 (BEUC’s
‘Helping consumers to make healthier and more-informed food choices’, submitted
under advocacy) and n°1317 would potentially benefit from accessing this information.
There is also potential for some of the industry commitments submitted under
reformulation to become joint commitments with others. For example, commitment
n°1004 (‘Product Reformulations & Portion Size Reductions’) under which Mars has
been reformulating some of its products, could be run jointly with a knowledge
production and dissemination commitment such as n°1420 (‘Dietary habits and
nutrient intakes in infants and toddlers’, implemented by Danone). Commitment
n°1004 could then utilise the information being produced by commitment n°1420,
while commitment n°1420 could disseminate work done under n°1004 as an example
of best practice.
It is also worth noting that commitment n°1713 (FoodDrinkEurope’s ‘FoodDrinkEurope
Framework for commitments - product formulation and innovation (including
portions)’) has been encouraging industry to submit new and existing commitments to
FoodDrinkEurope as part of a framework, under which companies make commitments
to improve nutritional content and reduce portion sizes of products. Industry
commitments on product nutritional content or portion sizes - such as n°535, n°537
and n°834 - could become part of this framework as one joint commitment.
2.4.2 Transferability
This year’s assessment of commitments explored possible transferability of
commitment aims and actions. In this context, transferability means that the design
and intent of an action could be replicated in another setting (e.g. organisational,
geographical) or that the action could be replicated by another organisation in another
locality or by the same organisation in another locality.
Figure 34. Transferability of actions

Monitoring the activities of the EU Platform for Action on Diet, Physical Activity and Health – Annexes 1-3
May, 2016 36
Source: Platform monitoring reports – food reformulation 2015, N=18
One-third of commitments submitted in the area of reformulation in 2015 were
deemed to be transferrable, having given enough detail about the actions undertaken
that the commitment’s delivery model could be replicated in a different thematic or
geographical context.
Among those six commitments which were found to be transferable, the majority
(five) were commitments which involved knowledge/guideline production and
dissemination, or were commitments whereby an industry body signed companies up
to a charter or pledge. For example, commitment n°1317 (COPA-COGECA’s
‘Partnership on the reduction of salt content in food’) produced guidelines for lower-
salt production of food, along with a monitoring programme and consumer awareness
campaign. Actions taken were detailed and could be replicated in other countries
(n°1317 is applied solely to Denmark) by other organisations.
The sixth commitment found to be transferable was CPME’s ‘Healthy choices at work’,
which distributed fruit at various meetings hosted within CPME as a means of
promoting healthier eating at work. The actions taken under this commitment were
clearly presented in the report and could readily be replicated by any other
organisation who wishes to.
2.5 Conclusions and recommendations
2.5.1 Conclusions
Overall, the quality of reporting on commitments submitted in 2015 for the area of
reformulation was roughly similar to the quality of 2014 reports, with a small rise in
the number of reports rates as non-satisfactory offset by some reports being rated as
highly satisfactory.
The main findings in relation to the design of the commitments submitted in this area
were as follows:
The setting of S.M.A.R.T. objectives has significantly improved from 2014 to
2015. The number of commitments whose objectives were rated as mostly or
fully S.M.A.R.T. almost doubled, from six to eleven. Where objectives are not
S.M.A.R.T., the most common issues are a lack of specificity, measurability and
clear timeframes. This will need to be addressed in 2016 by the relevant
commitment holder.
Clearly linking of commitments to the Platform and to wider EU priorities
remained roughly the same in 2015 as in 2014, with a minor drop in the
number of reports explicitly linking their commitment to the Platform (from nine
to eight). Half of reports are still only making implicit links to supporting the
objectives of the Platform.
There was a slight increase in the number of commitments which neither refer
to evidence of need/effectiveness nor (in the case of innovative commitments)
state that they intend to generate evidence or information. There were seven
such reports in 2015, compared to four in 2014. This change was accompanied
by a slight drop in the number of commitments stating evidence of need and
likely effectiveness or evidence of need only.
Geographical coverage of commitments continues to be well spread across EU-
28 Member States (and beyond), with the majority of commitments (13 out of
18) covering more than 20 countries.
The main findings concerning reporting on the implementation and results of the
commitments were as follows:

Monitoring the activities of the EU Platform for Action on Diet, Physical Activity and Health – Annexes 1-3
May, 2016 37
There was a slight drop in the number of commitments being either mostly or
fully implemented, from 15 in 2014 to 12 in 2015. While the number being
mostly implemented rose (from four to seven), this was offset by a larger drop
in the number being fully implemented (from 11 to six). The main issue here
was reporting not being detailed enough to evidence full implementation.
Reporting on both human and financial inputs has improved, although clear
details are still not being submitted for all commitments. In 2014, the number
of reports providing clear information on human and financial inputs was eight
and seven; in 2015, this rose to eleven and nine.
Reporting on dissemination activities increased, from four reports in 2014 to
seven in 2015. Where reports did include information on the dissemination of
their commitments’ results, details were generally clear.
There was a slight improvement in additionality, with two commitments in 2015
showing they would not have taken place without the Platform and one
indicating it was of higher quality (compared to two in 2014 showing they would
have taken place anyway but were of higher quality).
There was a drop in the number of reports displaying EU-added value though,
from eight in 2014 to two in 2015. The main issue here was that very few
commitment reports evidenced any interaction between the commitment and
the Platform, and so did not explicitly show that there was a benefit of their
relationship with the Platform or other EU bodies.
Overall quality of the reports submitted in the area of reformulation was mixed,
with two highly satisfactory, seven satisfactory and nine non-satisfactory
reports. Compared to 2014 this meant there were two more non-satisfactory
reports in 2015, but also two more highly satisfactory reports.
2.5.2 Recommendations
Based upon both the assessment of 2015 commitments and a comparison between
reports submitted in 2014 and 2015, a number of key recommendations can be put
forward for this area:
A small number of commitment reports used a structure whereby objectives
were numbered, and then inputs, outputs and outcomes were listed and given
the same numbers depending on which objective they were relevant to. This
made it significantly clearer how inputs, outputs and outcomes related to each
objective and exactly what had been achieved by those commitments. This
would be a good format for all reports to follow, as it helps evidence level of
implementation more clearly.
Several reports confused inputs, outputs and outcomes with each other to
varying degrees. Additional guidance for commitment report authors that would
help them distinguish between these three things would be beneficial.
In the cases of some commitments, where multiple organisations submitted
individual commitments as part of a charter or framework, details on inputs,
outputs and outcomes were particularly low. In the case of such commitments,
each individual organisation should be encouraged to provide information on
inputs, outputs and outcomes to the body which submitted the commitment so
that reporting can be done more clearly and results aligned.
Overall, commitments would benefit from paying particular attention to the
setting of specific and time bound annual objectives, and providing information
which would clearly evidence both their relevance to the objectives of the
Platform and the value of their relationship with the Platform.
At present one-third (six) of reformulation commitments demonstrate
transferability to other geographic and/or thematic contexts. All of these 6 had
reports which gave clear details on both the commitments’ inputs and outputs,
while the majority of those which were assessed as not demonstrating
transferability (nine out of 12) were assessed as such due to providing
insufficient amounts of detail on inputs and/or outputs in their reports.

Monitoring the activities of the EU Platform for Action on Diet, Physical Activity and Health – Annexes 1-3
May, 2016 38
Providing a higher level of detail would help more commitments to demonstrate
transferability.
As this area is one of the priorities of the Platform, a greater number of and
more ambitious actions from all relevant and major Platform members are
welcomed.

Monitoring the activities of the EU Platform for Action on Diet, Physical Activity and Health – Annexes 1-3
May, 2016 39
3 Consumer information, including labelling
The area of consumer information (including labelling) allows Platform members to put
forward commitments that relate to informing consumers about nutritional and health
information of products. In 2015, there were 12 such commitments implemented.
Out of the 12 commitments in this area, two were completed in 2015 (commitment
n°1015 Nutrition Labelling Initiative: Indication of Guideline Daily Amounts (GDAs)
and action n°1024 ‘¡A comer bien! (To eat well)’, both by FoodDrinkEurope), with one
new commitment launched: commitment 1712 FoodDrinkEurope Framework for
commitments – consumer information by FoodDrinkEurope. This initiative encourages
the submission of existing and new commitments at different levels within the
industry, focusing on providing consumers with factual, science-based, objective and
consistent nutrition information.
As in the previous year, most of the commitments (11) were implemented by industry
representations (FoodDrinkEurope, EuroCommerce, and Serving Europe); with the
remaining commitment implemented by EUFIC. A summary commitments per Platform
member is provided in Table 5 below.
Table 5. Number of commitments per Platform member
Platform member N° of commitments
FoodDrinkEurope 9
EuroCommerce 1
EUFIC 1
Serving Europe 1
Total 12
Platform monitoring reports 2015
Figure 35 below shows the geographical coverage of commitments. As in the previous
year, the majority of commitments (nine out of 12) covered more than 20 European
countries; two commitments were nationally based (one taking place in Belgium and
the other in Spain) while the remaining commitment covered between six and ten
countries.
Most of the commitments covering more than 20 countries included 27 EU Member
States (three of them also included Croatia) and most of them also covered non-EU
Member States (Switzerland and/or Norway and/or Iceland). Two covered all EU-28
countries. An example of a commitment that covered all 28 Member States and
Switzerland is n°1027 (‘Guideline Daily Amount Labelling’), undertaken by UNESDA (a
member of FoodDrinkEurope), which aims to expand information on packaging in all
EU countries to offer consumers opportunities to reduce calorie intake.

Monitoring the activities of the EU Platform for Action on Diet, Physical Activity and Health – Annexes 1-3
May, 2016 40
Figure 35. Geographic coverage of commitments in the area of consumer information,
including labelling
Source: Platform monitoring reports - consumer information, including labelling 2015, N=12
Countries most covered by the commitments in this area were Belgium and Spain
(each covered by 11), while Croatia remains the least covered8 (three commitments
only). A breakdown of country coverage is illustrated in Figure 36 below.
Figure 36. Geographic coverage of commitments in the area of consumer information,
including labelling
Source: Platform monitoring reports - consumer information, including labelling 2015, N=12
Figure 37 below shows that, similarly to the previous year, the majority of
commitments in this area targeted the general public (ten out of 12). The remaining
two commitments targeted children and adolescents; and employees. None of the
commitments specifically targeted health professionals, policy makers, the industry,
8 Croatia is the newest member state, having become a member on 1 July 2013.
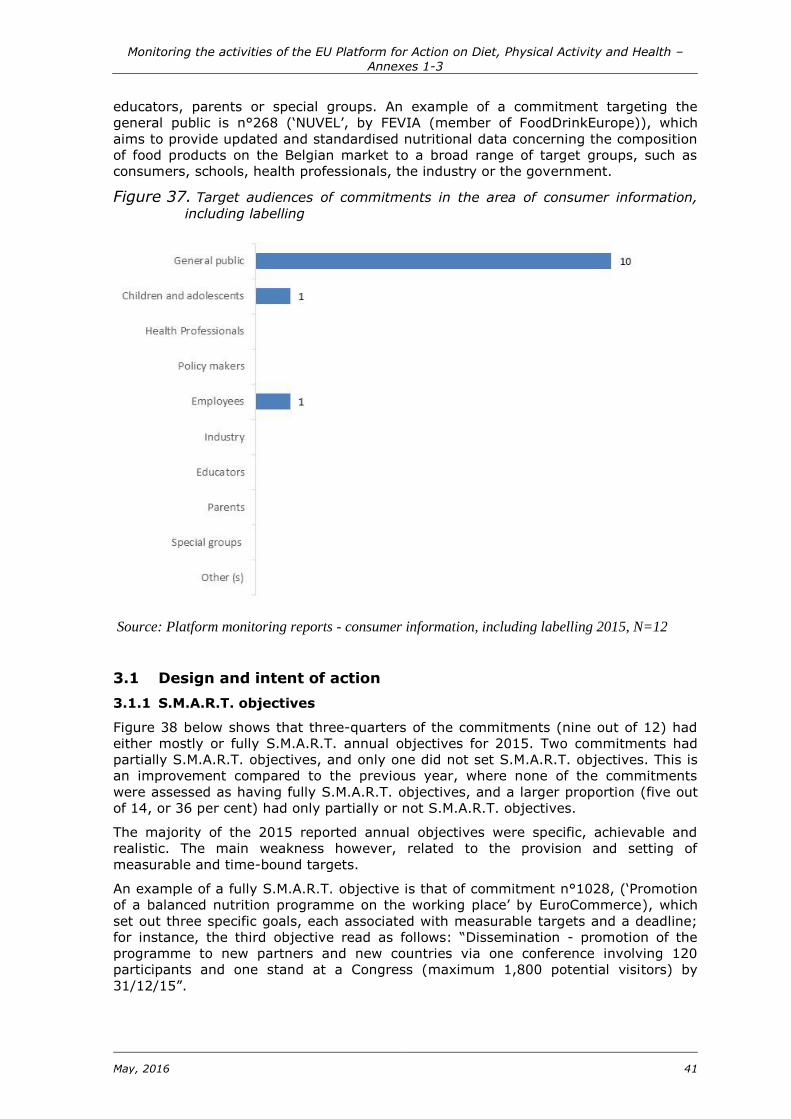
Monitoring the activities of the EU Platform for Action on Diet, Physical Activity and Health – Annexes 1-3
May, 2016 41
educators, parents or special groups. An example of a commitment targeting the
general public is n°268 (‘NUVEL’, by FEVIA (member of FoodDrinkEurope)), which
aims to provide updated and standardised nutritional data concerning the composition
of food products on the Belgian market to a broad range of target groups, such as
consumers, schools, health professionals, the industry or the government.
Figure 37. Target audiences of commitments in the area of consumer information,
including labelling
Source: Platform monitoring reports - consumer information, including labelling 2015, N=12
3.1 Design and intent of action
3.1.1 S.M.A.R.T. objectives
Figure 38 below shows that three-quarters of the commitments (nine out of 12) had
either mostly or fully S.M.A.R.T. annual objectives for 2015. Two commitments had
partially S.M.A.R.T. objectives, and only one did not set S.M.A.R.T. objectives. This is
an improvement compared to the previous year, where none of the commitments
were assessed as having fully S.M.A.R.T. objectives, and a larger proportion (five out
of 14, or 36 per cent) had only partially or not S.M.A.R.T. objectives.
The majority of the 2015 reported annual objectives were specific, achievable and
realistic. The main weakness however, related to the provision and setting of
measurable and time-bound targets.
An example of a fully S.M.A.R.T. objective is that of commitment n°1028, (‘Promotion
of a balanced nutrition programme on the working place’ by EuroCommerce), which
set out three specific goals, each associated with measurable targets and a deadline;
for instance, the third objective read as follows: “Dissemination - promotion of the
programme to new partners and new countries via one conference involving 120
participants and one stand at a Congress (maximum 1,800 potential visitors) by
31/12/15”.

Monitoring the activities of the EU Platform for Action on Diet, Physical Activity and Health – Annexes 1-3
May, 2016 42
Figure 38. S.M.A.R.T. objectives
Source: Platform monitoring reports - consumer information, including labelling 2015, N=12
3.1.2 Relevance of commitments
3.1.2.1 Link to EU Platform and EU policy goals
As in the previous year, all of the commitments displayed relevance to the stated aims
of the Platform. The proportion of commitments making an explicit link compared to
those making an implicit link was smaller than in the previous year: 42 per cent (five
out of 12) in 2015 compared to 50 per cent in 2014. An example of an explicit link can
be found in commitment n°1028 ‘Promotion of a balanced nutrition programme on the
working place’ by EuroCommerce. The monitoring report stated: "The FOOD
commitments share the same objectives as the EU Platform: to contribute concretely
to the pursuit of healthy nutrition while sharing the best practices among the partners
and at EU level".
Figure 39. Relevance of commitments to Platform priorities
Source: Platform monitoring reports - consumer information, including labelling 2015, N=12

Monitoring the activities of the EU Platform for Action on Diet, Physical Activity and Health – Annexes 1-3
May, 2016 43
All commitments contained an implicit link to wider EU objectives, with no
commitments providing an explicit link to any particular EU policy goal or initiative. An
example of an implicit link can be found in commitment n°1414 (‘FoodDrinkEurope
Recommendation for the continued use of Guideline Daily Amounts (GDAs)’. With this
commitment, FoodDrinkEurope members go further than what EU regulations
recommend (Regulation (EU) 1169/2011 on the provision of food information to
consumers which provides for mandatory nutrition labelling of products).
Relevance to wider EU policy goals was not assessed separately in 2014, so no
comparison can be made between the two years.
3.1.2.2 Link to WHO targets
Table 6 shows the number of commitments that made an explicit or implicit link to the
nine WHO targets. Overall, however, it can be seen that commitments made implicit-
rather than explicit- links to these targets.
Within this activity area, implicit links were found with target 7 - “Halt the rise in
diabetes and obesity”. This was also the only target where an explicit link was made
with the objective of a commitment (n°1028, ‘Promotion of a balanced nutrition
programme on the working place’, by EuroCommerce). This aims to enable citizens to
improve their nutrition, by acting on supply and demand at the same time. The report
states that obesity was designated by the World Health Organisation as one of the
greatest public health challenges, hence the reason to act - making links to the
commitment objective.
Lastly, an implicit link was documented between commitment n°268 ‘NUBEL’ by FEVIA
(member of FoodDrinkEurope) and target 4 - “30 per cent relative reduction in mean
population intake of salt/sodium”. Links with WHO targets were not assessed in the
2014 monitoring exercise and so a comparison between the two years is not possible.
Table 6. Links to WHO targets
Explicit link Implicit link No apparent
link
Target 1: 5% relative reduction in
the overall mortality from
cardiovascular diseases, cancer,
diabetes, or chronic respiratory
diseases
0 0 12
Target 2: At least 10% relative
reduction in the harmful use of
alcohol
0 0 12
Target 3: 10% relative reduction in
prevalence of insufficient physical
activity
0 0 12
Target 4: 30% relative reduction in
mean population intake of
salt/sodium
0 1 11
Target 5: 30% relative reduction in
prevalence of current tobacco use in
persons aged 15+ years
0 0 12
Target 6: 25% relative reduction in
the prevalence of raised blood
pressure or contain the prevalence
of raised blood pressure
0 0 12

Monitoring the activities of the EU Platform for Action on Diet, Physical Activity and Health – Annexes 1-3
May, 2016 44
Target 7: Halt the rise in diabetes
and obesity
1 7 4
Target 8: At least 50% of eligible
people receive drug therapy and
counselling to prevent heart attacks
and strokes
0 0 12
Target 9: 80% availability of the
affordable basic technologies and
essential medicines, including
generics, required to treat major
NCDs
0 0 12
Source: Platform monitoring reports – consumer information, including labelling 2015, N=12
3.1.3 Actions to reduce health inequalities
In the area of consumer information, including labelling, only one commitment
explicitly addressed health inequalities. Commitment n°582, ‘Consumer information’
by UNESDA (member of FoodDrinkEurope), aims to educate consumers about healthy
and balanced diets and empower them to make the most appropriate purchase choice
for their nutrition needs. Through this commitment they aim to address health
inequalities by focusing on the less educated population, who have more difficulty
understanding labels. In the previous year, none of the commitments explicitly
addressed health inequalities.
Figure 40. Actions to reduce health inequalities
Source: Platform monitoring reports - consumer information, including labelling 2015, N=12
3.1.4 Using evidence in design
Figure 41 below shows that the majority of the commitments (seven out of 12)
showed evidence of need and/or likely effectiveness. This is a smaller proportion than
in 2014 (nine out of 14); however, in 2014, none of the commitments reported both
on need and likely effectiveness of the action.
For instance, in the report of the commitment n°1611 ‘Providing Portion Guidance
(TM) on all Nestlé’s children's and family products’ by Nestlé (member of
FoodDrinkEurope) reference to the Cochrane Database of Systematic Reviews and

Monitoring the activities of the EU Platform for Action on Diet, Physical Activity and Health – Annexes 1-3
May, 2016 45
McKinsey Global Institute showed the importance of appropriate portions of packaged
foods and beverages for consumers. In addition, the monitoring report made reference
to research conducted by McKinsey Global Institute, demonstrating that “reducing
portion sizes in packaged foods and at fast-food restaurants is the most effective
single intervention to reduce obesity”.
As in the previous year, a small proportion of commitments (two out of 12) aimed at
generating evidence. For instance, commitment n°521 (‘Consumer research on
nutrition information and labelling’, by EUFIC) intends to expand its research
programme on nutrition information and labelling, building a knowledge base of
existing research and findings as well as conducting further research on the basis of
an assessment of the knowledge gaps in existing research.
Figure 41. Use of evidence in commitment design
Source: Platform monitoring reports - consumer information, including labelling 2015, N=12
3.2 Implementation and results
3.2.1 Level of implementation
Figure 42 below shows the level of implementation of the commitments. Similarly to
the previous year, half of the commitments (six out of 12) fully implemented the
actions set out in their commitment design. In addition, four commitments were
considered to be mostly implemented, one partially implemented and for the
remaining one not enough information was provided to make an assessment.
An example where a commitment was mostly implemented can be taken from
commitment n°536 ‘Consumer Information’. Members of Serving Europe pledge to
inform their customers about how product options and product composition compare
to Guideline Daily Amounts, or other nutrition driven references, through the use of
various communications and consumer information materials. In the outputs box,
details are given for three Serving Europe members (Domino’s Pizza, KFC UK, Quick
Group). From the information provided, it was concluded that action was fully
implemented within these three companies. However, there was no information
provided demonstrating implementation within the remaining Serving Europe
members.

Monitoring the activities of the EU Platform for Action on Diet, Physical Activity and Health – Annexes 1-3
May, 2016 46
Figure 42. Level of commitment implementation
Source: Platform monitoring reports - consumer information, including labelling 2015, N=12
3.2.2 Main inputs reported (human and financial)
As in the previous year, there were significant differences between commitments
regarding the detail and the quality of information provided (both in relation to human
and financial resources).
Figure 43. Main inputs reported
Source: Platform monitoring reports – food reformulation 2015, N=18
As illustrated in Figure 43, the majority of monitoring reports (eight out of 12, or 67
per cent), provided some information on financial costs of the actions. This is a higher
proportion than in 2014 (eight out of 14, or 57 per cent) showing some progress in
the reporting of inputs. In 2015, financial costs ranged from EUR 12,000 to EUR
6,400,000, bringing the total reported sum of EUR 16,834,076 in this activity area.
This is slightly higher than in 2014 (EUR 16,611,400).
Regarding human resource inputs, the analysis looked into the number of full-time
(FTE) and part-time (PTE) employees working on the action, whether some volunteer
time was used and if the monetary value spent on human resources was provided. In
the majority of the commitments (seven out of 12), no information was provided in
relation to the number of employees working on the actions. For the commitments
that provided information, the number of full time employees ranged from two to

Monitoring the activities of the EU Platform for Action on Diet, Physical Activity and Health – Annexes 1-3
May, 2016 47
three FTE employees, and from one to ten PTE employees. As in the previous year, no
information was provided on whether some of the work was carried out by volunteers.
Furthermore, the number of hours spent on implementing the commitment was
quantified when there was information that enabled these calculations (e.g. seven full
time people or 1.2 FTE/year). As previously explained, calculations were made based
on the assumption that a full time employee could work 8 hours per day/40 hours per
week/48 weeks a year (1,920 hours). Information pertaining to number of hours spent
was provided in only approximately 40 per cent of the commitments (five out of 12).
This is an improvement compared to the previous year where only approximately 20
per cent of the commitments (three out 14) provided information. In 2015, the annual
number of hours ranged from 138 to 5,760 (totalling around 17,500 hours). This is a
much higher value than in 2014 (4,100 hours).
As in the previous year, information on the costs of paying staff was not provided in
any of the monitoring reports.
3.2.3 Outputs
Figure 44 reports on the quality of reporting for outputs. As in the previous year,
information was provided in all the monitoring reports, however the degree of details
varied.
For eight out of the 12 commitments, outputs were clearly explained, with detailed
quantitative and qualitative information directly related to the commitments’ annual
objectives. For example, commitment n°521 ‘Consumer research on nutrition
information and labelling’ by EUFIC clearly explains the outputs, by type of activity:
“(1) Producing scientific publications and conducting outreach through scientific
presentations at stakeholder conferences, (2) Monitoring access to EUFIC-produced
content on portion information on label; and (3) Monitoring 2015 access to main
section of Eufic.org related to consumer research on nutrition information and
labelling, and dedicated webpages about related scientific publications”. In addition,
quantitative data on the number of scientific publications, of presentations, of
webinars or of pages viewed are given.
In other cases the information provided was not specific or not very clear (e.g.
quantitative information was missing for some of the objectives). For example, a
commitment by a member of FoodDrinkEurope reported on the new programmes and
tools developed. However, only the name of these tools and a short description were
given; there were no details on the number of users or the number of downloads.
Not all of the commitments presented indicators correctly. In some instances,
information in the outputs box related to inputs or outcomes. In other cases, the
opposite was true: information on outputs could be found in the inputs or outcomes
boxes. For instance, in two reports:
The ‘inputs’ box contained details on health inequalities, evidence in the design
and activities;
The ‘outputs’ box contained details on financial inputs; and
The ‘outcomes’ box contained details on outputs, additionality and EU added
value.
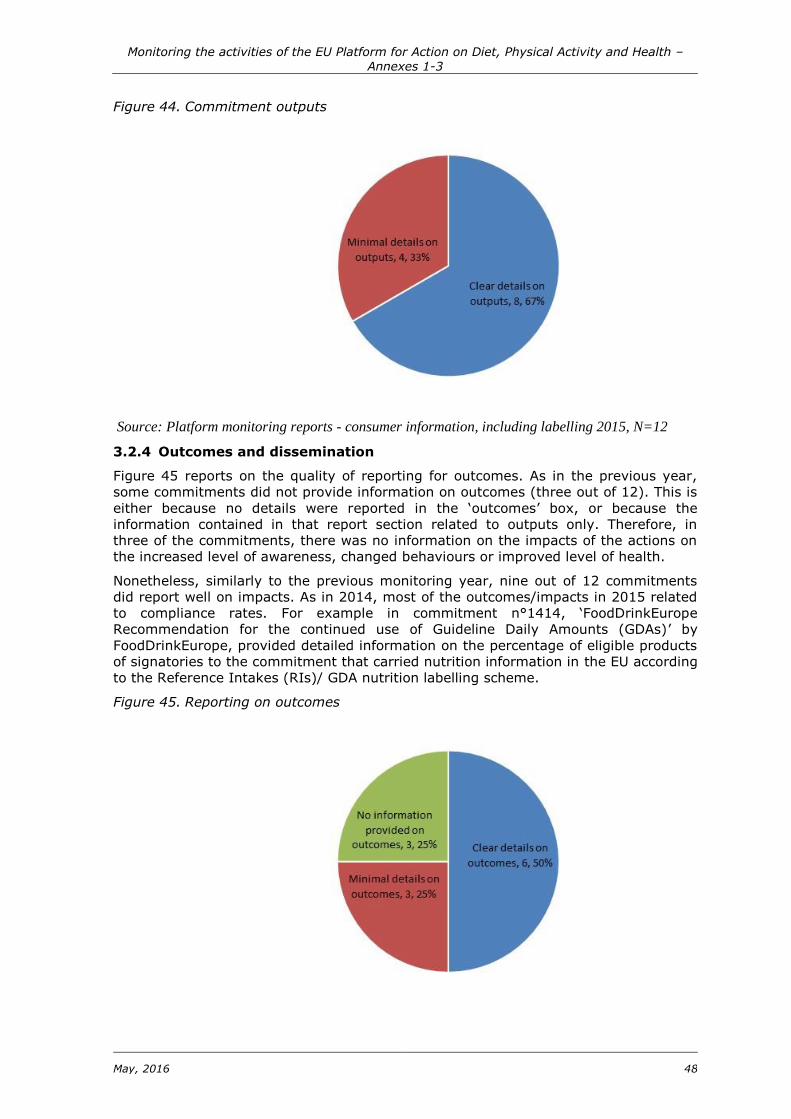
Monitoring the activities of the EU Platform for Action on Diet, Physical Activity and Health – Annexes 1-3
May, 2016 48
Figure 44. Commitment outputs
Source: Platform monitoring reports - consumer information, including labelling 2015, N=12
3.2.4 Outcomes and dissemination
Figure 45 reports on the quality of reporting for outcomes. As in the previous year,
some commitments did not provide information on outcomes (three out of 12). This is
either because no details were reported in the ‘outcomes’ box, or because the
information contained in that report section related to outputs only. Therefore, in
three of the commitments, there was no information on the impacts of the actions on
the increased level of awareness, changed behaviours or improved level of health.
Nonetheless, similarly to the previous monitoring year, nine out of 12 commitments
did report well on impacts. As in 2014, most of the outcomes/impacts in 2015 related
to compliance rates. For example in commitment n°1414, ‘FoodDrinkEurope
Recommendation for the continued use of Guideline Daily Amounts (GDAs)’ by
FoodDrinkEurope, provided detailed information on the percentage of eligible products
of signatories to the commitment that carried nutrition information in the EU according
to the Reference Intakes (RIs)/ GDA nutrition labelling scheme.
Figure 45. Reporting on outcomes

Monitoring the activities of the EU Platform for Action on Diet, Physical Activity and Health – Annexes 1-3
May, 2016 49
Source: Platform monitoring reports - consumer information, including labelling 2015, N=12
Additionally, analysis of commitments considered to what extent the results were
disseminated. As shown in Figure 46, there was information indicating dissemination
of results in seven of the 12 commitments. In 2015, dissemination was carried out
through websites, social media, newsletters etc. This comes as no surprise,
considering that dissemination is closely linked to the priority area of consumer
information. In addition, it can be noted that there was an improvement compared to
the previous year, where in only five of the 14 commitments, members reported on
disseminating their results.
Figure 46. Dissemination of results
Source: Platform monitoring reports - consumer information, including labelling 2015, N=12
3.2.5 Additionality
In the previous year, none of the commitments provided information on the extent to
which the commitments seemed to have been additional with regards to the Platform.
However, in 2015, as shown in Figure 47, only one of the 12 commitments was
deemed as not providing sufficient information to assess its additionality,
demonstrating a clear improvement in the manner of reporting.
This year’s analysis points towards a higher quality of commitment actions as a result
of the Platform. For example, commitment n°521 (‘Consumer research on nutrition
information and labelling’ by EUFIC) aims to conduct research on nutrition information
and labelling to communicate science-based information on food in an understandable
and effective way. The report mentions that through the medium of the EU Platform,
EUFIC was able to gather research from private and public sources, so that data from
the 58 studies were analysed, and conclusions drawn.
Other commitments took place at a greater scale or sooner because of the Platform.
For instance, commitment n°1027 (‘Guideline Daily Amount Labelling’ by UNESDA
(member of FoodDrinkEurope)), introduced GDA (now RI) labelling across the entire
soft drinks sector in 2008. The EU law did not require nutrition labelling across the EU
before December 2016. The UNESDA commitment was therefore delivered eight years
ahead of EU regulation and the action would not have taken place had it not been for
the industry commitment submitted under the Platform.
Lastly, one-third of the commitments (four out of 12) were deemed as not additional.
Examples were commitments were seen as not additional included actions ran only at

Monitoring the activities of the EU Platform for Action on Diet, Physical Activity and Health – Annexes 1-3
May, 2016 50
national/local level, or those that appeared to operate independently from the
Platform.
Figure 47. Commitment additionality
Source: Platform monitoring reports - consumer information, including labelling 2015, N=12
3.2.6 EU-added value
In 2014, more than half of the commitments did not provide information on the EU-
added value of taking part in the Platform. In comparison, only a quarter of the
commitments (three out of 12) did not provide information in 2015, showing an
improvement in reporting of information concerning possible EU-added value of
commitments.
For a third of the commitments (four out of 12), there did not appear to be an EU-
added value from taking part in the Platform. However, more than 40 per cent of the
commitments (five out of 12) demonstrated at least partial EU-added value. The
commitment that fully demonstrated EU-added value is commitment n°1712
‘FoodDrinkEurope Framework for commitments – consumer information’. This initiative
encourages the submission of a wide range of existing and new commitments to the
Platform, from different levels within the industry, with the aim of providing
consumers with factual, science-based, objective and consistent nutrition information.
It provides an example of coordinated action on the issue of obesity and non-
communicable diseases, by further promoting and encouraging industry initiatives in
this area.

Monitoring the activities of the EU Platform for Action on Diet, Physical Activity and Health – Annexes 1-3
May, 2016 51
Figure 48. EU-added value
Source: Platform monitoring reports - consumer information, including labelling 2015, N=12
3.2.7 Recommendations for additional actions
While in the previous year, only a small proportion of commitments indicated
additional actions (three out of 14), an improvement was reported for 2015, with half
of the commitments (six out of 12) providing such recommendations. For example, in
its report for ‘Providing Portion Guidance(TM) on all Nestlé's children's and family
products’ (commitment n°1611), Nestlé (member of FoodDrinkEurope) stated that in
2016 it will will extend its guiding efforts to recipes for consumers as well as its
healthy cooking and healthy eating educational programmes. Another example is
commitment n°521, ‘Consumer research on nutrition information and labelling’ by
EUFIC. The objective of this commitment is to gain a better understanding of the
contribution and potential of nutrition information and labelling in informing
consumers' decisions with a view to choosing a balanced diet. The research is
expected to provide guidance for further discussions about nutrition labelling, as the
EU Directive on nutrition labelling is revised.
Figure 49. Recommendations for additional actions

Monitoring the activities of the EU Platform for Action on Diet, Physical Activity and Health – Annexes 1-3
May, 2016 52
Source: Platform monitoring reports - consumer information, including labelling 2015, N=12
3.3 Overall assessment of the quality of reporting
3.3.1 Overall assessment
Figure 50 below indicates the assessment for the commitments within the area of
consumer information. Out of the 12 commitments, seven were assessed as highly
satisfactory while four were deemed satisfactory. Only one of the commitments was
non-satisfactory. This is an improvement compared to the previous year, where only
one of the 14 commitments was scored as highly satisfactory and a larger proportion
of commitments (five out of 14) were considered non-satisfactory.
Figure 50. Overall assessment of reporting
Source: Platform monitoring reports - consumer information, including labelling 2014, N=14;
2015, N=12
The reports rated as highly satisfactory had mostly or fully S.M.A.R.T. objectives as
well as a very good reporting of inputs, outputs and outcomes. Information related to
relevance, additionality and EU-added value was also consistent in these monitoring
reports, allowing for a detailed assessment of the commitment action. In contrast, the
report that was non-satisfactory did not provide annual objectives for 2015 and gave
limited or no information on outputs and outcomes.
3.4 Synergies, joint commitments and transferability
As a final part of the assessment, analysis was conducted on possible synergies, joint
commitments and transferability of commitment actions. This was done using
information included in the monitoring reports, and does not take into consideration
external or internal factors related to design and implementation of the actions.
3.4.1 Synergies and joint commitments
As a first point, analysis explored whether synergies existed or could exist between
different commitments.
Commitment n°1712, FoodDrinkEurope’s ‘Framework for commitments – consumer
information’, encourages the submission of a wide range of existing and new

Monitoring the activities of the EU Platform for Action on Diet, Physical Activity and Health – Annexes 1-3
May, 2016 53
commitments at different levels within the industry on providing consumers with
factual, science-based, objective and consistent nutrition information. Some
organisations have submitted case studies that are in fact individual commitments to
the EU Platform. Commitment n°1712 can be considered as a framework/overarching
commitment which provides support to its members on how to submit correct and
coherent commitments; encouraging synergies between commitments.
Joint commitments could be explored between commitments implementing similar
actions. For example, it would be advisable to encourage synergies between actions
that are about promoting the use of Guideline Daily Amounts (GDAs). For instance,
the aims and actions of the following commitments are very similar: n°1015 ‘Nutrition
Labelling Initiative: Indication of Guideline Daily Amounts (GDAs)’, n°1027 ‘Guideline
Daily Amount Labelling’ and n°1414 ‘FoodDrinkEurope Recommendation for the
continued use of Guideline Daily Amounts (GDAs)’.
3.4.2 Transferability
This year’s assessment of commitments explored possible transferability of
commitment aims and actions. In this context, transferability means that the design
and intent of an action could be replicated in another setting (e.g. organisational,
geographical) or that the action could be replicated by another organisation in another
locality or by the same organisation in another locality.
As shown in Figure 51 around 60 per cent of the commitments in this priority area
(seven out of 12) were seen as not transferable. Main reasons behind this are that
commitments are either already implemented in all of the EU Member States, or are
implemented by one European organisation at a central level, such that responsibility
cannot be transferred.
However, analysis shows that there could be scope to transfer five commitments. For
instance, commitment n°1024, ‘¡A comer bien! (To eat well)’ is implemented by
Nestlé in Spain. The commitment provides information to Spanish families on balanced
nutrition and healthy habits by using newsletters, magazines and updated nutritional
information on Nestlé Spain's website as well as a number of other specific
programmes and tools. Nestlé could develop the action to other countries where it is
present, taking into account the national nutritional profiles. Additionally, other food
and or drink companies (e.g. members of FoodDrinkEurope) could discuss
implementing similar actions if relevant for their scope of business. Another example
of transferrable action is commitment n°268, ‘NUBEL’, implemented by FEVIA,
(member of FoodDrinkEurope). NUBEL is responsible for the management of the
national food composition data in Belgium. The commitment could be explored further
in view of replicating the collection of other national food composition data by relevant
authorities.

Monitoring the activities of the EU Platform for Action on Diet, Physical Activity and Health – Annexes 1-3
May, 2016 54
Figure 51. Transferability of actions
Source: Platform monitoring reports - consumer information, including labelling 2015, N=12
3.5 Conclusions and recommendations
3.5.1 Conclusions
Overall, the quality of reports in the area of "Consumer information, including
labelling" significantly improved between 2014 and 2015. In 2015, 59 per cent of the
commitments were considered highly satisfactory (as opposed to seven per cent in
2014), 33 per cent satisfactory, and only eight per cent non-satisfactory (as opposed
to 36 per cent in 2014).
The main findings concerning the design and intent of commitments in this activity
area can be summarised as follows:
Three quarters of commitments (nine out of 12) had either mostly or fully
S.M.A.R.T. objectives for 2015. This is an improvement compared to 2014,
where none of the commitments were scored as having fully S.M.A.R.T.
objectives, and a larger proportion of commitments had only partially or not
S.M.A.R.T. objectives.
As in 2014, all of the commitments were assessed as being relevant to the
stated priorities of the Platform and the EU. However, the link with the WHO
targets was less clear, with reports making implicit links to two targets (only
report made an explicit link).
There are still very few commitments (only one) setting out to reduce health
inequalities as demonstrated by this year’s monitoring exercise.
The majority of commitments (nine out of 12, or 75 per cent) either showed
evidence of need and/or likely effectiveness or aimed to generate evidence.
This is similar to 2014, where ten out of 14 commitments used evidence in their
design or were committed to generate evidence.
Geographical coverage of commitments continues to be well spread across EU-
28 Member States (and beyond), with the majority of commitments (nine out of
12) covering more than 20 countries.
The main findings concerning the implementation and results of commitments are as
follows:
Compared to 2014, a larger proportion of monitoring reports in 2015 provided
information on the financial costs of the actions as well as on staff inputs. The

Monitoring the activities of the EU Platform for Action on Diet, Physical Activity and Health – Annexes 1-3
May, 2016 55
total reported sum of costs was slightly higher in 2015 than in 2014, while the
number of hours reported was significantly higher in 2015 than in 2014.
As in the previous year, reporting on outputs and outcomes was of satisfactory
quality. In 2015, 67 per cent of reports (eight out of 12) provided clear details
on outputs while 50 per cent (six out of 12) provided clear details on outcomes.
Reporting on additionality significantly improved between 2014 and 2015. In
2014, no reports provided information to assess the additionality of
commitments. In 2015, however, the level of relevant information improved
and it was found that seven (59 per cent) of the commitments were additional
(either because they took place at a greater scale/sooner, or because they were
of a higher quality) and that four (33 per cent) were not.
Reporting on EU-added value also significantly improved between 2014 and
2015. In 2014, less than half of the reports provided relevant information on
EU-added value. In 2015, however, this figure increased to 75 per cent (nine
out of 12 commitments) and it was found that five (42 per cent) of the
commitments demonstrated some EU-added value, while four (33 per cent) did
not.
3.5.2 Recommendations
As a result of the assessment in 2015, and taking into consideration the comparison to
2014 monitoring, a number of key recommendations can be put forward for this
activity area:
It is vital to ensure all of the commitments add specific, measurable and time
bound targets to their annual objectives; this will allow for developing fully
S.M.A.R.T. objectives. This contributes to more accurate monitoring and
reporting, enabling a better assessment of the annual progress made on
commitments and on the overall impact of the Platform.
Overall, more clarity on commitments’ relevance to the objectives of the
Platform and the value of their relationship with the Platform is needed.
Although exploring links between Platform commitments and the WHO targets
is a new area of assessment, commitments would benefit from such alignment
given the increasing emphasis placed on NCDs in Europe.
As with the previous year, commitments should, where relevant, explore
actions helping to reduce health inequalities.
Although improvement has been documented, all commitments should report
accurately on financial costs of inputs as well as on staff inputs (e.g. number of
FTE/PTE staff and number of hours spent).
Commitments should strive to be additional to their day to day activities. 33 per
cent of commitments (four out of 12) were deemed not additional in 2015.
Similarly, commitments should strive to demonstrate the EU-added value of
their action - 33 per cent of commitments (four out of 12) did not do so.

Monitoring the activities of the EU Platform for Action on Diet, Physical Activity and Health – Annexes 1-3
May, 2016 56
4 Education, including lifestyle modification
The area of education (including lifestyle modification) allows Platform members to put
forward commitments that relate to educating consumers about nutrition and healthy
lifestyles. In 2015, there were 33 commitments implemented in this area, out of which
three were completed in 2015. In contrast, there were five new commitments
submitted in 2015.
As in the previous year, commitments were being implemented both by industry
representations (such as FoodDrinkEurope, COPA-COGECA or EVA) and by non-for-
profit associations (such as IDF Europe or WOF). Similar to 2014, around half of the
commitments (16 out of 33) were submitted by FoodDrinkEurope. A summary of the
number of commitments per Platform member is provided in Table 7.
There were also three joint commitments implemented throughout the course of 2015,
one of which was a new joint commitment created between EASO and EFAD. With
commitment n°1706 (‘European Guidelines for Management of Obesity in Adults and
Children’), EASO and EFAD form a Nutrition Working Group which aims at: (1)
undertaking a landscaping exercise with national members to review and assess the
availability, quality and use of national dietary guidelines; and (2) developing and
disseminating evidence-based best-practice European dietary and lifestyle guidelines
for management of obesity.
Table 7. Number of commitments per Platform member
Platform monitoring reports 2015
Figure 52 below shows the geographical coverage of commitments. As in the previous
year, a significant proportion of commitments were either nationally based (14 out of
33) or covered more than 20 European countries (12 out of 33). Only six
commitments covered between two and 20 countries.
Most of the commitments covering more than 20 countries included all EU-27 Member
States, with three covering all EU-28 Member States. Most of them also covered non-
EU Member States (Switzerland, Norway and Iceland). An example of a commitment
that covered all the 28 Member States, as well as Switzerland, Norway and Iceland is
n°1060, ‘ESPGHAN contribution to obesity prevention’, undertaken by ESPGHAN,
which aims to contribute to obesity prevention in children/adolescents via professional
Platform member N° of commitments
FoodDrinkEurope 16
COPA-COGECA 5
EUFIC 2
Joint commitment between EUFIC) and EFAD 2
EASO 1
Joint commitment between EASO and EFAD 1
IDF Europe 2
World Obesity Federation (WOF) 1
EUROPREV 1
ESPGHAN 1
EVA 1
Total 33

Monitoring the activities of the EU Platform for Action on Diet, Physical Activity and Health – Annexes 1-3
May, 2016 57
educational activities, scientific position papers, and promoting and disseminating
research.
Of the 14 commitments that were nationally based, four took place in Denmark, three
in Belgium, two in France and two in the UK. There was also one nationally based
commitment in each of the following countries: Germany, Poland and Switzerland. An
example of a nationally based commitment is n°1065, ‘Holiday Food and Nutrition
Camps (Madskoler)’ by the Danish Agriculture & Food Council (member of COPA-
COGECA). This commitment relates to the organisation and management of Holiday
Food and Nutrition Camps in Denmark, aiming to teach children how to cook healthy
food and to teach them about diet and physical activities.
Figure 52. Geographic coverage of commitments in the area of education, including
lifestyle modification
Source: Platform monitoring reports - education, including lifestyle modification 2015, N=33
The countries that were had most coverage from the commitments were the UK (19),
Belgium and France (each covered by 18), while Croatia remained the least covered9
(eight commitments only). This is illustrated in Figure 53 below.
9 Croatia is the newest member state, having become a member on 1 July 2013.

Monitoring the activities of the EU Platform for Action on Diet, Physical Activity and Health – Annexes 1-3
May, 2016 58
Figure 53. Geographic coverage of commitments in the area of education, including
lifestyle modification
Source: Platform monitoring reports - education, including lifestyle modification 2015, N=33
Figure 54 below shows that, similarly to the previous year, around a third of
commitments (12 out of 33) targeted children and young people. As in 2014, other
frequently targeted groups were health professionals, followed by the general public
and employees. None of the commitments specifically targeted policy makers, the
industry or special groups. An example of a commitment targeting children and young
people is n°1614 (‘Arla Fonden Food Camps’, by Arla Fonden (member of COPA-
COGECA)). Under this commitment, Arla Fonden runs Food Camps, and hopes to bring
about a positive change in the lifestyles of Danish children and adolescents,
encouraging them to cook, and be more familiar with food, nature and local produce.
Figure 54. Target audiences of commitments in the area of education, including
lifestyle modification
Source: Platform monitoring reports - education, including lifestyle modification 2015, N=33

Monitoring the activities of the EU Platform for Action on Diet, Physical Activity and Health – Annexes 1-3
May, 2016 59
4.1 Design and intent of action
4.1.1 S.M.A.R.T. objectives
Figure 55 shows that just over half of the commitments (16 out of 33) had either
mostly or fully S.M.A.R.T. annual objectives for 2015, while nine per cent of
commitments (three out of 33) did not set S.M.A.R.T. objectives. This is a slight
improvement compared to 2014, where only 42 per cent (14 out of 33) of the
commitments had either mostly or fully S.M.A.R.T. objectives, and 21 per cent (seven
out of 33) did not set S.M.A.R.T. objectives.
The majority of the 2015 reported annual objectives were assessed as achievable and
realistic. A third of the goals (12 out of 33) were deemed not specific, and even fewer
reports set measurable and time-bound targets.
An example of a commitment which set fully S.M.A.R.T. objectives is n°810,
‘Improving medical and health professional skills to counteract obesity’ by WOF. The
report sets out a list of clear, specific goals, with quantitative targets (e.g. “to attract
a further 1,000 registered site visitors and certify a further 30 health care
professionals”).
Figure 55. S.M.A.R.T. objectives
Source: Platform monitoring reports - education, including lifestyle modification 2015, N=33
4.1.2 Relevance of commitments
4.1.2.1 Link to EU Platform and EU policy goals
The quality of reporting in terms of links to the Platform’s objectives decreased in
comparison to 2014, with only eight of the 33 commitments making an explicit link.
An example of an explicit link can be found in commitment n°1313 (‘Diabetes
Prevention Forum “Manage Care”’) by IDF Europe. The monitoring report stated: "The
Diabetes Prevention Forum (DPF) is relevant to the Platform as it works to raise
awareness of pre-diabetes and the prevention of type 2 diabetes through encouraging
those people most at risk to adopt healthier lifestyles”.
Four of the commitments were not deemed relevant to the stated priorities of the
Platform (compared to zero in 2014). These were, for instance, commitments by
multinational companies that perhaps reflected more corporate social responsibility
(CSR) actions than specifically Platform-related commitments.
Fully SMART; 2; 6%
Mostly SMART; 14; 43%
Partially SMART; 14; 42%
Not SMART; 3; 9%
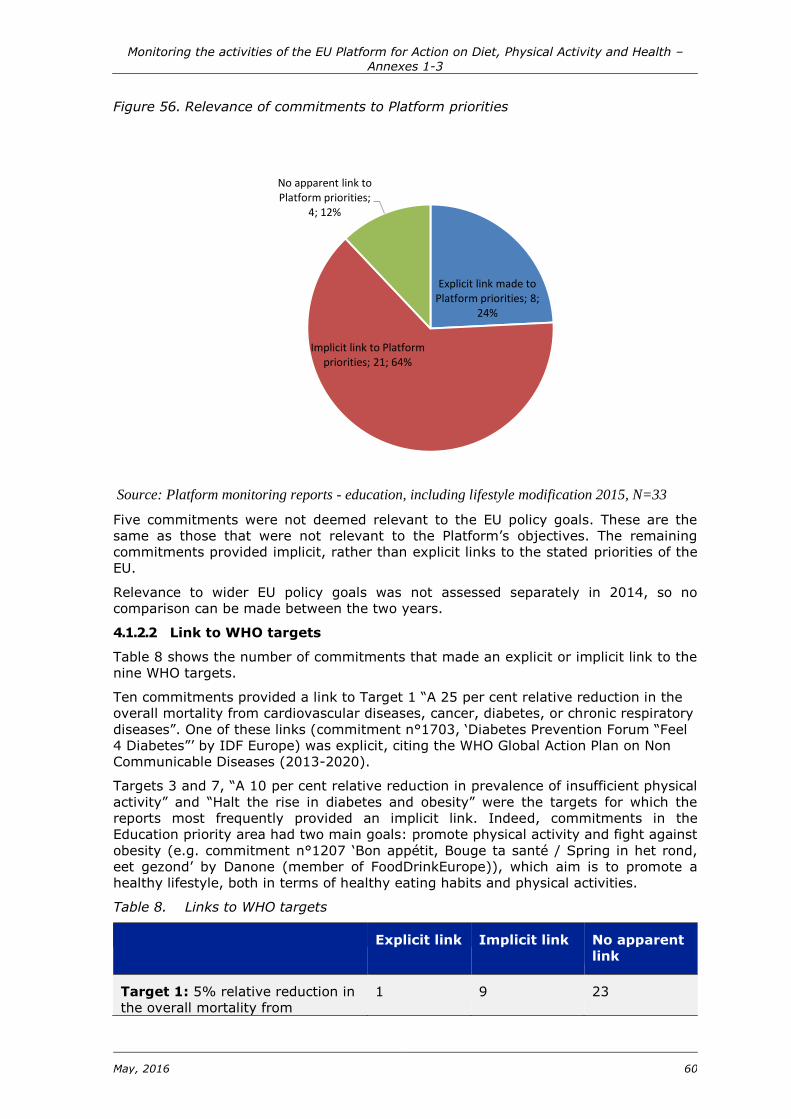
Monitoring the activities of the EU Platform for Action on Diet, Physical Activity and Health – Annexes 1-3
May, 2016 60
Figure 56. Relevance of commitments to Platform priorities
Source: Platform monitoring reports - education, including lifestyle modification 2015, N=33
Five commitments were not deemed relevant to the EU policy goals. These are the
same as those that were not relevant to the Platform’s objectives. The remaining
commitments provided implicit, rather than explicit links to the stated priorities of the
EU.
Relevance to wider EU policy goals was not assessed separately in 2014, so no
comparison can be made between the two years.
4.1.2.2 Link to WHO targets
Table 8 shows the number of commitments that made an explicit or implicit link to the
nine WHO targets.
Ten commitments provided a link to Target 1 “A 25 per cent relative reduction in the
overall mortality from cardiovascular diseases, cancer, diabetes, or chronic respiratory
diseases”. One of these links (commitment n°1703, ‘Diabetes Prevention Forum “Feel
4 Diabetes”’ by IDF Europe) was explicit, citing the WHO Global Action Plan on Non
Communicable Diseases (2013-2020).
Targets 3 and 7, “A 10 per cent relative reduction in prevalence of insufficient physical
activity” and “Halt the rise in diabetes and obesity” were the targets for which the
reports most frequently provided an implicit link. Indeed, commitments in the
Education priority area had two main goals: promote physical activity and fight against
obesity (e.g. commitment n°1207 ‘Bon appétit, Bouge ta santé / Spring in het rond,
eet gezond’ by Danone (member of FoodDrinkEurope)), which aim is to promote a
healthy lifestyle, both in terms of healthy eating habits and physical activities.
Table 8. Links to WHO targets
Explicit link Implicit link No apparent
link
Target 1: 5% relative reduction in
the overall mortality from
1 9 23
Explicit link made to Platform priorities; 8;
24%
Implicit link to Platform priorities; 21; 64%
No apparent link to Platform priorities;
4; 12%

Monitoring the activities of the EU Platform for Action on Diet, Physical Activity and Health – Annexes 1-3
May, 2016 61
cardiovascular diseases, cancer,
diabetes, or chronic respiratory
diseases
Target 2: At least 10% relative
reduction in the harmful use of
alcohol
0 0 33
Target 3: 10% relative reduction in
prevalence of insufficient physical
activity
0 18 15
Target 4: 30% relative reduction in
mean population intake of
salt/sodium
0 2 31
Target 5: 30% relative reduction in
prevalence of current tobacco use in
persons aged 15+ years
0 3 30
Target 6: 25% relative reduction in
the prevalence of raised blood
pressure or contain the prevalence
of raised blood pressure
0 3 30
Target 7: Halt the rise in diabetes
and obesity
0 23 10
Target 8: At least 50% of eligible
people receive drug therapy and
counselling to prevent heart attacks
and strokes
0 0 33
Target 9: 80% availability of the
affordable basic technologies and
essential medicines, including
generics, required to treat major
NCDs
0 0 33
Source: Platform monitoring reports - education, including lifestyle modification 2015, N=33
Links with WHO targets were not assessed for 2014 commitments and so a
comparison between the two years is not possible.
4.1.3 Actions to reduce health inequalities
In the area of education, including lifestyle modification, seven commitments (or 21
per cent) explicitly addressed health inequalities. This is an improvement compared to
the previous year, where only four out of 33 commitments (or 12 per cent) referred to
reducing health inequalities.
Most of the commitments that focused on health inequalities looked at low-income,
deprived households. One commitment, n°1009 (‘CleverNaschen’ by Mars (member of
FoodDrinkEurope)) consists of a platform that provides parents with information
provided by independent experts and institutions around three main themes: nutrition,
exercise and health. CleverNaschen aims to reduce health inequalities “among the
most vulnerable groups of the population through initiatives reducing barriers to
healthy diets and physical activity”. In this case, migrants were identified.

Monitoring the activities of the EU Platform for Action on Diet, Physical Activity and Health – Annexes 1-3
May, 2016 62
Figure 57. Actions to reduce health inequalities
Source: Platform monitoring reports - education, including lifestyle modification 2015, N=33
4.1.4 Using evidence in design
Figure 58 below indicates that the majority of the commitments (22 out of 33) showed
evidence of need and/or likely effectiveness. This proportion is smaller than in the
previous year, where 25 out of 33 commitments documented evidence in the design of
commitments.
For instance, commitment n°1413 (‘Global Employee Health Programme –
Lamplighter’ by Unilever (member of FoodDrinkEurope)) aims to protect Unilever’s
employees from work-related hazards, as well as promoting their health. The need for
action is shown by the following statement: "Improving the health and wellbeing of
[Unilever’s] employees is essential for continued business success", while likely
effectiveness is demonstrated by Unilever’s finding that if employees are kept
motivated during the first six months of a programme of change, positive changes are
likely to remain.
As in the previous year, a small proportion of commitments (three out of 33) aimed at
generating evidence. For instance, with commitment n°526 (‘Using EUFIC
communication vehicles to raise awareness of the EU Platform’) EUFIC aims to use its
communication tools to help raise awareness of and spread information about the
work of the Platform.
The proportion of commitments that used neither evidence of need nor likely
effectiveness, and did not commit to generate evidence, was larger than in the
previous year (eight out of 33 instead of four out of 33).

Monitoring the activities of the EU Platform for Action on Diet, Physical Activity and Health – Annexes 1-3
May, 2016 63
Figure 58. Use of evidence in commitment design
Source: Platform monitoring reports - education, including lifestyle modification 2015, N=33
4.2 Implementation and results
4.2.1 Level of implementation
Figure 59 below shows the level of implementation of the actions. A little under half of
the commitments (15 out of 33) fully implemented their actions. Another 15
commitments were judged to have been mostly implemented and one partially
implemented. For the remaining two commitments, not enough information was
provided to make an assessment. In the previous year, the proportion of fully
implemented commitments was larger (21 out of 33) but there were also more
commitments with an unsatisfactory level of information (five out of 33).
Figure 59. Level of commitment implementation
Source: Platform monitoring reports - education, including lifestyle modification 2015, N=33
Commitment n°1036 (‘Smart Choice Programme for Vending in Education’) by EVA is
an example of a fully implemented commitment. The presentation of annual objectives
and indicators is very clearly made, so it is easy to understand how well the goals
were achieved. For instance, the third objective is stated as follows: “3) to reward

Monitoring the activities of the EU Platform for Action on Diet, Physical Activity and Health – Annexes 1-3
May, 2016 64
minimum all 500 schools that have taken sports initiatives with sports equipment” and
the outputs were given as follows: “3) Mars rewarded 500 schools that took part or
are going to take part in more sport initiatives by giving them ''sport points'' in
exchange for which they can then “buy” sport equipment.”
4.2.2 Main inputs reported (human and financial)
As in the previous year, there were significant differences between commitments
regarding the detail and the quality of information provided (both in relation to human
and financial resources).
Figure 60. Main inputs reported
Source: Platform monitoring reports - education, including lifestyle modification 2015, N=33
In the majority of the reports (25 out of 33, or 76 per cent), as illustrated in Figure
60, some information on the financial costs of actions was provided. This is similar to
the 2014 figures (24 out of 33). In 2015, financial costs ranged from EUR 2,500 to
EUR 1,344,000, bringing the total reported sum of EUR 6,428,015 in this activity area.
This is only slightly higher than in 2014, when EUR 6,095,700 was reported.
Regarding human resource inputs, the analysis looked into the number of full time
(FTE) and part time (PTE) employees working on the action, whether volunteer time
was used, and if the monetary value spent on human resources was provided. In most
of the commitments (20 out of 33), information was provided in relation to the
number of employees working on the actions. For the commitments that provided
information, the number of full time employees ranged from one to 20 FTE employees,
and from one to 37 PTE employees. As in the previous year, a small number
commitments (five) provided information on whether some of the work was carried
out by volunteers.
Furthermore, the number of hours spent on implementing the commitment was
quantified when there was information that enabled these calculations (e.g. seven full-
time people or 1.2 FTE/year). As previously explained, calculations were made based
on the assumption that a full time employee could work 8 hours per day/40 hours per
week/48 weeks a year (1,920 hours). Information pertaining to number of hours spent
was provided in about approximately 60 per cent of the commitments (20 out of 33).
This is an improvement compared to the previous year where approximately 51 per
cent of the commitments (17 out 33) provided information. In 2015, the annual
number of hours ranged from 96 to 84,420, totalling around 145,264 hours. This is a
much higher value than in 2014 (53,644 hours).

Monitoring the activities of the EU Platform for Action on Diet, Physical Activity and Health – Annexes 1-3
May, 2016 65
As in the previous year, information on the costs of paying staff was provided in a
small number (three) of the monitoring reports.
4.2.3 Outputs
Figure 61 shows the quality of reporting for outputs. Information was provided in all
but one of the monitoring reports, however the degree of details given varied.
For 22 of the 33 commitments, outputs were clearly explained, with detailed
quantitative and qualitative information directly related to the commitments’ annual
objectives. For example, in commitment n°526 (‘Using EUFIC communication vehicles
to raise awareness of the EU Platform’) EUFIC clearly detail each one of the outputs,
with detailed quantitative information (e.g. number of downloads, number of clicks,
number of events etc.).
In other cases the information provided was not specific or not clear enough (e.g.
quantitative information was missing for some of the objectives). For instance, the
report for commitment n°1065 (‘Holiday Food and Nutrition Camps (Madskoler)’) by a
member of COPA-COGECA provides very good reporting of outputs for the first of the
three goals ("extend the food camps to new locations") but there is no information on
the other two goals: "to reduce the work load" and "to use a new, comprehensive
digital work database".
As a final point, not all commitments presented the indicators in the correct way. In
some instances, information in the outputs box related to inputs or outcomes. In other
cases, the opposite was true: information on outputs could be found in the inputs or
outcomes boxes. For instance, in one report the inputs sectioned referred to the
number of handbooks, posters and brochures prepared (outputs), while outcomes
refer to the number of schools and pupils reached.
Figure 61. Commitment outputs
Source: Platform monitoring reports - education, including lifestyle modification 2015, N=33
4.2.4 Outcomes and dissemination
Figure 62 illustrates the quality of reporting for outcomes, showing - similarly to 2014
- a number of commitments did not provide information on outcomes (13 out of 33).
This is either because no details were reported in the “outcomes” box, or because the
information contained in that report section related to outputs only.

Monitoring the activities of the EU Platform for Action on Diet, Physical Activity and Health – Annexes 1-3
May, 2016 66
However, and similarly to the previous monitoring year, eight out of 33 commitments
reported clearly on outcomes. For example, commitment n°1065 (‘Holiday Food and
Nutrition Camps (Madskoler)’), implemented by the Danish Agriculture & Food Council
(member of COPA-COGECA), clearly reported on outcomes, highlighting the results of
a questionnaire sent to parents. It was therefore possible to assess the impact of the
camps on children’s behaviour towards healthy eating and physical activity as a result.
Figure 62. Reporting on outcomes
Source: Platform monitoring reports - education, including lifestyle modification 2015, N=33
Additionally, analysis of commitments observed the extent to which the results were
disseminated. As shown in Figure 63, there was information indicating dissemination
of results in 12 of the 33 commitments. This was an improvement compared to the
previous year, where members reported on disseminating their results in only 12 of
the 33 commitments.
Figure 63. Dissemination of results
Source: Platform monitoring reports - education, including lifestyle modification 2015, N=33

Monitoring the activities of the EU Platform for Action on Diet, Physical Activity and Health – Annexes 1-3
May, 2016 67
4.2.5 Additionality
As shown in Figure 64 only three out of 33 commitments did not provide enough
information on which to assess their additionality. This is a significant improvement
compared to 2014, where 24 commitments did not give sufficient information.
In 2015 and similarly to the previous year, one commitment would not have taken
place without the Platform. This was commitment n°526 (Using EUFIC communication
vehicles to raise awareness of the EU Platform’) by EUFIC. Indeed, as suggested by its
title, the whole commitment revolves around the Platform.
Other three commitments took place at a greater scale or sooner because of the
Platform. This is an increase in comparison to 2014 reporting. An example is
commitment n°837 (‘Healthy Choice the Easy Choice’, by Unilever (member of
FoodDrinkEurope)). It aims to help consumers quickly identify a healthier product at
the moment of purchase. This commitment could take place without the Platform.
However, the Platform enables it to take place at a greater scale, as "through its
multi-stakeholder nature, [the Platform] provided Choices with a forum to share
knowledge, best practices and to jointly help make the healthy choice easy".
This year’s analysis points towards a higher quality of commitment actions as a result
of the Platform for six commitments (compared to zero in 2014). One example is
n°1013 (‘Supporting the Epode European Network’, by Mars (member of
FoodDrinkEurope)). The Epode Network was an initiative by DG SANCO, so the
commitment would have occurred without the Platform. However, it appears the
commitment is of higher quality thanks to the Platform, as the Platform helps Mars
work in multi-stakeholder partnerships involving all sectors of society both in the
public and private sectors.
Lastly, 20 commitments were deemed to be not additional; this is a much larger
number than in the previous year (seven). Commitments in this activity area assessed
as not being additional were either part of an existing project (funded by alternative
EU funds) or were seen to be operating fully independently of the Platform, with no
stated links to sharing work or gathering knowledge from the Platform.
Figure 64. Commitment additionality
Source: Platform monitoring reports - education, including lifestyle modification 2015, N=33
4.2.6 EU-added value
In 2014, 23 of the 33 commitments did not provide information concerning the EU-
added value of their actions. However, as shown in Figure 65, only two commitments

Monitoring the activities of the EU Platform for Action on Diet, Physical Activity and Health – Annexes 1-3
May, 2016 68
did not do so in 2015, showing a significant improvement in reporting of information
which demonstrates the EU-added value of commitments.
For the majority of the commitments (24 out of 33), there did not appear to be an EU-
added value from taking part in the Platform. However, seven commitments did
demonstrate at least partially EU-added value. Furthermore, one commitment was
assessed as fully demonstrating EU-added value: commitment n°524 (‘Increasing the
outreach of EUFICs information on healthy lifestyles’, implemented by EUFIC). With
this commitment, EUFIC aims to provide science-based information on healthy diets
and lifestyles to larger audiences in many languages, in cooperation with partners in
Europe and promotion via its website. As stated in the report, “the existence of this
commitment brings additional high-quality science-based credibility and scale to EU
stakeholder and public focus on tackling obesity in Europe, while offering significant
added-value to existing EU funded projects and initiatives".
Figure 65. EU-added value
Source: Platform monitoring reports - education, including lifestyle modification 2015, N=33
4.2.7 Recommendations for additional actions
The number of commitments making recommendations for additional actions was
stable between 2014 and 2015. Ten of the 33 commitments provided
recommendations for additional actions in 2015, in comparison to 11 having done so
in 2014.
For example, the report for commitment n°1706 ‘European Guidelines for
Management of Obesity in Adults and Children’ (a joint commitment between EASO
and EFAD) clearly stated that the action would take place in two steps, over a period
of several years, with an additional (new) commitment being implemented from 2017
onwards.

Monitoring the activities of the EU Platform for Action on Diet, Physical Activity and Health – Annexes 1-3
May, 2016 69
Figure 66. Recommendations for additional actions
Source: Platform monitoring reports - education, including lifestyle modification 2015, N=33
4.3 Overall assessment
Figure 67 illustrates a slight improvement in the overall assessment of commitments
in the area of education. Out of the 33 commitments, only ten were assessed as highly
satisfactory while 17 were deemed satisfactory and six of the commitments were
assessed as non-satisfactory. This is contrast to 2014 monitoring where only six of the
33 commitments were assessed as highly satisfactory, with a larger proportion of
commitments (eight out of 33) considered non-satisfactory.
Figure 67. Overall assessment of reporting
Source: Platform monitoring reports - education, including lifestyle modification 2015, N=34;
2015, N=33
The reports rated as highly satisfactory had mostly or fully S.M.A.R.T. objectives as
well as a very good reporting of inputs, outputs and outcomes. However, highly
satisfactory reports did not consistently demonstrate additionality or EU-added value.

Monitoring the activities of the EU Platform for Action on Diet, Physical Activity and Health – Annexes 1-3
May, 2016 70
The non-satisfactory reports did not provide S.M.A.R.T. annual objectives for 2015 and
gave limited or no information on inputs, outputs and outcomes.
4.4 Synergies, joint commitments and transferability
As a final part of the assessment, analysis was conducted on possible synergies, joint
commitments and transferability of commitment actions; this was done using
information included in the monitoring reports, and does not take into consideration
external or internal factors related to design and implementation of the actions.
4.4.1 Synergies and joint commitments
In terms of synergies, a couple of commitments submitted in the area of education
had the potential to strengthen the offer of other commitments if the two were to
interact with each other in some way. In this case, commitment n°1706 (‘European
Guidelines for Management of Obesity in Adults and Children’), implemented by EASO
and EFAD, set up a Nutrition Working Group aiming at developing and disseminating
evidence-based best-practice on European dietary and lifestyle guidelines for
management of obesity. These guidelines could be used in other commitments such as
n°1060 (‘ESPGHAN contribution to obesity prevention’), which aims to contribute to
obesity prevention in children/adolescents via professional educational activities,
scientific position papers, and promoting research.
There is also potential for some of the industry commitments submitted under
reformulation to become joint commitments with others. For example, commitment
n°1001 (‘EPODE (Ensemble Prévenons l'Obesité des Enfants) / EEN (European Epode
Network))’) under which Ferrero Group supports the activities of the EPODE, could be
run jointly with commitment n°1013 (‘Supporting the Epode European Network’,
implemented by Mars).
What is more, there could be stronger synergies between all of the actions that consist
of food programmes targeted at children and teenagers. For instance, the aims and
actions of the following commitments are very similar: n°1065 (‘Supporting the Epode
European Network’), n°1614 (‘Arla Fonden Food Camps’), n°1704 (‘Farming and
Countryside Education (FACE)’), n°1208 (‘Eat like a Champ’) etc.
4.4.2 Transferability
This year’s assessment of commitments explored possible transferability of
commitment aims and actions. In this context, transferability means that the design
and intent of an action could be replicated in another setting (e.g. organisational,
geographical) or that the action could be replicated by another organisation in another
locality or by the same organisation in another locality.
As shown in Figure 68 , around 30 per cent of the commitments in this priority area
(23 out of 33) were not deemed transferable. Main reasons behind this were that
commitments are either already implemented in all of the EU Member States, or are
implemented by one European organisation at a central level, such that responsibility
cannot be transferred.
However, analysis shows that there could be scope to transfer all of the 23 other
commitments. For instance, commitment n°1704 (‘Farming and Countryside Education
(FACE)’), which aims to facilitate educational visits to farms, is implemented by the
National Farmers' Union in England and Wales (member of COPA-COGECA). COPA-
COGECA could increase the scope of the project by promoting this commitment to its
other members and encouraging similar action within other countries.

Monitoring the activities of the EU Platform for Action on Diet, Physical Activity and Health – Annexes 1-3
May, 2016 71
Figure 68. Transferability of actions
Source: Platform monitoring reports - education, including lifestyle modification 2015, N=33
4.5 Conclusions and recommendations
4.5.1 Conclusions
Overall, the quality of reports in the area of education, including lifestyle modification
was satisfactory, demonstrating a slight improvement between 2014 and 2015. In
2015, 30 per cent of the commitments were considered highly satisfactory (as
opposed to 18 per cent in 2014), 52 per cent satisfactory, and 18 per cent non-
satisfactory (as opposed to 24 per cent in 2014).
The main findings concerning the design and intent of commitments in this activity
area can be summarised as follows:
Almost half of commitments had either mostly or fully S.M.A.R.T. objectives for
2015 (49 per cent, or 16 out of 33). This is only a slight improvement
compared to 2014, where 42 per cent of commitments (14 out of 33) had
S.M.A.R.T. objectives.
Only eight of the 33 commitments made an explicit link to the Platform’s
objectives. Five commitments did not have an apparent link to the Platform or
EU priorities. This is a decrease compared to the previous year, where 11 of the
33 commitments made an explicit link and all of the commitments had at least
an implicit link to the Platform. Furthermore, links with the WHO targets were
not explicitly clear, with only one report making an explicit link to one target.
Although there was an improvement compared to 2014, there are still very few
commitments setting out to reduce health inequalities as demonstrated by this
year’s monitoring exercise (seven out of 33).
The majority of the commitments (25 out of 33) showed evidence of need
and/or likely effectiveness or aimed to generate evidence. However, this
proportion is smaller than in the previous year (29 out of 33).
Geographical coverage of commitments remained consistent with 2014, and
continues to be mixed. 36 per cent of commitments cover more than 20
countries, but 43 per cent cover just one. More needs to be done to show
ambition and expand the geographic scope of education commitments.
The main findings concerning the implementation and results of commitments are as
follows:

Monitoring the activities of the EU Platform for Action on Diet, Physical Activity and Health – Annexes 1-3
May, 2016 72
The proportion of commitments providing information on financial costs of the
actions was similar to 2014 (25 out of 33). However, compared to 2014, a
larger proportion of monitoring reports in 2015 provided information on staff
inputs. The total reported sum of costs was slightly higher in 2015 than in
2014, while the number of hours reported was significantly higher in 2015 than
in 2014.
As in the previous year, reporting on outputs was of satisfactory quality. In
2015, 67 per cent of reports provided clear details on outputs (22 out of 33).
Reporting on outcomes was of lesser quality: only 24 per cent provided clear
details on outcomes (eight out of 33).
Reporting on additionality significantly improved between 2014 and 2015. Only
three out of 33 commitments did not provide enough information on the extent
to which the commitments seemed to have been additional with regards to the
Platform (compared to 24 of 33 commitments in 2014).
Reporting on EU-added value also significantly improved between 2014 and
2015. Only two out of 33 commitments did not provide enough information on
the extent to which the commitments demonstrated EU-added value (compared
to 23 of 33 commitments in 2014).
4.5.2 Recommendations
As a result of this year’s assessment, and taking into consideration the comparison to
2014 monitoring, a number of recommendations can be put forward for this activity
area:
Around half of the commitments (17 out of 33) would benefit from adding
specific, measurable and time bound targets to their annual objectives; this will
allow for developing fully S.M.A.R.T. objectives and will facilitate the annual
reporting by Members as well as the analysis by ICF.
Overall, more clarity on commitments’ relevance to the objectives of the
Platform and the value of their relationship with the Platform is needed. Five of
the commitments in 2015 did not have apparent link to the Platform nor to EU
policy goals.
More details would also be useful in terms of evidence of need for action and
likely effectiveness of the action: around one quarter of commitments (eight
out of 33) did not use evidence in the design.
Some commitments were poorly presented, with indicators (inputs, outputs and
outcomes) not reported in the correct boxes. All members are asked to
implement a good practice that would consist in using a structure whereby
objectives were numbered, and then corresponding inputs, outputs and
outcomes were listed and reported on.
All commitments should report accurately on financial costs of inputs as well as
on staff inputs.
Improvements in terms of details for outputs and especially outcomes are
needed.
Commitments should strive to be additional to their day to day activities:
around 60 per cent of commitments (20 out of 33) were deemed not additional
in 2015. Similarly, commitments should strive to demonstrate the EU-added
value of their action: almost three quarters of commitments (24 out of 33) did
not do so. Both these assessment criteria aim to demonstrate the importance of
Platform activity and the impact it can have on contributing to improving public
health within the EU.
Monitoring the activities of the EU Platform for Action on Diet, Physical Activity and Health – Annexes 1-3
May, 2016 73
5 Physical activity promotion
Commitments in the area of physical activity promotion cover a wide range of
activities, including the organisation of events, raising awareness and dissemination
activities. Such actions were undertaken by different types of organisations, including
industry (seven actions) and non-for-profit organisations (six action actions)10, as
demonstrated by Table 9 below
Table 9. Number of commitments per Platform member
Platform member N° of commitments
FERRERO Group 1
Danone Group 1
MARS 1
EUFIC 1
Danone Spain 1
CESS 1
Joint commitment between ISCA and Coca-Cola 2
ER-WCPT 1
WOF 1
EuropeActive 1
Total 11
Source: Platform monitoring reports – physical activity promotion, N=11
Figure 69 below shows the geographical coverage of the commitments in this area.
Five commitments out of 11 cover more than 20 countries; two cover between two
and 10 countries; one covers between 11 and 15 countries; and three cover only one
country. This reflects a very similar coverage as reported in the 2014 monitoring
exercise; with the number of commitments covering 20 or more Member States
remaining the same (five actions out of 12 in the previous year).
An example of a commitment covering more than 20 countries is n°431 (‘Promotion of
physical activity’), run by Ferrero Group. It also covers Norway and Switzerland. Those
commitments that were nationally based were implemented in Spain and Poland. An
example of nationally based commitment is n°1418 (‘Danone Sport Schools’), by
Danone Spain, which aims to: help children develop and practice healthy habits and
hygiene; develop their attitudes of respect and collaboration; and boost motivation.
10
Two actions were undertaken by a private company and a non-for-profit association together.

Monitoring the activities of the EU Platform for Action on Diet, Physical Activity and Health – Annexes 1-3
May, 2016 74
Figure 69. Geographic coverage of commitments in the area of physical activity
promotion
Source: Platform monitoring reports – physical activity promotion 2015, N=11
On average, EU-28 countries were covered by six different commitments, with
countries mostly being covered by between five and six commitments. Those most
covered were Spain (covered by ten), Ireland and the United Kingdom (each covered
by eight), while Croatia remains the country least covered11.
Figure 70. Geographic coverage of commitments in the area of physical activity
promotion
Source: Platform monitoring reports – physical activity promotion 2015, N=11
11
Croatia is the newest member state, having become a member on 1 July 2013.

Monitoring the activities of the EU Platform for Action on Diet, Physical Activity and Health – Annexes 1-3
May, 2016 75
Figure 71 below shows the target audience of commitments on physical activity
promotion. The majority of commitments in this area are aimed at children and young
people (five out of the 11 commitments); followed by the general public (three out of
11). Two actions aimed at health professionals, one at a special group (hard-to-reach
physically inactive populations) and one at senior citizens. None of the commitments
were aimed at industry, parents, policy makers or educators.
The coverage is very similar to the previous year, where four actions out of 12 were
aimed at children and young people, four at the general public, two at health
professionals and two at special groups.
An example of commitment targeting children is n°1012 (‘Bielice Run' - Young
Europeans Run’ by Mars), which aims at promoting physical activity among children in
schools, as well as fair play and integration of disabled children.
Figure 71. Target audiences of commitments in the area of physical activity promotion
Source: Platform monitoring reports – physical activity promotion 2015, N=11
An example of action targeting the general public is ‘Using EUFIC communication
vehicles to promote physical activity’, by the European Information Council. This
action aims at sharing scientific information about nutrition and physical activity in
order to raise awareness about these topics.
5.1 Design and intent of action
5.1.1 S.M.A.R.T. objectives
Figure 72 below shows that two commitments out of 11 were assessed as having fully
S.M.A.R.T. objectives, seven as having mostly S.M.A.R.T. objectives and two as
having partially S.M.A.R.T. objectives. None of the actions were assessed as not
having set S.M.A.R.T. objectives at all. The objectives were specific, achievable and
realistic, but in many cases they were not time bound nor measurable12 The actions
with partially S.M.A.R.T. objectives had only achievable and realistic objectives, while
they were not measurable, specific or time bound.
The analysis showed very similar results in 2014, where two commitments out of 12
had fully S.M.A.R.T. objectives, five had mostly, four had partially and one had not set
S.M.A.R.T. objectives at all.
12
In this case they classified as mostly S.M.A.R.T.

Monitoring the activities of the EU Platform for Action on Diet, Physical Activity and Health – Annexes 1-3
May, 2016 76
Figure 72. S.M.A.R.T. objectives
Source: Platform monitoring reports – physical activity promotion 2015, N=11
5.1.2 Relevance of commitments
5.1.2.1 Link to EU Platform and EU policy goals
The analysis also looked into the relevance of the actions to the objectives of the
Platform and to the EU Policy goals in the area of nutrition and physical activity (as
shown in Figure 73 and Figure 74 below).
The commitments were all considered relevant to the objectives of the Platform,
however only two of them made an explicit reference to the Platform. An example of
commitment making explicit relevance to the Platform objectives was n°1609
(‘Promoting physical activity in children, the role of Physiotherapists’, by the European
Region of the World Confederation for Physical Therapy), which explicitly mentions the
work of the Platform, the High Level Group on Nutrition and Physical Activity and the
European Action Plan on Childhood Obesity.
The remaining nine commitments had an implicit reference to the priorities of the
Platform. For instance n°1615 (‘DAPHNE - Data-as-a-Service platform for Healthy
Lifestyle support’, by the World Obesity Federation), had an implicit link with the
objectives of promoting healthy lifestyle and fighting against obesity.
A decrease in the number of explicit references to the Platform can be identified in
comparison with 2014, where five commitments out of 12 made an explicit link to the
Platform objectives, while seven showed an implicit link with them.

Monitoring the activities of the EU Platform for Action on Diet, Physical Activity and Health – Annexes 1-3
May, 2016 77
Figure 73. Relevance of commitments to Platform priorities
Source: Platform monitoring reports – physical activity promotion 2015, N=11
As illustrated in Figure 74 below, the vast majority of commitments (nine) contained
an implicit link to wider EU objectives, with two commitment monitoring reports
making an explicit link with EU priorities. Relevance to wider EU policy goals was not
assessed separately in 2014, so no comparison can be made between the two years.
Figure 74. Relevance of commitments to wider EU priorities
Source: Platform monitoring reports – physical activity promotion 2015, N=11
An example of a commitment monitoring report making an explicit link to EU priorities
is n°1701 (‘Promoting Physical Activity and Health in Ageing (PAHA) ‘, run by
EuropeActive13). Its report makes direct links to recommendations and policy
principles set out by the EU Expert Group on Sport, Health and Participation.
13
Formerly EHFA

Monitoring the activities of the EU Platform for Action on Diet, Physical Activity and Health – Annexes 1-3
May, 2016 78
5.1.2.2 Link to WHO targets
In general, links between commitments and WHO targets were implicit rather than
explicit, as illustrated in Table 10 below. In the area of physical activity promotion,
only one commitment made an explicit link to one of these targets, while others had
an implicit link to one or more of the targets.
One commitment made an explicit link with Target 3 (‘A 10 per cent relative reduction
in prevalence of insufficient physical activity’). This was n°1609 (‘Promoting physical
activity in children, the role of Physiotherapists’), and was undertaken by European
Region of the World Confederation for Physical Therapy, where reference was made to
the WHO recommendation to children to do 60 minutes of physical activity every day.
One commitment was implicitly related to Target 1 (‘A 25 per cent relative reduction in
the overall mortality from cardiovascular diseases, cancer, diabetes, or chronic
respiratory diseases’). Finally, 10 commitments had an implicit link with Target 7 (‘halt
the rise in diabetes and obesity’).
Table 10. Links to WHO targets
Explicit link Implicit link No apparent
link
Target 1: 5% relative reduction in
the overall mortality from
cardiovascular diseases, cancer,
diabetes, or chronic respiratory
diseases
0 1 10
Target 2: At least 10% relative
reduction in the harmful use of
alcohol
0 0 11
Target 3: 10% relative reduction in
prevalence of insufficient physical
activity
0 1 10
Target 4: 30% relative reduction in
mean population intake of
salt/sodium
0 0 11
Target 5: 30% relative reduction in
prevalence of current tobacco use in
persons aged 15+ years
0 0 11
Target 6: 25% relative reduction in
the prevalence of raised blood
pressure or contain the prevalence
of raised blood pressure
0 0 11
Target 7: Halt the rise in diabetes
and obesity
0 10 1
Target 8: At least 50% of eligible
people receive drug therapy and
counselling to prevent heart attacks
and strokes
0 0 11
Target 9: 80% availability of the
affordable basic technologies and
essential medicines, including
generics, required to treat major
NCDs
0 0 11

Monitoring the activities of the EU Platform for Action on Diet, Physical Activity and Health – Annexes 1-3
May, 2016 79
Source: Platform monitoring reports – physical activity promotion, N=11
5.1.3 Actions to reduce health inequalities
Two commitments out of 11 were reported as setting out to reduce health inequalities,
as demonstrated in Figure 75 below. An example is n°1606 (‘Now We Move –
Activation’, by International Sport and Culture Association/Coca Cola), which aimed at
developing the capacity of local and national entities to develop and/or implement
physical activity initiatives for hard-to-reach physically inactive populations.
A slight decrease can be identified in comparison with 2014, where five commitments
out of 12 stated to set out to reduce health inequalities, while the remaining seven did
not. However, it can be noted that one such commitment was completed in 2014.
Figure 75. Commitments set out to reduce health inequalities
Source: Platform monitoring reports – physical activity promotion, N=11
5.1.4 Using evidence in design
Figure 76 below shows that, in the area of physical activity promotion: three
commitments out of 11 provided evidence of need; one provided evidence of likely
effectiveness; and two committed to generate data or information. The remaining five
commitments did not refer to any reports or studies nor did they aim at generating
data or information. The use of evidence in the design of the actions seems to have
decreased in comparison with 2014, where five commitments out of 12 showed
evidence of need and likely effectiveness, three provided evidence of need only, two
committed to generate evidence and two did not provide any information.

Monitoring the activities of the EU Platform for Action on Diet, Physical Activity and Health – Annexes 1-3
May, 2016 80
Figure 76. Use of evidence in the design of the commitments
Source: Platform monitoring reports – physical activity promotion, N=11
An example of a commitment in this area that aimed to generate data/information was
n°1615 (‘DAPHNE - Data-as-a-Service platform for Healthy Lifestyle support’, run by
the World Obesity Federation). This commitment aimed at generating data through
the design of an ICT platform providing data on physical activity.
5.2 Implementation and results
5.2.1 Level of implementation
Figure 77 shows that nine commitments out of 11 were fully implemented and two
were assessed as mostly implemented. This shows an improvement in the level of
implementation compared to 2014, where eight actions out of 12 were fully
implemented, one was mostly implemented, one was partially implemented and two
actions did not provide enough information on this. One example of a commitment
which fully implemented the actions set out in its annual objectives was n°1701
(‘Promoting Physical Activity and Health in Ageing (PAHA), by EuropeActive), which
delivered exercise programmes for 55-65 year-olds who were inactive, to increase the
long-term physical activity of people in this age group.

Monitoring the activities of the EU Platform for Action on Diet, Physical Activity and Health – Annexes 1-3
May, 2016 81
Figure 77. Level of implementation of the actions
Source: Platform monitoring reports – physical activity promotion, N=11
5.2.2 Main inputs reported (human and financial)
With regards to the inputs, Figure 78 below shows that, in the area of physical activity
promotion, five commitments did not provide financial information on the value of the
inputs, while the remaining six commitments provided this information in the
monitoring reports. Six reports provided details on the value of inputs, which ranged
from EUR 14,000 to EUR 12.8 million, with a total sum of EUR 15,146,795 spent in
this area. Most of the actions (four) provided a value of EUR 360,000 or less, while
two commitments reported much higher values (EUR 1.6 million and EUR 12.8
million).
The quality of reporting therefore has remained quite stable as with last year, where
four actions did not provide information on this, while the remaining eight
commitments did. In 2014, the value of inputs was lower, ranging between EUR 2,000
and EUR 8 million; while the total number of hours reported as spent on the
commitments was higher (144,900).

Monitoring the activities of the EU Platform for Action on Diet, Physical Activity and Health – Annexes 1-3
May, 2016 82
Figure 78. Information on financial value of inputs
Source: Platform monitoring reports – physical activity promotion, N=11
Four commitments out of 11 provided an estimate of the staff hours spent on the
actions, while seven commitments did not provide information on time spent. Where
information on staff input was given, calculations were made based on the assumption
that a full time employee could work 1,920 hours in a year14. For the four
commitments where information on staff input was provided, the annual number of
hours ranged from nine to 30,399. The total amount of hours spent on the actions in
this area was 35,718. With regards to the human resources used for the commitments
(number of full-time and/or part-time personnel) only two commitments out of 11
provided information in this regards, and indicated between four and 55 part-time
employees. No information on number of full-time employees was provided.
5.2.3 Outputs
The outputs produced in the area of physical activity were diverse, consisting of: the
organisation of tournaments and games; production of publications and databases;
and the running of advocacy campaigns.
All commitments provided clear details of the outputs produced, compared to 2014
when the quality of reporting varied considerably. An example of a commitment which
provided clear details is n°462 (‘Danone Nations Cup’ by Danone Group), which
detailed the following outputs: 32 national tournaments, with 2.5 million players from
35,000 clubs and 20,000 schools; health through nutrition programmes organised in
many countries; development of nutrition and hydration activities; and a world final in
Morocco with 22,000 spectators.
However, in some cases the commitments had not set measurable objectives, which
resulted in unclear reporting of outcomes and success of the action.
5.2.4 Outcomes and dissemination
Figure 79 shows that in the area of physical activity promotion six commitments out of
11 provided clear details on outcomes. Three provided minimal details and two did not
provide any information on outcomes. Where commitments provided clear details,
reports gave specific information highlighting changes in the activities undertaken and
feedback received on the activities carried out; however, overall the commitment
reports only made broad statements and some highlighted that it was too early to
14
8 hours per day, 5 days per week, 48 weeks per year.

Monitoring the activities of the EU Platform for Action on Diet, Physical Activity and Health – Annexes 1-3
May, 2016 83
provide an analysis of the outcomes. An example of commitment reporting clearly on
outcomes is commitment n°1615 (’DAPHNE - Data-as-a-Service platform for Healthy
Lifestyle support’, undertaken by the World Obesity Federation), which details
measurable results and illustrates the long-term effects of the commitment. It
describes how the database created through the project was taken up by the scientific
community and tested in a few countries.
Figure 79. Details provided on outcomes
Source: Platform monitoring reports – physical activity promotion, N=11
Figure 80 below shows whether dissemination activities were undertaken by
commitments in the area of physical activity promotion. Six commitments out of 11
reported that dissemination activities were carried out and the remaining five
commitments did not report on any dissemination activities. In general, when
information was provided details on how results were disseminated (using
organisations’ websites, sharing databases, publication in journals, and dissemination
of brochures) was provided.
Very similar results were found in 2014, where seven out of 12 commitments reported
dissemination activities and five did not provide such information.
An example of a commitment including dissemination activities is n°1012 (‘Bielice Run
- Young Europeans Run’, by Mars), in which the run was publicised through
newspapers, radio stations, local websites and TV channels.

Monitoring the activities of the EU Platform for Action on Diet, Physical Activity and Health – Annexes 1-3
May, 2016 84
Figure 80. Dissemination of results
Source: Platform monitoring reports – physical activity promotion, N=11
5.2.5 Additionality
Figure 81 illustrates the results of analysis undertaken examining the additionality of
actions, with eight commitments assessed as not additional, one as of a higher quality
as a result of the Platform and two not providing any information in relation to
additionality.
In 2014, nine commitments out of 12 did not provide any information regarding the
additionality of the actions and three commitments were assessed as not additional.
Therefore, while the number of commitments judged to not be additional has
increased, an improvement in reporting on additionality has also been made.
The commitment which was of higher quality as a result of the Platform is n°1061
(‘Using EUFIC communication vehicles to promote physical activity’, run by European
Food Information Council). The commitment aims at sharing scientific information
about nutrition and physical activity, with the aim of raising awareness about these
topics among the general public.; It was assessed as of being of higher quality due to
its relationship with the Platform because it explicitly mentions that the commitment
was designed in such a way to ‘contribute to the Platform’s goals of tackling
overweight and obesity related health problems in Europe’.

Monitoring the activities of the EU Platform for Action on Diet, Physical Activity and Health – Annexes 1-3
May, 2016 85
Figure 81. Additionality of the actions
Source: Platform monitoring reports – physical activity promotion, N=11
5.2.6 EU-added value
As shown in Figure 82, a large proportion (seven out of 11) of commitments submitted
under this activity area evidenced no interaction with the Platform, and so could not
be said to have demonstrated the EU-added value of their relationship with the
Platform. Two commitments mostly demonstrated EU-added value by, for instance,
making explicit reference to the Platform throughout and addressing the objectives at
European level. Two commitments did not provide sufficient information to make an
assessment of the EU-added value of their involvement in Platform activities.
An improvement in reporting can be clearly seen in comparison to 2014, when 11 out
of 12 commitments did not provide any information on EU-added value and the
remaining one demonstrated no EU-added value.

Monitoring the activities of the EU Platform for Action on Diet, Physical Activity and Health – Annexes 1-3
May, 2016 86
Figure 82. Extent to which the commitments demonstrate EU-added value
Source: Platform monitoring reports – physical activity promotion, N=11
5.2.7 Recommendations for additional actions
The analysis also examined whether the commitments suggested any additional
actions to be implemented in the future, with Figure 83 showing that eight out of 11
actions did not provide such reporting, while three provided this information.
For instance, commitment n°1606 (‘Now we move’) aimed at developing the capacity
of local and national entities to develop and/or implement physical activity initiatives
for hard-to-reach physically inactive populations, mentions that the activities of
selecting best practices and best practice owners will continue through into 2016.
Very similar results were shown in 2014: nine out of 12 actions did not report on any
additional actions, while three commitments suggested follow-up activities. The three
commitments proposing follow-up in 2015 are different to the three which proposed
follow-up actions in 2014.
Mostly demonstrates EU
added value; 2; 18%
Does not demonstrate EU
added value; 7; 64%
No information provided ; 2; 18%

Monitoring the activities of the EU Platform for Action on Diet, Physical Activity and Health – Annexes 1-3
May, 2016 87
Figure 83. Recommendations for additional actions
Source: Platform monitoring reports – physical activity promotion, N=11
5.3 Overall assessment of the quality of reporting
5.3.1 Overall assessment
With regard to the overall assessment of the commitments, Figure 84 shows that, in
the area of physical activity promotion, only three out of 11 actions were assessed as
being highly satisfactory, seven as satisfactory and one as non-satisfactory.
Similar results were shown during the previous year’s monitoring exercise, where
three out of 12 commitments in this area were highly satisfactory, seven were
satisfactory and two were non-satisfactory. No overall progress on monitoring can
therefore be reported.

Monitoring the activities of the EU Platform for Action on Diet, Physical Activity and Health – Annexes 1-3
May, 2016 88
Figure 84. Assessment of the reports in the area of physical activity promotion
Source: Platform monitoring reports – physical activity promotion, 2014, N=12; 2015, N=11
The actions that were rated as highly satisfactory had fully or mostly S.M.A.R.T.
objectives and clear details on inputs and outputs. The actions rated as satisfactory
generally provided less detailed information on inputs and or outcomes, and were
weaker in the design (less specific, less clear and/or less measurable objectives).
The action that was considered as non-satisfactory presented inconsistencies between
the general description and general objectives and the rest of the report (describing
annual objectives, inputs, outputs and outcomes).
An example of a commitment whose reporting was considered highly satisfactory is
n°1012 (‘Bielice Run' - Young Europeans Run’, undertaken by Mars). Its report had
mostly S.M.A.R.T. objectives and provided clear details on inputs, output and
outcomes.
5.4 Synergies, joint commitments and transferability
As a final part of this assessment, analysis was conducted on possible synergies and
joint commitments between different commitments, as well as the transferability of
commitment actions to other geographical or organisational contexts. This was done
using information included in the monitoring reports, and does not take into
consideration external or internal factors related to design and implementation of the
actions.
5.4.1 Synergies and joint commitments
The analysis of possible synergies between actions found that linkages were identified
between the following commitments: n°462 (‘Danone Nations Cup’, by Danone
Group); n°1012 (‘Bielice Run' - Young Europeans Run’, by Mars); and n°1418
(‘Danone Sport Schools’, by Danone Spain). These commitments have similar
objectives, the same target group (children and adolescents), and similar activities
were carried out. Creating synergies between these actions could benefit the
commitment owners, both in terms of support to the activities carried out and of
increased impact of the actions.

Monitoring the activities of the EU Platform for Action on Diet, Physical Activity and Health – Annexes 1-3
May, 2016 89
No possible joint actions were identified in this area.
5.4.2 Transferability
This year’s assessment of commitments explored possible transferability of
commitment aims and actions. Figure 85 shows that nine out of 11 commitments were
considered to be transferrable. Transferability means that the design and intent of an
action could be replicated in another geographic or thematic setting, either by the
same organisation or another one. One action was seen as not transferable due to its
design and nature, and one report did not provide enough information to evaluate this
aspect.
The actions considered transferrable were mainly due to their nature. For example:
organising sports activities in schools; sharing scientific information about nutrition
and physical activity; or organising mobilisation and advocacy campaigns. These are
activities which could easily be transferred across to other settings.
An example of a commitment with transferrable actions is n°1604 (‘Ready Steady Go’,
undertaken by Confederation Européenne Sport Santé (CESS)). The sport activities
organised for young people and families under this commitment could be replicated in
other geographical locations.
Figure 85. Transferability of the actions
Source: Platform monitoring reports – physical activity promotion, N=11
5.5 Conclusions and recommendations
5.5.1 Conclusions
As an overall assessment, it can be said that the monitoring results in the area of
physical activity promotion remain in line with the 2014 results, although a slight
improvement in reporting overall can be seen. 64 per cent of the commitments in this
area were satisfactory (compared to 58 per cent in the last monitoring year), 27 per
cent were highly satisfactory (against 25 per cent last year) and 9 per cent were non
satisfactory (compared to 17 per cent last year).
The main findings regarding the design and intent of commitments submitted in this
activity area are as follows:
A slight improvement can be identified with regards to setting S.M.A.R.T.
objectives compared to last year: only 18 per cent (two out of 11) of

Monitoring the activities of the EU Platform for Action on Diet, Physical Activity and Health – Annexes 1-3
May, 2016 90
commitments had fully S.M.A.R.T. objectives (16 per cent - two out of 12 - in
2014), 64 per cent (seven out of 11) had mostly S.M.A.R.T. objectives (42 per
cent - five out of 12 - last year), and 18 per cent (two out of 11) had partially
S.M.A.R.T. objectives (33 per cent - four out of 12 - in 2014). Moreover, in
2014, 8 per cent (one out of 12) of the actions had not set S.M.A.R.T.
objectives.
All commitments were considered to be relevant to the stated priorities of the
Platform and EU priorities, as in the previous year. However, the number of
commitments making an explicit link to the Platform has gone down (from 42
per cent - five out of 11 - in the last year’s monitoring exercise to 18 per cent -
two out of 11 - this year).
This year only 18 per cent (two out of 11) of commitments stated to set out to
reduce health inequalities, while in 2014 42 per cent (five out of 12) of the
actions did so.
No improvement was made regarding the evidence in design. Indeed, 27 per
cent (three out of 11) of commitments showed evidence of need, 9 per cent (1
out of 11) showed evidence of likely effectiveness and 46 per cent (five out of
11) did not provide any information in this regard. Last year, 42 per cent (five
out of 12) of the actions showed evidence of need and likely effectiveness, 25
per cent (three out of 12) showed evidence of need and 16 per cent (two out of
12) committed to generate evidence.
Geographic coverage of commitments remains mixed, with only five out of 11
covering more than 20 countries and the remainder being of varying scope.
Regarding the implementation and results of the commitments, the following
conclusions can be drawn:
The level of implementation of the actions has slightly improved in comparison
to last year: 82 per cent (nine out of 11) fully implemented (66 per cent - eight
out of 12 - last year), 18 per cent (two out of 11) mostly implemented (8 per
cent - one out of 12 - in 2014). Also in 2014 8 per cent (one out of 12) were
partially implemented and 16 per cent (two out of 12) did not provide any
information.
A slight decrease in the number of commitments providing information on
inputs can be identified, with 55 per cent (six out of 11) not providing
information in this regard this year, against 66 per cent (eight out of 12) in
2014. Also, the total number of hours spent on the actions (35,718 this year,
144,900 in 2014) was lower this year. The value on inputs was higher this year
(between EUR 2,000 and 8 million, compared to a range of EUR 14,000 to 12.8
million in 2014).
Clear details were provided on outputs for all the commitments, displaying an
improvement in reporting; however, in some cases the information provided
was not measurable.
While the majority of the actions (64 per cent - seven out of 11) provided clear
details on outcomes, 18 per cent (two out of 11) provided only minimal details
and 18 per cent (two out of 11) did not provide any information in this regard.
The dissemination of results of the actions in 2015 was very much in line with
last year; indeed in both years, dissemination was undertaken in 58 per cent
(six out of 11 in 2015; 7 out of 12 in 2014) of cases.
With regards to the additionality of the actions, a clear improvement in
reporting was made in comparison to 2014. In 2014, only 25 per cent (3 out of
12) of the actions provided information on additionality, compared to 81 per
cent (nine of 11 actions) in 2015.
An improvement was also noted with regards to EU-added value. While in 2014
only 9 per cent of commitments provided information on EU-added value, 81
per cent (nine out of 11) did so this year.

Monitoring the activities of the EU Platform for Action on Diet, Physical Activity and Health – Annexes 1-3
May, 2016 91
5.5.2 Recommendations
Based upon both the assessment of 2015 commitments and a comparison between
commitment reports submitted in 2014 and 2015, a number of key recommendations
can be put forward for reports submitted in this area:
While the information provided was, in general, more detailed than last year,
there is still room for improvement, in particular with regards to setting
measurable, specific and time bound objectives.
The commitments could make more use of evidence in design (of need, or of
likely effectiveness) or more often commit to generate data or information, as
this would provide an indication of the relevance of the actions.
With regards to the reference to the Platform and to the EU objectives, a very
limited number of actions made an explicit reference to either (18 per cent in
both cases). Greater referencing of these aspects would not only provide a
justification for the actions undertaken but also help demonstrate the relevance
of the commitments.
More details on inputs should be provided, as well as more detailed information
on (measurable) outputs and outcomes.
As this area is one of the priorities of the Platform, a greater number of and
more ambitious actions from all relevant and major Platform members are
welcomed.

Monitoring the activities of the EU Platform for Action on Diet, Physical Activity and Health – Annexes 1-3
May, 2016 92
6 Advocacy and information exchange
This activity area is the Platform’s primary knowledge management and dissemination
tool, aiming to reach stakeholders concerned with healthy diets and regular physical
activity.
Out of the 21 commitments in this area, four were completed in 2015. As Table 11
below shows, commitments are being implemented by a mixture of industry
representations (such as COPA-COGECA, FoodDrinkEurope or FoodServiceEurope) and
NGOs (such as WOF or EuroHealthNet).
Table 11. Number of commitments per Platform member
Platform member N° of commitments
EPHA 2
COPA-COGECA 2
EASO 2
Freshfel 2
CPME 2
A.R.E.F.L.H 1
ACT 1
BEUC 1
EuroCoop 1
EuroHealthNet 1
Joint commitment between EASO and EUFIC 1
European Heart Network 1
FoodDrinkEurope 1
IBFAN 1
IDF Europe 1
WOF 1
Total 21
Source: Platform monitoring reports 2015 - advocacy and information exchange, N= 21
As shown in Figure 86, just under half (ten) of commitments covered more than 20
countries, four of which covered all EU-28 countries. Of those which covered fewer,
two focused on single countries and the other nine varied in scope. This mix is broadly
the same as that of the commitments presented for 2014, although there has been a
slight decrease in the number of larger commitments, primarily due to several larger
commitments ending in 2014. The number of commitments covering 11 or more
countries dropped from 20 to 14 between 2014 and 2015, while the number of
commitments covering 6-10 countries rose from three to four.
The two commitments which covered a single country both focused on Denmark. An
example of one such commitment is n°1616 (‘Forum on Malnutrition’), for which
COPA-COGECA brought stakeholders together at a Forum on Malnutrition with the aim
of producing policy recommendations on malnutrition for Danish policy-makers.

Monitoring the activities of the EU Platform for Action on Diet, Physical Activity and Health – Annexes 1-3
May, 2016 93
Figure 86. Geographic coverage of commitments in the area of advocacy
Source: Platform monitoring reports – advocacy 2015, N=21
The majority of commitments covering more than 20 countries covered all or most EU-
28 countries, with a significant majority of those also covering Norway (eight),
Switzerland (eight), and a few covering Iceland (three). Where commitments covered
more than 20 countries but did not cover all EU-28 countries there was no clear
pattern of coverage, with each country being covered by at least seven of those ten
large commitments.
Figure 87. Geographic coverage of commitments in the area of advocacy
Source: Platform monitoring reports – advocacy 2015, N=21
On average, countries were covered by 12 different commitments. The number of
commitments covering any individual country was mixed, ranging from seven up to
seventeen. The most covered countries were Belgium, the Netherlands and the UK
(covered by 17 each), while the least covered were Greece, Latvia and Malta (covered
by seven each). Where countries were covered by the largest number of
commitments, this was generally due to being covered by a slightly higher number of
the smaller commitments.

Monitoring the activities of the EU Platform for Action on Diet, Physical Activity and Health – Annexes 1-3
May, 2016 94
Figure 88. Target audiences of commitments in the area of advocacy
Source: Platform monitoring reports – advocacy 2015, N=21
Most (16) advocacy commitments were targeted at an audience of either health
professionals or policy makers, with the remainder largely aimed at the general public.
One of the 2015 advocacy commitments was aimed at industry. This is fairly similar to
the commitments submitted in 2014, of which 18 out of 26 were aimed at health
professionals or policy makers.
An example of a commitment targeted at health professionals is n°724 (A.R.E.F.L.H’s
‘Dissemination of Fruit and Vegetable promotion initiatives’), which aimed to
disseminate information on programmes and initiatives being carried out by regional
authorities to a wider range of policy makers, to promote the exchange of best
practice.
6.1 Design and intent of action
6.1.1 S.M.A.R.T. objectives
Nine commitments submitted in the area of advocacy set objectives which were either
fully or mostly S.M.A.R.T., with the majority (12) setting objectives which were only
partially S.M.A.R.T. One commitment’s objectives were assessed as being not
S.M.A.R.T.
This means there have been two significant changes between 2014 and 2015. The first
is a large reduction in the number of commitments setting fully or non-S.M.A.R.T.
objectives – in 2014, six commitments set fully S.M.A.R.T. objectives and five set non-
S.M.A.R.T. objectives. There was also a similar-sized increase in the number of
commitments setting partially S.M.A.R.T. objectives between the two years, from
seven in 2014 to twelve in 2015.

Monitoring the activities of the EU Platform for Action on Diet, Physical Activity and Health – Annexes 1-3
May, 2016 95
Figure 89. S.M.A.R.T. objectives
Source: Platform monitoring reports – advocacy 2015, N=21
The majority (18) of commitments set achievable and realistic objectives – where
most fell short of setting fully S.M.A.R.T. objectives was that they did not set specific
or measurable objectives, or get specific timeframes for achieving their objectives.
The commitment which set fully S.M.A.R.T. objectives was n°1503 (EASO’s
‘Development of the EASO European Obesity Patient Council’) – this commitment
clearly listed quantifiable output targets for the year 2015, many of which were bound
to be achieved at a particular conference. In the case of the commitment which set
non-S.M.A.R.T. objectives, this was because the objectives section of its report gave a
retrospective list of the commitment’s achievements during 2015, rather than setting
objectives at the start of the year.
6.1.2 Relevance of commitments
6.1.2.1 Link to EU Platform and EU policy goals
In order to establish whether the design of the commitment met the main aims of the
Platform, the analysis explored if the commitment reports explicitly or implicitly stated
the commitment’s relevance to the priorities of the Platform. In the case of advocacy,
all the commitments’ objectives were deemed as relevant to the stated priorities of
the Platform.
As Figure 90 shows, there was a fairly even mixture of commitments which explicitly
linked their actions to the Platform’s priorities (11) and commitments which implicitly
demonstrated links, without directly mentioning the Platform’s goals (ten).
Proportionally there was no change between 2014, when 14 out of 26 commitments
explicitly demonstrated relevance. In neither year did any commitments fail to
demonstrate any relevance to the Platform’s priorities.

Monitoring the activities of the EU Platform for Action on Diet, Physical Activity and Health – Annexes 1-3
May, 2016 96
Figure 90. Relevance of commitments to Platform priorities
Source: Platform monitoring reports – advocacy 2015, N=21
One example of a commitment which made explicit links between itself and the
Platform’s priorities was n°1516 (‘European Snacks Association commitment in the
area of advocacy and information exchange’), which identified the Platform's aim of
“[collecting] evidence on best practices in measures which help promote healthier
lifestyles, reduce obesity and improve health” in its report, stating that the European
Snacks Association is aiming to contribute to this objective.
An example of a commitment which implicitly demonstrated links to Platform priorities
is n°529 (‘Fresh Fruit and Vegetables Consumption Monitor’) – in its report Freshfel
makes a link between increasing consumption of fruit and vegetables and reducing
obesity, and aims to contribute to awareness raising and policy making work in
relation to this. However, it does not explicitly link these goals to the aims of the
Platform.
The vast majority of advocacy commitments displayed a link to wide EU priorities,
either explicitly (four) or implicitly (14). Just three commitments had no apparently
relevance to wider EU priorities. Relevance to wider EU policy goals was not assessed
separately in 2014, so no comparison can be made between the two years.
Figure 91. Relevance of commitments to wider EU priorities
Source: Platform monitoring reports – advocacy 2015, N=21

Monitoring the activities of the EU Platform for Action on Diet, Physical Activity and Health – Annexes 1-3
May, 2016 97
One commitment which made explicit reference to wider EU priorities was n°1608
(EuroHealthNet’s ‘Promote information exchange and innovation, including health and
social equity’), which stated in its report that actions undertaken for this commitment
will be undertaken ‘in liaison’ with EU Joint Actions such as CHRODIS15 and will utilise
the EU Platform for Action on Health and Social Equity.
6.1.2.2 Link to WHO targets
Where links were evidenced between advocacy commitments and WHO targets, these
links were implicit rather than explicit. The majority (15) of commitments contained
an implicit link to WHO’s target on halting the rise in diabetes and obesity, with a little
under half (8) being implicitly linked to WHO’s target of reducing prevalence of
insufficient physical activity. Where these links existed but were deemed to be implicit,
this was because commitments stated an aim of promoting physical activity or
contributing to the fight against obesity, but did not make direct reference to WHO
goals in these areas.
Links with WHO targets were not assessed during the analysis of 2014 commitments
and so a comparison between the two years is not possible.
Table 12. Links to WHO targets
Explicit link Implicit link No apparent
link
Target 1: 5% relative reduction in
the overall mortality from
cardiovascular diseases, cancer,
diabetes, or chronic respiratory
diseases
0 2 19
Target 2: At least 10% relative
reduction in the harmful use of
alcohol
0 0 21
Target 3: 10% relative reduction in
prevalence of insufficient physical
activity
0 8 13
Target 4: 30% relative reduction in
mean population intake of
salt/sodium
0 2 19
Target 5: 30% relative reduction in
prevalence of current tobacco use in
persons aged 15+ years
0 0 21
Target 6: 25% relative reduction in
the prevalence of raised blood
pressure or contain the prevalence
of raised blood pressure
0 0 21
Target 7: Halt the rise in diabetes
and obesity
0 15 6
Target 8: At least 50% of eligible
people receive drug therapy and
counselling to prevent heart attacks
0 0 21
15
Joint Action on Chronic Diseases.

Monitoring the activities of the EU Platform for Action on Diet, Physical Activity and Health – Annexes 1-3
May, 2016 98
and strokes
Target 9: 80% availability of the
affordable basic technologies and
essential medicines, including
generics, required to treat major
NCDs
0 0 21
Source: Platform monitoring reports – advocacy 2015, N=21
6.1.3 Actions to reduce health inequalities
One commitment submitted in the area of advocacy included an objective of
addressing health inequalities in its design. This is lower than the four commitments
from 2014 which addressed health inequalities – two of those four finished in 2014,
and one did not continue to mention health inequalities in its 2015 report.
Figure 92. Actions to reduce health inequalities
Source: Platform monitoring reports – advocacy 2015, N=21
The commitment which included a target of addressing health inequalities was n°1608
(EuroHealthNet’s ‘Promote information exchange and innovation, including health and
social equity’). One of the actions undertaken as part of commitment n°1608 was to
build links with stakeholders in other relevant policy areas in support of efforts to
tackle health and social inequalities.
6.1.4 Using evidence in design
The vast majority (16) of commitments submitted in the area of advocacy addressed
need and/or likely effectiveness in some way. Where commitments did make reference
to evidence, most (11) gave evidence of potential impact or made a commitment to
generate data/information, while a lower but still significant proportion (eight) gave
evidence of need.

Monitoring the activities of the EU Platform for Action on Diet, Physical Activity and Health – Annexes 1-3
May, 2016 99
Figure 93. Use of evidence in commitment design
Source: Platform monitoring reports – advocacy 2015, N=21
One commitment which addressed both need and likely effectiveness was n°530
(Freshfel’s ‘“Fresh Times" Newsletter with Information on Fruit & Vegetables
Promotion’), which cited medical evidence that increased fruit and vegetable
consumption is linked with the reduction of obesity, and has tracked the effectiveness
of its newsletter via a survey of stakeholders. Furthermore, one commitment which
provided a commitment to generate information was n°1043 (EPHA’s “Dissemination
of information on European food, nutrition and physical activity policy developments
with EPHA's member organisations’), which collated and disseminated examples of
best practice to EPHA’s members.
Compared to 2014 commitments this shows a slight increase in the number of
commitments which neither refer to evidence of need/effectiveness nor (in the case of
innovative commitments) state that they intend to generate evidence or information.
There were five such reports in 2015, compared to three in 2014. There was,
however, an increase in the number citing evidence of need only, up from three to
five. This change was accompanied by a significant drop in the number of
commitments stating evidence of need and likely effectiveness (from ten to three) and
a slight drop in the number committing to generate data/information (from ten to
eight).
6.2 Implementation and results
6.2.1 Level of implementation
All commitments submitted under advocacy supplied enough information to assess
their level of implementation. Of the 21 submitted 10 were fully implemented, while
the rest were mostly or partially implemented.
This was an improvement on 2014, with the number fully implemented rising from
nine to ten and the number partially implemented or not providing enough information
for an assessment halving (from twelve to six). The improvement in the proportion
judged to have been fully implemented is particularly noticeable, rising from 35 per
cent in 2014 to 48 per cent in 2015.

Monitoring the activities of the EU Platform for Action on Diet, Physical Activity and Health – Annexes 1-3
May, 2016 100
Figure 94. Level of commitment implementation
Source: Platform monitoring reports – advocacy 2015, N=21
One example of a commitment which fully implemented the actions set out in its
annual objectives was n°1312 (EASO and EUFIC’s joint ‘Increase outreach of new
knowledge in obesity research’). Under this commitment, EUFIC produced a podcast of
interviews with experts who spoke at EASO’s European Congress on Obesity. This
podcast was published on EUFIC and EASO’s websites, and publicised to EASO
members via a membership e-bulletin.
6.2.2 Main inputs reported (human and financial)
Reporting on the inputs of each commitment was mixed, with the majority giving clear
details on human input (16) but a little under half giving clear information on the
financial cost of implementation (nine). Compared to 2014 this is a slight
improvement in reporting on both financial cost (up from seven to nine) and a
significant improvement in reporting on human input (up from nine to sixteen).
Figure 95. Main inputs reported
Source: Platform monitoring reports – advocacy 2015, N=21
In general, staff time was detailed in commitment reports as either number of full-
time employees (FTE) or number of hours, but not both. Where information on staff
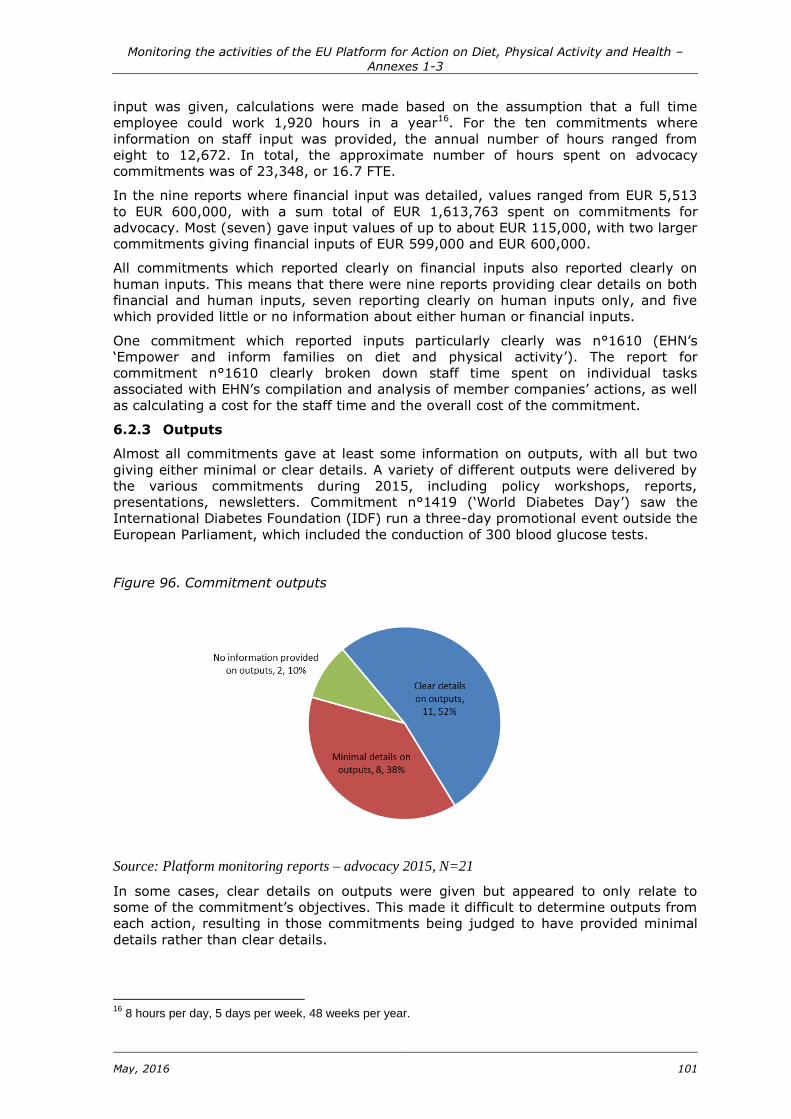
Monitoring the activities of the EU Platform for Action on Diet, Physical Activity and Health – Annexes 1-3
May, 2016 101
input was given, calculations were made based on the assumption that a full time
employee could work 1,920 hours in a year16. For the ten commitments where
information on staff input was provided, the annual number of hours ranged from
eight to 12,672. In total, the approximate number of hours spent on advocacy
commitments was of 23,348, or 16.7 FTE.
In the nine reports where financial input was detailed, values ranged from EUR 5,513
to EUR 600,000, with a sum total of EUR 1,613,763 spent on commitments for
advocacy. Most (seven) gave input values of up to about EUR 115,000, with two larger
commitments giving financial inputs of EUR 599,000 and EUR 600,000.
All commitments which reported clearly on financial inputs also reported clearly on
human inputs. This means that there were nine reports providing clear details on both
financial and human inputs, seven reporting clearly on human inputs only, and five
which provided little or no information about either human or financial inputs.
One commitment which reported inputs particularly clearly was n°1610 (EHN’s
‘Empower and inform families on diet and physical activity’). The report for
commitment n°1610 clearly broken down staff time spent on individual tasks
associated with EHN’s compilation and analysis of member companies’ actions, as well
as calculating a cost for the staff time and the overall cost of the commitment.
6.2.3 Outputs
Almost all commitments gave at least some information on outputs, with all but two
giving either minimal or clear details. A variety of different outputs were delivered by
the various commitments during 2015, including policy workshops, reports,
presentations, newsletters. Commitment n°1419 (‘World Diabetes Day’) saw the
International Diabetes Foundation (IDF) run a three-day promotional event outside the
European Parliament, which included the conduction of 300 blood glucose tests.
Figure 96. Commitment outputs
Source: Platform monitoring reports – advocacy 2015, N=21
In some cases, clear details on outputs were given but appeared to only relate to
some of the commitment’s objectives. This made it difficult to determine outputs from
each action, resulting in those commitments being judged to have provided minimal
details rather than clear details.
16
8 hours per day, 5 days per week, 48 weeks per year.

Monitoring the activities of the EU Platform for Action on Diet, Physical Activity and Health – Annexes 1-3
May, 2016 102
Compared to advocacy commitments submitted in 2014, this means the number of
giving clear details of outputs has shrunk, from 16 to 11. The number providing
minimal or no details remained the same.
6.2.4 Outcomes and dissemination
Information on outcomes was provided by 12 (out of 21) commitments. One
commitment was able to give statistical information gathered via a survey carried out
as part of its activities, but in general commitment reports were only able to make
broad statements relating to assumed impact.
Figure 97. Reporting on outcomes
Source: Platform monitoring reports – advocacy 2015, N=21
The commitment which gave clear evidence relating to outcomes was commitment
n°530 (Freshfel’s ’”Fresh Times” Newsletter’), under which Freshfel conducted a
survey of recipients of its newsletter collecting their perceptions of its impact and
effectiveness. Results from this survey were included in the commitment report,
allowing to understand the impact of the action.
Figure 98. Dissemination of results
Source: Platform monitoring reports – advocacy 2015, N=21

Monitoring the activities of the EU Platform for Action on Diet, Physical Activity and Health – Annexes 1-3
May, 2016 103
Information on dissemination of results was provided in 15 advocacy commitment
reports. This is roughly the same proportion as said they disseminated their results in
2014 – 73 per cent then, compared to 71 per cent in 2015. This continuing high level
of dissemination is likely due to the nature of the commitments, which mostly focus on
advocacy and information exchange. Results were disseminated via newsletters,
promotional events, social media, and reports and media content published on
websites.
6.2.5 Additionality
A reasonable number of commitments submitted in the area of advocacy
demonstrated some level of additionality, with nine showing that they either would not
have taken place without the Platform, or would have taken place later or at a smaller
scale. 12 of the commitments submitted in the area of advocacy did not demonstrate
additionality, as they consisted of activities which fell within the submitting
organisations’ regular remits and which did not appear to have been initiated or
expanded upon due to association with the Platform.
Figure 99. Commitment additionality
Source: Platform monitoring reports – advocacy 2015, N=21
One commitment which would not have taken place without the Platform was n°1602
(EPHA’s “Analysis of the industry's commitments against public health objectives’). n°
1602 involved an analysis of commitments made to the Platform and the production of
recommendations for Platform members on improving the quality and relevance of
their commitments.
Compared to 2014 the number of commitments not evidencing additionality remained
fairly stable, but the number of commitments which took place at a greater
scale/sooner or would not have taken place otherwise fell (from 13 to nine).
6.2.6 EU-added value
Almost half (nine) of commitments submitted in the area of advocacy demonstrated
EU-added value to some extent, with five mostly or fully demonstrating EU-added
value. 12 did not evidence any interaction with the Platform17, and so could not be
said to have demonstrated the EU-added value of their relationship with the Platform.
This is a decrease from 2014, when 16 commitments demonstrated EU-added value to
some extent and ten did not.
17
For example, disseminating results via the Platform, collaborating with other Platform members, or utilising information provided by the Platform/other Platform members.
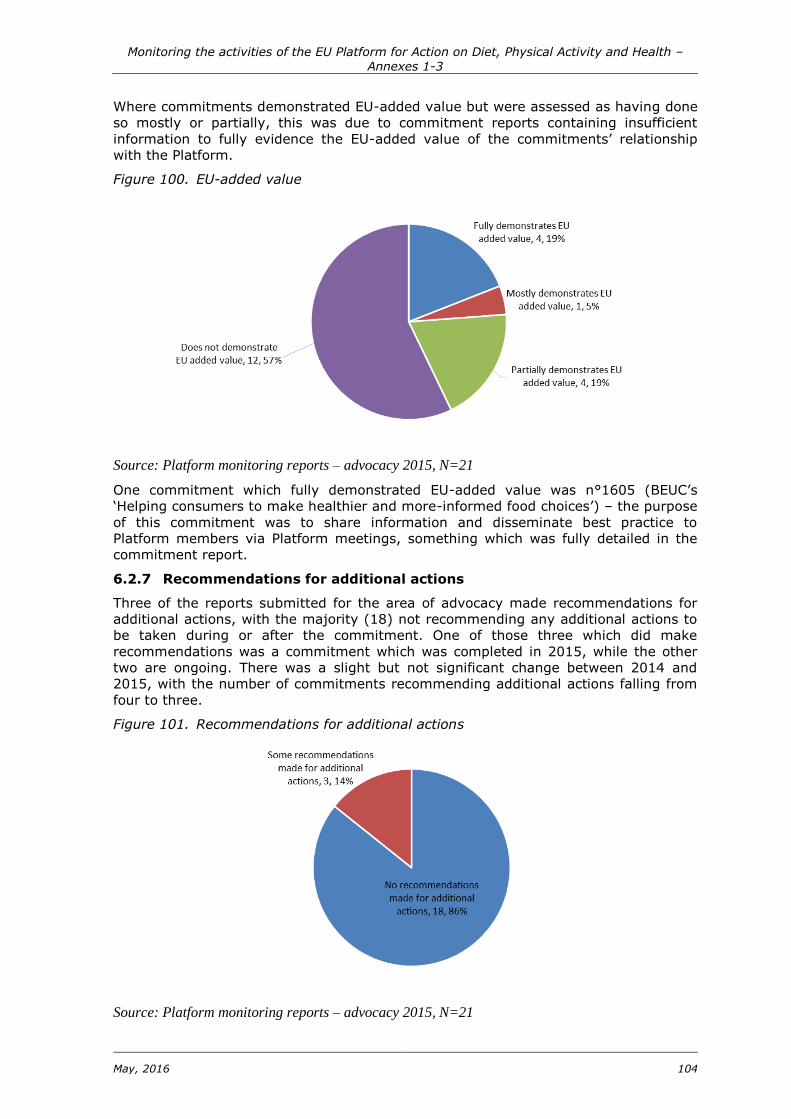
Monitoring the activities of the EU Platform for Action on Diet, Physical Activity and Health – Annexes 1-3
May, 2016 104
Where commitments demonstrated EU-added value but were assessed as having done
so mostly or partially, this was due to commitment reports containing insufficient
information to fully evidence the EU-added value of the commitments’ relationship
with the Platform.
Figure 100. EU-added value
Source: Platform monitoring reports – advocacy 2015, N=21
One commitment which fully demonstrated EU-added value was n°1605 (BEUC’s
‘Helping consumers to make healthier and more-informed food choices’) – the purpose
of this commitment was to share information and disseminate best practice to
Platform members via Platform meetings, something which was fully detailed in the
commitment report.
6.2.7 Recommendations for additional actions
Three of the reports submitted for the area of advocacy made recommendations for
additional actions, with the majority (18) not recommending any additional actions to
be taken during or after the commitment. One of those three which did make
recommendations was a commitment which was completed in 2015, while the other
two are ongoing. There was a slight but not significant change between 2014 and
2015, with the number of commitments recommending additional actions falling from
four to three.
Figure 101. Recommendations for additional actions
Source: Platform monitoring reports – advocacy 2015, N=21

Monitoring the activities of the EU Platform for Action on Diet, Physical Activity and Health – Annexes 1-3
May, 2016 105
One of the ongoing commitments which recommended additional actions was n°1605
(BEUC’s ‘Helping consumers to make healthier and more-informed food choices’).
Under this commitment, BEUC collects Platform-related articles published in their
members’ magazines and then shares information from these at Platform meetings, to
aid assessment of industry commitments in the areas of labelling, reformulation and
advertising. One additional activity recommended by n°1605 is for the Platform
agenda to include regular updates on previous presentations given by Platform
members, so that progress and persisting loopholes can be identified more clearly.
6.3 Overall assessment of the quality of reporting
6.3.1 Overall assessment
Overall analysis of the commitments submitted for advocacy concluded that the
majority were either highly satisfactory or satisfactory, with a smaller amount being
rated as non-satisfactory.
Figure 102. Overall assessment of reporting
Source: Platform monitoring reports – advocacy 2015, N=21
There is a noticeable increase in the number of non-satisfactory reports compared to
2014, as well as a decrease in highly satisfactory reports. In 2014, nine reports were
rated as highly satisfactory and just four were rated as non-satisfactory. Given that
five fewer commitments were submitted in the area of advocacy in 2015, this suggests
that the overall drop in report quality is due to two factors: the first is that in 2015
some commitment holders submitted reports which were not as clear as their 2014
reports, and the second is that some well-reported commitments concluded in 2014,
with no follow-up actions.
The primary reasons for reports being rated as non-satisfactory were a lack of clear
S.M.A.R.T. objectives, a lack of information addressing the commitments’ interaction
with the Platform, and a lack of clear reporting on the needs being addressed or the
desired impact of the commitments. Several reports confused inputs, outputs and
outcomes to varying degrees, leading them to underreport in one or more of these
areas, and in two instances the annual objectives listed in reports were recaps of what
was achieved in 2015 rather than a set of goals written at the start of the year.

Monitoring the activities of the EU Platform for Action on Diet, Physical Activity and Health – Annexes 1-3
May, 2016 106
One of the reports rated as highly satisfactory was n°1402 (WOF’s ‘SPOTLIGHT -
Sustainable prevention of obesity through integrated strategies’). Strengths of this
report included the clarity of its objectives and action plan, and its detailed and
clearly-structured reporting on the commitments input and outputs.
6.4 Synergies, joint commitments and transferability
As a final part of this assessment, analysis was conducted on possible synergies and
joint commitments between different actions, as well as the transferability of
commitment actions to other geographical or organisational contexts. This was done
using information included in the monitoring reports, and does not take into
consideration external or internal factors related to design and implementation of the
actions.
6.4.1 Synergies and joint commitments
In terms of synergies, there was potential for many of the commitments submitted
under advocacy to strengthen each other if they were to interact in some way. For
example, commitment n°1402 is reviewing literature and data in order to identify
interventions which have the strongest effect on combating obesity – commitments
which focus on disseminating information (such as n°530 – Freshfel’s ‘"Fresh Times"
Newsletter’) or undertaking awareness raising with the aim of fighting obesity (such as
n°1516 – FoodDrinkEurope’s “European Snacks Association commitment in the area of
advocacy and information exchange’) could share the findings of commitment n°1402
to good effect.
Within advocacy there are multiple other potential synergies of this nature, between
commitments which produce knowledge and identify best practice, and commitments
which undertake awareness raising. As just one more example, the ‘toolbox’ of
guidelines and interventions produced by CPME under commitment n°1509 could be
disseminated via COPA-COGECA’s forum for health professionals (commitment
n°1518).
Potential was also found for some commitments to become joint commitments.
Commitment n°1312 (‘Increase outreach of new knowledge in obesity research’)
involves EUFIC producing multimedia output from EASO’s annual Obesity conference.
This commitment could be merged with commitment n°533 (EASO’s ‘To Promote
Obesity as a Health, Research and Societal Priority in Europe’) – not only could EASO
promote EUFIC’s podcasts via the actions it undertakes as part of commitment n°533,
but combining these two commitments could create potential for EUFIC to collaborate
with EASO in a wider range of its activity areas.
There is also potential for commitments n°529 and n°530 to operate as a joint
commitment – both are run by Freshfel, with n°529 compiling data on fruit and
vegetable consumption levels across Europe and n°530 distributing information on
promotional campaigns encouraging the consumption of fruit and vegetables via a
newsletter. These two commitments complement each other well and, being run by
the same organisation, could quite likely be combined.
6.4.2 Transferability
This year’s assessment of commitments explored possible transferability of
commitment aims and actions. In this context, transferability means that the design
and intent of an action could be replicated in another geographic or thematic setting,
either by the same organisation or another one. This took into account not just
whether enough detail had been provided to enable effective replication, but also the
extent to which replication of the commitment in another setting had the potential to
reach new audiences or generate different impacts, rather than simple duplicating the
impacts of the original commitment.

Monitoring the activities of the EU Platform for Action on Diet, Physical Activity and Health – Annexes 1-3
May, 2016 107
Figure 103. Transferability of actions
Source: Platform monitoring reports – advocacy 2015, N=21
12 out of the 26 commitments submitted in the area of advocacy in 2015 were
deemed to be transferrable, having given enough detail about the actions undertaken
that the commitment’s delivery model could be replicated in a different thematic or
geographical context. Six did not provide a high enough level of detail, and three did
provide detail but did not appear transferrable.
One commitment judged to be transferrable was n°1613 (‘Commercial TV channels
best practices in promoting physical activity via programming and beyond’). Under this
commitment, ACT conducted a study of broadcasters’ best practice in promoting
physical activity and sports. This commitment could be broadened to have a wider
geographic focus (at present it covers seven countries), and could also be replicated
by another trade association in contexts such as online media and radio.
An example of a commitment judged to be non-transferrable was n°1509 (CPME’s
‘Mobilising the medical profession: the ‘Health Village’ Toolbox II’) – this commitment
concerned the updating and dissemination of one specific tool produced by CPME, an
action which could not be replicated by another organisation or in another setting.
6.5 Conclusions and recommendations
6.5.1 Conclusions
Overall, the quality of reporting on commitments submitted in 2015 for the area of
advocacy was lower than the quality of 2014 reports, with a rise in the number of
reports rates as non-satisfactory and a decrease in the number of highly satisfactory
reports. Within this, however, there were some specific areas of improvement, and in
areas where report quality dropped in 2015 there are lessons which can be learned
going forward.
The main findings in relation to the design of the commitments submitted in this area
were as follows:
While almost all commitments set objectives which were at least partially
S.M.A.R.T., the overall clarity of objectives dropped between 2014 and 2015.
This was mostly due to commitments setting goals which were not specific,
measurable or time bound, although in two cases it was because commitments
failed to set annual goals at the start of 2015.
Reports submitted in the area of advocacy were good at evidencing contextual
relevance, with almost all evidencing relevance to both the Platform and wider
EU priorities. There is, however, scope for more to make these links explicit
rather than implicit (as many currently are).

Monitoring the activities of the EU Platform for Action on Diet, Physical Activity and Health – Annexes 1-3
May, 2016 108
The extent to which commitments evidenced need and likely effectiveness, or
(in the case of innovative commitments) stated that they intend to generate
evidence or information, remains good, although in 2015 there was a slightly
level lower of evidence referencing than in 2014.
Geographic coverage of commitments remains mixed, and has actually seen a
drop in the number of larger commitments due to several concluding in 2014.
At present 28 per cent of commitments cover more than 20 countries,
compared to 54 per cent in 2014.
The main findings concerning reporting on the implementation and results of the
commitments were as follows:
There was a significant increase in the level to which advocacy commitments
were implemented between 2014 and 2015, with the proportion of
commitments judged to have been fully implemented rising from 35 per cent to
48 per cent.
Reporting on inputs improved significantly between 2014 and 2015, especially
the reporting of human inputs. Overall, reports contained a greater amount of
detail on the time and money spent on implementing commitments
In contrast, the average quality of reporting on outputs dropped slightly
between 2014 and 2015, although was still reasonable. It is worth noting that
the number of reports providing little or no detail on outputs did not increase
between 2014 and 2015, suggesting that the proportional decrease in clear
output reporting may be a reflection of the smaller number of commitments
submitted in 2015 than a decrease in reporting clarity.
Dissemination of results was relatively high in this area, and stayed relatively
consistent between 2014 and 2015. 15 out of 21 commitments submitted
reports detailing dissemination activities in 2015, a reflection of the fact that
commitments in this area focus largely on awareness raising and campaigning
activities.
Fewer commitments demonstrated additionality in 2015 than did in 2014,
although (as with output reporting) this appears to be largely down to the lower
number of commitments rather than an increase in poor reporting. Between
2014 and 2015 the number of reports not evidencing additionality at all actually
dropped by one.
A relatively high proportion of advocacy commitments demonstrated EU-added
value, with nine out of 21 demonstrate at least some added value created by
their association with the Platform. This is roughly consistent with 2014, and
reflects the relatively larger number of advocacy commitments which use the
Platform as a dissemination tool.
The average quality of reports submitted in the area of advocacy dropped in
2015, with two rated as highly satisfactory, 11 rated as satisfactory and eight
rated as non-satisfactory. This was partially due to some commitments
submitting less detailed reports in 2015, and partially due to some well-
reported commitments ending in 2014.
6.5.2 Recommendations
Based upon both the assessment of 2015 commitments and a comparison between
commitment reports submitted in 2014 and 2015, a number of key recommendations
can be put forward for reports submitted in this area:
Three commitment reports (n°533, n°1402 and n°1503) used a structure
whereby objectives were numbered, and then inputs, outputs and outcomes
were listed and ascribed the same numbers depending on which objective they
were relevant to. This made it significantly clearer how inputs, outputs and
outcomes related to each objective and exactly what had been achieved by
those commitments. This would be a good approach for all commitment holders
to follow, as it helps evidence level of implementation more clearly.
Monitoring the activities of the EU Platform for Action on Diet, Physical Activity and Health – Annexes 1-3
May, 2016 109
Commitment holders need to take care that the objectives they set are fully
S.M.A.R.T. At present, a high number of objectives set for advocacy
commitments are neither specific nor measurable, and in most cases lack a
clear timeframe for completion as well. Objectives which are more S.M.A.R.T.
would help both clarify the intent of the commitment and focus report writing
around.
One area of weakness in many of the reports’ design sections was that they did
not give a clear sense of the impact the commitment was expected or desired
to have. Future reports would benefit from ensuring that statements concerned
with intended impact and outcomes are clearer and more substantive.
There is currently significant variation in the extent to which different EU-28
countries are covered by advocacy commitments, with nine countries covered
by only a minority of commitments. Given the nature of many of these
commitments (information dissemination) and the fact that many of Platform
members are multi-national advocacy and representative bodies, many
organisations submitting advocacy commitments could usefully expand the
reach of their respective commitments by cooperating or partnering with other
Platform members.

Monitoring the activities of the EU Platform for Action on Diet, Physical Activity and Health – Annexes 1-3
May, 2016 110
Annex 2: Platform commitments 2015 by status
New commitments;
Active commitments;
Completed commitments.
Table 13. New commitments
Platform member Actor name Action
number
Action Title Type of Action From / To
EuropeActive EuropeActive 1701 Promoting Physical Activity and Health in
Ageing (PAHA)
Physical activity
promotion
2015 /
2017
EUROPREV EUROPREV network 1702 Lifestyle interventions in patients with
established cardiovascular diseases
Education,
including lifestyle
modification
2015 /
2016
IDF Europe
International Diabetes
Federation European
Region
1703 Diabetes Prevention Forum “Feel 4
Diabetes”
Education,
including lifestyle
modification
2015 /
2019
COPA-COGECA National Farmers' Union
of England and Wales 1704
Farming and Countryside Education
(FACE)
Education,
including lifestyle
modification
2015 /
2019
ISCA /
FoodDrinkEurope
International Sport and
Culture Association /
Coca Cola
1705 Now We Move – MOVE Week
Physical activity
promotion
2015 /
2015
EASO / EFAD
European Association for
the Study of Obesity /
European Federation of
the Associations of
1706 European Guidelines for Management of
Obesity in Adults and Children
Education,
including lifestyle
modification
2015 /
2018
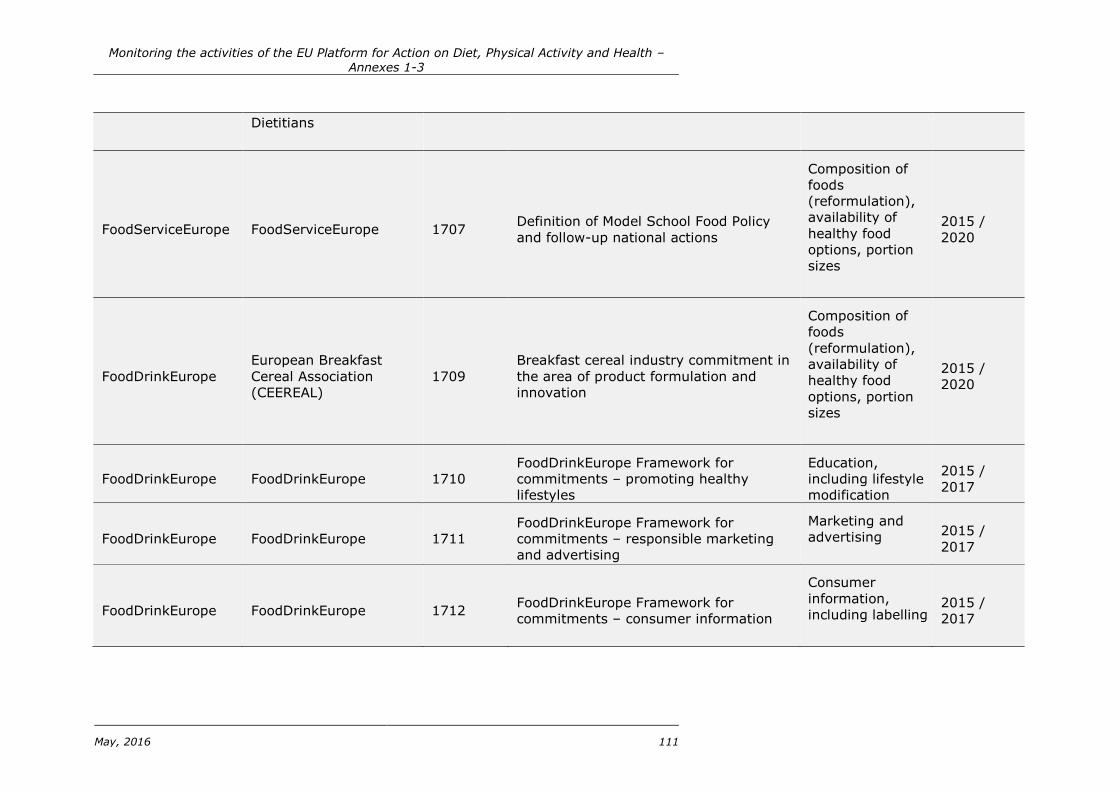
Monitoring the activities of the EU Platform for Action on Diet, Physical Activity and Health – Annexes 1-3
May, 2016 111
Dietitians
FoodServiceEurope FoodServiceEurope 1707 Definition of Model School Food Policy
and follow-up national actions
Composition of
foods
(reformulation),
availability of
healthy food
options, portion
sizes
2015 /
2020
FoodDrinkEurope
European Breakfast
Cereal Association
(CEEREAL)
1709
Breakfast cereal industry commitment in
the area of product formulation and
innovation
Composition of
foods
(reformulation),
availability of
healthy food
options, portion
sizes
2015 /
2020
FoodDrinkEurope FoodDrinkEurope 1710
FoodDrinkEurope Framework for
commitments – promoting healthy
lifestyles
Education,
including lifestyle
modification
2015 /
2017
FoodDrinkEurope FoodDrinkEurope 1711
FoodDrinkEurope Framework for
commitments – responsible marketing
and advertising
Marketing and
advertising 2015 /
2017
FoodDrinkEurope FoodDrinkEurope 1712 FoodDrinkEurope Framework for
commitments – consumer information
Consumer
information,
including labelling
2015 /
2017

Monitoring the activities of the EU Platform for Action on Diet, Physical Activity and Health – Annexes 1-3
May, 2016 112
FoodDrinkEurope FoodDrinkEurope 1713
FoodDrinkEurope Framework for
commitments - product formulation and
innovation (including portions)
Composition of
foods
(reformulation),
availability of
healthy food
options, portion
sizes
2015 /
2017

Monitoring the activities of the EU Platform for Action on Diet, Physical Activity and Health – Annexes 1-3
May, 2016 113
Table 14. Active commitments
PLATFORM
member Actor
Action number
Action Title
Activity Type
Period covered
FoodDrinkEurope FEVIA 263 Nutritional policy Charter
Composition of foods
(reformulation), availability of
healthy food options, portion
sizes
2005 / 2020
FoodDrinkEurope FEVIA 265 The self-regulatory code for
advertising Marketing and Advertising 2005 / 2020
FoodDrinkEurope FEVIA 268 NUBEL Consumer information,
including labelling 2004 / 2020
FoodDrinkEurope FEVIA 269 FEVIA Fund (partnership with the King
Baudouin Foundation)
Education, including lifestyle
modification 2005 / 2016
WFA FERRERO 427 Media literacy and responsible
advertising to children Marketing and Advertising 2005 / 2020
FoodDrinkEurope FERRERO Group 431 Promotion of physical activity Physical activity promotion
2004 / 2020
FoodDrinkEurope Danone (Groupe) 462 DANONE NATIONS CUP Physical activity promotion
2004 / 2020
EUFIC European Food
Information Council 521
Consumer research on nutrition
information and labelling
Consumer information,
including labelling 2006 / 2015

Monitoring the activities of the EU Platform for Action on Diet, Physical Activity and Health – Annexes 1-3
May, 2016 114
EUFIC European Food
Information Council 524
Increasing the outreach of EUFICs
information on healthy lifestyles
Education, including lifestyle
modification 2006 / 2015
EUFIC European Food
Information Council 526
Using EUFIC communication vehicles
to raise awareness of the EU Platform
Education, including lifestyle
modification 2006 / 2015
FRESHFEL Freshfel Europe 529 Freshfel Europe "Fresh Fruit and
Vegetables Consumption Monitor"
Advocacy and information
exchange
2006 / 2020
FRESHFEL Freshfel Europe 530
"Fresh Times" Newsletter with
Information on Fruit and Vegetables
Promotion
Advocacy and information
exchange
2006 / 2018
EASO European Association for
the Study of Obesity 533
To Promote Obesity as a Health,
Research and Societal Priority in
Europe
Advocacy and information
exchange
2005 / 2020
Serving Europe Serving Europe 535 Product Composition
Composition of foods
(reformulation), availability of
healthy food options, portion
sizes
2006 / 2016
Serving Europe Serving Europe 536 Consumer Information Consumer information,
including labelling 2006 / 2016
Serving Europe Serving Europe 537 Choice
Composition of foods
(reformulation), availability of
healthy food options, portion
sizes
2006 / 2016
WFA World Federation of
Advertisers 545
Media Smart media literacy
programme for primary school children Marketing and Advertising 2006 / 2020

Monitoring the activities of the EU Platform for Action on Diet, Physical Activity and Health – Annexes 1-3
May, 2016 115
FoodDrinkEurope UNESDA 581
Advertising and Commercial
Communications, including school
vending
Marketing and Advertising 2006 / 2020
FoodDrinkEurope UNESDA 582 Consumer information Consumer information,
including labelling 2006 / 2020
FoodDrinkEurope UNESDA 583 Products, Choice and Portion Size
Composition of foods
(reformulation), availability of
healthy food options, portion
sizes
2006 / 2020
FoodDrinkEurope PepsiCo Europe and UK 619
Product development, consumer
information, marketing/advertising and
the promotion of healthy lifestyles
Marketing and Advertising 2011 / 2015
A.R.E.F.L.H.
Assemblée des Régions
Européennes Fruitières,
Légumières et Horticoles
724 Dissemination of regional education
programmes
Advocacy and information
exchange
2007 / 2016
FoodDrinkEurope FERRERO Group 807 PRODUCT FORMULATION AND
PORTION SIZES
Composition of foods
(reformulation), availability of
healthy food options, portion
sizes
2004 / 2020
WOF World Obesity
Federation 810
Improving medical and health
professional skills to counteract obesity
Education, including lifestyle
modification 2007 / 2018
FoodDrinkEurope UNILEVER 833 Responsible marketing and advertising Marketing and Advertising 2006 / 2020
FoodDrinkEurope UNILEVER 834 Product reformulation and innovations
Composition of foods
(reformulation), availability of
healthy food options, portion
sizes
2006 / 2015

Monitoring the activities of the EU Platform for Action on Diet, Physical Activity and Health – Annexes 1-3
May, 2016 116
FoodDrinkEurope UNILEVER 837 Healthy Choice the Easy Choice Education, including lifestyle
modification 2006 / 2016
FoodDrinkEurope FERRERO Group 1001
EPODE (Ensemble Prévenons l'Obesité
des Enfants) / EEN (European Epode
Network))
Education, including lifestyle
modification 2006 / 2020
FoodDrinkEurope MARS 1004 Product Reformulations and Portion
Size Reductions
Composition of foods
(reformulation), availability of
healthy food options, portion
sizes
2007 / 2017
FoodDrinkEurope MARS 1009 CleverNaschen Education, including lifestyle
modification 2007 / 2017
FoodDrinkEurope MARS 1012 Bielice Run' - Young Europeans Run Physical activity promotion
2007 / 2017
FoodDrinkEurope MARS 1013 Supporting the Epode European
Network
Education, including lifestyle
modification 2007 / 2017
FoodDrinkEurope MARS 1016 Reduction of salt levels in rice and
sauce products
Composition of foods
(reformulation), availability of
healthy food options, portion
sizes
2007 / 2017
FoodDrinkEurope MARS 1018 Mars Marketing Commitments (MMC) Marketing and Advertising 2008 / 2020
FoodDrinkEurope UNESDA 1027 Guideline Daily Amount Labelling Consumer information,
including labelling 2007 / 2020
EuroCommerce Edenred 1028 Promotion of a balanced nutrition
programme on the working place
Consumer information,
including labelling 2006 / 2020

Monitoring the activities of the EU Platform for Action on Diet, Physical Activity and Health – Annexes 1-3
May, 2016 117
EVA MARS Inc 1036 Smart Choice Programme for Vending
in Education
Education, including lifestyle
modification 2007 / 2015
EUFIC European Food
Information Council 1061
Using EUFIC communication vehicles
to promote physical activity
Physical activity promotion
2008 / 2015
FoodDrinkEurope UNESDA 1064 No advertising in cinemas during films
aimed at children under 12 years Marketing and Advertising 2008 / 2020
COPA-COGECA The Danish Agricultural
and Food Council 1065
Holiday Food and Nutrition Camps
(Madskoler)
Education, including lifestyle
modification 2004 / 2020
IBFAN International Baby Food
Action Network 1068
Policy and programme coherence in
infant and young child feeding in the
EU
Advocacy and information
exchange
2008 / 2017
WFA World Federation of
Advertisers 1075
The EU Pledge - Changing Food
Advertising to Children Marketing and Advertising 2008 / 2020
COFACE Family Associations 1106 Media, advertising and nutrition:
media literacy educational package Marketing and Advertising 2009 / 2016
EFAD / EUFIC
European Federation of
the Associations of
Dietitians / European
Food Information Council
1111 Collaborate to promote increased
awareness and use of energy balance
Education, including lifestyle
modification 2009 / 2015
FoodDrinkEurope
Polish Federation of Food
Industry Union of
Employers
1113 "Keep fit" educational programme
Education, including lifestyle
modification 2006 / 2016
FoodDrinkEurope Kellogg Company 1115 Kellogg's Breakfast clubs Education, including lifestyle
modification 2004 / 2020
WOF IASO-World Obesity
Federation 1118
International standards for marketing
food to children Marketing and Advertising 2010 / 2016

Monitoring the activities of the EU Platform for Action on Diet, Physical Activity and Health – Annexes 1-3
May, 2016 118
FoodDrinkEurope UNESDA 1203 Not to market to children under 12
years in the Digisphere Marketing and Advertising 2010 / 2020
FoodDrinkEurope Danone Belgium 1207 Bon appétit, Bouge ta santé / Spring in
het rond, eet gezond
Education, including lifestyle
modification 2010 / 2020
FoodDrinkEurope Danone 1208 Eat like a Champ Education, including lifestyle
modification 2010 / 2020
COPA-COGECA The Danish Agricultural
and Food Council 1209 6 A DAY
Education, including lifestyle
modification 2008 / 2020
CPME Standing Committee of
European Doctors 1307 Informing the medical profession
Advocacy and information
exchange
2011 / 2016
EASO European Association for
the Study of Obesity 1310
Develop and maintain a network of
'EASO Collaborating Centres for
Obesity Management'
Education, including lifestyle
modification 2011 / 2020
EASO / EUFIC
European Association for
the Study of Obesity /
European Food
Information Council
1312 Increase outreach of new knowledge in
obesity research
Advocacy and information
exchange
2011 / 2015
IDF
International Diabetes
Federation European
Region
1313 Diabetes Prevention Forum “Manage
Care”
Education, including lifestyle
modification 2011 / 2016
COPA-COGECA
The Danish Agricultural
and Food Council
(DAFC)
1317 Partnership on the reduction of salt
content in food
Composition of foods
(reformulation), availability of
healthy food options, portion
sizes
2011 / 2018
WOF World Obesity
Federation 1402
SPOTLIGHT - Sustainable prevention of
obesity through integrated strategies
Advocacy and information
exchange 2012 / 2016

Monitoring the activities of the EU Platform for Action on Diet, Physical Activity and Health – Annexes 1-3
May, 2016 119
FoodDrinkEurope Nestlé 1406 Nestlé Healthy Kids Programme Education, including lifestyle
modification 2012 / 2015
FoodDrinkEurope UNILEVER 1413 Global Employee Health Programme -
Lamplighter
Education, including lifestyle
modification 2005 / 2020
FoodDrinkEurope FoodDrinkEurope 1414
FoodDrinkEurope Recommendation for
the continued use of Guideline Daily
Amounts (GDAs)
Consumer information,
including labelling
2012 / 2016
FoodDrinkEurope Blédina (Danone) 1417 Malin program, to improve dietary
habits of vulnerable infants
Education, including lifestyle
modification 2012 / 2018
FoodDrinkEurope Danone Spain 1418 Danone Sport Schools Physical activity promotion
2004 / 2020
IDF
International Diabetes
Federation European
Region
1419 World Diabetes Day
Advocacy and information
exchange
2012 / 2020
FoodDrinkEurope Danone Research 1420 Dietary habits and nutrient intakes in
infants and toddlers
Composition of foods
(reformulation), availability of
healthy food options, portion
sizes
2010 / 2016
EASO European Association for
the Study of Obesity 1503
Development of the EASO European
Obesity Patient Council
Advocacy and information
exchange
2013 / 2016
EFAD / EUFIC
European Federation of
the Associations of
Dietitians / European
Food Information Council
1504
Integrating behavior change
techniques and digital technology for
dietitian support
Education, including lifestyle
modification 2013 / 2015

Monitoring the activities of the EU Platform for Action on Diet, Physical Activity and Health – Annexes 1-3
May, 2016 120
FoodDrinkEurope European Snacks
Association 1513
European savoury snacks industry
commitment in the area of consumer
information
Consumer information,
including labelling
2006 / 2016
FoodDrinkEurope European Snacks
Association 1514
European savoury snacks industry
commitment in the area of product
development and choice
Composition of foods
(reformulation), availability of
healthy food options, portion
sizes
2006 / 2016
FoodDrinkEurope European Snacks
Association 1515
European savoury snacks industry
commitment in the area of marketing
and advertising
Marketing and Advertising 2010 / 2016
FoodDrinkEurope European Snacks
Association 1516
European Snacks Association
commitment in the area of advocacy
and information exchange
Advocacy and information
exchange
2006 / 2016
COPA-COGECA The Danish Agricultural
and Food Council ( 1517
Forum for home economics teachers in
primary and lower secondary schools
Education, including lifestyle
modification 2005 / 2020
COPA-COGECA The Danish Agricultural
and Food Council 1518
Forum for health professionals
including dieticians
Advocacy and information
exchange
2004 / 2020
CESS Confederation
Européenne Sport Santé 1604 Ready steady Go
Physical activity promotion
2014 / 2018
BEUC The European
Consumer's Organisaiton 1605
Helping consumers to make healthier
and more-informed food choices
Advocacy and information
exchange
2014 / 2017
ISCA /
FoodDrinkEurope
International Sport and
Culture Association /
Coca Cola
1606 Now We Move Activation Physical activity promotion
2014 / 2016
FoodDrinkEurope Nestlé 1607 Provide nutritionally sound products Composition of foods 2014 / 2016

Monitoring the activities of the EU Platform for Action on Diet, Physical Activity and Health – Annexes 1-3
May, 2016 121
for all consumers including children (reformulation), availability of
healthy food options, portion
sizes
EuroHealthNet EuroHealthNet 1608
Promote information exchange and
innovation, including health and social
equity
Advocacy and information
exchange
2014 / 2020
ER-WCPT
European Region of the
World Confederation for
Physical Therapy
1609 Promoting physical activity in children,
the role of Physiotherapists
Physical activity promotion
2014 / 2016
EHN European Heart Network 1610 Empower and inform families on diet
and physical activity
Advocacy and information
exchange
2014 / 2015
FoodDrinkEurope Nestlé 1611 Providing Portion Guidance(TM) on all
Nestlé's children's and family products
Consumer information,
including labelling 2014 / 2016
ACT Association of
Commercial Television 1613
COMMERCIAL TV CHANNELS BEST
PRACTICES IN PROMOTING PHYSICAL
ACTIVITY via programming and
beyond
Advocacy and information
exchange
2014 / 2016
COPA-COGECA Arla Fonden 1614 Arla Fonden Food Camps Education, including lifestyle
modification 2014 / 2020
WOF World Obesity
Federation 1615
DAPHNE - Data-as-a-Service platform
for Healthy Lifestyle support
Physical activity promotion
2013 / 2016
COPA-COGECA Danish Agriculture and
Food Council 1616 Forum on Malnutrition
Advocacy and information
exchange
2014 / 2018

Monitoring the activities of the EU Platform on Diet, Physical Activity and Health
April, 2016 122
Table 15. Completed commitments
Platform
member
Actor
Name
Action
number Action Title
Activity Type
FoodDrinkEurope Nestlé
(Suisse) 449 Wellness For Me
Education, including
lifestyle modification
FoodDrinkEurope MARS 1015 Nutrition Labelling Initiative: Indication of Guideline Daily
Amounts (GDAs)
Consumer information,
including labelling
FoodDrinkEurope Nestlé
(Spain) 1024 ¡A comer bien! (To eat well)
Consumer information,
including labelling
EPHA
European
Public
Health
Alliance
1043
Dissemination of information on European food, nutrition
and physical activity policy developments with EPHA's
member organisations
Advocacy and information
exchange
FoodDrinkEurope
DANONE
RESEARCH
Centre
Daniel
Carasso
1114 Ma santé au quotidien Education, including
lifestyle modification
FoodDrinkEurope Mondelēz
International 1211 Mondelēz International - Employee Wellbeing
Education, including
lifestyle modification
CPME
Standing
Committee
of European
Doctors
1305 healthy choices at work
Composition of foods
(reformulation),
availability of healthy
food options, portion
sizes
EVA
European
Vending
Association
1314 Increasing vending choice to promote healthy eating
habits
Composition of foods
(reformulation),
availability of healthy

Monitoring the activities of the EU Platform on Diet, Physical Activity and Health
April, 2016 123
food options, portion
sizes
CPME
Standing
Committee
of European
Doctors
1509 Mobilising the medical profession: the ‘Health Village’
Toolbox II
Advocacy and information
exchange
EPHA
European
Public
Health
Alliance
1602
EU Platform for Action on Diet, Physical Activity and
Health - analysis of the industry's commitments against
public health objectives
Advocacy and information
exchange
ISCA /
FoodDrinkEurope
International
Sport and
Culture
Association /
Coca Cola
1705 Now We Move – MOVE Week
Physical activity
promotion

Monitoring the activities of the EU Platform on Diet, Physical Activity and Health
April, 2016 124
Annex 3: Breakdown of commitments 2015 per activity type
The tables in this annex provide a breakdown of commitments per activity type and
are in the following order:
Marketing and advertising;
Composition of foods (reformulation), availability of healthy food options,
portion sizes;
Consumer information, including labelling;
Education, including lifestyle modification;
Physical activity promotion; and
Advocacy and information exchange.

Monitoring the activities of the EU Platform on Diet, Physical Activity and Health
May, 2016 125
Table 16. Marketing and advertising
Platform
member
Action
Number
Title
COFACE 1106 Media, advertising and nutrition: media literacy educational package
FoodDrinkEurope
265 The self-regulatory code for advertising
581 Advertising and Commercial Communications, including school vending
619 Product development, consumer information, marketing/advertising and the promotion of
healthy lifestyles
833 Responsible marketing and advertising
1018 Mars Marketing Commitments (MMC)
1064 No advertising in cinemas during films aimed at children under 12 years
1203 Not to market to children under 12 years in the Digisphere
1515 European savoury snacks industry commitment in the area of marketing and advertising
1711 FoodDrinkEurope Framework for commitments – responsible marketing and advertising
WFA
427 media literacy and responsible advertising to children
545 Media Smart media literacy programme for primary school children
1075 The EU Pledge - Changing Food Advertising to Children
WOF 1118 International standards for marketing food to children

Monitoring the activities of the EU Platform on Diet, Physical Activity and Health
May, 2016 126
Table 17. Composition of foods (reformulation), availability of healthy food options, portion sizes
Platform member Action Number Title
COPA-COGECA 1317 Partnership on the reduction of salt content in food
CPME 1305 healthy choices at work
EVA 1314 Increasing vending choice to promote healthy eating habits
FoodDrinkEurope
263 Nutritional policy Charter
583 Products, Choice and Portion Size
807 PRODUCT FORMULATION AND PORTION SIZES
834 Product reformulation and innovations
1004 Product Reformulations and Portion Size Reductions
1016 Reduction of salt levels in rice and sauce products
1420 Dietary habits and nutrient intakes in infants and toddlers
1514 European savoury snacks industry commitment in the area of
product development and choice
1607 Provide nutritionally sound products for all consumers including
children
1709 Breakfast cereal industry commitment in the area of product
formulation and innovation
1713 FoodDrinkEurope Framework for commitments - product formulation
and innovation (including portions)
FoodServiceEurope 1707 Definition of Model School Food Policy and follow-up national actions
Serving Europe 535 Product Composition
Serving Europe 537 Choice
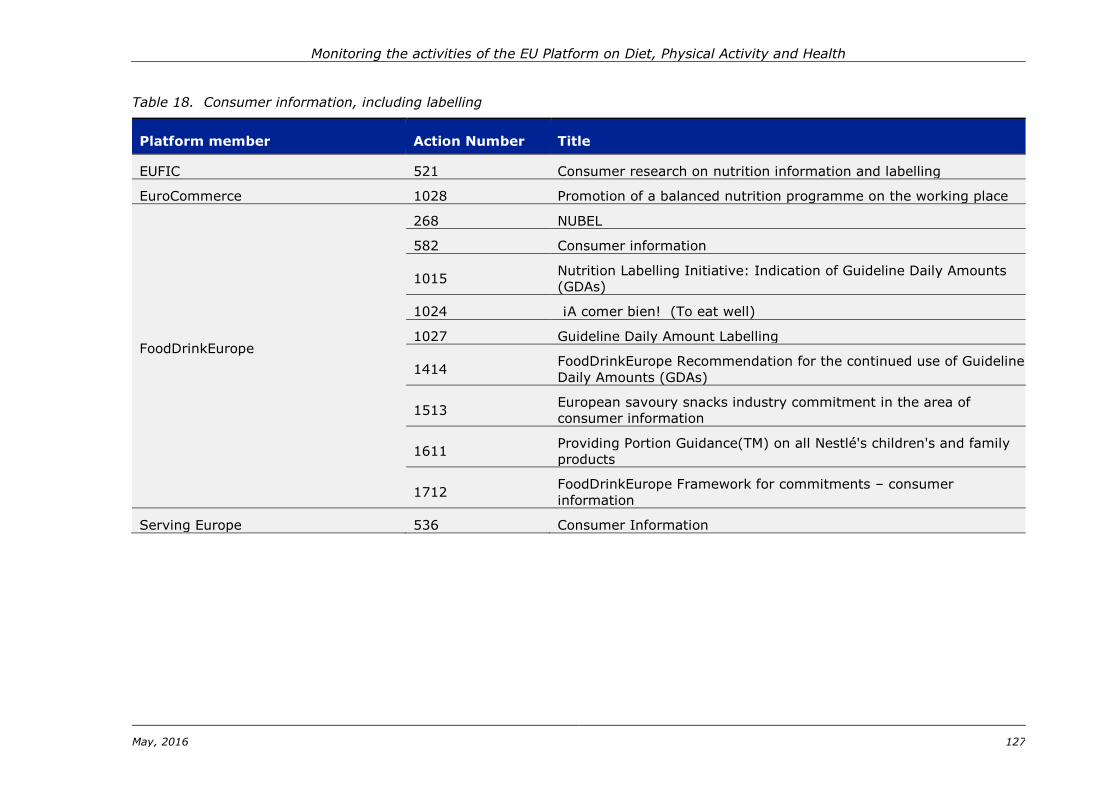
Monitoring the activities of the EU Platform on Diet, Physical Activity and Health
May, 2016 127
Table 18. Consumer information, including labelling
Platform member Action Number Title
EUFIC 521 Consumer research on nutrition information and labelling
EuroCommerce 1028 Promotion of a balanced nutrition programme on the working place
FoodDrinkEurope
268 NUBEL
582 Consumer information
1015 Nutrition Labelling Initiative: Indication of Guideline Daily Amounts
(GDAs)
1024 ¡A comer bien! (To eat well)
1027 Guideline Daily Amount Labelling
1414 FoodDrinkEurope Recommendation for the continued use of Guideline
Daily Amounts (GDAs)
1513 European savoury snacks industry commitment in the area of
consumer information
1611 Providing Portion Guidance(TM) on all Nestlé's children's and family
products
1712 FoodDrinkEurope Framework for commitments – consumer
information
Serving Europe 536 Consumer Information

Monitoring the activities of the EU Platform on Diet, Physical Activity and Health
May, 2016 128
Table 19. Education, including lifestyle modification
Platform member Action Number Title
COPA-COGECA
1065 Holiday Food and Nutrition Camps (Madskoler)
1209 6 A DAY
1517 Forum for home economics teachers in primary and lower secondary
schools
1614 Arla Fonden Food Camps
1704 National Farmers' Union of England and Wales
EASO 1310 Develop and maintain a network of 'EASO Collaborating Centres for
Obesity Management'
EASO / EFAD 1706 European Guidelines for Management of Obesity in Adults and
Children
EFAD / EUFIC
1111 Collaborate to promote increased awareness and use of energy
balance
1504 Integrating behaviour change techniques and digital technology for
dietitian support
EUFIC
524 Increasing the outreach of EUFICs information on healthy lifestyles
526 Using EUFIC communication vehicles to raise awareness of the EU
Platform
EUROPREV 1702 Lifestyle interventions in patients with established cardiovascular
diseases
EVA 1036 Smart Choice Programme for Vending in Education
FoodDrinkEurope
269 FEVIA Fund (partnership with the King Baudouin Foundation)
449 Wellness For Me
837 Healthy Choice the Easy Choice

Monitoring the activities of the EU Platform on Diet, Physical Activity and Health
May, 2016 129
1001 EPODE (Ensemble Prévenons l'Obesité des Enfants) / EEN (European
Epode Network))
1009 CleverNaschen
1013 Supporting the Epode European Network
1113 "Keep fit" educational programme
1114 Ma santé au quotidien
1115 Kellogg's Breakfast clubs
1207 Bon appétit, Bouge ta santé / Spring in het rond, eet gezond
1208 Eat like a Champ
1211 Mondelēz International - Employee Wellbeing
1406 Nestlé Healthy Kids Programme
1413 Global Employee Health Programme - Lamplighter
1417 Malin program, to improve dietary habits of vulnerable infants
1710 FoodDrinkEurope Framework for commitments – promoting healthy
lifestyles
IDF 1313 Diabetes Prevention Forum “Manage Care”
1703 Diabetes Prevention Forum “Feel 4 Diabetes”
WOF 810 Improving medical and health professional skills to counteract
obesity

Monitoring the activities of the EU Platform on Diet, Physical Activity and Health
May, 2016 130
Table 20. Physical activity promotion
Platform Member Action Number Title
CESS 1604 Ready steady Go
ER-WCPT 1609 Promoting physical activity in children, the role of Physiotherapists
EUFIC 1061 Using EUFIC communication vehicles to promote physical activity
EuropeActive 1701 Promoting Physical Activity and Health in Ageing (PAHA)
FoodDrinkEurope
431 Promotion of physical activity
462 DANONE NATIONS CUP
1012 Bielice Run' - Young Europeans Run
1418 Danone Sport Schools
ISCA / FoodDrinkEurope 1606 Now We Move Activation
1705 Now We Move – MOVE Week
WOF 1615 DAPHNE - Data-as-a-Service platform for Healthy Lifestyle support

Monitoring the activities of the EU Platform on Diet, Physical Activity and Health
May, 2016 131
Table 21. Advocacy and information exchange
A.R.E.F.L.H. 724 Dissemination of regional education programmes
ACT 1613 COMMERCIAL TV CHANNELS BEST PRACTICES IN PROMOTING
PHYSICAL ACTIVITY via programming and beyond
BEUC 1605 Helping consumers to make healthier and more-informed food
choices
COPA-COGECA 1518 Forum for health professionals including dieticians
1616 Forum on Malnutrition
CPME 1307 Informing the medical profession
1509 Mobilising the medical profession: the ‘Health Village’ Toolbox II
EASO 533
To Promote Obesity as a Health, Research and Societal Priority in
Europe
1503 Development of the EASO European Obesity Patient Council
EASO / EUFIC 1312 Increase outreach of new knowledge in obesity research
EHN 1610 Empower and inform families on diet and physical activity
EPHA
1043
Dissemination of information on European food, nutrition and
physical activity policy developments with EPHA's member
organisations
1602
EU Platform for Action on Diet, Physical Activity and Health -
analysis of the industry's commitments against public health
objectives
EuroHealthNet 1608 Promote information exchange and innovation, including health
and social equity
FoodDrinkEurope 1516 European Snacks Association commitment in the area of advocacy
and information exchange

Monitoring the activities of the EU Platform on Diet, Physical Activity and Health
May, 2016 132
FRESHFEL
529 Freshfel Europe "Fresh Fruit and Vegetables Consumption Monitor"
530 "Fresh Times" Newsletter with Information on Fruit and
Vegetables Promotion
IBFAN 1068 Policy and programme coherence in infant and young child feeding
in the EU
IDF 1419 World Diabetes Day
WOF 1402 SPOTLIGHT - Sustainable prevention of obesity through integrated
strategies
