monitoring kubernetes with prometheus (kubernetes ireland, 2016)
TRANSCRIPT
Brian BrazilFounder
Monitoring Kubernetes
with Prometheus
Who am I?Engineer passionate about running software reliably in production.
● TCD CS Degree● Google SRE for 7 years, working on high-scale reliable systems such as
Adwords, Adsense, Ad Exchange, Billing, Database● Boxever TL Systems&Infrastructure, applied processes and technology to let
allow company to scale and reduce operational load● Contributor to many open source projects, including Prometheus, Ansible,
Python, Aurora and Zookeeper.● Founder of Robust Perception, making scalability and efficiency available to
everyone
Why monitor?
● Know when things go wrong○ To call in a human to prevent a business-level issue, or prevent an issue in advance
● Be able to debug and gain insight● Trending to see changes over time, and drive technical/business decisions● To feed into other systems/processes (e.g. QA, security, automation)
Common Monitoring ChallengesThemes common among companies I’ve talk to:
● Monitoring tools are limited, both technically and conceptually● Tools don’t scale well and are unwieldy to manage● Operational practices don’t align with the business
For example:
Your customers care about increased latency and it’s in your SLAs. You can only alert on individual machine CPU usage.
Result: Engineers continuously woken up for non-issues, get fatigued
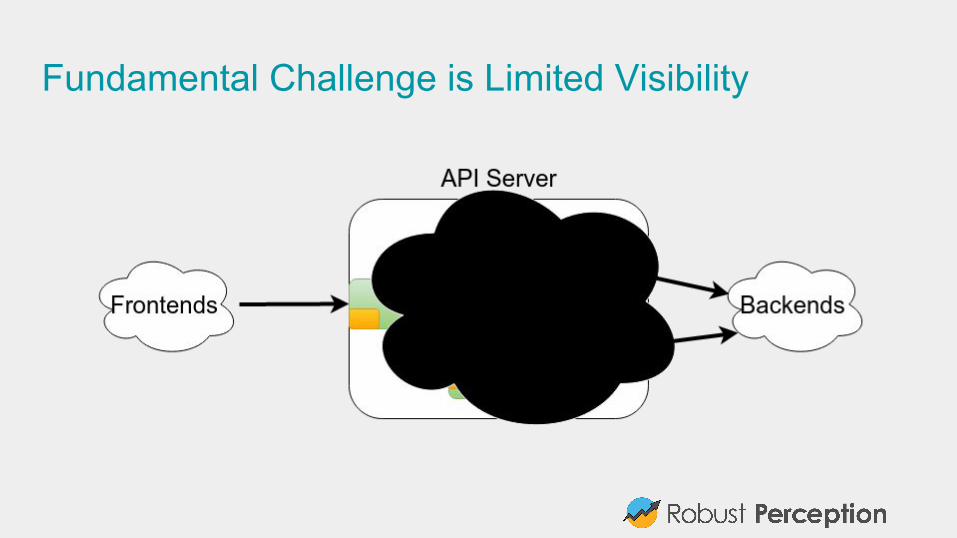
Fundamental Challenge is Limited Visibility
PrometheusInspired by Google’s Borgmon monitoring system.
(Kubernetes is the next version of Google’s Borg.)
Started in 2012 by ex-Googlers working in Soundcloud as an open source project, mainly written in Go. Publically launched in early 2015, and continues to be independent of any one company.
Over 100 companies have started relying on it since then.
What does Prometheus offer?● Inclusive Monitoring● Powerful data model● Powerful query language● Manageable and Reliable● Efficient● Scalable● Easy to integrate with● Dashboards
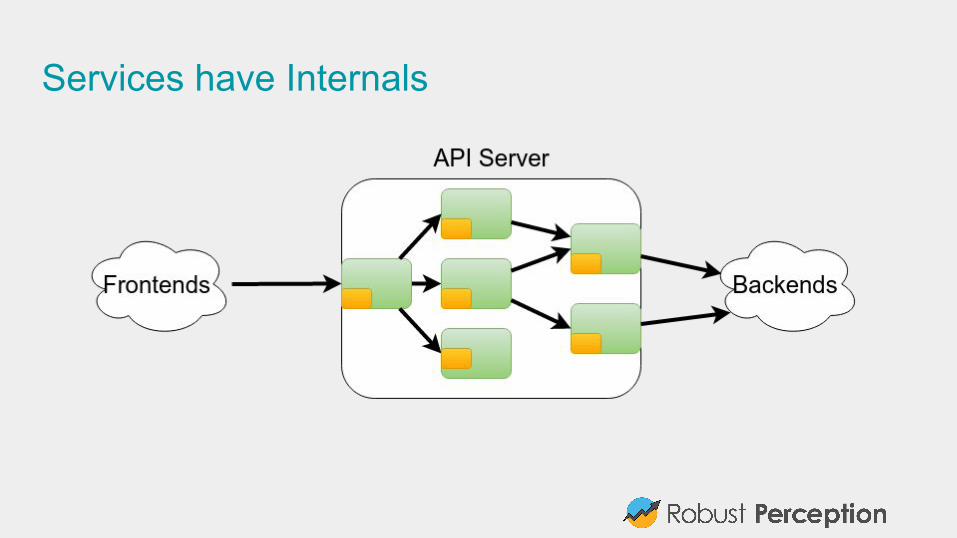
Services have Internals
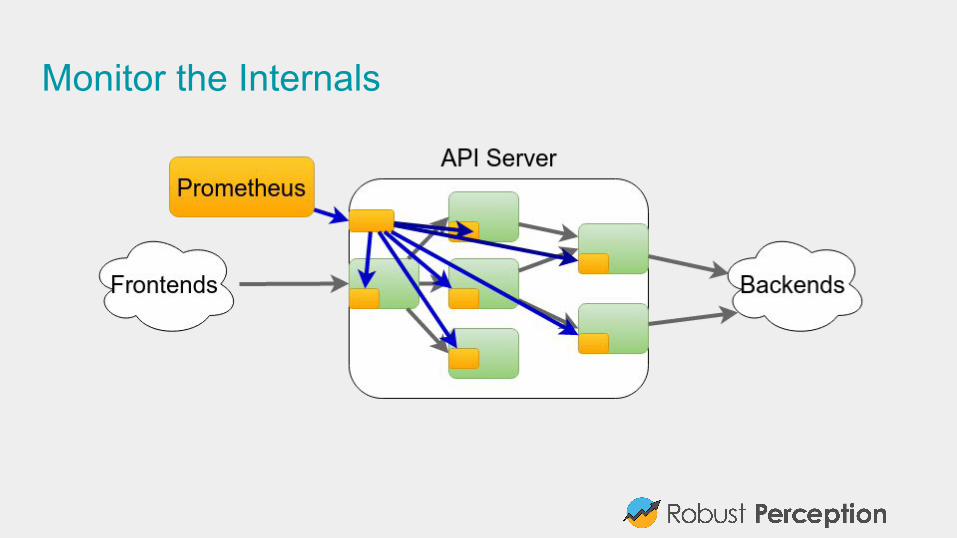
Monitor the Internals
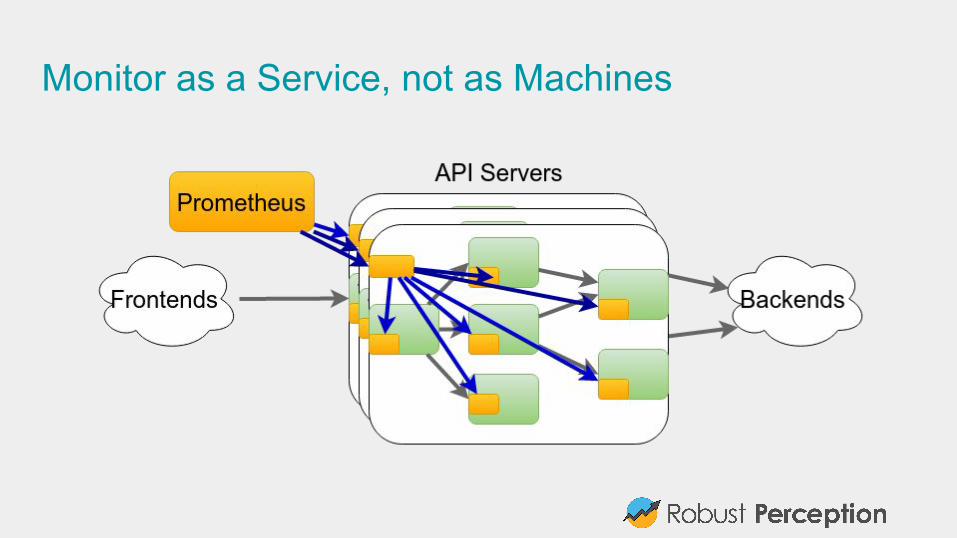
Monitor as a Service, not as Machines
Inclusive MonitoringDon’t monitor just at the edges:
● Instrument client libraries● Instrument server libraries (e.g. HTTP/RPC)● Instrument business logic
Library authors get information about usage.
Application developers get monitoring of common components for free.
Dashboards and alerting can be provided out of the box, customised for your organisation!
How to instrument your code?
Several common approaches:
● Custom endpoint/interface to dump stats (usually JSON or CSV)
● Use one mildly standard instrumentation system (e.g. JMX in Java)
● For libraries, have some type of hooks
● Don’t
This isn’t greatUsers run more than just your software project, with a variety of monitoring tools.
As a user you’re left with a choice: Have N monitoring systems, or run extra services to act as shims to translate.
As a monitoring project, we have to write code and/or configuration for every individual library/application.
This is a sub-optimal for everyone.
Open ecosystemPrometheus client libraries don’t tie you into Prometheus.
For example the Python and Java clients can output to Graphite, with no need to run any Prometheus components.
This means that you as a library author can instrument with Prometheus, and your users with just a few lines of code can output to whatever monitoring system they want. No need for users to worry about a new standard.
This can be done incrementally.
It goes the other way tooIt’s unlikely that everyone is going to switch to Prometheus all at once, so we’ve integrations that can take in data from other monitoring systems and make it useful.
Graphite, Collectd, Statsd, SNMP, JMX, Dropwizard, AWS Cloudwatch, New Relic, Rsyslog and Scollector (Bosun) are some examples.
Prometheus and its client libraries can act a clearinghouse to convert between monitoring systems.
For example Zalando’s Zmon uses the Python client to parse Prometheus metrics from directly instrumented binaries.
Instrumentation made easyPrometheus clients don’t just marshall data.
They take care of the nitty gritty details like concurrency and state tracking.
We take advantage of the strengths of each language.
In Python for example that means context managers and decorators.
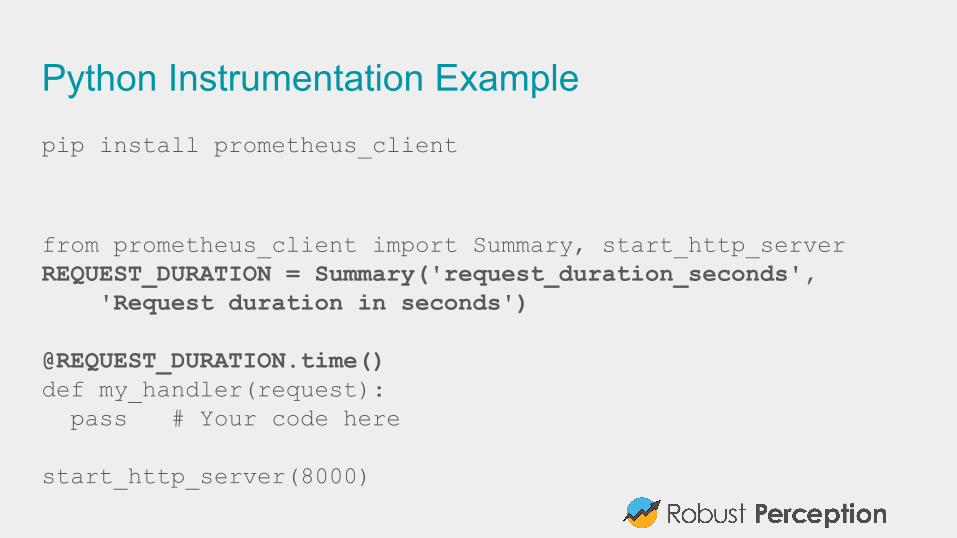
Python Instrumentation Examplepip install prometheus_client
from prometheus_client import Summary, start_http_serverREQUEST_DURATION = Summary('request_duration_seconds', 'Request duration in seconds')
@REQUEST_DURATION.time()def my_handler(request): pass # Your code here
start_http_server(8000)
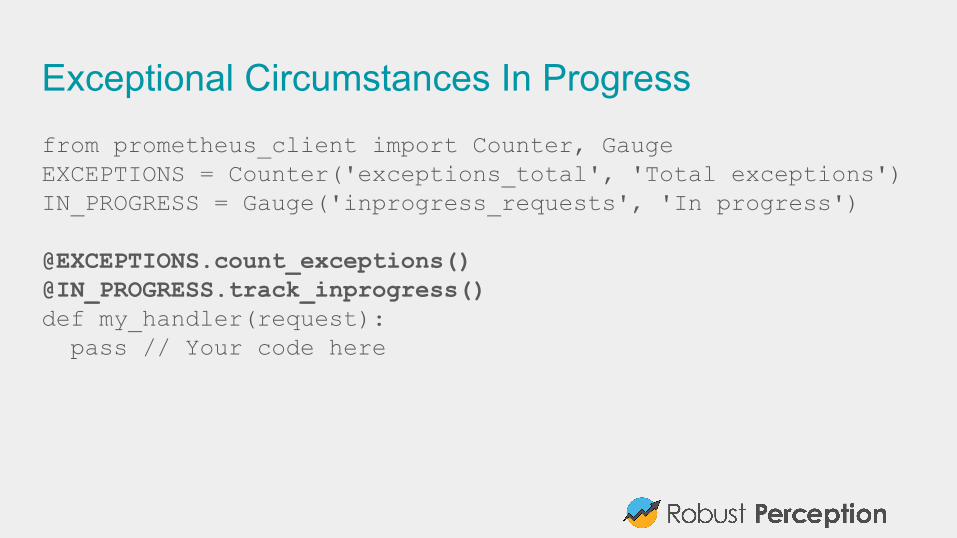
Exceptional Circumstances In Progressfrom prometheus_client import Counter, GaugeEXCEPTIONS = Counter('exceptions_total', 'Total exceptions')IN_PROGRESS = Gauge('inprogress_requests', 'In progress')
@EXCEPTIONS.count_exceptions()@IN_PROGRESS.track_inprogress()def my_handler(request): pass // Your code here
Data and Query Language: LabelsPrometheus doesn’t use dotted.strings like metric.kubernetes.dublin.
Multi-dimensional labels instead like metric{tech=”kubernetes”,city=”dublin”}
Similar to Kubernetes' labels.
Can aggregate, cut, and slice along them.
Can come from instrumentation, or be added based on the service you are monitoring.
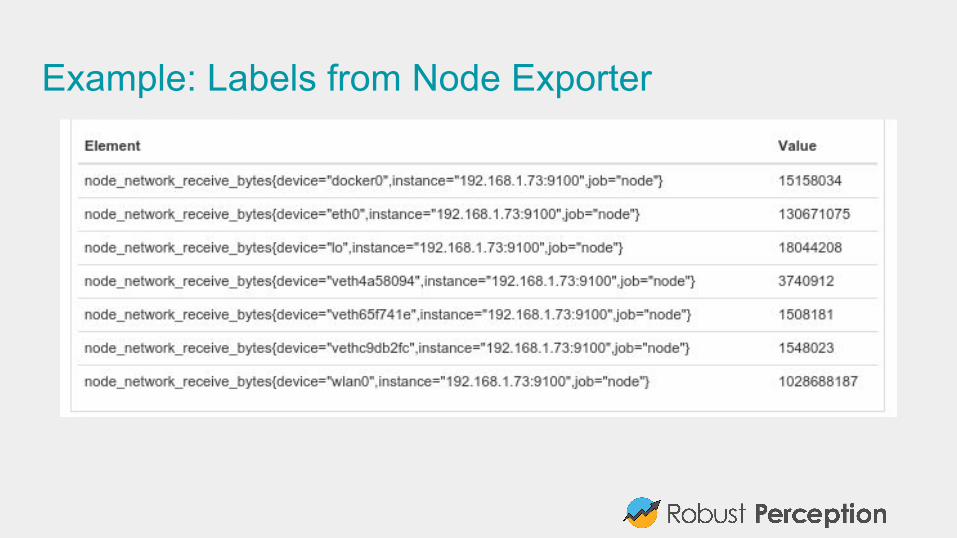
Example: Labels from Node Exporter
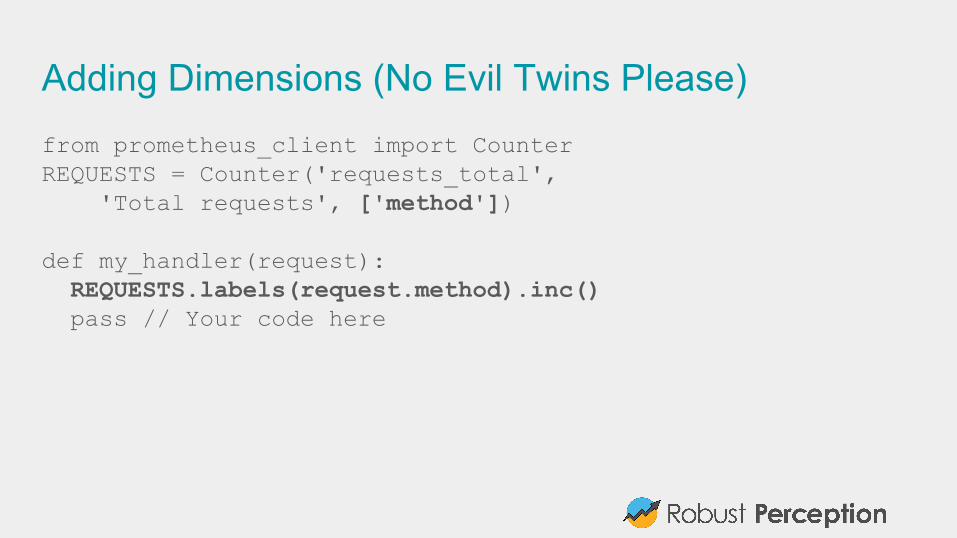
Adding Dimensions (No Evil Twins Please)from prometheus_client import CounterREQUESTS = Counter('requests_total', 'Total requests', ['method'])
def my_handler(request): REQUESTS.labels(request.method).inc() pass // Your code here
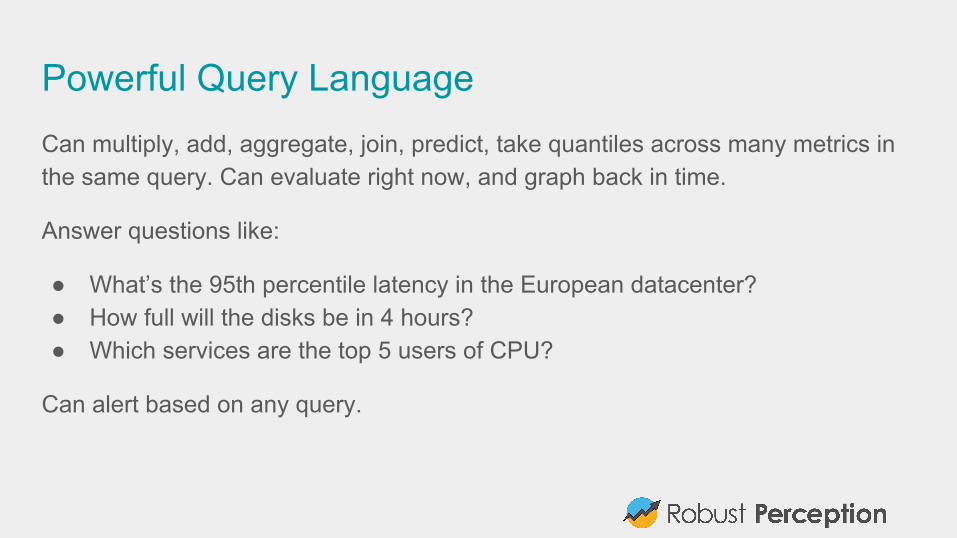
Powerful Query LanguageCan multiply, add, aggregate, join, predict, take quantiles across many metrics in the same query. Can evaluate right now, and graph back in time.
Answer questions like:
● What’s the 95th percentile latency in the European datacenter?● How full will the disks be in 4 hours?● Which services are the top 5 users of CPU?
Can alert based on any query.
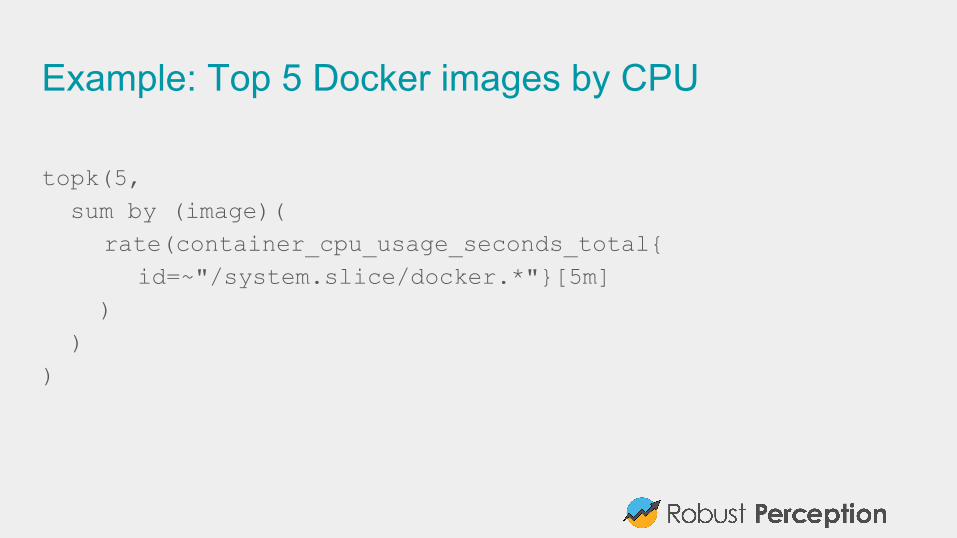
Example: Top 5 Docker images by CPU
topk(5, sum by (image)(
rate(container_cpu_usage_seconds_total{id=~"/system.slice/docker.*"}[5m]
) ))
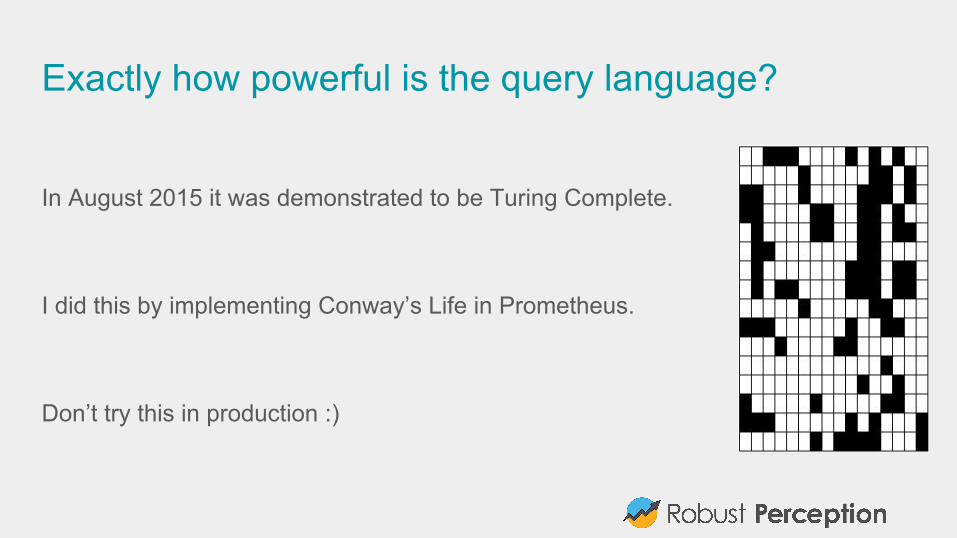
Exactly how powerful is the query language?
In August 2015 it was demonstrated to be Turing Complete.
I did this by implementing Conway’s Life in Prometheus.
Don’t try this in production :)
Manageable and ReliableCore Prometheus server is a single binary.
Doesn’t depend on Zookeeper, Consul, Cassandra, Hadoop or the Internet.
Only requires local disk (SSD recommended). No potential for cascading failure.
Pull based, so easy to on run a workstation for testing and rogue servers can’t push bad metrics.
Advanced service discovery finds what to monitor.
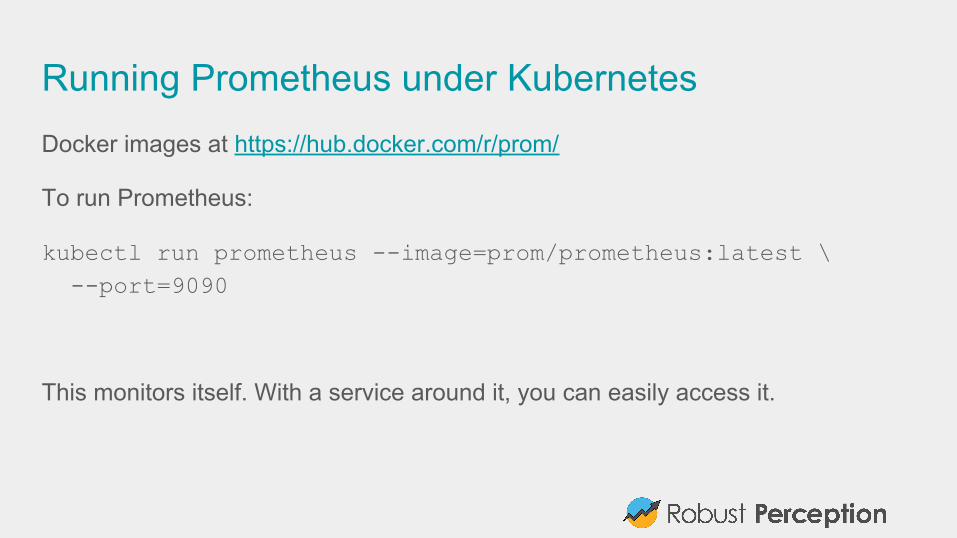
Running Prometheus under KubernetesDocker images at https://hub.docker.com/r/prom/
To run Prometheus:
kubectl run prometheus --image=prom/prometheus:latest \ --port=9090
This monitors itself. With a service around it, you can easily access it.
Easy to integrate withMany existing integrations: Java, JMX, Python, Go, Ruby, .Net, Machine, Cloudwatch, EC2, MySQL, PostgreSQL, Haskell, Bash, Node.js, SNMP, Consul, HAProxy, Mesos, Bind, CouchDB, Django, Mtail, Heka, Memcached, RabbitMQ, Redis, RethinkDB, Rsyslog, Meteor.js, Minecraft...
Graphite, Statsd, Collectd, Scollector, Munin, Nagios integrations aid transition.
It’s so easy, most of the above were written without the core team even knowing about them!
Kubernetes natively supports Prometheus
If you go to the Kubernetes apiserver, the /metrics endpoint has Prometheus metrics
Example: http://localhost:8080/metrics
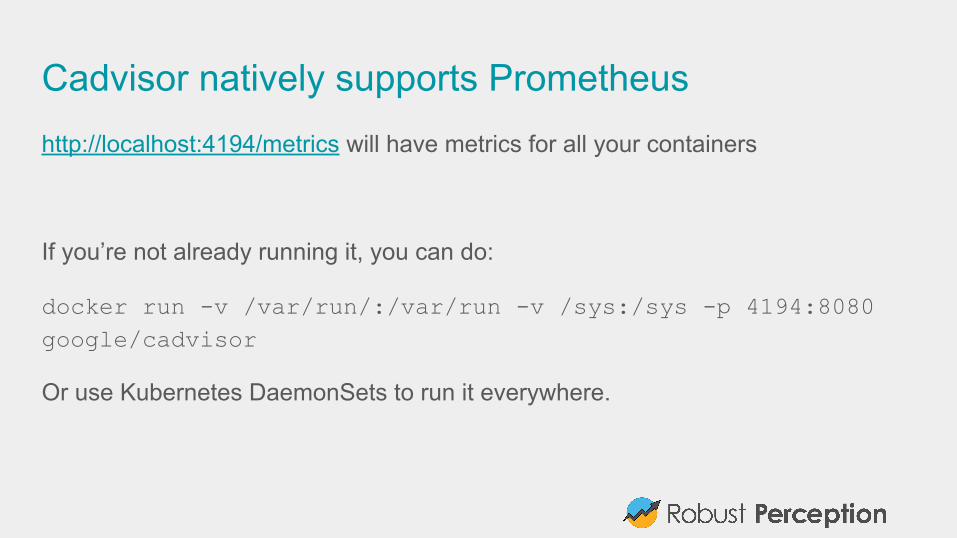
Cadvisor natively supports Prometheushttp://localhost:4194/metrics will have metrics for all your containers
If you’re not already running it, you can do:
docker run -v /var/run/:/var/run -v /sys:/sys -p 4194:8080 google/cadvisor
Or use Kubernetes DaemonSets to run it everywhere.
Service DiscoveryIt’s vital to know where each of your instances is meant to be running.
Systems such as Kubernetes spread applications across machines, so we need some form of service discovery to find them.
Prometheus supports Kubernetes as a discovery mechanism

Prometheus configuration to monitor kubeletsscrape_configs: - job_name: 'kubelet' kubernetes_sd_configs: - api_servers: 'http://127.0.0.1:8500' relabel_configs: - source_labels: [__meta_kubernetes_role] action: keep regex: node
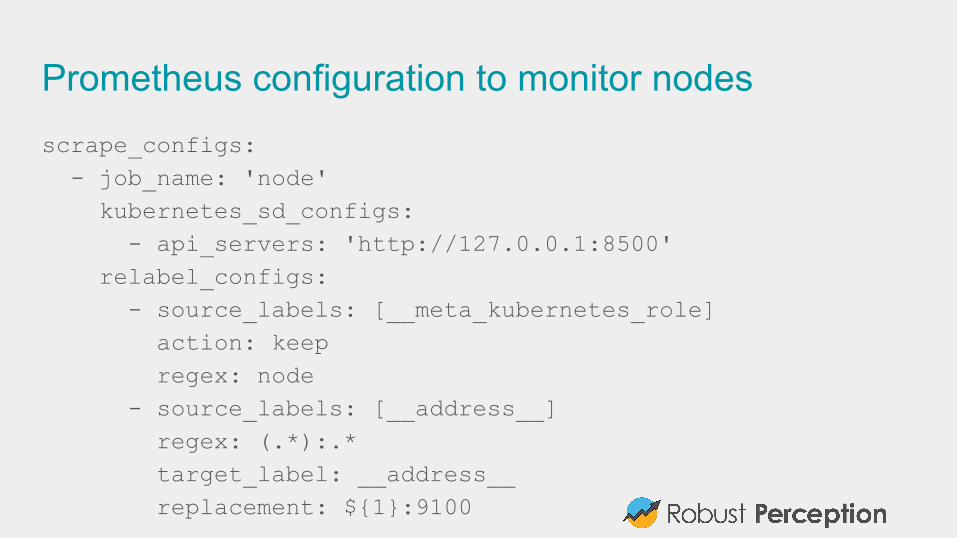
Prometheus configuration to monitor nodesscrape_configs: - job_name: 'node' kubernetes_sd_configs: - api_servers: 'http://127.0.0.1:8500' relabel_configs: - source_labels: [__meta_kubernetes_role] action: keep regex: node - source_labels: [__address__] regex: (.*):.* target_label: __address__ replacement: ${1}:9100
Discovering ServicesCan also work via service endpoints.
Can use annotations and labels of the service to select and set labels.
How this works in terms of containers/pods/services/endpoints is currently under active discussion, and how it works will likely change in the next week or two.
EfficientInstrumenting everything means a lot of data.
Prometheus is best in class for lossless storage efficiency, 4.5 bytes per datapoint.
A single server can handle:
● millions of metrics● hundreds of thousands of datapoints per second
ScalablePrometheus is easy to run, can give one to each team in each datacenter.
Federation allows pulling key metrics from other Prometheus servers.
When one job is too big for a single Prometheus server, can use sharding+federation to scale out. Needed with thousands of machines.
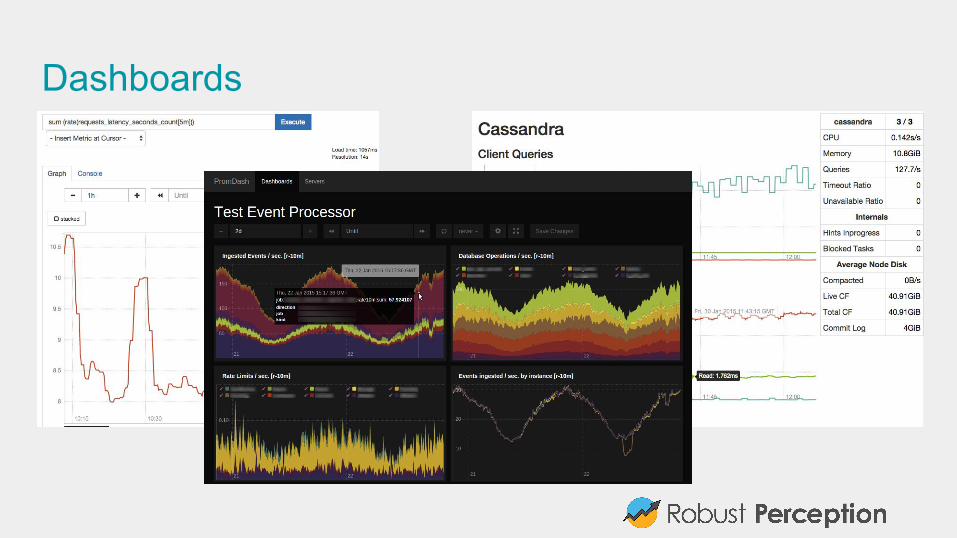
Dashboards

What does Prometheus offer?● Inclusive Monitoring● Powerful data model● Powerful query language● Manageable and Reliable● Efficient● Scalable● Easy to integrate with● Dashboards
What do we do?Robust Perception provides consulting and training to give you confidence in your production service's ability to run efficiently and scale with your business.
We can help you:
● Decide if Prometheus is for you● Manage your transition to Prometheus and resolve issues that arise● With capacity planning, debugging, infrastructure etc.
We are proud to be among the core contributors to the Prometheus project.
ResourcesOfficial Project Website: prometheus.io
Official Mailing List: [email protected]
Demo: demo.robustperception.io
Robust Perception Website: www.robustperception.io
Queries: [email protected]