modern continuous improvement methods to improve seaport ... · 5s system visual workplace...
TRANSCRIPT
Modern Continuous Improvement Methods to Improve Seaport
Velocity and Productivity
Jeff SiniardUniversity of Alabama in Huntsville
Nicholas LoydUniversity of Alabama in Huntsville
Thanks!Thanks!
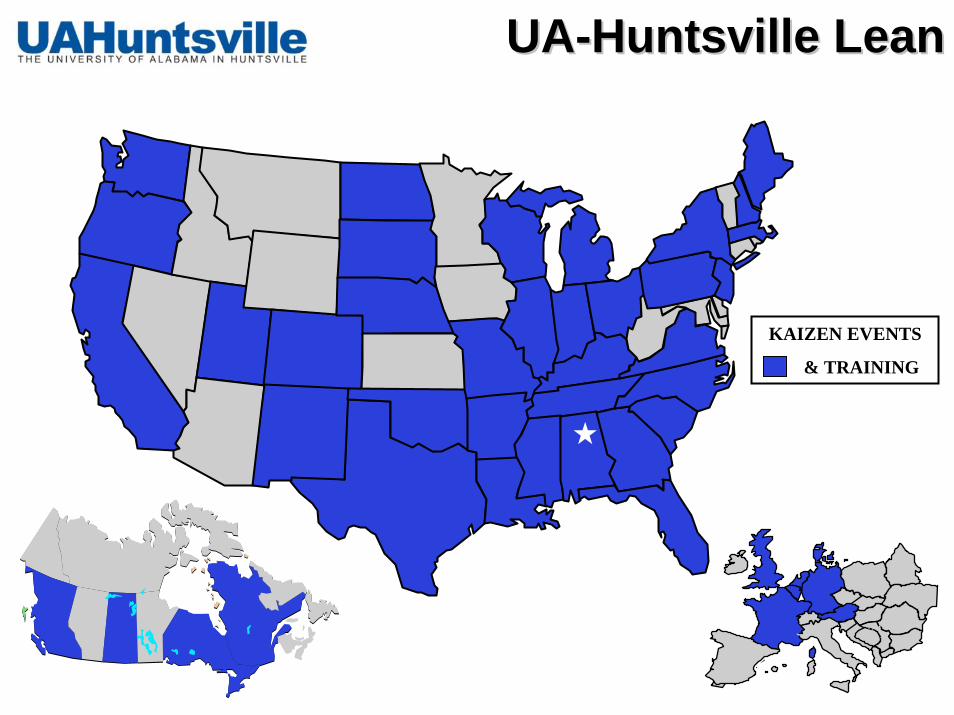
UAUA--Huntsville LeanHuntsville Lean
KAIZEN EVENTS
& TRAINING
Where Did Where Did ““LeanLean”” Come From?Come From?
The Toyota Production System by Taiichi Ohno
The Machine That Changed the World and Lean Thinking
by Jim Womack and Dan Jones
Lean Enterprise ObjectiveLean Enterprise Objective
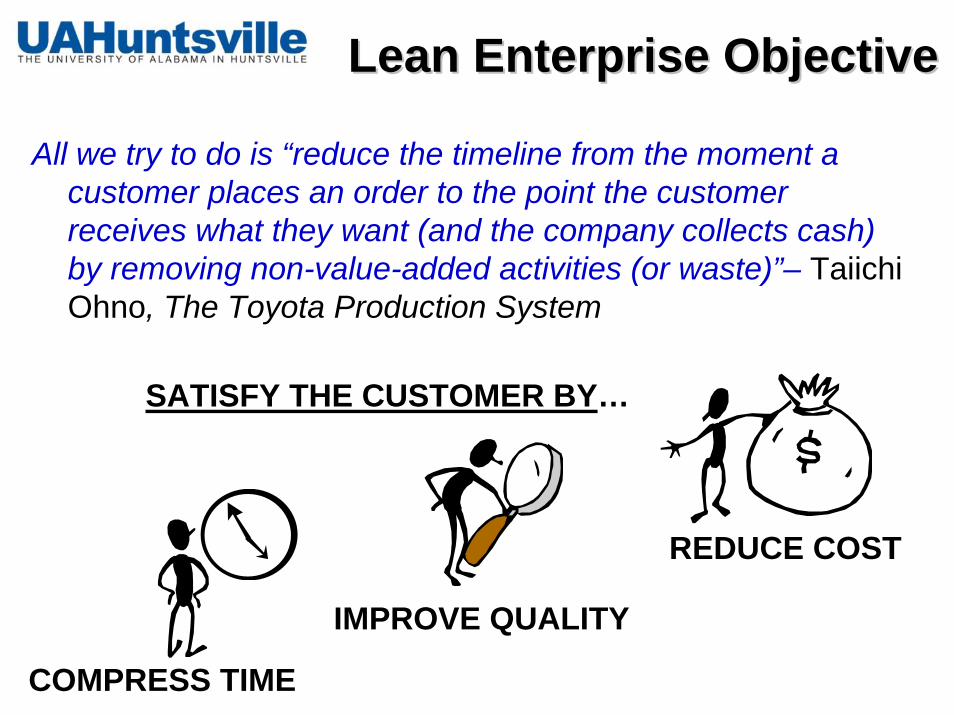
All we try to do is “reduce the timeline from the moment a customer places an order to the point the customer receives what they want (and the company collects cash) by removing non-value-added activities (or waste)”– Taiichi Ohno, The Toyota Production System
SATISFY THE CUSTOMER BY…
REDUCE COST
IMPROVE QUALITY
COMPRESS TIME
The Case for Port The Case for Port Improvement:Improvement:
The need for efficient travel and transfer of goods between overseas ships and domestic trucks, trains, and barges has accelerated due to:
– Increase in world population– Nations increasingly becoming more
industrialized– Heavier reliance on world trade
The Case for Port The Case for Port Improvement:Improvement:
The Data:Foreign trade accounts for 22% of the U.S. Gross Domestic Product95% of this trade is moved by ships (USDOT)
Trends:North American port volumes have increased by an average of 7% per year since 1990It is estimated that most major ports are already operating near capacity, and some reports are predicting port volumes to double by 2020
(Transportation Journal)
Why Lean at Ports?Why Lean at Ports?
To increase port capacity without significant investment in new resources, me must:
Flow material through at a faster rate– Unload more efficiently when it arrives– Manage material more efficiently while we store it– Load more efficiently when it departs
Why Lean at Ports?Why Lean at Ports?
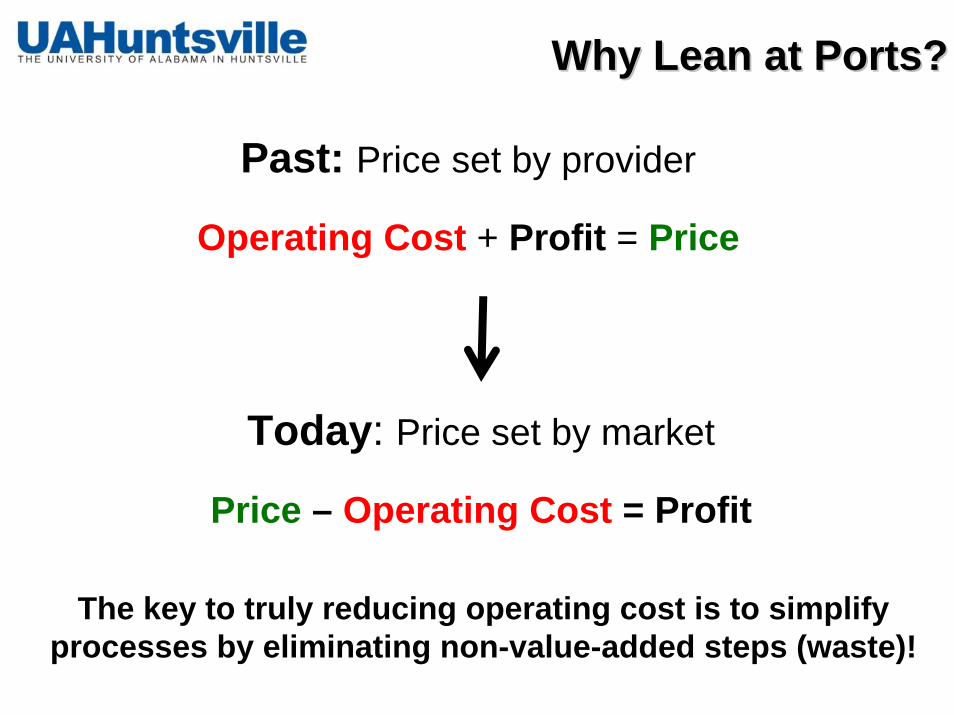
Past: Price set by provider
Operating Cost + Profit = Price
Today: Price set by market
Price – Operating Cost = Profit
The key to truly reducing operating cost is to simplify processes by eliminating non-value-added steps (waste)!
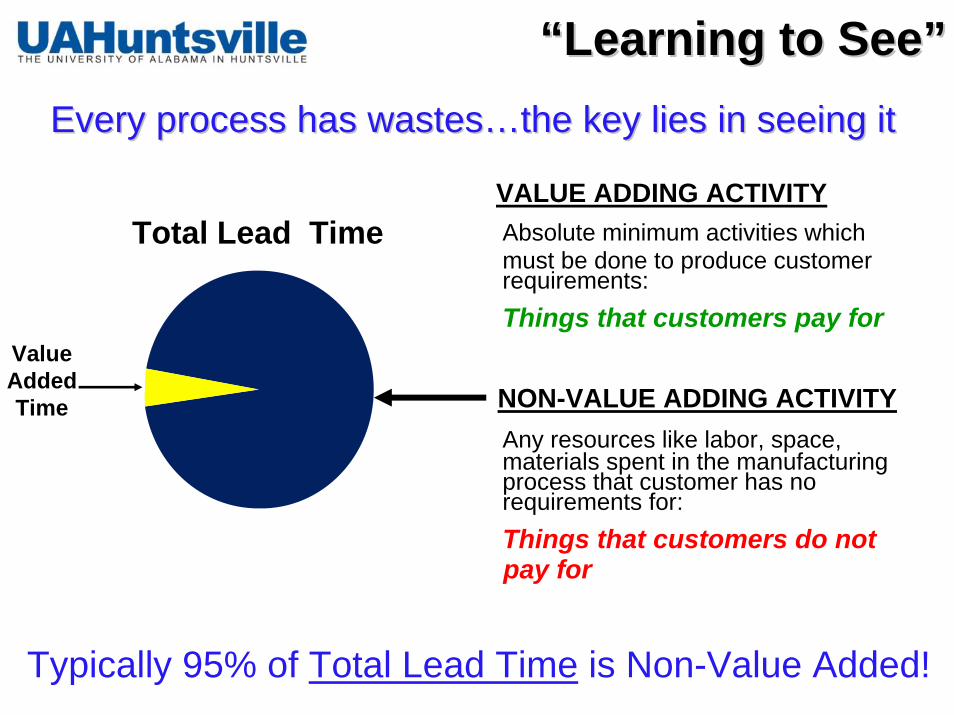
““Learning to SeeLearning to See””Every process has wastesEvery process has wastes……the key lies in seeing itthe key lies in seeing it
ValueAddedTime
Total Lead TimeVALUE ADDING ACTIVITYAbsolute minimum activities whichmust be done to produce customer requirements: Things that customers pay for
NON-VALUE ADDING ACTIVITYAny resources like labor, space, materials spent in the manufacturing process that customer has no requirements for:Things that customers do not pay for
Typically 95% of Total Lead Time is Non-Value Added!
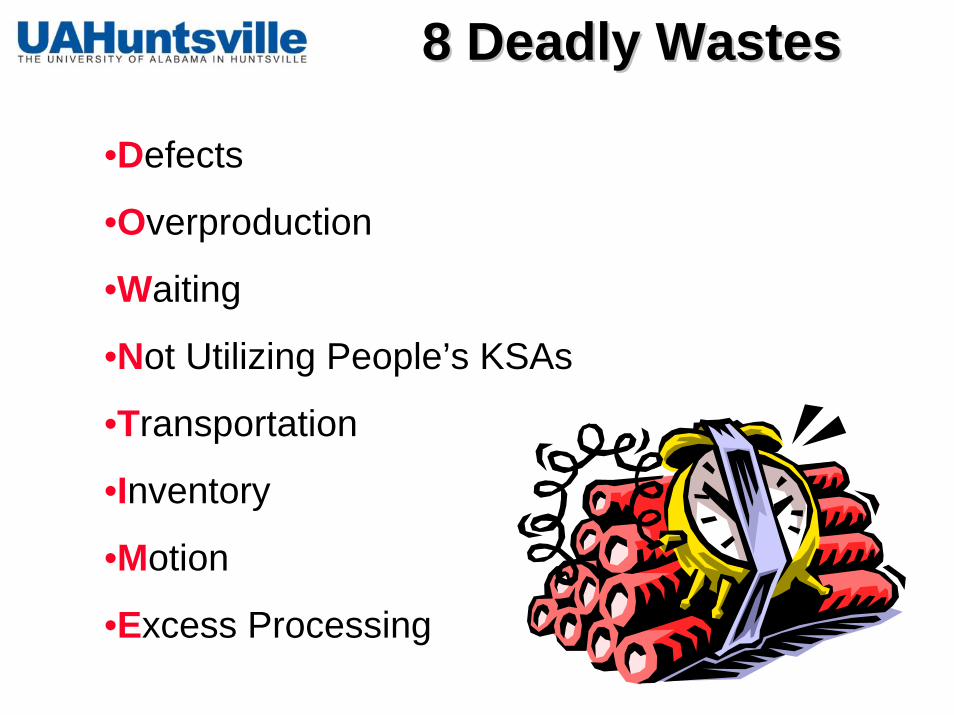
8 Deadly Wastes8 Deadly Wastes
•Defects
•Overproduction
•Waiting
•Not Utilizing People’s KSAs
•Transportation
•Inventory
•Motion
•Excess Processing
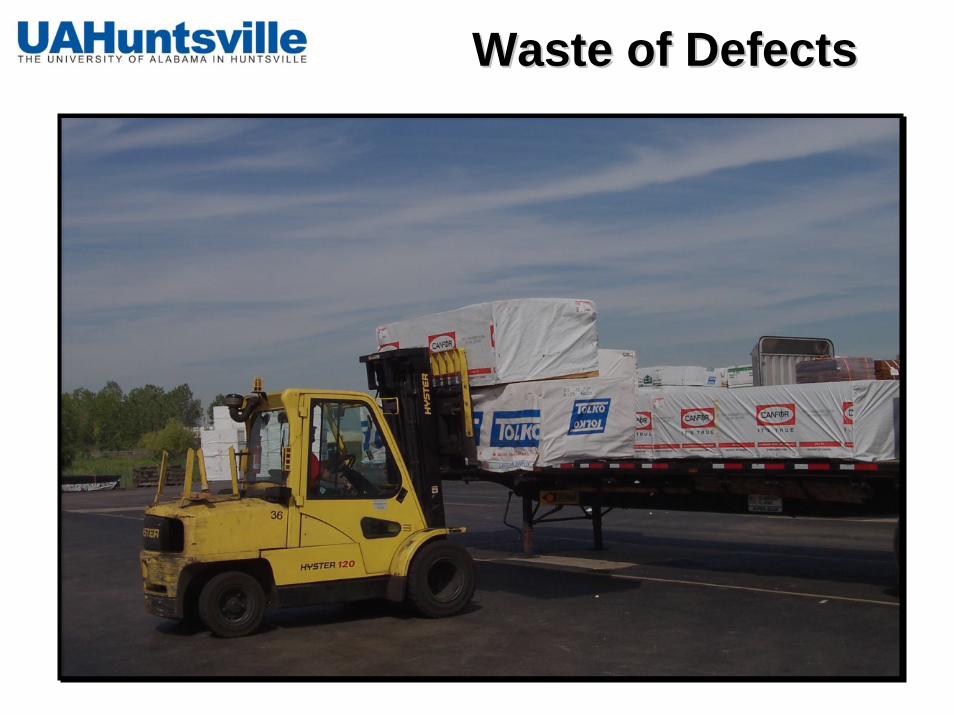
Waste of DefectsWaste of Defects
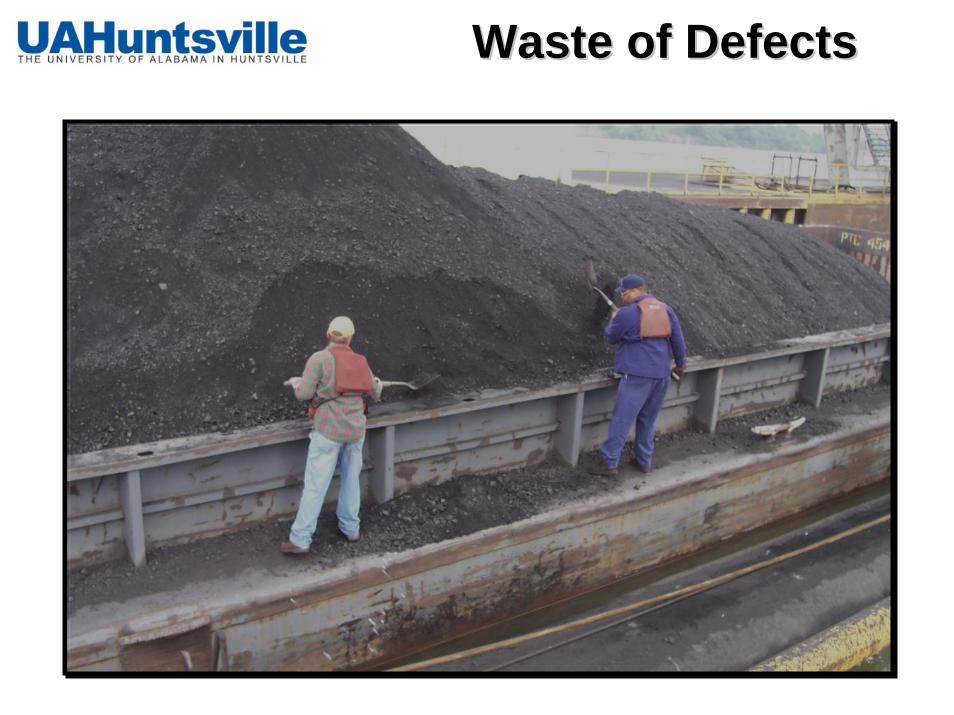
Waste of DefectsWaste of Defects
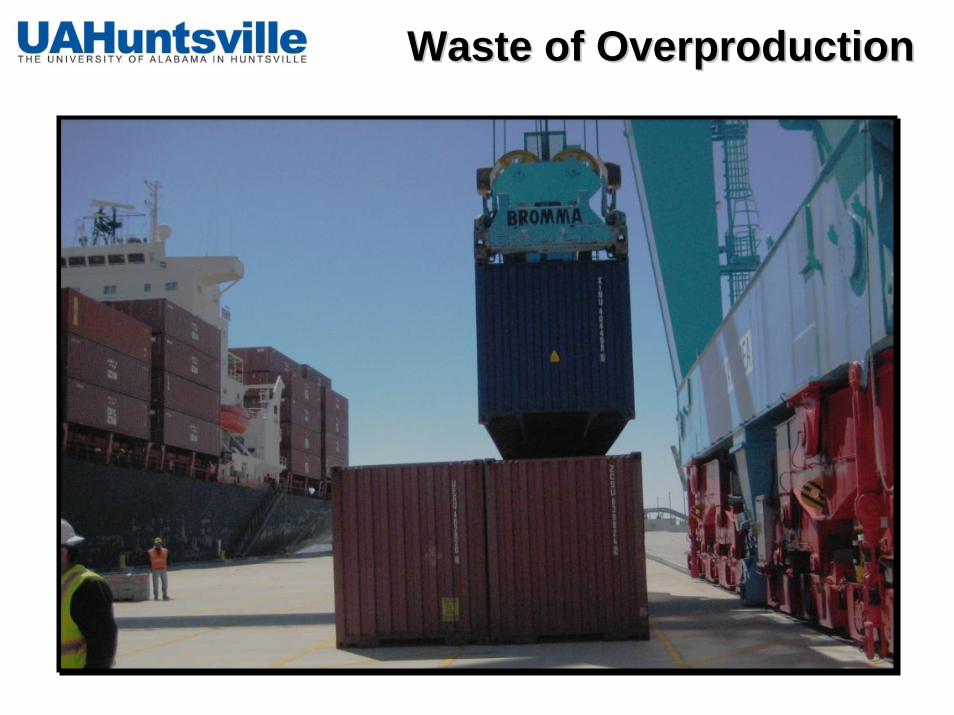
Waste of OverproductionWaste of Overproduction
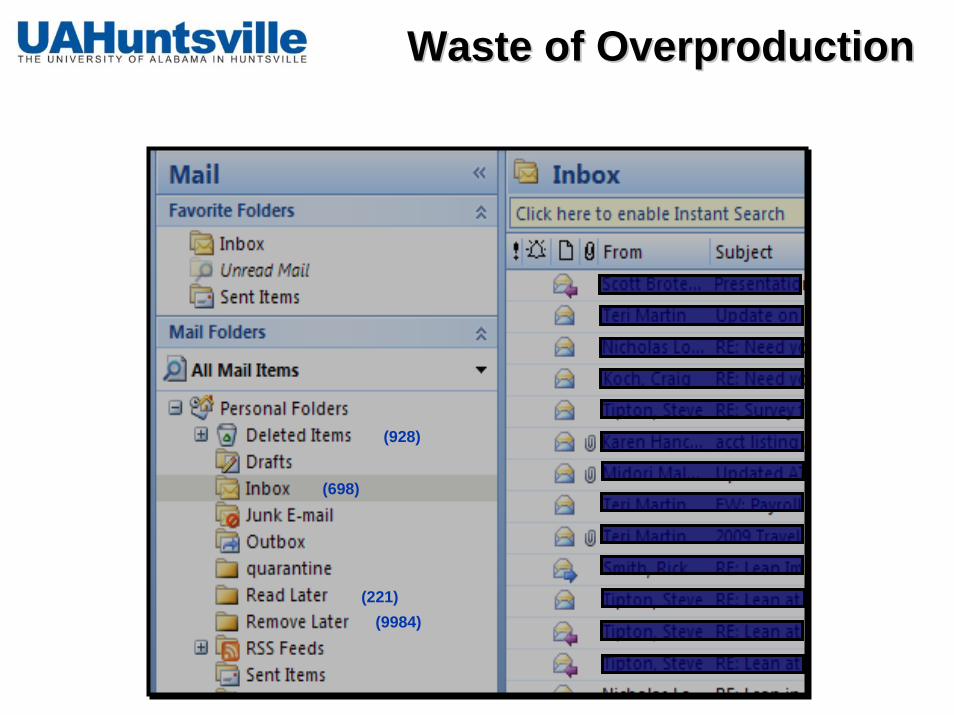
Waste of OverproductionWaste of Overproduction
(698)
(221)(9984)
(928)
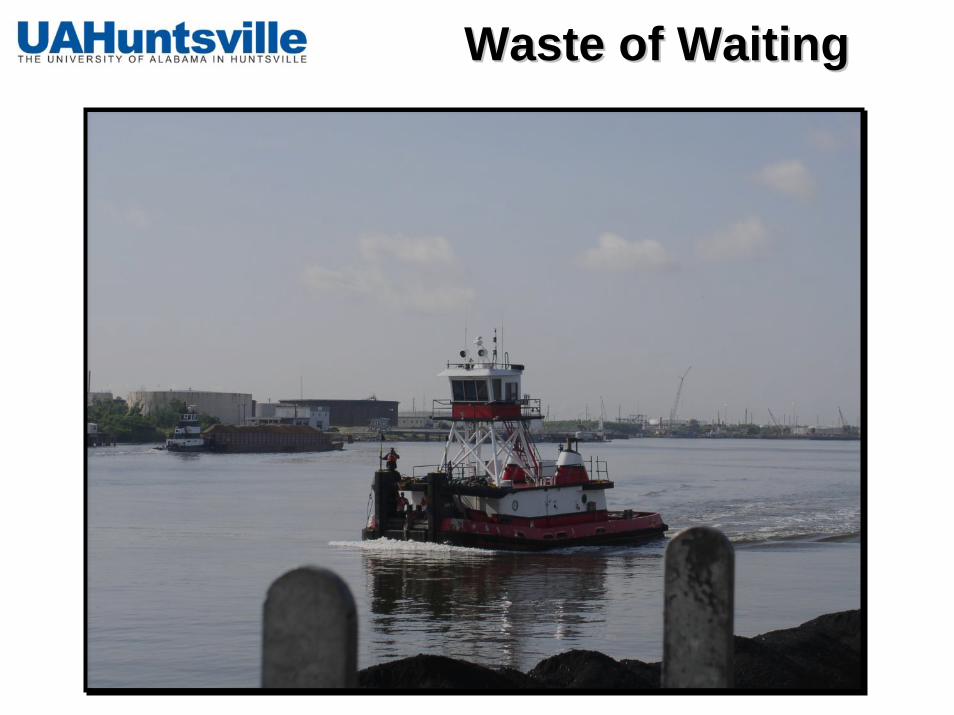
Waste of WaitingWaste of Waiting
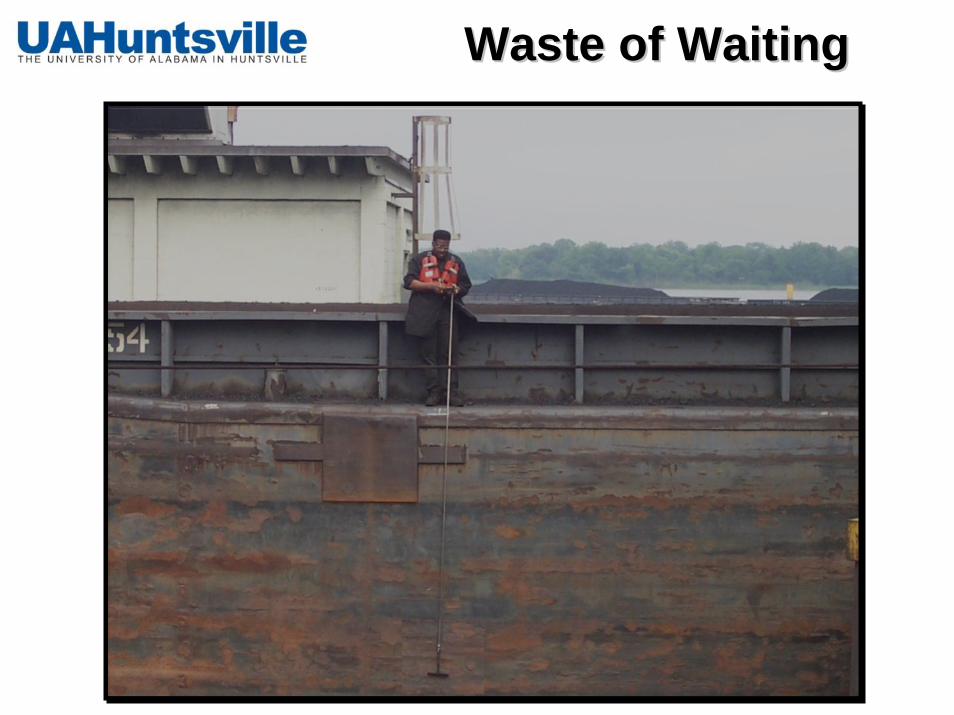
Waste of WaitingWaste of Waiting
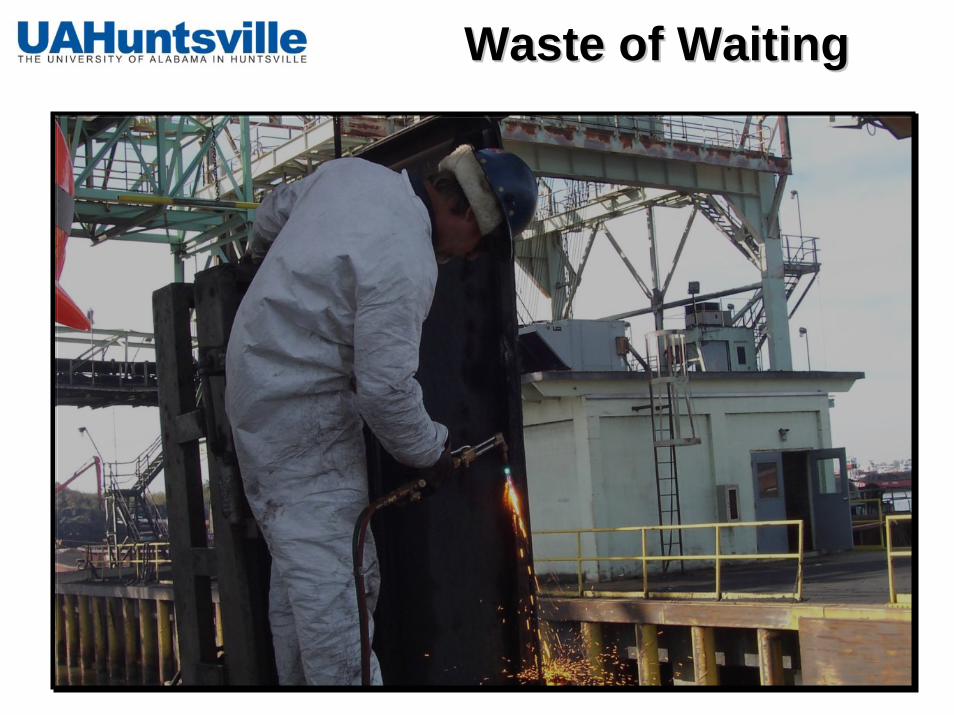
Waste of WaitingWaste of Waiting
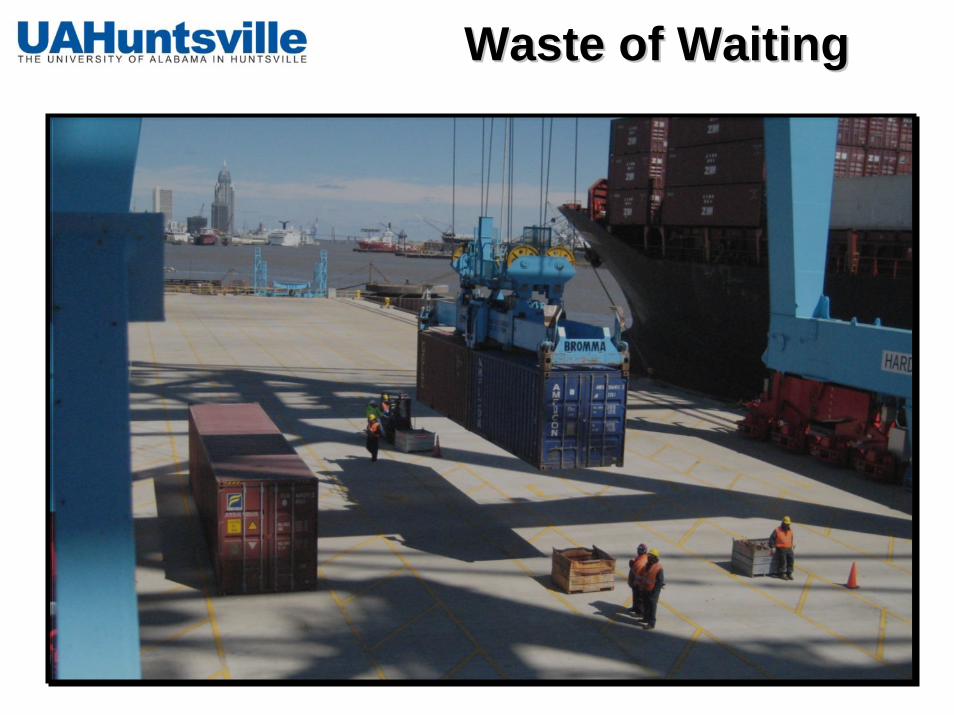
Waste of WaitingWaste of Waiting
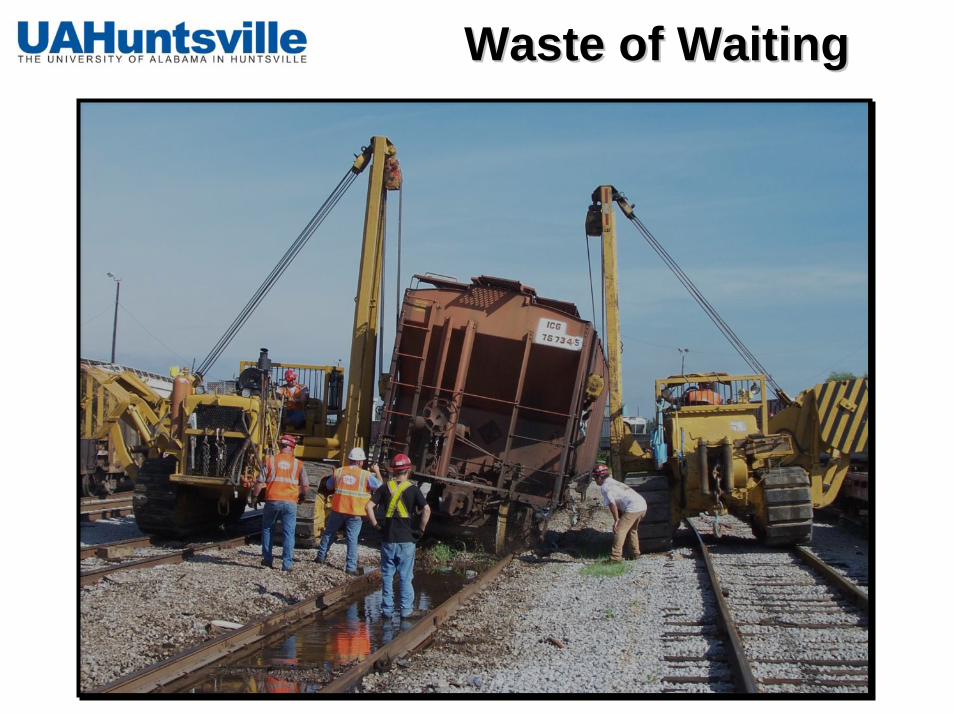
Waste of WaitingWaste of Waiting
Waste of Not Using Waste of Not Using PeoplePeople’’s KSAss KSAs
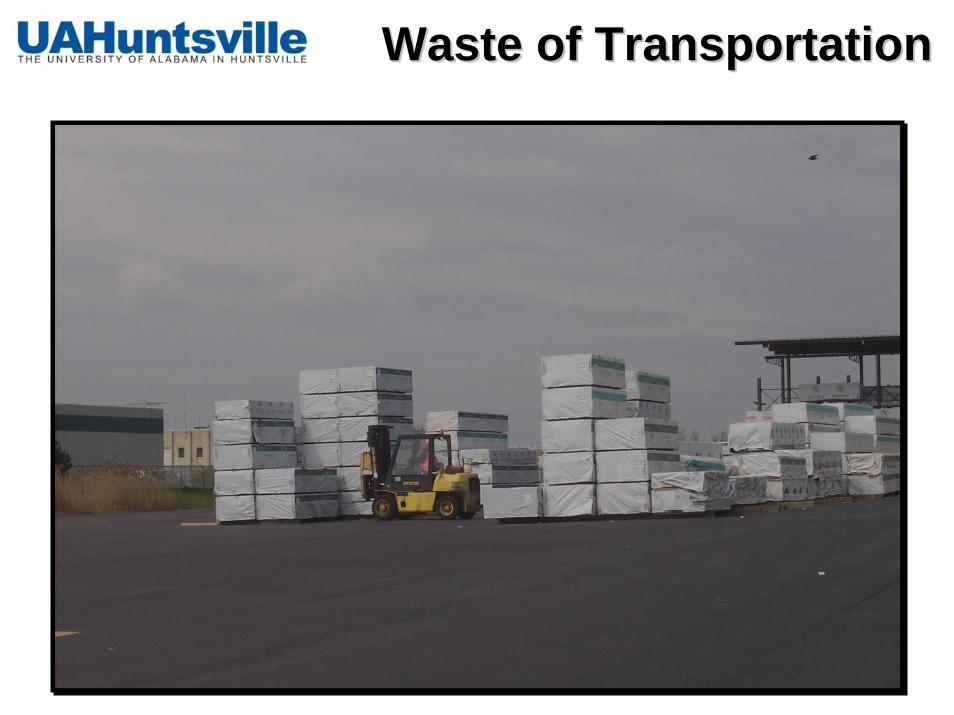
Waste of TransportationWaste of Transportation
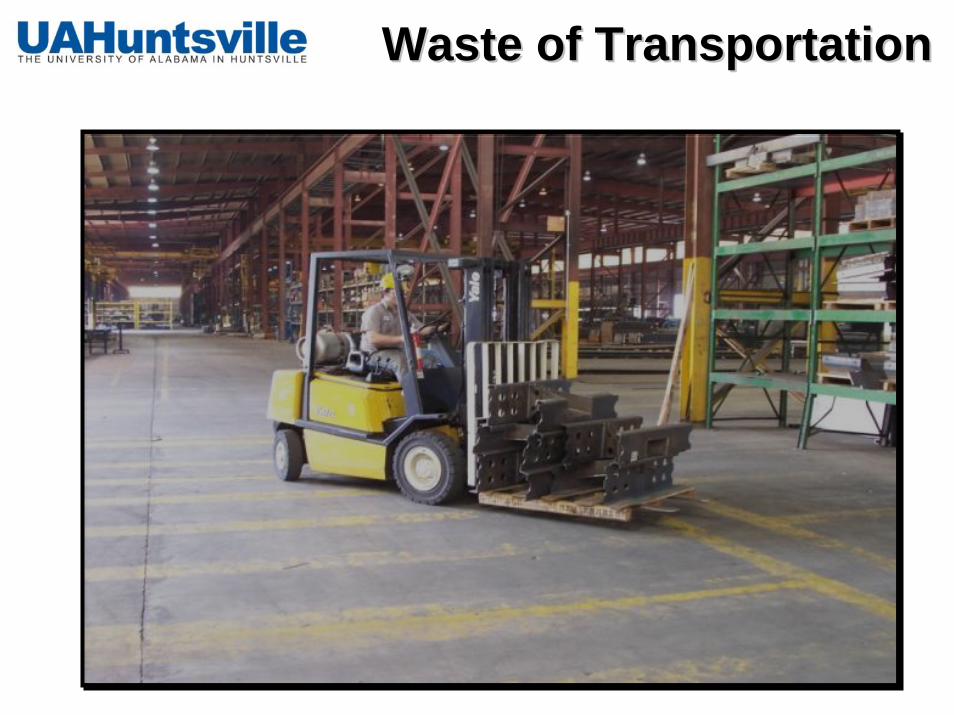
Waste of TransportationWaste of Transportation
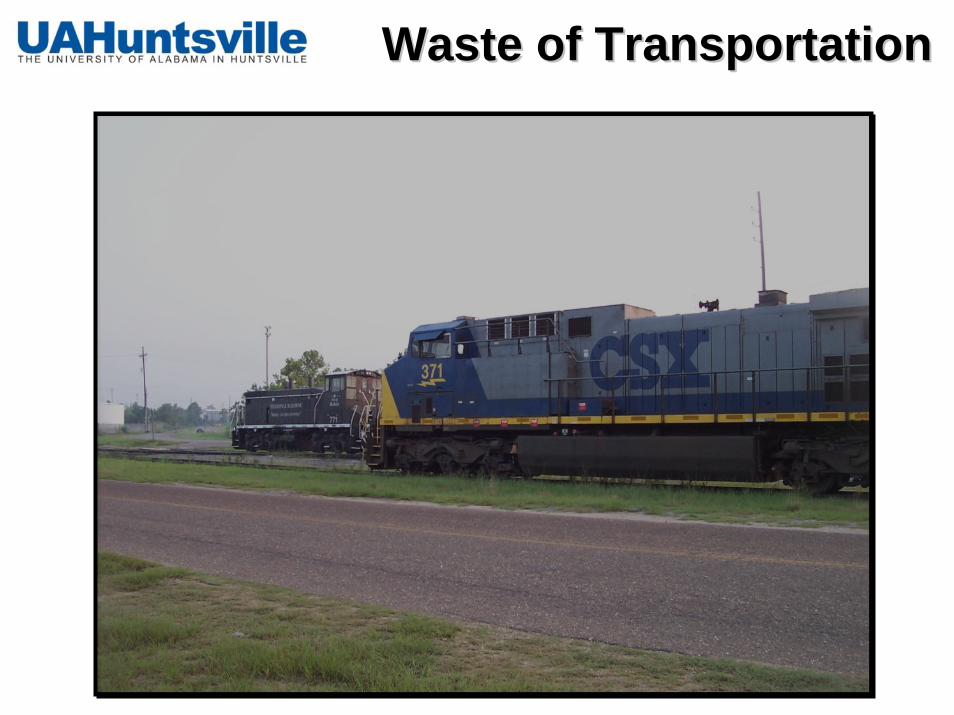
Waste of TransportationWaste of Transportation
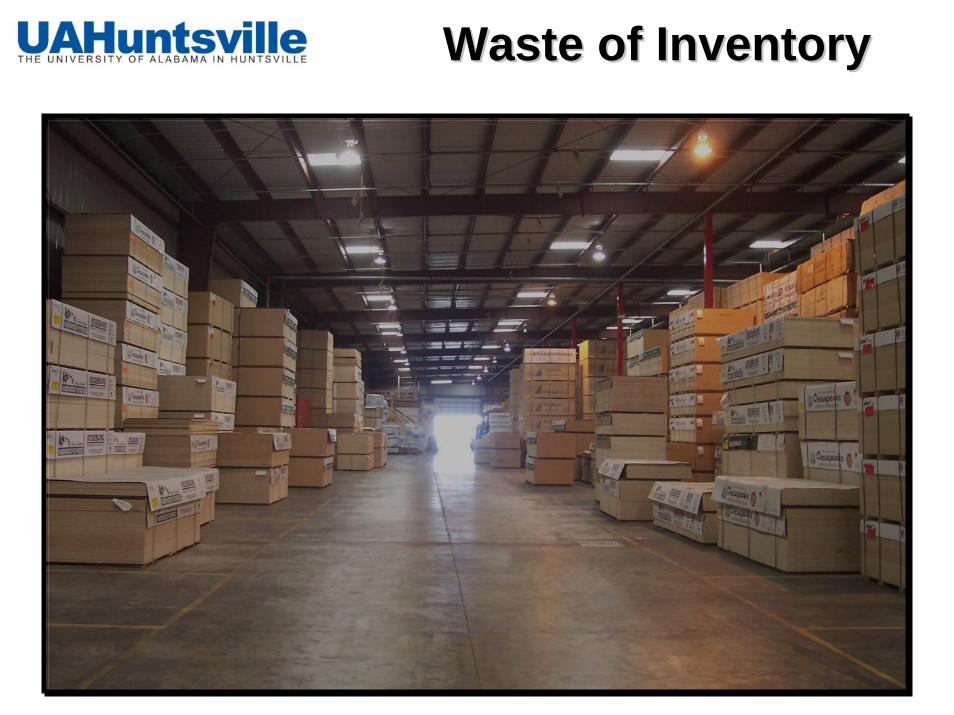
Waste of InventoryWaste of Inventory
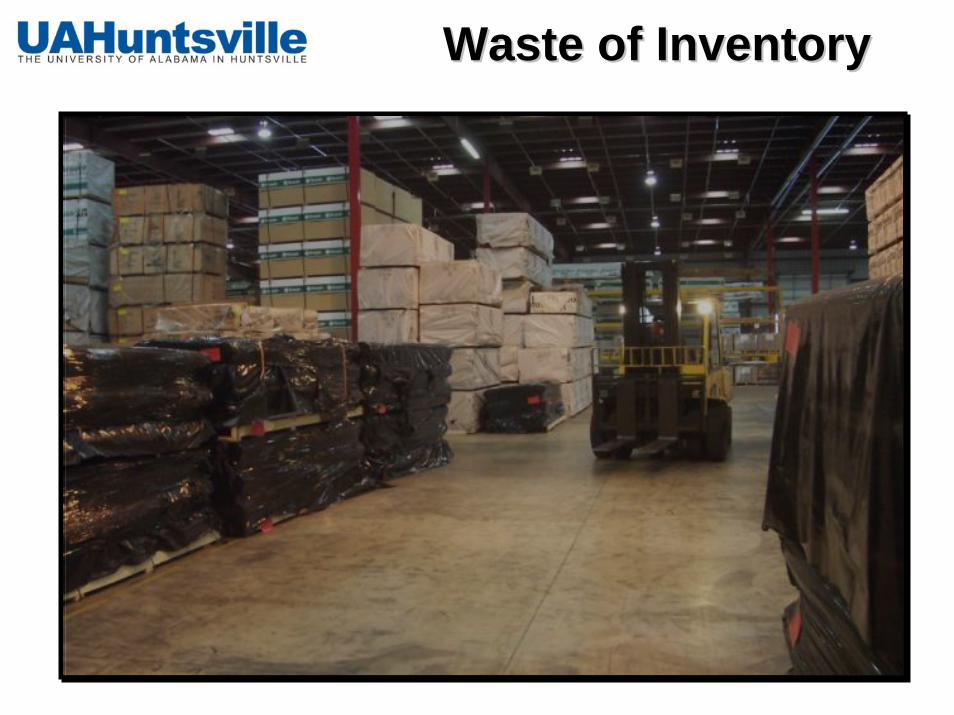
Waste of InventoryWaste of Inventory
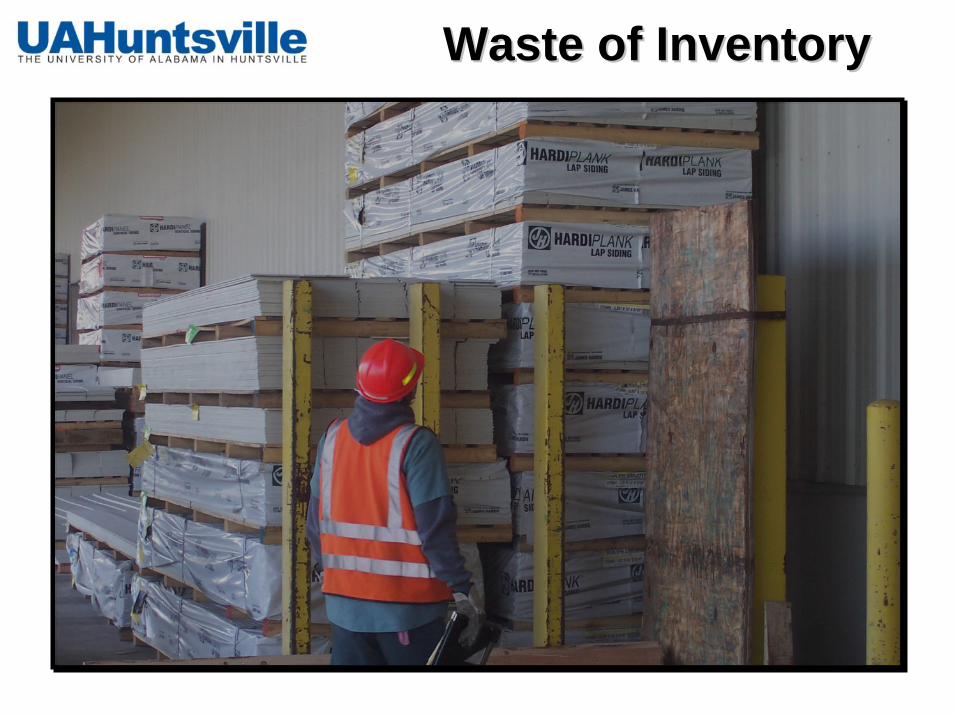
Waste of InventoryWaste of Inventory
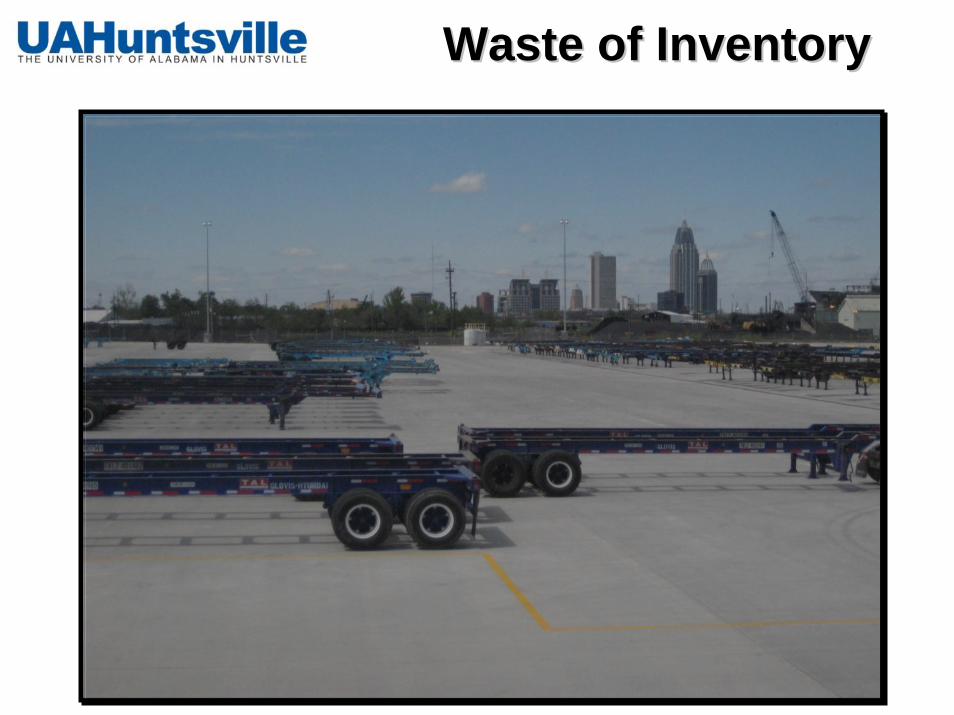
Waste of InventoryWaste of Inventory

Waste of InventoryWaste of Inventory
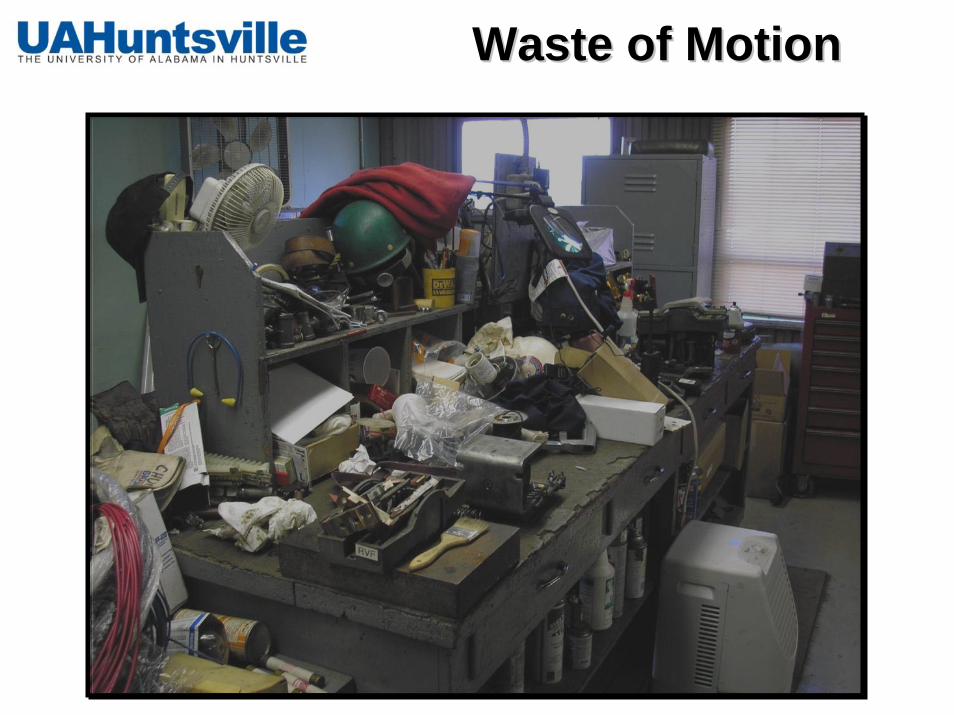
Waste of MotionWaste of Motion
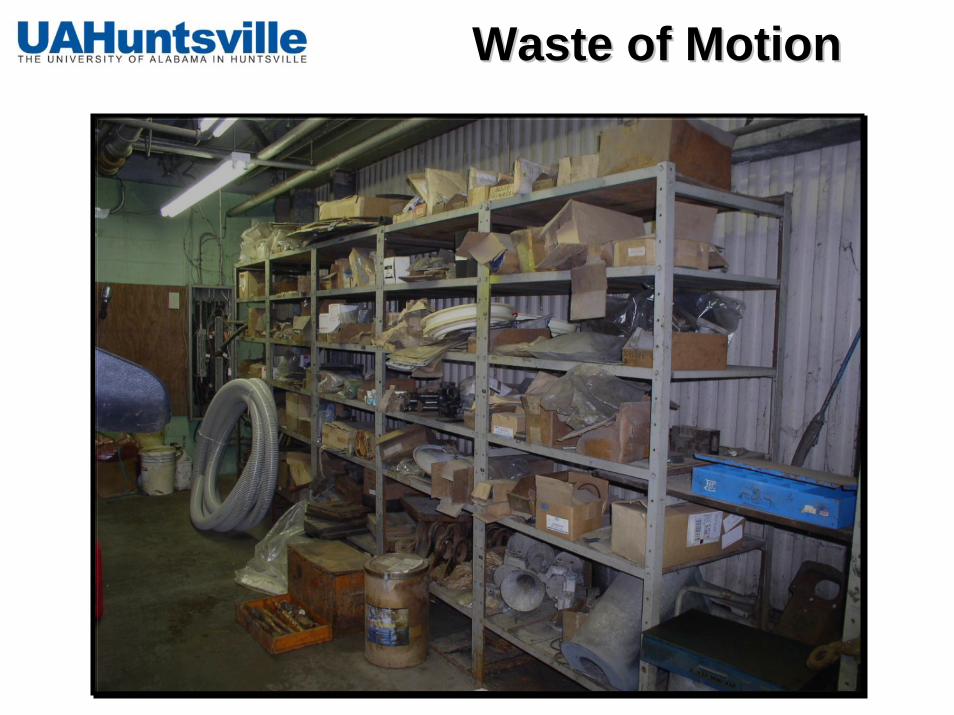
Waste of MotionWaste of Motion
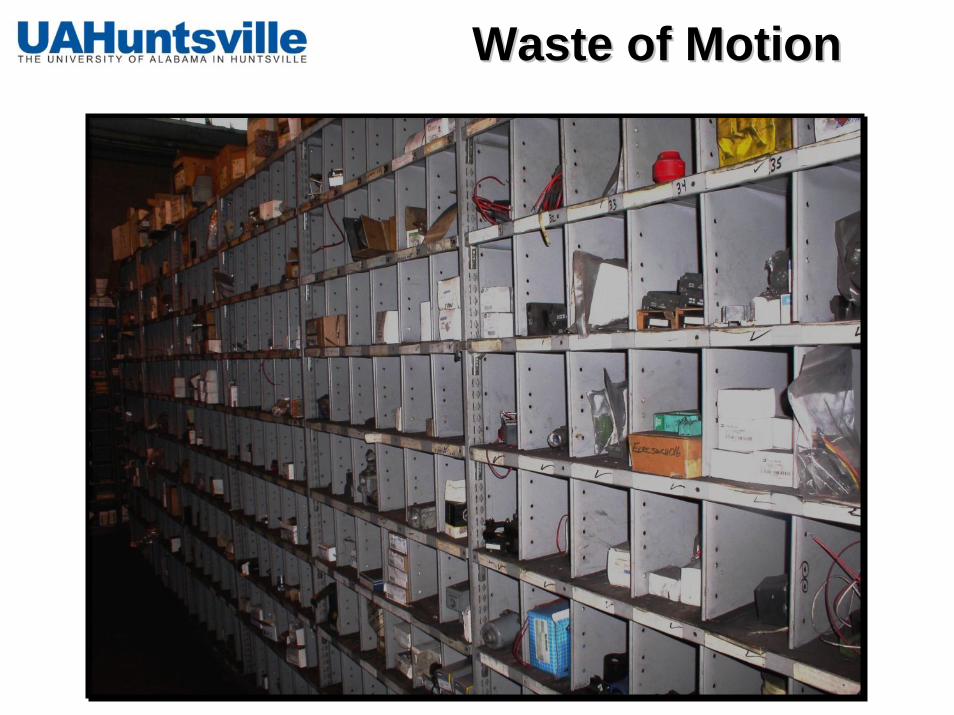
Waste of MotionWaste of Motion
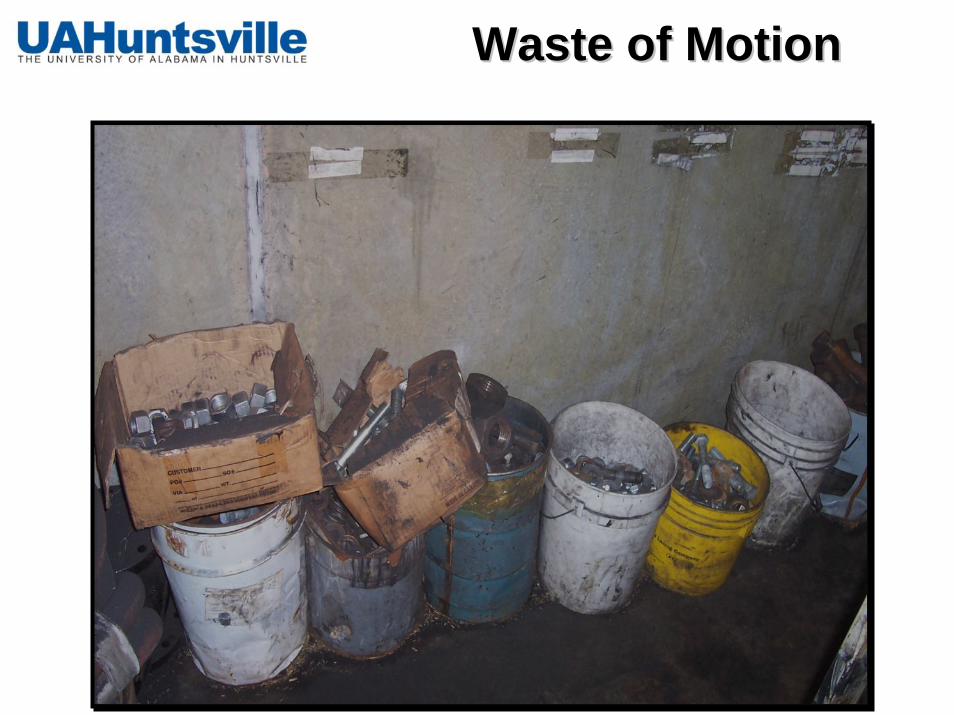
Waste of MotionWaste of Motion
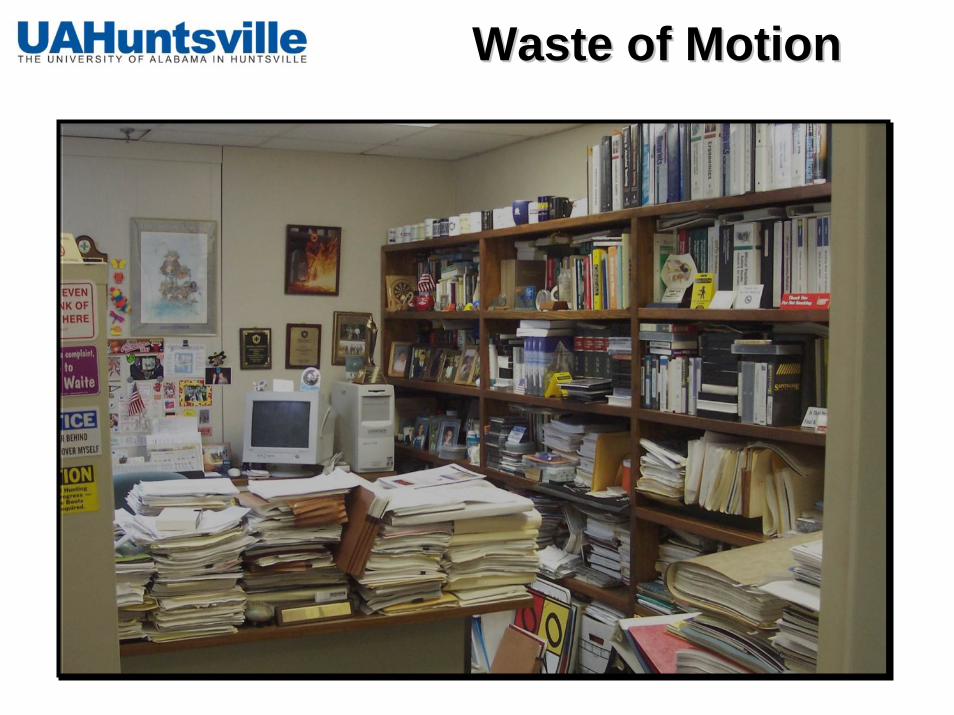
Waste of MotionWaste of Motion
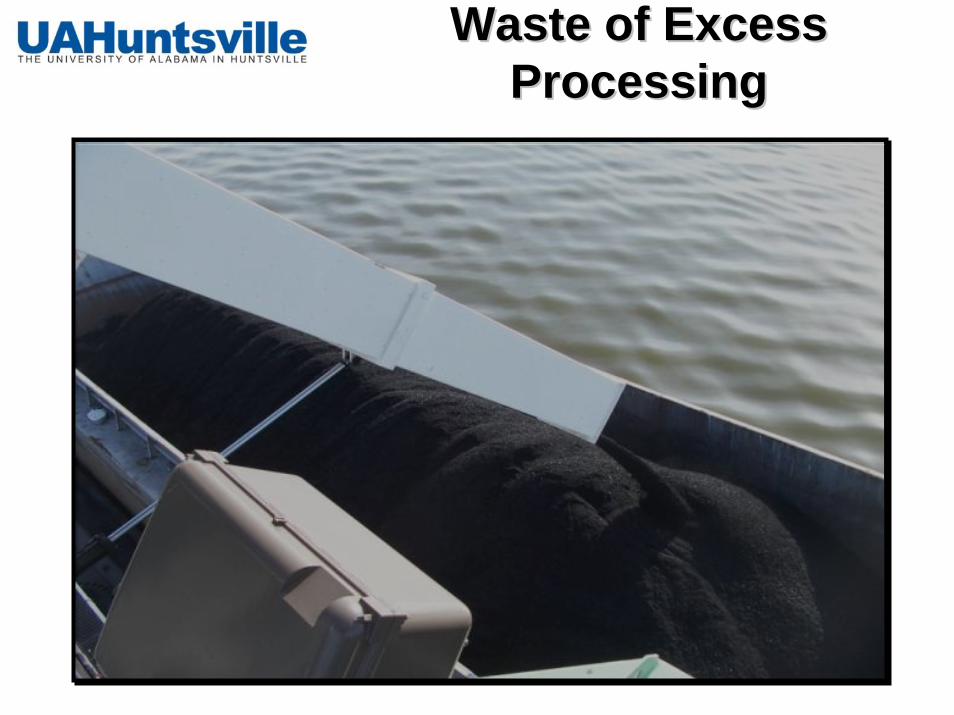
Waste of Excess Waste of Excess ProcessingProcessing
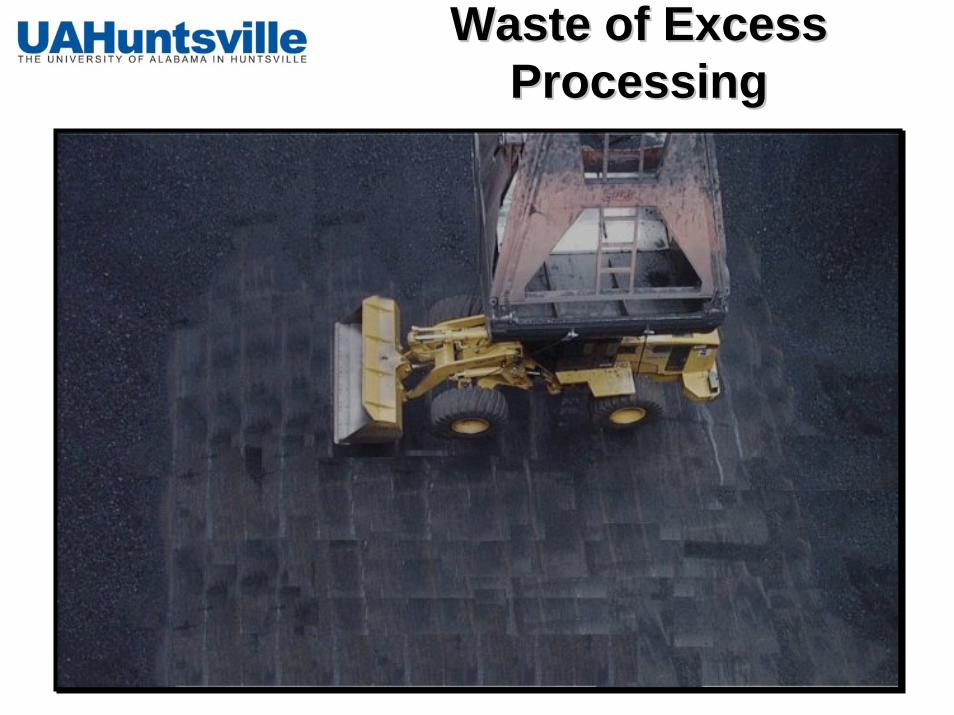
Waste of Excess Waste of Excess ProcessingProcessing
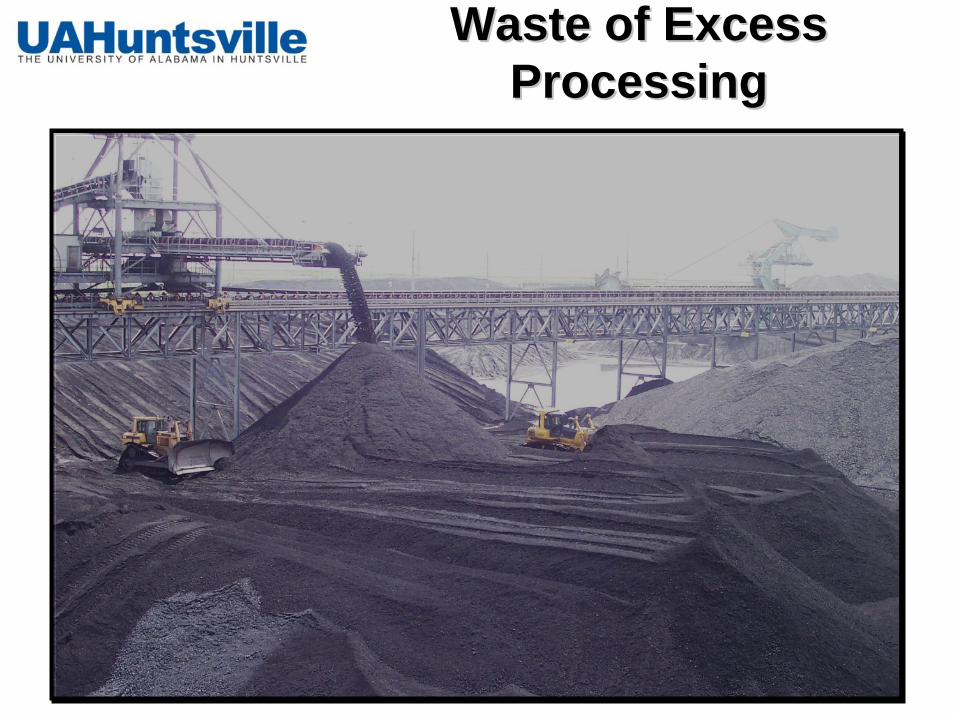
Waste of Excess Waste of Excess ProcessingProcessing
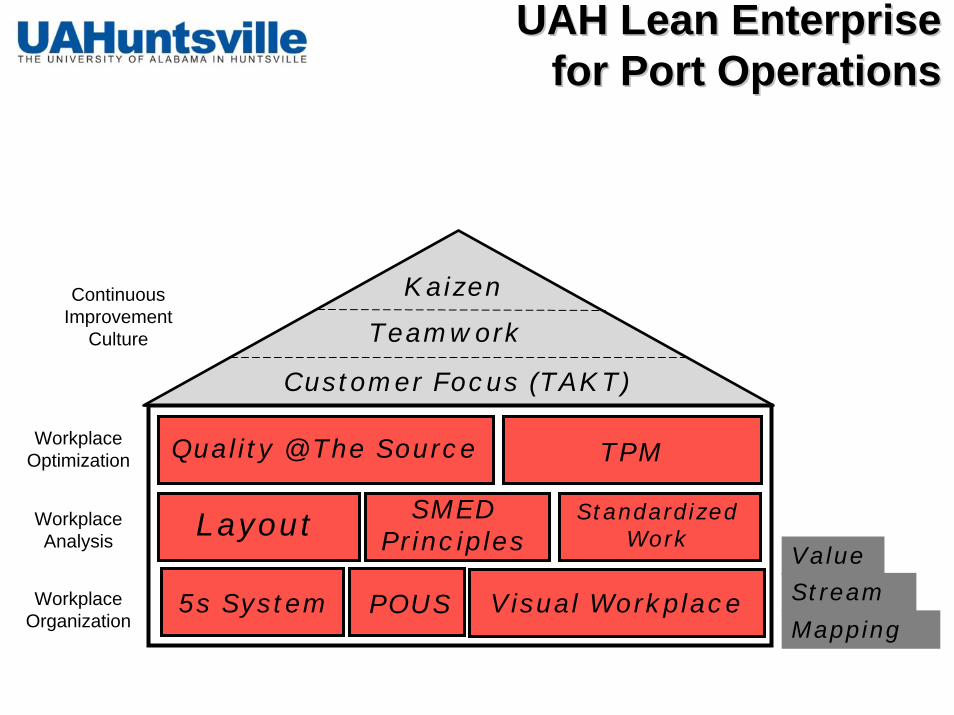
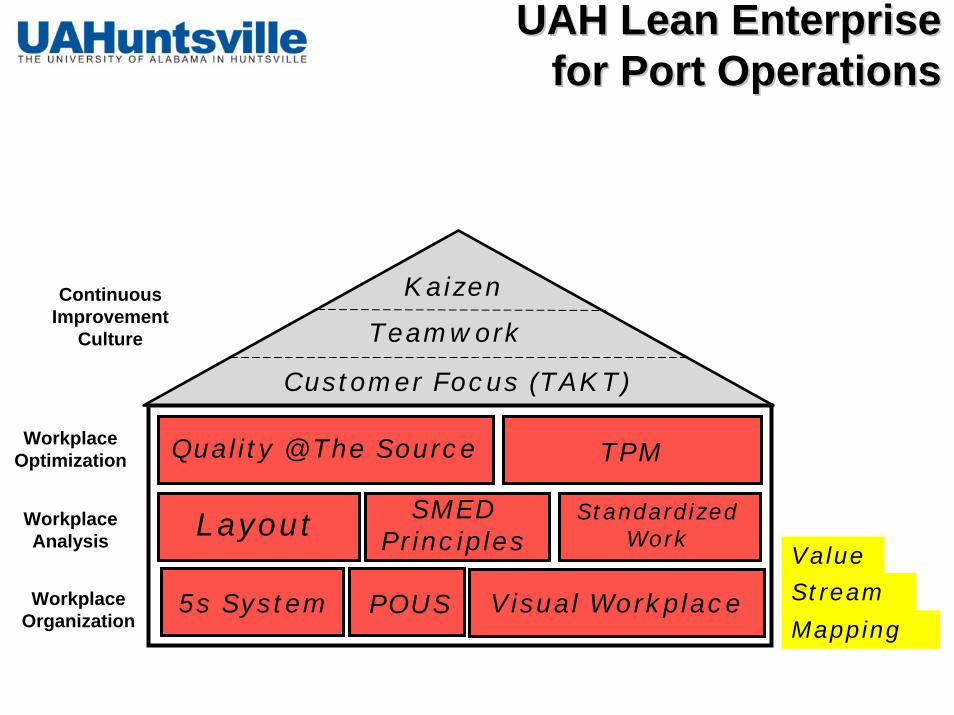
UAH Lean Enterprise UAH Lean Enterprise for Port Operationsfor Port Operations
Workplace Organization
Workplace Analysis
Workplace Optimization
Continuous Improvement
Culture
Kaizen
5s System Visual Workplace
Standardized WorkLayout
POUS
Quality @ The Source
Teamwork
TPM
Mapping
Stream
Value
SMED Principles
Customer Focus (TAKT)
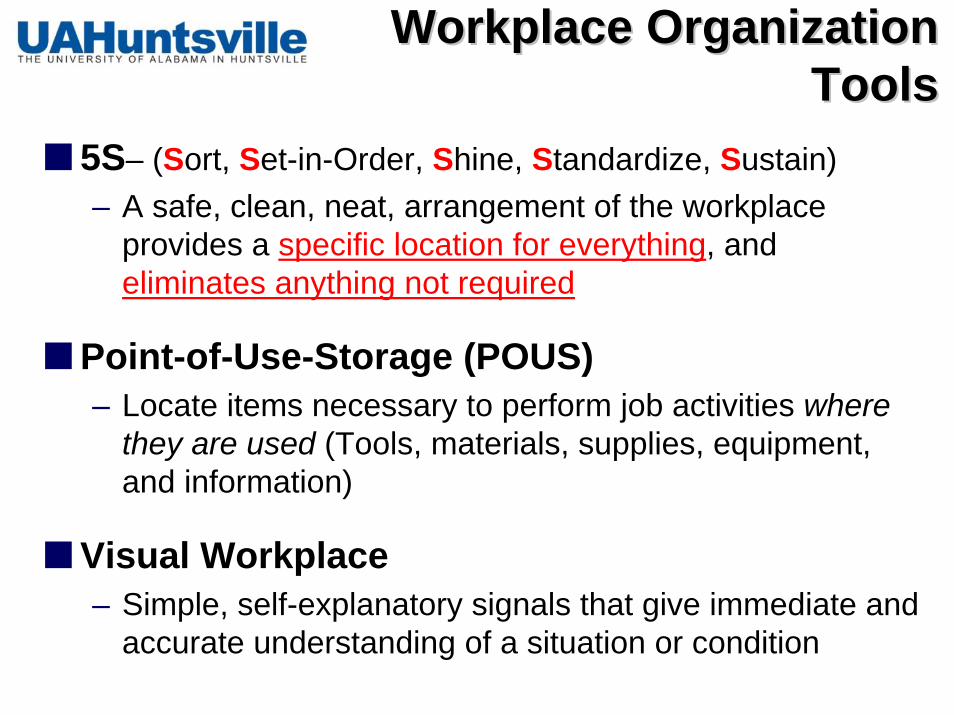
Workplace Organization Workplace Organization ToolsTools
5S– (Sort, Set-in-Order, Shine, Standardize, Sustain)– A safe, clean, neat, arrangement of the workplace
provides a specific location for everything, and eliminates anything not required
Point-of-Use-Storage (POUS)– Locate items necessary to perform job activities where
they are used (Tools, materials, supplies, equipment, and information)
Visual Workplace– Simple, self-explanatory signals that give immediate and
accurate understanding of a situation or condition
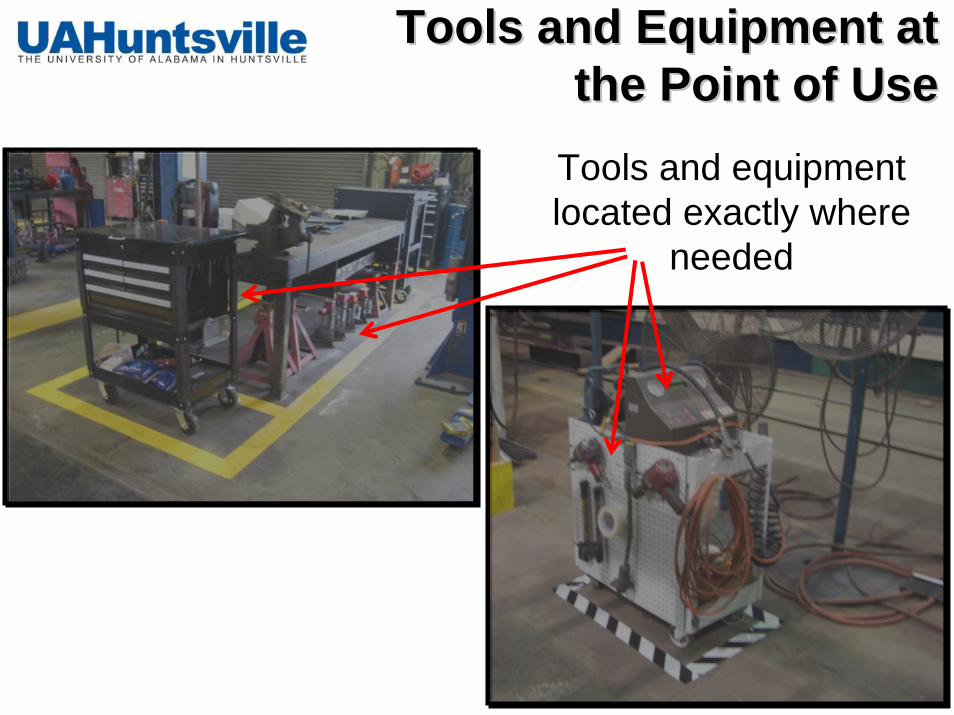
Tools and Equipment at Tools and Equipment at the Point of Usethe Point of Use
Tools and equipment located exactly where
needed
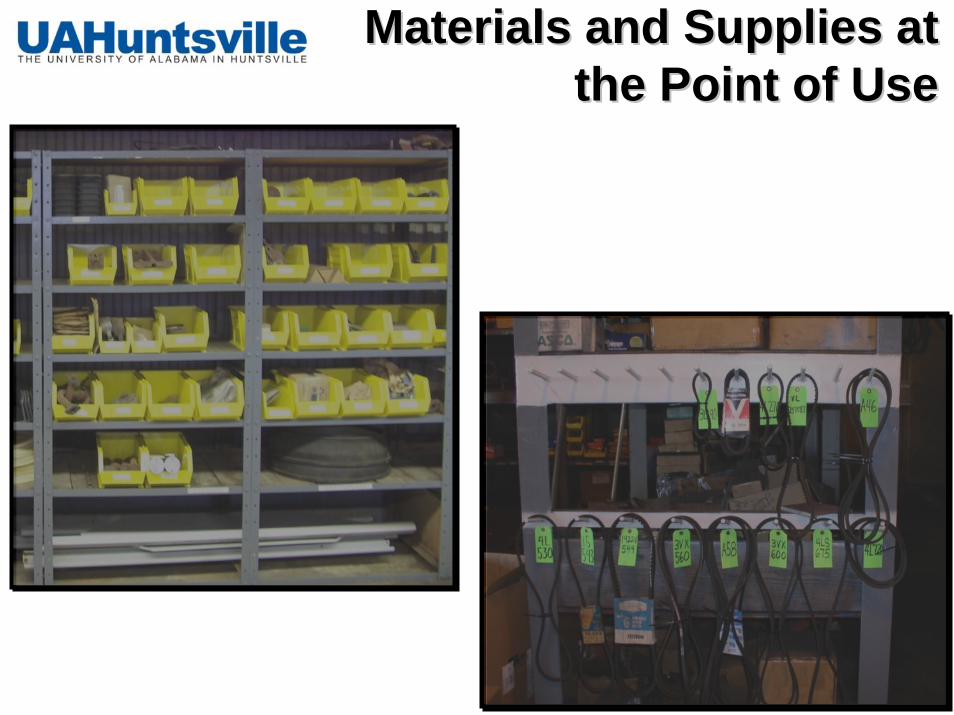
Materials and Supplies at Materials and Supplies at the Point of Usethe Point of Use
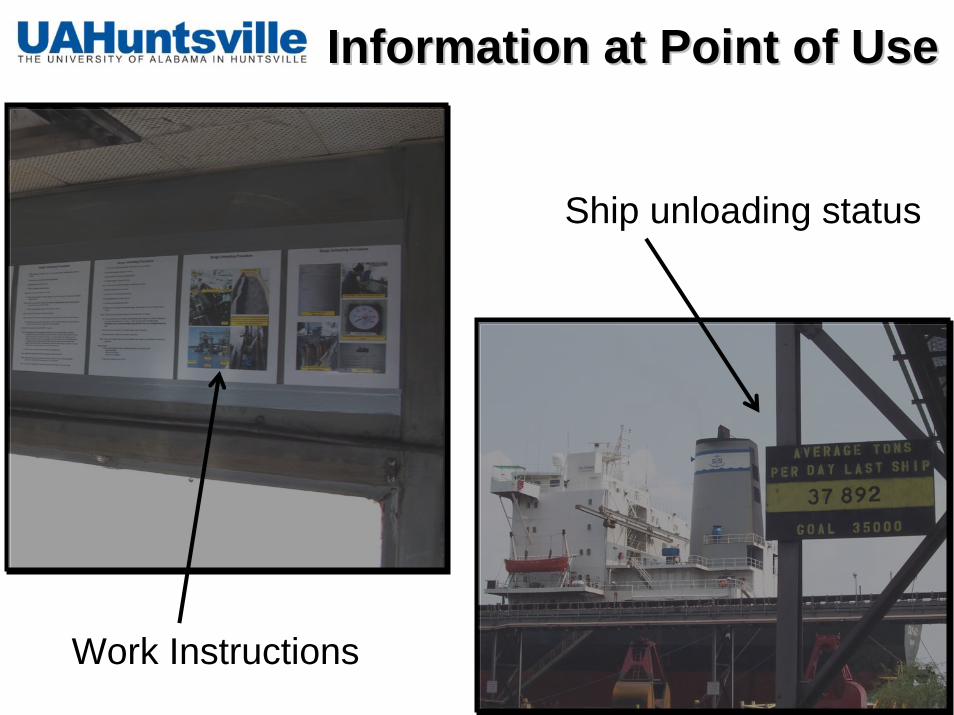
Information at Point of UseInformation at Point of Use
Ship unloading status
Work Instructions

Visual IdentificationVisual Identification
Product Identification
Equipment Identification
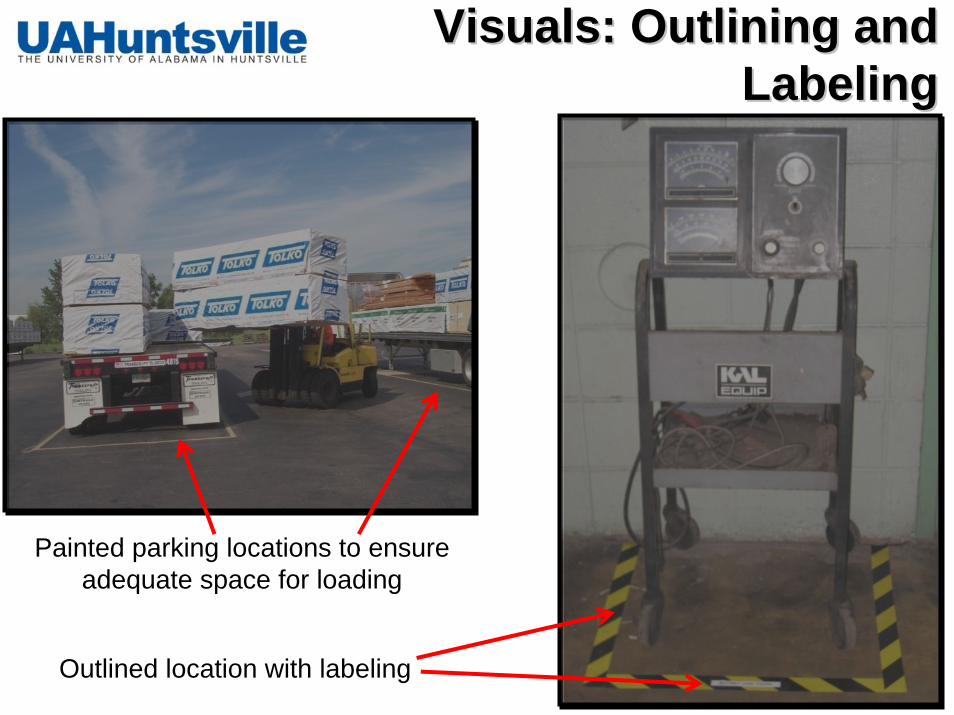
Visuals: Outlining and Visuals: Outlining and LabelingLabeling
Painted parking locations to ensure adequate space for loading
Outlined location with labeling
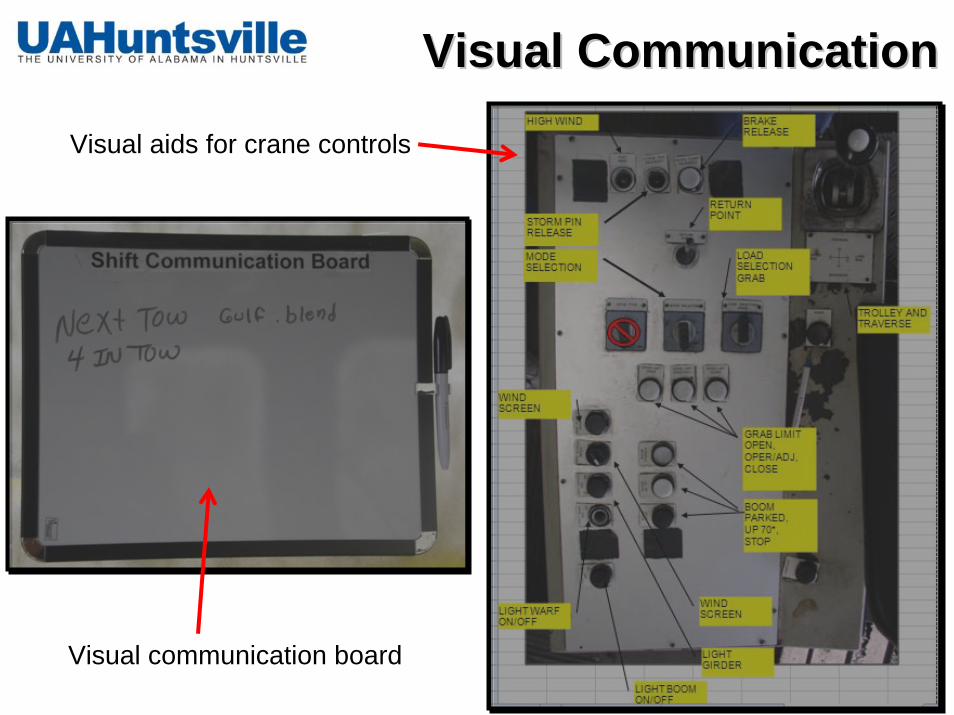
Visual CommunicationVisual Communication
Visual aids for crane controls
Visual communication board
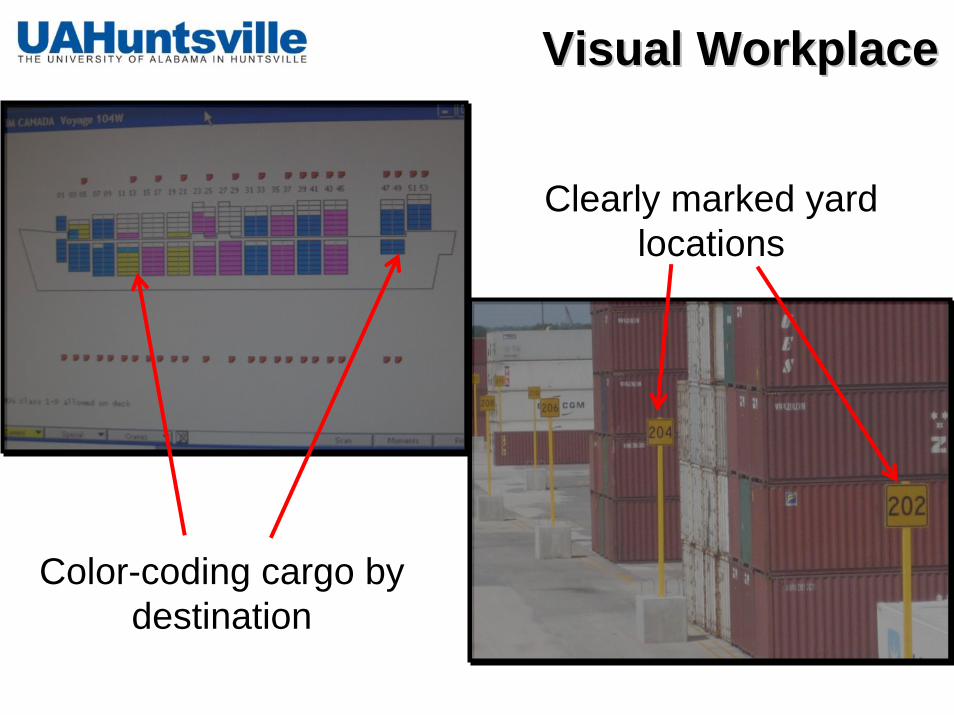
Visual WorkplaceVisual Workplace
Color-coding cargo by destination
Clearly marked yard locations
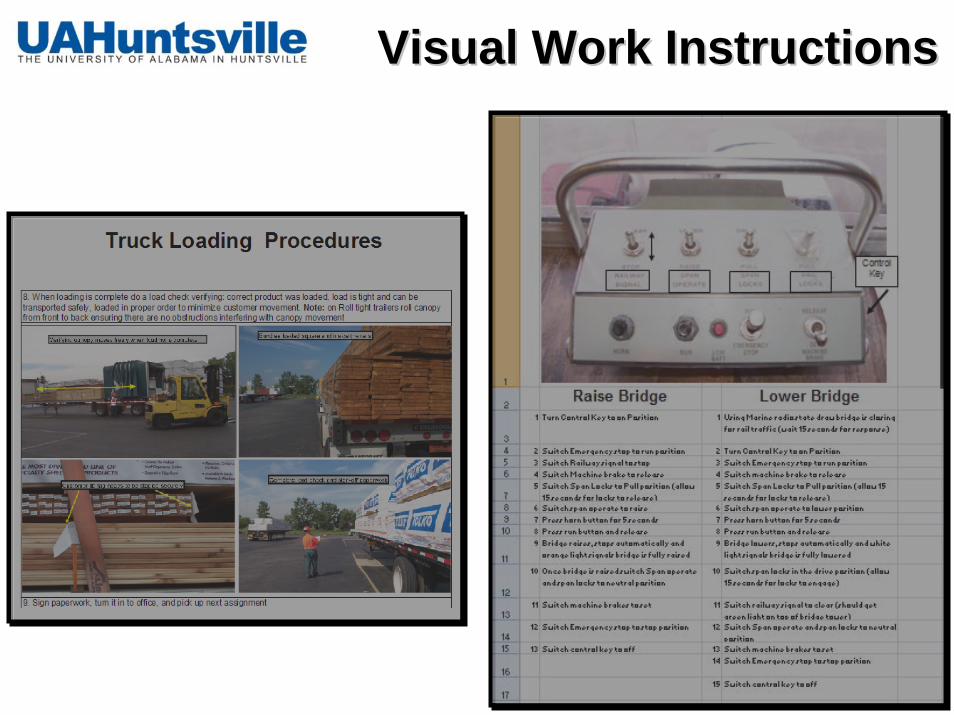
Visual Work InstructionsVisual Work Instructions
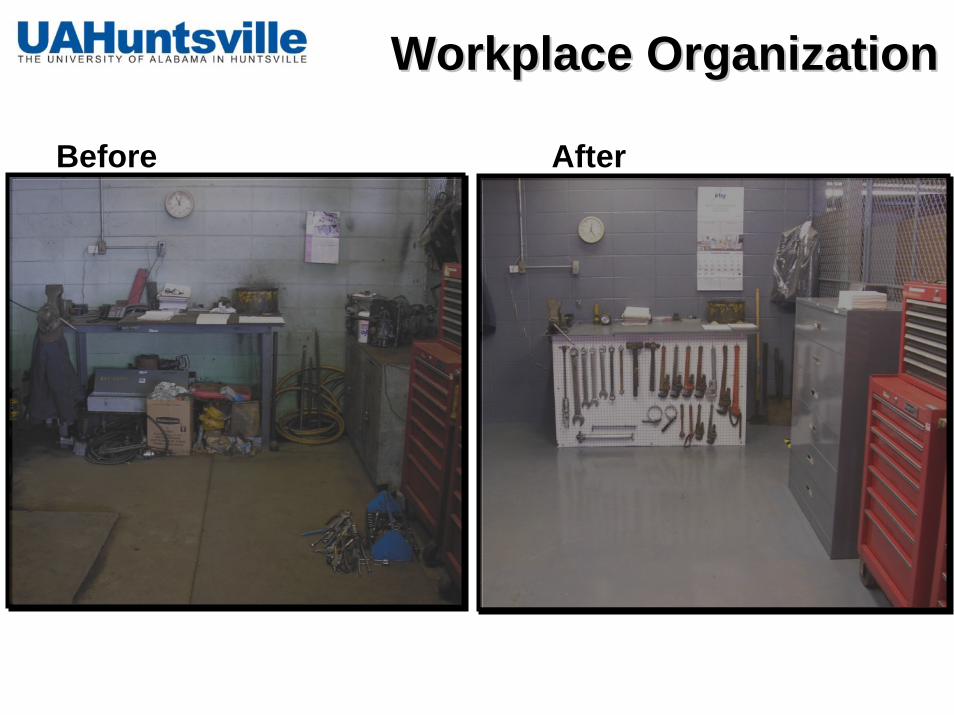
Workplace OrganizationWorkplace Organization
Before After
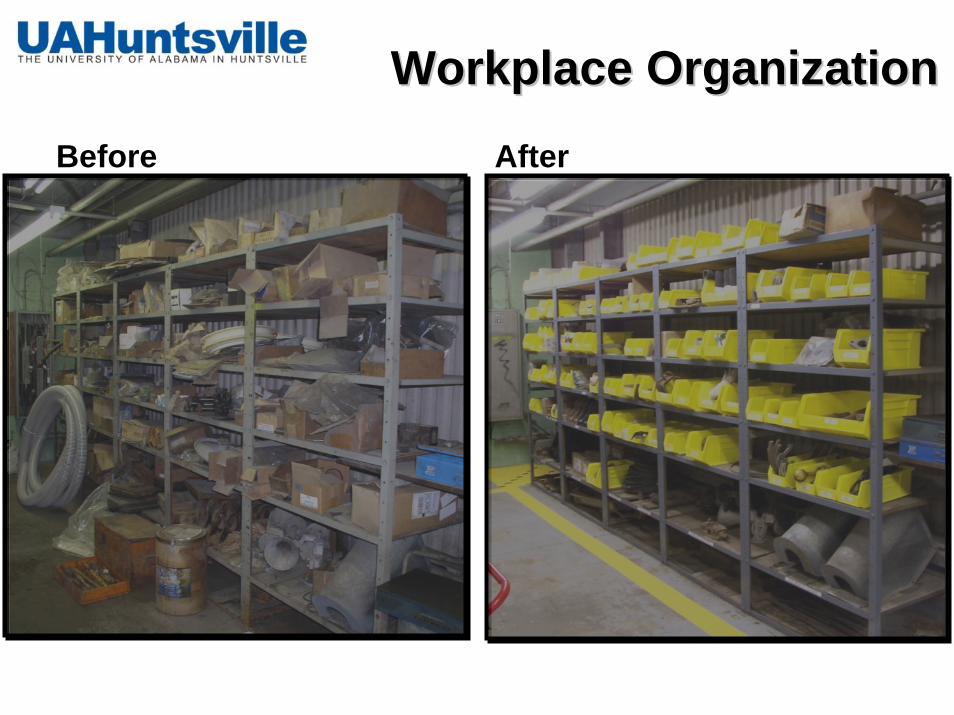
Workplace OrganizationWorkplace Organization
Before After
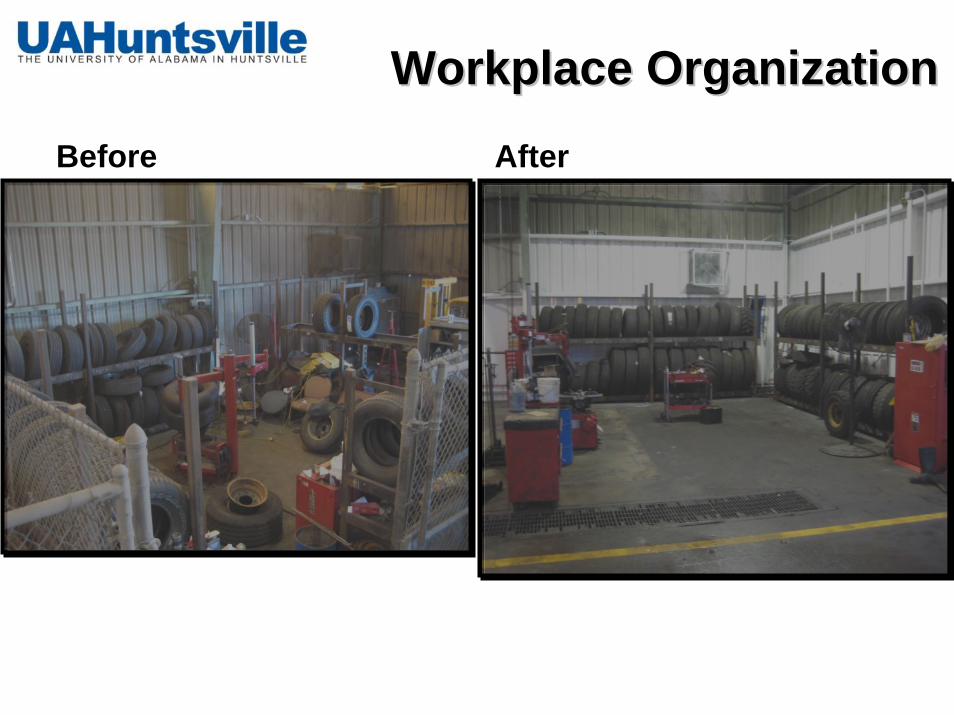
Workplace OrganizationWorkplace Organization
Before After
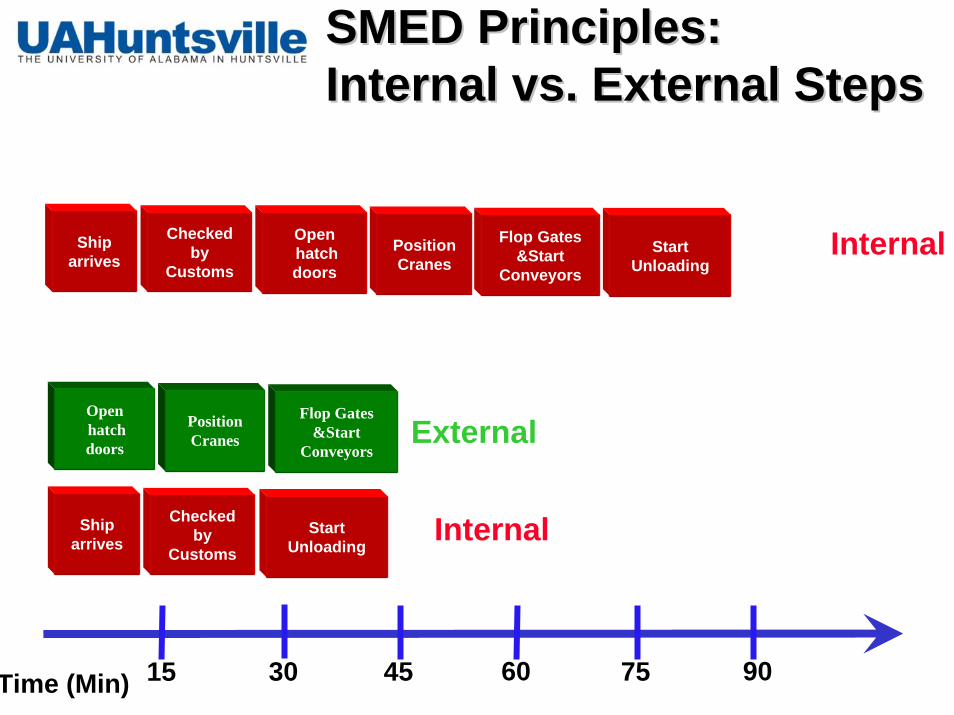
SMED Principles: SMED Principles: Internal vs. External StepsInternal vs. External Steps
Shiparrives
Checked by
CustomsPosition Cranes
Openhatch doors
StartUnloading
Flop Gates &Start
ConveyorsInternal
Flop Gates &Start
Conveyors
Position Cranes
Openhatch doors
External
Shiparrives
Checked by
CustomsStart
UnloadingInternal
15 30 45 60 75 90Time (Min)
Standardized WorkStandardized Work
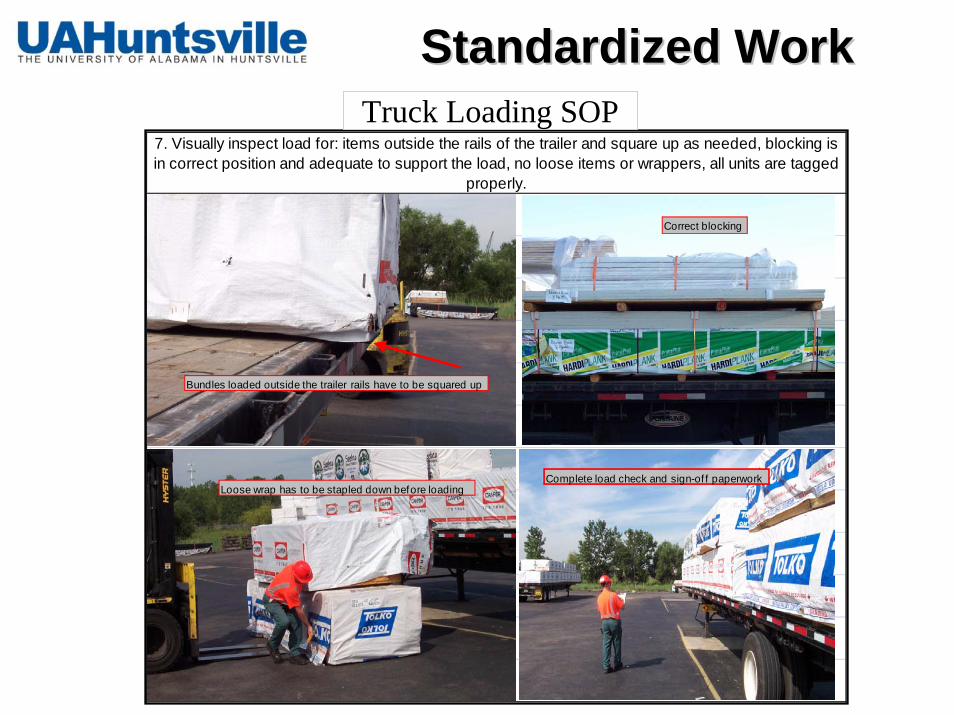
7. Visually inspect load for: items outside the rails of the trailer and square up as needed, blocking is in correct position and adequate to support the load, no loose items or wrappers, all units are tagged
properly.
Bundles loaded outside the trailer rails have to be squared up
Loose wrap has to be stapled down before loading
Correct blocking
Complete load check and sign-of f paperwork
Truck Loading SOP
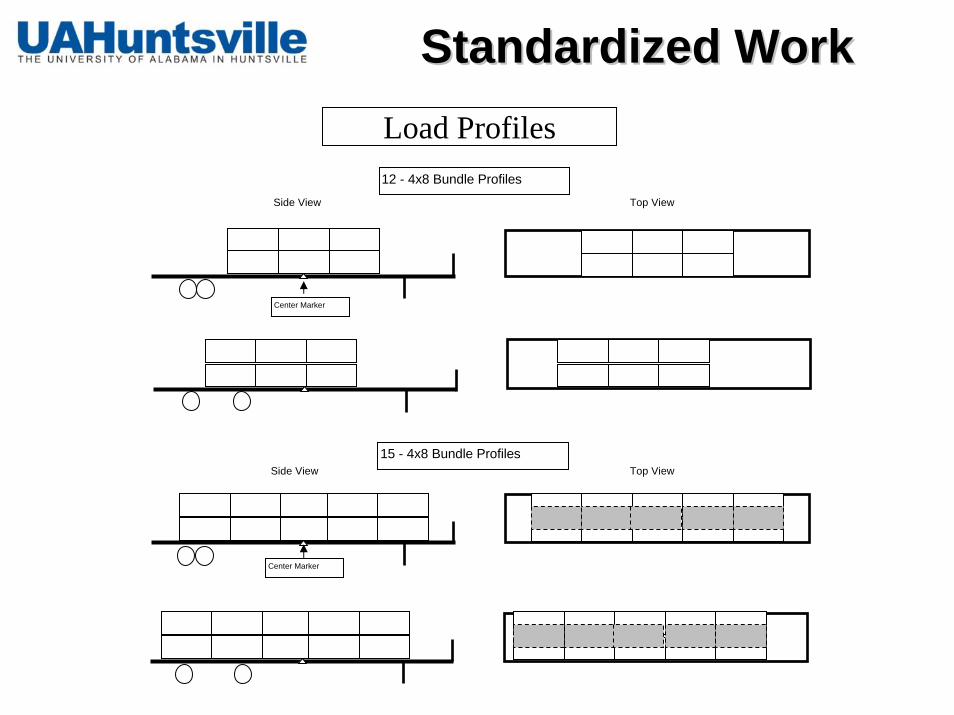
Standardized WorkStandardized WorkLoad Profiles12 - 4x8 Bundle Profiles
Side View Top View
Center Marker
15 - 4x8 Bundle ProfilesSide View Top View
Center Marker
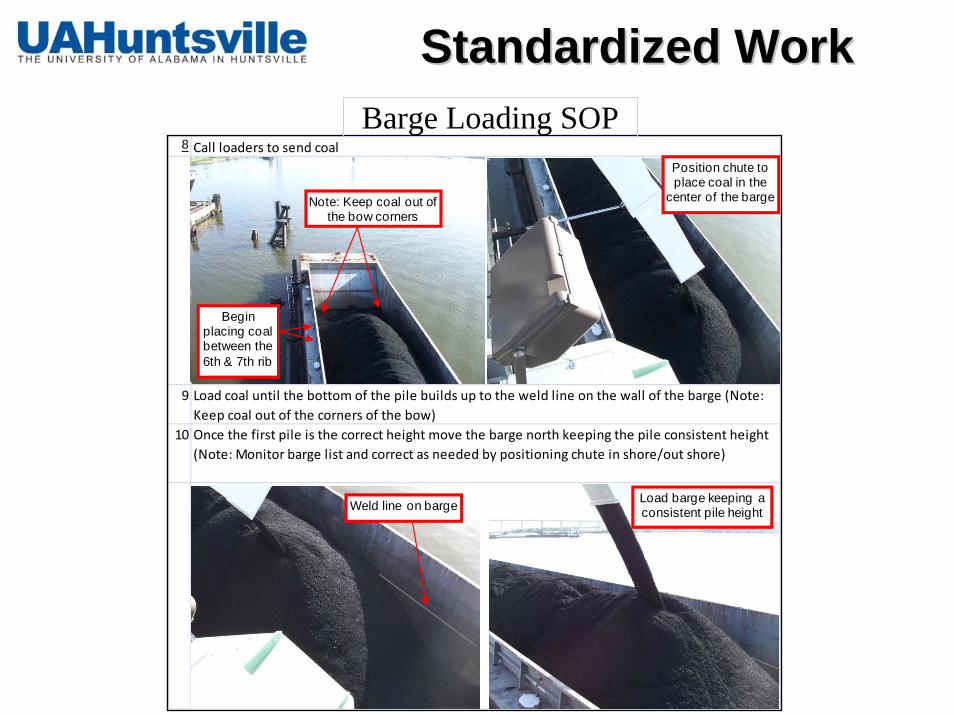
Standardized WorkStandardized Work
8 Call loaders to send coal
9 Load coal until the bottom of the pile builds up to the weld line on the wall of the barge (Note: Keep coal out of the corners of the bow)
10 Once the first pile is the correct height move the barge north keeping the pile consistent height (Note: Monitor barge list and correct as needed by positioning chute in shore/out shore)
Begin placing coal between the 6th & 7th rib
Note: Keep coal out of the bow corners
Position chute to place coal in the
center of the barge
Weld line on barge Load barge keeping a consistent pile height
Barge Loading SOP
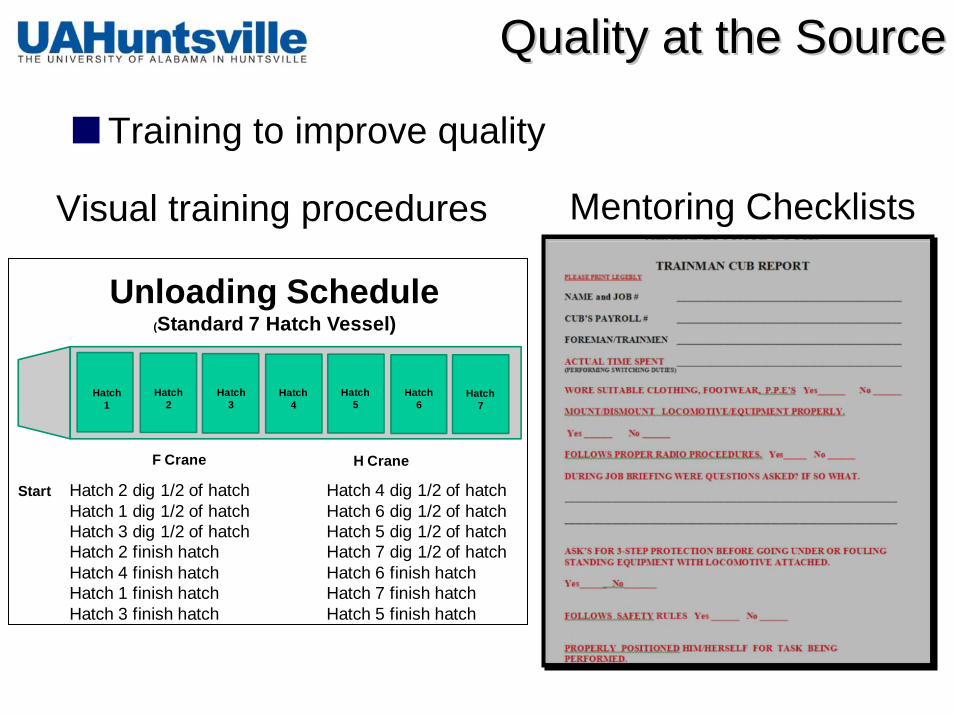
Quality at the SourceQuality at the Source
Training to improve quality
Mentoring ChecklistsVisual training procedures
Unloading Schedule(Standard 7 Hatch Vessel)
F Crane H Crane
Start Hatch 2 dig 1/2 of hatch Hatch 4 dig 1/2 of hatchHatch 1 dig 1/2 of hatch Hatch 6 dig 1/2 of hatchHatch 3 dig 1/2 of hatch Hatch 5 dig 1/2 of hatchHatch 2 finish hatch Hatch 7 dig 1/2 of hatchHatch 4 finish hatch Hatch 6 finish hatchHatch 1 finish hatch Hatch 7 finish hatchHatch 3 finish hatch Hatch 5 finish hatch
Hatch 1
Hatch 2
Hatch 3
Hatch 4
Hatch 5
Hatch 6
Hatch 7
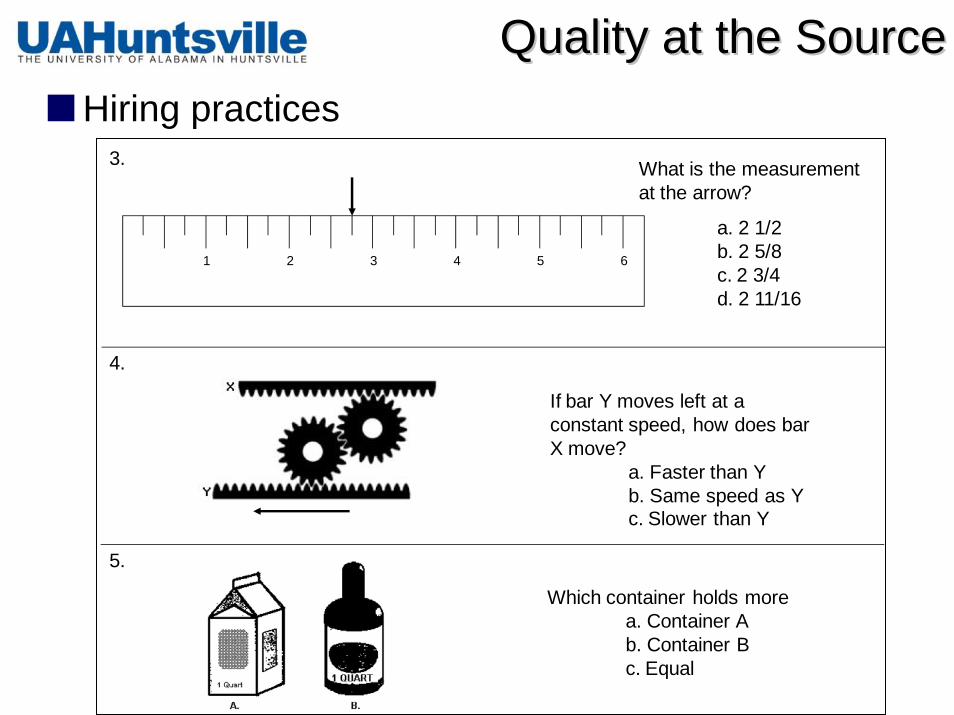
Quality at the SourceQuality at the SourceHiring practices
If bar Y moves left at a constant speed, how does bar X move?
a. Faster than Yb. Same speed as Yc. Slower than Y
Which container holds morea. Container Ab. Container Bc. Equal
3.
4.
5.
1 2 3 4 5 6
What is the measurement at the arrow?
a. 2 1/2b. 2 5/8c. 2 3/4d. 2 11/16
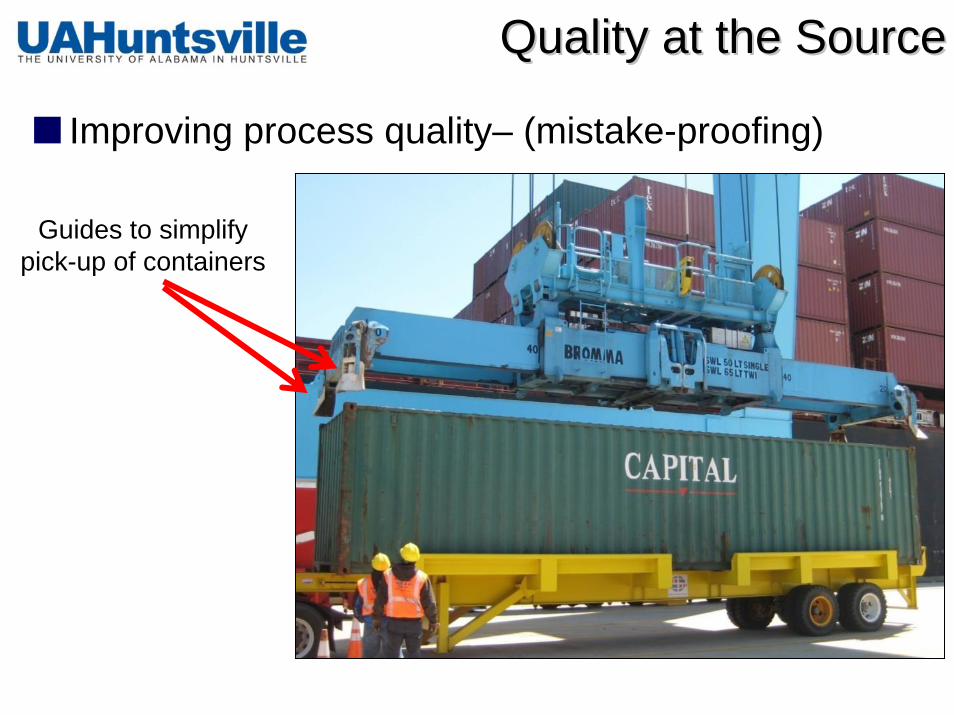
Quality at the SourceQuality at the Source
Improving process quality– (mistake-proofing)
Guides to simplify pick-up of containers
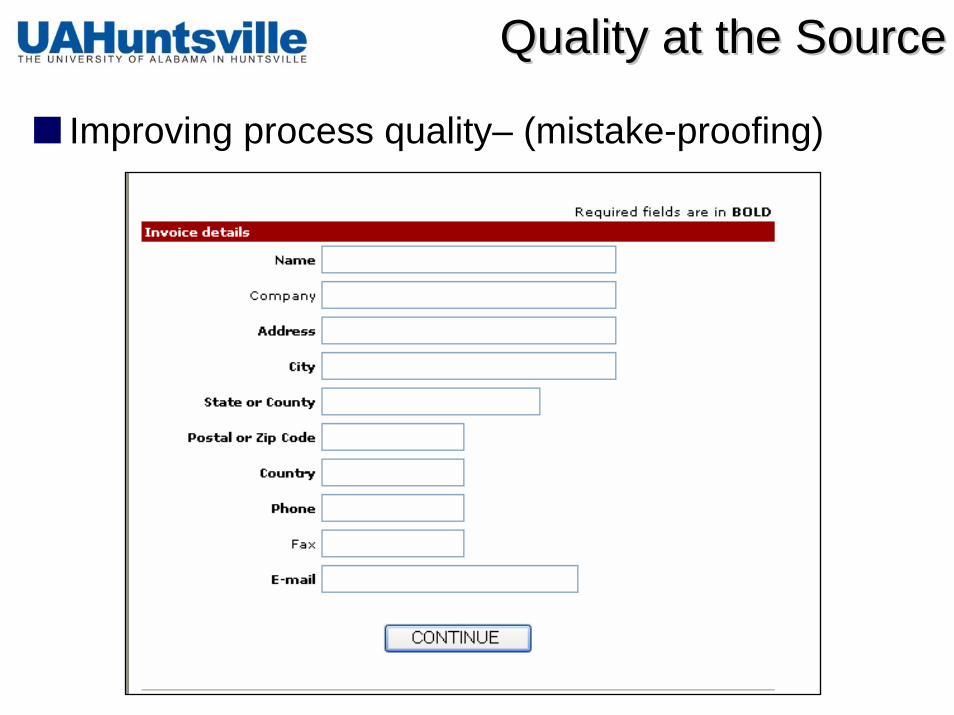
Quality at the SourceQuality at the Source
Improving process quality– (mistake-proofing)
Total Productive MaintenanceTotal Productive Maintenance
TPM is a company wide equipment maintenance program that permanently improves the overall effectiveness of equipment with the active involvement of all employeesGoal is to eliminate/minimize downtime due to breakdown maintenance and to maintain machines at peak performance.

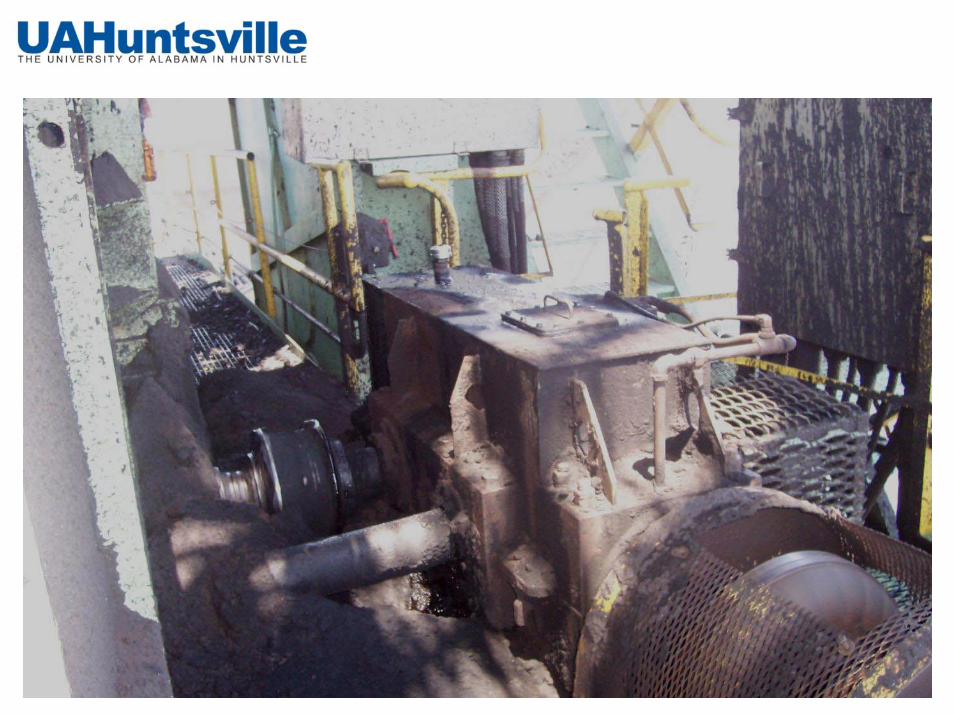
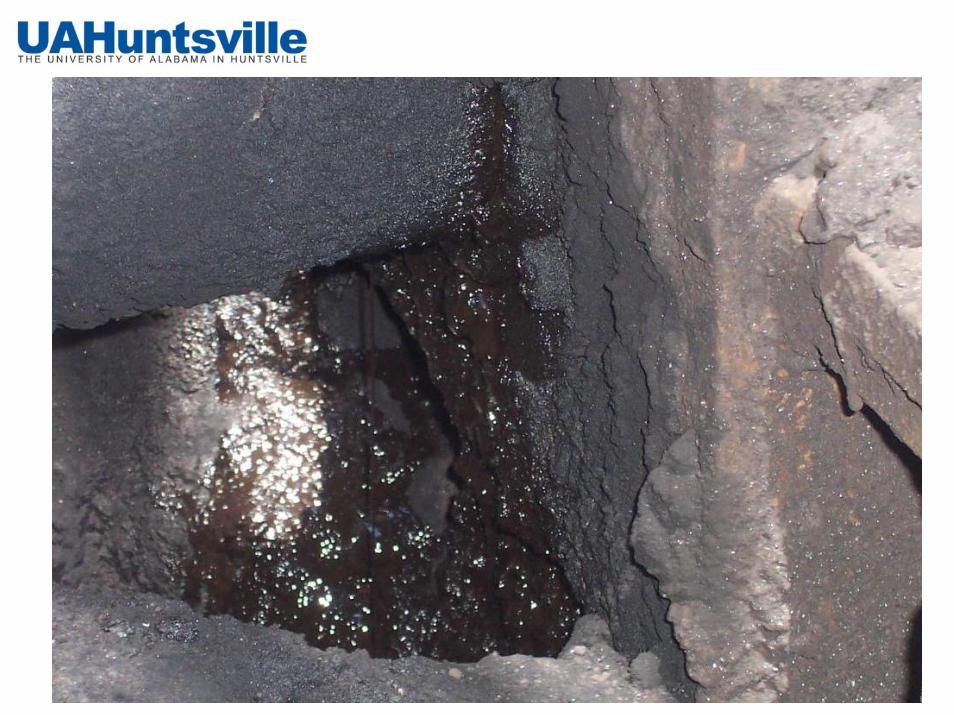
Current StateCurrent State
Typical conditions:• There is often a run-to-failure
mentality• Breakdowns occur regularly• Temporary repairs are the
norm• Minor stoppages occur
frequently• Processing speed decreases • No one is accountable for
tracking these losses• Operator training may not be
adequate
WhatWhat’’s the Impact?s the Impact?
An estimated $200 billion spent each year on wasteful maintenance-related activities.Average equipment efficiency < 50%
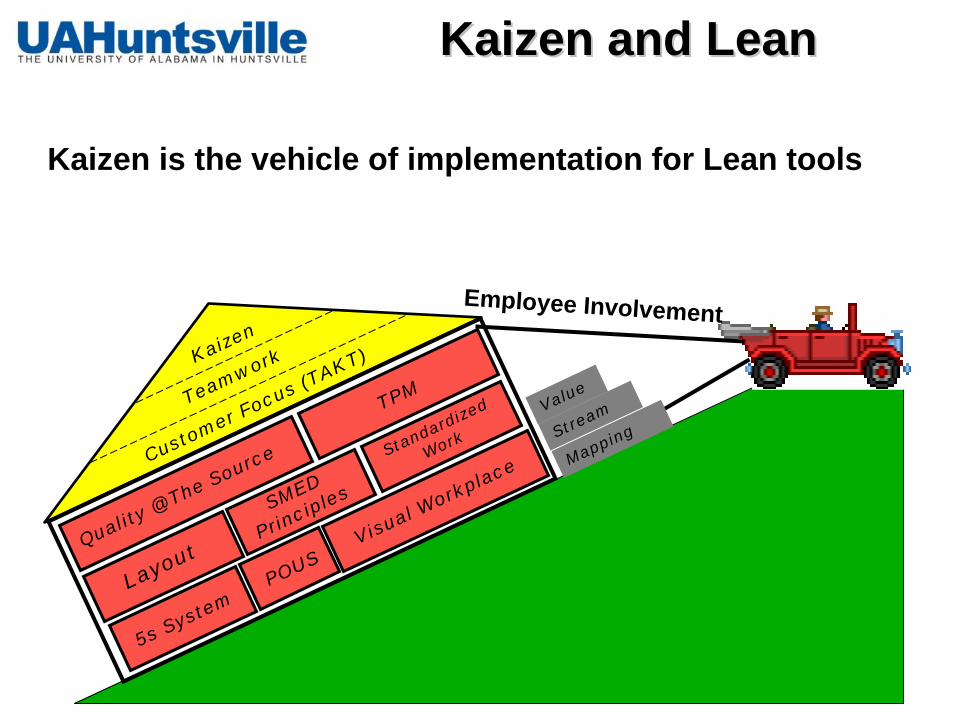
Kaizen and LeanKaizen and Lean
Kaizen is the vehicle of implementation for Lean tools
Employee InvolvementKaizen
5s System
Visual Workplace
Standardized
Work
LayoutPOUS
Quality @ The Source
Teamwork
TPM
MappingStreamValue
SMED
Principles
Customer Focus (T
AKT)
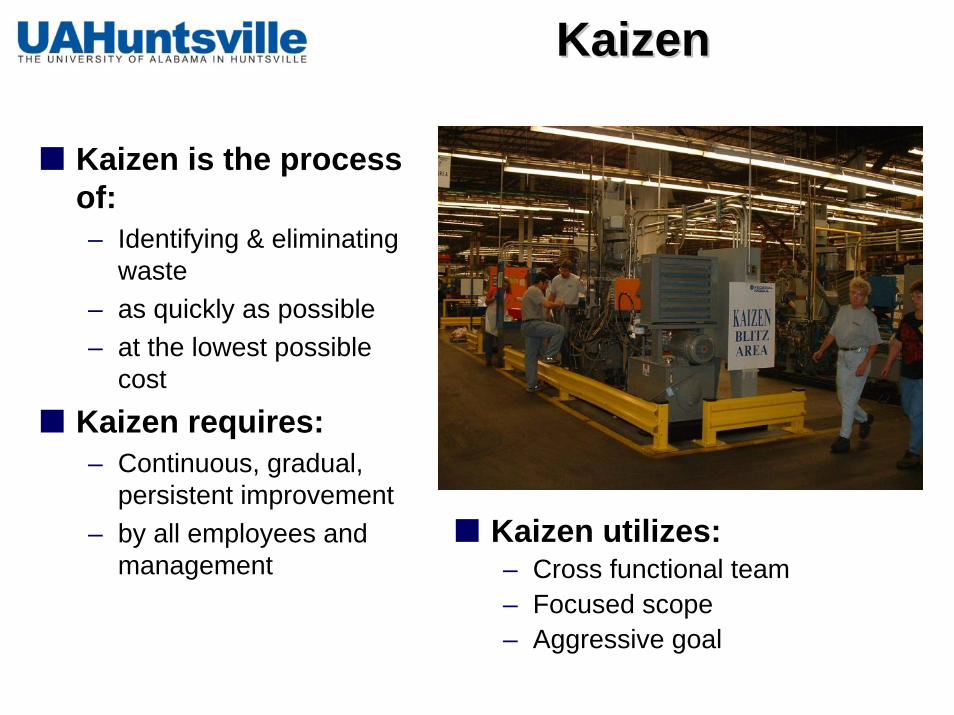
KaizenKaizen
Kaizen is the process of:– Identifying & eliminating
waste– as quickly as possible– at the lowest possible
cost
Kaizen requires:– Continuous, gradual,
persistent improvement– by all employees and
managementKaizen utilizes:– Cross functional team– Focused scope– Aggressive goal
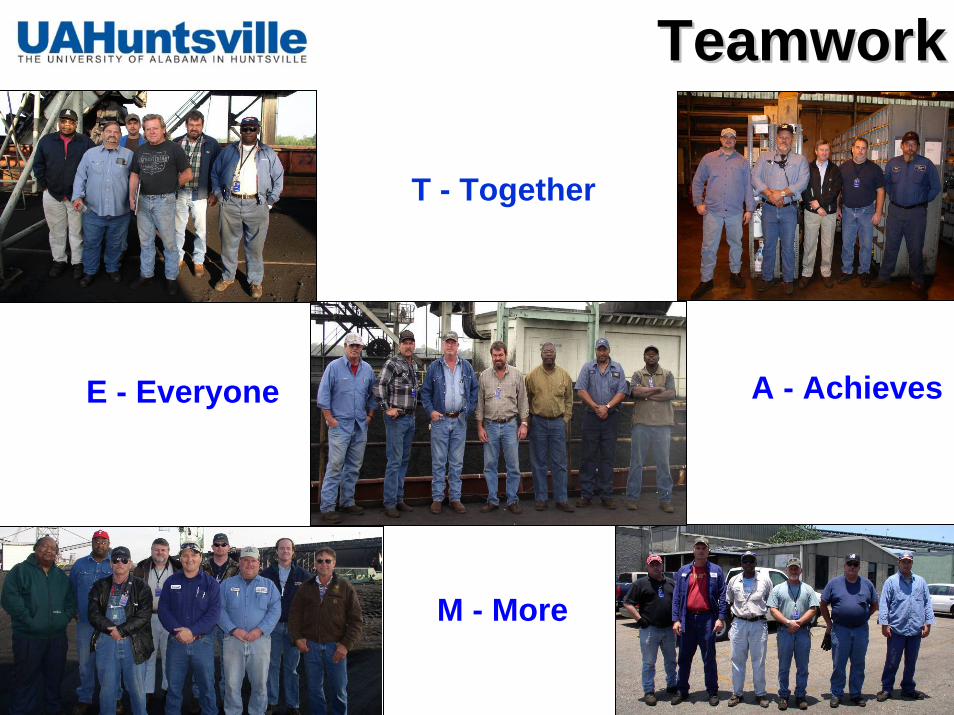
TeamworkTeamwork
T - Together
E - Everyone A - Achieves
M - More
UAH Lean Enterprise UAH Lean Enterprise for Port Operationsfor Port Operations
Workplace Organization
Workplace Analysis
Workplace Optimization
Continuous Improvement
Culture
Kaizen
5s System Visual Workplace
Standardized WorkLayout
POUS
Quality @ The Source
Teamwork
TPM
Mapping
Stream
Value
SMED Principles
Customer Focus (TAKT)
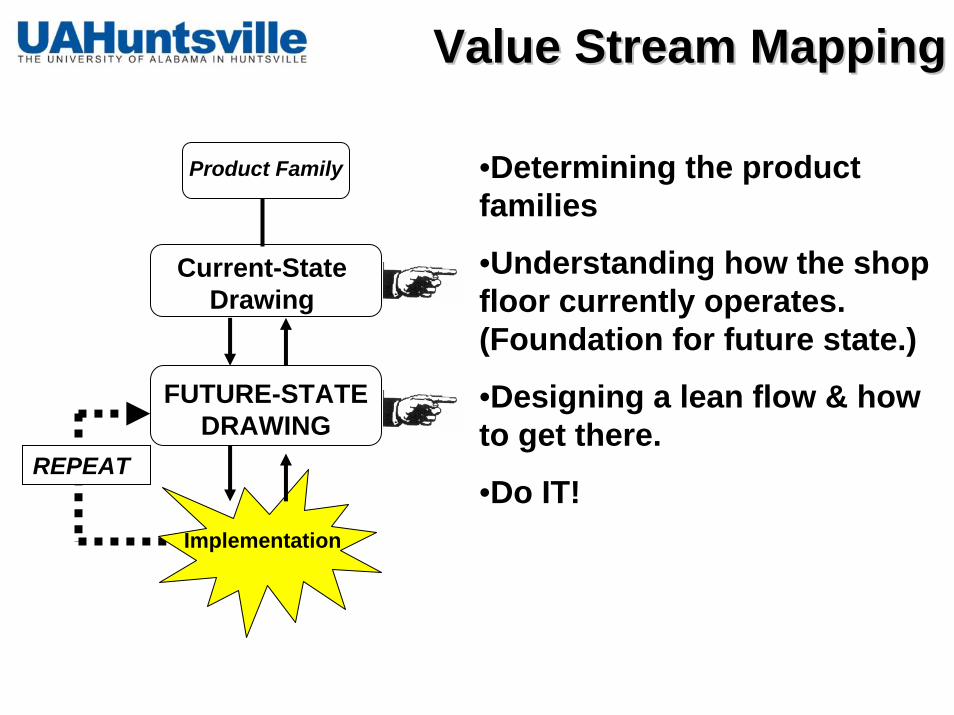
Value Stream MappingValue Stream Mapping
•Determining the product families
•Understanding how the shop floor currently operates. (Foundation for future state.)
•Designing a lean flow & how to get there.
•Do IT!
Product Family
Current-State Drawing
FUTURE-STATE DRAWING
Implementation
REPEAT
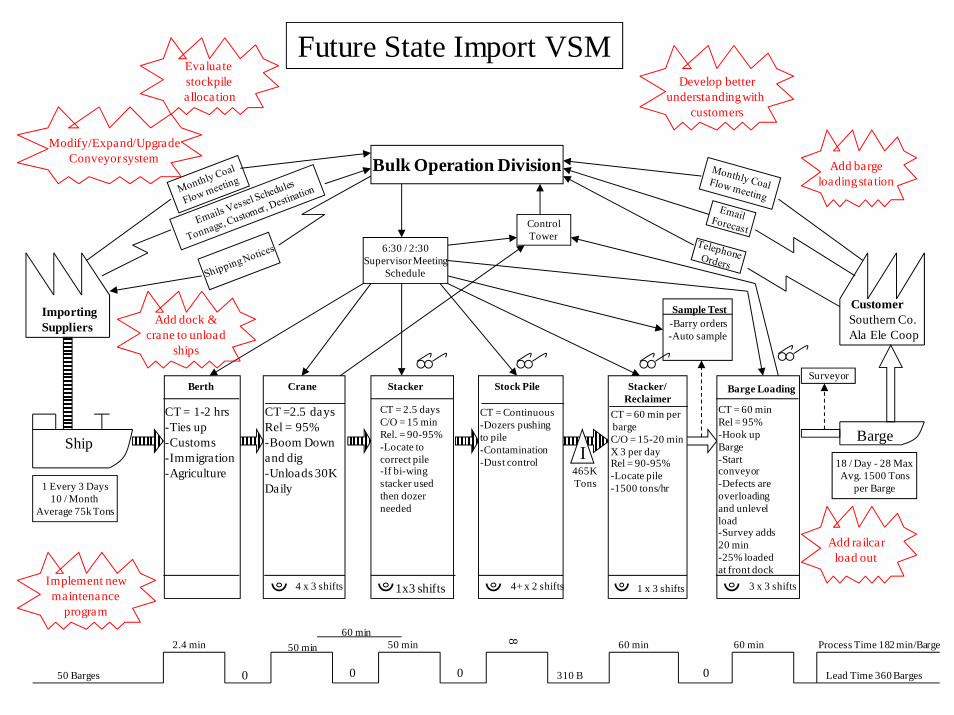
Future State Import VSM
I
Berth
CT = 1-2 hrs-Ties up-Customs-Immigration-Agriculture
Stock Pile
CT = Continuous-Dozers pushing to pile-Contamination-Dust control
4+ x 2 shifts
CustomerSouthern Co.Ala Ele Coop
BargeShip
ImportingSuppliers
465KTons
Stacker/Reclaimer
CT = 60 min perbargeC/O = 15-20 minX 3 per dayRel = 90-95%-Locate pile-1500 tons/hr
1 x 3 shifts
Barge Loading
CT = 60 minRel = 95%-Hook up Barge-Start conveyor-Defects are overloading and unlevel load-Survey adds 20 min-25% loaded at front dock
3 x 3 shifts
Stacker
CT = 2.5 daysC/O = 15 minRel. = 90-95%-Locate to correct pile-If bi-wing stacker used then dozerneeded
1x3 shifts
Crane
CT =2.5 daysRel = 95%-Boom Downand dig-Unloads 30KDaily
4 x 3 shifts
50 Barges
2.4 min
0
50 min 60 min
310 B
Process Time 182 min/Barge
Lead Time 360 Barges
60 min
Bulk Operation Division
1 Every 3 Days10 / Month
Average 75k Tons
6:30 / 2:30Supervisor Meeting
Schedule
-Barry orders-Auto sample
Sample Test
Surveyor
ControlTower
0 0 0
18 / Day - 28 MaxAvg. 1500 Tons
per Barge
60 min50 min
8
Evaluatestockpileallocation
Modify/Expand/UpgradeConveyor system
Add dock &crane to unload
ships
Develop betterunderstanding with
customers
Add bargeloading station
Add railcarload out
Implement newmaintenance
program
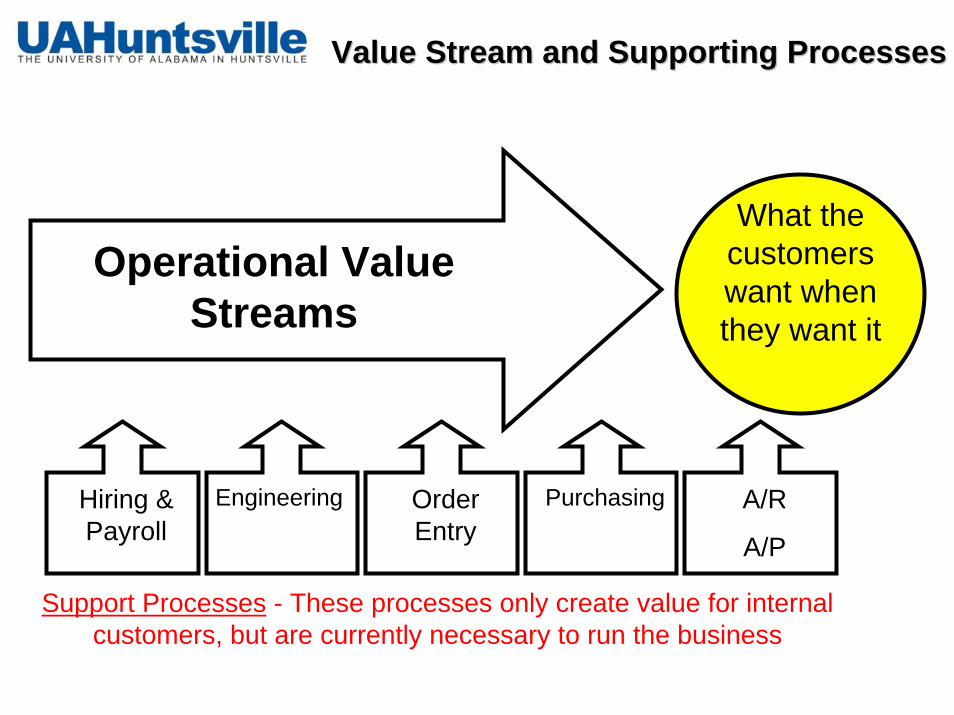
Value Stream and Supporting ProcessesValue Stream and Supporting Processes
Operational Value Streams
What the customers want when they want it
Hiring & Payroll
A/R
A/P
Engineering Order Entry
Purchasing
Support Processes - These processes only create value for internal customers, but are currently necessary to run the business
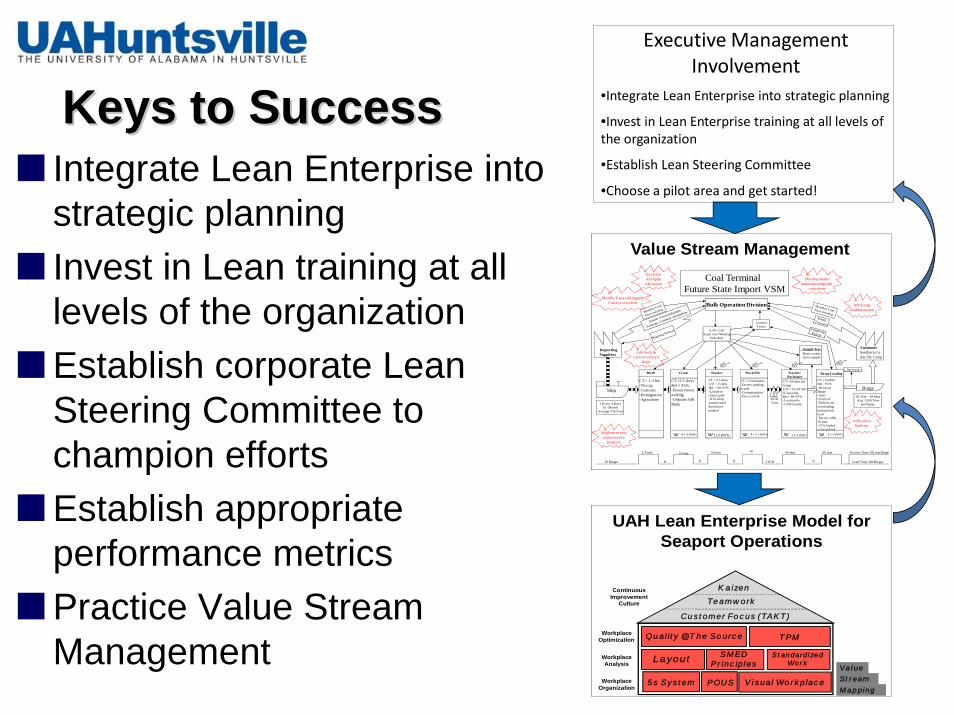
Executive Management Involvement
•Integrate Lean Enterprise into strategic planning
•Invest in Lean Enterprise training at all levels of the organization
•Establish Lean Steering Committee
•Choose a pilot area and get started!
Coal Terminal Future State Import VSM
I
Berth
CT = 1-2 hrs-Ties up-Customs-Immigration-Agriculture
Stock Pile
CT = Continuous-Dozers pushing to pile-Contamination-Dust control
4+ x 2 shifts
CustomerSouthern Co.Ala Ele Coop
BargeShip
ImportingSuppliers
465KTons
Stacker/Reclaimer
CT = 60 min perbargeC/O = 15-20 minX 3 per dayRel = 90-95%-Locate pile-1500 tons/hr
1 x 3 shifts
Barge Loading
CT = 60 minRel = 95%-Hook up Barge-Start conveyor-Defects are overloading and unlevel load-Survey adds 20 min-25% loaded at front dock
3 x 3 shifts
Stacker
CT = 2.5 daysC/O = 15 minRel. = 90-95%-Locate to correct pile-If bi-wing stacker used then dozerneeded
1x3 shifts
Crane
CT =2.5 daysRel = 95%-Boom Downand dig-Unloads 30KDaily
4 x 3 shifts
50 Barges
2.4 min
0
50 min 60 min
310 B
Process Time 182 min/Barge
Lead Time 360 Barges
60 min
Bulk Operation Division
1 Every 3 Days10 / Month
Average 75k Tons
6:30 / 2:30Supervisor Meeting
Schedule
-Barry orders-Auto sample
Sample Test
Surveyor
ControlTower
0 0 0
18 / Day - 28 MaxAvg. 1500 Tons
per Barge
50 min
8
Evaluatestockpileallocation
Modify/Expand/UpgradeConveyor system
Add dock &crane to unload
ships
Develop betterunderstanding with
customers
Add bargeloading station
Add railcarload out
Implement newmaintenance
program
Value Stream Management
UAH Lean Enterprise Model for Seaport Operations
Kaizen
5s System Visual Workplace
Standardized WorkLayout
POUS
Quality @ The Source
Teamwork
TPM
Mapping
Stream
Value
SMED Principles
Customer Focus (TAKT)
Workplace Organization
Workplace Analysis
Workplace Optimization
Continuous Improvement
Culture
Keys toKeys to SuccessSuccessIntegrate Lean Enterprise into strategic planningInvest in Lean training at all levels of the organizationEstablish corporate Lean Steering Committee to champion effortsEstablish appropriate performance metricsPractice Value Stream Management

Growth StrategyGrowth Strategy
Satisfy the Customer
Invest in EmployeesGrow the Company
Sales
Improvement
Profit
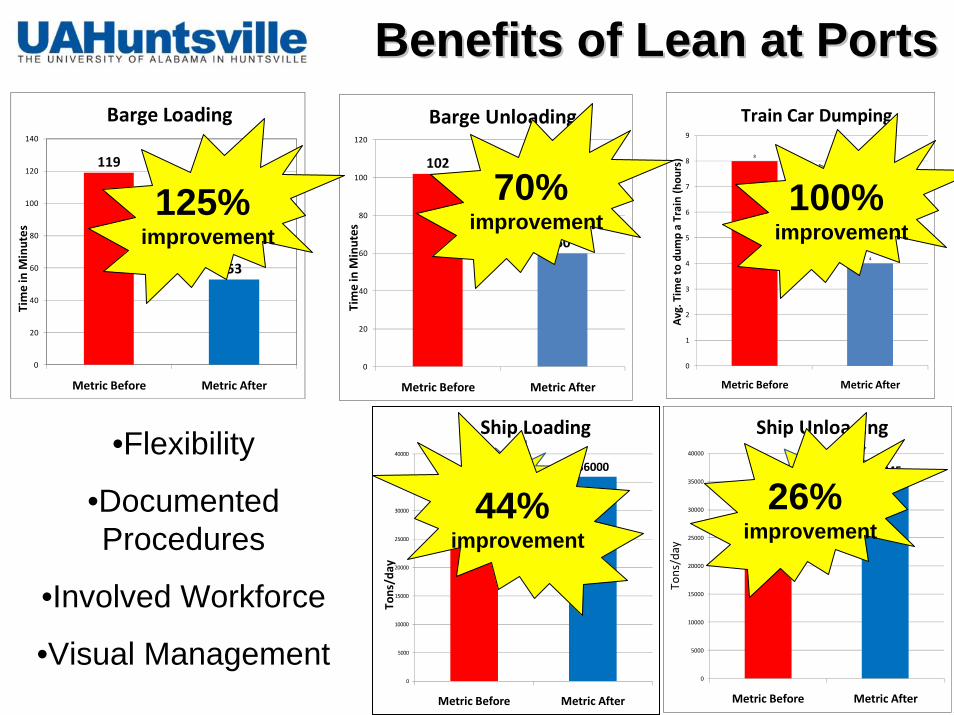
Benefits of Lean at PortsBenefits of Lean at Ports
119
53
0
20
40
60
80
100
120
140
Metric Before Metric After
Time in M
inutes
Barge Loading
125%Improvement
102
60
0
20
40
60
80
100
120
Metric Before Metric After
Barge Unloading
Time in M
inutes
70%Improvement
25000
36000
0
5000
10000
15000
20000
25000
30000
35000
40000
Metric Before Metric After
Tons/day
Ship Loading
44%Improvement
28000
35245
0
5000
10000
15000
20000
25000
30000
35000
40000
Metric Before Metric After
Tons/day
Ship Unloading
26%Improvement
8
4
0
1
2
3
4
5
6
7
8
9
Metric Before Metric After
Avg. Tim
e to dum
p a Train (hou
rs)
Train Car Dumping
100%Improvement125%
improvement
70% improvement
100% improvement
44% improvement
26% improvement
•Flexibility
•Documented Procedures
•Involved Workforce
•Visual Management