modern apm approaches
TRANSCRIPT

Modern APM Approaches
Ken Ahrens


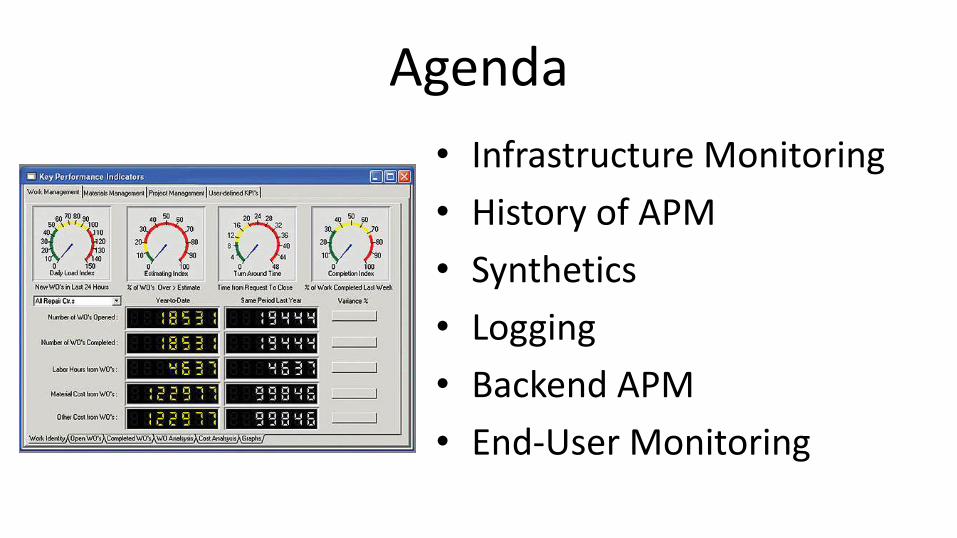
Agenda
• Infrastructure Monitoring
• History of APM
• Synthetics
• Logging
• Backend APM
• End-User Monitoring
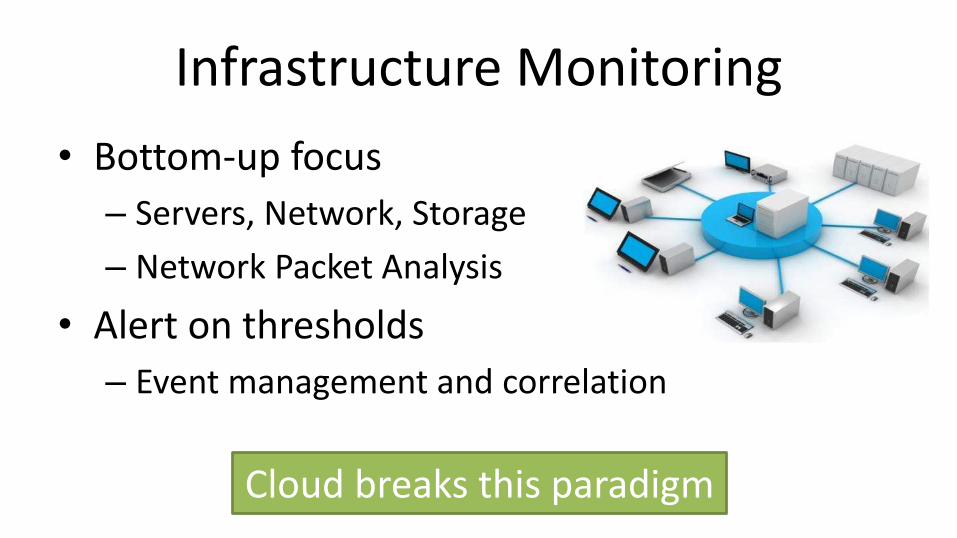
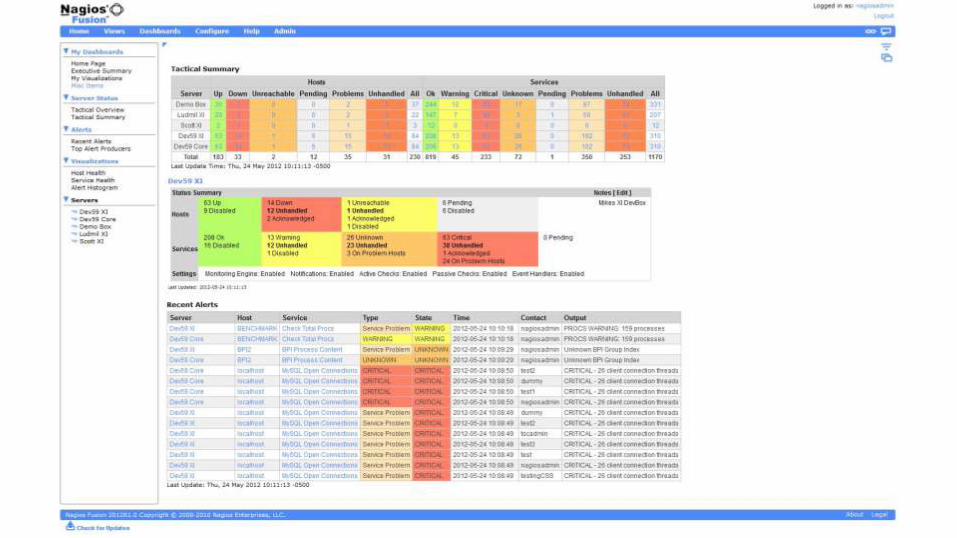
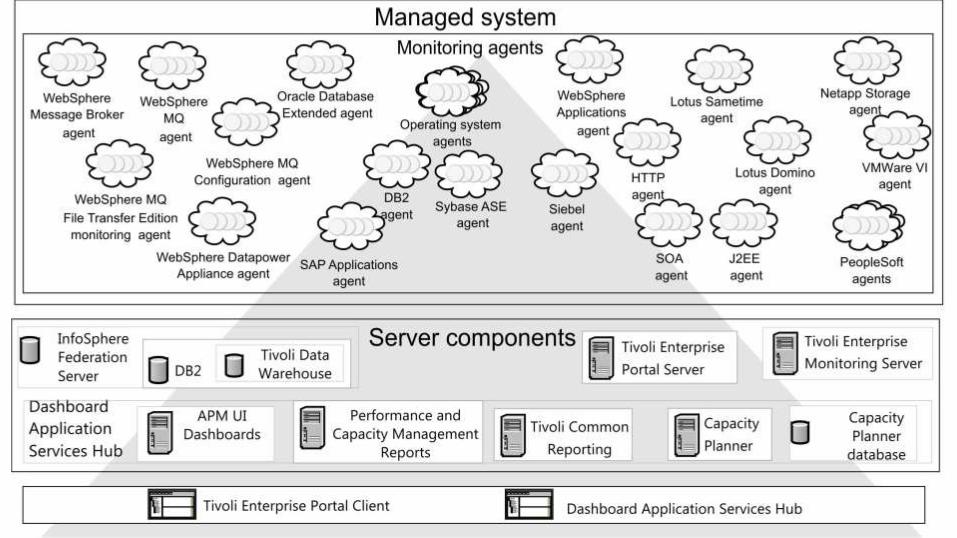
Infrastructure Monitoring
• Bottom-up focus
– Servers, Network, Storage
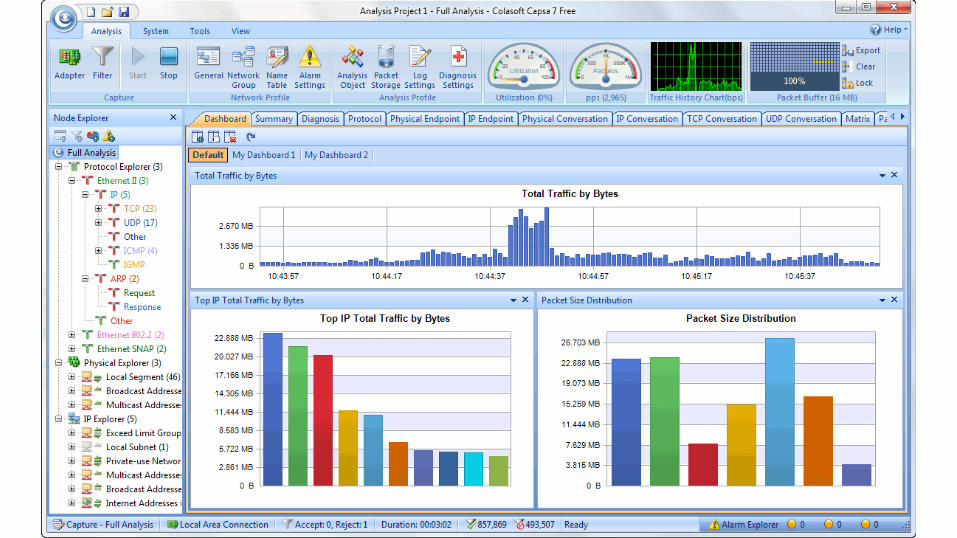
– Network Packet Analysis
• Alert on thresholds
– Event management and correlation
Cloud breaks this paradigm
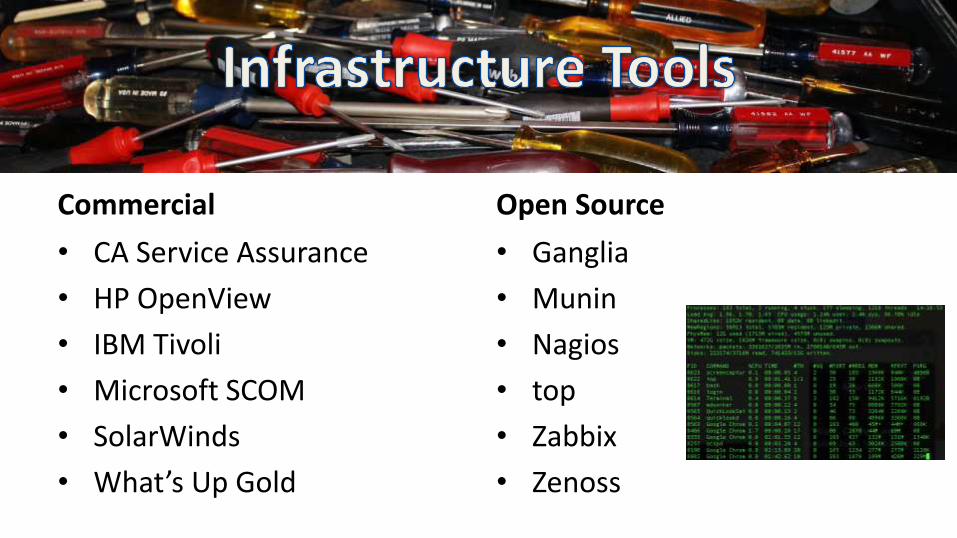
Commercial
• CA Service Assurance
• HP OpenView
• IBM Tivoli
• Microsoft SCOM
• SolarWinds
• What’s Up Gold
Open Source
• Ganglia
• Munin
• Nagios
• top
• Zabbix
• Zenoss
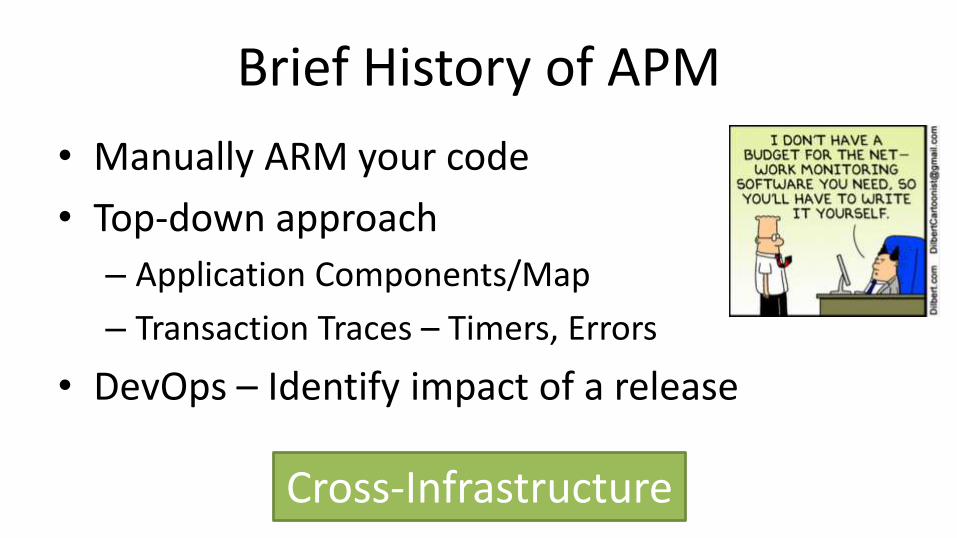
Brief History of APM
• Manually ARM your code
• Top-down approach
– Application Components/Map
– Transaction Traces – Timers, Errors
• DevOps – Identify impact of a release
Cross-Infrastructure
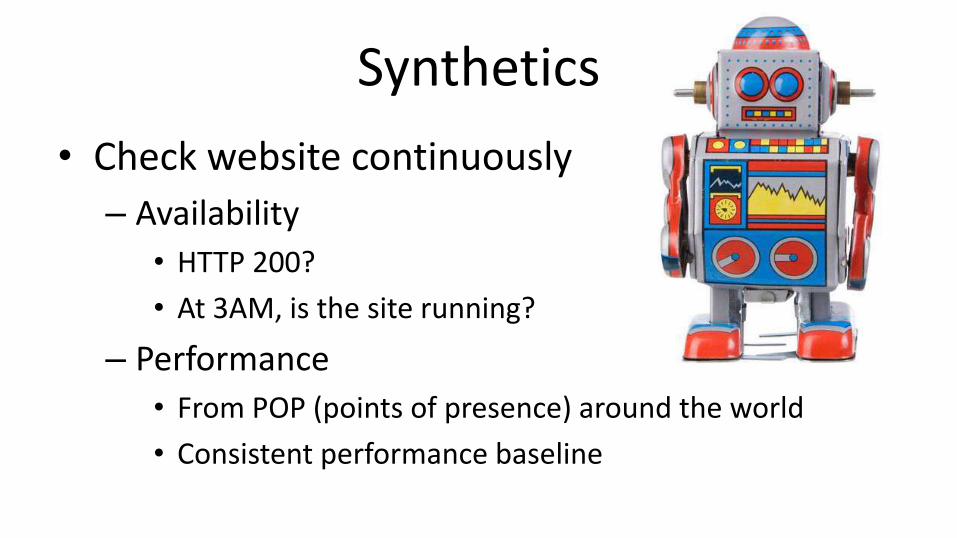
Synthetics
• Check website continuously
– Availability
• HTTP 200?
• At 3AM, is the site running?
– Performance
• From POP (points of presence) around the world
• Consistent performance baseline
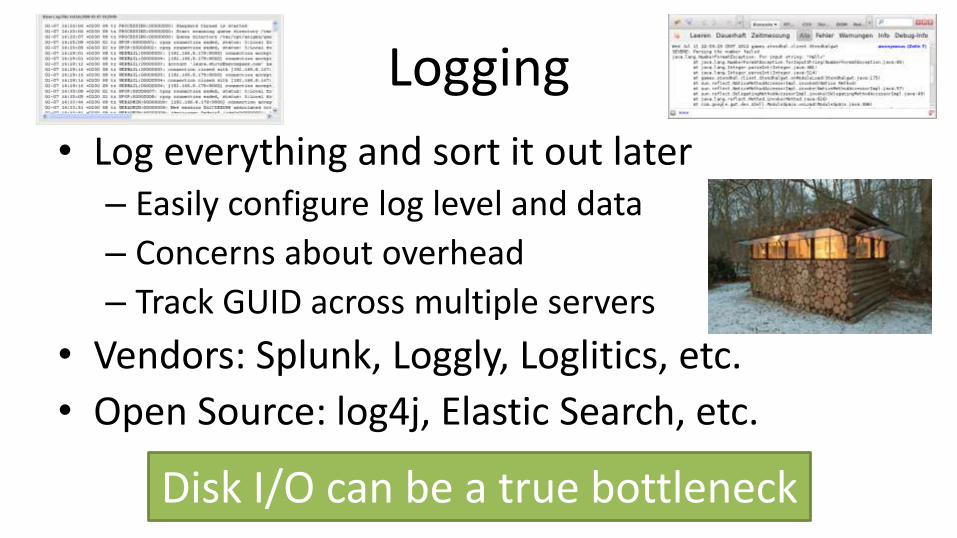
Logging
• Log everything and sort it out later– Easily configure log level and data
– Concerns about overhead
– Track GUID across multiple servers
• Vendors: Splunk, Loggly, Loglitics, etc.
• Open Source: log4j, Elastic Search, etc.
Disk I/O can be a true bottleneck
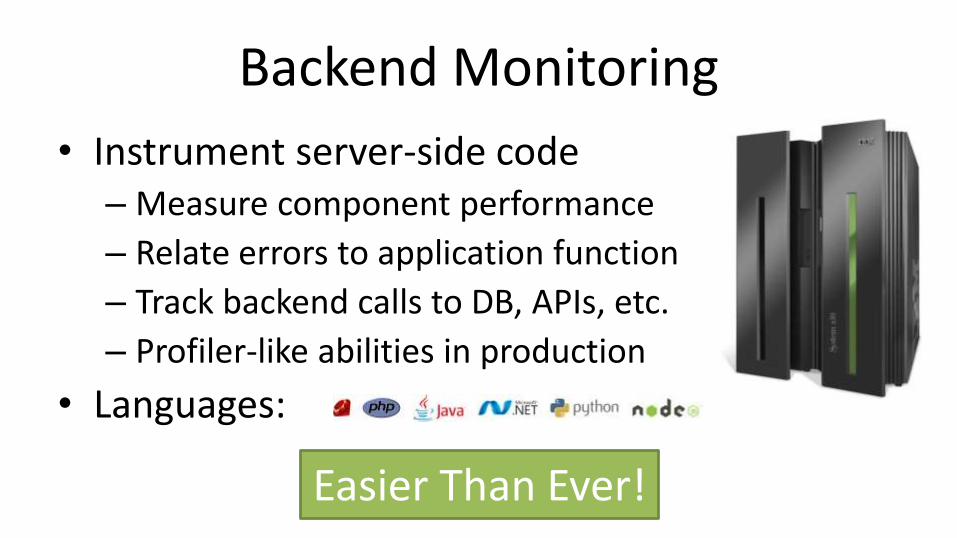
Backend Monitoring
• Instrument server-side code– Measure component performance
– Relate errors to application function
– Track backend calls to DB, APIs, etc.
– Profiler-like abilities in production
• Languages:
Easier Than Ever!
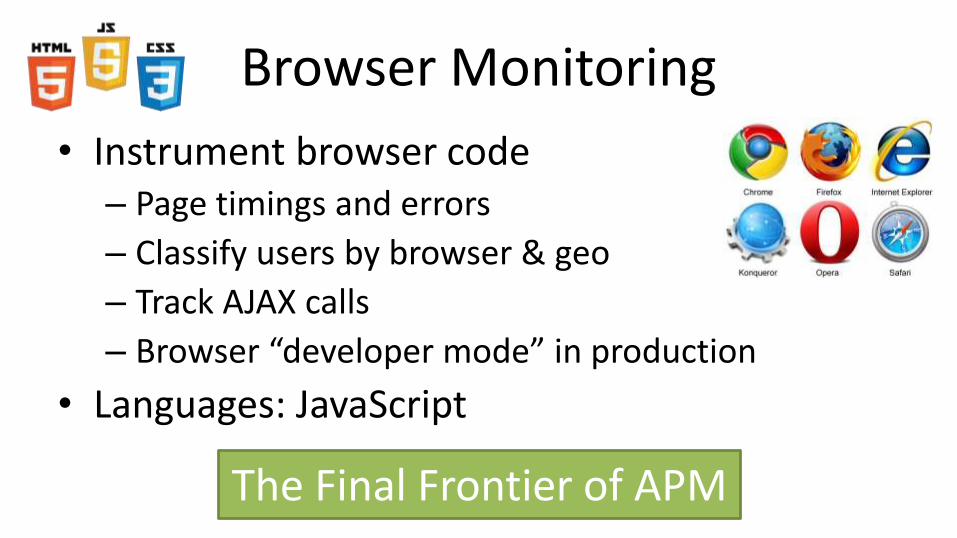
Browser Monitoring
• Instrument browser code– Page timings and errors
– Classify users by browser & geo
– Track AJAX calls
– Browser “developer mode” in production
• Languages: JavaScript
The Final Frontier of APM

Native Mobile Monitoring
• Instrument native mobile app
– Track crashes and bread crumbs
– Measure interaction performance
– Identify HTTP calls leaving the device
• Languages: Android, iOS, Windows
Blind Spot?
Software Analytics
• Consolidate events from everywhere
• Enrich with business context
• Make data-driven decisions
• Focus on real-time
• Solutions: Big Data Analytics, BI