models – refinement & validation lewis & clark workshop macromolecular crystallography ©...
Post on 19-Dec-2015
215 views
TRANSCRIPT

Models – Refinement & Validation
Lewis & Clark WorkshopMacromolecular Crystallography
© Michael S. Chapman
11/6/2009 Michael S. Chapman (Oregon Health & Science University)
1

MODEL-BUILDINGPart I – Mostly to be replaced by practical
11/6/2009 Michael S. Chapman (Oregon Health & Science University)
2

Michael S. Chapman (Oregon Health & Science University)
311/6/2009
RoleAn electron density map is
the direct product of a crystallographic experiment
An atomic model is required to understand the chemical implications
Here model fit into the electron density “Manual”
computer-assisted Need only be
approximate Adjusted later-
refinement
Michael S. Chapman (Oregon Health & Science University)
411/6/2009
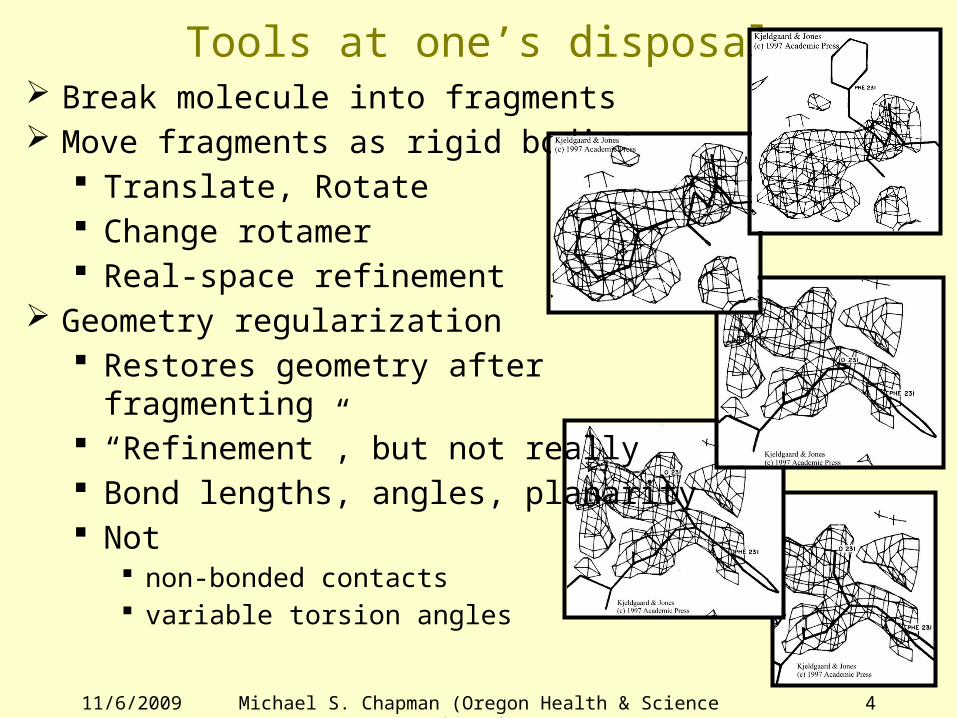
Tools at one’s disposal Break molecule into fragments Move fragments as rigid bodies
Translate, Rotate Change rotamer Real-space refinement
Geometry regularization Restores geometry after fragmenting “Refinement”, but not really Bond lengths, angles, planarity Not
non-bonded contacts variable torsion angles
Michael S. Chapman (Oregon Health & Science University)
511/6/2009
Data bases – a Powerful ToolPremise – ain’t nothin’ new”Almost everything that you see…
Should have been seen before In one of the hundreds of prior structures
If it looks new… Most likely a mistake
Not all structures the same! but built of common fragments
Tools to find prior fragments that fit densityEspecially useful at modest resolutionProgram “O”

Michael S. Chapman (Oregon Health & Science University)
611/6/2009
ProgramsCoot – currently most popular
Paul EmsleyO – still fans. Best database searches
T. Alwyn Jones & colleaguesQuanta – More automated; Commercial;
Tom Oldfield et al.Automation:Main – D. Turk; Textal – T. Ioerger; Resolve -
TerwilligerAutomation
Best programs do easiest 75% w/ good map 7 months to complete? / 30% w/in 100
days.

MODEL-REFINEMENTPart II
11/6/2009 Michael S. Chapman (Oregon Health & Science University)
7

Michael S. Chapman (Oregon Health & Science University)
811/6/2009
RefinementComputer optimization of atomic modelFit to the Experimental Diffraction DataAgreement with known stereochemical values
Lengths of bonds…
Minimize (e.g.) U = Sx(ro,x–rc,x)2 + SrwL,r(Lr-L)2. Fit to density over map grid points, x. Deviation from known stereochemistries, L.

Michael S. Chapman (Oregon Health & Science University)
911/6/2009
Objective Function - TypeWhat we are trying to minimize
Real space: Min Sx(ro,x–rc,x)2 + SrwL,r(Lr-L)2. Niche-only: density limited by phases
Reciprocal space
Min Sh(|Fo,h| – |Fc,h|)2 + SrwL,r(Lr - L)2
Fit to diffraction amplitudes (Optionally phases) By far most popular

Michael S. Chapman (Oregon Health & Science University)
1011/6/2009
Objective Functional FormMinimizing error - Least-squares: S(xo – xc)2:
Solution of minimal error Errors assumed Gaussian & Independent Simpler Programs: X-Plor; TNT; ShellX
Maximum Likelihood is better: Most likely to be consistent w/ data Probabilistic estimates for all errors Bayesian statistics / Newer / Complex Programs: Phenix; Refmac Advantage: Over-fitting reduced

Michael S. Chapman (Oregon Health & Science University)
1111/6/2009
Over-fittingFit is too good
Expected discrepancies: Random errors in data Missing elements of model – solvent; disorder
etc..Over-fitting when refinement works too well
Model compensates for errors / deficienciesFacilitated by global nature of refinement
Each |F| depends on every atom Error (or omission) of atoms in one region
compensated by adjustments of other atoms
“Restoring” good fit between |Fo| & |Fc|Monitored by cross-validation – Rfree.

Michael S. Chapman (Oregon Health & Science University)
1211/6/2009
Need for Stereochemical Restraints/Constraints
Diffraction experiments yield insufficient data to refine unrestrained individual atoms
How many data points? Assume (35Å)³ cell at 2.7Å resolution 10,300 reflections
Atomic parameters 3,000 atoms x {x,y,z,B} = 12,000
parametersUnder-determined – no unique answerPerfect data – data pts >= # parametersReality – would need Data:parameter ratio >
6:1
Michael S. Chapman (Oregon Health & Science University)
1311/6/2009
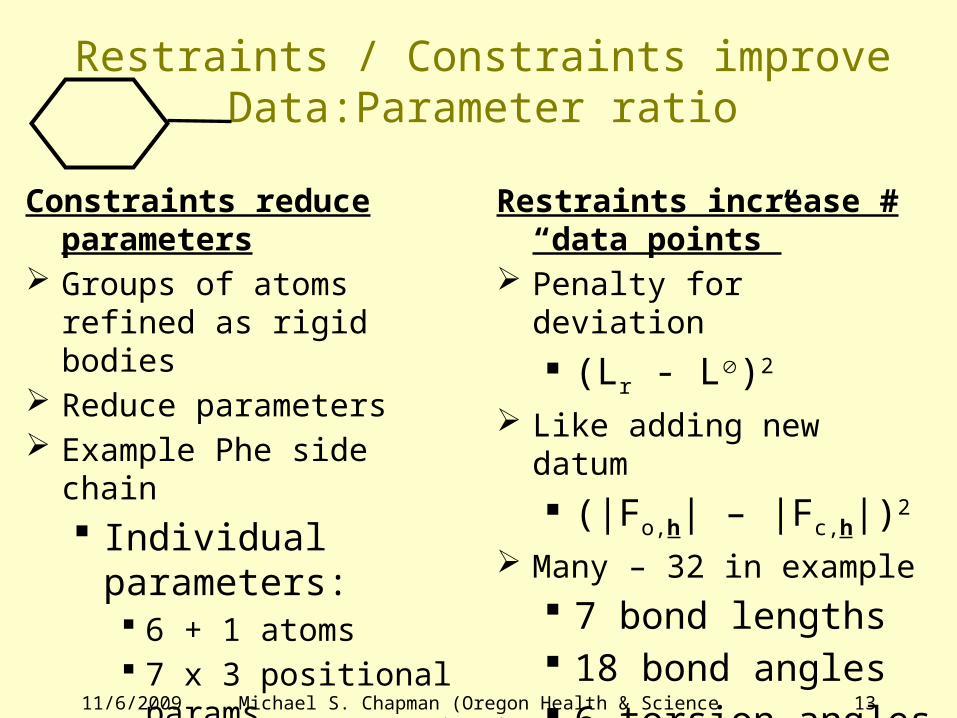
Restraints / Constraints improve Data:Parameter ratio
Constraints reduce parameters
Groups of atoms refined as rigid bodies
Reduce parameters Example Phe side chain
Individual parameters: 6 + 1 atoms 7 x 3 positional
params Rigid body
3 angles for orientation
3 coordinates for center
Restraints increase # “data points”
Penalty for deviation
(Lr - L)2
Like adding new datum
(|Fo,h| – |Fc,h|)2
Many – 32 in example 7 bond lengths 18 bond angles 6 torsion angles 1 planarity

Michael S. Chapman (Oregon Health & Science University)
1411/6/2009
Typical Restraints & Constraints embody our a priori knowledge
Typical Restraints Covalent bond lengths Bond angles Fixed torsion angles
Rings Peptide bond
Variable torsion angles , , f y c have
optima, but some variation
Van der Waal’s separation
Not usually H-bonds Fix structure
Constrained refinement Fully constrained –
atomic refinement does not converge as well
Not flexible enough
Constraints used in Rigid-body
refinement Molecular
replacement Some in
“restrained” refinement Chemical
Sequence

Michael S. Chapman (Oregon Health & Science University)
1511/6/2009
Ways that Restraints can be Specified Everything as distances
Simplest; weighting easiest Not very intuitive Program Prolsq, SHELLX
As the parameters we use
SrwL,r(Lr - L)2 + Ss (qs - q)2 + SswNB,n(ds - d)2 + … Program TNT
As an empirical energy function, e.g. CHARMM SrkL,r(Lr-L)2 + Sskq,s(qs-q)2 + SnkNB,n(A/d11
n–B/d5n)2 +
… Note similarities, minor differences: form, k vs. w…
Minimize potential energy w/ a new energy: Exray = Sh(|Fo,h| – |Fc,h|)2 (others possible)
Programs X-plor; CNS; Phenix.refine

Michael S. Chapman (Oregon Health & Science University)
1611/6/2009
How to Weight StereochemistryStronger weight more ideal stereochemistry
Less easy to fit diffraction dataWhat is the correct weight?
X-plor / CNS: option to calculate weight ~equal improvement of stereochemistry & fit to diffraction data
Phenix: minimum Rfree vs. weight Requires ~ 10 cycles of refinement for each
point Modern computers fast – this is worth doing
log weight
Rfree
Caution – automatic weight determination in CNS is by a lesser method.

Michael S. Chapman (Oregon Health & Science University)
1711/6/2009
Ways of Finding the Optimum
Gradient descentSimulated annealing

Michael S. Chapman (Oregon Health & Science University)
1811/6/2009
Gradient DescentSeveral methods
E.g. Conjugate gradientPrinciple: at optimum…
partial derivative of objective function = 0 dr/dxi = 0
So, if r = Sh(|Fo,h| – |Fc,h|)2 + SrwL,r(Lr - L)2
dr/dxi = 2Sh(|Fo,h| – |Fc,h|).d(|Fc,h|)/dxi + … = 0
Determine changes to parameters leading: r 0
Michael S. Chapman (Oregon Health & Science University)
1911/6/2009
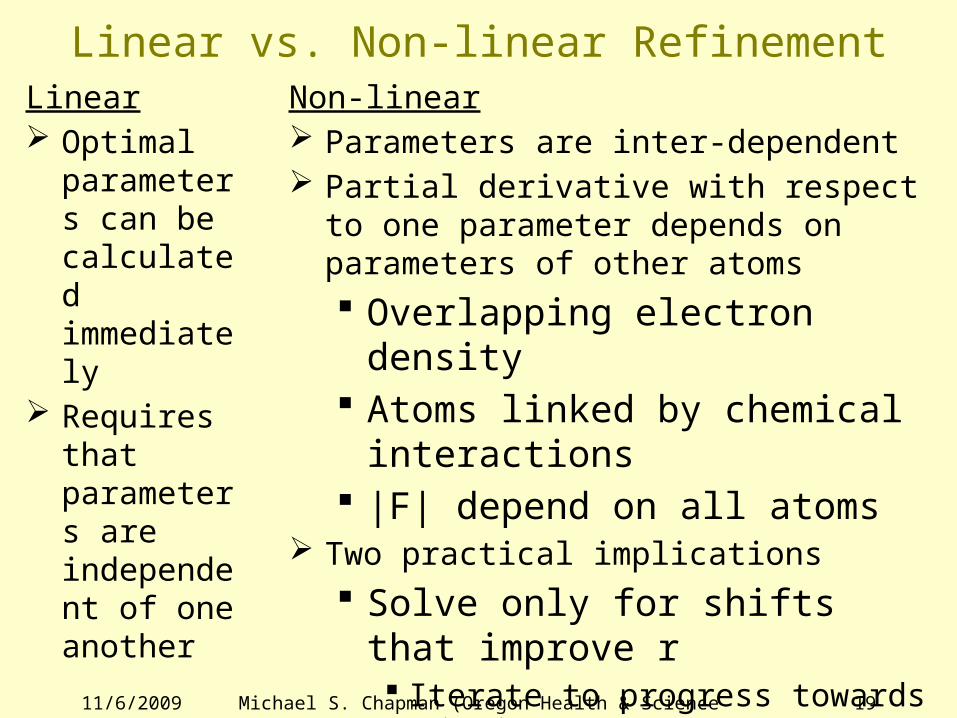
Linear vs. Non-linear RefinementLinear Optimal
parameters can be calculated immediately
Requires that parameters are independent of one another
Non-linear Parameters are inter-dependent Partial derivative with respect to one
parameter depends on parameters of other atoms Overlapping electron density Atoms linked by chemical
interactions |F| depend on all atoms
Two practical implications Solve only for shifts that
improve r Iterate to progress towards
optimum Local minima

Michael S. Chapman (Oregon Health & Science University)
2011/6/2009
Local MinimaG = global optimum L might be a model that fits
reasonably, but perhaps Not as well as G Or with worse
stereochemistryRotation about c2 might
make the fit or stereochemistry Worse (M) before better
Gradient descent does a good job of getting from S to L
But can never go up-hill to find a better optimum
U
L M G
S
Michael S. Chapman (Oregon Health & Science University)
2111/6/2009
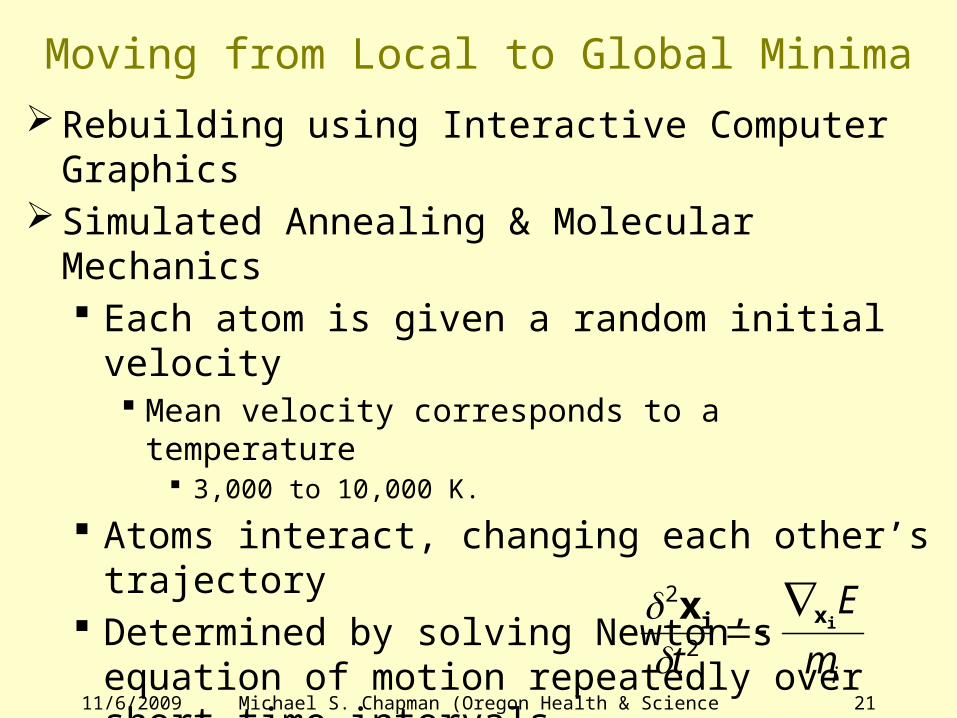
Moving from Local to Global Minima
Rebuilding using Interactive Computer Graphics
Simulated Annealing & Molecular Mechanics Each atom is given a random initial velocity
Mean velocity corresponds to a temperature 3,000 to 10,000 K.
Atoms interact, changing each other’s trajectory
Determined by solving Newton’s equation of motion repeatedly over short time intervals
E is energy is directional gradient
2
2
x i x i
t
E
mi

Michael S. Chapman (Oregon Health & Science University)
2211/6/2009
How does Molecular Dynamics help?Atoms are movingKinetic energy can be
converted to potential energy
Can overcome an energy barrier to find global minimum
Time spent at each minimum depends on depth Chance that could move
away from global minimum
But less chance than moving from local minimum.
U
U
Michael S. Chapman (Oregon Health & Science University)
2311/6/2009
Annealing Schedules Initial velocities simulate T = 3-10,000 KEnergy withdrawn to simulate drop to 290 KSlow cooling – steps of about 25 K
Energy gradually falls below that needed to escape deep minima
While still sufficing to escape local minima

Michael S. Chapman (Oregon Health & Science University)
2411/6/2009
Coordinate SystemsMost refinement programs in
Cartesian space Atoms move in straight lines
Torsion angles are the primary determinants of structure Changes – move atoms in
arcsCartesian approx limits step
size Improved fit balanced by
worse stereochemistryCNS; X-plor; Phenix (?) support
torsion angle refinement More efficient w/ poor
models
Effec
t of
tors
ion
angl
e
Cartesian change moves through
bad stereochemistry
Effec
t of
tors
ion
angl
e
Michael S. Chapman (Oregon Health & Science University)
2511/6/2009
Programs & their merits TNT - Restrained least squares
Efficient & Very easy to understand Tronrud, Ten Eyck & Matthews
SHELXL – High resolution; only one for Anisotropic B’s George Sheldrick
X-plor CNS Phenix - Axel Brünger; Paul Adams et al. Least squares or Maximum Likelihood Simulated annealing or Conjugate gradient Cartesian or Torsion angle (?) Empirical energy
REFMAC - Murshudov, Vagin & Dodson Fast, Maximum likelihood
Most popular are Phenix and RefMac
Michael S. Chapman (Oregon Health & Science University)
2611/6/2009
Refinement is a Process as well as a ProgramRefinements good at local optimization
Rarely find global optimum Parts where locked in local optimum
Need to alternate Automatic refinement “Manual” rebuilding using computer
graphicsFocus on regions of:
Poor stereochemistry – fighting the fit Poor fit to density
Usually use improved map with phases calculated from the latest model
Usually 3 or 4 turns of refinement & re-building
MODEL-PHASED MAPSPart III
11/6/2009 Michael S. Chapman (Oregon Health & Science University)
27
Michael S. Chapman (Oregon Health & Science University)
2811/6/2009
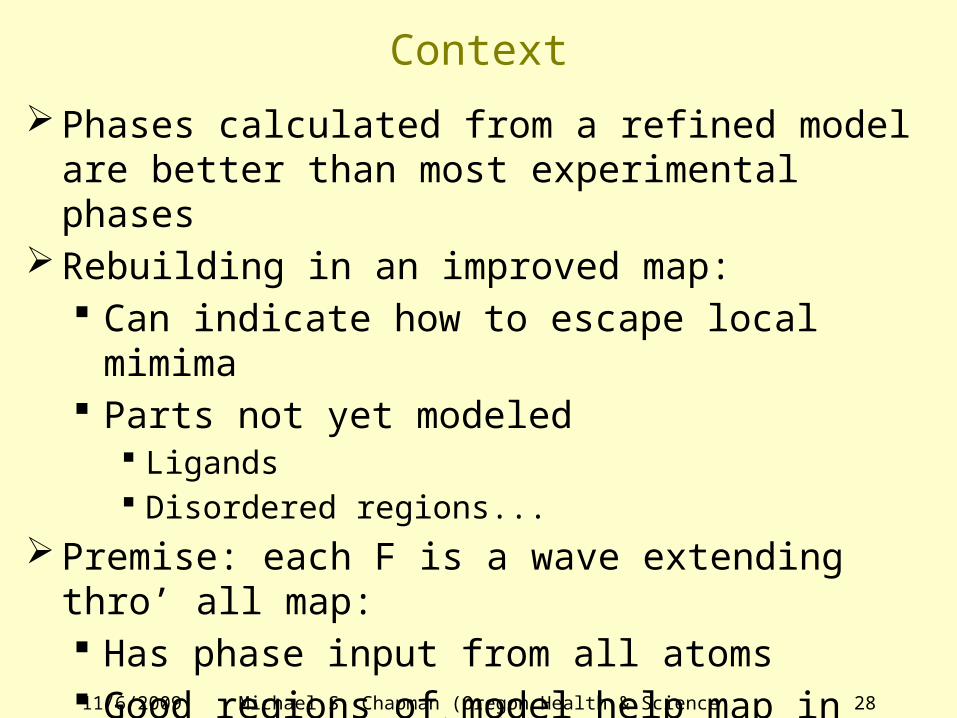
Context
Phases calculated from a refined model are better than most experimental phases
Rebuilding in an improved map: Can indicate how to escape local mimima Parts not yet modeled
Ligands Disordered regions...
Premise: each F is a wave extending thro’ all map: Has phase input from all atoms Good regions of model help map in poor
regions
Michael S. Chapman (Oregon Health & Science University)
2911/6/2009
CreditsFollowing illustrations are taken fromKevin Cowtan’s Book of Fourier
http://www.yorvic.york.ac.uk/~cowtan/fourier/fourier.html

Michael S. Chapman (Oregon Health & Science University)
3011/6/2009
Introducing Felix
A cat – that has a tail But hasn’t yet found it…
Manfred the Manx – who never had a tailCan we reveal the tail fr. image calculated w/
Felix’s Fourier amplitudes Tail and all
Manfred’s phases No tail
Michael S. Chapman (Oregon Health & Science University)
3111/6/2009
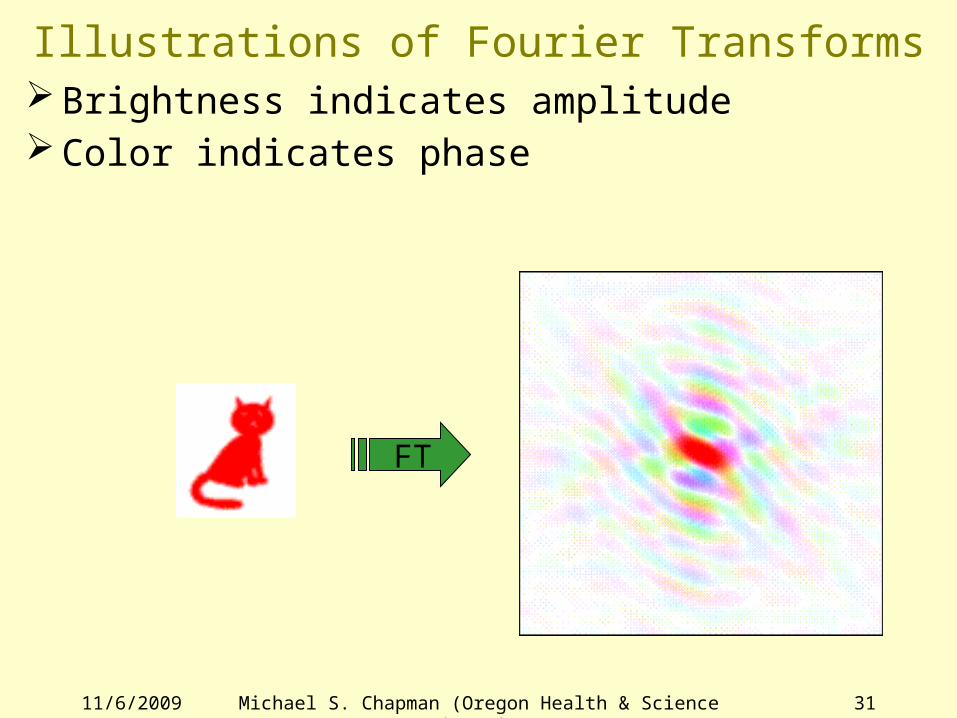
Illustrations of Fourier TransformsBrightness indicates amplitudeColor indicates phase
FT
Michael S. Chapman (Oregon Health & Science University)
3211/6/2009
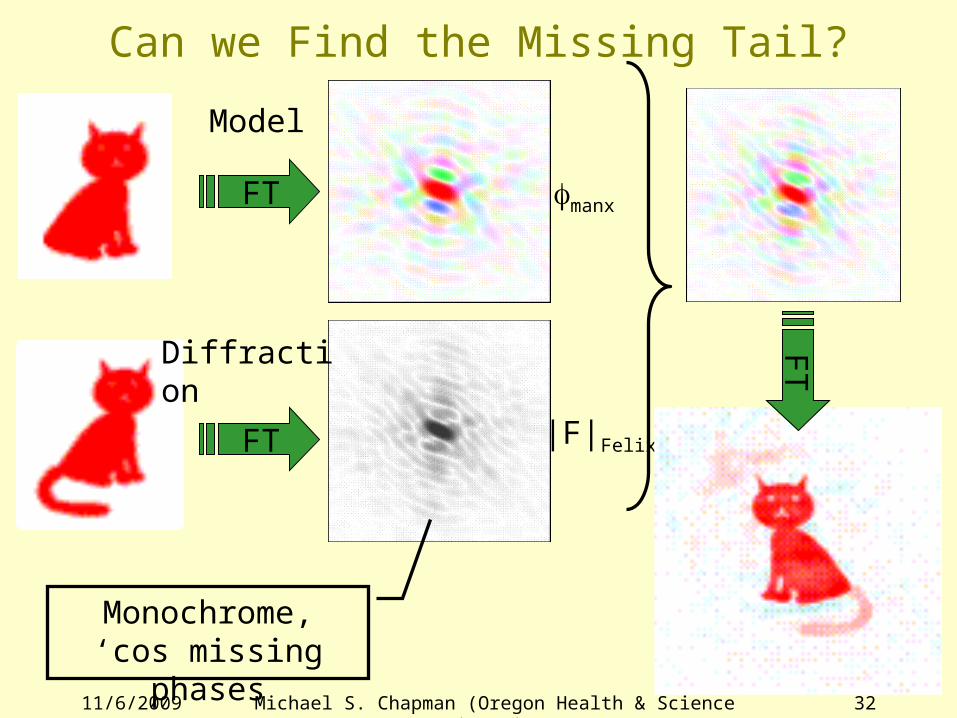
Can we Find the Missing Tail?
FT
FT fmanx
|F|Felix
FT
Monochrome, ‘cos missing phases
Model
Diffraction

Michael S. Chapman (Oregon Health & Science University)
3311/6/2009
Picky-picky – the tail is weaker Jensen showed that phases account for ½ of
mapBody should be twice as strong as tail
Body “in” |F| & f Tail only in f.
Solution – subtract ½ a body (Fourier) |FFelix| - ½|Fmanx|, fmanx = “2Fo – Fc”

Michael S. Chapman (Oregon Health & Science University)
3411/6/2009
Potential for Bias if Phasing Model Wrong Suppose we collected diffraction for a cat But thought that it was a duck…
FT
FT fduck
|F|Felix
FTModel
Diffraction
Model phases misleading image.Never know that really a cat.

Michael S. Chapman (Oregon Health & Science University)
3511/6/2009
Potential for Bias – or - Disaster…
Poor initial map incorrect modelSubsequent maps biased to incorrect model If you are lucky…
Does not refine well; Rfree remains high Indicates a potential problem
SomewhereMay be little indication of where the problem
is.Not so lucky examples:
Carboxypeptidase: Bill Lipscomb RuBisCO: Chapman…

Michael S. Chapman (Oregon Health & Science University)
3611/6/2009
RemediesDifference map: (|Fo| - |Fc|, fcalc)
Shows differences between: What the model should be What it currently is
Negative peaks where model shouldn’t be Positive peaks where should be more model Difficult to interpret when noisey
2Fo-Fc maps Only a minor improvement – still biased 2mFo – DFc maps – better (& fast)
Omit maps
Michael S. Chapman (Oregon Health & Science University)
3711/6/2009
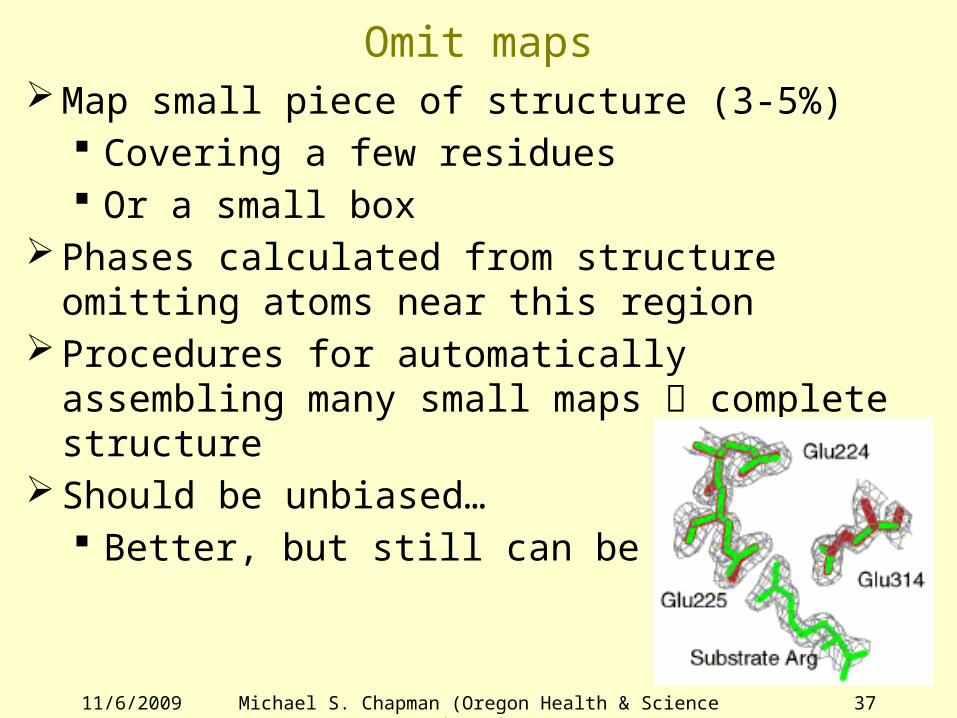
Omit mapsMap small piece of structure (3-5%)
Covering a few residues Or a small box
Phases calculated from structure omitting atoms near this region
Procedures for automatically assembling many small maps complete structure
Should be unbiased… Better, but still can be biased
Michael S. Chapman (Oregon Health & Science University)
3811/6/2009
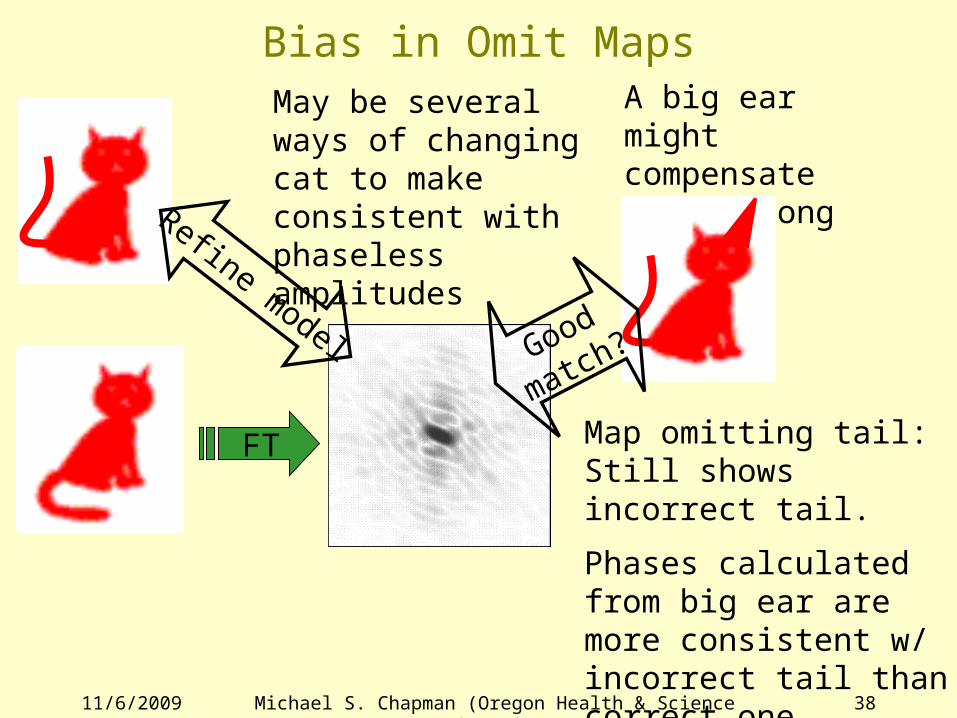
Bias in Omit Maps
FT
Refine model
May be several ways of changing cat to make consistent with phaseless amplitudes
A big ear might compensate for a wrong tail…
Good
match?
Map omitting tail:Still shows incorrect tail.
Phases calculated from big ear are more consistent w/ incorrect tail than correct one.
Michael S. Chapman (Oregon Health & Science University)
3911/6/2009
Mitigating Bias in Omit MapsProblem is combination of phasing with
Refinement against amplitudesSimulated-annealing omit maps
Undo (?) bias by refining phasing model w/o omit atoms
~100 refinements / cycle – very slow Best with Sigma-A weighting
Cycle local real-space model refinement w/ omit phase calculation Even more intensive
Big issue w/ structures worse than 2.7 Å Higher resolution becoming more common

MODEL QUALITY & VALIDATION
Part IV
11/6/2009 Michael S. Chapman (Oregon Health & Science University)
40

Michael S. Chapman (Oregon Health & Science University)
4111/6/2009
R-factors: Global Indicators of QualityR = Sh||Fo| - k|Fc|| / Sh|Fo|
k is scaling constant (function); h = Miller index
Expected values 0.59 (59%) - randomly placed atoms 0.30 – 0.50 – OK - for unrefined structure > 0.30 (refined) – incorrect structure 0.25 – 0.3 – 10-20% structure wrong 0.20 – 0.25 – a few problems
1 or 2 frame-shift errors… 0.15 – 0.20 – great model 0 – perfect model – never get there
Michael S. Chapman (Oregon Health & Science University)
4211/6/2009
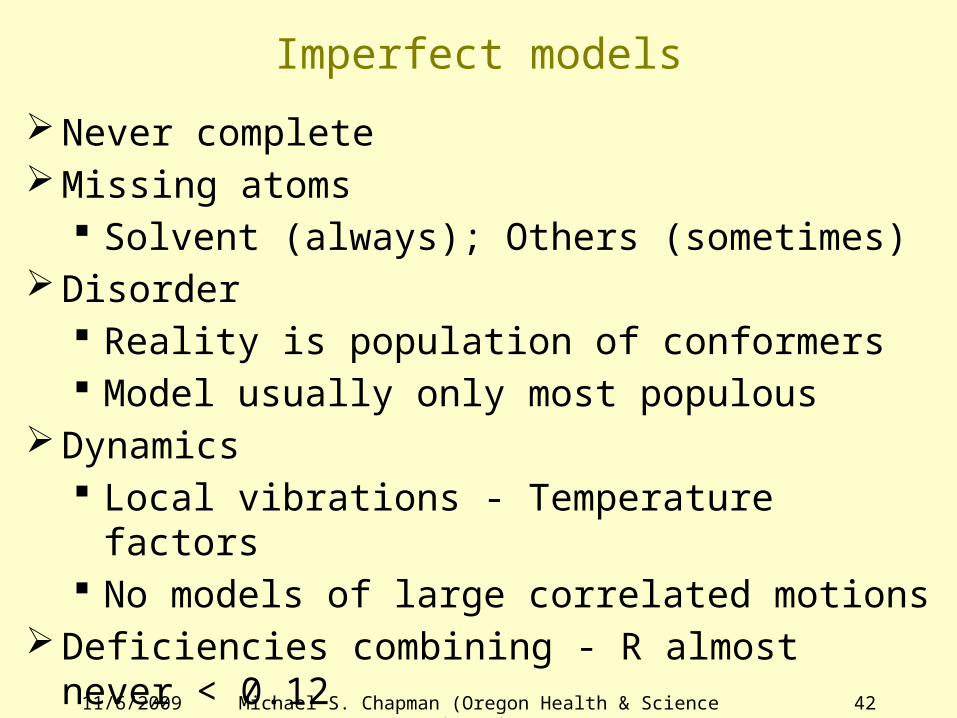
Imperfect models
Never completeMissing atoms
Solvent (always); Others (sometimes)Disorder
Reality is population of conformers Model usually only most populous
Dynamics Local vibrations - Temperature factors No models of large correlated motions
Deficiencies combining - R almost never < 0.12
Michael S. Chapman (Oregon Health & Science University)
4311/6/2009
Problems with R-factorsGlobal – no indication of where the error isBiased by over-fittingUnit-less – what is the Å error?
Michael S. Chapman (Oregon Health & Science University)
4411/6/2009
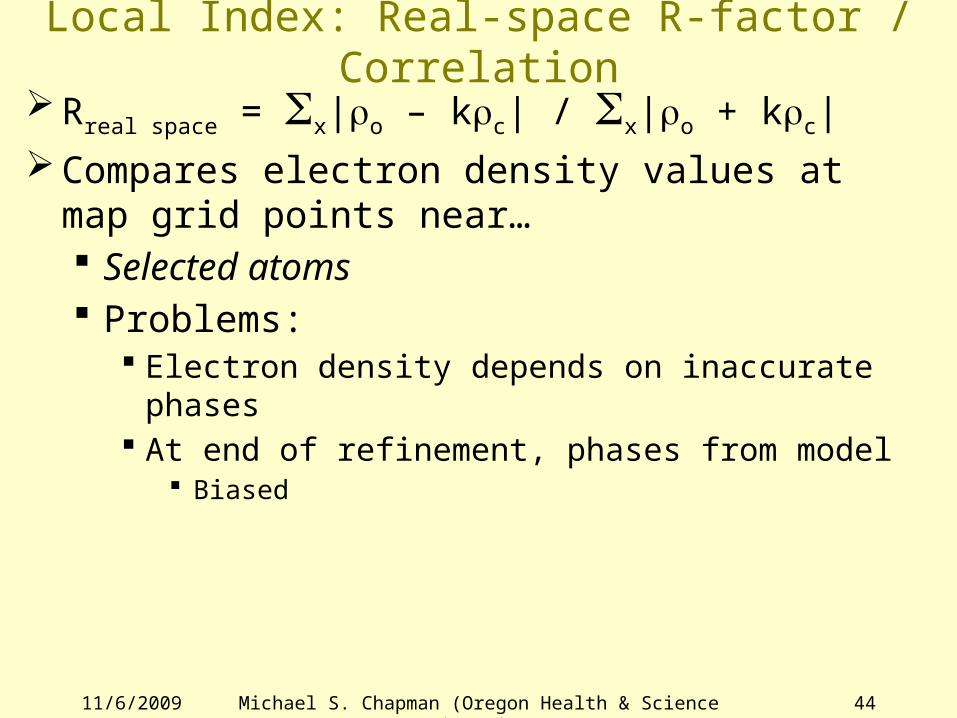
Local Index: Real-space R-factor / Correlation
Rreal space = Sx|ro – krc| / Sx|ro + krc|Compares electron density values at map grid
points near… Selected atoms Problems:
Electron density depends on inaccurate phases At end of refinement, phases from model
Biased

Michael S. Chapman (Oregon Health & Science University)
4511/6/2009
Local Index: Temperature Factors
B = 8 p2 <u2> <u2> is mean square displacement of
vibrationB also reflects model quality If atoms stuck in wrong place...
Poor agreement w/ diffraction data High B smears out the atom
Better agreement w/ diffractionB-values reflect quality, motion & static
disorder Subjective interpretation of which applies

Michael S. Chapman (Oregon Health & Science University)
4611/6/2009
Stereochemistry – indirect measure of quality
Protein refinement is “restrained” Simultaneously improving
Fit to diffraction Agreement with known stereochemistry
Often, when atoms are stuck in local minimum...
Improving fit balanced by deteriorating stereochemistry
Poor stereochemistry can be used to highlight problems

Michael S. Chapman (Oregon Health & Science University)
4711/6/2009
RMSDs – A global indicatorRoot mean square deviations
From expected geometryExpected RMSDs for a reasonable structure
Bond lengths < 0.02 Å Bond angles < 2.5º Peptide torsion angle w < 7º Side chain torsion angles c < 15º Non-bonded contacts < 0.1 Å
Michael S. Chapman (Oregon Health & Science University)
48
Bra
nden &
Tooze
© 1
99
9 G
arla
nd
11/6/2009
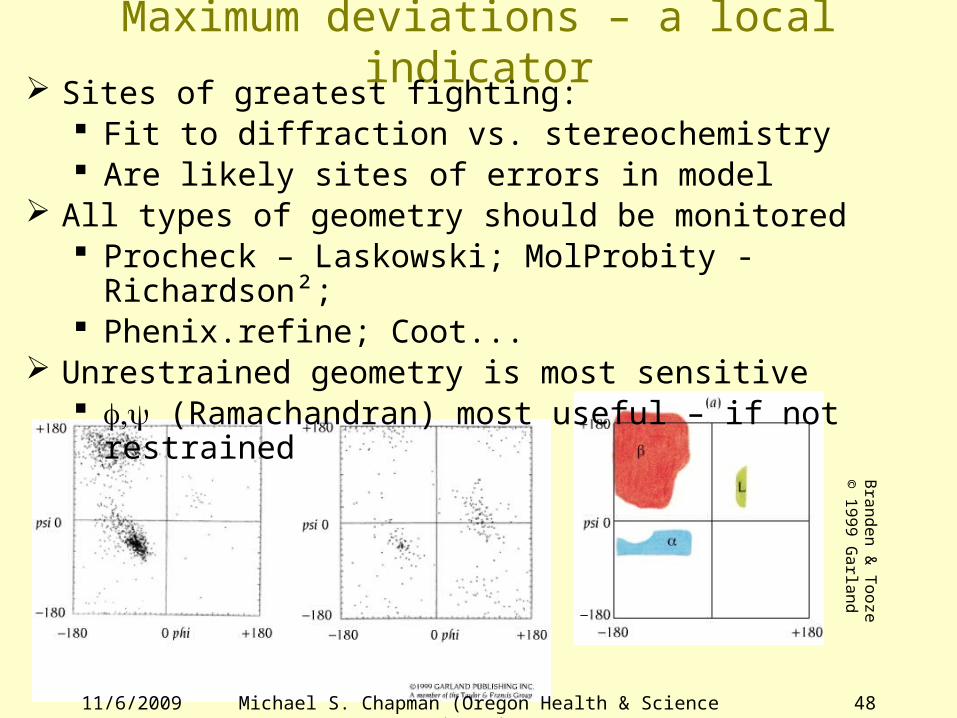
Maximum deviations – a local indicator Sites of greatest fighting:
Fit to diffraction vs. stereochemistry Are likely sites of errors in model
All types of geometry should be monitored Procheck – Laskowski; MolProbity - Richardson²; Phenix.refine; Coot...
Unrestrained geometry is most sensitive ,f y (Ramachandran) most useful – if not
restrained
Michael S. Chapman (Oregon Health & Science University)
4911/6/2009
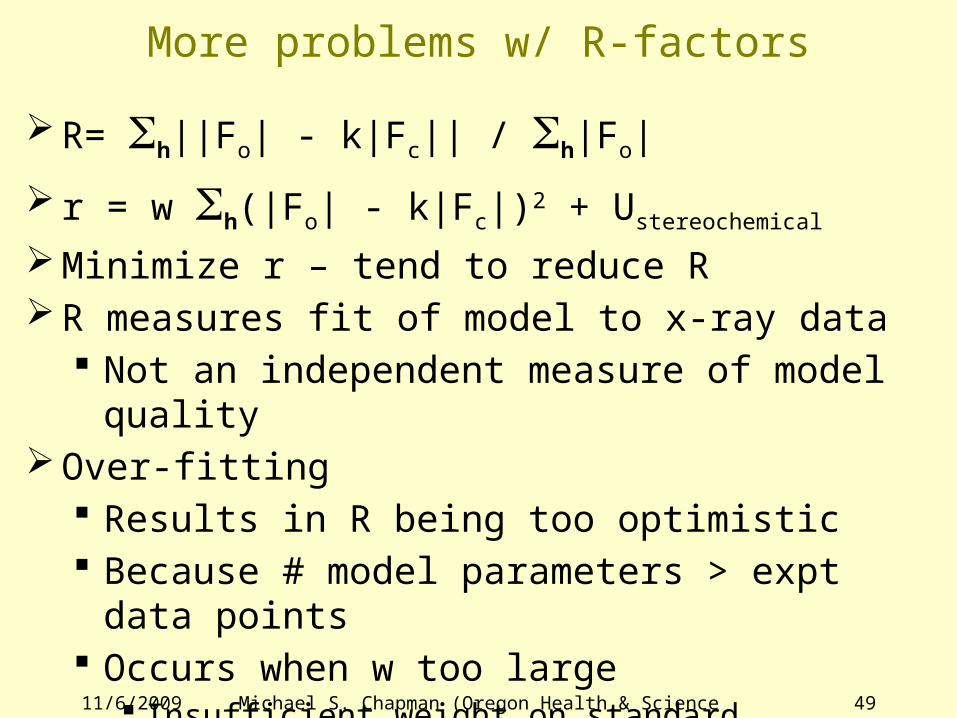
More problems w/ R-factors
R= Sh||Fo| - k|Fc|| / Sh|Fo|
r = w Sh(|Fo| - k|Fc|)2 + Ustereochemical Minimize r – tend to reduce RR measures fit of model to x-ray data
Not an independent measure of model quality
Over-fitting Results in R being too optimistic Because # model parameters > expt data
points Occurs when w too large
Insufficient weight on standard stereochemistry

Michael S. Chapman (Oregon Health & Science University)
5011/6/2009
R-factors – Measure Goodness of Fit
Simple analogy – fitting line to data…
R-factor could be used to quantify fit of line. Similar to coefficient
of regressionSum of distances:
Data to model “Model” is straight
line

Michael S. Chapman (Oregon Health & Science University)
5111/6/2009
Improving R (Goodness of Fit)
1) Improve the model (change
the line)
2) Make model more flexible:a) Add parameters:
y = ax + c y = ax²+ bx + c
b) Adding H2O, Bs etc.c) Relaxing stereochemistry
3) Discard dataEasier to fit, but worse
model

Michael S. Chapman (Oregon Health & Science University)
5211/6/2009
R-factor must be evaluated in context
How many data points for each parameter? Data points depend on inverse cube
resolution Can refine fewer parameters at low
resolutionWere the stereochemical restraints too
flexible? Rmsd bond lengths ~ 0.01 Å, angles 2.5°…
Tables of such parameters ,f y – Ramachandran plot

Michael S. Chapman (Oregon Health & Science University)
5311/6/2009
Cross-validated “free”-R-factorsSet aside 3-10% data
Selected randomly Never used in refinement
Only used to assess quality of model Calculate Rfree against only this data
Not refined, so independent of stereochemical restraints, # data etc..
Indicator of model quality. (1 to 5% Higher than conventional R-factor)Rfree < 30% means structure approx. correct
Michael S. Chapman (Oregon Health & Science University)
5411/6/2009
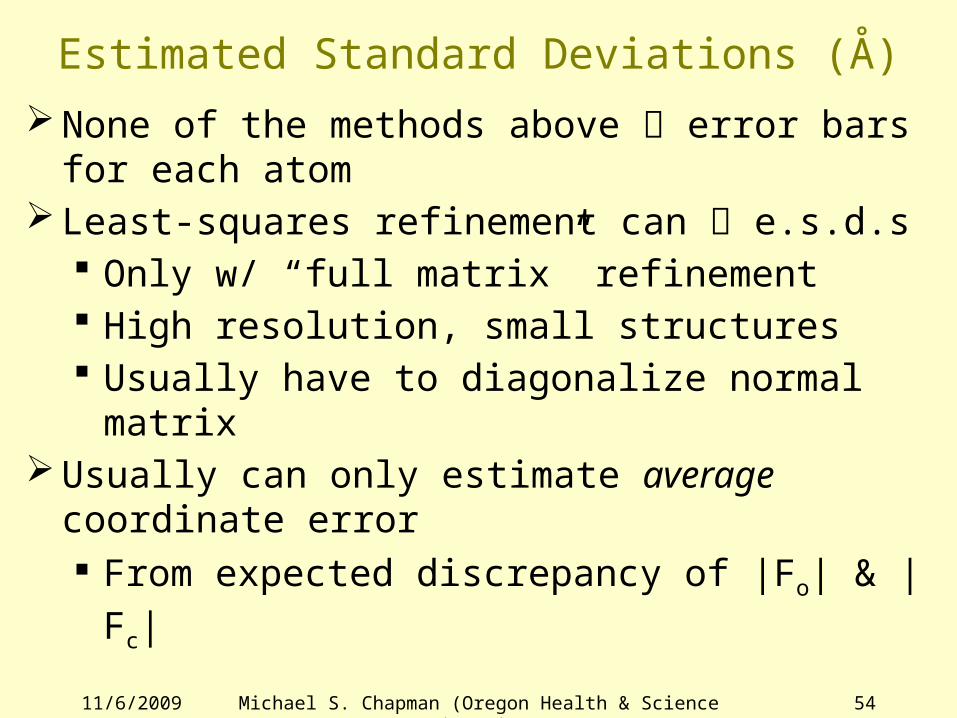
Estimated Standard Deviations (Å)
None of the methods above error bars for each atom
Least-squares refinement can e.s.d.s Only w/ “full matrix” refinement High resolution, small structures Usually have to diagonalize normal matrix
Usually can only estimate average coordinate error From expected discrepancy of |Fo| & |Fc|

Michael S. Chapman (Oregon Health & Science University)
5511/6/2009
Estimating overall error
Two related methods Luzzatti plot Sigma-A plot “sA”
Common principle Given coordinate error Dependence of ||Fo| - |Fc|| on resolution
Differences Luzzatti assumes errors only in position Sigma-A plot accounts for missing structure

Michael S. Chapman (Oregon Health & Science University)
5611/6/2009
Luzzatti Plots (1954) Calculate expected
R vs. resolution Read 1/2d =
sin /q l for resolution
Straight lines Plot R vs. resolution
for your structure Match at high
resolution Nearly linear –
hopefully Rfree better than R
Sigma-A plot conceptually similar
More complicated Usually similar estimates
0.3
0.2
0.1
R
0.1 0.2
sin /q l
<Dr> = 0.08Å<Dr> = 0.12Å
<Dr> = 0.16Å

Michael S. Chapman (Oregon Health & Science University)
5711/6/2009
Typical error levelsValues depend on
Quality of refinement Resolution of refinement
Values to hope for Refinement resolution <|Dr|2> 3 Å 0.5 Å 2 Å 0.2 Å Better than 1 Å 0.05 Å
Michael S. Chapman (Oregon Health & Science University)
5811/6/2009
Conclusion – topics for another day...
Intelligent analysis of structure / function Appreciation for the limitations in structures
Crystallographic methods for complexesMethods for physical / chemical propertiesBiological inferences
Conservation of structure & functionExtrapolations
Energy minimization & Docking Dynamics
Prediction of Function & Mechanism