models – plotting the course in uncharted waters · models – plotting the course in uncharted...
TRANSCRIPT
MODELS–PLOTTINGTHECOURSEINUNCHARTEDWATERS
EcologicalmodelstosupportbeCermanagementandpolicyimplementaFon
Chair:ChrisFanWilson,OceanDTM
DEVOTESFinalConference,17–19October2016,Brussels
PRESENTORSINBLOCK3(14:00–15:15)LauraUusitalo(SYKEFinnishEnvironmentInsFtute)Next:GuillemChust,AZTIChristopherLynam(Cefas)ChristopherLynam(Cefas)
BiologicalconnecFvityatgeneFcandcommunitylevelsAuthors:GuillemChust,ErnestoVillarino,AnneChenuil,XabierIrigoien,NihayetBizsel,AntonioBode,CecilieBroms,SimonClaus,MaríaL.FernándezdePuelles,SerenaFonda-Umani,GaliceHoarau,MariaG.Mazzocchi,PatricijaMozeFč,LeenVandepiCe,HelenaVeríssimo,SoultanaZervoudaki,AngelBorjaLeader:AZTI,Partners:CNRS,PML,HCMR,MHI-NASU,DEU,CONISMA
DEVOTESFinalconference,17-19Oct2016,Brussels
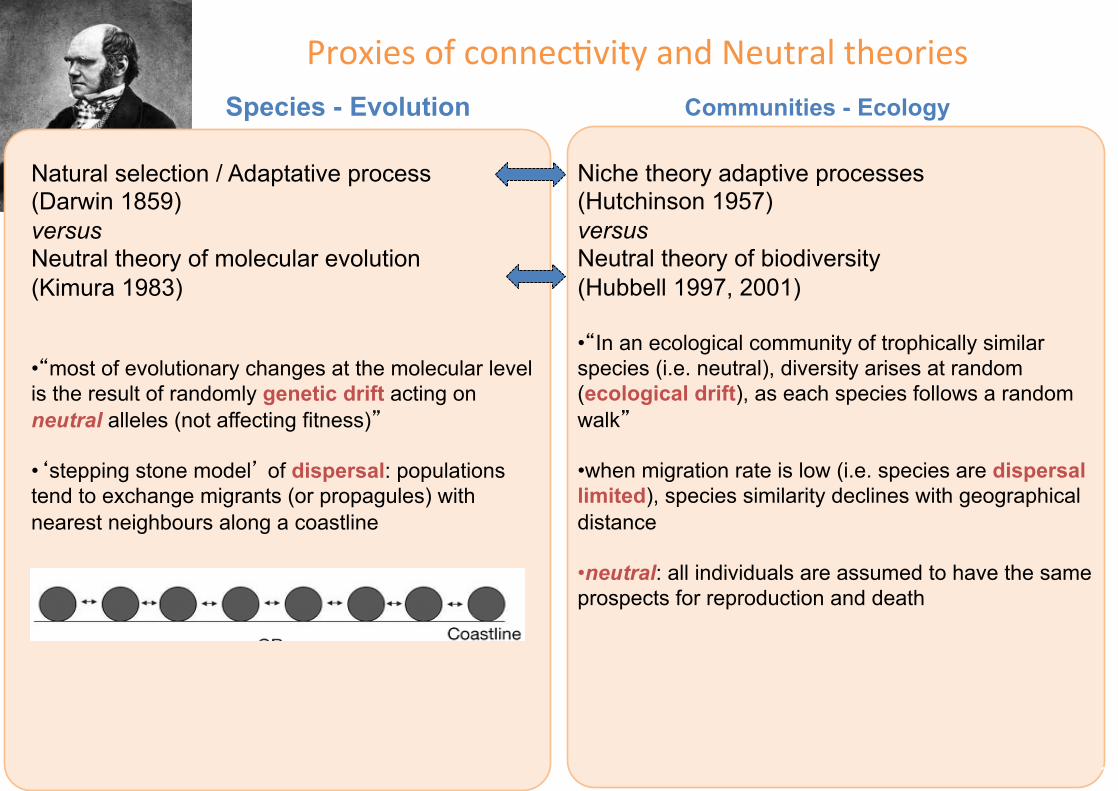
ProxiesofconnecFvityandNeutraltheories
Natural selection / Adaptative process (Darwin 1859) versus Neutral theory of molecular evolution (Kimura 1983)
• “most of evolutionary changes at the molecular level is the result of randomly genetic drift acting on neutral alleles (not affecting fitness)”
• ‘stepping stone model’ of dispersal: populations tend to exchange migrants (or propagules) with nearest neighbours along a coastline
Species - Evolution
Niche theory adaptive processes (Hutchinson 1957) versus Neutral theory of biodiversity (Hubbell 1997, 2001) • “In an ecological community of trophically similar species (i.e. neutral), diversity arises at random (ecological drift), as each species follows a random walk”
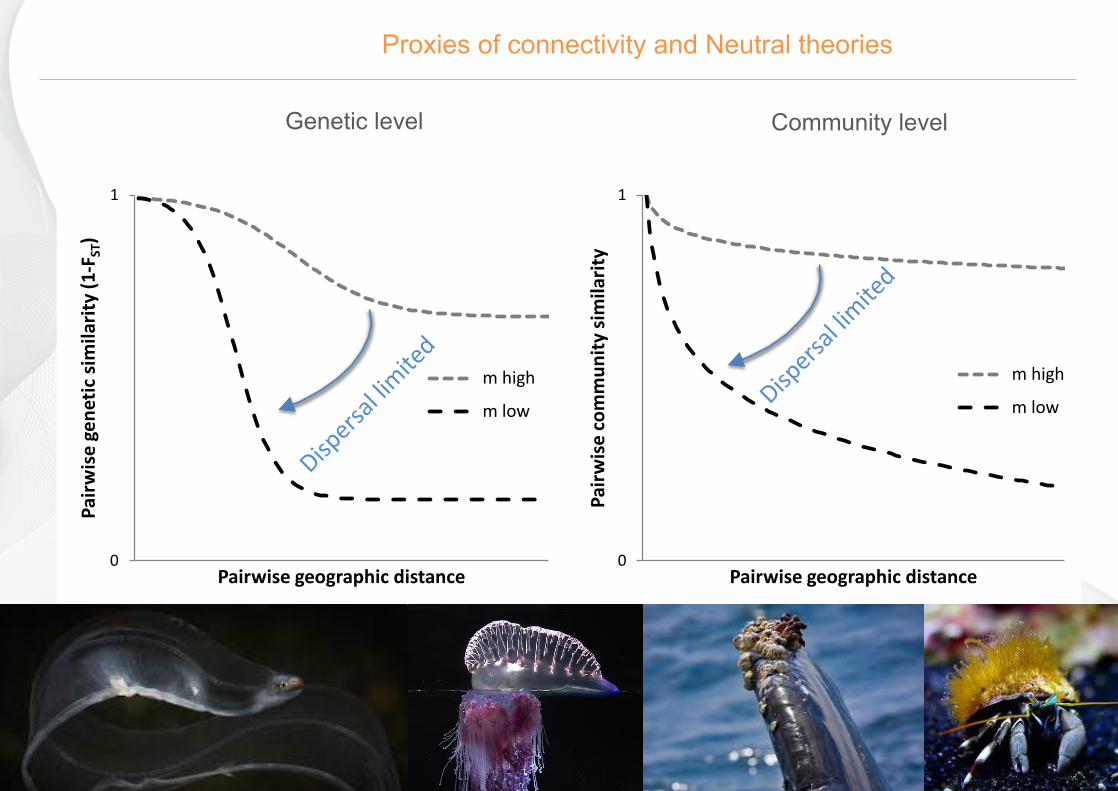
• when migration rate is low (i.e. species are dispersal limited), species similarity declines with geographical distance
• neutral: all individuals are assumed to have the same prospects for reproduction and death
Communities - Ecology
3
www.azti.es 22/10/16
Genetic level
4
0
1
Pairw
isecommun
itysimilarity
Pairwisegeographicdistance
mhigh
mlow
0
1
Pairw
isegene
ticsimilarity(1-F
ST)
Pairwisegeographicdistance
mhigh
mlow
Community level
Proxies of connectivity and Neutral theories
www.azti.es 22/10/16
Aim:Tocomparecommunity-basedanalysiswithpopula:ongene:canalysisin3differentgroupsacrossregional(European)seas[Task4.3.5]:• Phytoplankton• Zooplankton• BenthicMacroinvertebrates(Sok-boCom)Hypothesis:planktonspecieshaveahigherdispersaldistancecomparedtobenthicmacroinvertebratespeciesatthetwolevelsoforganizaFon,basedupontheconstraintsinmovementwithinthebenthichabitatwithashortplanktoniclarvalphaseofmacroinvertebratesRa$onale:toproposevulnerabilityindicatorsbasedonconnec$vityproxies
5
Modelling of marine connectivity and biodiversity across regional seas
www.azti.es 22/10/16 6
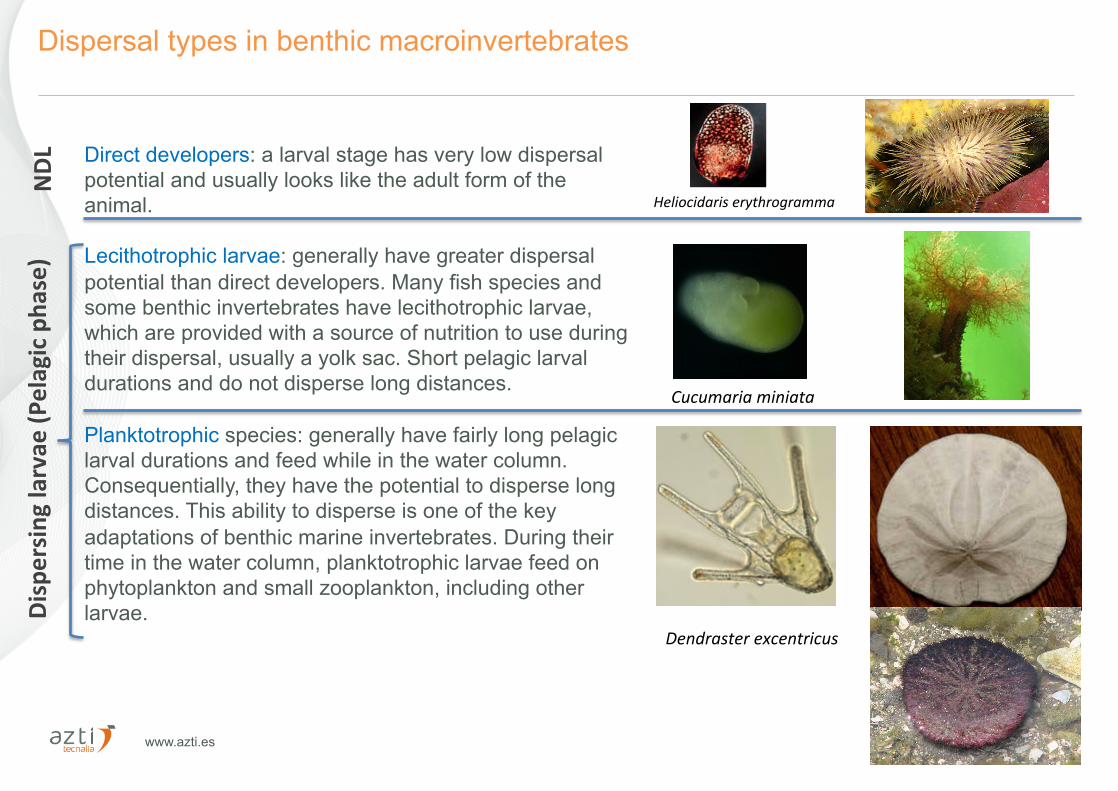
Dispersal types in benthic macroinvertebrates
Direct developers: a larval stage has very low dispersal potential and usually looks like the adult form of the animal. Lecithotrophic larvae: generally have greater dispersal potential than direct developers. Many fish species and some benthic invertebrates have lecithotrophic larvae, which are provided with a source of nutrition to use during their dispersal, usually a yolk sac. Short pelagic larval durations and do not disperse long distances. Planktotrophic species: generally have fairly long pelagic larval durations and feed while in the water column. Consequentially, they have the potential to disperse long distances. This ability to disperse is one of the key adaptations of benthic marine invertebrates. During their time in the water column, planktotrophic larvae feed on phytoplankton and small zooplankton, including other larvae.
Dendrasterexcentricus
Cucumariaminiata
Heliocidariserythrogramma
Dispe
rsinglarvae(P
elagicpha
se)
NDL
www.azti.es 22/10/16 7
Community analysis
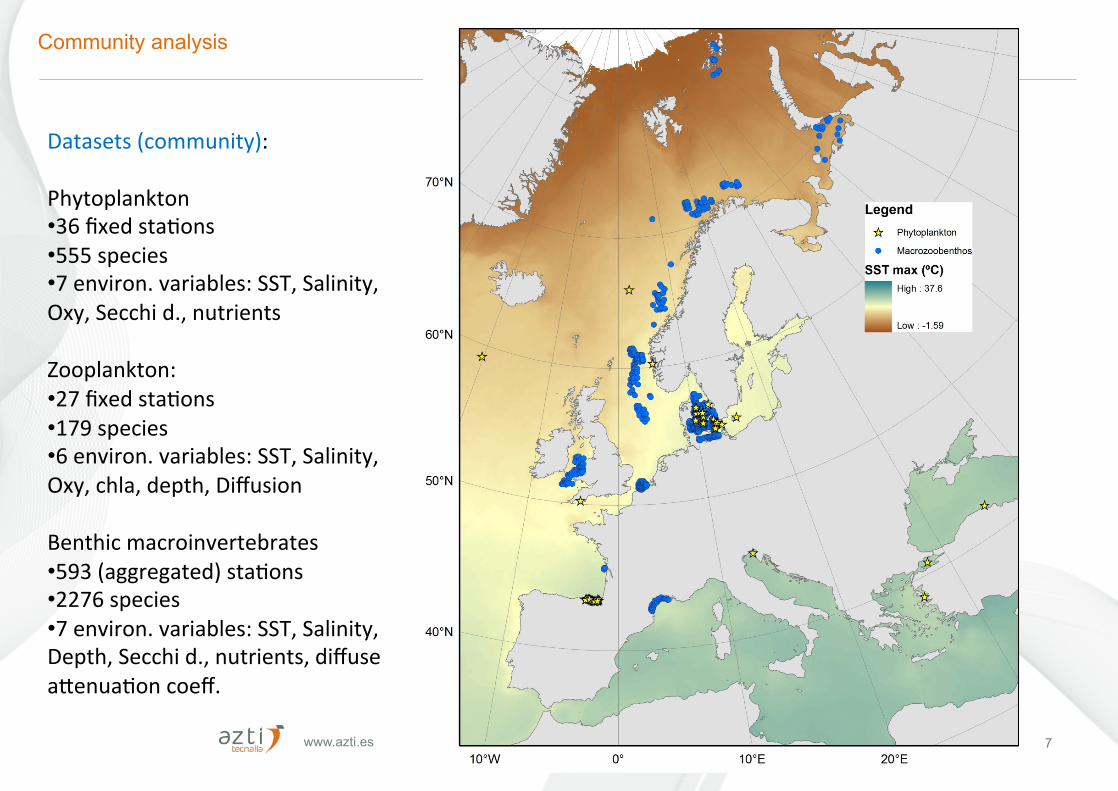
Datasets(community):Phytoplankton• 36fixedstaFons• 555species• 7environ.variables:SST,Salinity,Oxy,Secchid.,nutrientsZooplankton:• 27fixedstaFons• 179species• 6environ.variables:SST,Salinity,Oxy,chla,depth,Diffusion
Benthicmacroinvertebrates• 593(aggregated)staFons• 2276species• 7environ.variables:SST,Salinity,Depth,Secchid.,nutrients,diffuseaCenuaFoncoeff.
www.azti.es 22/10/16
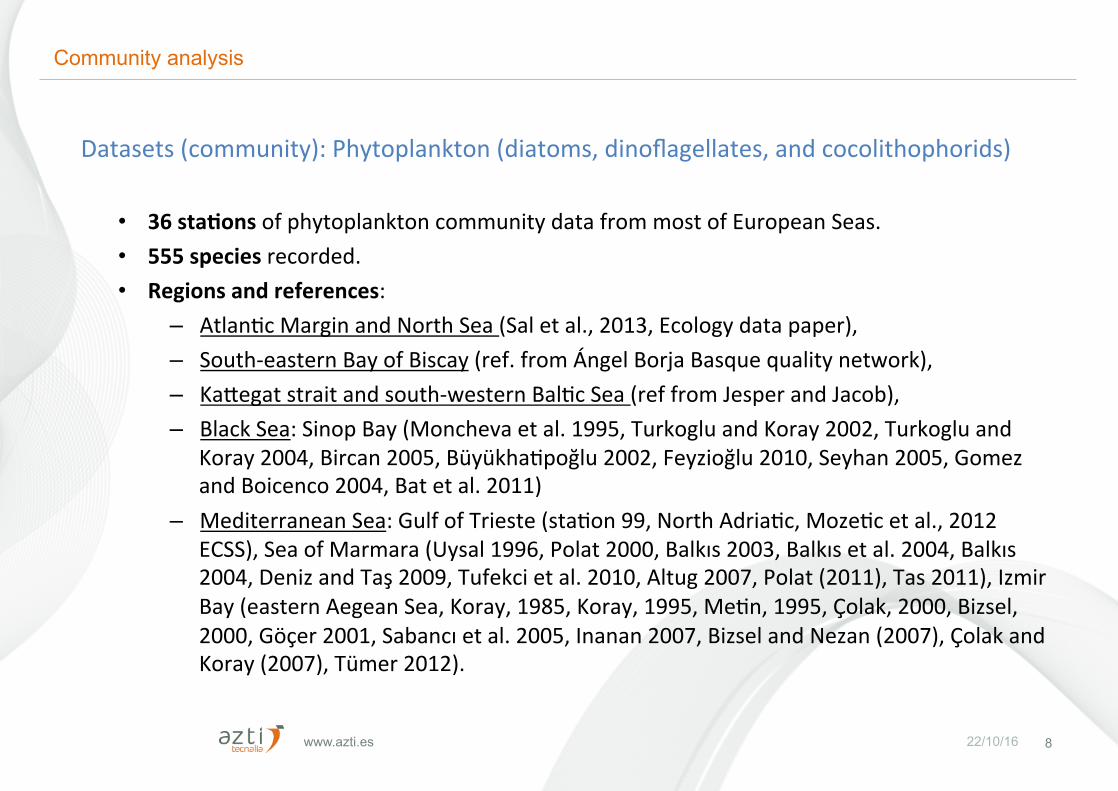
Datasets(community):Phytoplankton(diatoms,dinoflagellates,andcocolithophorids)
• 36sta:onsofphytoplanktoncommunitydatafrommostofEuropeanSeas.• 555speciesrecorded.• Regionsandreferences:
– AtlanFcMarginandNorthSea(Saletal.,2013,Ecologydatapaper),– South-easternBayofBiscay(ref.fromÁngelBorjaBasquequalitynetwork),– KaCegatstraitandsouth-westernBalFcSea(reffromJesperandJacob),– BlackSea:SinopBay(Monchevaetal.1995,TurkogluandKoray2002,Turkogluand
Koray2004,Bircan2005,BüyükhaFpoğlu2002,Feyzioğlu2010,Seyhan2005,GomezandBoicenco2004,Batetal.2011)
– MediterraneanSea:GulfofTrieste(staFon99,NorthAdriaFc,MozeFcetal.,2012ECSS),SeaofMarmara(Uysal1996,Polat2000,Balkıs2003,Balkısetal.2004,Balkıs2004,DenizandTaş2009,Tufekcietal.2010,Altug2007,Polat(2011),Tas2011),IzmirBay(easternAegeanSea,Koray,1985,Koray,1995,MeFn,1995,Çolak,2000,Bizsel,2000,Göçer2001,Sabancıetal.2005,Inanan2007,BizselandNezan(2007),ÇolakandKoray(2007),Tümer2012).
8
Community analysis
www.azti.es 22/10/16
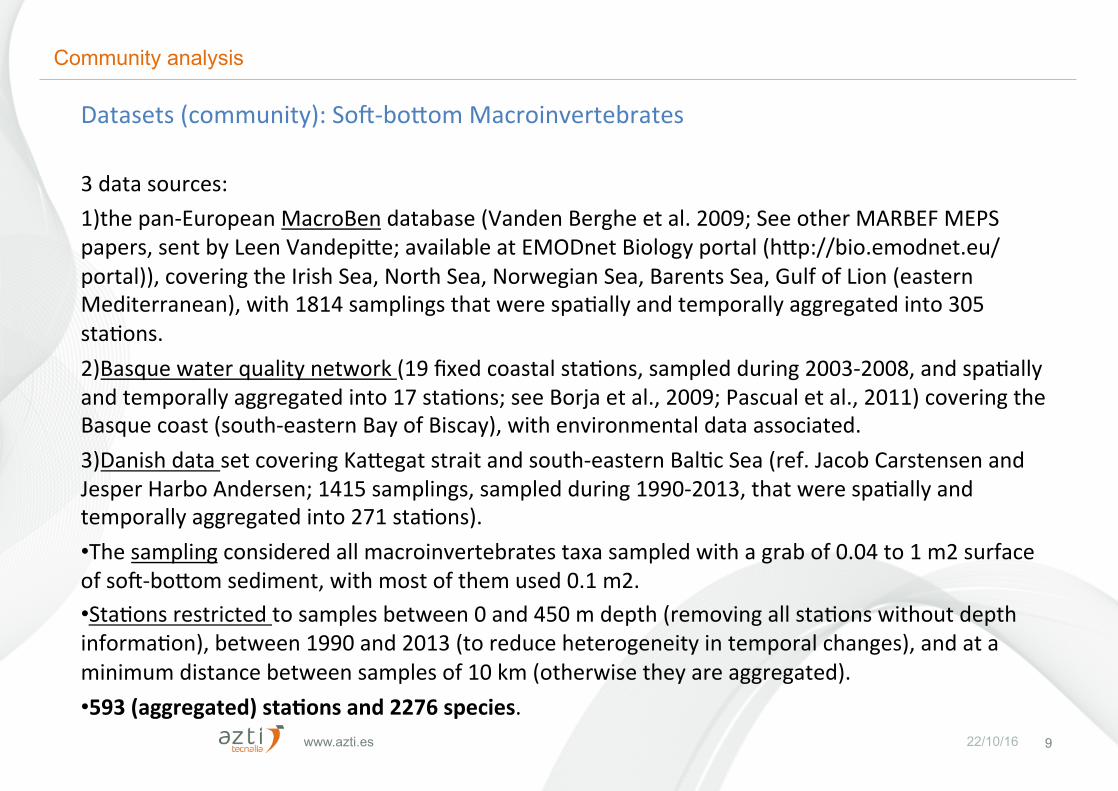
Datasets(community):Sok-boComMacroinvertebrates3datasources:1) thepan-EuropeanMacroBendatabase(VandenBergheetal.2009;SeeotherMARBEFMEPSpapers,sentbyLeenVandepiCe;availableatEMODnetBiologyportal(hCp://bio.emodnet.eu/portal)),coveringtheIrishSea,NorthSea,NorwegianSea,BarentsSea,GulfofLion(easternMediterranean),with1814samplingsthatwerespaFallyandtemporallyaggregatedinto305staFons.2) Basquewaterqualitynetwork(19fixedcoastalstaFons,sampledduring2003-2008,andspaFallyandtemporallyaggregatedinto17staFons;seeBorjaetal.,2009;Pascualetal.,2011)coveringtheBasquecoast(south-easternBayofBiscay),withenvironmentaldataassociated.3) DanishdatasetcoveringKaCegatstraitandsouth-easternBalFcSea(ref.JacobCarstensenandJesperHarboAndersen;1415samplings,sampledduring1990-2013,thatwerespaFallyandtemporallyaggregatedinto271staFons).• Thesamplingconsideredallmacroinvertebratestaxasampledwithagrabof0.04to1m2surfaceofsok-boComsediment,withmostofthemused0.1m2.• StaFonsrestrictedtosamplesbetween0and450mdepth(removingallstaFonswithoutdepthinformaFon),between1990and2013(toreduceheterogeneityintemporalchanges),andataminimumdistancebetweensamplesof10km(otherwisetheyareaggregated).• 593(aggregated)sta:onsand2276species.
9
Community analysis
www.azti.es 22/10/16 10
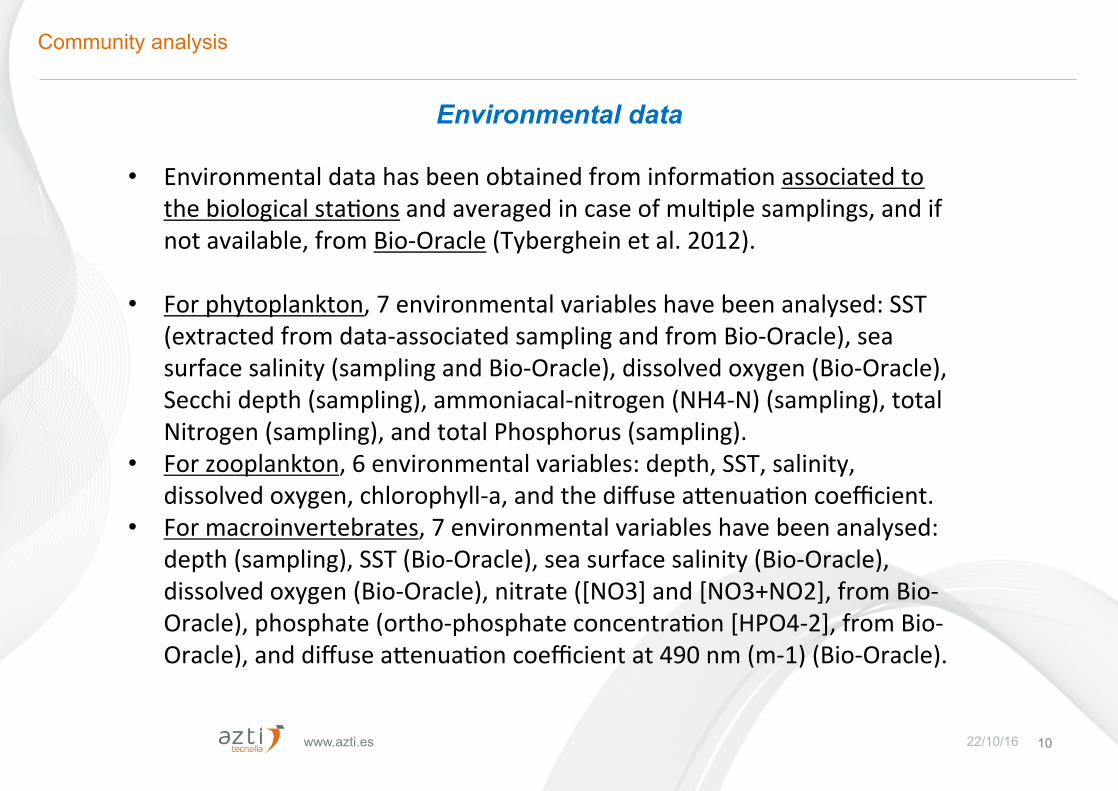
• EnvironmentaldatahasbeenobtainedfrominformaFonassociatedtothebiologicalstaFonsandaveragedincaseofmulFplesamplings,andifnotavailable,fromBio-Oracle(Tybergheinetal.2012).
• Forphytoplankton,7environmentalvariableshavebeenanalysed:SST(extractedfromdata-associatedsamplingandfromBio-Oracle),seasurfacesalinity(samplingandBio-Oracle),dissolvedoxygen(Bio-Oracle),Secchidepth(sampling),ammoniacal-nitrogen(NH4-N)(sampling),totalNitrogen(sampling),andtotalPhosphorus(sampling).
• Forzooplankton,6environmentalvariables:depth,SST,salinity,dissolvedoxygen,chlorophyll-a,andthediffuseaCenuaFoncoefficient.
• Formacroinvertebrates,7environmentalvariableshavebeenanalysed:depth(sampling),SST(Bio-Oracle),seasurfacesalinity(Bio-Oracle),dissolvedoxygen(Bio-Oracle),nitrate([NO3]and[NO3+NO2],fromBio-Oracle),phosphate(ortho-phosphateconcentraFon[HPO4-2],fromBio-Oracle),anddiffuseaCenuaFoncoefficientat490nm(m-1)(Bio-Oracle).
Environmental data
Community analysis
Distanceindices
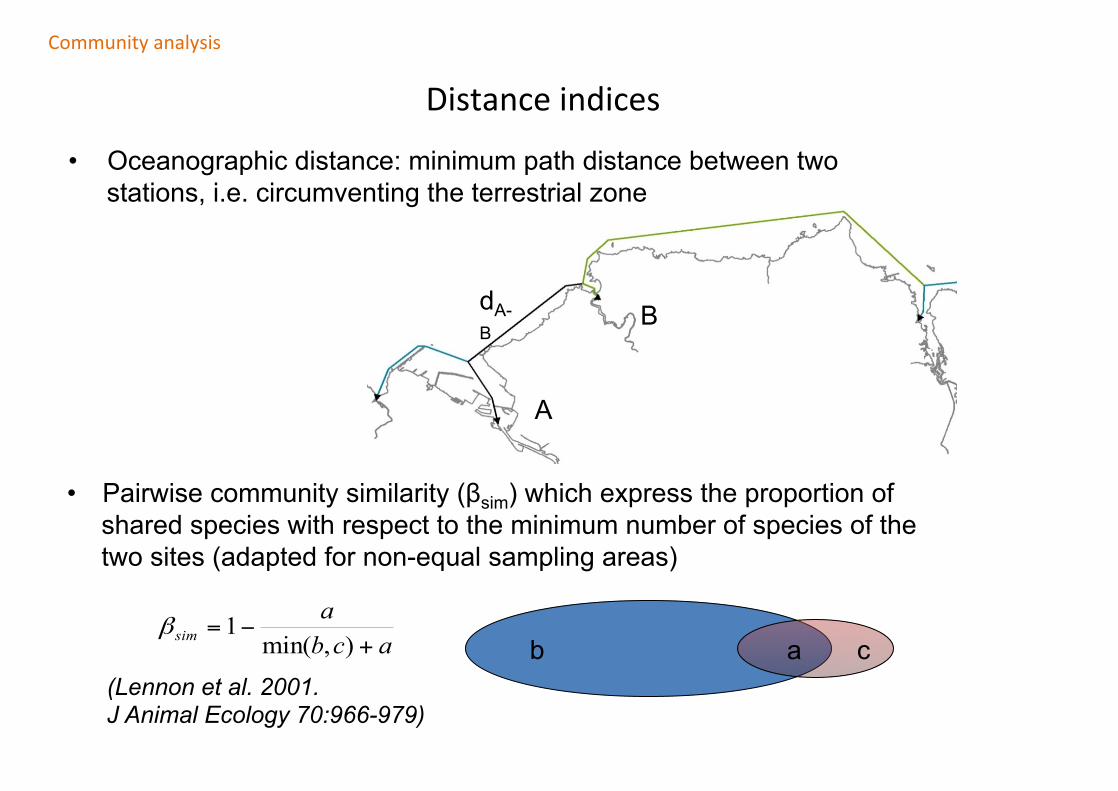
• Oceanographic distance: minimum path distance between two stations, i.e. circumventing the terrestrial zone
A
BdA-B
• Pairwise community similarity (βsim) which express the proportion of shared species with respect to the minimum number of species of the two sites (adapted for non-equal sampling areas)
b c a acba
sim +−=
),min(1β
(Lennon et al. 2001. J Animal Ecology 70:966-979)
Communityanalysis
12
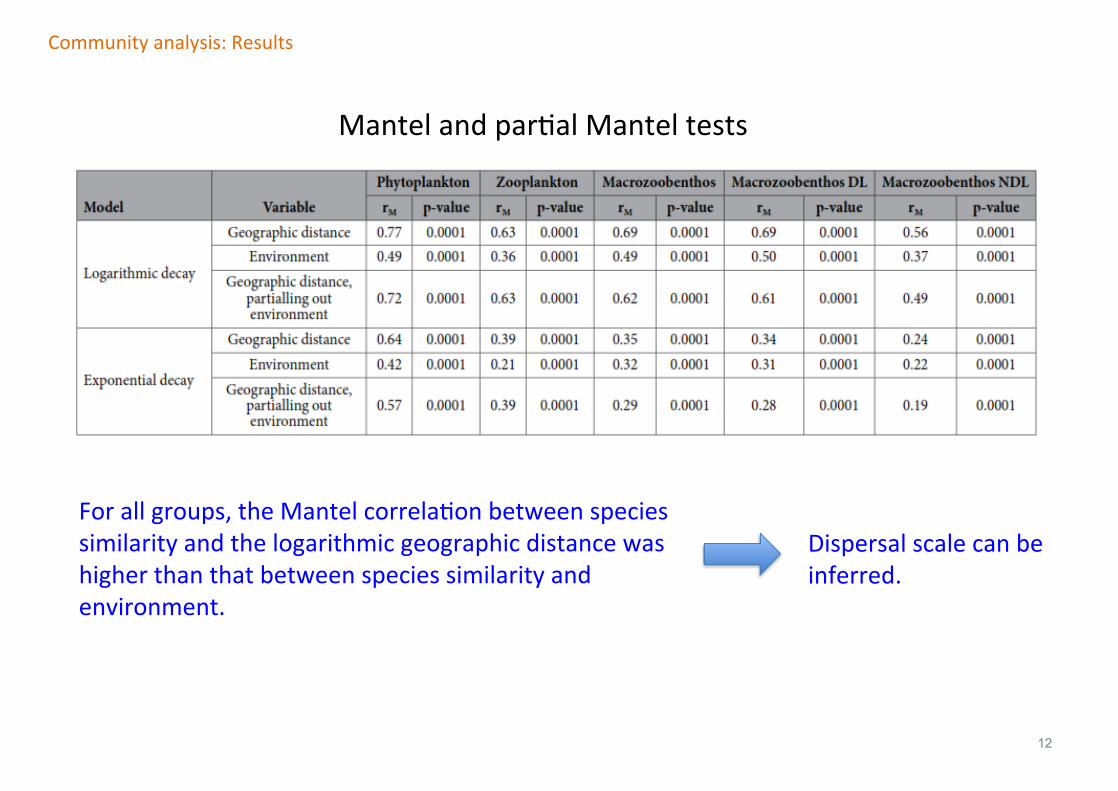
Forallgroups,theMantelcorrelaFonbetweenspeciessimilarityandthelogarithmicgeographicdistancewashigherthanthatbetweenspeciessimilarityandenvironment.
Communityanalysis:Results
MantelandparFalManteltests
Dispersalscalecanbeinferred.

www.azti.es 22/10/16
Definition: similarity is half its initial value
13
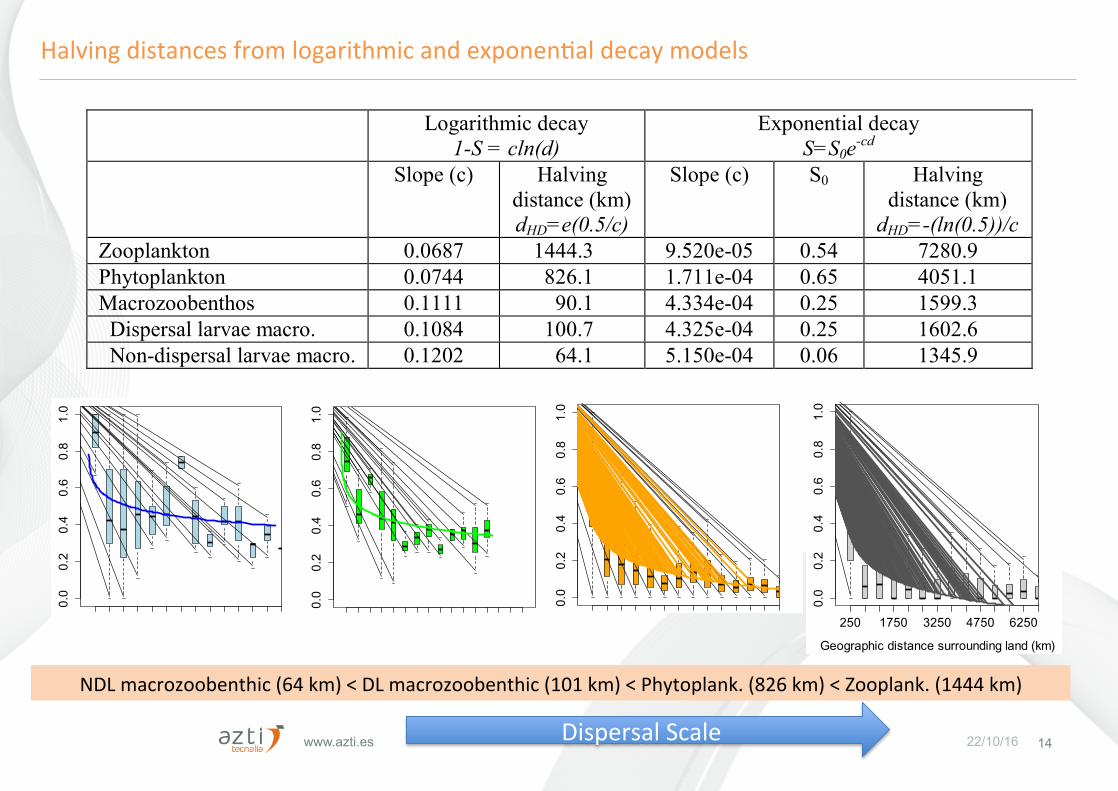
Halving distance as surrogates of dispersal scale
Soininenetal.2007Ecography
Logarithmicdecaymodel,1-S=cln(d)
whereSissimilarityatdistanced,cistherateofdistancedecay,assumingS=1whend=0;
thecorrespondinghalvingdistance,atwhichthesimilarityishalfitsiniFalvalue,is
dH=e0.5/c
www.azti.es 22/10/16 14
Logarithmic decay 1-S = cln(d)
Exponential decay S=S0e-cd
Slope (c) Halving distance (km) dHD=e(0.5/c)
Slope (c) S0 Halving distance (km)
dHD=-(ln(0.5))/c Zooplankton 0.0687 1444.3 9.520e-05 0.54 7280.9 Phytoplankton 0.0744 826.1 1.711e-04 0.65 4051.1 Macrozoobenthos 0.1111 90.1 4.334e-04 0.25 1599.3 Dispersal larvae macro. 0.1084 100.7 4.325e-04 0.25 1602.6 Non-dispersal larvae macro. 0.1202 64.1 5.150e-04 0.06 1345.9 1
HalvingdistancesfromlogarithmicandexponenFaldecaymodels
250 1750 3250 4750 6250
0.0
0.2
0.4
0.6
0.8
1.0
Geographic distance surrounding land (km)
Com
mun
ity s
imila
rity
(Bet
a-si
m)
250 1750 3750 5750 7750
0.0
0.2
0.4
0.6
0.8
1.0
Geographic distance surrounding land (km)
Com
mun
ity s
imila
rity
(Bet
a-si
m)
250 1750 3250 4750 6250
0.0
0.2
0.4
0.6
0.8
1.0
Geographic distance surrounding land (km)
Com
mun
ity s
imila
rity
(Bet
a-si
m)
250 1750 3250 4750 6250
0.0
0.2
0.4
0.6
0.8
1.0
Geographic distance surrounding land (km)
Com
mun
ity s
imila
rity
(Bet
a-si
m)
NDLmacrozoobenthic(64km)<DLmacrozoobenthic(101km)<Phytoplank.(826km)<Zooplank.(1444km)
DispersalScale
www.azti.es 22/10/16
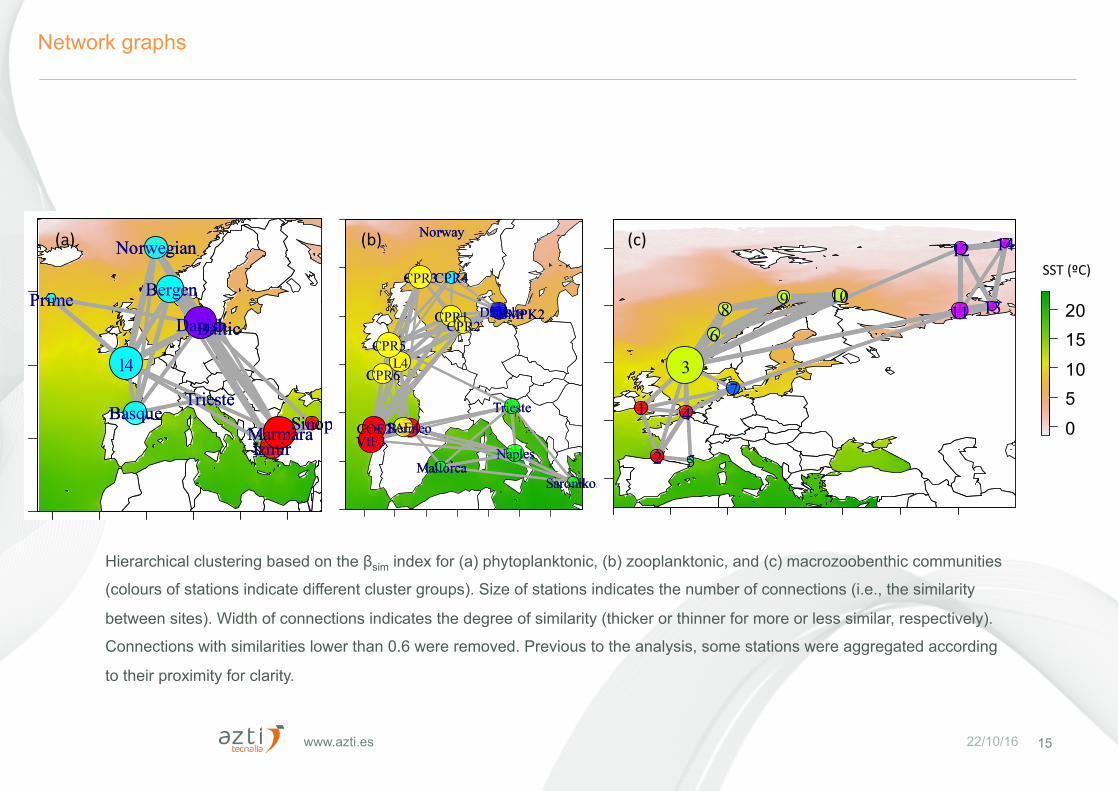
Network graphs
15
Hierarchical clustering based on the βsim index for (a) phytoplanktonic, (b) zooplanktonic, and (c) macrozoobenthic communities
(colours of stations indicate different cluster groups). Size of stations indicates the number of connections (i.e., the similarity
between sites). Width of connections indicates the degree of similarity (thicker or thinner for more or less similar, respectively).
Connections with similarities lower than 0.6 were removed. Previous to the analysis, some stations were aggregated according
to their proximity for clarity.
1-20 -10 0 10 20 30
3040
5060
0510152025
IzmirMarmaraSinop
TriesteBasque
DanishBaltic
Bergen
l4
Norwegian
Prime
IzmirMarmaraSinop
TriesteBasque
DanishBaltic
Bergen
l4
Norwegian
Prime
-10 -5 0 5 10 15 20
3540
4550
5560
65
5
10
15
20
BermeoCOE2VIE3
SAE4
L4
Trieste
Mallorca
CPR1CPR2
CPR3CPR4
CPR5
CPR6
Naples
Saronikos
DanishBMPK2
Norway
BermeoCOE2VIE3
SAE4
L4
Trieste
Mallorca
CPR1CPR2
CPR3CPR4
CPR5
CPR6
Naples
Saronikos
DanishBMPK2
Norway
-10 0 10 20 30 40 50
4050
6070
80
0
510
1520
1
2
3
4
5
6
7
8 9 1011
12
13
14
1
2
3
4
5
6
7
8 9 1011
12
13
14(a) (b) (c)
SST(ºC)
www.azti.es 22/10/16
Datasets(PopulaFongeneFcs):• Meta-analysesusingdatafrompapersinrelaFontoDispersalesFmatesandIBDstaFsFcs(IBDslope:Fst/km,seeKinlanandGaines2003)
• CollaboraFonswithUniversityofNordland,…Meta-analysis:• Macroinvertebratesandplanktondatafrom148papers• 36studiesforzooplankton(addressing22species,6withIBDslopesig.)• 8studiesforphytoplankton(13speciesanalysed,3withIBDslopesig.)• 104studiesforbenthicmacroinvertebrates(addressing77species,65withIBDslopesig.)
• 397pairwiseobservaFons(FSTvsgeographicdistance)forphytoplankton,• 1952pairwiseobservaFonsforzooplankton,• 1423pairwiseobservaFonsformacrobenthos
16
Genetic Meta-analysis
www.azti.es 22/10/16 17
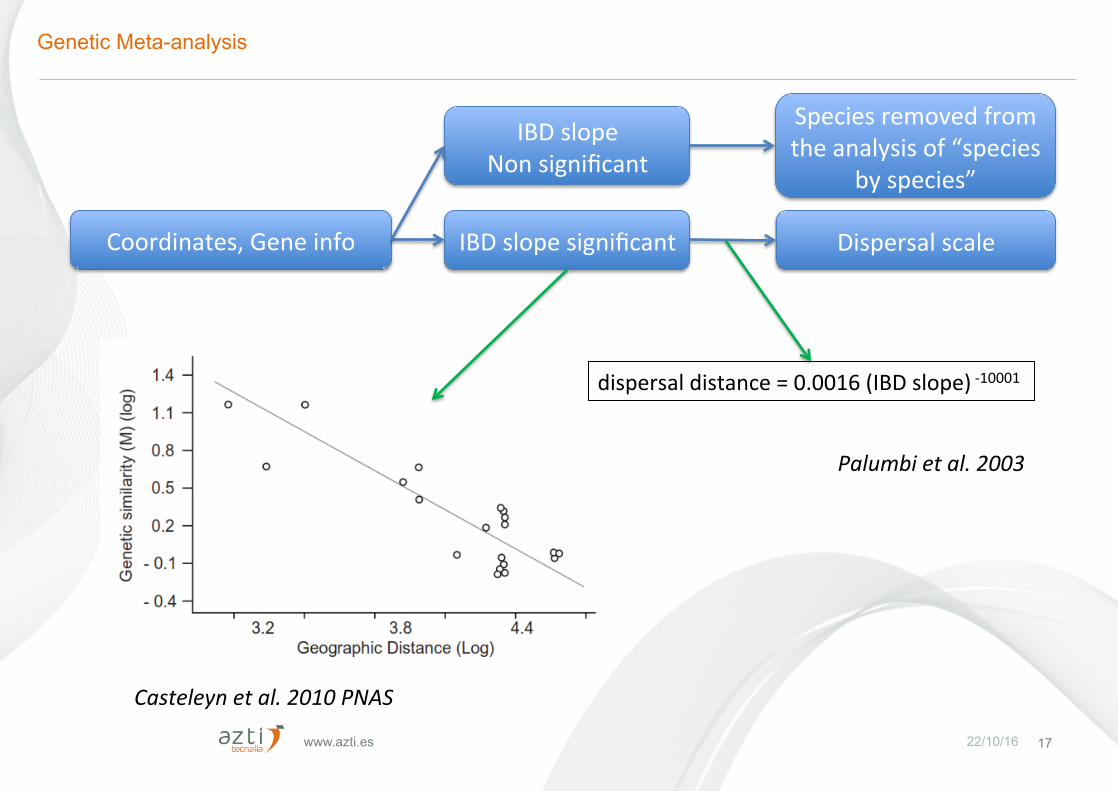
Coordinates,Geneinfo IBDslopesignificant Dispersalscale
Casteleynetal.2010PNAS
dispersaldistance=0.0016(IBDslope)-10001
IBDslopeNonsignificant
Speciesremovedfromtheanalysisof“species
byspecies”
Palumbietal.2003
Genetic Meta-analysis
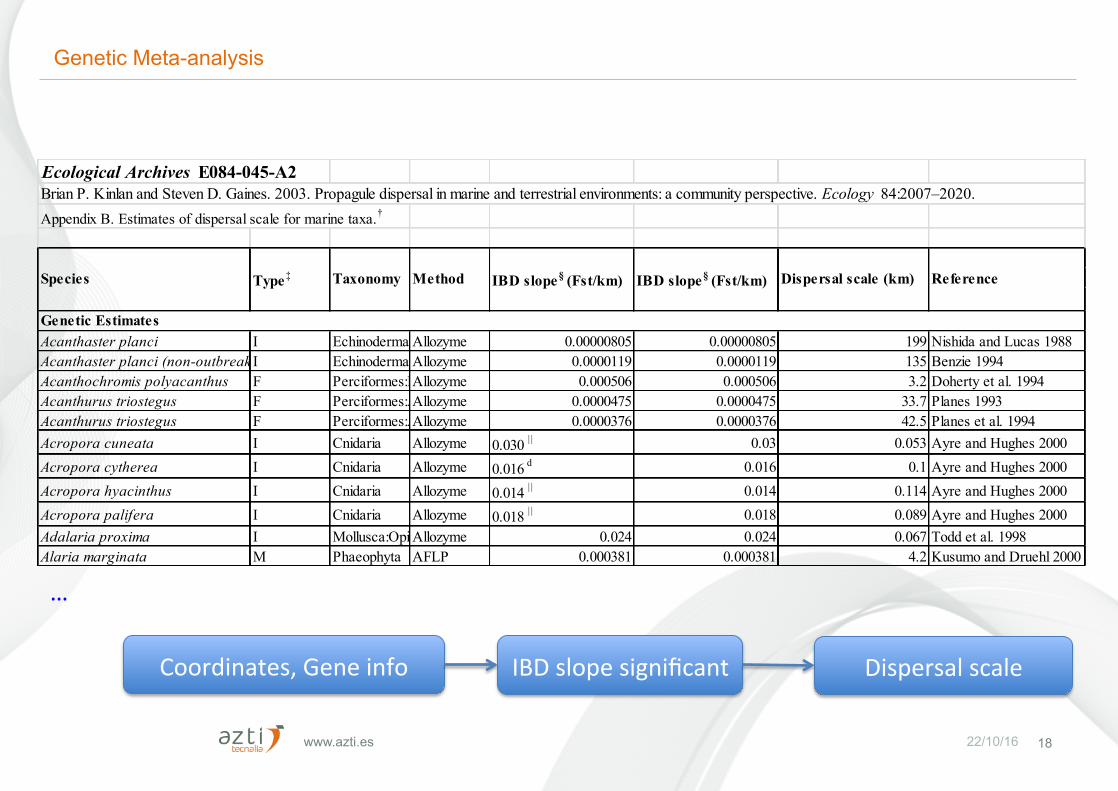
www.azti.es 22/10/16 18
Ecological Archives E084-045-A2 Brian P. Kinlan and Steven D. Gaines. 2003. Propagule dispersal in marine and terrestrial environments: a community perspective. Ecology 84:2007–2020.Appendix B. Estimates of dispersal scale for marine taxa.†
Acanthaster planci I Echinodermata:AsteroideaAllozyme 0.00000805 0.00000805 199 Nishida and Lucas 1988Acanthaster planci (non-outbreaking)I Echinodermata:AsteroideaAllozyme 0.0000119 0.0000119 135 Benzie 1994Acanthochromis polyacanthus F Perciformes:PomacentridaeAllozyme 0.000506 0.000506 3.2 Doherty et al. 1994Acanthurus triostegus F Perciformes:AcanthuridaeAllozyme 0.0000475 0.0000475 33.7 Planes 1993Acanthurus triostegus F Perciformes:AcanthuridaeAllozyme 0.0000376 0.0000376 42.5 Planes et al. 1994Acropora cuneata I Cnidaria Allozyme 0.030 | | 0.03 0.053 Ayre and Hughes 2000Acropora cytherea I Cnidaria Allozyme 0.016 d 0.016 0.1 Ayre and Hughes 2000Acropora hyacinthus I Cnidaria Allozyme 0.014 | | 0.014 0.114 Ayre and Hughes 2000Acropora palifera I Cnidaria Allozyme 0.018 | | 0.018 0.089 Ayre and Hughes 2000Adalaria proxima I Mollusca:OpisthobranchiaAllozyme 0.024 0.024 0.067 Todd et al. 1998Alaria marginata M Phaeophyta AFLP 0.000381 0.000381 4.2 Kusumo and Druehl 2000
Genetic Estimates
Species Type‡ Taxonomy Method Dispersal scale (km) ReferenceIBD slope§ (Fst/km) IBD slope§ (Fst/km)
…
Coordinates,Geneinfo IBDslopesignificant Dispersalscale
Genetic Meta-analysis
19
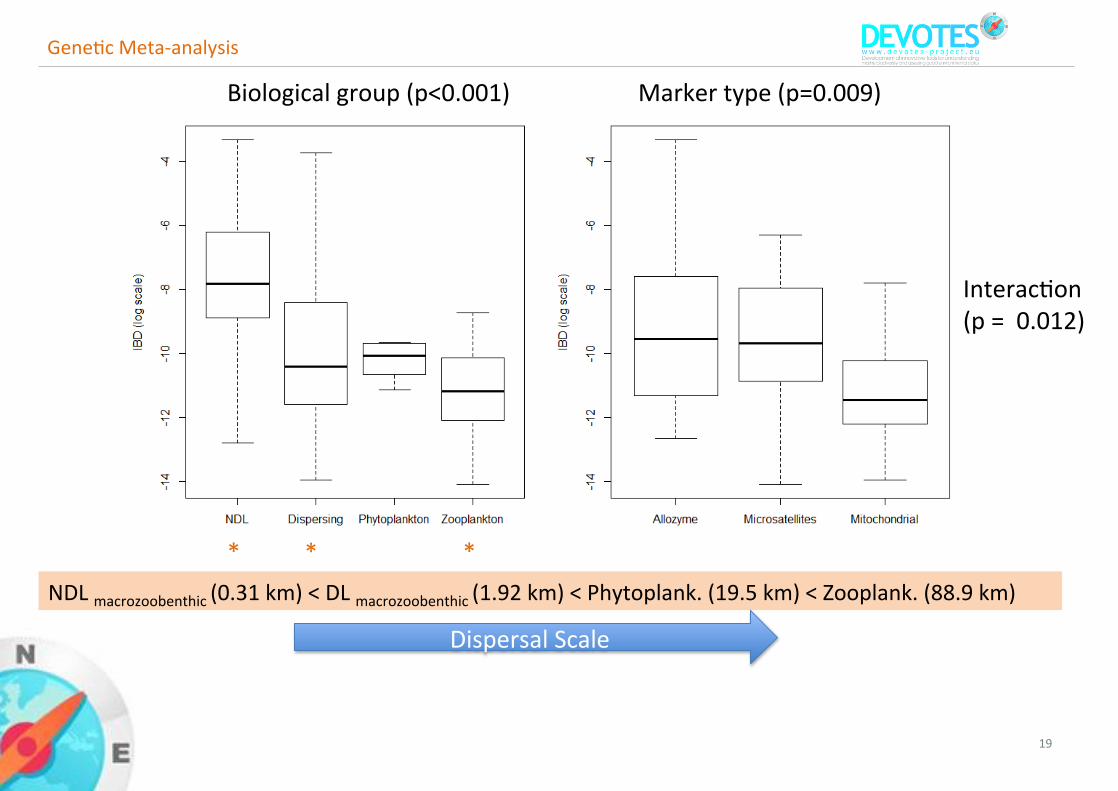
GeneFcMeta-analysis
* * *NDLmacrozoobenthic(0.31km)<DLmacrozoobenthic(1.92km)<Phytoplank.(19.5km)<Zooplank.(88.9km)
Biologicalgroup(p<0.001) Markertype(p=0.009)
InteracFon(p=0.012)
DispersalScale
www.azti.es 22/10/16 20
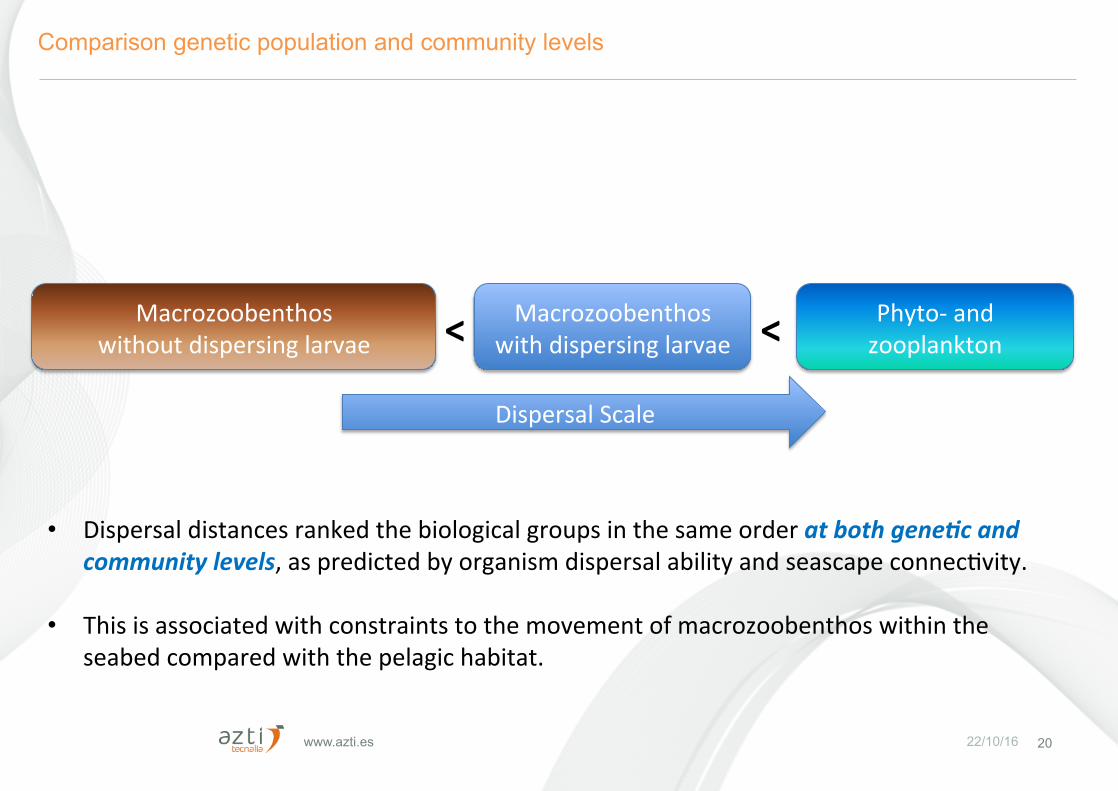
Comparison genetic population and community levels
DispersalScale
• Dispersaldistancesrankedthebiologicalgroupsinthesameorderatbothgene$candcommunitylevels,aspredictedbyorganismdispersalabilityandseascapeconnecFvity.
• Thisisassociatedwithconstraintstothemovementofmacrozoobenthoswithintheseabedcomparedwiththepelagichabitat.
Macrozoobenthoswithoutdispersinglarvae
Macrozoobenthoswithdispersinglarvae
Phyto-andzooplankton< <
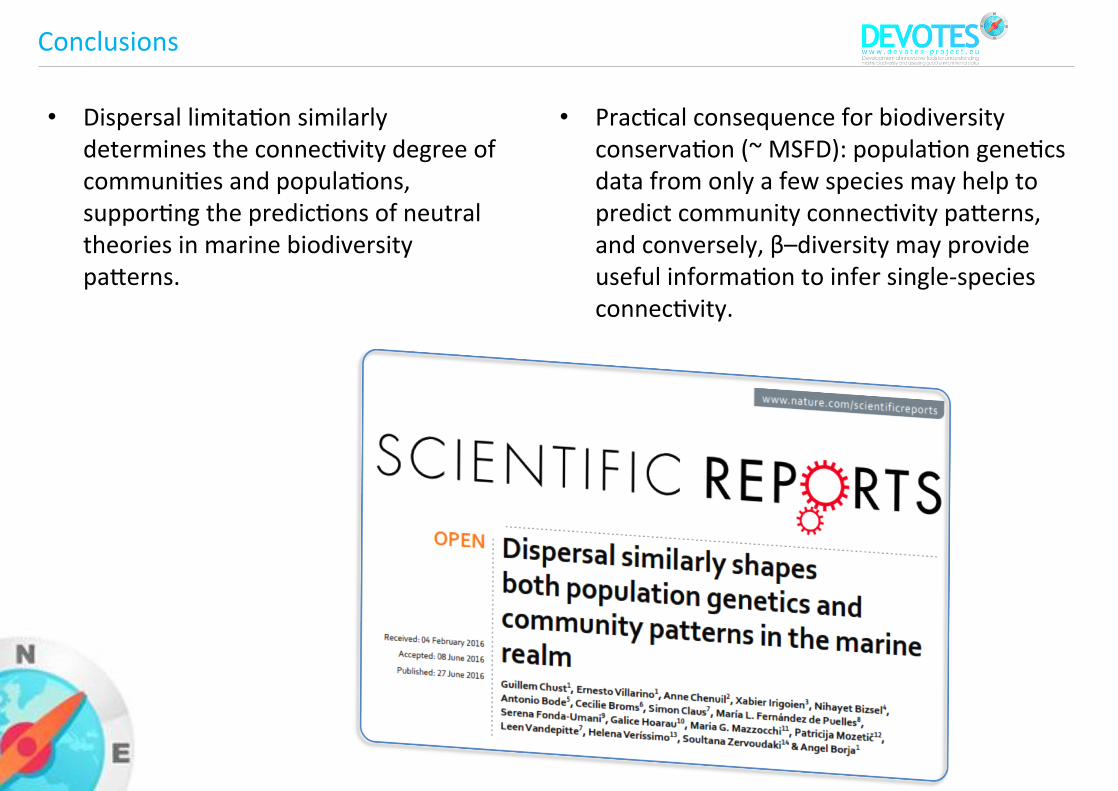
Conclusions
• DispersallimitaFonsimilarlydeterminestheconnecFvitydegreeofcommuniFesandpopulaFons,supporFngthepredicFonsofneutraltheoriesinmarinebiodiversitypaCerns.
• PracFcalconsequenceforbiodiversityconservaFon(~MSFD):populaFongeneFcsdatafromonlyafewspeciesmayhelptopredictcommunityconnecFvitypaCerns,andconversely,β–diversitymayprovideusefulinformaFontoinfersingle-speciesconnecFvity.

www.devotes-project.eu
Grantagreementnº308392
ThisprojecthasreceivedfundingfromtheEuropeanUnion’sSeventhFrameworkProgrammeforresearch,technologicaldevelopmentanddemonstra:onunderthegrantagreementnº308392
DEVOTESFinalconference,17-19Oct2016,Brussels