models 595a & 598a pulsed/cw microwave … 595a & 598a pulsed/cw microwave frequency...
TRANSCRIPT
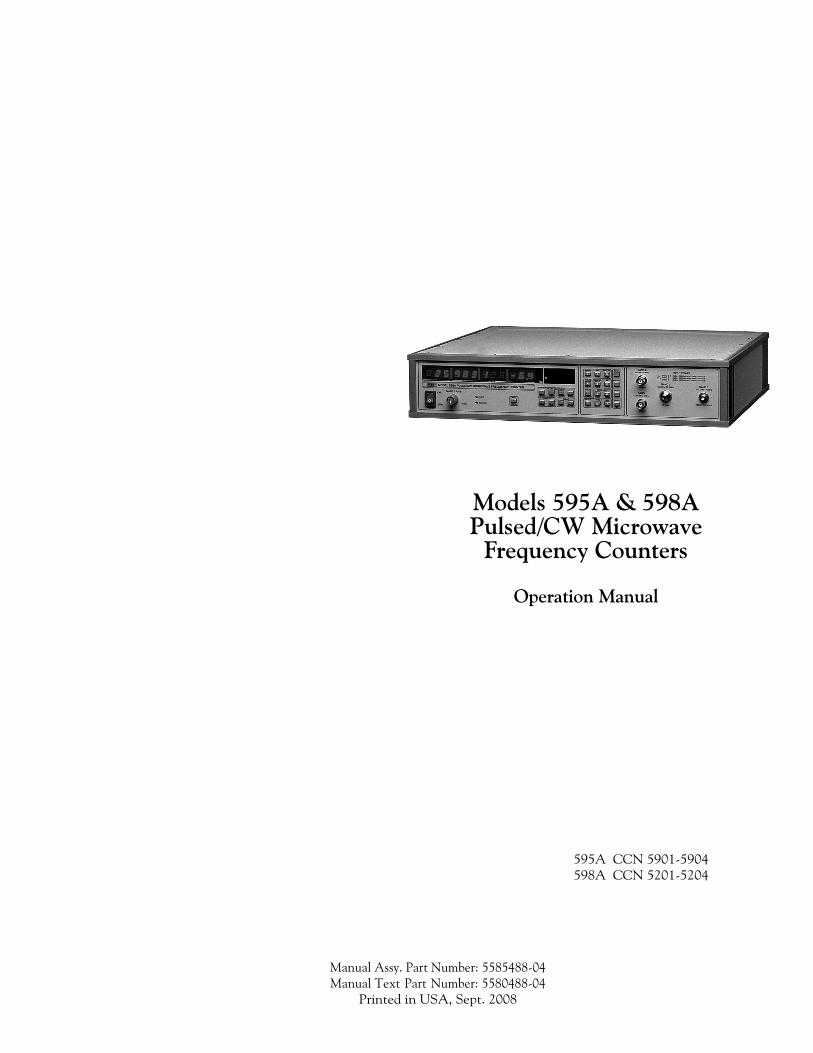
Models 595A & 598APulsed/CW Microwave
Frequency Counters
Operation Manual
Manual Assy. Part Number: 5585488-04Manual Text Part Number: 5580488-04
Printed in USA, Sept. 2008
595A CCN 5901-5904598A CCN 5201-5204


iii
Warranty
Phase Matrix, Inc. warrants this product to be free from defects in material and workmanship for one year from the date of delivery. Damage due to accident, abuse, or improper signal level is not covered by the warranty. Removal, defacement, or alteration of any serial or inspection label, marking or seal may void the warranty. Phase Matrix, Inc. will repair or replace, at its option, any components of this product which prove to be defective during the warranty period, provided the entire unit is returned COLLECT to Phase Matrix, Inc. or an authorized repair facility. Please visit our web site at: www.phasematrix.com for up-to-date return information. In warranty units will be returned freight prepaid; out of warranty units will be returned freight COLLECT. No other warranty other than above is expressed or implied.
Certification
Phase Matrix, Inc. certifies this instrument to be in conformance with the specifications noted herein at time of shipment from the factory. Phase Matrix, Inc. further certifies that its calibration measurements are traceable to the National Institute of Standards and Technology (NIST).
Manual Change Information
As Phase Matrix, Inc. continually improves and updates its products, changes to the material covered by the manual will occur. When a part or assembly in a Phase Matrix, Inc. instrument is changed to the extent that it is no longer interchangeable with the earlier part, the configuration control number (CCN) of the instrument, shown on the title page of the manual, will change, and a new edition of the manual will be published.
To maintain the technical accuracy of the manual, it may be necessary to provide new or additional information with the manual. In these cases, the manual is shipped with a Manual update. Please be sure to incorporate the information as instructed in the Manual update.

iv
Phase Matrix, Inc.TM
595A & 598A
SAFETY
The Phase Matrix 595A & 598A are designed and tested according to international safety requirements, but as with all electronic equipment, certain precautions must be observed. This manual contains information, cautions, and warnings that must be followed to prevent the possibility of personal injury and/or damage to the instrument.
SAFETY AND HAZARD SYMBOLS
WARNING
A WARNING denotes a hazard to personnel. It calls attention to aprocedure or practice, which, if not correctly performed or adheredto, could result in personal injury.
CAUTION
A CAUTION denotes a hazard to the equipment. It calls attention toan operating procedure or practice, which, if not correctly performedor adhered to, could result in damage to or destruction of part or allof the product.
This is a general warning that appears whenever care is necessary to prevent damage to the equipment.
Dangerous Voltage
Toxic Substance
Static-Sensitive Component
Fire Hazard

v
OVERALL SAFETY CONSIDERATIONS
WARNING
Before this instrument is switched on, its protective earth terminalsmust be connected to the AC power cord’s protective conductor.The main plug must only be inserted in a socket/outlet that has aprotective earth contact. The protective action must not be negatedby using an extension cord (power cable) or adapter that does nothave a protective earth (grounding) conductor.
WARNING
Use only fuses of the type specified with the required current andvoltage ratings. Never use repaired fuses or short-circuitedfuseholders, as doing so causes a shock and/or fire hazard.
WARNING
Whenever it is likely that electrical protection is impaired, theinstrument must be made inoperative and be secured against anyunintended operation.
WARNING
All protective earth terminals, extension cords, autotransformers,and other devices connected to this instrument must be connectedto a socket/outlet that has a protective earth contact. Anyinterruption of the protection causes a potential shock hazard thatcan result in personal injury.
WARNING
The power supply is energized whenever AC power is connected tothis instrument. Disconnect the AC power cord before removing thecovers to prevent electrical shock. Internal adjustments or servicingthat must be done with the AC power cord connected must beperformed only by qualified personnel.
vi
Phase Matrix, Inc.TM
595A & 598A
WARNING
Since the power supply filter capacitors may remain charged afterthe AC power cord is disconnected from the equipment,disconnecting the power cord does not ensure that there is noelectrical shock hazard.
WARNING
Some of the components used in this instrument contain resins andother chemicals that give off toxic fumes if burned. Be sure todispose of these items properly.
WARNING
Beryllia (beryllium oxide) is used in the construction of the YTFassembly. This material, if handled incorrectly, can pose a healthhazard. NEVER disassemble the microwave converter assembly.
CAUTION
Static sensitive components are used in the YTF assembly. Thesecomponents can be damaged if handled incorrectly.
CAUTION
Before connecting power to the instrument, ensure that the correctfuse is installed and the voltage-selection switch on the instrument’srear panel is set properly. Refer to Section 2, INSTALLATION.
CAUTION
Excessive signal levels can damage this instrument. To preventdamage, do not exceed the specified damage level. Refer to theinstrument specifications in Section 1 of this manual.

1
TABLE OF CONTENTS
WARRANTY. . . . . . . . . . . . . . . . . . . . . . . . . . . . . . . . . . . . . . . . . . . IIICERTIFICATION . . . . . . . . . . . . . . . . . . . . . . . . . . . . . . . . . . . . . . . . IIIMANUAL CHANGE INFORMATION . . . . . . . . . . . . . . . . . . . . . . . . . . . . IIISAFETY. . . . . . . . . . . . . . . . . . . . . . . . . . . . . . . . . . . . . . . . . . . . . . IVSAFETY AND HAZARD SYMBOLS . . . . . . . . . . . . . . . . . . . . . . . . . . . . . . IVOVERALL SAFETY CONSIDERATIONS . . . . . . . . . . . . . . . . . . . . . . . . . . . . V
SECTION 1: GENERAL INFORMATION
INTRODUCTION . . . . . . . . . . . . . . . . . . . . . . . . . . . . . . . . . . . . . . . . 1-1OPERATING CONDITIONS . . . . . . . . . . . . . . . . . . . . . . . . . . . . . . . . . . 1-2VENTILATION . . . . . . . . . . . . . . . . . . . . . . . . . . . . . . . . . . . . . . . . . 1-2STORAGE . . . . . . . . . . . . . . . . . . . . . . . . . . . . . . . . . . . . . . . . . . . . 1-2SPECIFICATIONS . . . . . . . . . . . . . . . . . . . . . . . . . . . . . . . . . . . . . . . . 1-2SPECIFICATIONS (CONTINUED) . . . . . . . . . . . . . . . . . . . . . . . . . . . . . . 1-3
SECTION 2: INSTALLATION
UNPACKING . . . . . . . . . . . . . . . . . . . . . . . . . . . . . . . . . . . . . . . . . . 2-1INSTALLATION . . . . . . . . . . . . . . . . . . . . . . . . . . . . . . . . . . . . . . . . 2-1FUSE REPLACEMENT . . . . . . . . . . . . . . . . . . . . . . . . . . . . . . . . . . . . . 2-2VOLTAGE SELECTION . . . . . . . . . . . . . . . . . . . . . . . . . . . . . . . . . . . . 2-3INCOMING OPERATIONAL CHECKOUT . . . . . . . . . . . . . . . . . . . . . . . . . . 2-3SERVICE INFORMATION . . . . . . . . . . . . . . . . . . . . . . . . . . . . . . . . . . . 2-4
PERIODIC MAINTENANCE . . . . . . . . . . . . . . . . . . . . . . . . . . . . . . . . 2-4COUNTER IDENTIFICATION. . . . . . . . . . . . . . . . . . . . . . . . . . . . . . . 2-4FACTORY SERVICE . . . . . . . . . . . . . . . . . . . . . . . . . . . . . . . . . . . . 2-5SHIPPING INSTRUCTIONS . . . . . . . . . . . . . . . . . . . . . . . . . . . . . . . . 2-5
SECTION 3: OPERATION
INTRODUCTION . . . . . . . . . . . . . . . . . . . . . . . . . . . . . . . . . . . . . . . . 3-1FRONT PANEL CONTROLS, INDICATORS, AND CONNECTORS . . . . . . . . . . . 3-1
STATUS DISPLAY . . . . . . . . . . . . . . . . . . . . . . . . . . . . . . . . . . . . . 3-2GPIB STATUS INDICATORS . . . . . . . . . . . . . . . . . . . . . . . . . . . . . . . 3-3SIGNAL INPUT CONNECTORS. . . . . . . . . . . . . . . . . . . . . . . . . . . . . . 3-4
REAR PANEL CONTROLS AND CONNECTORS . . . . . . . . . . . . . . . . . . . . . . 3-4INSTRUMENT DEFAULT SETTINGS. . . . . . . . . . . . . . . . . . . . . . . . . . . . . 3-6

2
Phase Matrix, Inc.TMPhase Matrix, Inc.TM
595A & 598A
KEYBOARD OPERATION . . . . . . . . . . . . . . . . . . . . . . . . . . . . . . . . . . . 3-7NUMERIC ENTRY KEYS . . . . . . . . . . . . . . . . . . . . . . . . . . . . . . . . . . 3-7TERMINATOR KEYS . . . . . . . . . . . . . . . . . . . . . . . . . . . . . . . . . . . . 3-7CLEAR DISPLAY AND CLEAR DATA KEYS. . . . . . . . . . . . . . . . . . . . . . . 3-7PARAMETER CALL KEYS . . . . . . . . . . . . . . . . . . . . . . . . . . . . . . . . . 3-8
THEORY OF OPERATION . . . . . . . . . . . . . . . . . . . . . . . . . . . . . . . . . . 3-16FUNCTIONAL DESCRIPTION . . . . . . . . . . . . . . . . . . . . . . . . . . . . . 3-16
SIGNAL MEASUREMENTS . . . . . . . . . . . . . . . . . . . . . . . . . . . . . . . . . 3-22AUTOMATIC FREQUENCY MEASUREMENTS . . . . . . . . . . . . . . . . . . . . 3-22TECHNIQUES FOR IMPROVING ACCURACY . . . . . . . . . . . . . . . . . . . . 3-34
SPECIAL FUNCTION DIRECTORY . . . . . . . . . . . . . . . . . . . . . . . . . . . . . 3-40ACTIVATION OF SPECIAL FUNCTIONS . . . . . . . . . . . . . . . . . . . . . . . 3-42
ERROR MESSAGES . . . . . . . . . . . . . . . . . . . . . . . . . . . . . . . . . . . . . . 3-58
SECTION 4: ACCESSORIES
INTRODUCTION . . . . . . . . . . . . . . . . . . . . . . . . . . . . . . . . . . . . . . . . 4-1CARRYING CASE M595A-ACC010 . . . . . . . . . . . . . . . . . . . . . . . . . . . . 4-2RACK-MOUNT KIT WITH HANDLES M595A-ACC021 . . . . . . . . . . . . . . . . 4-3RACK-MOUNT KIT WITHOUT HANDLES M595A-ACC022 . . . . . . . . . . . . . 4-4SERVICE KIT (ADJUSTMENT AND TROUBLESHOOTING TOOL KIT)M595A-ACC043 . . . . . . . . . . . . . . . . . . . . . . . . . . . . . . . . . . . . . . . 4-5RACK-MOUNT KIT WITH CHASSIS SLIDES AND HANDLES M595A-ACC101 . . 4-7RACK-MOUNT KIT WITH CHASSIS SLIDES/WITHOUT HANDLESM595A-ACC102 . . . . . . . . . . . . . . . . . . . . . . . . . . . . . . . . . . . . . . . 4-9
SECTION 5: PROGRAMMING
REMOTE PROGRAMMING . . . . . . . . . . . . . . . . . . . . . . . . . . . . . . . . . . 5-1GENERAL PURPOSE INTERFACE BUS. . . . . . . . . . . . . . . . . . . . . . . . . . 5-1GPIB FUNCTIONS IMPLEMENTED. . . . . . . . . . . . . . . . . . . . . . . . . . . . 5-1DEVICE-DEPENDENT MESSAGES (LISTENER FEATURES). . . . . . . . . . . . . . 5-3OUTPUT MESSAGES (TALKER FEATURES) . . . . . . . . . . . . . . . . . . . . . 5-11STATUS BYTE. . . . . . . . . . . . . . . . . . . . . . . . . . . . . . . . . . . . . . . 5-12SERVICE REQUEST MASK. . . . . . . . . . . . . . . . . . . . . . . . . . . . . . . . 5-13DEFAULT STATE (DEVICE CLEAR FEATURES) . . . . . . . . . . . . . . . . . . . 5-14GPIB ADDRESS SELECTION . . . . . . . . . . . . . . . . . . . . . . . . . . . . . . 5-15TALK ONLY MODES . . . . . . . . . . . . . . . . . . . . . . . . . . . . . . . . . . . 5-15DATA INPUT AND OUTPUT SPEED. . . . . . . . . . . . . . . . . . . . . . . . . . 5-16
READING MEASUREMENTS . . . . . . . . . . . . . . . . . . . . . . . . . . . . . . . . 5-16
3
SECTION 6: OPERATIONAL VERIFICATION TESTS
EQUIPMENT REQUIREMENTS . . . . . . . . . . . . . . . . . . . . . . . . . . . . . . . . 6-1SPECIAL EQUIPMENT . . . . . . . . . . . . . . . . . . . . . . . . . . . . . . . . . . . 6-2
TEST PROCEDURES . . . . . . . . . . . . . . . . . . . . . . . . . . . . . . . . . . . . . . 6-3BAND 0 RANGE/SENSITIVITY TESTS (CW ONLY) . . . . . . . . . . . . . . . . . . 6-3BAND 1 RANGE/SENSITIVITY TESTS . . . . . . . . . . . . . . . . . . . . . . . . . . 6-4BAND 2 RANGE/SENSITIVITY TESTS . . . . . . . . . . . . . . . . . . . . . . . . . . 6-5BAND 1 AMPLITUDE DISCRIMINATION TEST . . . . . . . . . . . . . . . . . . . . 6-6BAND 2 AMPLITUDE DISCRIMINATION TEST . . . . . . . . . . . . . . . . . . . . 6-7BAND 1 GATE ERROR TEST . . . . . . . . . . . . . . . . . . . . . . . . . . . . . . . 6-8BAND 2 GATE ERROR TEST . . . . . . . . . . . . . . . . . . . . . . . . . . . . . . 6-10BAND 1 DISTORTION ERROR TEST. . . . . . . . . . . . . . . . . . . . . . . . . . 6-11BAND 2 DISTORTION ERROR TEST. . . . . . . . . . . . . . . . . . . . . . . . . . 6-13BAND 1 AVERAGING ERROR TEST . . . . . . . . . . . . . . . . . . . . . . . . . . 6-14BAND 2 AVERAGING ERROR TEST . . . . . . . . . . . . . . . . . . . . . . . . . . 6-16BAND 2 FREQUENCY LIMITS TEST . . . . . . . . . . . . . . . . . . . . . . . . . . 6-18BAND 2 CENTER FREQUENCY TEST . . . . . . . . . . . . . . . . . . . . . . . . . 6-18BAND 1 MAXIMUM VIDEO . . . . . . . . . . . . . . . . . . . . . . . . . . . . . . . 6-19BAND 2 MAXIMUM VIDEO . . . . . . . . . . . . . . . . . . . . . . . . . . . . . . . 6-21PULSE WIDTH ACCURACY TEST . . . . . . . . . . . . . . . . . . . . . . . . . . . 6-22PULSE PERIOD ACCURACY TEST . . . . . . . . . . . . . . . . . . . . . . . . . . . 6-23

4
Phase Matrix, Inc.TMPhase Matrix, Inc.TM
595A & 598A
1-1
1
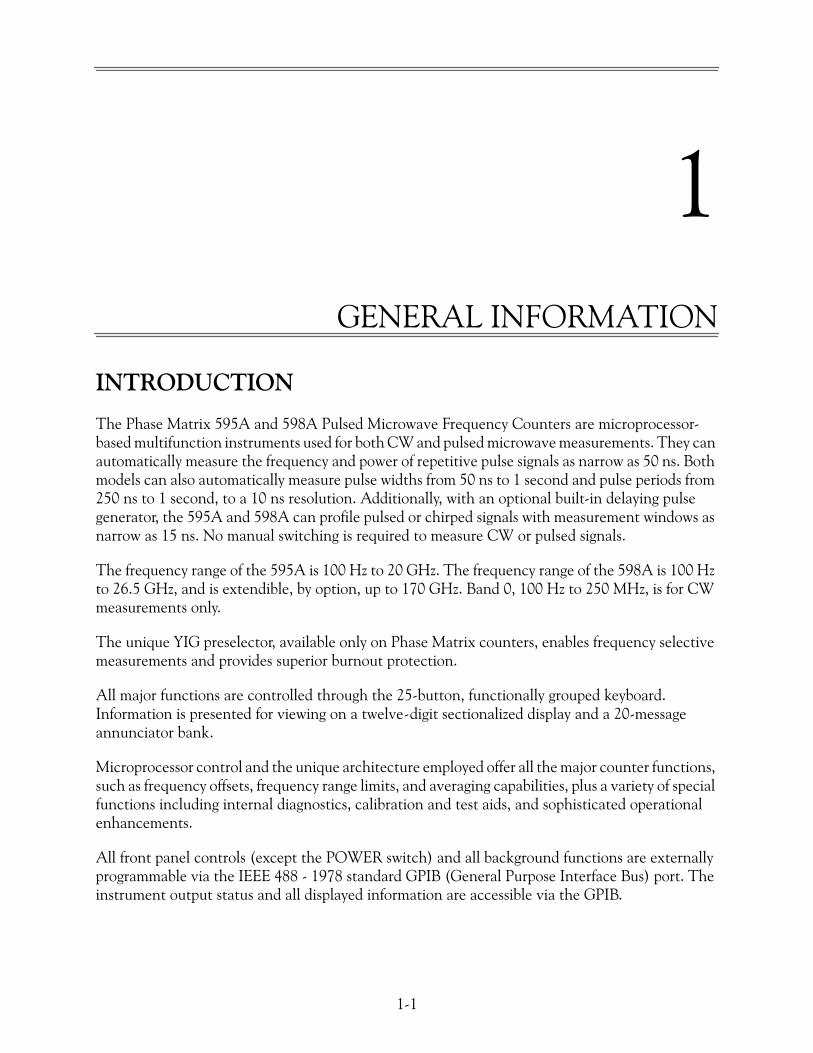
INTRODUCTION
The Phase Matrix 595A and 598A Pulsed Microwave Frequency Counters are microprocessor-based multifunction instruments used for both CW and pulsed microwave measurements. They can automatically measure the frequency and power of repetitive pulse signals as narrow as 50 ns. Both models can also automatically measure pulse widths from 50 ns to 1 second and pulse periods from 250 ns to 1 second, to a 10 ns resolution. Additionally, with an optional built-in delaying pulse generator, the 595A and 598A can profile pulsed or chirped signals with measurement windows as narrow as 15 ns. No manual switching is required to measure CW or pulsed signals.
The frequency range of the 595A is 100 Hz to 20 GHz. The frequency range of the 598A is 100 Hz to 26.5 GHz, and is extendible, by option, up to 170 GHz. Band 0, 100 Hz to 250 MHz, is for CW measurements only.
The unique YIG preselector, available only on Phase Matrix counters, enables frequency selective measurements and provides superior burnout protection.
All major functions are controlled through the 25-button, functionally grouped keyboard. Information is presented for viewing on a twelve-digit sectionalized display and a 20-message annunciator bank.
Microprocessor control and the unique architecture employed offer all the major counter functions, such as frequency offsets, frequency range limits, and averaging capabilities, plus a variety of special functions including internal diagnostics, calibration and test aids, and sophisticated operational enhancements.
All front panel controls (except the POWER switch) and all background functions are externally programmable via the IEEE 488 - 1978 standard GPIB (General Purpose Interface Bus) port. The instrument output status and all displayed information are accessible via the GPIB.
GENERAL INFORMATION
1-2
Phase Matrix, Inc.TM
595A & 598A
OPERATING CONDITIONSThis instrument is designed to be operated at temperatures not exceeding 0 to 50° C at relative humidity not to exceed 95% (75% for temperatures greater than 25° C and 45% for temperatures greater than 40° C) non-condensing. This instrument performs to specifications at altitudes not exceeding 10,000 ft (3050 m) and tolerates vibration not exceeding 2 g. It is fungus resistant. The chassis is not designed to provide protection from mechanical shock or falling water particles and is intended for normal bench use in an environmentally uncontaminated area.
VENTILATIONAir circulates through the vents in the rear panel of the counter. These vents must not be obstructed or the temperature inside the counter may increase enough to reduce counter stability and shorten component life.
STORAGEStore the instrument in an environment that is protected from moisture, dust, and other contaminants. Do not expose the instrument to temperatures below –55° C or above 75° C, nor to altitudes above 40,000 ft (12,000 m).
SPECIFICATIONS
GENERAL
Size 3.5 in H x 16.75 in. W x 14 in. D (8.9 cm H x 42.6 cm W x 35.6 cm D)
Weight 24 lb (11 kg) (with no options)
Shipping Weight 33 lb (15 kg) (with no options)
Operating Temperature 32 to 122 °F (0 to 50° C)
Humidity 0% to 95%, non-condensing (75% for > 25° C; 45% for > 40° C)
Power 100/120/220/240 V AC ±10% 50-400 Hz, 100 VA, typical
Pulsed Measurements
Minimum Pulse Width 50 ns
Maximum Pulse Width CW
Minimum Profile Sample Frequency: 15 nsPower: 100 ns
Minimum PRF 1 Hz
Maximum PRF 4 MHz
Minimum Off Time 200 ns (does count CW)
Minimum On/off Ratio 15 dB
Resolution 1 Hz to 1 GHz
Gate Time 4 s to 1 μs (dependent upon band and resolution)

1-3
1/GENERAL INFORMATION
SPECIFICATIONS (Continued)
BAND 0 (CW ONLY)
BAND 1
Frequency Range 100 Hz to 250 MHz
Sensitivity –20 dBm
Connector BNC
Impedance 50 Ω nominal
Maximum Input +7 dBm
Damage Level +27 dBm
FM Tolerance Carrier frequency must remain within band
Measurement Time ①
Total Error TE = timebase error ±1 count
Frequency Range 250 MHz to 1 GHz
Sensitivity –20 dBm
Connector BNC
Impedance 50 Ω nominal
Maximum Input +7 dBm
Damage Level +27 dBm
Amplitude Discrimination 15 dB
FM Tolerance (up to 10 MHz rate) Carrier frequency must remain within band
Measurement Time (Pulse) ①
Measurement Time (CW) ①
Acquisition Time ①
Gate Error in Hz ①
Distortion Error in Hz ①
Averaging Error in Hz ①
Total Error (Pulse) ①
Total Error (CW)(Based on averaging 10 measurements)
MT 1RES------------- 0.05+=
MT 4( ) PP( )GW( ) RES( )
--------------------------------- + 0.05=
MT 4RES------------- + 0.05=
AQ 1MINPRF------------------------⎝ ⎠⎛ ⎞ + 0.05=
GE 0.07GW-----------±=
DE 0.03
PW 3 x 10 8–( )–------------------------------------------±=
AE 2±= x RES(GW ) AVG( )----------------------------------
TEP AE GE DE Time Base Error±±±±=
TECW Time Base Error 1 count±=

1-4
Phase Matrix, Inc.TM
595A & 598A
SPECIFICATIONS (Continued)
BAND 2
Frequency Range 0.95 to 20 GHz (595A), 0.95 to 26.5 GHz (598A)
Sensitivity –20 dBm (0.95 GHz to 2 GHz)–25 dBm (2 GHz to 12.4 GHz)–20 dBm (12.4 GHz to 20 GHz)–15 dBm (20 GHz to 26.5 GHz, 598A Only)
Connector Precision Type N (595A), APC 3.5 (598A)
Impedance 50 Ω nominal
Maximum Input +7 dBm
Damage Level +45 dBm CW, +53 dBm peak (1 μsec pulse width, 0.1% duty cycle)
Amplitude Discrimination 15 dB (> 50 MHz separation). If < 15 dB, unit counts one signal accurately if signals are > 200 MHz apart.
Frequency Limits Instrument rejects signals > 50 MHz outside of limits.Frequency limit can be set to a resolution of 10 MHz.
Center Frequency Instrument rejects signals > 50 MHz outside the specified Δ frequency. Center Frequency and Δ Frequency can be set to a resolution of 10 MHz.
FM Tolerance (up to 10 MHz rate) 20 MHz p-p
Acquisition Time (Pulse)
Acquisition Time (CW)
Measurement Time (Pulse) ①
Measurement Time (CW) ①
Gate Error in Hz ①
Distortion Error in Hz ①
Averaging Error in Hz ①
Total Error (Pulse)
Total Error (CW)(Based on averaging 10 measurements)
AQ 2 FH( ) 4 x 10 12–( ) 4 x 10 8–( )MINPRF--------------------------+ 60
MINPRF------------------------ + 2 x 10 5–( ) PP( )
GW------------------------------------------ + 0.3+=
AQ 2 FH( ) 4 x 10 12–( ) 4 x 10 8–( )MINPRF--------------------------+ 60
MINPRF------------------------ + 0.3+=
MT PP( )GW( ) RES( )
--------------------------------- + 0.05=
MT 1RES------------- + 0.05=
GE 0.01GW-----------±=
DE 0.03
PW 3 x 10 8–( )–------------------------------------------±=
AE RES(GW ) AVG( )----------------------------------=
TEP AE GE DE Time Base Error±±±±=
TECW Time Base Error 1 count±=

1-5
1/GENERAL INFORMATION
SPECIFICATIONS (Continued)
BAND 3 (OPTION 5804)
Frequency Range 26.5 to 170 GHz (see page 1-8)
Sensitivity –20 dBm (26.5 to 60 GHz)–15 dBm (60 to 170 GHz)
Connector Varies with remote sensor (see page 1-8)
Maximum Input +5 dBm
Damage Level +10 dBm
Amplitude Discrimination 20 dB
FM Tolerance (up to 10 MHz rate) ➁
AutomaticCenter Freq
20 MHz p-p150 MHz p-p
Averaging Error in Hz ①
Gate Error in Hz ①
Distortion Error in Hz ①
Total Error (Pulse)
Total Error (CW)
Acquisition Time (Pulse) ①
Automatic
Center Freq
Acquisition Time (CW)
Measurement Time (Pulse) ①
Measurement Time (CW)
Center Frequency Signal must be within ±2 GHz of specified center frequency.
PULSE PERIOD
Accuracy ① ±3x10⁻⁸ + (Timebase Error x PW)
Resolution 10 ns
Range 250 ns to 1 s
Measurement Points –6 dB ±1.5 dB
AE 2 x RES(GW ) AVG( )----------------------------------±=
GE 0.03GW-----------±=
DE 0.02
PW 3 x 10 8–( )–------------------------------------------±=
TEP AE GE DE Time Base Error±±±±=
TECW Time Base Error N2 counts, where N freq
2x10¹⁰-------------------=±=
AQ 70MINPRF------------------------ 6 x 10 3–( ) PP( )
GW------------------------------------------ + 0.2+=
AQ 70MINPRF------------------------ 8 x 10 4–( ) PP( )
GW------------------------------------------ + 0.2+=
AQ 70MINPRF------------------------ + 0.2=
MT 4( ) PP( )GW( ) RES( )
--------------------------------- + 0.05=
MT 4RES------------- + 0.05=
1-6
Phase Matrix, Inc.TM
595A & 598A
SPECIFICATIONS (Continued)
PULSE WIDTH
Accuracy ① ±3x10⁻⁸ + (Timebase Error x PW)
Resolution 10 ns
Range 50 ns to 1 s
Measurement Points –6 dB ±1.5 dB
POWER MEASUREMENT (BAND 1 and BAND 2 ONLY)
Frequency Range 250 MHz - 20 GHz (595A)250 MHz - 20 GHz (598A)
Resolution 0.1 dB ➄
Dynamic Range Same as counter operation range
Measurement Window 25 MHz nominal
Minimum Pulse Width 100 ns (measures narrower pulses with degraded accuracy, internal or external gating)
Measurement Time Frequency measurement time + 1 gate time + 0.15 seconds, CW
Offset Can offset ±99.9 dB to a 0.1 dB resolution
Accuracy ±0.5 dB typical, CW
±1.5 dB typical, Pulse (1 μs measurement window, 10% duty cycle)
Repeatability ±0.3 dB typical, CW to 20 GHz
±0.5 dB typical, CW to 26.5 GHz
±03 dB typical, Pulse to 20 GHz (1 μs measurement window, 10% duty cycle)
±0.8 dB typical, Pulse to 26.5 GHz (1 μs measurement window, 10% duty cycle)
TCXO TIME BASE (STANDARD)
Frequency 10 MHz
Aging Rate < 1 x 10⁻⁷/month
Short Term Stability < 1 x 10⁻⁹ RMS for one second averaging time
Temperature Stability < 1 x 10⁻⁶ over the range 0° to 50° C
Line Variation < 1 x 10⁻⁷ (±10% line voltage change)
Warm-up Time < 5 minutes
Output Signal 10 MHz, 1 V p-p minimum into 50 Ω
External Time Base Input 10 MHz, 1 V p-p minimum into 1 kΩ

1-7
1/GENERAL INFORMATION
SPECIFICATIONS (Continued)
HIGH-STABILITY TIME BASE (OPTION 5809)
Frequency 10 MHz
Aging Rate < 5 x 10⁻¹⁰/day (after 72-hour warm-up), 1 x 10⁻⁷/year
Short Term Stability < 1 x 10⁻¹⁰ RMS for one second averaging time
Temperature Stability < 3 x 10⁻⁸ over the range 0° C to 50° C
Line Variation < 2 x 10⁻¹⁰ (±10% line voltage change)
Warm-up Time Within 5 x 10⁻⁹ 10 min after turn-on at 25° CWithin 1 x 10⁻⁹ 30 min after turn-on at 25° C
DELAYING PULSE GENERATOR (OPTION 5810)
Pulse Output
LevelConnector
TTL ➂ into 50 ΩBNC
Trigger Input
LevelPolarityImpedanceConnector
TTL ➂Positive or Negative (see special functions 12 and 13)1 kΩBNC
Trigger Output
LevelPulse WidthConnector
TTL ➂ into 50 Ω50 to 100 nsBNC
Pulse Width
MinimumMaximumResolution
24 ns800 ms2 ns
Pulse Delay ➃
MinimumMaximumResolution
74 ns800 ms2 ns
Pulse Period
MinimumMaximumResolution
100 ns800 ms50 ns

1-8
Phase Matrix, Inc.TM
595A & 598A
SPECIFICATIONS (Continued)
REMOTE SENSORS
OPTIONS AND ACCESSORIES
RemoteSensor
Band FrequencyRange (GHz)
WaveguideSize
WaveguideFlange
PowerRange (dBm)
DamageLevel (dBm)
91 3-1 26.5 - 40 WR-28 UG-599/U –20 to +5 +10
92 3-3 40 - 60 WR-19 UG-383/U –20 to +5 +10
93 3-5 60 - 90 WR-12 UG-387/U –15 to +5 +10
94 3-6 90 - 110 WR-10 UG-387/U –15 to +5 +10
95 3-4 50 - 75 WR-15 UG-385/U –20/–15 to +5 +10
96 3-2 33 - 50 WR-22 UG-383/U –20 to +5 +10
97 3-1 26.5 - 50 2.92 mm coax(K-Connector)*
— –20 to +5 +10
98 3-8 110 - 170 WR-6 UG-387/U –15 to +5 +10
* K-Connector is a registered trademark of the Wiltron Company.
OPTION DESCRIPTION
5803 Rear-Panel Input Connectors
5804 Band 3 Frequency Extension Module. Available on Model 598A only. Required for frequencies between 26.5 GHz and 170 GHz. Frequency Extension Cable Kit 890 and appropriate remote sensors are also required.
5809 Ovenized High Stability Time Base (Aging Rate: < 5 x 10⁻¹⁰/day)
5810 Delaying Pulse Generator
ACCESSORY DESCRIPTION010 Carrying Case
101 Chassis-Slide kit (includes Rack-Mount kit with handles)
102 Chassis Slide kit (includes Rack-Mount kit without handles)
890 Frequency Extension Cable kit
031 Operation Manual (one supplied with each instrument)
032 Operation and Service Manual
022 Rack Mount kit without Handles
091 Remote Sensor 26.5 GHz to 40 GHz (WR-28)
092 Remote Sensor 40 to 60 GHz (WR-19)
093 Remote Sensor 60 GHz to 90 GHz (WR-12)
094 Remote Sensor 90 GHz to 110 GHz (WR-10)
1-9
1/GENERAL INFORMATION
SPECIFICATIONS (Continued)
OPTIONS AND ACCESSORIES (Continued)
095 Remote Sensor 50 GHz to 75 GHz (WR-15)
096 Remote Sensor 33 GHz to 50 GHz (WR-22)
097 Remote Sensor 26.5 GHz to 50 GHz (2.92 mm coax, SMA-compatible)
098 Remote Sensor 110 GHz to 170 GHz (WR-6)
021 Rack Mount kit with Handles
043 Service Kit
NOTES
① All formulas are written in fundamental units (Hz, sec, etc.).
MV is the maximum video amplitude in dBm.SL is the input signal level in dBm.FV is the frequency component of the video in Hz.GW is the logical “AND” of pulse width and inhibit signal minus 30 ns.PW is pulse width of the incoming signal in seconds.PP is the period of the input signal in seconds.RES is the resolution in Hz up to 1 MHz. Above 1 MHz only the displayed resolution changes; the internal resolution remains at 1 MHz.AVG is the number of measurements averaged.FH is the difference between Frequency Limit High and Frequency Limit Low in Hz.MINPRF is the specified instrument MINPRF in Hz up to 1 kHz. Above 1 kHz, MINPRF is 1 kHz.
➁ In Band 3, if FM/Chirp is > 150 MHz and nonsymmetrical, the measured frequency is a function of average frequency and geometric center frequency.
➂ TTL levels have a maximum low of 0.4 and a minimum high of 2.4.
➃ In Internal Trigger Mode, pulse delay is measured from the rising edge of the Internal Trigger Output to the Pulse Output. In External Trigger Mode, pulse delay is measured from either the rising or the falling edge (software selectable) of the External Trigger Input to the Pulse Output.
➄ Frequency display is limited to 100 kHz resolution while power is displayed. Full resolution is obtained over GPIB.

1-10
Phase Matrix, Inc.TM
595A & 598A

2-1
2
UNPACKINGThe Phase Matrix 595A and 598A series Pulsed Microwave Frequency Counters arrive ready for operation. Carefully inspect the shipping carton for any sign of damage. If the carton is damaged, immediately notify shipper’s agent.
Remove the packing carton and supports, being careful not to mar or damage the instrument. Make a complete visual inspection of the counter, checking for any damage or missing components. Check that all switches and controls operate mechanically. Report any damage to Phase Matrix immediately.
INSTALLATIONThere are no special installation instructions for these counters. They are self-contained bench or rack-mount instruments, which only require connection to a standard, single-phase power line for operation.
CAUTION
To prevent damage to the counter, verify that the voltage valuevisible through the window in the fuse drawer (see Figure 2-1) iscorrect for the available AC power input voltage, and inspect the fuseto ensure that it is the correct type and that it matches the ratingspecified in Table 2-1.
WARNING
Disconnect the AC power cord before removing the fuse or changingthe voltage selector setting.
INSTALLATION
2-2
Phase Matrix, Inc.TM
595A & 598A
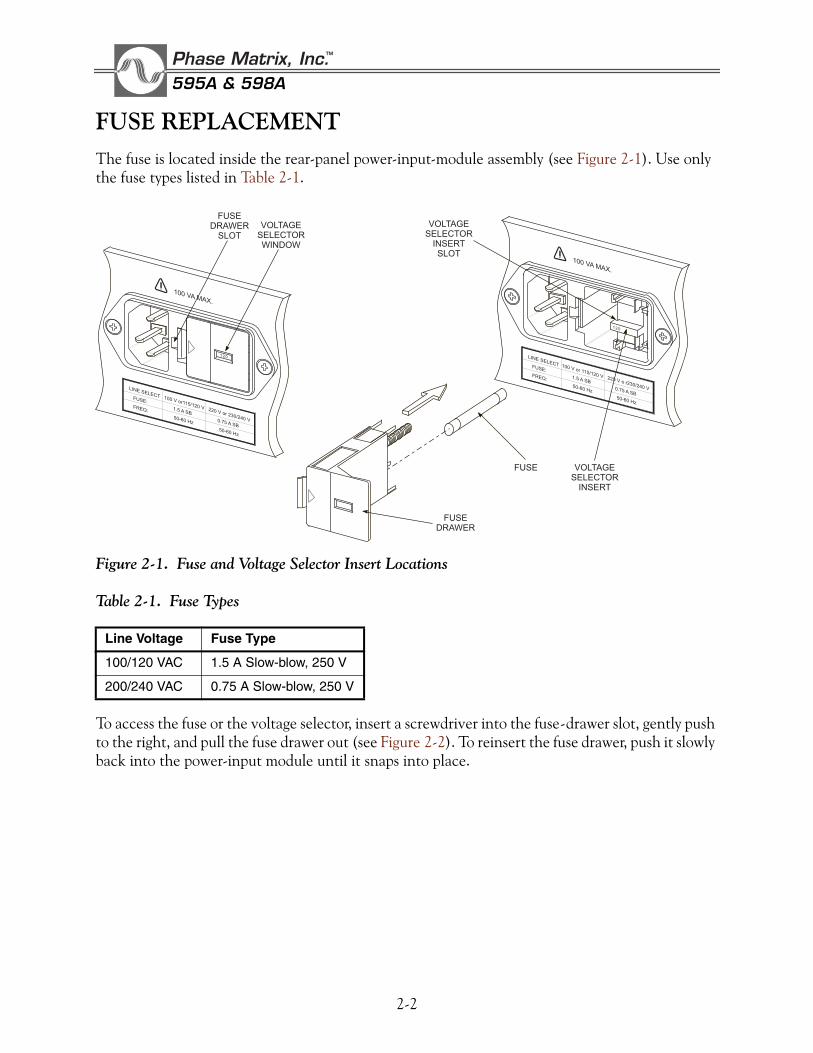
FUSE REPLACEMENTThe fuse is located inside the rear-panel power-input-module assembly (see Figure 2-1). Use only the fuse types listed in Table 2-1.
Figure 2-1. Fuse and Voltage Selector Insert Locations
Table 2-1. Fuse Types
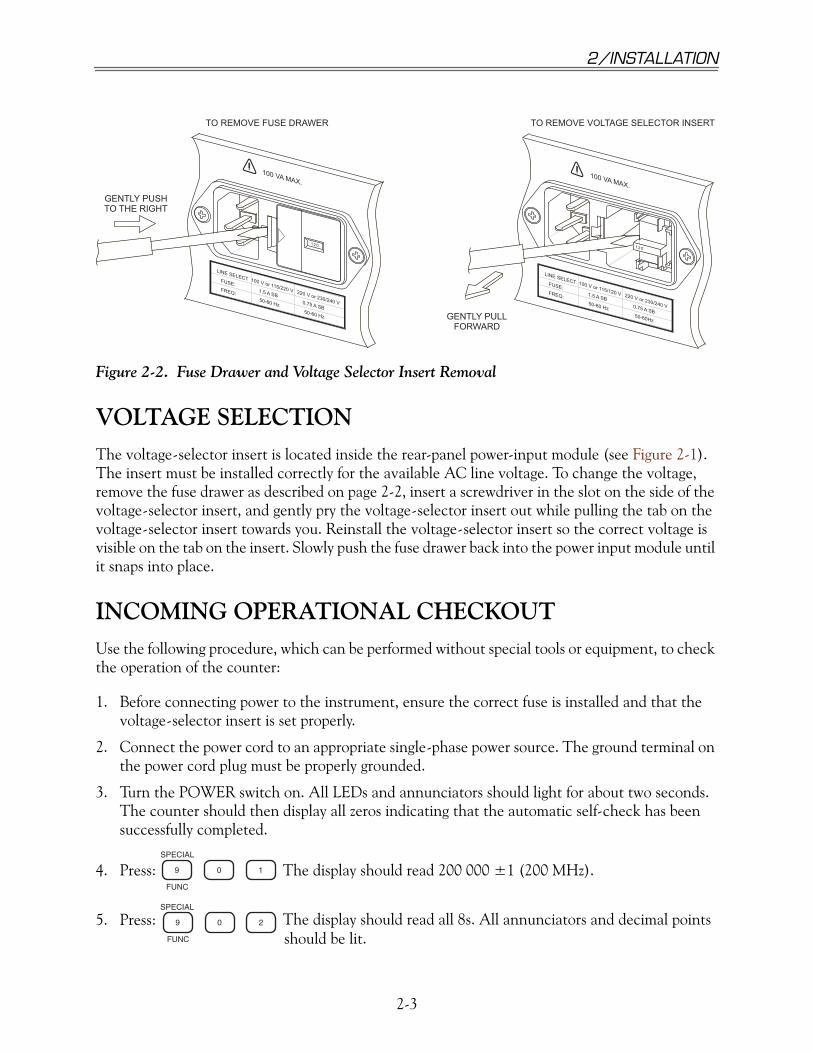
To access the fuse or the voltage selector, insert a screwdriver into the fuse-drawer slot, gently push to the right, and pull the fuse drawer out (see Figure 2-2). To reinsert the fuse drawer, push it slowly back into the power-input module until it snaps into place.
Line Voltage Fuse Type
100/120 VAC 1.5 A Slow-blow, 250 V
200/240 VAC 0.75 A Slow-blow, 250 V
120
LINE SELECT 100 V or115/120 V 220 V or 230/240 V
FUSE:
1.5 A SB
0.75 A SB
FREQ:
50-60 Hz
50-60 Hz
LINE SELECT 100 V or 115/120 V 220 V o r230/240 V
FUSE:
1.5 A SB
0.75 A SB
FREQ:
50-60 Hz
50-60 Hz
100 VA MAX.
100 VA MAX.
120
VOLTAGESELECTOR
INSERT
VOLTAGESELECTOR
INSERTSLOT
FUSE
FUSEDRAWER
SLOT
FUSEDRAWER
VOLTAGESELECTORWINDOW
2-3
2/INSTALLATION
Figure 2-2. Fuse Drawer and Voltage Selector Insert Removal
VOLTAGE SELECTIONThe voltage-selector insert is located inside the rear-panel power-input module (see Figure 2-1). The insert must be installed correctly for the available AC line voltage. To change the voltage, remove the fuse drawer as described on page 2-2, insert a screwdriver in the slot on the side of the voltage-selector insert, and gently pry the voltage-selector insert out while pulling the tab on the voltage-selector insert towards you. Reinstall the voltage-selector insert so the correct voltage is visible on the tab on the insert. Slowly push the fuse drawer back into the power input module until it snaps into place.
INCOMING OPERATIONAL CHECKOUTUse the following procedure, which can be performed without special tools or equipment, to check the operation of the counter:
1. Before connecting power to the instrument, ensure the correct fuse is installed and that the voltage-selector insert is set properly.
2. Connect the power cord to an appropriate single-phase power source. The ground terminal on the power cord plug must be properly grounded.
3. Turn the POWER switch on. All LEDs and annunciators should light for about two seconds. The counter should then display all zeros indicating that the automatic self-check has been successfully completed.
4. Press: The display should read 200 000 ±1 (200 MHz).
5. Press:
120
TO REMOVE FUSE DRAWER TO REMOVE VOLTAGE SELECTOR INSERT
GENTLY PUSHTO THE RIGHT
GENTLY PULLFORWARD
120
LINE SELECT 100 V or 115/220 V 220 V or 230/240 V
FUSE:
1.5 A SB
0.75 A SB
FREQ:
50-60 Hz
50-60 Hz
100 VA MAX.
LINE SELECT 100 V or 115/120 V 220 V or 230/240 V
FUSE:
1.5 A SB
0.75 A SB
FREQ:
50-60 Hz
50-60Hz
100 VA MAX.
SPECIAL
FUNC
09 1
SPECIAL
FUNC
09 2 The display should read all 8s. All annunciators and decimal pointsshould be lit.
2-4
Phase Matrix, Inc.TM
595A & 598A
6. Press:
7. Press:
This completes the incoming operational checkout procedure.
SERVICE INFORMATION
PERIODIC MAINTENANCE
No periodic maintenance is required. However, to maintain accuracy, it is recommended that the counter be recalibrated every 12 months. The specific calibration interval may be redefined depending upon the measurement accuracy required. For sample measurement error calculations for both 6- and 12-month calibration intervals, see “Timebase Error” in 3.
CAUTION
Do not attempt to repair or disassemble the microwave converter,millimeter wave converter, or time-base-oscillator assemblies. Suchactions void the counter’s warranty. Contact Phase Matrix or yoursales representative if you think these assemblies require service.
WARNING
Do not attempt to repair or dissemble the microwave converterassembly. This assembly contains beryllia (beryllium oxide), which,if handled improperly, could pose a health hazard.
COUNTER IDENTIFICATION
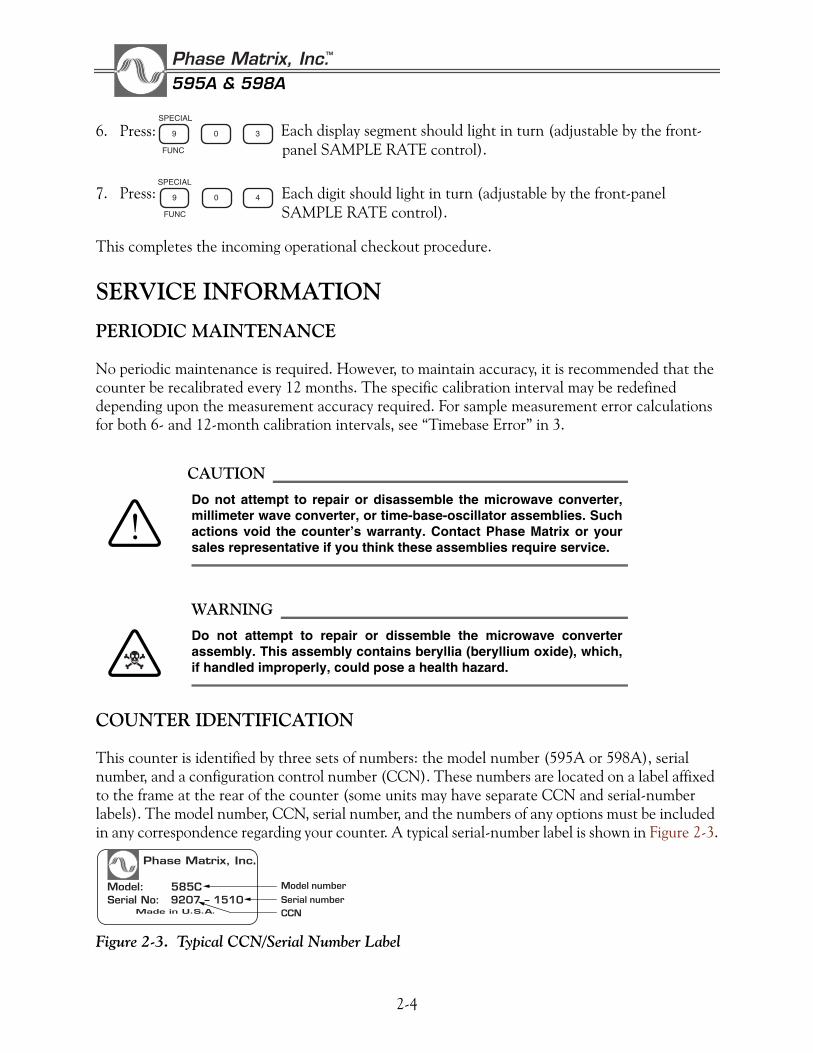
This counter is identified by three sets of numbers: the model number (595A or 598A), serial number, and a configuration control number (CCN). These numbers are located on a label affixed to the frame at the rear of the counter (some units may have separate CCN and serial-number labels). The model number, CCN, serial number, and the numbers of any options must be included in any correspondence regarding your counter. A typical serial-number label is shown in Figure 2-3.
Figure 2-3. Typical CCN/Serial Number Label
SPECIAL
FUNC
09 3 Each display segment should light in turn (adjustable by the front-panel SAMPLE RATE control).
SPECIAL
FUNC
09 4
Each digit should light in turn (adjustable by the front-panelSAMPLE RATE control).
CCNSerial numberModel number585C

2-5
2/INSTALLATION
FACTORY SERVICE
If the counter is being returned to Phase Matrix for service or repair, be sure to include the following information with the shipment:
• Name and address of owner.
• Model, complete serial number, and CCN of the counter.
• A complete description of the problem. (Under what conditions did the problem occur? What was the signal level? What equipment was attached or connected to the counter? Did that equipment experience failure symptoms?)
• Name and telephone number of someone familiar with the problem that may be contacted by Phase Matrix for any further information if necessary.
• Shipping address to which the counter is to be returned. Include any special shipping instructions.
Pack the counter for shipping as detailed below.
SHIPPING INSTRUCTIONS
Wrap the counter in heavy plastic or kraft paper, and repack in original container if available. If the original container cannot be used, use a heavy (275 pound test) double-walled carton with approximately four inches of packing material between the counter and the inner carton. Seal carton with strong filament tape or strapping. Mark the carton to indicate that it contains a fragile electronic instrument. Clearly mark the carton to indicate that the contents were manufactured in the U.S.A. Ship the carton to the Phase Matrix address on the cover of this manual.

2-6
Phase Matrix, Inc.TM
595A & 598A
This Page Intentionally Left Blank

3-1
3
INTRODUCTIONThis section lists the counter controls, connectors, and indicators, explains how each counter function operates, and provides some general measurement considerations.
NOTE
A carrying case, a tool kit, and rack-mounting kits that are available fromPhase Matrix for the 595A and 598A counters are described in Section 4.
FRONT PANEL CONTROLS, INDICATORS, AND CONNECTORS
Figure 3-1. Front Panel Controls and Indicators
POWER
SAMPLE RATE
MODEL 588C PULSE/CW MICROWAVE FREQUENCY COUNTER
HOLD
GATE INIT
PULSE GENERATOR
WIDTH
DELAY
DELAY
DISPLAY CLEAR
POWER
PERIOD
DATA
MODE
DISPLAYLOCALSEARCH
B2
HzGHz MHz kHz
I
O
ON
STBY
OPERATION

3-2
Phase Matrix, Inc.TM
595A & 598A
• POWER switch — selects ON or STBY. In the standby position power is applied to the oven oscillator, if installed, and to the primary side of the power transformer.
WARNING
Whenever AC power is connected to this instrument, the powersupply is energized. Therefore, exercise caution whenever thecovers are removed.
• SAMPLE RATE/HOLD control — varies time between measurements from 0.1 to 10 seconds (nominal). The last reading is retained indefinitely in HOLD.
• GATE indicator — lights when the signal gate is open and a measurement is being made.
• SEARCH indicator — lights when the counter is not locked to an input signal.
• Data display — 12-digit numeric display provides direct read-out of measurement data. Frequency data is displayed in a fixed position format that is sectionalized in GHz, MHz, kHz and Hz. When active, pulse parameter data (pulse width and pulse period) is displayed in the three least significant digits of the frequency display in a floating point format.
• Status display — A series of annunciators provided to indicate current operating status of the counter (see Figure 3-2).
• Keyboard — Both data entry and function selection are controlled through the keyboard (see Keyboard Operation on page 3-7).
STATUS DISPLAY
Figure 3-2. Status Display
• sec — indicates pulse parameters are being displayed in seconds.
• ms — indicates pulse parameters are being displayed in milliseconds.
• us — indicates pulse parameters are being displayed in microseconds.
• dBm — indicates power is being displayed in dBm.
• B0 — lights when Band 0 is selected.
• B1 — lights when Band 1 is selected.
• B2 — lights when Band 2 is selected.
B0sec PW LO PRF LSN
B2 DLY CF SPC SRQ
B1 PP HI HLD TLK
B3 GENCAL EXT RMT
us
dBm
ms

3-3
3/OPERATION
• B3 — lights when any sub-band of Band 3 is selected.
• PW (pulse width) — lights when the pulse width display function is selected.
• PP (pulse period) — lights when the pulse period display function is selected.
• DLY (delay) — lights when the pulse generator (optional) display delay function is selected.
• LO (frequency limit low) — lights when a low limit other than the factory default is being used.
• HI (frequency limit high) — lights when a high limit other than the factory default is being used.
• CF (center frequency) — lights when the center frequency mode of operation is enabled.
• GEN (generator) — lights when optional delaying pulse generator is active.
• PRF (minimum pulse repetition frequency) — lights when a MINPRF other than the factory default is being used.
• HLD (hold) — lights when measurement updating is disabled.
• SPC (special function) — lights when a special function is enabled.
• EXT (external reference) — lights when the counter is set to an external timebase reference.
NOTE
For proper counter operation: when the EXT function is selected, a 10 MHzexternal reference MUST be applied to the rear panel input connector.
GPIB STATUS INDICATORS
• LSN (listen) — lights when the counter is addressed as a listener by the GPIB.
• TLK (talk) — lights when the counter is addressed as a talker by the GPIB.
• SRQ (service request) — lights when the counter is sending a service request.
• RMT (remote) — lights to indicate that the front panel controls are disabled and the counter is being controlled by the GPIB.

3-4
Phase Matrix, Inc.TM
595A & 598A
SIGNAL INPUT CONNECTORS
Figure 3-3. Signal Input Connectors (Model 598A Shown)
• BAND 0 (BNC female) — has a nominal input impedance of 50 Ω and is used for CW measurements in the range of 100 Hz to 250 MHz.
• BAND 1 (BNC female) — has a nominal input impedance of 50 Ω and is used for measurements in the range of 250 MHz to 1 GHz.
• BAND 2 (precision N female for Model 595A, GPC 3.5 female for Model 598A) — has a nominal input impedance of 50 Ω and is used for measurements in the range of 1 GHz to 20 GHz (26.5 GHz for 598A).
• BAND 3 (Optional – for Model 598A only, SMA female) — Used for measurements in the range of 26.5 to 170 GHz. This input is used in conjunction with the Model 890 Frequency Extension Cable Kit and a remote sensor.
REAR PANEL CONTROLS AND CONNECTORS
Figure 3-4. Rear Panel Controls and Connectors
• BAND 0, BAND 1, BAND 2, and BAND 3 — are provided on instruments with optional rear panel inputs (Option 5803).
250 MHz - 1 GHz
100 Hz - 250 MHz
BAND 0
950 MHz - 26.5 GHz
26.5 GHz - 170 GHz
50OHM
50 OHM
50 OHM
REMOTE SENSOR
BAND 1
BAND 2BAND 3
BAND0,1BAND2BAND3
INPUT POWER
!+7 dBm Maximum +27 dBm DAMAGE+7dBm Maximum +45 dBm DAMAGE+5 dBm Maximum +10 dBm DAMAGE
BAND 3 BAND 2BAND 0
BAND 1
(CW ONLY)
TRIGGERIN
TRIGGEROUT
PULSEOUT
INHIBITIN
120
GPIB IEEE488/197810 MHzIN/OUT
THRESHOUT
GATEOUT
WARNING:TO AVOID ELECTRIC SHOCK:DO NOT REMOVE COVERS.NO USER SERVICABLE PARTS INSIDE.REFER ALL SERVICING TO QUALIFIED PERSONNEL.THIS UNIT MUST BE GROUNDED.
LINE SELECT 100 V or 115/120 V 200 V or 220/240 V
FUSE: 1.5 A SB 0.75 A SB
FREQ: 50 - 60 Hz 50 - 60 Hz
100 VA MAX.

3-5
3/OPERATION
• THRESH OUT — is the digitized pulse envelope. When the counter has a converter lock and a signal is present, the output is a TTL high into 50 Ω. Without a converter lock, the output is a TTL low. The Thresh Out and the Gate Out, together, show exactly where in the pulse the measurement is being taken.
• GATE OUT — represents the gate to the Count Chain board. The gate output follows the actual gate, not the gate enable. When the gate is active, the output is a TTL high into 50 Ω; otherwise, the output is a TTL low. The Threshold Out and the Gate Out, together, show exactly where in the pulse the measurement is being taken.
• 10 MHz IN/OUT — provides a 10 MHz square wave output at 1 V p-p, AC coupled into 50 Ω, when the counter’s internal timebase is enabled. Accepts a 10 MHz 1 V p-p signal into 1000 Ω for external timebase operation. Special Functions 08 and 09 are used to select either the external or internal timebase.
• INHIBIT IN — used to delay frequency measurements. TTL level input is used to control when the counter can perform a measurement. A TTL high on this input allows counter to search, center, and perform measurements on incoming signals. A TTL low on this input prevents the counter from detecting an incoming signal, inhibiting signal measurements.
• GPIB — connects the instrument to the IEEE 488 - 1978 bus.
• AC Power Connector — accepts the power cord supplied with the counter.
• DELAYING PULSE GENERATOR (OPTIONAL)
• TRIGGER IN — TTL input signal for triggering the internal delaying pulse generator. Input impedance is approximately 1 kΩ. Trigger polarity is selectable using Special Functions 12 and 13.
• TRIGGER OUT — TTL output signal, 50 to 100 ns in duration, with a low-to-high transition occurring at delay time equal to zero. This output is capable of driving 50 Ω.
• PULSE OUT — TTL output pulse from the internal delaying pulse generator. This output is capable of driving 50 Ω.

3-6
Phase Matrix, Inc.TM
595A & 598A
INSTRUMENT DEFAULT SETTINGSWhen the counter is initially turned on the state of the counter is determined by a set of default values which are stored in memory. The factory-set (default) values for all instrument settings are listed in Table 3-1.
• Models 598A and 598A both offer a feature that enables the user to customize the state of the instrument at turn-on. For more information on this feature, see Special Functions 72 and 73.
Table 3-1. Instrument Default SettingsParameter Default ValueBand 2 (microwave band)Subband 1Resolution 3 (1 kHz)Special Function 00 (all cleared)Average 01Frequency Multiplier 01Frequency Offset 0 kHzMinimum PRF 2 kHzFrequency Limit Low 900 MHzFrequency Limit High 20.5 GHz (Model 595A)
26.7 GHz (Model 598A)Center Frequency 0 kHz (not active)ΔF 50 MHzFrequency Display OnPulse Width Measurements OffPulse Period Measurements OffPower Measurements OffPulse Generator (Optional)
Width 1 μsDelay 50 nsPeriod 10 μsMode 0 (not active)
3-7
3/OPERATION
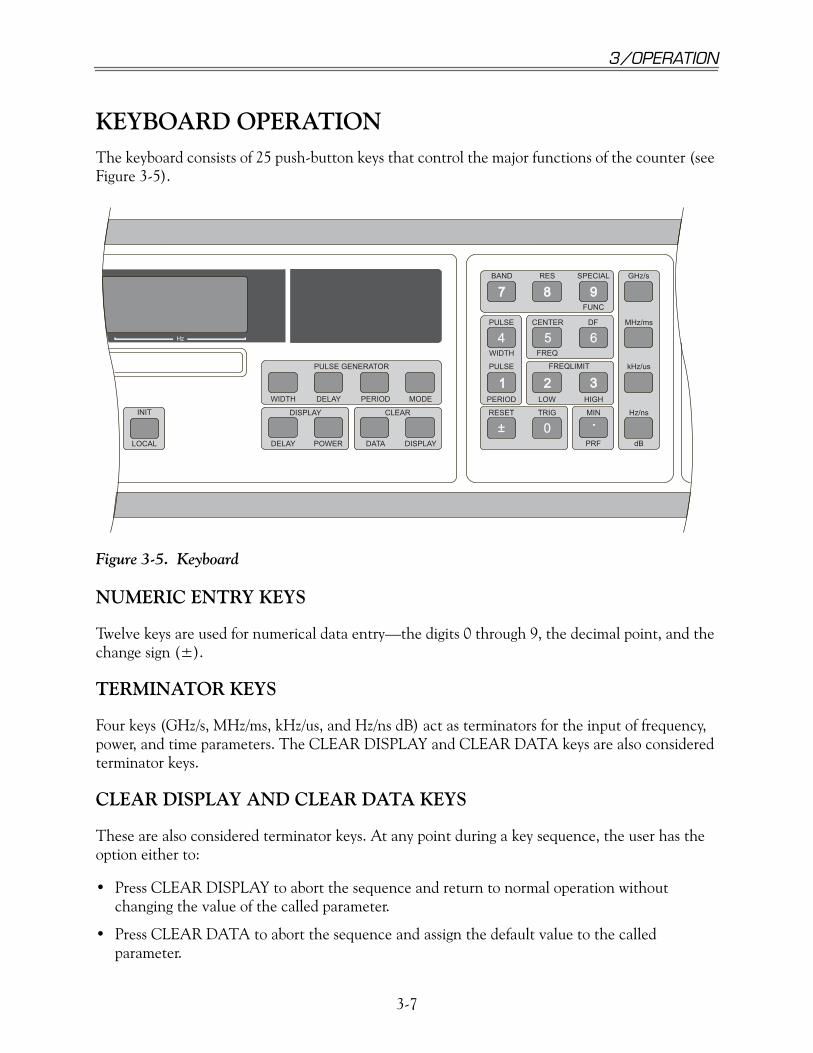
KEYBOARD OPERATIONThe keyboard consists of 25 push-button keys that control the major functions of the counter (see Figure 3-5).
Figure 3-5. Keyboard
NUMERIC ENTRY KEYS
Twelve keys are used for numerical data entry—the digits 0 through 9, the decimal point, and the change sign (±).
TERMINATOR KEYS
Four keys (GHz/s, MHz/ms, kHz/us, and Hz/ns dB) act as terminators for the input of frequency, power, and time parameters. The CLEAR DISPLAY and CLEAR DATA keys are also considered terminator keys.
CLEAR DISPLAY AND CLEAR DATA KEYS
These are also considered terminator keys. At any point during a key sequence, the user has the option either to:
• Press CLEAR DISPLAY to abort the sequence and return to normal operation without changing the value of the called parameter.
• Press CLEAR DATA to abort the sequence and assign the default value to the called parameter.
INIT
PULSE GENERATOR
WIDTH
DELAY
DELAY LOW
FREQ
DISPLAY RESET TRIGCLEAR MIN Hz/ns
GHz/sSPECIALRESBAND
MHz/msDFCENTER
kHz/us
PULSE
PULSE FREQLIMIT
POWER
PERIOD HIGH
FUNC
DATA PRF
WIDTH
PERIODMODE
DISPLAY dBLOCAL
Hz
77
4
11
±
88
5
22
0
99
6
33
"

3-8
Phase Matrix, Inc.TM
595A & 598A
PARAMETER CALL KEYS
The operation of the counter is controlled by the values of the measurement parameters. These parameters can be changed by the user through the keyboard or via GPIB. Twelve of the keys, called parameter call keys, are also used to select the measurement parameters. Four of these keys, BAND (which also calls subband), PULSE GENERATOR MODE, RES, and SPECIAL FUNC are used without terminators, while the other eight, CENTER FREQ, FREQ LIMIT LOW, FREQ LIMIT HIGH, MIN PRF, PULSE GENERATOR DELAY, PULSE GENERATOR PERIOD, PULSE GENERATOR WIDTH, and Δ FREQ are used with the terminator keys. The parameter call keys are dual-function keys since they are also used for numeric data entry.
PARAMETER CALL KEYS USED WITHOUT TERMINATOR
BAND
This key controls the frequency measurement range. Select the appropriate band according to Table 3-2.
KEYBOARD EXAMPLES:
Press: to select the default band.
Press: to select Band 2.
GPIB EXAMPLE:
Enter: Send 0, 18, “BAND 2", NLend to select Band 2.
SUBBAND (CALLED USING BAND KEY)
This parameter controls the frequency measurement range of Band 3. It is set according to the remote sensor being used. Select the appropriate subband per Table 3-3.
Table 3-2. Band Key
Band Range
0 100 Hz to 250 MHz
1 250 MHz to 1 GHz
2 1 GHz to 20 GHz (Model 595A)1 GHz to 26.5 GHz (Model 598A)
3 26.5 to 170 GHz (Optional - Model 598A only)
B A N D C L E A R
D ATA
B A N D
2

3-9
3/OPERATION
KEYBOARD EXAMPLES:
Press: to select default subband.
Press: to select Band 3, subband 4.
Press: to display the band without changing it.
GPIB EXAMPLES:
Enter: Send 0, 18, “BAND 3, SUBBAND 4", NLend to select Band 3, subband 4.
Enter: Send 0, 18, “SUBBAND 4", NLend to select subband 4 (if counter is already in Band 3). This command does not automatically set counter to Band 3.
PULSE GENERATOR MODE
This key is used to turn on the optional internal delaying pulse generator and to select the trigger source.
KEYBOARD EXAMPLES:
Press: to select default value.
Press: to turn off the pulse generator.
Press: to trigger from an external source.
Press: for continuous internal trigger.
Press: to trigger from input RF signal threshold.
Table 3-3. Subband Selection
Subband Range (GHz) Subband Range (GHz)
1 26.5 to 40 5 60 to 90
2 33 to 50 6 75 to 110
3 40 to 60 7 90 to 140
4 50 to 75 8 110 to 170
BAND
DATA
CLEAR
3
BAND
3 4
BAND CLEAR
D ISPLAY
CLEAR
DATAMODE
MODE
0
MODE
1
MODE
2
MODE
3

3-10
Phase Matrix, Inc.TM
595A & 598A
GPIB EXAMPLES:
Enter: Send 0, 18, “GMODE 1", NLend to trigger from external source.
Enter: Send 0, 18, “GMODE 2", NLend for continuous internal trigger.
Enter: Send 0, 18, “GMODE 3", NLend to trigger from input RF signal threshold.
Enter: Send 0, 18, “GMODE 0", NLend to turnoff pulse generator.
RES
This key controls the frequency measurement resolution. Select the desired resolution according to Table 3-4.
KEYBOARD EXAMPLES:
Press: to select default resolution.
Press: to select resolution 2 (100 Hz).
Press: to select resolution 9 (1 GHz).
Table 3-4. Frequency Measurement Resolution
Selection Resolution Gate Time
0 1 Hz 1 sec
1 10 Hz 100 ms
2 100 Hz 10 ms
3 1 kHz 1 ms (default)
4 10 kHz 100 μs
5 100 kHz 10 μs
6 1 MHz 1 μs
7 10 MHz 1 μs
8 100 MHz 1 μs
9 1 GHz 1 μs
RES CLEAR
DATA
RES
2
RES
9
3-11
3/OPERATION
GPIB EXAMPLE:
Enter: Send 0, 18, “RESOLUTION 2", NLend to select resolution 2 (100 Hz).
SPECIAL FUNC
This key is used to call any of the various special functions listed in the “Special Functions” section of this manual.
KEYBOARD EXAMPLES:
Press: to clear all activated special functions.
Press: to activate Special Function 01, 200 MHz self test.
Press: to activate Special Function 04, scan digits test.
GPIB EXAMPLE:
Enter: Send 0, 18, “SPECIAL 01", NLend to activate Special Function 01, 200 MHz self-test.
PARAMETER CALL KEYS USED WITH TERMINATOR
CENTER FREQ
This key controls the center of the frequency range in which the counter searches for a signal. The ΔF key controls the search range. This function is used to reduce the acquisition time or to search for a particular signal in a multiple signal environment. This function is only available in bands 2 and 3.
Select Band 2 CENTER FREQ in the range of 1 GHz to 20 GHz for Model 595A, and in the range of 1 GHz to 26.5 GHz for Model 598A. The counter searches and locks onto signals within ±ΔF from the entered value. Depending on input signal power and frequency, the counter can lock on signals outside the ΔF frequency range. The actual locking range is determined by the entered ΔF frequency, input signal level, the maximum frequency range of Band 2, and the bandpass of the YIG filter located at the input to Band 2.
Select Band 3 CENTER FREQ in the range of the subband currently selected. The counter locks on signals ±2 GHz from the entered center frequency. The ΔF key is not active in Band 3. The counter does not reject signals outside this range. If a signal more than ±2 GHz from the entered center frequency is applied, an erroneous reading may result.
The entered center frequency value is truncated to 10 MHz resolution. The number can be entered in any fixed-point format; the units terminator determines the scale of the input number.
CLEARSPECIAL
DATAFUNC
SPECIAL
FUNC
0 1
SPECIAL
FUNC
0 4

3-12
Phase Matrix, Inc.TM
595A & 598A
KEYBOARD EXAMPLES:
Press: to disable center-frequency operation.
Press: to select a 14.8 GHz value.
Press: to select a 2170 MHz (2.17 GHz) value (truncatedto 10 MHz resolution).
GPIB EXAMPLE:
Enter: Send 0, 18, "CENTERFREQ 14.8 GHZ", NLend to select a center frequency of 14.8 GHz.
FREQ LIMIT LOW
This key controls the low end of the frequency window that is searched for a signal in Band 2. Select frequency limit low in the range of 900 MHz to 20.5 GHz for Model 595A, and in the range of 900 MHz to 26.7 GHz for Model 598A. The value entered is truncated to 10 MHz resolution. This function is only available in Band 2. The frequency limit low must always be less than the frequency limit high. The number can be entered in any fixed-point format; the units terminator determines the scale of the input number.
KEYBOARD EXAMPLES:
Press: to select the default value.
Press: to select a 2.35 GHz value.
Press: to select 3130.0 MHz (3.13 GHz) (truncated to 10 MHz resolution).
GPIB EXAMPLE:
Enter: Send 0, 18, “LOWLIMIT 2.35 GHZ”, NLend to select a 2.35 GHz value.
FREQ LIMIT HIGH
This key controls the high end of the frequency window that is searched for a signal in Band 2. Select the high frequency limit in the range of 900 MHz to 20.5 GHz for Model 595A, and in the range of 900 MHz to 26.5 GHz for Model 598A.
The value entered is truncated to 10 MHz resolution. This function is only available in Band 2. Frequency limit high must always be greater than frequency limit low.
CLEARCENTER
DATAFREQ
CENTER GHz/s
FREQ
1 4 . 8
CENTER MHz/ms
FREQ
2 1 7 5
CLEARFREQ LIMIT
DATALOW
FREQ LIMIT GHz/s
LOW
2 . 3 5
FREQ LIMIT MHz/ms
LOW
3 1 3 6 . 3

3-13
3/OPERATION
The number can be entered in any fixed-point format; the units terminator determines the scale of the input number.
KEYBOARD EXAMPLES:
Press: to select the default value.
Press: to select a 3.2 GHz value.
Press: to select a 21090 MHz (21.09 GHz) value(truncated to 10 MHz resolution).
GPIB EXAMPLE:
Enter: Send 0, 18, “HIGHLIMIT 3.2 GHZ”, NLend to select a 3.2 GHz value.
MIN PRF
This key controls the minimum pulse repetition frequency of the pulsed signals that can be acquired and measured by the counter. For example, if a MIN PRF of 500 Hz is selected, the counter only measures signals with a minimum pulse repetition frequency of 500 Hz or greater. This parameter affects the acquisition speed indirectly by affecting two internal processes: the time of waiting for a pulse at each frequency step in the frequency range search, and the time of waiting for a pulse when taking measurements before declaring a “signal lost” condition. CW signals can always be acquired and counted regardless of the specified MIN PRF.
Select MIN PRF in the range of 1 Hz to 100 kHz, depending on the minimum pulse repetition frequency of the signal being measured. The number can be entered in any fixed-point format; the units terminator determines the scale of the input number.
NOTE
If the PRF of the input signal is less than the MIN PRF chosen, erroneousmeasurements may be displayed.
KEYBOARD EXAMPLES:
Press: to select the default value.
Press: to select a 500 Hz value.
CLEARFREQ LIMIT
DATAHIGH
FREQ LIMIT GHz/s
HIGH
3 . 2
FREQ LIMIT MHz/ms
HIGH
2 1 0 9 8
CLEARMIN
DATAPRF
MIN Hz/ns
PRF dB
5 0 0

3-14
Phase Matrix, Inc.TM
595A & 598A
GPIB EXAMPLE:
Enter: Send 0, 18, “MINPRF 500 HZ”, NLend to select a minimum pulse repetition frequency value of 500 Hz.
PULSE GENERATOR DELAY
This key is used to control the delay from trigger of the output pulse from the optional internal delaying pulse generator. The delay can be set in increments of 2 ns, from a minimum of 74 ns (values smaller than 74 ns may be entered, but the minimum guaranteed is 74 ns) to a maximum of 800 ms using either the keyboard or GPIB. Entries made to a resolution finer than 2 ns are rounded down to the closest 2 ns value.
KEYBOARD EXAMPLES:
Press: to select the default value (50 ns).
Press: to set delay to 100 ns.
GPIB EXAMPLES:
Enter: Send 0, 18, "GDELAY 100 NS", NLend to set delay to 100 ns
Enter: Send 0, 18, "GDELAY 5 MS", NLend to set delay to 5 ms.
PULSE GENERATOR PERIOD
This key is used to control the period of the output signal from the internal delaying pulse generator. In MODES 1 and 3, the period of the signal is determined by the trigger source, so this parameter only applies when the pulse generator is in the continuous trigger mode (MODE 2). The pulse period can be set in increments of 50 ns, from a minimum of 100 ns to a maximum of 800 ms using either the keyboard or GPIB. Entries made to a resolution finer than 50 ns are rounded down to the closest 50 ns value.
KEYBOARD EXAMPLES:
Press: to select the default value (10 μs).
Press: to set the period to 100 ns.
Press: to set the period to 100 ms.
DELAY DATA
CLEARPULSE GEN
DELAY
nsPULSE GEN
1 0 0
DELAY DATA
PULSE G CLEAREN
DELAY
nsPULSE GEN
1 0 0
PERIOD
msPULSE GEN
1 0 0
3-15
3/OPERATION
GPIB EXAMPLES:
Enter: Send 0, 18, “GPERIOD 100 MS”, NLend to set period to 100 ms.
Enter: Send 0, 18, “GPERIOD 100 US”, NLend to set period to 100 μs.
PULSE GENERATOR WIDTH
This key is used to control the output pulse width for the optional internal delaying pulse generator. The pulse width can be set in 2 ns increments, from a minimum of 24 ns to a maximum of 800 ms using either the keyboard or GPIB. Entries made to a resolution finer than 2 ns are rounded down to the closest 2 ns value.
KEYBOARD EXAMPLES:
Press : to select default value (1 μs).
Press: to set width to 50 ns.
GPIB EXAMPLES:
Enter: Send 0, 18, “GWIDTH 50 NS”, NLend to set width to 50 ns.
Enter: Send 0, 18, “GWIDTH 5 MS”, NLend to set width to 5 ms.
Δ FREQ
This key controls the search range for the center frequency function. It defaults to a range of ±50 MHz, but can be set from 0 to the full range of the selected band in increments of 10 MHz. ΔF is only available in Band 2.
The counter searches ±ΔF around the center frequency. Setting ΔF to zero is a special case. If ΔF is zero the counter does not search for the signal. The YIG filter is moved to the entered center frequency, and if a signal is present, it is measured. Since the counter does not search for the signal, when ΔF equals zero, the signal acquisition time is effectively eliminated.
ONE-SHOT ACTION KEYS
The remaining keys are called one-shot action keys. These are DISPLAY DELAY, DISPLAY POWER, INIT/LOCAL, PULSE PERIOD, PULSE WIDTH, RESET, and TRIG.
• DISPLAY DELAY — causes the counter to display the current delay time of the internal delaying pulse generator in the parameter display.
• DISPLAY POWER — turns the power measurement on or off. The result is displayed in the parameter display.
WIDTH
PULSE GEN
3
CLEAR
DATA
WIDTH
nsPULSE GEN
5 0

3-16
Phase Matrix, Inc.TM
595A & 598A
• INIT/LOCAL — when the counter is in local mode, this key causes the counter to be initialized to the power-on state. When the counter is in remote mode, the INIT/LOCAL key causes a return to local mode (unless a GPIB local lockout is active).
• PULSE WIDTH — turns the pulse width measurement on or off. The result is displayed in the parameter display.
• PULSE PERIOD — turns the pulse period measurement on or off. The result is displayed in the parameter display.
NOTE
When DISPLAY DELAY, DISPLAY POWER, PULSE WIDTH, or PULSEPERIOD are enabled, the frequency display is limited to 100 kHz resolutionand the parameter is displayed in the three rightmost digits (the parameterdisplay). If Special Function 69 is active when the parameter is enabled,frequency is not displayed and the parameter occupies the entire display.
• RESET — resets the converter and restarts the signal acquisition process. If a signal is found, a measurement is taken, even if the counter is in HOLD.
• TRIG — begins a new measurement cycle. If a measurement cycle is in progress, it is aborted and a new cycle is begun.
THEORY OF OPERATIONThe Phase Matrix 595A/598A Pulsed Microwave Frequency/Power Counters are able to automatically measure the frequency and power of repetitive pulsed signals as well as CW signals. Pulse widths from 50 nanoseconds to 1 second and pulse periods from 250 nanoseconds to 1 second are measured to a resolution of 10 ns. Using an inhibit input, the instruments can profile, in both frequency and power, pulsed or chirped CW signals using gates as narrow as 15 ns. No manual switching is required to select CW or pulse signal measurement. The frequency range of the 595A is 100 Hz to 20 GHz. The frequency range of the 598A is 100 Hz to 26.5 GHz and can be extended by option up to 170 GHz.
Microprocessor control and the unique architecture permit not only the major counter functions such as frequency offsets, frequency range limits, and averaging capabilities, but also a variety of special functions such as internal diagnostics, calibration and test aids, and sophisticated operational enhancements. All primary and background functions are fully programmable.
FUNCTIONAL DESCRIPTION
In the following description, the Phase Matrix 595A/598A is divided into two major portions: the Basic Counter and the RF Converter. The RF Converter is further divided into the RF Band 0 Converter, the RF Band 1 Converter, and the RF Band 2 Microwave Converter. Theory of operation for the Band 3 mm wave converter is provided in the OPTIONS section.

3-17
3/OPERATION
BASIC COUNTER
The Basic Counter, shown in Figure 3-6, receives input signals from all four bands and performs both frequency measurements and pulse parameter measurements (pulse width and pulse period). The basic counter can directly measure the frequency of signals from 100 Hz to 250 MHz.
Figure 3-6. Block Diagram of Basic Counter
Overall operation of the counter is controlled by the CPU assembly. This assembly contains a Motorola 68B09 microprocessor, its control logic, the system memory, and the circuitry for the GPIB interface. It communicates with all other assemblies in the counter via a triple bus system: the data bus, address bus, and control bus. Each assembly (except for the Signal Conditioner and Gate Control) contains a peripheral interface adapter (PIA) that provides the interface between the bus system and the counter hardware. The basic counter performs frequency measurements by comparing the unknown signal to a reference frequency, namely the timebase. The standard timebase is a 10 MHz temperature compensated crystal oscillator (TCXO). An optional high- stability ovenized oscillator is also available for improved frequency accuracy. For coherence with system clocks, the counters have the capability of accepting an external 10 MHz reference via the rear panel 10 MHz IN/OUT connector.
A frequency measurement is made by generating a time interval (gate time) consisting of a number of cycles of the reference. This gate time is used as an interval during which the input signal is counted by the Count Chain assembly. This process is considerably more difficult for pulsed signals than it is for CW signals and must be accomplished as a two-step operation. The first step is to supply a gate to the Count Chain that is present only when an input signal is also present. The second step is to accumulate the total time during which the gate is applied, until the desired gate time is reached.
The first step requires that the gate begin after the signal is present at the Count Chain and end prior to the end of the signal. This is accomplished by generating a gate approximately 30 ns shorter than the RF signal. The arrival time at the Count Chain of the IF from the converter is then controlled by a delay line so the gate signal falls entirely within the IF pulse width.
FROM IFTHRESHOLDDETECTOR
INHIBIT FROMREAR PANEL
GATEGENERATOR
GATEACCUMULATOR
80 MHz PHASELOCK LOOP
10 MHzTIMEBASE
WAVESHAPINGNETWORK
COUNTCHAIN
DIVIDE BY 4PRESCALER
DELAYLINE
RF/IF
VCO400-505 MHz
FROMBAND 2
CONVERTER
FROMSIGNAL
CONDITIONER
3-18
Phase Matrix, Inc.TM
595A & 598A
The second step is accomplished by counting reference clock pulses whenever the gate is open until a total time equal to is obtained. This requires that each gate opening be an exact integral number of clock pulses. Since an 80 MHz clock is being used, the gate is always an exact multiple of 12.5 ns.
Pulse widths are measured by detecting the signal and counting the number of zero crossings of the phase locked VCO signal (prescaled by 4) that occur while the signal is present. The microprocessor then calculates the pulse width by multiplying the number of zero crossings by the period of the VCO signal. Pulse period measurements are made using a similar technique, except that the counter counts zero crossings during the time from the rising edge of one pulse to the rising edge of the next pulse.
RF CONVERTER
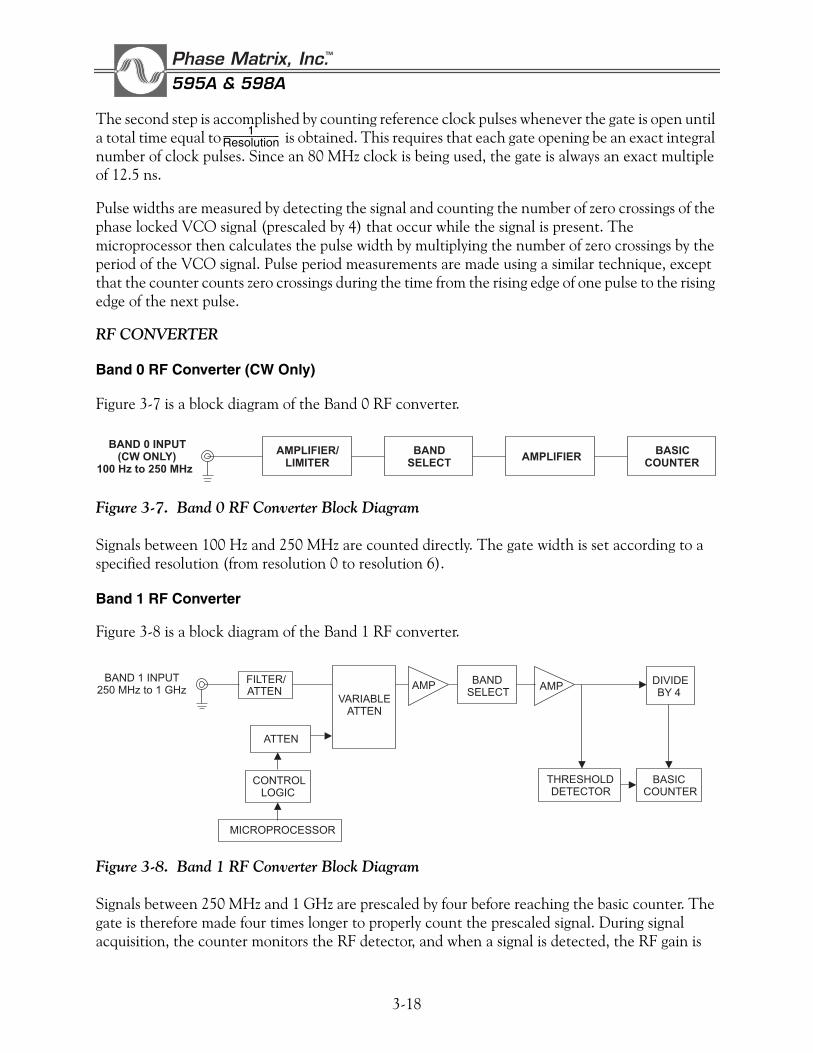
Band 0 RF Converter (CW Only)
Figure 3-7 is a block diagram of the Band 0 RF converter.
Figure 3-7. Band 0 RF Converter Block Diagram
Signals between 100 Hz and 250 MHz are counted directly. The gate width is set according to a specified resolution (from resolution 0 to resolution 6).
Band 1 RF Converter
Figure 3-8 is a block diagram of the Band 1 RF converter.
Figure 3-8. Band 1 RF Converter Block Diagram
Signals between 250 MHz and 1 GHz are prescaled by four before reaching the basic counter. The gate is therefore made four times longer to properly count the prescaled signal. During signal acquisition, the counter monitors the RF detector, and when a signal is detected, the RF gain is
1Resolution----------------------------
BAND 0 INPUT(CW ONLY)
100 Hz to 250 MHz
AMPLIFIER/LIMITER
BANDSELECT
AMPLIFIERBASIC
COUNTER
BAND 1 INPUT250 MHz to 1 GHz
VARIABLEATTEN
AMPBAND
SELECTAMP
CONTROLLOGIC
MICROPROCESSOR
ATTEN
ATTENFILTER/ DIVIDE
BY 4
BASICCOUNTER
THRESHOLDDETECTOR
3-19
3/OPERATION
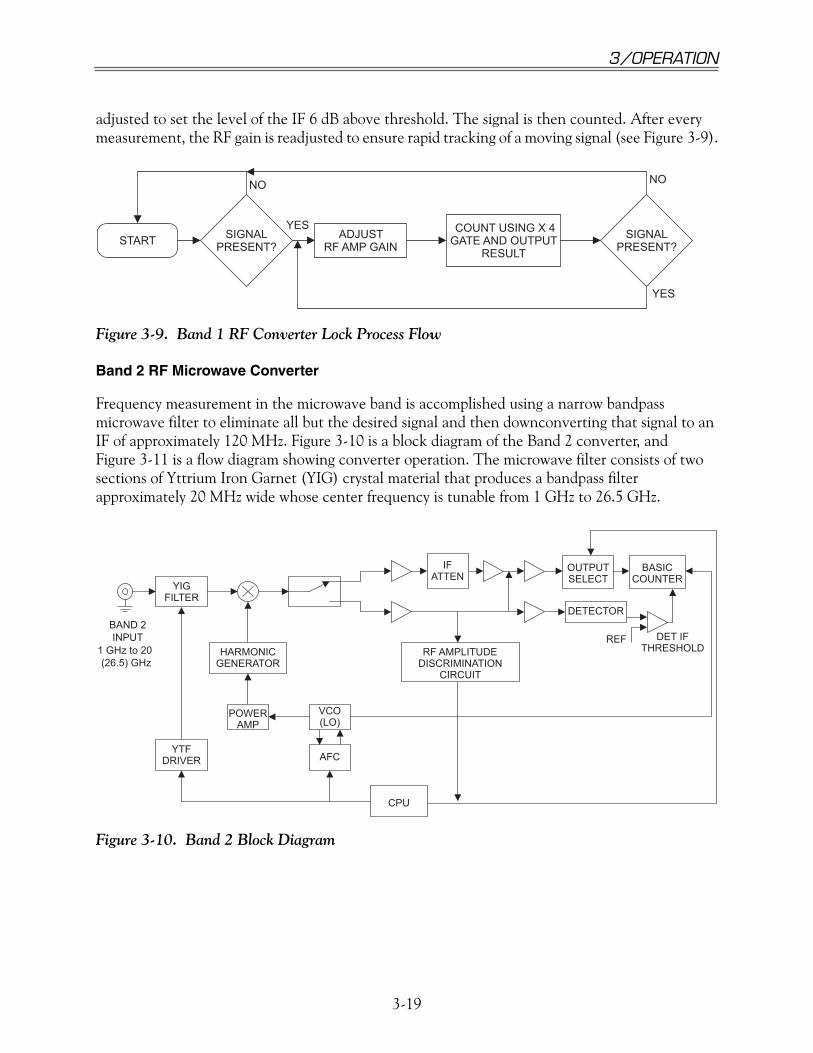
adjusted to set the level of the IF 6 dB above threshold. The signal is then counted. After every measurement, the RF gain is readjusted to ensure rapid tracking of a moving signal (see Figure 3-9).
Figure 3-9. Band 1 RF Converter Lock Process Flow
Band 2 RF Microwave Converter
Frequency measurement in the microwave band is accomplished using a narrow bandpass microwave filter to eliminate all but the desired signal and then downconverting that signal to an IF of approximately 120 MHz. Figure 3-10 is a block diagram of the Band 2 converter, and Figure 3-11 is a flow diagram showing converter operation. The microwave filter consists of two sections of Yttrium Iron Garnet (YIG) crystal material that produces a bandpass filter approximately 20 MHz wide whose center frequency is tunable from 1 GHz to 26.5 GHz.
Figure 3-10. Band 2 Block Diagram
STARTSIGNAL
PRESENT?ADJUST
RF AMP GAIN
COUNT USING X 4GATE AND OUTPUT
RESULT
SIGNALPRESENT?
NO
YES
YES
NO
BAND 2
INPUT
1 GHz to 20
(26.5) GHz
YIGFILTER
YTFDRIVER
CPU
AFC
VCO(LO)
POWERAMP
HARMONICGENERATOR
RF AMPLITUDEDISCRIMINATION
CIRCUIT
DETECTOR
OUTPUTSELECT
BASICCOUNTER
IFATTEN
REF DET IFTHRESHOLD
3-20
Phase Matrix, Inc.TM
595A & 598A
The actual process of signal measurement in the microwave band is accomplished using a series of steps:
1. Search for the largest signal.
2. Center the YIG on the largest signal.
3. Calculate the harmonic number and required VCO frequency for the local oscillator (LO).
4. Adjust the IF gain.
5. Measure the IF.
6. Perform calculations.
7. Output measurement results.
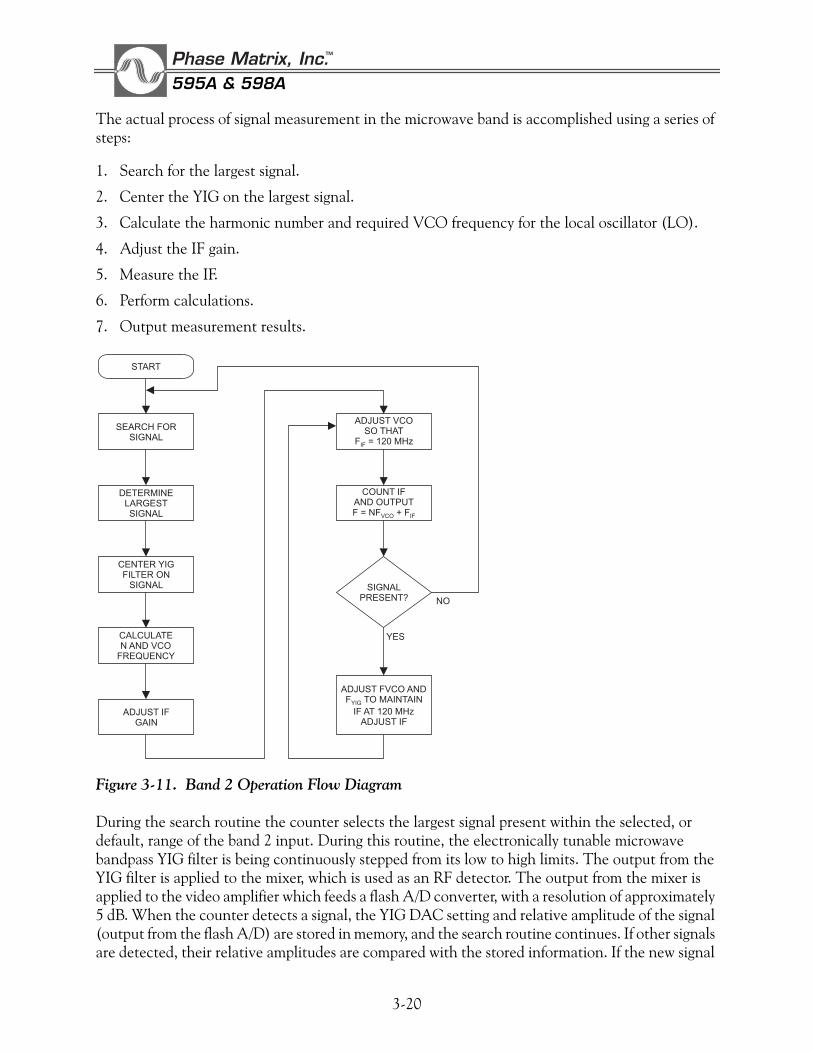
Figure 3-11. Band 2 Operation Flow Diagram
During the search routine the counter selects the largest signal present within the selected, or default, range of the band 2 input. During this routine, the electronically tunable microwave bandpass YIG filter is being continuously stepped from its low to high limits. The output from the YIG filter is applied to the mixer, which is used as an RF detector. The output from the mixer is applied to the video amplifier which feeds a flash A/D converter, with a resolution of approximately 5 dB. When the counter detects a signal, the YIG DAC setting and relative amplitude of the signal (output from the flash A/D) are stored in memory, and the search routine continues. If other signals are detected, their relative amplitudes are compared with the stored information. If the new signal
START
SEARCH FORSIGNAL
DETERMINELARGESTSIGNAL
CENTER YIGFILTER ON
SIGNAL
CALCULATEN AND VCO
FREQUENCY
ADJUST IFGAIN
ADJUST VCOSO THAT
F = 120 MHzIF
COUNT IFAND OUTPUTF = NF + FVCO IF
SIGNALPRESENT?
ADJUST FVCO ANDF TO MAINTAIN
IF AT 120 MHzADJUST IF
YIG
YES
NO
3-21
3/OPERATION
is higher in amplitude, the memory is updated with information on the new signal. After searching the entire band, the YIG DAC setting and relative amplitude of the highest signal present are stored in memory.
The next step is to precisely center the YIG on the selected signal. This process begins by moving the YIG to the signal selected during the search routine. The YIG is then stepped in 2 MHz steps around the signal until four points are found: the points on either side of the peak 1.25 dB down from the peak and the points on either side of the peak 5 dB down from the peak. From these points the approximate “center of mass frequency” of the signal is found, and the YIG filter is set to that frequency. The “center of mass” algorithm compensates for pulsed signals that deviate from perfect sinX/X shape and for nonsymmetries in the YIG filter.
After the YIG is centered on the signal, the harmonic number N is calculated based on the setting of the YIG filter using the following formula:
The resulting N is rounded up to the next higher integer. At this point low side mixing (NFVCO < FIN) is assumed, and the proper VCO frequency is calculated using the formula:
If the results yield a VCO frequency which is less than 400 MHz (the minimum VCO frequency), high side mixing is assumed, and FVCO is recalculated using the formula:
At this point the IF gain is adjusted to set the signal level approximately 6 dB above signal threshold.
Since FYIG is only approximately equal to FIN, the IF frequency (FIF) is not exactly 120 MHz. , therefore, the next step is to adjust the FVCO to shift FIN to the center of the IF passband at 120 MHz. This is done by counting FIF and recalculating FVCO based on the following formula:
Where +FIF is used if high side mixing and – FIF is used if low side mixing.
N =FYIG – 120 MHz
500 MHz
FVCO =FYIG – 120 MHz
N
FVCO =FYIG + 120 MHz
N
FVCO =FYIG ± FIF
N

3-22
Phase Matrix, Inc.TM
595A & 598A
Once the VCO corrections have been made, the counter counts the IF and calculates the input frequency using the following formula and then displays the results:
Where:
N = Harmonic numberFVCO = VCO frequency± = + for low side mixing and – for high side mixing
After each measurement, new frequencies for the YIG and VCO are calculated to maintain the IF at 120 MHz, and the IF gain is readjusted to keep the signal 6 dB above threshold. This method provides rapid tracking of a signal being tuned.
SIGNAL MEASUREMENTS
AUTOMATIC FREQUENCY MEASUREMENTS
The Phase Matrix 595A and 598A Pulsed Microwave Frequency Counters can automatically measure the frequency of CW and repetitive pulse signals having pulse widths as narrow as 50 ns.
To measure the frequency of a CW signal, apply the signal to the input connector that corresponds to the frequency being measured and select the appropriate band. The counter then automatically finds the signal, measures it, and displays the measured frequency.
The average frequency of repetitive pulse signals is measured in much the same way as CW signals. The only difference is that for pulse signals with pulse repetition frequencies of less than 2 kHz, the minimum pulse repetition frequency must be entered into the counter using the MINPRF key on the front panel. If the MINPRF is not set at or below the minimum pulse repetition frequency of the signal to be measured, the counter is unable to lock on the signal.
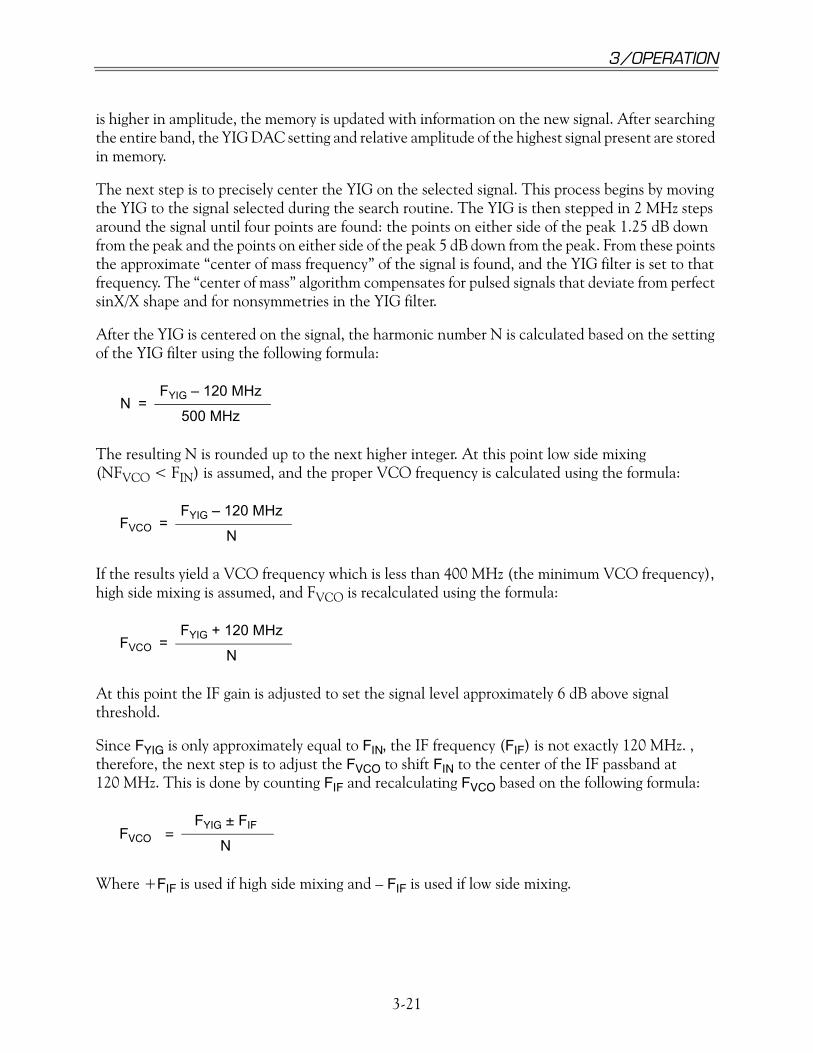
As an example, consider the signal shown in Figure 3-12. The signal is a 2 GHz signal with a pulse width of 1 ms and a pulse period of 2 ms. Since the pulse repetition frequency is the reciprocal of pulse period, the minimum pulse repetition frequency of the signal shown is 500 Hz. Since this is less than 2 kHz, it must be entered into the counter. To enter a minimum pulse repetition frequency of 500 Hz into the counter, press the MIN PRF key followed by the 5 key, the 0 key, and the 0 key; then terminate the sequence with the Hz terminator key. If the signal at this point is applied to the Band 2 input connector and Band 2 is selected, the counter would automatically find the signal and display the frequency on the front panel.
FIN = N x FVCO ± FIF
3-23
3/OPERATION
Figure 3-12. Pulsed Signal
These counters can also automatically measure both the pulse width and the pulse period of the incoming signal to a resolution of 10 ns and the peak power. This is accomplished by pressing the PULSE WIDTH key to measure the pulse width, the PULSE PERIOD key to measure the pulse period, or the DISPLAY POWER key to measure the power.
MULTIPLE SIGNAL MEASUREMENTS
In actual microwave environments, there are often multiple signals present. In a multi-signal environment, the counter automatically finds and measures the largest signal (as specified by amplitude discrimination).
In Band 2, the counter can also measure signals other than the largest signal present. This is accomplished by setting frequency limits around the desired signal. Figure 3-14 shows an example of the frequency limits feature.
Pulse Period
PulseWidth 1 ms
2 ms

3-24
Phase Matrix, Inc.TM
595A & 598A
Figure 3-13. Frequency Limits
If the signals shown in Figure 3-13 are applied to Band 2, the counter automatically finds the signal at 6 GHz since it is the largest signal. If it is desired to measure the signal at 6.3 GHz set the frequency limit low to 6.2 GHz and the frequency limit high to 6.4 GHz. This prevents the counter from seeing either the signal at 6 GHz or the signal at 6.6 GHz.
The counter also provides a center frequency mode which is used in combination with ΔF. In this mode, the counter searches around the entered center frequency ± the entered ΔF. For example, if the center frequency in Figure 3-14 is set to 8 GHz, and ΔF is set to 1 GHz, the counter searches ±1 GHz around the center frequency and measures the signal at 8 GHz.
+20
+10
0
- 10
- 20
- 30
5 6 6.3 6.6 7
INPUT POWER(dBm)
FREQUENCY(GHz)
FREQUENCYLIMIT LOW
FREQUENCYLIMIT HIGH
+10
- 20
- 5
DISPLAYEDFREQUENCY

3-25
3/OPERATION
Figure 3-14. Center Frequency
PULSE PROFILING
Automatic pulsed frequency measurements determine the average frequency across a pulse and the power at the highest point in the pulse. In some cases, however, additional information may be required. For example, a pulsed magnetron may exhibit substantial frequency shift near the leading and trailing edges of the pulse. Other specialized pulsed signals are intentionally ramped in frequency. Repetitive frequency or power variations across a pulsed signal can easily be measured using the counter and either an external delaying pulse generator or the optional internal delaying pulse generator. Figure 3-15 shows a typical setup for profiling frequency changes across a pulsed signal.
+20
+10
0
87 8 . 4 9
INPUT POWER(dBm)
FREQUENCY(GHz)
CENTERFREQUENCY
SEARCH RANGE
-ΔF + FΔ
- 10
- 20
- 30

3-26
Phase Matrix, Inc.TM
595A & 598A
Figure 3-15. Pulse Profile Measurement Test Setup
The output pulse of the signal generator is used as an enable input to the counter. As the pulse delay is varied, the measurement window can be “walked” through the pulse. A plot of frequency-versus-delay gives the frequency-versus-time profile of the pulse directly, as shown in Figure 3-16. A plot of power vs. delay gives the corresponding power-versus-time profile.
The width of the measurement window is determined by the width of the pulse generator output. Measurement windows as narrow as 15 ns can be used, although wider windows yield higher accuracy.
Figure 3-16. Pulse Profile Measurement
DELAYING
* External pulse generator is not required if Option 5810, Internal Delaying Pulse
Generator, is installed.
PULSE GENERATOR*
INPUTSIGNAL
INHIBITINPUT
TRIGGERFROM SOURCE
TRIGGERINPUT
OUTPUTPULSE
INPUT SIGNAL
. . .PROFILEMEASUREMENTWINDOW
FREQUENCY PROFILE
f AVERAGE
TIME
FREQUENCY
p AVERAGE
TIME
POWER

3-27
3/OPERATION
With the optional internal delaying pulse generator, frequency and power profiling is further simplified. For example, consider the repetitive pulsed signal shown below, which is ramping from 5 GHz to 5.2 GHz.
Using the delaying pulse generator in the 595A/598A counter, this signal can be profiled either manually or automatically. When profiling a pulsed signal, the change in frequency across the measurement window must be less than 20 MHz to ensure that the signal passes through the input YIG filter. The signal shown in Figure 3-17 is changing frequency at a rate of 2 MHz per μs, so the maximum width of the measurement window should be less than 10 μs.
Figure 3-17. Frequency Profiling
To profile the signal shown in Figure 3-17 manually, perform the following steps:
1. Set MINPRF to default (2 kHz) using the MINPRF key.
2. Connect your trigger source to the trigger input on the rear panel.
3. Set the measurement window to 5 μs using the Pulse Generator Width key.
4. Set the delay to the minimum delay, of 75 ns, using the Pulse Generator Delay key.
5. Setup the pulse generator to trigger from external trigger input by pressing the Pulse Generator Mode key and entering 1.
6. To minimize signal acquisition time, set frequency limit low at 4.5 GHz and frequency limit high at 5.5 GHz.
The counter automatically finds the signal and displays the average frequency over the 5 μs measurement window beginning 75 ns after the rising edge of the pulse. If power measurement is activated, the counter also measures and displays the peak power over the 5 μs window. The frequency and power can be measured anywhere along the pulse by changing the delay time of the pulse generator.
To profile the signal shown in Figure 3-17 automatically, perform the following steps:
1. Set MINPRF to default (2 kHz) using the MINPRF key.
2. Connect your trigger source to the trigger input on the rear panel.
3. Set the measurement window to 5 μs using the Pulse Generator Width key.
Pulse Period
PulseWidth
100 sμ
200 sμ

3-28
Phase Matrix, Inc.TM
595A & 598A
4. Set the delay to the minimum delay, of 75 ns, using the Pulse Generator Delay key.
5. Set up the pulse generator to trigger on the external signal by pressing the Pulse Generator Mode key and entering 1.
6. To minimize signal acquisition time, set frequency limit low at 4.5 GHz and frequency limit high at 5.5 GHz.
7. Put the counter in hold by turning the sample rate control fully clockwise.
8. Enable the auto profile function by pressing Special Function 77. The counter displays “Inc” (increment) in the three least significant digits of the display.
9. Enter a measurement window increment of 5 μs.
10. The counter displays “End” in the three least significant digits of the display. Enter an end delay of 99 μs.
The counter automatically finds the signal and displays the average frequency and peak power over the 5 μs measurement window beginning 75 ns after the rising edge of the pulse. Press the “Trig” key to increment the measurement window by 5 μs. Each time the “Trig” key is pressed, the measurement window is incremented by 5 μs until the end delay is reached. Press the “Display Delay” key or the “Display Power” key to display the delay or the power.
Frequency and power profiling can be easily automated using Special Function 77 and a computer.
VCO SETTLING TIME MEASUREMENTS
Many complex signals are not pulsed at all, but are continuous signals with frequencies or powers that vary repetitively over time. One example is a settling time measurement of a voltage controlled oscillator (VCO). When a voltage step is applied to the tuning voltage input on a VCO its output frequency changes to reflect the voltage change on the tuning input. However, as shown in Figure 3-18, it takes the VCO a finite amount of time to settle in at the new frequency. The amount of time it takes for the VCO to settle in at the new frequency within some predetermined limits is specified as its settling time. A typical VCO settling time specification would require that the frequency output be within ±10 MHz of the settled frequency within 1 ms after the voltage step is applied to the tuning input on the VCO.
Figure 3-18. VCO Settling Time Measurements
INPUT SIGNAL
PROFILEMEASUREMENT
WINDOW
FREQUENCY PROFILE
AVERAGE
• • •

3-29
3/OPERATION
VCO settling time measurements can easily be made using the counter and a delaying pulse generator(either external or the optional internal delaying pulse generator), as shown in Figure 3-19.
Figure 3-19. Time Varying Signal Measurement Test Setup
With the equipment set up as shown in Figure 3-19, the signal generator provides a repetitive frequency step, square wave modulation, to the VCO under test. The trigger output from the signal generator triggers the delaying pulse generator which in turn provides a measurement window to the counter. The counter measures the VCO during this measurement window. Changing the delay time of the delaying pulse generator moves the measurement window and allows the frequency and power of the VCO to be measured at any point in time relative to the trigger from the signal generator.
Using the optional internal delaying pulse generator further simplifies the setup. For this setup, the trigger from the signal generator is connected directly to the trigger input on the counter and the internal delaying pulse generator provides the measurement window.
FREQUENCY AGILE PULSE MEASUREMENTS
Another type of measurement is that of a repetitive sequence of pulses that differ in frequency. In this case, it is desirable to measure the frequency of each pulse in the sequence separately. The same test setup as shown in Figure 3-19 is required, with the trigger pulse synchronous with the sequence. In this measurement, the input inhibit is used to discriminate between pulses. The enabling pulse can be slightly wider than the pulse to be measured. By shifting the delay time of the enabling pulse, the user can measure each input pulse of the sequence separately.
INPUTSIGNAL
INHIBITINPUT
595A/598A COUNTER
TRIGGEROUTPUT
MODULATIONOUTPUT
FREQUENCYMODULATION
INPUT
MODULATEDMICROWAVE
OUTPUT
VCOTO BE
TESTED
TRIGGERINPUT
TTL OUTPUTPULSE
DELAYINGPULSE GENERATOR*
SIGNAL GENERATOR
* External pulse generator is not required if Option 5810, Internal Delaying Pulse
Generator, is installed.
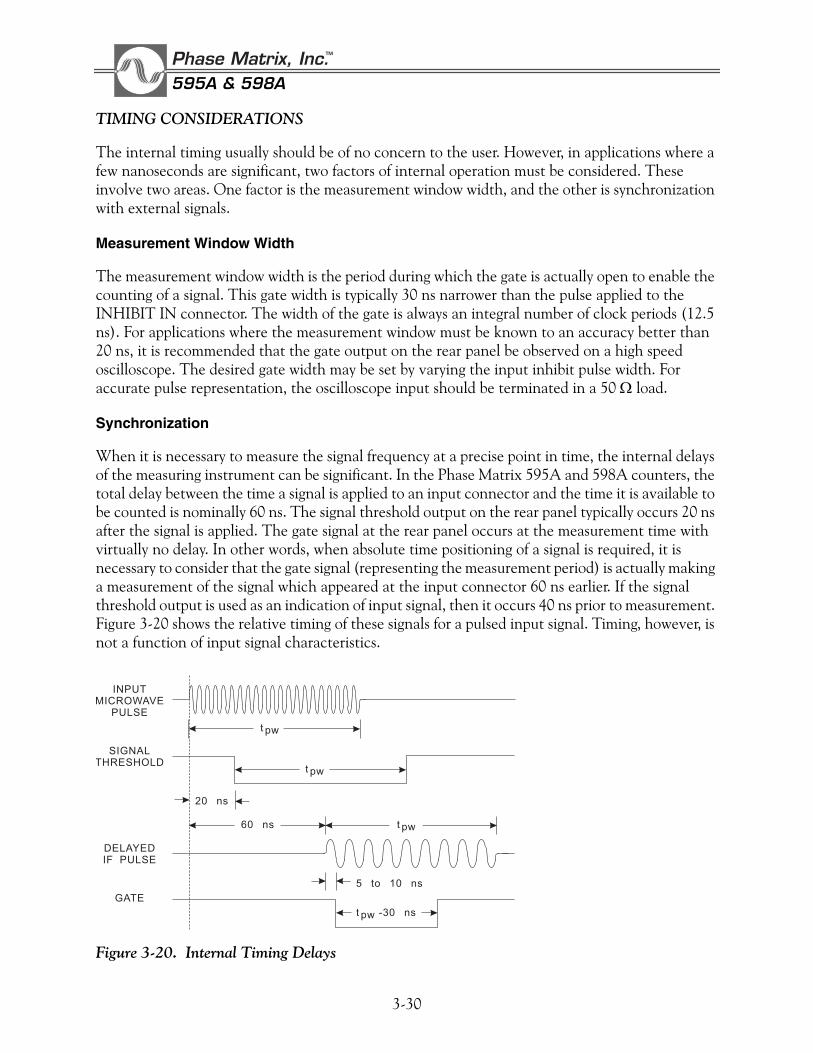
3-30
Phase Matrix, Inc.TM
595A & 598A
TIMING CONSIDERATIONS
The internal timing usually should be of no concern to the user. However, in applications where a few nanoseconds are significant, two factors of internal operation must be considered. These involve two areas. One factor is the measurement window width, and the other is synchronization with external signals.
Measurement Window Width
The measurement window width is the period during which the gate is actually open to enable the counting of a signal. This gate width is typically 30 ns narrower than the pulse applied to the INHIBIT IN connector. The width of the gate is always an integral number of clock periods (12.5 ns). For applications where the measurement window must be known to an accuracy better than 20 ns, it is recommended that the gate output on the rear panel be observed on a high speed oscilloscope. The desired gate width may be set by varying the input inhibit pulse width. For accurate pulse representation, the oscilloscope input should be terminated in a 50 Ω load.
Synchronization
When it is necessary to measure the signal frequency at a precise point in time, the internal delays of the measuring instrument can be significant. In the Phase Matrix 595A and 598A counters, the total delay between the time a signal is applied to an input connector and the time it is available to be counted is nominally 60 ns. The signal threshold output on the rear panel typically occurs 20 ns after the signal is applied. The gate signal at the rear panel occurs at the measurement time with virtually no delay. In other words, when absolute time positioning of a signal is required, it is necessary to consider that the gate signal (representing the measurement period) is actually making a measurement of the signal which appeared at the input connector 60 ns earlier. If the signal threshold output is used as an indication of input signal, then it occurs 40 ns prior to measurement. Figure 3-20 shows the relative timing of these signals for a pulsed input signal. Timing, however, is not a function of input signal characteristics.
Figure 3-20. Internal Timing Delays
20 ns
t pw -30 ns
5 to 10 ns
t pw60 ns
t pw
t pw
INPUTMICROWAVE
PULSE
SIGNALTHRESHOLD
DELAYEDIF PULSE
GATE

3-31
3/OPERATION
ACCURACY
When making any type of measurement, some degree of measurement error exists. In Phase Matrix’s CW type frequency counters, as with most other CW counters, these errors are limited to a combination of timebase error, gate phasing error (±1 count), and gate width error. In making frequency measurements on pulsed RF signals, the preceding errors, along with one additional error due to distortion of the pulsed RF signal, affect measurement accuracy. To minimize these errors and to properly interpret the results of the measurements, the magnitude of these errors must be known.
NOTE
A Microsoft® Excel® spreadsheet that automatically calculates pulseaccuracy and acquisition/measurement times is available for downloadfrom the Phase Matrix Web site. To download the spreadsheet, point yourWeb browser to <http://www.phasematrix.com/prodpages/58XC.html>,and click the link for the Pulse Calculator (note where you select to havethe file saved on your hard disk). When the download is complete, runeippulse.exe. Select the location on your hard drive where you want tosave the Pulse Calculator spreadsheet, open the spreadsheet in Excel,and follow the directions.
CW MEASUREMENT ACCURACY
When measuring CW signals the measurement accuracy is specified as:
Total error = timebase error ±1 count(Based on measurement averaging)
Timebase error causes an error in the measured frequency proportional to the error in the timebase oscillator. For example, if the 10 MHz oscillator is off frequency by 3 Hz, the corresponding measurement error on a 1 GHz signal would be 300 Hz. For an 18 GHz signal, the same 3 Hz error in the timebase would cause a measurement error of 5.4 kHz. The maximum error in the timebase is the sum of the various possible errors, such as aging rate and temperature stability.
The second type of error, ±1 count, is due to the lack of phase coherence between the gate and the signal. Simply stated, if an event occurs every 400 ms (F = 2.5 Hz), a counter could measure either 2 or 3 events in a one second interval.
The above note “based on measurement averaging” is included due to a random instrumentation error in the counter. This error can be virtually eliminated by averaging measurements.
PULSE MEASUREMENT ACCURACY
Each of the sources of CW measurement error contribute to the overall error in pulsed frequency measurements, along with gate error and distortion error. For narrow pulses, the gate phasing error, referred to as averaging error, and gate error can become the dominant sources of error for pulse
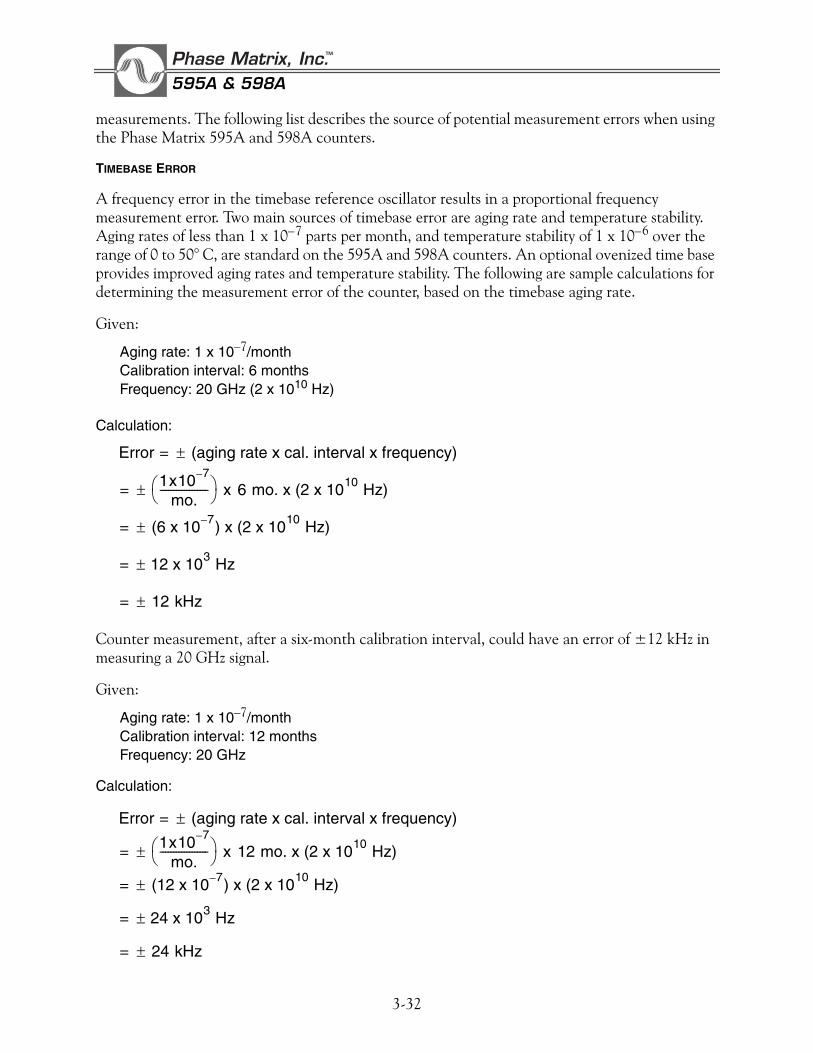
3-32
Phase Matrix, Inc.TM
595A & 598A
measurements. The following list describes the source of potential measurement errors when using the Phase Matrix 595A and 598A counters.
TIMEBASE ERROR
A frequency error in the timebase reference oscillator results in a proportional frequency measurement error. Two main sources of timebase error are aging rate and temperature stability. Aging rates of less than 1 x 10⁻⁷ parts per month, and temperature stability of 1 x 10⁻⁶ over the range of 0 to 50° C, are standard on the 595A and 598A counters. An optional ovenized time base provides improved aging rates and temperature stability. The following are sample calculations for determining the measurement error of the counter, based on the timebase aging rate.
Given:
Aging rate: 1 x 10⁻⁷/monthCalibration interval: 6 monthsFrequency: 20 GHz (2 x 10¹⁰ Hz)
Calculation:
Counter measurement, after a six-month calibration interval, could have an error of ±12 kHz in measuring a 20 GHz signal.
Given:
Aging rate: 1 x 10⁻⁷/monthCalibration interval: 12 monthsFrequency: 20 GHz
Calculation:
Error (aging rate x cal. interval x frequency)±=
1x10 7–
mo.------------------⎝ ⎠⎛ ⎞ x 6 mo. x (2 x 10¹⁰ Hz)±=
(6 x 10 7– ) x (2 x 10¹⁰ Hz)±=
12 x 103 Hz±=
12 kHz±=
Error (aging rate x cal. interval x frequency)±=
1x10 7–
mo.------------------⎝ ⎠⎛ ⎞ x 12 mo. x (2 x 10¹⁰ Hz)±=
(12 x 10 7– ) x (2 x 10¹⁰ Hz)±=
24 x 103 Hz±=
24 kHz±=
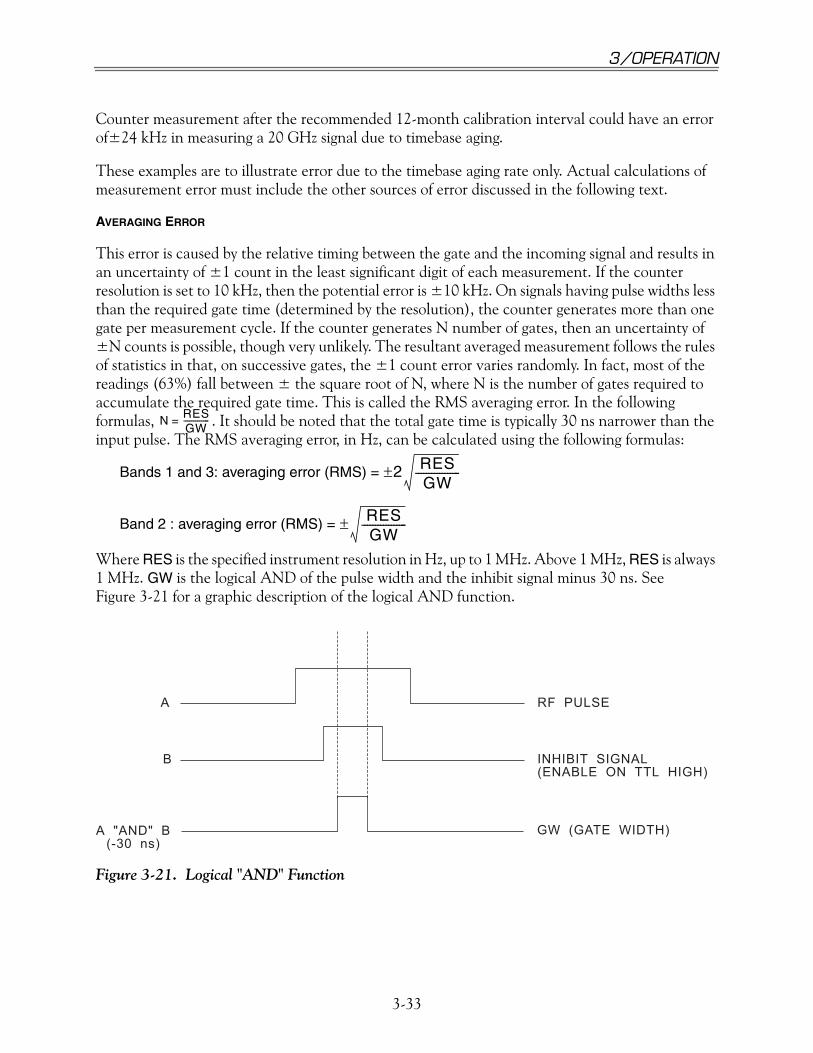
3-33
3/OPERATION
Counter measurement after the recommended 12-month calibration interval could have an error of±24 kHz in measuring a 20 GHz signal due to timebase aging.
These examples are to illustrate error due to the timebase aging rate only. Actual calculations of measurement error must include the other sources of error discussed in the following text.
AVERAGING ERROR
This error is caused by the relative timing between the gate and the incoming signal and results in an uncertainty of ±1 count in the least significant digit of each measurement. If the counter resolution is set to 10 kHz, then the potential error is ±10 kHz. On signals having pulse widths less than the required gate time (determined by the resolution), the counter generates more than one gate per measurement cycle. If the counter generates N number of gates, then an uncertainty of ±N counts is possible, though very unlikely. The resultant averaged measurement follows the rules of statistics in that, on successive gates, the ±1 count error varies randomly. In fact, most of the readings (63%) fall between ± the square root of N, where N is the number of gates required to accumulate the required gate time. This is called the RMS averaging error. In the following formulas, . It should be noted that the total gate time is typically 30 ns narrower than the input pulse. The RMS averaging error, in Hz, can be calculated using the following formulas:
Bands 1 and 3: averaging error (RMS) =
Band 2 : averaging error (RMS) =
Where RES is the specified instrument resolution in Hz, up to 1 MHz. Above 1 MHz, RES is always 1 MHz. GW is the logical AND of the pulse width and the inhibit signal minus 30 ns. See Figure 3-21 for a graphic description of the logical AND function.
Figure 3-21. Logical "AND" Function
N = RESGW-------------
2 RES GW -----------------±
RES GW -----------------±
A
A "AND" B(-30 ns)
B
RF PULSE
GW (GATE WIDTH)
INHIBIT SIGNAL(ENABLE ON TTL HIGH)

3-34
Phase Matrix, Inc.TM
595A & 598A
GATE ERROR
When narrow pulses are counted, the gate is opened and closed many times in order to accumulate enough gate time to provide the required resolution. Each time the gate opens and closes, there is a small but finite error. The total error is proportional to the number of times the gate is cycled during a measurement, and is inversely proportional to the gate width. This error is also related to both temperature and input frequency.
In the 595A and 598A counters, the worst case gate error, including all variables, is specified as:
Band 1: gate error =
Band 2: gate error =
Band 3: gate error =
Where GW, in seconds, is the logical AND of the pulse width and the inhibit signal minus 30 ns (see Figure 3-21). Unlike averaging error, which is random, gate error is systematic, and is not reduced by averaging.
DISTORTION ERROR
During the first and last few nanoseconds of a pulse, phase distortion caused by impedance mismatches or video effects can occur, resulting in shifts in time of the zero crossing. On wide pulses, distortion error is insignificant; however, on narrow pulses it may become a dominant source of error. To reduce the effect of distortion error on count accuracy, the 595A and 598A counters automatically adjust the gate to start 15 ns after the pulse begins, and to end 15 ns before the end of the pulse. The specified maximum distortion error for all three bands can be calculated from the following formula:
Maximum Distortion Error =
Where PW = pulse width (minimum pulse width is 50 ns).
TECHNIQUES FOR IMPROVING ACCURACY
In most cases, the specified counter accuracy is more than sufficient to meet measurement requirements. If greater accuracy is required, all four sources of error can be minimized by a combination of calibration, long term averaging, added correction factors, and signal conditioning.
TIMEBASE CALIBRATION
A frequency error in the internal timebase oscillator results in a proportional error in the frequency reading for either CW or pulsed signals. The aging rate of the standard internal timebase is specified to be less than 1 x 10⁻⁷ parts per month. This means that if the oscillator were set precisely on frequency at the beginning of the month, it could be 1 Hz off frequency at the end of the month.
0.07 GW
---------------±
0.01 GW
---------------±
0.03 GW
---------------±
0.03 (PW–30 ns)--------------------------------±

3-35
3/OPERATION
On a frequency measurement of 18 GHz, a 1 Hz error in the 10 MHz timebase would cause a measurement error of 1.8 kHz. Other errors can result from changes in ambient temperature. Measurement errors caused by the timebase can be reduced by adjusting the timebase (at the temperature it is used) using a standard of known accuracy. Another error reduction method is to use an external 10 MHz timebase with a known degree of accuracy, such as a 10 MHz frequency standard.
REDUCING AVERAGING ERROR
Averaging error is reduced to ±1 count whenever the gate width (GW) is greater than RES, where RES is the counter resolution in Hz. Since the averaging error is random in nature, it can also be reduced by increasing the number of individual gates. This can be accomplished by increasing the resolution of the counter and/or averaging a number of individual measurements. The counter allows 1 Hz maximum resolution and can automatically average up to 99 individual measurements internally. With the GPIB and a controller, the user can average a larger number of individual measurements, which virtually eliminate averaging error. The following formulas can be used to determine the averaging error (RMS) when averaging a number of individual measurements.
Bands 1 and 3: averaging error (RMS) =
Band 2: averaging error (RMS) =
Where RES is the specified instrument resolution in Hz, up to 1 MHz. Above 1 MHz, RES is always 1 MHz. GW is the logical AND of the pulse width and the inhibit signal minus 30 ns. AVG is the number of individual measurements to be averaged.
REDUCING GATE ERROR
Gate error at any given frequency and pulse width can also be virtually eliminated by comparing a CW frequency measurement to a simulated pulsed frequency measurement and computing a correction factor due to gate error. This correction factor can then be added to, or subtracted from, the indicated pulsed measurement to obtain the corrected frequency. The CW signal should be the same frequency (within 25 MHz) as that of the actual pulsed signal to be measured. To simulate a pulsed signal, apply an enable signal (of the same width as the pulse to be measured) to the INHIBIT IN connector on the rear panel. A single measurement contains both averaging error and gate error. Averaging measurements reduces averaging error by the square root of the number of measurements averaged. If 100 measurements are averaged, the averaging error is reduced by a factor of 10. Gate error, and any residual averaging error, is the difference in reading between the pulsed and non-pulsed measurement of the same CW signal.
EXAMPLE:
Pulse frequency = 2 GHz
Pulse width = 2 ms
2 RES (GW) (AVG)----------------------------------±
RES (GW) (AVG)----------------------------------±

3-36
Phase Matrix, Inc.TM
595A & 598A
1. Apply a CW signal to the counter at 2 GHz ±25 MHz and record the displayed frequency. This frequency is called F1.
2. Apply a TTL signal with a pulse width of 2 ms at the INHIBIT IN connector on the rear panel. Set the 595A/598A counter to average 99 readings. The frequency displayed on the counter is called F2.
3. Gate Error = F2 – F1
NOTE
This procedure avoids errors associated with pulsed signal distortion andany possible pulling of the signal source. It should be noted that by usingSpecial Function 92, gate error can also be automatically calibrated out ofthe system for a given pulse width and frequency. However, the calibrationprocedure may result in additional errors for other pulse widths orfrequencies. For additional information on Special Function 92, see theService Manual.
REDUCING DISTORTION ERROR
Since distortion error is most significant on the edges of the pulse, it may be reduced by using the counter inhibit feature to measure only in the middle of the pulse; however, measuring only the middle of the pulse narrows the gate, and gate error increases. For pulses less than 70 to 80 ns, this may add more error than it removes. The performance test section of the service manual describes a method of determining the magnitude of this error that can be used to determine the improvement in accuracy achieved by using the inhibit function.
CALCULATING MEASUREMENT ACCURACY
The following is a sample calculation for determining the maximum specified measurement error for a typical pulse frequency measurement.
Given:
Frequency: 18 GHzPulse width: 530 nsResolution: 100 kHz
• TIMEBASE ERROR (TBE) (Based on 6 Hz error from 10 MHz timebase) - - - - - - - ±10.8 kHz
TBE = (6 Hz/10 MHz)(18 GHz) = 10.8 kHz
NOTE
The direction of the timebase error is not specified, so it is not knownwhether the timebase error caused the indicated reading to be higher orlower. If the actual frequency of the timebase was 6 Hz high, then its periodwould be reduced and the counter would indicate a lower frequency.

3-37
3/OPERATION
• RMS AVERAGING ERROR (AE) - - - - - - - - - - - - - - - - - - - - - - - - - - - - - - - - - - - -±45 kHz
AE (RMS) =
Where RES = specified counter resolution, GW = (pulse width AND inhibit signal) – 30 ns, and AVG = number of measurements averaged.
AE (RMS) = = ±45 kHz
NOTE
To reduce the averaging error for this example, the measurementaveraging feature of the counter was used. If it had not been used, theaveraging error would have been ±450 kHz.
• GATE ERROR (GE) (Worst Case) - - - - - - - - - - - - - - - - - - - - - - - - - - - - - - - - - - - ±20 kHz
GE =
Where GW = (pulse width AND inhibit signal) – 30 ns
GE = = ±20 kHz
• DISTORTION ERROR (DE) (Worst Case) - - - - - - - - - - - - - - - - - - - - - - - - - - - - - ±60 kHz
DE =
Where PW = pulse width.
DE = = ±60 kHz
• TOTAL ERROR = SUM OF INDIVIDUAL ERRORS - - - - - - - - - - - - - - - - - - - - ±136 kHz
NOTE
The total measurement error, as calculated above, is the worst case error.The errors that make up the total error would not under normalcircumstances be additive. Errors in opposite directions would offset oneanother, with the effect of reducing the total error.
RES (GW) (AVG)----------------------------------±
100E3(500E-9) (99)-----------------------------------±
0.01 GW
---------------±
0.01 500E - 9----------------------±
0.03 (PW–30 ns)--------------------------------±
0.03 (530 ns –30 ns)------------------------------------------±

3-38
Phase Matrix, Inc.TM
595A & 598A
MEASUREMENT ACCURACY WORKSHEET
The following worksheet can be used to determine the maximum specified measurement error for a particular application. To determine the specified maximum error, select the desired operating parameters and use the formulas given to determine the magnitude of each type of error.
Variables:
Frequency (F):Pulse width (PW):Counter resolution (RES):
SUM INDIVIDUAL ERRORS
• TIMEBASE ERROR
This error can be determined by accurately measuring the frequency at the rear panel 10 MHz IN/OUT connector. The frequency measured (F mea) is then used in the following formula to determine measurement error.
TBE = X F
where F mea = measured timebase frequency and F = input frequency
• RMS AVERAGING ERROR
Bands 1 and 3: AE (RMS) =
Band 2 : AE (RMS) =
Where RES = specified counter resolution in Hz up to 1 MHz. Above 1 MHz resolution, the counter’s internal resolution remains at 1 MHz. GW = (pulse width AND inhibit signal) – 30 ns and AVG = number of measurements averaged.
NOTE
If GW is > then AE = ±1 count.
• GATE ERROR (Worst Case)
Band 1: GE =
Band 2: GE =
10 MHz – F mea10 MHz
--------------------------------------------
2 RES (GW) (AVG)----------------------------------±
RES (GW) (AVG)----------------------------------±
1RES------------
0.07 GW
---------------±
0.01 GW
---------------±

3-39
3/OPERATION
Band 3: GE =
Where GW = (pulse width AND inhibit signal) –30 ns
• DISTORTION ERROR (Worst Case)
DE =
Where PW = pulse width
• TOTAL ERROR = sum of individual errors
0.03 GW
---------------±
0.03 (PW–30 ns)--------------------------------±
3-40
Phase Matrix, Inc.TM
595A & 598A
SPECIAL FUNCTION DIRECTORYThe Phase Matrix Models 595A/598A provide a wide variety of special functions. These special functions are divided into three major categories:
1. Counter operation verification.
2. Counter setup and capability enhancements.
3. Calibration and troubleshooting aids.
The following special functions are used to verify proper operation. Special Function 01 is the most comprehensive because it tests most of the major subassemblies contained in the counter.
There are a wide range of special functions for counter setup and performance enhancement. The most commonly used setup special functions include 08, 72, 74, 81, and 90. The most commonly used performance enhancement special functions include 61, 63 and 77.
Special Function Description
01 200 MHz Self Test
02 Light Display Segments Test
03 Scan Display Segments Test
04 Scan Display Digits Test
05 Keyboard Test
06 Prom checksum Test
07 Display Counter Model Number
76 EEPROM checksum Test
Special Function Description
08 External Timebase Select
09 Internal Timebase Select
10 Internally Disconnect Pulse Generator from the Counter
11 Internally Connect Pulse Generator to Counter
12 Trigger Pulse Generator on Falling Edge
13 Trigger Pulse Generator on Rising Edge
61 Disable Input Signal Tracking
62 Enable Input Signal Tracking
63 Disable Sample Rate Control
64 Enable Sample Rate Control
65 Disable Results Display
66 Enable Results Display
67 Display Pulse Repetition Frequency (PRF)
68 Display Pulse Period
69 Display Pulse Parameter Measurements Only

3-41
3/OPERATION
The following special functions set up the counter in special modes to aid in troubleshooting or to initiate calibration routines. These functions should only be used by qualified technicians for calibration and repair.
70 Display Frequency and Pulse Parameter Measurements72 Store Counter Setup and/or Default Values73 Recall Counter Setup74 Relative Frequency Readings75 Display IF Frequency Readings77 Enable Pulse Profile78 Disable Pulse Profile79 Enable Band 0 Low Pass Filter80 Disable Band 0 Low Pass Filter81 Measurement Averaging82 Frequency Multiplier83 Frequency Offset84 Power Offset87 Enable Constant Threshold88 Disable Constant Threshold90 Display/Alter GPIB address
Special Function Description
20 Band 2 Detected RF Level40 Sweep YIG DAC41 Sweep VCO with VCO Power Amp On42 Sweep VCO with VCO Power Amp Off44 Disable Normal Operations45 Enable Normal Operations46 Display and/or Alter Memory47 Measure IF Only91 YIG DAC Automatic Calibration92 Gate Accuracy Calibration93 Calculate EEPROM Checksum
Special Function Description

3-42
Phase Matrix, Inc.TM
595A & 598A
ACTIVATION OF SPECIAL FUNCTIONS
CAUTION
Executing Special Function 46, 91, 92 or 93 can cause a loss ofcalibration data. To prevent this from occurring, access to thesefunctions is blocked by an internal memory protect feature.Attempting to access these functions with the memory protectedcauses the counter to display “ERROR 53”.
Special functions can be activated through both the front panel keyboard and the GPIB interface. To activate a special function through the keyboard, press the SPECIAL key followed by two digit keys. To activate a special function through the GPIB interface, enter the word SPECIAL followed by a two-digit number. Activating special functions does not alter any previously entered parameters unless specifically stated. To terminate all previously activated special functions: press the SPECIAL key and then the 0 key followed by the 0 key again; or, press the SPECIAL key followed by the CLEAR DATA key. To terminate all special functions using GPIB, issue the command SPECIAL 00.
SPECIAL FUNCTION 01 - 200 MHz Self Test
This function verifies that the count chain, gate generator, and VCO are operational.
NOTE
The front-panel TEST button provides a convenient shortcut for accessingSpecial Function 01.
When this function is entered, the counter:
1. Exits the current band
2. Sets the hardware to the self-test mode
3. Sets the VCO to 400 MHz (The measurement is the VCO divided by 2.)
4. Sets the counter to take frequency measurements only
5. Starts measurement cycles
The display shows the frequency measurement results. These results are output to the GPIB interface when frequency readings are requested. The measurement result should be 200 MHz ±1 count.
STOP/RESET SPC INDICATOR: ON

3-43
3/OPERATION
SPECIAL FUNCTION 02 - Light Display Segments Test
This function verifies that all the digit segments and annunciator LEDs are operational. When this function is activated, all digit segments and all annunciators are turned on. The GATE and the SEARCH annunciators are both on for the duration of the special function.
STOP/RESET SPC INDICATOR: ON
SPECIAL FUNCTION 03 - Scan Display Segments Test
Each segment in all the digits and banks of annunciators is turned on sequentially by this function to test the display segment drivers. The scan rate is determined by the setting of the SAMPLE RATE control.
STOP/RESET SPC INDICATOR: N/A
SPECIAL FUNCTION 04 - Scan Display Digits Test
Each digit and each bank of annunciators is turned on sequentially by this function to check the display digit driver. The scan rate is determined by the setting of the SAMPLE RATE control.
STOP/RESET SPC INDICATOR: N/A
SPECIAL FUNCTION 05 - Keyboard Test
This function verifies the operation of the keyboard.
After this function is activated the counter stops normal operations and the display shows the key code of the last key pressed. When a new key is pressed, the display is updated to show the code of the new key. When the GPIB controller requests a key code, the code of the last key pressed is output. (If the controller requests a key code, the counter outputs to the GPIB interface the code of the last key pressed even if Special Function 05 is not activated). If the counter is in LOCAL, this function must be terminated by the CLEAR DISPLAY key. If it is in remote, this function can be terminated by any device-dependent command.
STOP/RESET SPC INDICATOR: ON

3-44
Phase Matrix, Inc.TM
595A & 598A
Table 3-5. Keyboard Scan Codes
SPECIAL FUNCTION 06 - PROM checksum Test
This function generates the checksum for the PROM in the counter and compares it with the checksum table stored in the firmware. If the checksum generated is correct, the counter displays the word “PASSEd” on the front panel. If the checksum is incorrect, an error message is output to the display. At the same time, the error-condition-status bit in the GPIB serial poll status byte is set. During checksum generation, “SPECIAL 06” is displayed.
ONE-SHOT SPC INDICATOR: ON
SPECIAL FUNCTION 07 - Display Counter Model Number
This function enables the user to find out whether the counter is configured as a 595A or 598A counter. It displays the appropriate model number on the front panel.
ONE-SHOT SPC INDICATOR: ON
SPECIAL FUNCTION 08 - External Timebase Select
Selecting this function configures the counter to external timebase input mode. The EXT annunciator is lit when the counter is in external timebase mode.
ONE-SHOT SPC INDICATOR: OFF
SPECIAL FUNCTION 09 - Internal Timebase Select
Selecting this function configures the counter to internal timebase mode. The EXT annunciator is turned off when the counter is in internal timebase mode.
ONE-SHOT SPC INDICATOR: OFF
KEY SCAN CODE KEY SCAN CODE KEY SCAN CODE
7 11 1 31 Pulse Generator Width 71
8 12 2 32 Delay 72
9 13 3 33 Period 73
GHz/s 14 kHz/μs 34 Mode 74
4 21 ± 41 Init/Local 61
5 22 0 42 Delay 51
6 23 . 43 Power 52
MHz/ms 24 Hz/ns 44 Clear Data 53
Clear Display* 54
* This scan code cannot be seen on the display, since it exits the keyboard test.
3-45
3/OPERATION
SPECIAL FUNCTION 10 - Internally Disconnect Pulse Generatorfrom the Counter for Independent Operation
This function disconnects the pulse generator from the counters inhibit input, allowing the pulse generator to be used as a completely separate instrument. When this function is activated, the internal pulse generator has no affect on the operation of the counter, but the pulse generator’s rear panel connections are still active.
This function differs from the Pulse Generator ON/OFF key in that the ON/OFF key turns off the pulse generator and the pulse generator’s rear panel connections.
ONE-SHOT SPC INDICATOR: ON
SPECIAL FUNCTION 11 - Internally Connect Pulse Generator to Counter
This function reverses the action of Special Function 10, internally reconnecting the output of the pulse generator to the inhibit input of the counter. By default, the pulse generator output is connected to the inhibit input.
ONE-SHOT SPC INDICATOR: OFF
SPECIAL FUNCTION 12 - Trigger on Falling Edge
This function causes the Internal Delaying Pulse Generator to trigger on the falling edge of the pulse generator trigger input.
STOP/RESET SPC INDICATOR: ON
SPECIAL FUNCTION 13 - Trigger on Rising Edge
This function causes the Internal Delaying Pulse Generator to trigger on the rising edge of the pulse generator trigger input.
ONE-SHOT SPC INDICATOR: OFF
SPECIAL FUNCTION 20 - Display Band 2 Detected RF Level
This function verifies coarse calibration of the Band 2 YIG DAC offset and YIG DAC slope adjustments.
When this function is activated, the counter waits for the user to enter the new YIG calibration frequency. The previously entered frequency number and “Fr” are displayed in the frequency
3-46
Phase Matrix, Inc.TM
595A & 598A
section and the pulse parameter section of the display, respectively. The special function stops in this state until the user enters a new frequency value, or, if the previously entered frequency value is the required frequency, pushing the kHz key allows the special function to continue.
After the number has been entered, the YIG DAC is set to the entered frequency number. The display shows “CAL DAC” plus a number from 0 to 29 that corresponds to the information on the Band 2 power discrimination circuitry. The counter outputs the power discrimination circuitry information when requested by the GPIB to OUtput LEvel.
STOP/RESET SPC INDICATOR: ON
SPECIAL FUNCTION 40 - Sweep YIG DAC
When this function is activated, the counter waits for the user to enter the start frequency of the YIG sweep. The previously entered start frequency and “F1” are displayed in the frequency section and the pulse parameter section of the display, respectively. The special function stops in this state until the user enters a new start frequency or, if the previously entered frequency is the required start frequency, the user presses the kHz key to tell the special function to continue.
After the start frequency is entered, the counter waits for the user to enter the stop frequency of the YIG sweep. The previously entered stop frequency and “F2” are displayed in the frequency section and the pulse parameter section of the display, respectively. The special function stops in this state until the user enters a new stop frequency or, if the previously entered frequency is the required stop frequency, the user presses the kHz key to tell the special function to continue.
When both the start and stop frequencies have been entered, the display reverts to displaying SPECIAL “40”. The YIG DAC sweeps continuously from F1 to F2 until the function is terminated. If F1 and F2 are equal, the YIG DAC is set to the frequency corresponding to F1 and F2.
To activate this function in remote, the user programs the controller to output SPECIAL 40. The start and stop frequencies used are the frequencies specified in the GPIB commands Y1FREQ and Y2FREQ (where Y1FREQ and Y2FREQ correspond to F1 AND F2 respectively). If the start or stop frequency required is different from that specified in Y1FREQ or Y2FREQ respectively, the number in that frequency register must be updated before Special Function 40 is activated.
STOP/RESET SPC INDICATOR: ON
SPECIAL FUNCTION 41 - Sweep VCO with VCO Power Amplifier On
After this function is activated, the counter waits for the user to enter the start frequency of the VCO sweep. The previously entered start frequency and “F1” are displayed in the frequency section and the pulse parameter section of the display, respectively. The special function stops in this state until the user enters a new start frequency or, if the previously entered frequency is the required start frequency, the user presses the kHz key to tell the special function to continue.
3-47
3/OPERATION
After the start frequency is entered, the counter waits for the user to enter the stop frequency of the VCO sweep. The previously entered stop frequency and “F2” is displayed in the frequency section and the pulse parameter section of the display, respectively. The special function stops in this state until the user enters a new stop frequency or, if the previously entered frequency is the required stop frequency, the user presses the kHz key to tell the special function to continue.
When both the start and stop frequencies have been entered, the display reverts to “SPECIAL 41”. The VCO sweeps continuously from F1 to F2 in 100 kHz steps until the function is terminated. The sweep rate is controlled by the sample rate. Maximum sweep rate may be obtained by disabling the sample rate (Special Function 63) before calling this function. If F1 and F2 are equal, the VCO is set to that particular frequency. The VCO power amplifier is turned on during this function.
To activate this function in remote, the user instructs the controller to output SPECIAL 41. The start and stop frequencies used are the frequencies specified in the GPIB commands V1FREQ and V2FREQ (where V1FREQ and V2FREQ correspond to F1 and F2 respectively). If the start or stop frequency required is different from that specified in V1FREQ or V2FREQ, the number in that frequency register must be updated before SPECIAL 41 is activated.
ONE-SHOT SPC INDICATOR: OFF
SPECIAL FUNCTION 42 - Sweep VCO with VCO Power Amplifier Off
After this function is activated, the counter waits for the user to enter the start frequency of the VCO sweep. The previously entered start frequency and “F1” is displayed in the frequency section and the pulse parameter section of the display, respectively. The special function stops in this state until the user enters a new start frequency or, if the previously entered frequency is the required start frequency, the user presses the kHz key to tell the special function to continue.
After the start frequency is entered, the counter waits for the user to enter the stop frequency of the VCO sweep. The previously entered stop frequency and “F2” is displayed in the frequency section and the pulse parameter section of the display respectively. The special function stops in this state until the user enters a new stop frequency or, if the previously entered frequency is the required stop frequency, the user presses the kHz key to tell the special function to continue.
When both the start and stop frequencies have been entered, the display reverts to “SPECIAL 42”. The VCO sweeps continuously from F1 to F2 in 100 kHz steps until the function is terminated. The sweep rate is controlled by the sample rate. Maximum sweep rate may be obtained by disabling the sample rate (Special Function 63) before calling this function. If F1 and F2 are equal, the VCO is set to that particular frequency. The VCO power amplifier is turned off during this function.
To activate this function in remote, the user instructs the controller to output SPECIAL 42. The start and stop frequencies used are the frequencies specified in the GPIB commands V1FREQ and V2FREQ (where V1FREQ and V2FREQ correspond to F1 and F2, respectively). If the start or stop frequency required is different from that specified in V1FREQ or V2FREQ, the number in that frequency register must be updated before SPECIAL 42 is activated.

3-48
Phase Matrix, Inc.TM
595A & 598A
SPECIAL FUNCTION 44 - Pause Normal Counter Operation
This function prevents the counter from performing the normal converter lock and measurement cycles. It freezes the counter in the state it was in at the moment the function was activated. The display shows “PAUSE” and the STOP ON/OFF status bit is set when this function is active. Special Function 44 remains activated until terminated through Special Function 45 or by pressing the SPECIAL key followed by the CLEAR DATA key, or by pressing the SPECIAL key followed by the 0 key and then the 0 key again.
STOP/RESET SPC INDICATOR: ON
SPECIAL FUNCTION 45 - Restore Normal Counter Operation
This function reverses the action taken when Special Function 44 is activated. The function returns the counter to normal operation. A reset is generated and the STOP ON/OFF status bit is cleared when this function is activated.
STOP/RESET SPC INDICATOR: OFF
SPECIAL FUNCTION 46 - Display and/or Alter Memory
CAUTION
Care must be used when operating Special Function 46. Although thecounter cannot be damaged by this function, improper operation ofit can affect the counter calibration. For this reason, access to thisfunction is blocked by an internal memory protect feature.Attempting to access this function with the memory protectedcauses the counter to display “ERROR 53”.
This function allows the user to display and/or alter any memory location. The counter continues its normal operations when performing this function unless Special Function 44 has previously been activated.
In the local mode, the keys on the keyboard take on different meanings after Special Function 46 is activated. The following are the definitions of the keys when this function is enabled.
• All number keys remain number keys
• GHz key = hexadecimal digit A
• MHz key = hexadecimal digit B
• kHz key = hexadecimal digit C
• Hz key = hexadecimal digit D

3-49
3/OPERATION
• . key = hexadecimal digit E
• ± key = hexadecimal digit F
• DISPLAY DELAY key = INCREMENT command
• DISPLAY POWER key = DECREMENT command
• CLEAR DATA key = ADDRESS command (allows the user to enter another address)
• CLEAR DISPLAY key remains the same (it exits the special function)
After activating Special Function 46, the user can do one of the following:
• Exit the function by issuing a CLEAR DISPLAY command (pressing the CLEAR DISPLAY key).
• Alter the content of the memory location by entering a two-digit hexadecimal number.
• Display the next memory location by issuing an INCREMENT command (pressing the DISPLAY DELAY key).
• Display the previous memory location by issuing a DECREMENT command (pressing the DISPLAY TEST key).
• Enter another memory address by first issuing an ADDRESS command (pressing the CLEAR DATA key).
If the content of a memory location is altered, the new content of that memory location is displayed in the pulse parameter section of the display. If the ADDRESS command is issued, the display changes to show “Addr_ _ _ _”. While the address is being entered, the hexadecimal digits keyed in replace each blank sequentially. After the memory address is entered, the content of that memory location is displayed in the pulse parameter section of the display. This function must be terminated by the CLEAR DISPLAY command.
In the remote mode, a memory content can be interrogated by using the OUTPUT MEMORY command. When the counter is addressed to talk, the last memory address accessed is output. A memory location can be accessed using the MEMORY 0HHHH command (where H is a hexadecimal digit). The content of a memory location can be altered using the MEMORY 0HHHH 0HH command. In the remote mode, Special Function 46 need not be activated when accessing and altering memory locations. Those operations can be done by the controller in the background.
STOP/RESET SPC INDICATOR: ON

3-50
Phase Matrix, Inc.TM
595A & 598A
SPECIAL FUNCTION 47 - Measure IF Only
This function provides the user with the means to measure the frequency of the IF signal, present at the input of the count chain assembly, without having the counter converter locked on the signal. The counter does not measure pulse parameters when this function is activated.
When Special Function 47 is activated, the counter stops the normal converter lock and measurement cycles. The VCO, YIG, and all microprocessor-controlled hardware switches are left at the state they were in when the function was activated. The counter then starts measuring the frequency of the IF signal present at the input to the count chain assembly. The measurement results are displayed on the front panel and are also output via the GPIB interface if frequency readings are requested.
NOTE
This function does not check periodically for the presence of a signal as inthe normal operation of the counter.
STOP/RESET SPC INDICATOR: ON
SPECIAL FUNCTION 61 - Disable Input Signal Tracking
This function configures the counter to skip the execution of the input signal tracking function that normally occurs after every measurement cycle. This function shortens the measurement cycle time, but prohibits the counter from tracking a moving signal.
The action taken with this function can be reversed by activating Special Function 62.
ONE-SHOT SPC INDICATOR: ON
SPECIAL FUNCTION 62 - Enable Input Signal Tracking
This function reverses the action taken with Special Function 61.
ONE-SHOT SPC INDICATOR: OFF
SPECIAL FUNCTION 63 - Disable Sample Rate Control
This function configures the counter to ignore the local and the remote sample rate controls. The counter measurement cycle rate is maximized, which shortens the measurement cycle time.
The action taken with this function can be reversed by activating Special Function 64.
ONE-SHOT SPC INDICATOR: ON

3-51
3/OPERATION
SPECIAL FUNCTION 64 - Enable Sample Rate Control
This function reverses the action taken with Special Function 63.
ONE-SHOT SPC INDICATOR: OFF
SPECIAL FUNCTION 65 - Disable Results Display
This function prevents the display of measurement results on the front panel. When Special Function 65 is activated, the front panel displays only a row of dots. When the user enters parameters through the keyboard, the display responds normally. This function shortens the measurement cycle time and provides security in systems used with classified frequencies.
The action taken with this function can be reversed by activating Special Function 66.
ONE-SHOT SPC INDICATOR: ON
SPECIAL FUNCTION 66 - Enable Results Display
This function reverses the action taken by Special Function 65. When this function is activated, the display is immediately updated with the last measurement results.
ONE-SHOT SPC INDICATOR: OFF
SPECIAL FUNCTION 67 - Display Pulse Period Function as Pulse Repetition Frequency
This function configures the counter to display the pulse period measurements as a frequency. It has no effect on pulse width measurements.
After this function is turned on, frequency measurements are not displayed on the front panel. The pulse period is displayed to the maximum available resolution, using the pulse parameter display as the 100 Hz, 10 Hz and 1 Hz digits. Since the PRF is derived mathematically from the period, the resolution is a function of the period measurement resolution per the formula:
When requested by the GPIB bus controller to output a period measurement, the counter outputs the period measurement instead of the PRF of the input signal.
If pulse period measurements are enabled, Special Function 67 has a higher priority than Special Function 69. That is, the front panel is configured according to Special Function 67 if both Special Function 67 and Special Function 69 are activated.
The action taken with this function can be reversed by activating Special Function 68.
ONE-SHOT SPC INDICATOR: ON
Resolution Hz( ) = 1Period 10 ns±--------------------------------------- – 1
Period-----------------

3-52
Phase Matrix, Inc.TM
595A & 598A
SPECIAL FUNCTION 68 - Display Period Function as Pulse Period
This function reverses the action taken with Special Function 67.
ONE-SHOT SPC INDICATOR: OFF
SPECIAL FUNCTION 69 - Display Pulse Parameter Measurements Only
When this function is activated, frequency measurements are not displayed on the front panel. Instead, the 12 digits on the front panel are devoted exclusively to displaying pulse parameter measurements to 10 ns resolution.
If the pulse period function is on, this special function has a lower priority than Special Function 67. That is, the front panel is configured according to Special Function 67 if both Special Function 67 and Special Function 69 are activated.
The action taken with this function can be reversed by activating Special Function 70.
ONE-SHOT SPC INDICATOR: ON
SPECIAL FUNCTION 70 - Display Frequency and Pulse Parameter Measurement
This function returns the counter to the normal mode of displaying measurement results, reversing the action taken by Special Function 69.
ONE-SHOT SPC INDICATOR: OFF
SPECIAL FUNCTION 72 - Store Counter Setup and/or Default Values
This function serves two purposes. Its primary use is to store the present counter setup in the storage register specified. When this function is activated, the counter requests the user to enter the register number by displaying “REG _” on the front panel. The counter remains in this state until the user enters a number between 0 and 9. After the register number is entered, the function stores the current counter setup in the register specified. During this time, “REG N” is displayed on the front panel (where N is the register number entered).
This function also can be used to customize the default values used by the counter. The default values determine the state of the instrument at turn-on. This is accomplished by setting the instrument up in the desired turn-on condition and storing it in register 0. The information stored in register 0 is used to determine the power-on state of the counter. To clear the instrument back to the factory-set default values, select Special Function 72 and press the CLEAR DATA key.
ONE-SHOT SPC INDICATOR: OFF

3-53
3/OPERATION
SPECIAL FUNCTION 73 - Recall Counter Setup
This function recalls the counter setup stored in the storage register specified.
When this function is activated, the counter requests the user to enter the register number by displaying “REG _” on the front panel. The counter remains in this state until the user enters a number between 0 and 9. After the register number is entered, the function proceeds to set up the counter according to the information stored in the register specified. During this time, “REG N” is displayed on the front panel (where N is the register number entered).
When the counter finishes setting the counter up, a reset is generated.
ONE-SHOT/RESET SPC INDICATOR: OFF
SPECIAL FUNCTION 74 - Store Current Reading as Frequency Offset
When this function is activated, the counter assigns a negative value to the last input frequency reading and enters it into the frequency offset register (overwriting any previously entered frequency offset). The last input frequency in this case means the actual frequency of the input signal, not the frequency displayed on the front panel, which may be affected by a frequency multiplier or another special function. The counter displays the difference between the last input frequency and the current one, subject to any other functions activated. It continues to do so until the SPECIAL FUNC 83 and CLEAR DATA keys are pressed. The OFS annunciator is turned on when this function is activated.
ONE-SHOT SPC INDICATOR: OFF
SPECIAL FUNCTION 75 - Display IF Frequency Readings
When this function is activated, the counter assigns a negative value to the local oscillator (LO) frequency and enters it into the frequency offset register (overwriting any previously entered frequency offset). The counter then subtracts the LO frequency from the input frequency and displays the resulting IF frequency. It continues to do so until the SPECIAL FUNC 83 and CLEAR DATA keys are pressed. The OFS annunciator is turned on.
ONE-SHOT SPC INDICATOR: OFF

3-54
Phase Matrix, Inc.TM
595A & 598A
SPECIAL FUNCTION 76 - EEPROM Checksum Test
This special function calculates a checksum based on the data contained in the EEPROM and compares the calculated checksum to the checksum stored in the EEPROM. If the calculated checksum is the same as the stored checksum, the counter displays “PASSEd”.
If the counter displays “ERROR 94", the calculated checksum is different from the stored checksum. Although pressing clear display does clear the error, the counter should not be used; it must be recalibrated to ensure proper operation.
ONE-SHOT SPC INDICATOR: ON
SPECIAL FUNCTION 77- Enable Pulse Profile
This function is used to automatically profile the frequency of a repetitive pulsed microwave signal. When this function is activated, the counter displays “000000.000 Inc”. At this point the desired measurement increment is entered. After a valid measurement increment has been entered, the counter displays “000000.000 End”. At this point, the maximum delay time, relative to the trigger, is entered.
This function only sets up the measurement increment and last measurement time. The front panel Pulse Generator control keys are used to select the trigger source (Mode) and measurement window (Width).
ONE-SHOT SPC INDICATOR: ON
SPECIAL FUNCTION 78- Disable Pulse Profile
This function turns off automatic pulse profiling, reversing the action of Special Function 77.
ONE-SHOT SPC INDICATOR: OFF
SPECIAL FUNCTION 79- Connect Band 0 Low Pass Filter
This function connects a low pass filter to the Band 0 input. The 3 dB point on the filter is at approximately 30 kHz which means the attenuation of signals above 30 kHz increases as a function of frequency.
When measuring signals below 50 kHz, if the count seems unstable, enabling the low pass filter may stabilize the count by attenuating the higher frequency components of the input signal.
ONE-SHOT SPC INDICATOR: ON

3-55
3/OPERATION
SPECIAL FUNCTION 80- Disconnect Band 0 Low Pass Filter
This function disconnects the Band 0 Low Pass Filter, reversing the action of Special Function 79. The Band 0 Low Pass Filter is, by default, disconnected.
ONE-SHOT SPC INDICATOR: OFF
SPECIAL FUNCTION 81- Measurement Averaging
This function allows multiple measurements to be mathematically averaged. Use this function to select the number of averages in the range of 01 to 99. Entering 01 or CLEAR DATA clears the averaging function back to the default value of 1.
When measuring pulsed signals, one of the sources of error is averaging error. Special Function 81 is used to average measurements which reduces averaging error. Refer to the measurement accuracy section of the manual for more information on averaging error.
ONE-SHOT SPC INDICATOR: ON
SPECIAL FUNCTION 82 - Frequency Multiplier
This function allows the measured frequency to be multiplied by a fixed value prior to being displayed or returned over GPIB. The multiplier value defaults to a value of 1, but any integer value between 01 and 99 can be used.
When this function is activated, the counter displays the current multiply factor. A new factor can then be entered. When a factor is entered, the SPC (special) annunciator is lit. Entering 01 or CLEAR DATA clears the multiply function back to the default value.
ONE-SHOT SPC INDICATOR: ON
SPECIAL FUNCTION 83 - Frequency Offset
This function allows the measured frequency to be offset by a fixed value prior to being displayed or returned over GPIB. Frequency offset defaults to zero, but may be any positive or negative value in the range of –99.999999 GHz to +99.999999 GHz. The maximum resolution on frequency offset is 1 kHz.
When this function is activated, the counter displays the current frequency offset. When an offset is entered, the SPC (special) annunciator is lit. Pressing CLEAR DATA or entering “0" followed by any frequency terminator resets the Frequency Offset value back to the default value of zero.
ONE-SHOT SPC INDICATOR: ON

3-56
Phase Matrix, Inc.TM
595A & 598A
SPECIAL FUNCTION 84 - Power Offset
This function allows the measured power to be offset by a fixed value prior to being displayed or returned over GPIB. Power offset defaults to zero, but may be any positive or negative value in the range of –70 dB to +80 dB. The resolution of the power offset is 0.1 dB.
When this function is activated, the counter displays the current power offset. When an offset is entered, the SPC (special) annunciator is lit. Pressing CLEAR DATA or entering “0" followed by the dB terminator resets the power offset value back to the default value of zero.
ONE-SHOT SPC INDICATOR: ON
SPECIAL FUNCTION 90 - Display and/or Alter GPIB Address
When this function is activated, the counter displays the current address of the GPIB interface. If the address need not be changed, the function may be terminated by pressing the CLEAR DISPLAY or CLEAR DATA keys.
After this function has been activated, the GPIB address can be changed by entering a two-digit decimal number between 01 and 99. The function is terminated and the display returned to displaying measurement results after the second digit key is released.
(Refer to the GPIB interface section on page 4-15 for the meanings of GPIB addresses above 31.)
ONE-SHOT SPC INDICATOR: ON
SPECIAL FUNCTION 91 - YIG DAC Automatic Calibration
CAUTION
Care must be used when operating Special Function 91. Although thecounter cannot be damaged by this function, improper operation ofit can affect the counter calibration. For this reason, access to thisfunction is blocked by an internal memory protect feature.Attempting to access this function with the memory protectedcauses the counter to display “ERROR 53”.
This function is used to calibrate the Band 2 input filter. Refer to the service manual for more information.
3-57
3/OPERATION
SPECIAL FUNCTION 92 - Gate Accuracy Calibration
CAUTION
Care must be used when operating Special Function 92. Although thecounter cannot be damaged by this function, improper operation ofit can affect the counter calibration. For this reason, access to thisfunction is blocked by an internal memory protect feature.Attempting to access this function with the memory protectedcauses the counter to display “ERROR 53”.
This function is used for calibration of the counter’s measurement gate. Refer to the service manual for more information.
SPECIAL FUNCTION 93- Calculate EEPROM checksum
CAUTION
Care must be used when operating Special Function 93. Although thecounter cannot be damaged by this function, improper operation ofit can affect the counter calibration. For this reason, access to thisfunction is blocked by an internal memory protect feature.Attempting to access this function with the memory protectedcauses the counter to display “ERROR 53”.
The EEPROM is non-volatile memory which stores calibration data along with other instrument parameters. After performing YIG DAC and/or Gate Error calibrations, this function commands the counter to compute a new checksum based on the new data and store the new checksum in the EEPROM. At turn on, the counter automatically calculates the checksum based on the stored data and compares the calculated checksum to the stored value. If the two checksums are not the same, the counter displays Error 94.
Although pressing clear display does clear the error, the counter should not be used; it must be recalibrated to ensure proper operation.
ONE-SHOT SPC INDICATOR: ON

3-58
Phase Matrix, Inc.TM
595A & 598A
ERROR MESSAGESWhen an error occurs, an error number is displayed. The probable cause of each error is listed below.
ERROR NUMBER DEFINITION
01 Key pushed not function key
02 Lower limit higher than high limit
03 Frequency limits and Δ frequency entries only supported in Band 2
04 Center frequency entries only supported in Band 2 and Band 3
05 Center frequency entry outside current band range
06 No valid data in storage registers for recall feature
07 Converter unable to lock on signal during special
08 Illegal delta frequency entry
09 Illegal register entry
10 Illegal band entry
11 Illegal subband entry
12 Illegal resolution entry
13 Illegal special function entry
14 Illegal average entry
15 Illegal multiplier entry
16 Illegal frequency offset entry
17 Illegal center frequency entry
18 Illegal MINPRF entry
19 Illegal low limit entry
20 Illegal high limit entry
21 Illegal sample rate entry
22 Illegal SRQ number entry

3-59
3/OPERATION
ERROR NUMBER DEFINITION
23 Illegal GPIB address
24 Illegal VCO frequency 1 entry
25 Illegal VCO frequency 2 entry
26 Illegal YIG frequency 1 entry
27 Illegal YIG frequency 2 entry
28 Illegal YIG DAC frequency entry
29 Frequency overflow due to multiplier
30 Pulse parameters measurements greater than specified MINPRF
31 GPIB input message too long
32 GPIB message starts with a number
33 GPIB message starts with a wrong number
34 Unidentified word found
35 Word misspelled
36 Missing space
37 Wrong mode argument
38 Parameter out of range
39 Command is missing parameter
40 Non-numeric parameter value
41 Wrong frequency terminator
42 Wrong time terminator
43 Wrong output argument
44 Numeric argument syntax error
45 Numeric mantissa has too many digits
46 Numeric exponent has too many digits
47 Hex data should precede with a zero

3-60
Phase Matrix, Inc.TM
595A & 598A
ERROR NUMBERDEFINITION
48 No hex memory address specified
49 Illegal hex data entry
50 Illegal hex address entry
51 Special Functions 72 and 73 not supported via GPIB (use store and fetchcommands)
52 Illegal entry
53 Access to this function blocked by memory protect switch
60 RAM fault
61 ROM checksum error: ADDR 3000 to FFFF
80 Invalid pulse period
81 Invalid pulse width
82 Invalid pulse delay
83 Invalid combination of pulse parameters (width + delay > period)
84 Invalid mode selected for internal delaying pulse generator
85 Invalid profile increment
87 Illegal power-offset entry
86 Invalid profile end
90 No key release detected
91 Option not installed
92 Band 3 option in a 595A unit
94 Nonvolatile memory failure
99 No IF detected

3-61
Figure 3-22. Functional Block Diagram for Models 598A and 598A
DIPLEXER LOPWR AMP MULTIPLIER
X12CABLEREMOTE
SENSOR
BAND 3 INPUT
26.5 - 170 GHz
J1
LO = 5 TO 6 GHz@ +13dBmIF = 600 MHz @ -50 dBm IF
AMPIF
ATTENIFAMP
IF
FILTER
EXT FREQ ASSY - OPTION 5804
J3
J2
AFCCONTROL
LOGIC
VCO
RFPWRAMP
BUFF
BUFF
AFC PCB
COMBGENERATOR
VIDEO
IF
YIGFILTER
BAND 2 INPUT1-26.5 GHz
IFATTEN
J1
J5
J4
J3
J2
IF PCB
AMP
A202 - CONVERTOR ASSY
VCO RF AMP PCB
DAC
I/OCTRLDACCUR
DRV
YIG DRIVE PCB
DIVIDE
BY N
100 MHz
OSC TRIGGER
SELECT
DELAYPERIOD WIDTHDELAYLINE
F/FFINE
DELAY
ATT AMP
DET
(CL)
ATT 4ECLCONV
(CL)
AMP
J5
J1
J6
J4
200 MHzHPF
J7
(CL)
TERM
LIM PINATT
DAC(CL)
AMP
(CL)
4
DET
ECLCONV
AMP
(CL)
DET
J8ATT LIM AMP
(CL)
LIM
DET
ECLCONV
LPF
(CL) (CL)
AMP
VIDEOMUXTEMP
(CL)
I/OCONTROL
PWRMEAS
LINES (CL)CONTROL
J2
A108 - SIGNAL CONDITIONER
BAND 3 IF
VCO
BAND 2 IF
BAND 2 VID
BAND 1 INPUT250MHz - 1GHz
BAND 0 INPUT100Hz - 250MHz
BAND 1
BAND 0
I/O PORT
INT INT
RAM16 X 8
INTERRUPT
LOGIC
SCANCONTROL
LOGIC
BUFFERS
KEYBOARD
SEGMENTDRIVERS
CONTROLLOGIC
235267817
COLUMN
DRIVERS
DISPLAY
ANNUNCIATORS
INTENSITYCONTROL
SAMPLERATE &HOLD
SAMPLE
RATECONTROL
A2 - FRONT PANEL ASSY
A107 - PULSE GENERATOR - OPTION 5810
+5V
-5.2V
+12V
-12V
+18 UNREG
+9V
GND
A101 - POWERSUPPLY
4 MHz
XTAL68B09
uPROC
SYSTEM
PROMRAM
RAM
NON-VOLATILE
BUFFERS
CONTROLLOGIC
BUFFERS GPIB
REAR PANEL
A102 - PROCESSOR/GPIB
AMP
AMPDELAY
LINE
LINERCVR
COUNTCHAIN
CONTROL
I/OGATEADJUST
ECL TO
TTL CONVAMP
J2IFOUT
A105 - COUNT CHAIN
INHIBIT IN
PULSE OUT
TRIGGER IN
TRIGGER OUT
GATE OUT
10 MHz IN/OUT
THRESH OUT
REAR PANEL
J3
BUFF
BUFF
SELECTLOGIC
80 MHzPHASELOCK
LOOP
J2
J1
GATELOGIC1uS TO4 SEC
GATEACCUM
CONTROL
GATE
LOGIC
CONTROLI/O
REFERENCETCXO10 MHz
TIMEBASE
A108 - GATE GENERATOR
22 dB 40 dB
6 dB

3-62
This Page Intentionally Left Blank

4-1
4ACCESSORIES
INTRODUCTIONThe accessories available for use with the Phase Matrix 595A and 598A counters are listed below. Part numbers and brief descriptions of the accessories are included.
Accessory Phase Matrix Number Description Part Number
ACC010 Molded Carrying Case —––––––––ACC021 Rack-mount kit with handles (includes hardware) 2011121-01ACC022 Rack-mount kit without handles (includes hardware) 2011122-01ACC043 Molded case and tools for adjustments and troubleshooting 2011125-02ACC101 Rack-mount kit with chassis slides and handles (includes hardware) 2011123-01ACC102 Rack-mount kit with chassis slides/without handles (includes hardware) 2011124-01
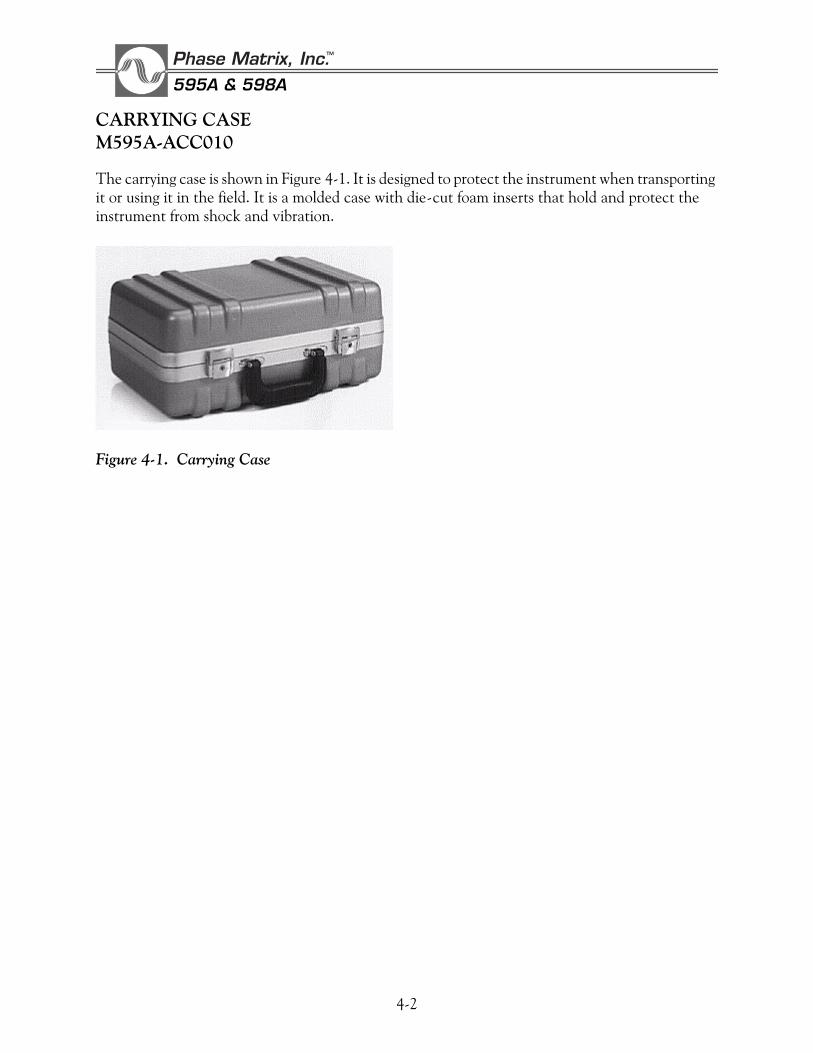
4-2
Phase Matrix, Inc.TM
595A & 598A
CARRYING CASEM595A-ACC010
The carrying case is shown in Figure 4-1. It is designed to protect the instrument when transporting it or using it in the field. It is a molded case with die-cut foam inserts that hold and protect the instrument from shock and vibration.
Figure 4-1. Carrying Case

4-3
4/ACCESSORIES
RACK-MOUNT KIT WITH HANDLESM595A-ACC021
This service kit provides all the parts and hardware required to rack-mount the instrument. The rack-mount brackets have built-in handles. Figure 4-2 shows one rack mount and the mounting hardware provided in the kit. Two rack mounts and mounting hardware for both sides of the instrument are included.
Figure 4-2. Rack-Mount Kit M595A-ACC021
RACK-MOUNT KIT WITH HANDLESM595A-ACC021 2011121-01 (595A)PARTS LIST 2011121-01 (598A)ReferenceDesignator Description
Phase MatrixPart Number
1 RACK MOUNT WITH D-HANDLE, GRAY, 3.50 INCH 5210435-12
2 NUT, FLANGE, 8-32 5210441-01
3 SCREW, FLANGE HEAD, X-REC, (100) SLFLKG, 8-32 X 5/16 5149001-05
4 HARDWARE KIT, RACK-MOUNT (US) 2010414-01
5 HARDWARE KIT, RACK-MOUNT (METRIC) 5000262-00
6 TRIM STRIP, HANDLE, GRAY, 3.25 INCHES 5210440-12
7 END CAP, D-HANDLE, GRAY 5220049-02
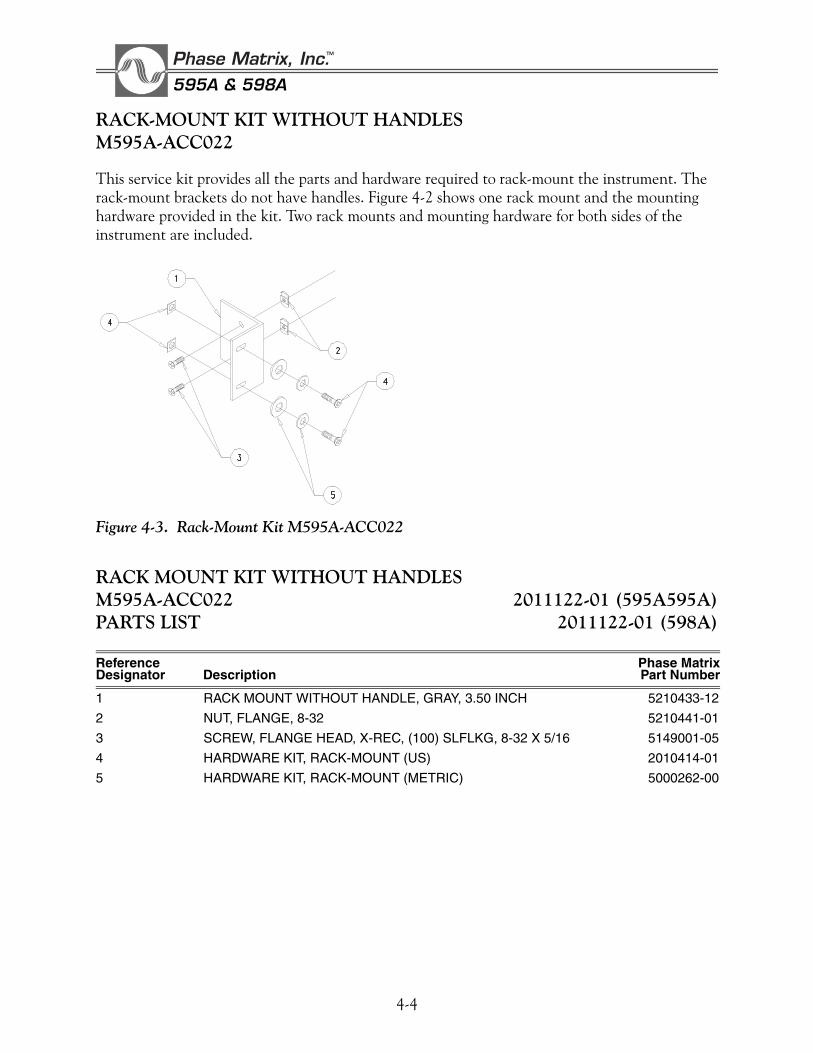
4-4
Phase Matrix, Inc.TM
595A & 598A
RACK-MOUNT KIT WITHOUT HANDLESM595A-ACC022
This service kit provides all the parts and hardware required to rack-mount the instrument. The rack-mount brackets do not have handles. Figure 4-2 shows one rack mount and the mounting hardware provided in the kit. Two rack mounts and mounting hardware for both sides of the instrument are included.
Figure 4-3. Rack-Mount Kit M595A-ACC022
RACK MOUNT KIT WITHOUT HANDLESM595A-ACC022 2011122-01 (595A595A)PARTS LIST 2011122-01 (598A)
ReferenceDesignator Description
Phase MatrixPart Number
1 RACK MOUNT WITHOUT HANDLE, GRAY, 3.50 INCH 5210433-12
2 NUT, FLANGE, 8-32 5210441-01
3 SCREW, FLANGE HEAD, X-REC, (100) SLFLKG, 8-32 X 5/16 5149001-05
4 HARDWARE KIT, RACK-MOUNT (US) 2010414-01
5 HARDWARE KIT, RACK-MOUNT (METRIC) 5000262-00

4-5
4/ACCESSORIES
SERVICE KIT (ADJUSTMENT AND TROUBLESHOOTING TOOL KIT)M595A-ACC043
This service kit provides a set of tools for adjustments and troubleshooting. The tools are supplied in a molded case.
Figure 4-4. Service Kit M595A-ACC043
SERVICE KIT M595A-ACC043 2011125-02 (595A)PARTS LIST 2011125-02 (598A)
ReferenceDesignator Description
Phase MatrixPart Number
1 PCB ASSY, EXTENDER 2020514-012 CABLE ASSY, BNC TO SMB 2040222-013 CONN, BNC E/Z HOOK TEST 2610054-004 CABLE ASSY, BNC TO MCX 2041079-015 CABLE ASSY, BNC TO STRAIGHT MCX 2041081-016 TOOL, INSULATED TUNING 5730006-007 TOOL, MINIGRABBER TEST KIT 5730007-008 CASE ASSY, TOOL BOX 2010852-02
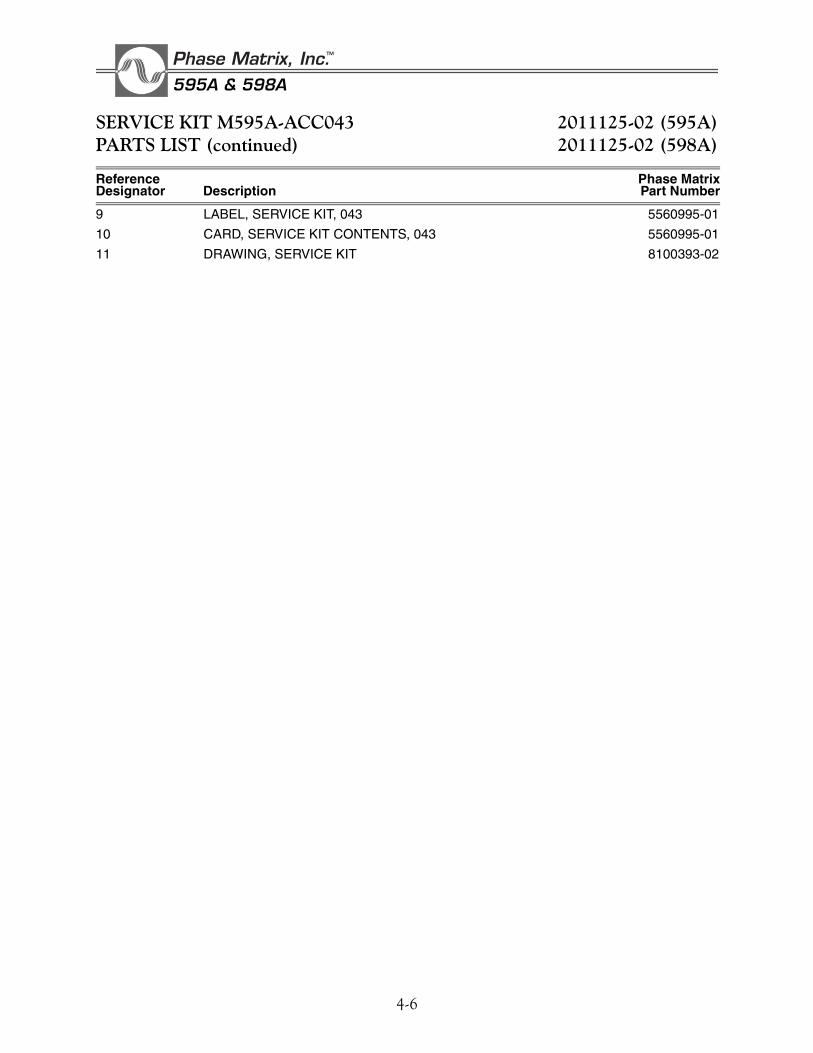
4-6
Phase Matrix, Inc.TM
595A & 598A
SERVICE KIT M595A-ACC043 2011125-02 (595A)PARTS LIST (continued) 2011125-02 (598A)
ReferenceDesignator Description
Phase MatrixPart Number
9 LABEL, SERVICE KIT, 043 5560995-01
10 CARD, SERVICE KIT CONTENTS, 043 5560995-01
11 DRAWING, SERVICE KIT 8100393-02

4-7
4/ACCESSORIES
RACK-MOUNT KIT WITH CHASSIS SLIDES AND HANDLESM595A-ACC101
This service kit provides all the parts and hardware required to rack-mount the instrument on slides for easier access. The rack-mount brackets have built-in handles. Figure 4-2 shows one rack mount, one slide, and the mounting hardware provided in the kit. Two rack mounts, two slides, and mounting hardware for both sides of the instrument are included.
Figure 4-5. Rack-Mount Kit M595A-ACC101
RACK-MOUNT KIT WITH CHASSIS SLIDES AND HANDLESM595A-ACC101 2011123-01 (595A)PARTS LIST 2011123-01 (598A)
ReferenceDesignator Description
Phase MatrixPart Number
1 SLIDE, CHASSIS, 370QD-24 INCH 5000366-002 RACK MOUNT W/HANDLES, GRAY, 3.50 INCH 5210435-123 BRACKET, RACK-MOUNT, SLIDE 5210953-014 NUT, FLANGE, 8-32 5210441-015 SCREW, FLATHEAD, X-REC, (100) SLFLKG, 8-32 X 5/16 5149001-056 SCREW, PANHEAD, X-REC, SLFLKG 8-32 X 1/4 UNC 5124008-047 HARDWARE KIT, RACK-MOUNT (US) 2010414-01
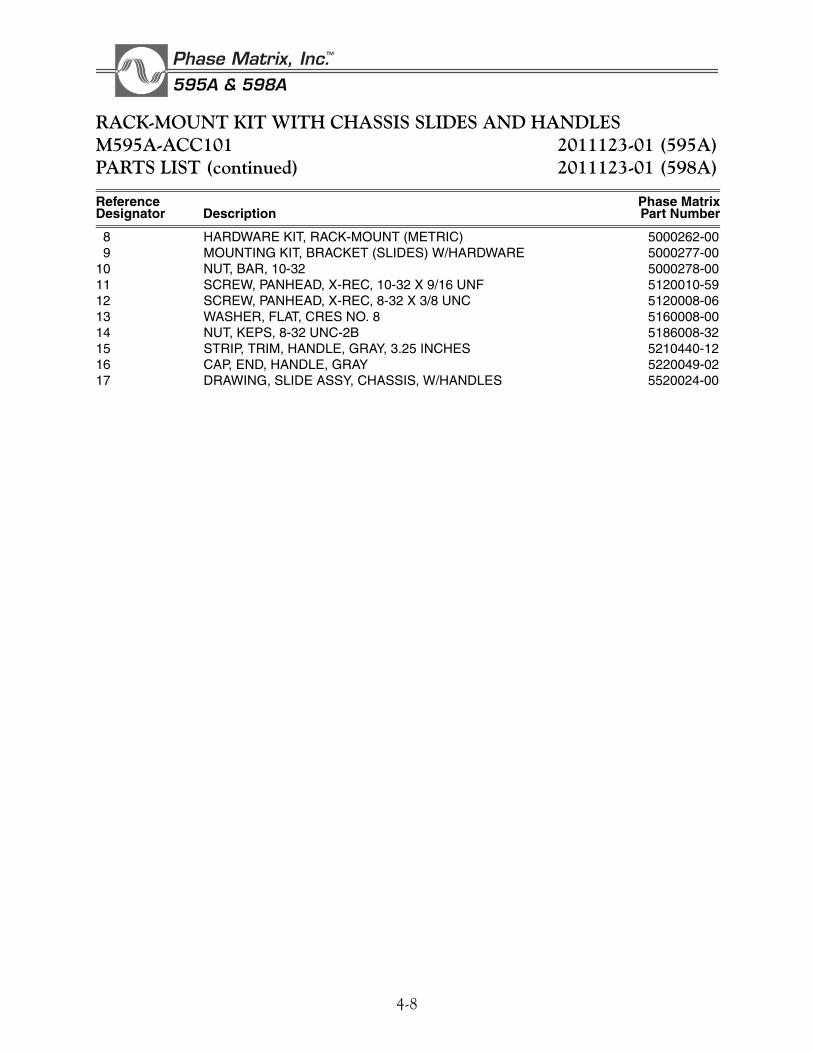
4-8
Phase Matrix, Inc.TM
595A & 598A
RACK-MOUNT KIT WITH CHASSIS SLIDES AND HANDLESM595A-ACC101 2011123-01 (595A)PARTS LIST (continued) 2011123-01 (598A)
ReferenceDesignator Description
Phase MatrixPart Number
8 HARDWARE KIT, RACK-MOUNT (METRIC) 5000262-009 MOUNTING KIT, BRACKET (SLIDES) W/HARDWARE 5000277-00
10 NUT, BAR, 10-32 5000278-0011 SCREW, PANHEAD, X-REC, 10-32 X 9/16 UNF 5120010-5912 SCREW, PANHEAD, X-REC, 8-32 X 3/8 UNC 5120008-0613 WASHER, FLAT, CRES NO. 8 5160008-0014 NUT, KEPS, 8-32 UNC-2B 5186008-3215 STRIP, TRIM, HANDLE, GRAY, 3.25 INCHES 5210440-1216 CAP, END, HANDLE, GRAY 5220049-0217 DRAWING, SLIDE ASSY, CHASSIS, W/HANDLES 5520024-00

4-9
4/ACCESSORIES
RACK-MOUNT KIT WITH CHASSIS SLIDES/WITHOUT HANDLESM595A-ACC102
This service kit provides all the parts and hardware required to rack-mount the instrument on slides for easier access. The rack-mount brackets do not have handles. Figure 4-2 shows one rack mount, one slide, and the mounting hardware provided in the kit. Two rack mounts, two slides, and mounting hardware for both sides of the instrument are included.
Figure 4-6. Rack-Mount Kit M595A-ACC102
RACK-MOUNT KIT WITH CHASSIS SLIDES/WITHOUT HANDLES M595A-ACC102 2011124-01 (595A)PARTS LIST 2011124-01 (598A)
ReferenceDesignator Description
Phase MatrixPart Number
1 SLIDE, CHASSIS, 370QD-24 INCH 5000366-002 RACK MOUNT W/O HANDLES, GRAY, 3.50 INCH 5210433-123 BRACKET, RACK-MOUNT, SLIDE 5210953-014 NUT, FLANGE, 8-32 5210441-015 SCREW, FLATHEAD, X-REC, (100) SLFLKG, 8-32 X 5/16 5149001-056 SCREW, PANHEAD, X-REC, SLFLKG 8-32 X 1/4 UNC 5124008-047 HARDWARE KIT, RACK-MOUNT (US) 2010414-018 HARDWARE KIT, RACK-MOUNT (METRIC) 5000262-009 MOUNTING KIT, BRACKET (SLIDES) W/HARDWARE 5000277-00
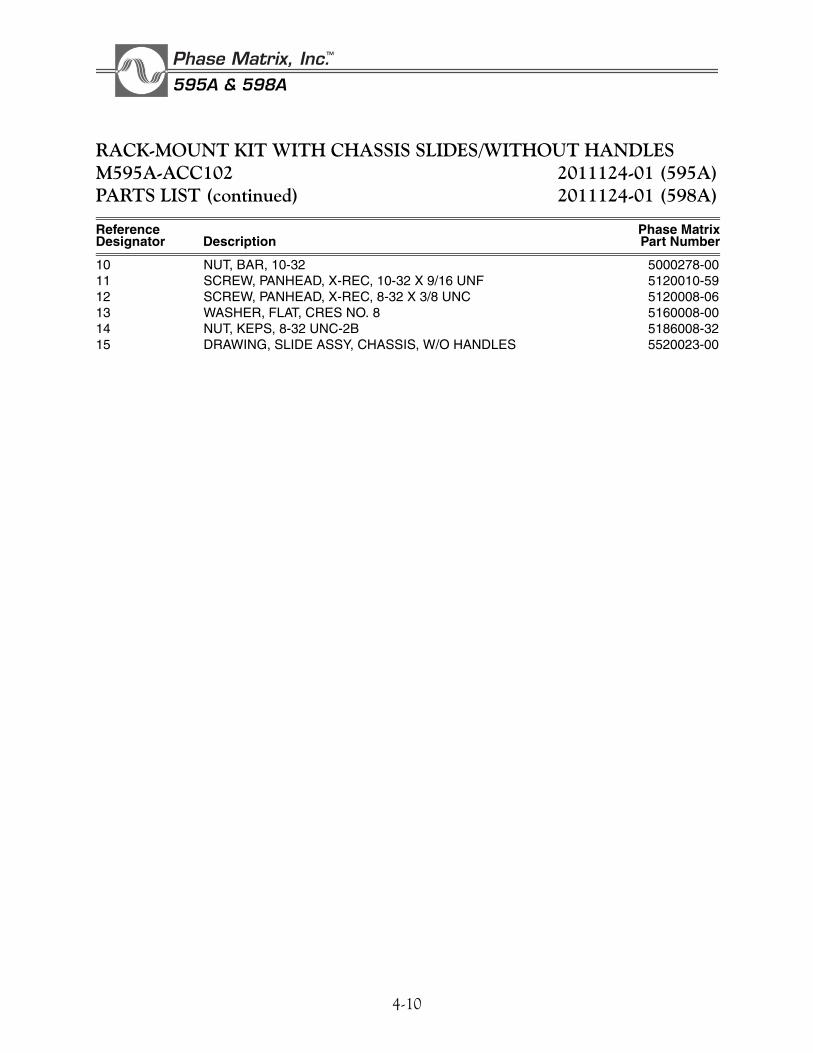
4-10
Phase Matrix, Inc.TM
595A & 598A
RACK-MOUNT KIT WITH CHASSIS SLIDES/WITHOUT HANDLES M595A-ACC102 2011124-01 (595A)PARTS LIST (continued) 2011124-01 (598A)
ReferenceDesignator Description
Phase MatrixPart Number
10 NUT, BAR, 10-32 5000278-0011 SCREW, PANHEAD, X-REC, 10-32 X 9/16 UNF 5120010-5912 SCREW, PANHEAD, X-REC, 8-32 X 3/8 UNC 5120008-0613 WASHER, FLAT, CRES NO. 8 5160008-0014 NUT, KEPS, 8-32 UNC-2B 5186008-3215 DRAWING, SLIDE ASSY, CHASSIS, W/O HANDLES 5520023-00

5-1
5
REMOTE PROGRAMMING
GENERAL PURPOSE INTERFACE BUS
The GPIB interface of the 595A/598A counters conforms to the IEEE Code and Format conventions and the IEEE 488-1978 Standards. With the GPIB interface, the counter can respond to remote control instructions and can output measurement results via the IEEE 488-1978 bus interface. At the simplest level, the counter can output data to other devices, such as a thermal printer. In more sophisticated systems, an instrument controller or computer can program the counter remotely, trigger measurements, and read results. A quick reference list of GPIB commands is located in Appendix A at the end of this manual.
GPIB FUNCTIONS IMPLEMENTED
The GPIB interface function subsets implemented in the 595A and 598A are listed and described in Table 5-1.
Table 5-1. GPIB Interface Function Subsets
Interface Function Subset Description
SOURCE HANDSHAKE SH1 Complete capability
ACCEPTOR HANDSHAKE AH1 Complete capability
TALKER T5 Basic talker, serial poll, talk only mode, unaddress if MLA
LISTENER L4 Basic listener, unaddress if MTA
SERVICE REQUEST SR1 Complete capability
REMOTE/LOCAL RL1 Complete capability
DEVICE CLEAR DC1 Complete capability
DEVICE TRIGGER DT1 Complete capability
PROGRAMMING
5-2
Phase Matrix, Inc.TM
595A & 598A
The 595A/598A counters thus have the capacity to provide the following capabilities in remote operation:
• Acceptance of device-dependent messages to set the instrument measurement mode and parameters. The input buffer can store up to 256 characters accepted from the bus. Execution of the device-dependent messages starts after the first message separator is accepted. Input of more characters interrupts the execution so that the additional characters are accepted and stored for fast bus response (unless buffer is full).
• Output of measurement results or any parameter value or instrument mode on demand from the system controller.
• Configuration of the output format in several ways to accommodate different system controllers and speed requirements.
• Implementation of device clear and selected device clear functions to configure the instrument to the power-on state. See page 5-13 for the counter’s power-on configuration.
• Implementation of group execute trigger (GET) message to start a new measurement cycle.
• Implementation of serial poll functions to allow the system controller to get a status byte from the instrument that gives status information for various functions. The instrument can also be instructed to interrupt (SRQ) the controller on any ORed combination of the status events.
• Implementation of remote/local transitions. When the counter is in remote, all front and rear panel keys and switches are disabled (except the POWER switch and the INIT/LOCAL key). Remote/local transitions do not change any instrument configuration (except the sample rate settings, which does override in a remote-to-local transition). When the counter changes from local to remote functioning, or vice-versa, all stored information is retained. The counter operates in the same state as it was in before the change. The only exception is when the counter is performing a special function, the special function is terminated.
• Implementation of local lockout, with the INIT/LOCAL key disabled accordingly. When the counter is in remote, and local lockout is not active, the INIT/LOCAL key on the front panel acts as the return-to-local key.
• Availability of counter configuration information, in addition to the status events available in the status byte, by means of a special OUTPUT CONFIGURATION command. When the counter is configured as a talker, it outputs five bytes that contain the current configuration.
• Recognition of all three bus terminators: CR LF (carriage return/line feed), NL (null), and EOI (end or identify).
• Availability of front panel annunciators for remote (RMT), talker (TLK), listener (LSN), and service request (SRQ) that continuously show the interface state.
• Implementation of talk-only modes for no-controller applications.

5-3
5/PROGRAMMING
DEVICE-DEPENDENT MESSAGES (LISTENER FEATURES)
A device-dependent message generally consists of reserved words and numbers. The message structure depends on the type of message, and can be:
• Header only
• Header and argument
• Header and argument and terminator
Where the header is a reserved word, the argument is a number or a reserved word, and the terminator is a reserved word.
Messages can be concatenated with a comma (,) or semicolon (;) as separators. A message chain can be terminated with CR LF or NL or EOI.
NOTE
Any device-reserved word is recognized by at least the two first characters,with the exception of RESET which requires the first four letters to beentered. These first two characters are printed in large boldface type in thefollowing command lists and in program examples to promote userfamiliarity with the shortened form of the command. Spelling of morecharacters (up to the full word) is optional for user program readability.
Example: INITIALIZE, INITIAL, INIT, and IN are all recognized equivalently.
A <number> can be sent in any of the defined IEEE formats (NR1, NR2, NR3).
Example: 12000, 12000.00, 001.2e4, and .12000E+5 are all recognized equivalently.
The reserved word DEFAULT can replace a numeric argument for default value assignment.
The terminator in the parameter messages group is optional, and defaults to Hz or seconds.
A command message having more than one word (e.g., PERIOD ON) should have a space between words. However, this is optional if the second word is a number (OFFSET4.3e9 and OFFSET 4.3E9 are recognized equivalently). Additional spaces in front of words, between words, or after a message are optional, and are ignored. Nulls and CRs are ignored anywhere. Both upper case and lower case characters are equally acceptable.
Following are the possible GPIB command messages for the 595A/598A series of counters.
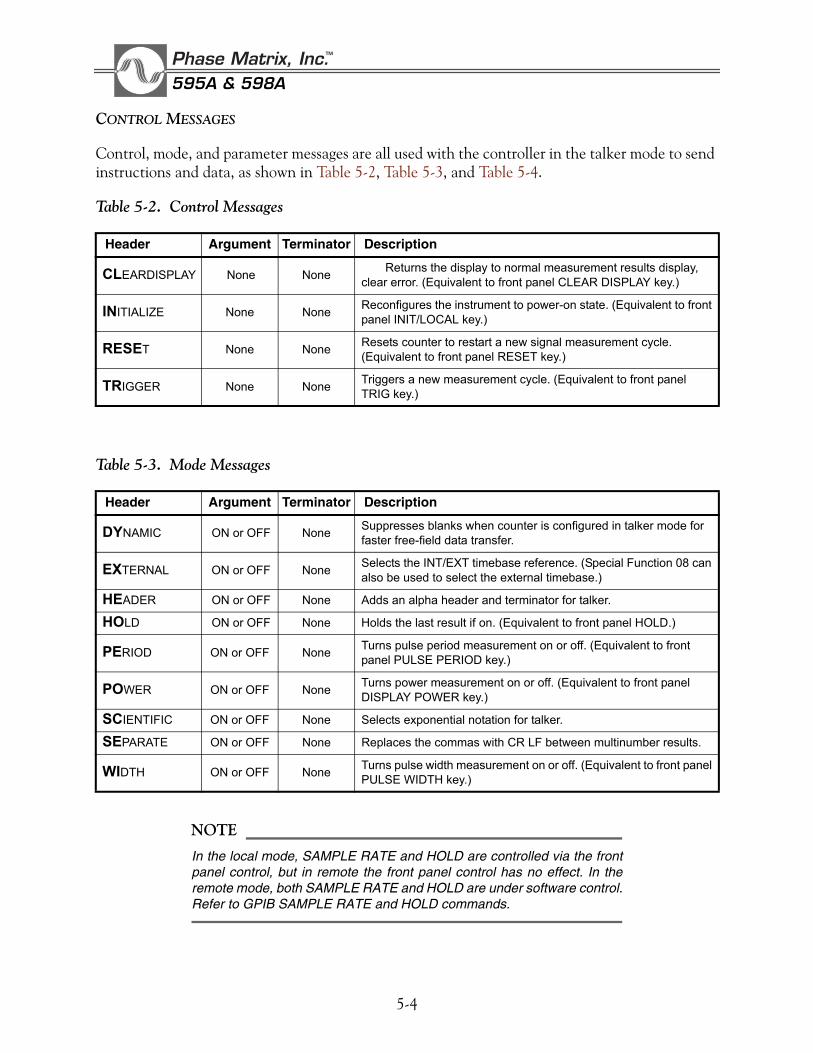
5-4
Phase Matrix, Inc.TM
595A & 598A
CONTROL MESSAGES
Control, mode, and parameter messages are all used with the controller in the talker mode to send instructions and data, as shown in Table 5-2, Table 5-3, and Table 5-4.
Table 5-2. Control Messages
Table 5-3. Mode Messages
NOTE
In the local mode, SAMPLE RATE and HOLD are controlled via the frontpanel control, but in remote the front panel control has no effect. In theremote mode, both SAMPLE RATE and HOLD are under software control.Refer to GPIB SAMPLE RATE and HOLD commands.
Header Argument Terminator Description
CLEARDISPLAY None None Returns the display to normal measurement results display, clear error. (Equivalent to front panel CLEAR DISPLAY key.)
INITIALIZE None None Reconfigures the instrument to power-on state. (Equivalent to front panel INIT/LOCAL key.)
RESET None None Resets counter to restart a new signal measurement cycle. (Equivalent to front panel RESET key.)
TRIGGER None None Triggers a new measurement cycle. (Equivalent to front panel TRIG key.)
Header Argument Terminator Description
DYNAMIC ON or OFF None Suppresses blanks when counter is configured in talker mode for faster free-field data transfer.
EXTERNAL ON or OFF None Selects the INT/EXT timebase reference. (Special Function 08 can also be used to select the external timebase.)
HEADER ON or OFF None Adds an alpha header and terminator for talker.
HOLD ON or OFF None Holds the last result if on. (Equivalent to front panel HOLD.)
PERIOD ON or OFF None Turns pulse period measurement on or off. (Equivalent to front panel PULSE PERIOD key.)
POWER ON or OFF None Turns power measurement on or off. (Equivalent to front panel DISPLAY POWER key.)
SCIENTIFIC ON or OFF None Selects exponential notation for talker.
SEPARATE ON or OFF None Replaces the commas with CR LF between multinumber results.
WIDTH ON or OFF None Turns pulse width measurement on or off. (Equivalent to front panel PULSE WIDTH key.)
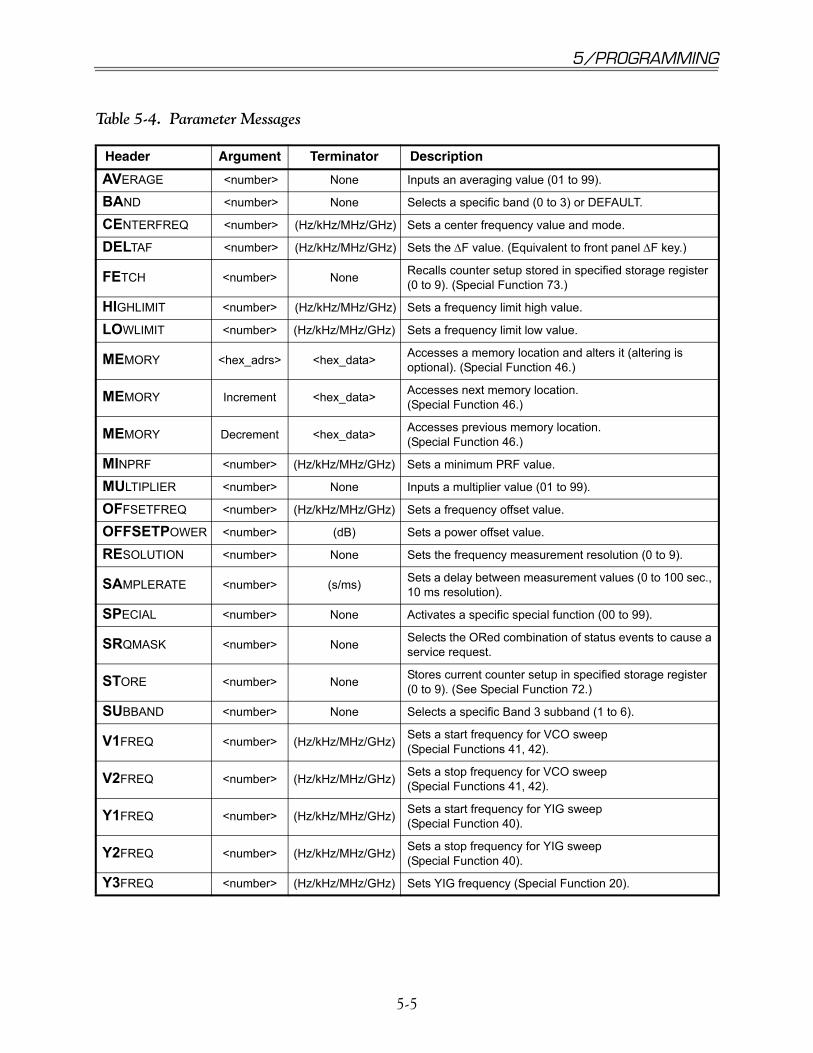
5-5
5/PROGRAMMING
Table 5-4. Parameter Messages
Header Argument Terminator Description
AVERAGE <number> None Inputs an averaging value (01 to 99).
BAND <number> None Selects a specific band (0 to 3) or DEFAULT.
CENTERFREQ <number> (Hz/kHz/MHz/GHz) Sets a center frequency value and mode.
DELTAF <number> (Hz/kHz/MHz/GHz) Sets the ΔF value. (Equivalent to front panel ΔF key.)
FETCH <number> None Recalls counter setup stored in specified storage register (0 to 9). (Special Function 73.)
HIGHLIMIT <number> (Hz/kHz/MHz/GHz) Sets a frequency limit high value.
LOWLIMIT <number> (Hz/kHz/MHz/GHz) Sets a frequency limit low value.
MEMORY <hex_adrs> <hex_data> Accesses a memory location and alters it (altering is optional). (Special Function 46.)
MEMORY Increment <hex_data> Accesses next memory location.(Special Function 46.)
MEMORY Decrement <hex_data> Accesses previous memory location.(Special Function 46.)
MINPRF <number> (Hz/kHz/MHz/GHz) Sets a minimum PRF value.
MULTIPLIER <number> None Inputs a multiplier value (01 to 99).
OFFSETFREQ <number> (Hz/kHz/MHz/GHz) Sets a frequency offset value.
OFFSETPOWER <number> (dB) Sets a power offset value.
RESOLUTION <number> None Sets the frequency measurement resolution (0 to 9).
SAMPLERATE <number> (s/ms) Sets a delay between measurement values (0 to 100 sec., 10 ms resolution).
SPECIAL <number> None Activates a specific special function (00 to 99).
SRQMASK <number> None Selects the ORed combination of status events to cause a service request.
STORE <number> None Stores current counter setup in specified storage register (0 to 9). (See Special Function 72.)
SUBBAND <number> None Selects a specific Band 3 subband (1 to 6).
V1FREQ <number> (Hz/kHz/MHz/GHz) Sets a start frequency for VCO sweep (Special Functions 41, 42).
V2FREQ <number> (Hz/kHz/MHz/GHz) Sets a stop frequency for VCO sweep (Special Functions 41, 42).
Y1FREQ <number> (Hz/kHz/MHz/GHz) Sets a start frequency for YIG sweep (Special Function 40).
Y2FREQ <number> (Hz/kHz/MHz/GHz) Sets a stop frequency for YIG sweep (Special Function 40).
Y3FREQ <number> (Hz/kHz/MHz/GHz) Sets YIG frequency (Special Function 20).

5-6
Phase Matrix, Inc.TM
595A & 598A
OUTPUT CONTROL MESSAGES
The commands listed in Table 5-5 are used with the controller in the talker mode to request the output of data.
Table 5-5. Output Control Messages
Header Description
OUTPUT BAND Outputs the number of the last specified band.
OUTPUT CENTERFREQ Outputs the center frequency last specified.
OUTPUT DATE Outputs a 42-character string that shows the revision level and date code of the software. The format is: #######-## REV.X MM-DD-YY.
OUTPUT DEFAULT Outputs displayed data.
OUTPUT DELTAF Outputs the last specified ΔF value.
OUTPUT ERRORNUMBER Outputs the number of the last error. See listing of error numbers in Section 3.
OUTPUT FREQUENCY(AND POWER)(AND WIDTH)(AND PERIOD)
Controls which measurement results to output. (Note: More than one measurement result is optional. The order of the results is preserved in the output. Any three of frequency, power, width and period can be used in any combination.)
OUTPUT HIGHLIMIT Outputs the high frequency limit last specified.
OUTPUT IDENTIFICATION Outputs “EIP59nA GPIB dd”, where n is 5 or 8 and dd is the GPIB address.
OUTPUT KEYCODE Outputs the code of the last key pressed.
OUTPUT LEVEL Outputs the rough amplitude measurement result (Special Function 20).
OUTPUT LOWLIMIT Outputs the low frequency limit last specified.
OUTPUT MEMORY Outputs the content of memory in the last accessed location (Special Function 46).
OUTPUT MINPRF Outputs the minimum PRF last specified.
OUTPUT MULTIPLIER Outputs the last specified multiplier value.
OUTPUT OFFSETFREQ Outputs the frequency offset last specified.
OUTPUT OFFSETPOWER Outputs the power offset last specified.
OUTPUT RESOLUTION Outputs the last specified frequency measurement resolution.
OUTPUT SAMPLERATE Outputs the last specified delay time between measurement values.
OUTPUT SRQMASK Outputs the combination of status events required to cause a service request. See page 5-11.
OUTPUT SUBBAND Outputs the number of the last specified subband.
OUTPUT V1FREQ OUTPUT V1FREQ
OUTPUT V2FREQ Outputs the last specified stop frequency for VCO sweep.
OUTPUT Y1FREQ Outputs the last specified start frequency for YIG sweep (Special Function 40).
OUTPUT Y2FREQ Outputs the last specified stop frequency for YIG sweep (Special Function 40).

5-7
5/PROGRAMMING
PULSE GENERATOR CONTROL MESSAGES
Table 5-6. Pulse Generator Control Messages
SYNTAX DEFINITION
In the instructions that follow, | means “or” and N|S means “null or space”. The format used for the examples is generic for Agilent controllers. Sample formats can easily be adapted for other controllers.
DEVICE-DEPENDENT MESSAGE:<message><N|S><message terminator>|<message>
<message separator><message><message terminator>
Message<control message>|<mode message>|
<parameter message>|<output control message>
Message separator ,|;
Message terminator CR LF|NL|EOI
Header Argument Terminator Description
GEND <number> s/ms/μs/ns Last pulse delay in auto profile measurement
GDELAY <number> s/ms/μs/ns Pulse delay from trigger
GINCREMENT <number> s/ms/μs/ns Delay increment for auto profile measurement (See Special Function 77.)
GWIDTH <number> s/ms/μs/ns Pulse width
GPERIOD none none Pulse period
GMODE0123
nonenonenonenone
Trigger modeTurns off pulse generatorTrigger externalTrigger continuousTrigger on signal threshold
OUTPUT GDELAY none none Outputs the last pulse delay
OUTPUT GEND none none Outputs the last pulse delay in profile
OUTPUT GINCREMENT none none Outputs the last delay increment in profile
OUTPUT GPERIOD none none Outputs the last pulse period
OUTPUT GWIDTH none none Outputs the last pulse width
OUTPUT GMODE none none Outputs the last trigger mode0=OFF, 1=EXT, 2=CONT, 3=THRESHOLD
PROFILE ON or OFF none Turns the pulse profile function on or off. (Special Function 77 except increment and end values are entered using the GINCREMENT and GEND GPIB commands.)

5-8
Phase Matrix, Inc.TM
595A & 598A
1. CONTROL MESSAGE: INITIALIZE|RESET|TRIGGER|CLEAR DISPLAY
Example: To instruct the instrument to begin a new signal acquisition process, the followingstatement could be used: Send 0, 18, “RESET”, NLend
2. MODE MESSAGE: <mode name><space><mode position>
Mode name WIDTH|PERIOD|HOLD|EXTERNAL|SCIENTIFIC|SEPARATE|HEADER|DYNAMIC|POWER
Mode position ON|OFF|1|0|DEFAULT
Example: To instruct the instrument to an external reference, the following statement wouldbe used: Send 0, 18, “EXTERNAL ON”, NLend
3. PARAMETER MESSAGE: <parameter message 1>|<parameter message 2>|
<parameter message 3>|<parameter message 4>|
<parameter message 5>|<parameter message 6>|
PARAMETER MESSAGE 1: <parameter 1><N|S><argument>
Parameter 1 BAND|SUBBAND|RESOLUTION|SPECIAL|AVERAGE|MULTIPLIER|SQRMASK
Argument DEFAULT|<number>
Number <NULL|+|><mantissa><exponent>
Mantissa <digit>|<digit string>|<digit|digit string, digit|digit string>
Exponent NULL|E<NULL|+|><digit|digit string>
Example: To instruct the instrument to accept an averaging value, the following statementcould be used: Send 0, 18, “AVERAGE 70", NLend
PARAMETER MESSAGE 2: <parameter 2><N|S><argument><N|S><frequency terminator>
Parameter 2 OFFSETFREQ|OFFSETPOWER|HIGHLIMIT|LOWLIMIT|MINPRF|CENTERFREQ|Y1FREQ|Y2FREQ|Y3FREQ|V1FREQ|V2FREQ|DELTAF
Frequency terminator NULL|Hz|kHz|MHz|GHz
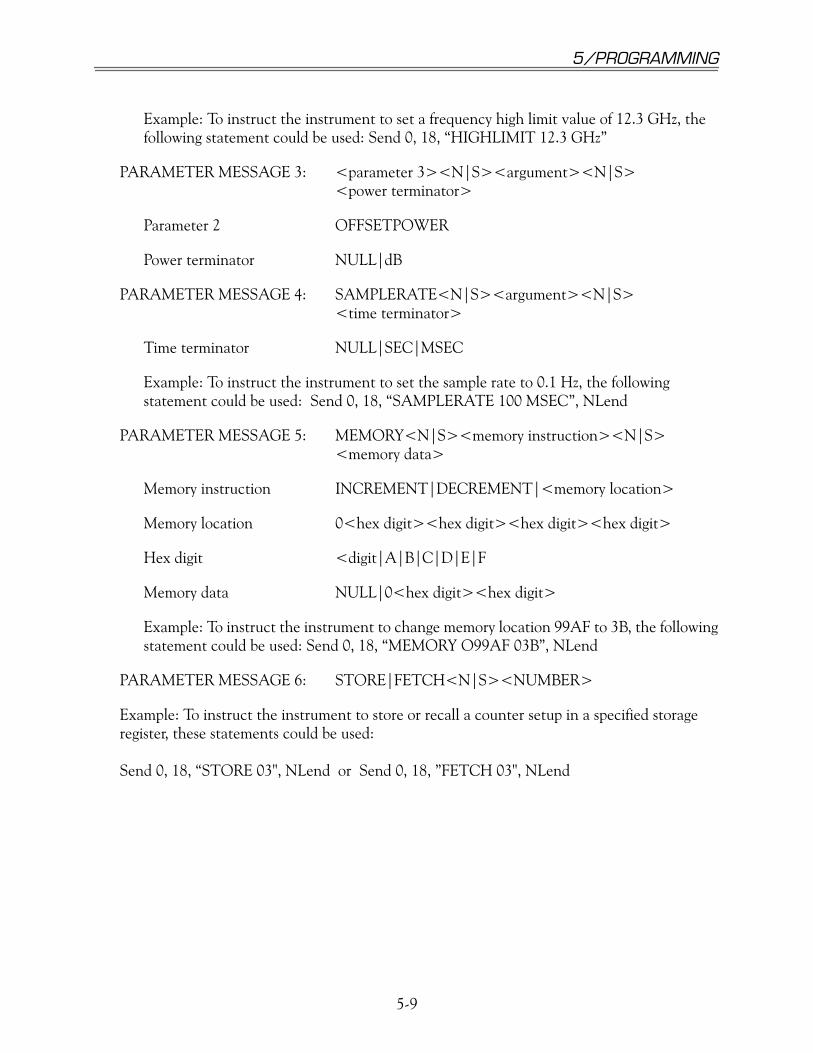
5-9
5/PROGRAMMING
Example: To instruct the instrument to set a frequency high limit value of 12.3 GHz, thefollowing statement could be used: Send 0, 18, “HIGHLIMIT 12.3 GHz”
PARAMETER MESSAGE 3: <parameter 3><N|S><argument><N|S><power terminator>
Parameter 2 OFFSETPOWER
Power terminator NULL|dB
PARAMETER MESSAGE 4: SAMPLERATE<N|S><argument><N|S><time terminator>
Time terminator NULL|SEC|MSEC
Example: To instruct the instrument to set the sample rate to 0.1 Hz, the followingstatement could be used: Send 0, 18, “SAMPLERATE 100 MSEC”, NLend
PARAMETER MESSAGE 5: MEMORY<N|S><memory instruction><N|S><memory data>
Memory instruction INCREMENT|DECREMENT|<memory location>
Memory location 0<hex digit><hex digit><hex digit><hex digit>
Hex digit <digit|A|B|C|D|E|F
Memory data NULL|0<hex digit><hex digit>
Example: To instruct the instrument to change memory location 99AF to 3B, the followingstatement could be used: Send 0, 18, “MEMORY O99AF 03B”, NLend
PARAMETER MESSAGE 6: STORE|FETCH<N|S><NUMBER>
Example: To instruct the instrument to store or recall a counter setup in a specified storageregister, these statements could be used:
Send 0, 18, “STORE 03", NLend or Send 0, 18, ”FETCH 03", NLend

5-10
Phase Matrix, Inc.TM
595A & 598A
4. OUTPUT CONTROL MESSAGE: OUTPUT<SPACE><output parameter>
Output parameter <single parameter>|<result parameter>
Single parameter RESOLUTION|BAND|SUBBAND|AVERAGE|MULTIPLIER|ERRORNUMBER|SQRMASK|CONFIGURATION|LEVEL|MEMORY|IDENTIFICATION|LOWLIMIT|HIGHLIMIT|OFFSETFREQ|OFFSETPOWER|CENTERFREQ|MINPRF|SAMPLERATE|KEYCODE|SETUP
Result parameter DEFAULT|<result list>
Result list <result name>|<result name><SPACE>AND<SPACE><result name>|<result name><SPACE>AND<SPACE><result name><SPACE>AND<SPACE><result name>
Result name FREQUENCY|WIDTH|PERIOD|POWER
Example: To request the controller to display the width and frequency, in that order, theoperator enters:
Send 0, 18, “OUTPUT WIDTH AND FREQUENCY”, NLendReceive 0, 18, A$, StopEndPrint A$
OUTPUT AND FORMAT EXAMPLES
The following program segment illustrates how controllers function with the counter. This program sets the counter up in a sample configuration and programs it to make a measurement of a 12.5 GHz pulsed signal with a 13.258 ms period. The talk and listen address of the counter is assumed to be 18.
Dimension A$(36)Send 0, 18, “IN”, NLendWait 4000Send 0, 18, “WI ON, RE 4", NLendSend 0, 18, ”HI 17.5 GHZ, LO 1.1 GHZ", NLendWait 1000Send 0, 18, “OUTPUT WI AND FR”, NLendWait 1000 Receive 0, 18, A$, StopEnd Print A$

5-11
5/PROGRAMMING
This program initializes the counter, provides a resolution value and a high and low frequency limit, and instructs it to output pulse width to the counter display and pulse width and frequency to the controller display. The controller display would appear something like this:
0.0000132580 12500000000
OUTPUT MESSAGES (TALKER FEATURES)
After receiving a talk address, the GPIB outputs the current configuration, or any parameter value or measurement result, in response to the appropriate output control message. After power-on or device-clear, the controller outputs the displayed measurement results (as it does after the OUTPUT DEFAULT command).
The controller can be instructed to output any ordered combination of the three of the four possible measurements, no matter what is displayed on the front panel.
Example: OUTPUT FREQ AND WIDTH
OUTPUT POWER AND PERIOD
OUTPUT WIDTH AND FREQUENCY AND PERIOD
The format of each output message can be controlled using the following:
• SCIENTIFIC - provides exponential notation with engineering exponents when SCIENTIFIC is ON. Default is OFF.
• DYNAMIC - suppresses blanks and trailing zeros for faster data transfers when DYNAMIC is ON. Default is OFF.
• HEADER - provides an alpha header and terminator around each numeric data item for clarity, (useful for printers) when HEADER is ON. Default is OFF.
NOTE
Terminator takes over the exponential role if both SCIENTIFIC andHEADER are ON.
• SEPARATE - Substitutes CR LF for the comma between results of one measurement (freq,period) when SEPARATE is ON. Default is OFF.
• DEFAULT - Outputs data in default format. The fixed fields are 16 characters long for the header and argument, and 5 long for the terminator. When none of the output formatting features above are turned on, numbers are right justified, letters are left justified, blanks are filled.

5-12
Phase Matrix, Inc.TM
595A & 598A
Example: The counter is measuring a 12.34 GHz pulsed signal with 98 ns width and 14.567 ms period. The operator enters the following messages through the controller:
RESOLUTION 6OUTPUT FREQ AND WIDTH AND PERIOD
The output for each message format is listed in Table 5-7(b = blank).
Table 5-7. Output Message Formats
If the counter is searching, zero data is output to the controller on all results once every search loop. If the counter has found a signal, a measurement result is output only once. When the instrument is in HOLD, therefore, the user must trigger the counter before sending another talk address. Otherwise, since it has no data to output, the counter holds indefinitely.
STATUS BYTE
Both the 595A and 598A counters maintain a one byte register that contains current information on the status of the instrument. This register, called the status byte, can be accessed through the GPIB using the serial poll command. When serial polled, the counter responds by returning a numeric value between 0 and 256. This value is the weighted sum of the status bits which are set. The status byte structure is shown in Figure 5-1. For example, a value of 132 indicates that the GPIB input buffer is empty and the counter is in the search mode.
Parameter Output
Default bbbbb12340000000,bbbbb0.000000100,bbbbb0.000014570 CR LF
SCIENTIFIC on bbbbbbbb12.340E+9,bbbbbbbbbb100E-9, bbbbbbbb14.57E-6 CR LF
DYNAMIC on 34E9,100E-9,14.57E-6 CR LF
SEPARATE on 2.34E9 CR LF100E-9 CR LF14.57E-6 CR LF
HEADER on FREQUENCY 12.34 GHz CR LFWIDTH 100 NSEC CR LFPERIOD 14.57 USEC CR LF

5-13
5/PROGRAMMING
Figure 5-1. Status Byte Structure
SERVICE REQUEST MASK
The counter can be instructed to send an interrupt, by setting the SRQ line on the GPIB, when any ORed combination of the bits in the status byte are set. This is done by sending the counter a service request mask.
For example, to instruct the counter to generate an SRQ whenever it has valid data available or an error condition exists, send the following service request mask:
Send 0, 18, “SRQMASK 33", NLend
This would tell the counter to generate an SRQ whenever bit 0 and bit 5 of the status byte are set. Since bit 0 corresponds to valid measurement result ready and bit 5 corresponds to an error condition, the counter would generate an SRQ whenever either an error condition exists or a valid measurement is available.
The following items should be included in any program using the SRQ feature:
1. Tell the counter when to generate an SRQ. That is, tell the counter which events should generate an SRQ. This is done using the SRQMASK command.
2. Tell the controller to monitor the SRQ line on the GPIB. The SRQ is a maskable interrupt and the controller needs to know if it should respond to the interrupt.
3. Tell the controller what to do when it receives an SRQ interrupt.
4. Serial poll the counter after an SRQ is generated to clear the interrupt. When the counter generates an SRQ it sets bit 6 in the status byte. Serial polling the instrument clears the SRQ bit and allows the instrument to generate a new SRQ upon the next occurrence of the conditions specified in the SRQ Mask.
5. It may also be necessary to clear the SRQ register in the controller. Consult your manual on the controller for more information on clearing the SRQ register in the controller.
Input buffer empty
IRQ bit (Master Summary Status)Error conditionOverload
Gate on
Search on
Signal found
Valid measurement result (data) ready
bit7(128)
6(64)
5(32)
4(16)
3(8)
2(4)
1(2)
bit0(1)

5-14
Phase Matrix, Inc.TM
595A & 598A
DEFAULT STATE (DEVICE CLEAR FEATURES)
The default state of the instrument occurs after power-on, hardware initialization, or a device clear command. The default state can be customized using Special Function 72. For additional information on this feature, see Section 3. Table 5-8 lists the factory-set default state values of the counter.
Table 5-8. Output Message Formats
Parameter Default State
Average 01
Band 2
Center frequency 0 (off)
Clear display Activated
Converter Reset
Delta F 50 MHz
Display Enabled
Dynamic Off
External reference Off
Frequency limit high 20.5 GHz (595A) or 26.7 GHz (598A)
Frequency limit low 900 MHz
Header Off
Hold Off
Minimum pulse repetition frequency 2 kHz
Multiply frequency 01
Offset frequency 0 kHz
Offset power 0 dB
Output Frequency measurement data
Resolution 3 (1 kHz)
Sample rate 50 ms
Scientific Off
Separate Off
Special functions 00 (All Cleared)
SRQmask Off
Pulse Generator:
Gmode 0 (Off)
Gdelay 50 ns
Gwidth 1 μs
Gperiod 10 μs
Gincrement 1 μs
Gend 9 μs
Profile Off

5-15
5/PROGRAMMING
GPIB ADDRESS SELECTION
This counter employs a software selectable GPIB address which is stored in nonvolatile memory. To verify the GPIB address, enter Special Function 90: the counter displays the current GPIB address. Press the CLEAR DISPLAY key to exit Special Function 90 without changing the GPIB address. To change the GPIB address, enter Special Function 90 followed by the desired GPIB address. Since the GPIB address is stored in nonvolatile memory, the counter always defaults to the last GPIB address selected.
TALK ONLY MODES
The talk-only modes enable the counter to continuously output data to other devices on the bus, such as a printer, without the need of an instrument controller. To use the counter in talk-only mode, enter the GPIB address corresponding to the desired data-output format, as listed in Table 5-9. The receiver must be configured to the listen-only mode to allow data to be transferred across the bus.
NOTE
Address is composed of the binary value of the choices +32.
Table 5-9. GPIB Addresses for Talk-Only Mode
Scientific Separate Header Dynamic Address
off off off off 32
off off off on 33
off off on off 34
off off on on 35
off on off off 36
off on off on 37
off on on off 38
off on on on 39
on off off off 40
on off off on 41
on off on off 42
on off on on 43
on on off off 44
on on off on 45
on on on off 46
on on on on 47

5-16
Phase Matrix, Inc.TM
595A & 598A
DATA INPUT AND OUTPUT SPEEDINPUT SPEED
It takes a specific amount of time for the counter to process input data (error checking, formatting, changing the mode of operation, etc.). To prevent the data rate of the bus from slowing down while the counter is processing input data, the data is accepted as soon as it is available on the bus and is temporarily stored in a 256-character storage memory.
It is necessary to be aware of the difference between accepting data and complying with it. If the counter is asked to output a reading before it is finished processing the input data, the output does not reflect the newly entered data. To prevent this, sufficient programmed delays must be provided (see the sample program formats on page 5-7). Bit 7 in the status byte can be used to determine if the counter has completed the processing of the GPIB command messages. Refer to the section on the status byte.
OUTPUT SPEED
Several options have been provided in the GPIB interface for the user who wants to increase the output speed of the counter. Each of the following conditions increases the measurement cycle rate. The fastest measurement cycle time is achieved with all of the following conditions set:
• HEADER OFF: Outputs the numeric results without header or terminator (default).
• SCIENTIFIC OFF: Outputs fixed point results which are shorter than exponential notations (default).
• DYNAMIC ON: Suppresses leading blanks. Note: The controller has to have free field capability.
• SPECIAL 61: Disables the tracking feature, thus saving the time required for YIG and VCO corrections.
• SPECIAL 63: Disables sample rate control, thus deleting any delay between gates. (For counter in local mode.)
• SPECIAL 65: Disables the LED results display thus saving the time required for display, formatting and output.
• SAMPLERATE 0: Same as SPECIAL 63 for counter in remote mode.
READING MEASUREMENTS The Phase Matrix 595A/598A counters provide a choice of methods for taking readings. When the command HOLD is ON, the counter takes one reading then waits for a RESET command or a device trigger GPIB command. In this condition, the counter is sent a RESET command or a device trigger and (when addressed to talk) outputs a new reading to the bus. The counter holds that particular reading on the display until another RESET command or device trigger is received.
When the HOLD command is off, data is read out to the bus in the normal way. The display is automatically updated at the specified sample rate, and the counter outputs successive measurement readings without requiring a RESET command or device trigger each time.
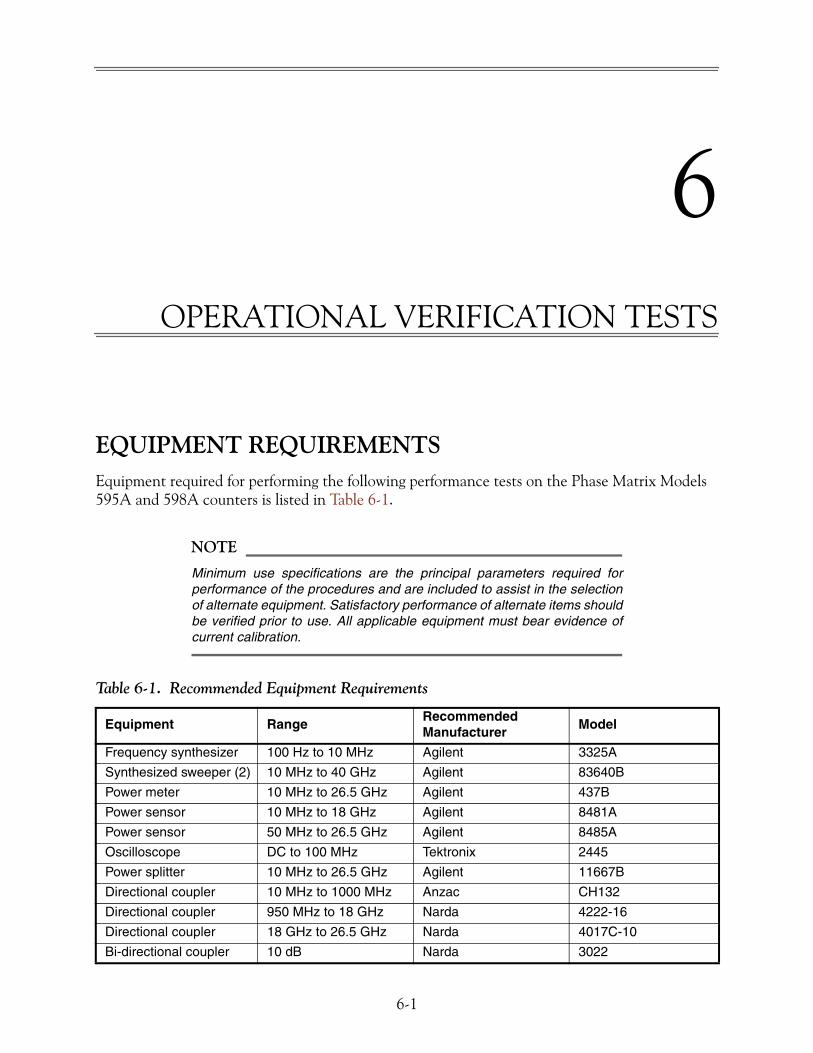
6-1
6
EQUIPMENT REQUIREMENTSEquipment required for performing the following performance tests on the Phase Matrix Models 595A and 598A counters is listed in Table 6-1.
NOTE
Minimum use specifications are the principal parameters required forperformance of the procedures and are included to assist in the selectionof alternate equipment. Satisfactory performance of alternate items shouldbe verified prior to use. All applicable equipment must bear evidence ofcurrent calibration.
Table 6-1. Recommended Equipment Requirements
Equipment RangeRecommended Manufacturer
Model
Frequency synthesizer 100 Hz to 10 MHz Agilent 3325A
Synthesized sweeper (2) 10 MHz to 40 GHz Agilent 83640B
Power meter 10 MHz to 26.5 GHz Agilent 437B
Power sensor 10 MHz to 18 GHz Agilent 8481A
Power sensor 50 MHz to 26.5 GHz Agilent 8485A
Oscilloscope DC to 100 MHz Tektronix 2445
Power splitter 10 MHz to 26.5 GHz Agilent 11667B
Directional coupler 10 MHz to 1000 MHz Anzac CH132
Directional coupler 950 MHz to 18 GHz Narda 4222-16
Directional coupler 18 GHz to 26.5 GHz Narda 4017C-10
Bi-directional coupler 10 dB Narda 3022
OPERATIONAL VERIFICATION TESTS

6-2
Phase Matrix, Inc.TM
595A & 598A
SPECIAL EQUIPMENT1. Because of the lack of adequate equipment for testing narrow pulses below 0.8 GHz, a special
0.25 to 1 GHz modulator must be fabricated to test the counter accurately in these ranges. In cases where full capability testing is not necessary, the instrument may be tested using substitute equipment. The pulsed modulator shown in Figure 6-1 can be used for testing Band 1 pulsed capabilities. If it is not necessary to test pulse widths of less than 100 ns, the pulse modulation capabilities of the Agilent 8340B are sufficient to test the counter. If another modulator is used, extreme care must be taken to prevent phase distortion of the pulse by the modulator.
Figure 6-1. Pulse Modulator
In Figure 6-1, all resistor values are in ohms, and the double balanced mixer is a Mini Circuits TFM-2.
Table 6-1. Recommended Equipment Requirements (continued)
Equipment RangeRecommended Manufacturer
Model
Pulse generator (2) 5 Hz to 50 MHz Wavetek 801
Pulse modulator 800 MHz to 2 GHz Agilent 8731B
Pulse modulator 2 GHz to 18 GHz Agilent 11720A
Pulse modulator 18 GHz to 26.5 GHz Narda S214DS
Low attenuation coaxial cable (3)
— Gore P2S01S01036.0
6 dB attenuator (2) DC to 1 GHz Texscan FP-50
3 dB attenuator (3) DC to 26.5 GHz Weinschel 9-3
Detector 10 MHz to 18 GHz Agilent 8473B
50 Ω termination — Pomona 4119-50
PULSE SIGNAL IN
IR
L
BNC
RF IN
300
18
300
62
240
62
300 300
18BNC
PULSE-MODULATEDSIGNAL OUTDOUBLE
BALANCEDMIXER

6-3
6/OPERATIONAL VERIFICATION TESTS
TEST PROCEDURES
NOTE
Review the entire procedure before starting the verification testingprocess. Verify that the line voltage selector is properly set for the intendedsingle-phase line voltage. Connect the instrument to local line voltagebefore starting any test.
BAND 0 RANGE/SENSITIVITY TESTS (CW ONLY)
DESCRIPTION
This test verifies counter operation from 100 Hz to 250 MHz at –20 dBm (0.063 V p-p into 50 Ω) and +7 dBm (1.42 V p-p into 50Ω). The oscilloscope is used to set up signal levels below 10 MHz and the power meter is used to set signal levels at 10 MHz and above. Test setup 1 tests the counter from 100 Hz to 10 MHz, and test setup 2 tests the counter from 10 MHz to 250 MHz.
EQUIPMENT REQUIRED
• Frequency synthesizer (Agilent 3325A)
• Synthesized sweeper (Agilent 83640B)
• Power meter (Agilent 437B)
• Power sensor (Agilent 8481A)
• Power splitter (Agilent 11687B)
• Oscilloscope (Tektronix 2445)
• 50 Ω termination (Pomona 4119-50)
PROCEDURE (100 HZ TO 10 MHZ)
1. Connect equipment as shown in Figure 6-2.
Figure 6-2. Band 0 Range and Sensitivity Test Setup 1 (100 Hz to 10 MHz)
2. Set the 595A/598A counter to Band 0, and select resolution 2.
3. Set the output frequency from the synthesizer to 100 Hz.
595A /598A ICOUNTER
50IOHM
TERMINATION
OSCILLOSCOPE
FREQUENCY
SYNTHESIZER10IMHz
IN
10IMHz
OUT
BANDI0
INPUT
CH1

6-4
Phase Matrix, Inc.TM
595A & 598A
4. Using the oscilloscope, set the output-signal level from the synthesizer to –20 dBm (0.063 V p-p into 50 Ω).
5. Apply the 100 Hz signal to the 595A/598A counter and verify the reading.
6. Repeat steps 3, 4, and 5 at 1 kHz, 10 kHz, 100 kHz, 1 MHz, and 10 MHz.
7. Repeat steps 3 through 6 at an input power of +7 dBm (1.42 V p-p into 50Ω).
PROCEDURE (100 MHZ TO 250 MHZ)
1. Connect the equipment as shown in Figure 6-3.
Figure 6-3. Band 0 Range and Sensitivity Test Setup 2 (100 MHz to 250 MHz)
1. Set the 595A/598A counter to Band 0, and select resolution 3.
2. Set the synthesizer to 100 MHz.
3. Using the power meter, set the output-signal level from the synthesizer to –20 dBm.
4. Apply the 100 MHz signal to the 595A/598A counter, and verify the reading.
5. Repeat steps 2, 3, and 4 at 200 MHz and 250 MHz.
6. Repeat steps 2 through 5 at an input power of +7 dBm.
BAND 1 RANGE/SENSITIVITY TESTS
DESCRIPTION
This test verifies counter operation from 250 MHz to 1 GHz at –20 dBm and +7 dBm for CW signals.
EQUIPMENT REQUIRED
• Synthesized sweeper (Agilent 83640B)
• Power meter (Agilent 437B)
• Power sensor (Agilent 8481A)
• Power splitter (Agilent 11667B)
595A/598AICOUNTER
POWERIMETER
POWER
SENSOR
SYNTHESIZEDISWEEPER

6-5
6/OPERATIONAL VERIFICATION TESTS
PROCEDURE
1. Connect the equipment as shown in Figure 6-4.
Figure 6-4. Band 1 Range and Sensitivity Test Setup
1. Set the 595A/598A counter to Band 1, and select resolution 3.
2. Set the synthesizer to 250 MHz.
3. Using the power meter, set the output-signal level from the synthesizer to –20 dBm.
4. Apply the 250 MHz signal to the 595A/598A counter, and verify the reading.
5. Repeat steps 2, 3, and 4 at 300 MHz, 400 MHz, 500 MHz, 600 MHz, 700 MHz, 800 MHz, 900 MHz, and 1 GHz.
6. Repeat steps 2 through 5 at an input power of +7 dBm.
BAND 2 RANGE/SENSITIVITY TESTS
DESCRIPTION
This test verifies counter operation from 950 MHz to 20 GHz (and from 20 GHz to 26.5 GHz for the 598A) for CW signals at +7 dBm and at the following power levels:
950 MHz to 2 GHz, –20 dBm2 GHz to 12.4 GHz, –25 dBm12.4 GHz to 20 GHz, –20 dBm20 GHz to 26.5 GHz, –15 dBm
EQUIPMENT REQUIRED
• Synthesized sweeper (Agilent 83640B)
• Power meter (Agilent 437B)
• Power sensor (Agilent 8485A)
• Power splitter (Agilent 11667B)
595A/598A COUNTER
POWER METER
POWER
SENSOR
SYNTHESIZED SWEEPER
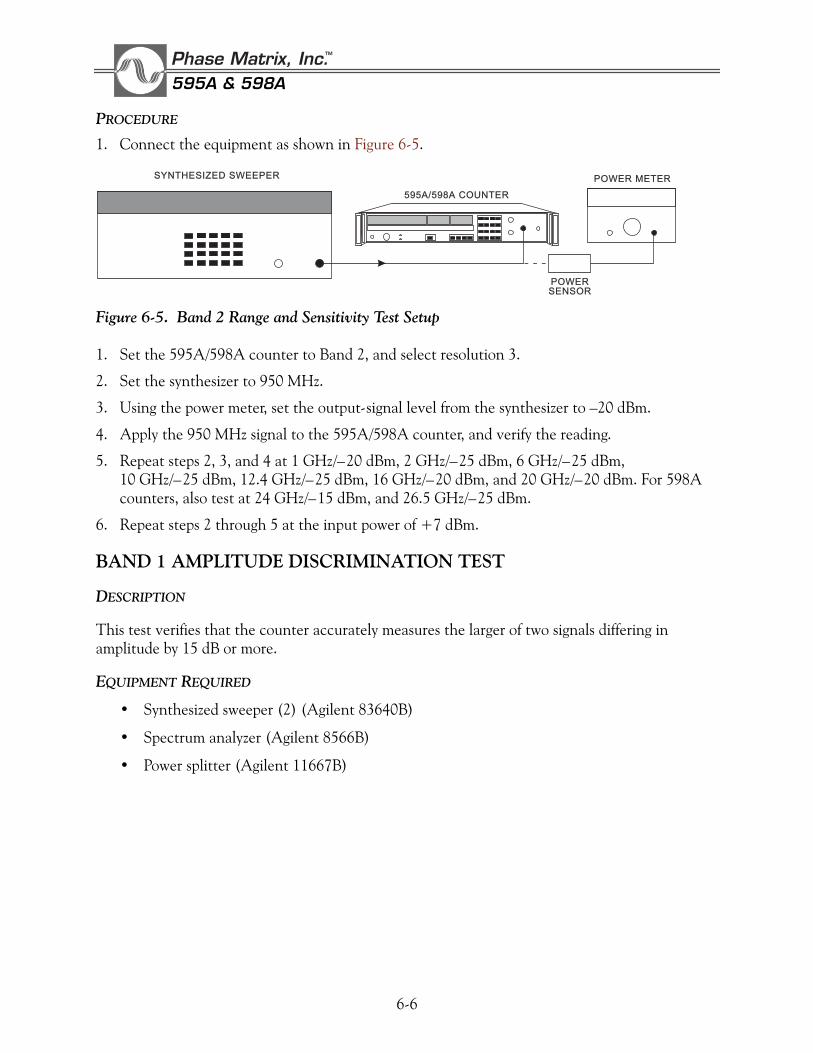
6-6
Phase Matrix, Inc.TM
595A & 598A
PROCEDURE
1. Connect the equipment as shown in Figure 6-5.
Figure 6-5. Band 2 Range and Sensitivity Test Setup
1. Set the 595A/598A counter to Band 2, and select resolution 3.
2. Set the synthesizer to 950 MHz.
3. Using the power meter, set the output-signal level from the synthesizer to –20 dBm.
4. Apply the 950 MHz signal to the 595A/598A counter, and verify the reading.
5. Repeat steps 2, 3, and 4 at 1 GHz/–20 dBm, 2 GHz/–25 dBm, 6 GHz/–25 dBm, 10 GHz/–25 dBm, 12.4 GHz/–25 dBm, 16 GHz/–20 dBm, and 20 GHz/–20 dBm. For 598A counters, also test at 24 GHz/–15 dBm, and 26.5 GHz/–25 dBm.
6. Repeat steps 2 through 5 at the input power of +7 dBm.
BAND 1 AMPLITUDE DISCRIMINATION TEST
DESCRIPTION
This test verifies that the counter accurately measures the larger of two signals differing in amplitude by 15 dB or more.
EQUIPMENT REQUIRED
• Synthesized sweeper (2) (Agilent 83640B)
• Spectrum analyzer (Agilent 8566B)
• Power splitter (Agilent 11667B)
595A/598A COUNTER
POWERIMETER
POWER
SENSOR
SYNTHESIZEDISWEEPER

6-7
6/OPERATIONAL VERIFICATION TESTS
PROCEDURE
1. Connect the equipment as shown in Figure 6-6.
Figure 6-6. Band 1 Amplitude Discrimination Test Setup
2. Set synthesized sweeper 1 to 300 MHz at 0 dBm, and set synthesized sweeper 2 to 400 MHz at –15 dBm.
3. Verify that the 595A/598A counter correctly measures the frequency of the high-power signal source.
4. Repeat steps 2 and 3 at 600 MHz/700 MHz and at 900 MHz/1 GHz.
BAND 2 AMPLITUDE DISCRIMINATION TEST
DESCRIPTION
This test verifies that the counter accurately measures the larger of two signals differing in amplitude by 15 dB or more.
EQUIPMENT REQUIRED
• Synthesized sweeper (2) (Agilent 83640B)
• Spectrum analyzer (Agilent 8566B)
• Power splitter (Agilent 11667B)
POWER
SPLITTER
(COMBINER)
595A/598AICOUNTER
SYNTHESIZEDISWEEPER 1
BAND 1
INPUT
HPI11667B
SYNTHESIZEDISWEEPER 2RFIIN
SPECTRUMIANALYZER
RFIOUT
RF OUT

6-8
Phase Matrix, Inc.TM
595A & 598A
PROCEDURE
1. Connect the equipment as shown in Figure 6-7.
Figure 6-7. Band 2 Amplitude Discrimination Test Setup
1. Set synthesized sweeper 1 to 3 GHz at 0 dBm, and set synthesized sweeper 2 to 3.1 GHz at –15 dBm.
2. Verify that the 595A/598A counter correctly measures the frequency of the high-power signal source.
3. Repeat steps 1 and 2 at 6 GHz/6.1 GHz, at 12 GHz/12.1 GHz, and at 18 GHz/18.1 GHz.
BAND 1 GATE ERROR TEST
DESCRIPTION
This test verifies that the gate error in Band 1 is within the limits defined by the equation:
The measurement is performed with a CW input signal and an inhibit signal.
GE = (±0.07) / (GW)
where
GE is the gate error in Hz
GW (in seconds) is the logical AND of inhibit and pulse width minus 30 ns.
POWERSPLITTER
(COMBINER)
595A/598A COUNTER
SYNTHESIZED SWEEPER 1
BAND 2INPUT
HP 11667B
SYNTHESIZED SWEEPER 2RF IN
SPECTRUM ANALYZER
RF OUT
RF OUT

6-9
6/OPERATIONAL VERIFICATION TESTS
EQUIPMENT REQUIRED
• Synthesized sweeper (Agilent 83640B)
• Pulse generator (Wavetek 801)
• Oscilloscope (Tektronix 2445)
PROCEDURE
1. Connect the equipment as shown in Figure 6-8 and turn the equipment on.
Figure 6-8. Band 1 Gate Error Test Setup
1. Set the pulse generator to provide a 0 to +4 volt pulse, 1 MHz PRF, and a 50 ns pulse width.
2. Set the 595A/598A counter to Band 1, and set resolution to 1.
3. Set the synthesized sweeper frequency to 250 MHz, and set the power to 0 dBm. The CW reading on the counter display should be equal to the input frequency ±10 Hz.
4. Connect the pulse generator output to the Inhibit input of the counter. Connect the gate output from the counter to the oscilloscope. Adjust the inhibit pulse width until the average gate width is 20 ns. Verify that the reading on the counter display is 250 MHz ±3.5 MHz.
5. Repeat steps 3 and 4 with 100 ns and 1μs gate widths while keeping the duty cycle (the ratio of pulse width to pulse period) constant. For 100 ns gate, the reading should be ±700 KHz. For 1μs gate, the reading should be ±70 KHz.
6. Repeat the measurements at 650 MHz and 1 GHz.
595A/598A COUNTER
SYNTHESIZED SWEEPER
BAND 1INPUT
RF OUT
10 MHz OUT
OSCILLOSCOPE
PULSE GENERATOR
OUTPUT
INHIBIT INPUT
GATE OUT

6-10
Phase Matrix, Inc.TM
595A & 598A
BAND 2 GATE ERROR TEST
DESCRIPTION
This test verifies that the gate error in Band 2 is within the limits defined by the equation:
The measurement is performed with a CW input signal and an inhibit signal.
EQUIPMENT REQUIRED
• Synthesized sweeper (Agilent 83640B)
• Pulse generator (Wavetek 801)
• Oscilloscope (Tektronix 2445)
• Low attenuation coaxial cable (Gore P2S01S01036.0)
PROCEDURE
1. Connect the equipment as shown in Figure 6-9 and turn equipment on.
Figure 6-9. Band 2 Gate Error Test Setup
2. Set the pulse generator to provide a 0 to +4 V pulse, 1 MHz PRF, and 50 ns pulse width.
GE = (±0.01) / (GW)
where
GE is the gate error in Hz
GW (in seconds) is the logical AND of inhibit and pulse width minus 30 ns.
595A/598A COUNTER
SYNTHESIZED SWEEPER
BAND 2
INPUT
RF OUT
10 MHz OUT
OSCILLOSCOPE
PULSE GENERATOR
OUTPUT
INHIBIT INPUT
GATE OUT
LOW ATTENUATION COAXIAL CABLE

6-11
6/OPERATIONAL VERIFICATION TESTS
3. Set the 595A/598A counter to Band 2, and set resolution to 1.
4. Set the synthesized sweeper frequency to 3 GHz, and set the power to 0 dB. The CW reading on the counter display should be equal to the input frequency ±10 Hz.
5. Connect the pulse generator output to the Inhibit input of the counter. Connect the gate output from the counter to the oscilloscope. Adjust the inhibit pulse width until the average gate width is 20 ns. Verify that the reading on the counter display is within ±500 KHz.
6. Repeat steps 4 and 5 with 100 ns and 1 μs gate width while keeping the duty cycle (the ratio of pulse width to pulse period) constant. For 100 ns gate, the reading should be ±100 KHz. For 1μs gate, the reading should be ±10 KHz.
7. Repeat the measurements every 3 GHz up to 20 GHz (26.5 GHz for the 598A counter).
BAND 1 DISTORTION ERROR TEST
DESCRIPTION
This test verifies that the distortion error in Band 1 is within the limits defined by the equation:
The measurement is performed by counting the frequency of a pulsed signal and subtracting the gate error from the result.
NOTE
Gate error must be known (see gate error test in this section) beforeperforming this test.
EQUIPMENT REQUIRED
• Synthesized sweeper (Agilent 83640B)
• Pulse generator (Wavetek 801)
• Pulse modulator (250 MHz to 1 GHz) (see “Special Equipment” page 6-2)
• Oscilloscope (Tektronix 2445)
• 6 dB attenuator (DC to 1 GHz) (Texscan FP-50)
• Detector (Agilent 8473B)
DE = (+0.03) / (PW–3x10⁻⁸)
where
DE is the distortion error in Hz
PW is the pulse width in seconds.
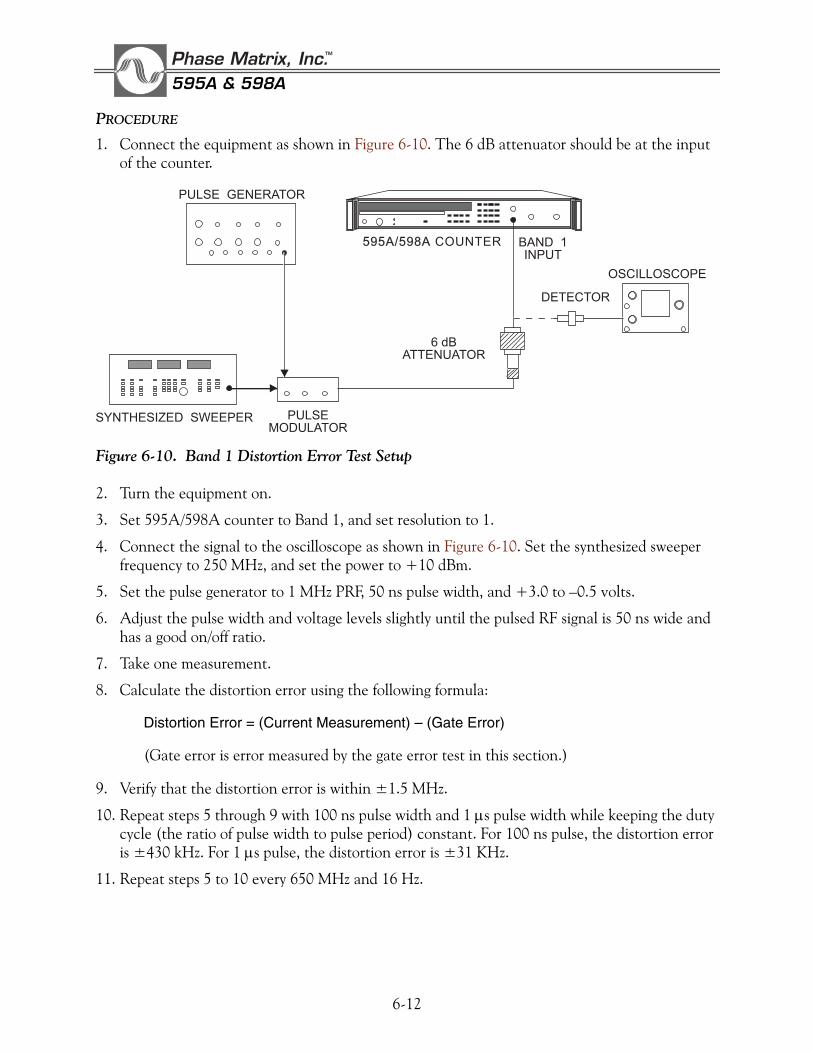
6-12
Phase Matrix, Inc.TM
595A & 598A
PROCEDURE
1. Connect the equipment as shown in Figure 6-10. The 6 dB attenuator should be at the input of the counter.
Figure 6-10. Band 1 Distortion Error Test Setup
2. Turn the equipment on.
3. Set 595A/598A counter to Band 1, and set resolution to 1.
4. Connect the signal to the oscilloscope as shown in Figure 6-10. Set the synthesized sweeper frequency to 250 MHz, and set the power to +10 dBm.
5. Set the pulse generator to 1 MHz PRF, 50 ns pulse width, and +3.0 to –0.5 volts.
6. Adjust the pulse width and voltage levels slightly until the pulsed RF signal is 50 ns wide and has a good on/off ratio.
7. Take one measurement.
8. Calculate the distortion error using the following formula:
Distortion Error = (Current Measurement) – (Gate Error)
(Gate error is error measured by the gate error test in this section.)
9. Verify that the distortion error is within ±1.5 MHz.
10. Repeat steps 5 through 9 with 100 ns pulse width and 1 μs pulse width while keeping the duty cycle (the ratio of pulse width to pulse period) constant. For 100 ns pulse, the distortion error is ±430 kHz. For 1 μs pulse, the distortion error is ±31 KHz.
11. Repeat steps 5 to 10 every 650 MHz and 16 Hz.
595A/598A COUNTER
SYNTHESIZED SWEEPER
BAND 1
INPUT
OSCILLOSCOPE
PULSE GENERATOR
PULSE
MODULATOR
DETECTOR
6 dB
ATTENUATOR

6-13
6/OPERATIONAL VERIFICATION TESTS
BAND 2 DISTORTION ERROR TEST
DESCRIPTION
This test verifies that the distortion error in Band 2 is within the limits defined by the equation:
The measurement is performed by counting the frequency of a pulsed signal and subtracting the gate error from the result.
EQUIPMENT REQUIRED
• Synthesized sweeper (Agilent 83640B)
• Pulse modulator (Agilent 11720A)
• Pulse generator (Wavetek 801)
• Oscilloscope (Tektronix 2445)
• 3 dB attenuators (3) (Weinschel 9-3)
• Low attenuation coaxial cable (Gore P2S01S01036.0)
• Detector (Agilent 8473B)
PROCEDURE
1. Connect the equipment as shown in Figure 6-11. The 3 dB attenuators should be at the IN and OUT ports of the pulse modulator and at the input to the counter. Turn the equipment on.
Figure 6-11. Band 2 Distortion Error Test Setup
DE = (±0.03) / (PW –3 x 10⁻⁸)
where
DE is the distortion error in Hz, and
PW is the pulse width in seconds.
595A/598A COUNTER
SYNTHESIZED SWEEPER
BAND 2INPUT
OSCILLOSCOPE
PULSE GENERATOR
DETECTOR
3 dBATTENUATOR
3 dBATTENUATOR
3 dBATTENUATOR
LOW ATTENUATIONCOAXIAL CABLE

6-14
Phase Matrix, Inc.TM
595A & 598A
2. Set the 595A/598A counter to Band 2, and set resolution to 1.
3. Connect the signal through to the oscilloscope as shown (the detector must be terminated in a low-impedance device, such as a 50 Ω feedthrough, to detect narrow pulses adequately). Set the synthesized sweeper frequency to 2 GHz, and set the power to +10 dBm.
4. Set the pulse generator to 1 MHz PRF, 50 ns pulse width, and +3.0 to –0.5 volts.
5. Adjust the pulse width and the voltage levels slightly until the pulsed RF signal is 50 ns wide and has a good on/off ratio.
6. Take one measurement.
7. Calculate:
Distortion Error = (Current Measurement) – (Gate Error)
(Gate error is the error measured by the gate error test in this section.)
8. Verify that the distortion error is within ±1.5 MHz.
9. Repeat steps 4 through 8 with 100 ns pulse width and 1 μs pulse width while keeping the duty cycle (the ratio of pulse width to pulse period) constant. For 100 ns pulse, the distortion error is ±430 kHz. For 1 μs pulse, the distortion error is 31 KHz.
10. Repeat steps 5 through 9 every 3 GHz up to 20 GHz (26.5 GHz for the 598A counter).
BAND 1 AVERAGING ERROR TEST
DESCRIPTION
This test verifies that the averaging error in Band 1 is within the limits defined by the equation:
where
AE is the RMS averaging error in Hz,
RES is the specified instrument resolution in Hz (this is true up to 1 MHz resolution; above 1 MHz resolution, RES is 1 MHz),
GW in seconds, is the logical AND of inhibit and pulse width minus 3 x 10⁻⁸ seconds (for this test, gate width is set to 20 ns), and
AVG is the number of specified count average.
AE = (2) RES / (GW)(AVG)[±
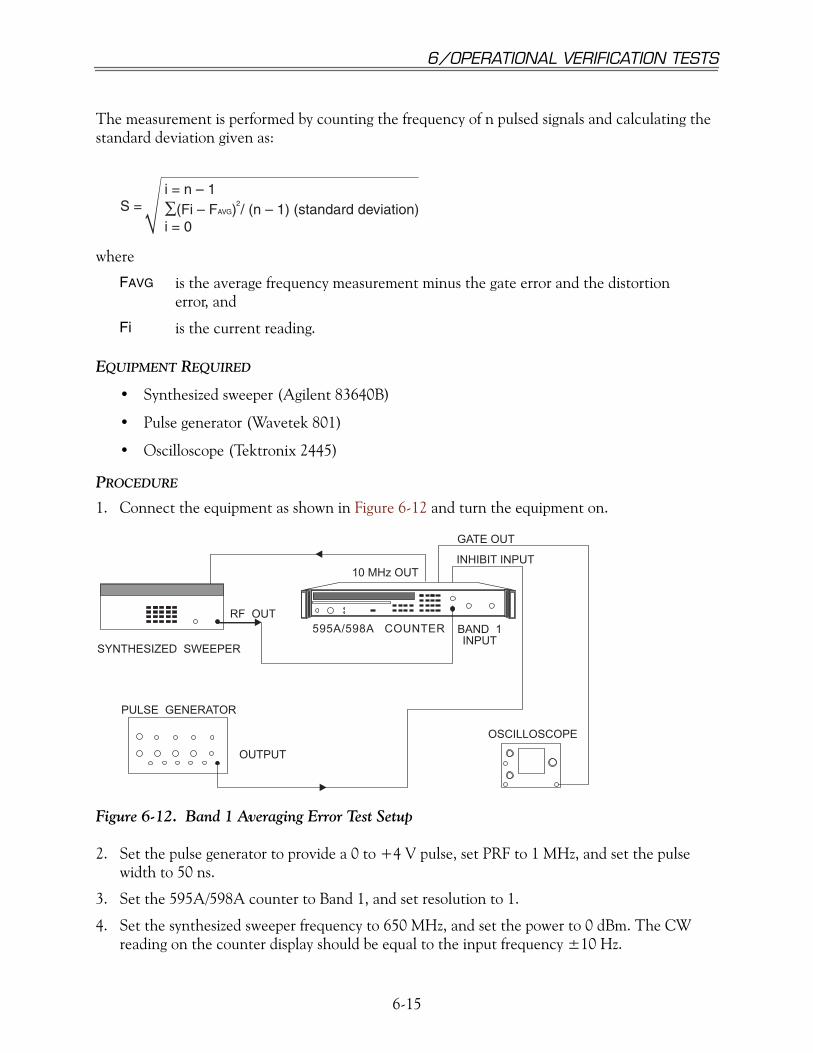
6-15
6/OPERATIONAL VERIFICATION TESTS
The measurement is performed by counting the frequency of n pulsed signals and calculating the standard deviation given as:
EQUIPMENT REQUIRED
• Synthesized sweeper (Agilent 83640B)
• Pulse generator (Wavetek 801)
• Oscilloscope (Tektronix 2445)
PROCEDURE
1. Connect the equipment as shown in Figure 6-12 and turn the equipment on.
Figure 6-12. Band 1 Averaging Error Test Setup
2. Set the pulse generator to provide a 0 to +4 V pulse, set PRF to 1 MHz, and set the pulse width to 50 ns.
3. Set the 595A/598A counter to Band 1, and set resolution to 1.
4. Set the synthesized sweeper frequency to 650 MHz, and set the power to 0 dBm. The CW reading on the counter display should be equal to the input frequency ±10 Hz.
where
FAVG is the average frequency measurement minus the gate error and the distortion error, and
Fi is the current reading.
i = n – 1∑(Fi – FAVG) / (n – 1) (standard deviation)i = 0
2S =
595A/598A COUNTER
SYNTHESIZED SWEEPER
BAND 1INPUT
RF OUT
10 MHz OUT
OSCILLOSCOPE
PULSE GENERATOR
OUTPUT
INHIBIT INPUT
GATE OUT

6-16
Phase Matrix, Inc.TM
595A & 598A
5. Adjust the inhibit pulse width until the average gate width is 20 ns.
6. Take one frequency measurement. This reading is FAVG.
7. Set resolution to 3. Set the SAMPLE RATE knob on the front panel to HOLD.
8. Take 10 measurements by pressing the TRIG key 10 times.
9. Calculate:
10. Verify that S < 450 KHz.
BAND 2 AVERAGING ERROR TEST
DESCRIPTION
This test verifies that the averaging error in Band 2 is within the limits defined by the equation:
The measurement is performed by counting the frequency of n pulsed signals and calculating the standard deviation given as:
where
AE is the RMS averaging error in Hz,
RES is the specified instrument resolution in Hz (this is true up to 1 MHz resolution; above 1 MHz resolution, RES is 1 MHz),
GW (in seconds) is the logical AND of inhibit and pulse width minus 3 x 10⁻⁸ seconds, and
AVG is the number of specified count average.
where
FAVG is the average frequency measurement minus the gate error and the distortion error, and
Fi is the current reading.
i = n – 1∑(Fi – FAVG) / (n)i = 0
2S=
AE = RES / (GW)(AVG)[±
i = n – 1∑(Fi – FAVG) / (n – 1)i = 0
2S=

6-17
6/OPERATIONAL VERIFICATION TESTS
EQUIPMENT REQUIRED
• Synthesized sweeper (Agilent 83640B)
• Pulse generator (Wavetek 801)
• Oscilloscope (Tektronix 2445)
• Low attenuation coaxial cable (Gore P2S01S01036.0)
PROCEDURE
1. Connect the equipment as shown in Figure 6-13, and turn the equipment on.
Figure 6-13. Band 2 Averaging Error Test Setup
2. Set the pulse generator to provide a 0 to + 4 V pulse, 1 MHz PRF, and 50 ns pulse width.
3. Set the 595A/598A counter to Band 2, set resolution to 1, and set averages to 99.
4. Set the synthesized sweeper frequency to 3 GHz, and set the power to 0 dBm. The CW reading on the counter display should be equal to the input frequency ±10 Hz.
5. Adjust the inhibit pulse width until the average gate width is 20 ns.
6. Take one frequency measurement. This reading is FAVG.
7. Turn averaging off. Set the SAMPLE RATE knob to HOLD.
8. Take 10 measurements by pushing the TRIG function key 10 times.
9. Calculate:
10. Verify that S < 220 KHz.
595A/598AICOUNTER
SYNTHESIZED SWEEPER
BAND 2
INPUT
RF OUT
10 MHz OUT
OSCILLOSCOPE
PULSE GENERATOR
OUTPUT
INHIBIT INPUT
GATE OUT
LOW-ATTENUATION COAXIAL CABLE
i = n – 1∑(Fi – FAVG) / (n – 1)i = 0
2S=
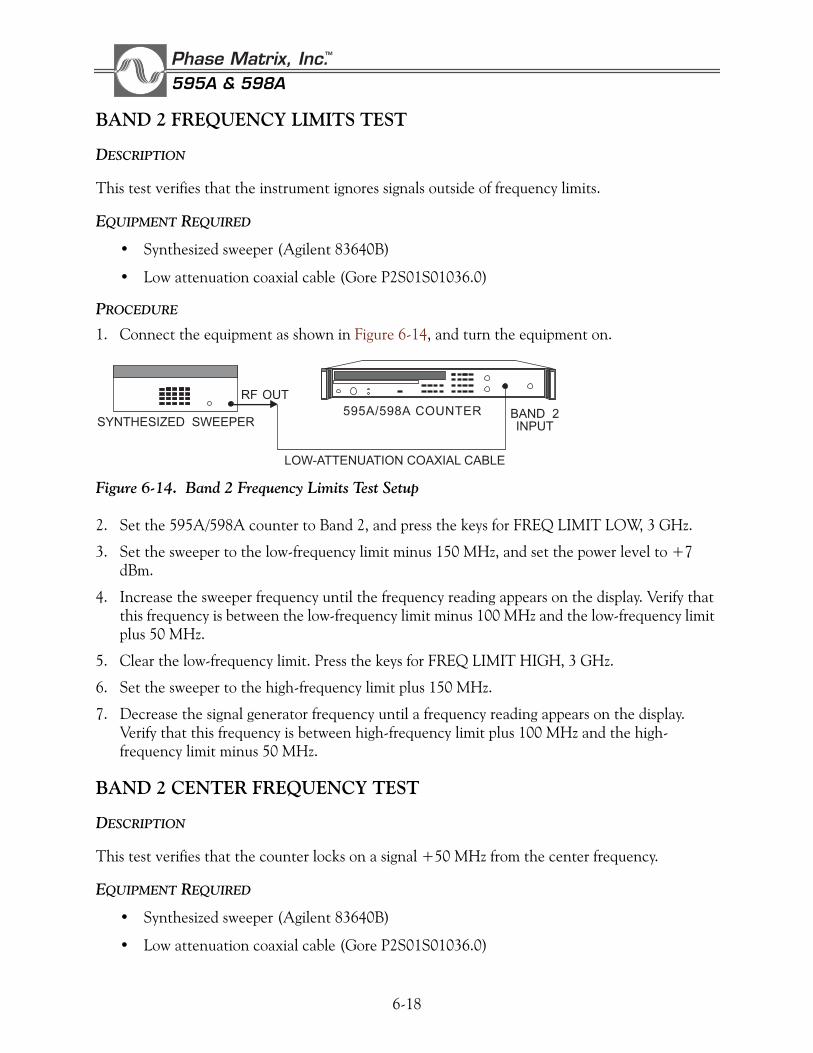
6-18
Phase Matrix, Inc.TM
595A & 598A
BAND 2 FREQUENCY LIMITS TEST
DESCRIPTION
This test verifies that the instrument ignores signals outside of frequency limits.
EQUIPMENT REQUIRED
• Synthesized sweeper (Agilent 83640B)
• Low attenuation coaxial cable (Gore P2S01S01036.0)
PROCEDURE
1. Connect the equipment as shown in Figure 6-14, and turn the equipment on.
Figure 6-14. Band 2 Frequency Limits Test Setup
2. Set the 595A/598A counter to Band 2, and press the keys for FREQ LIMIT LOW, 3 GHz.
3. Set the sweeper to the low-frequency limit minus 150 MHz, and set the power level to +7 dBm.
4. Increase the sweeper frequency until the frequency reading appears on the display. Verify that this frequency is between the low-frequency limit minus 100 MHz and the low-frequency limit plus 50 MHz.
5. Clear the low-frequency limit. Press the keys for FREQ LIMIT HIGH, 3 GHz.
6. Set the sweeper to the high-frequency limit plus 150 MHz.
7. Decrease the signal generator frequency until a frequency reading appears on the display. Verify that this frequency is between high-frequency limit plus 100 MHz and the high-frequency limit minus 50 MHz.
BAND 2 CENTER FREQUENCY TEST
DESCRIPTION
This test verifies that the counter locks on a signal +50 MHz from the center frequency.
EQUIPMENT REQUIRED
• Synthesized sweeper (Agilent 83640B)
• Low attenuation coaxial cable (Gore P2S01S01036.0)
595A/598AICOUNTERSYNTHESIZED SWEEPER
BAND 2
INPUT
OUTRF
LOW-ATTENUATION COAXIAL CABLE

6-19
6/OPERATIONAL VERIFICATION TESTS
PROCEDURE
1. Connect the equipment as shown in Figure 6-15, and turn the equipment on.
Figure 6-15. Band 2 Center Frequency Test Setup
2. Set the 595A/598A counter to Band 2, and press the keys for CENTER FREQUENCY 3 GHz.
3. Set the sweeper to the center frequency minus 50 MHz. Set the power level to the sensitivity level. Verify that the reading on the counter display is accurate.
4. Set the sweeper to the center frequency plus 50 MHz. Verify that the reading on the counter display is accurate.
BAND 1 MAXIMUM VIDEO
DESCRIPTION
This test verifies that frequency measurement accuracy is maintained in the presence of a video signal in excess of 20 dB below the RF signal.
EQUIPMENT REQUIRED
• Synthesized sweeper (Agilent 83640B)
• Bi-directional coupler (Narda 3022)
• Pulse generators (2) (Wavetek 801)
• 6 dB attenuator (Texscan FP-50)
595A/598AICOUNTER
SYNTHESIZED SWEEPERBAND 2
INPUT
OUTRF
LOW-ATTENUATION COAXIAL CABLE

6-20
Phase Matrix, Inc.TM
595A & 598A
PROCEDURE
1. Connect the equipment as shown in Figure 6-16, and turn the equipment on.
Figure 6-16. Band 1 Maximum Video Test Setup
2. Set pulse generator 1 to provide a 0 to +4 V pulse, 1 MHz PRF, and 50 ns pulse width. This signal is applied to the INHIBIT IN connector on the rear panel of the counter.
3. Synchronize pulse generator 2 to pulse generator 1. Set the pulse amplitude to 0 to 1 volt. Set the time delay and pulse width so that the pulses of both pulse generators overlap. Disable the output of pulse generator 2. This signal is applied to the coupled port of the bi-directional coupler.
4. Set the 595A/598A counter to Band 1, and set resolution to 1.
5. Set the sweeper frequency to 300 MHz and the power to +10 dBm at the input to Band 1. Since the CW signal is inhibited, the reading on the counter display includes some gate error and some averaging error.
6. Enable pulse generator 2. Verify that there is no change (besides that caused by averaging error) in the frequency reading.
7. Reverse the polarity of both pulse generators and repeat step 6.
595A/598A COUNTER
SYNTHESIZED SWEEPER
BAND 1
INPUT
PULSE GENERATOR 2 PULSE GENERATOR 1
6 dB
ATTENUATOR
BIDIRECTIONAL
COUPLER
PULSE OUT
SYNC
IN
INHIBIT IN

6-21
6/OPERATIONAL VERIFICATION TESTS
BAND 2 MAXIMUM VIDEO
DESCRIPTION
This test verifies that frequency measurement accuracy is maintained in the presence of a video signal in excess of 20 dB below the RF signal.
EQUIPMENT REQUIRED
• Synthesized sweeper (Agilent 83640B)
• Bi-directional coupler (Narda 3022)
• Pulse generators (2) (Wavetek 801)
• 6 dB attenuator (Texscan FP-50)
• Low attenuation coaxial cable (Gore P2S01S01036.0)
PROCEDURE
1. Connect the equipment as shown in Figure 6-17, and turn the equipment on.
Figure 6-17. Band 2 Maximum Video Test Setup
2. Set the pulse generator 1 to provide a 0 to +4 V pulse, 1 MHz PRF, and 50 ns pulse width. This signal is applied to the INHIBIT IN connector on the rear panel of the counter.
3. Synchronize pulse generator 2 to pulse generator 1. Set the pulse amplitude to 0 to 1 volt. Set the time delay and the pulse width so that the pulses of both pulse generators overlap. Disable the output of pulse generator 2. This signal is applied to the coupled port of bi-directional coupler.
4. Set the 595A/598A counter to Band 2, and set resolution to 1.
595A/598A COUNTER
SYNTHESIZED SWEEPER
BAND 2
INPUT
PULSE GENERATOR 2 PULSE GENERATOR 1
6 dB
ATTENUATOR
LOW ATTENUATION
COAXIAL CABLE LOW ATTENUATION
COAXIAL CABLE
BIDIRECTIONAL
COUPLER
PULSE OUT
SYNC
IN
INHIBIT IN

6-22
Phase Matrix, Inc.TM
595A & 598A
5. Set the sweeper frequency to 3 GHz and the power to +10 dBm at the input to Band 2. Since the CW signal is inhibited, the reading on the counter display includes some gate error and some averaging error.
6. Enable pulse generator 2. Verify that there is no change (besides that caused by averaging error) in the frequency reading.
7. Reverse the polarity of both pulse generators and repeat step 6.
PULSE WIDTH ACCURACY TEST
DESCRIPTION
This test verifies that the pulse width accuracy is within ±30 ns + (Timebase Error x PW).
EQUIPMENT REQUIRED
• Synthesized sweeper (Agilent 83640B)
• Pulse modulator (Agilent 11720A)
• Pulse generator (Wavetek 801)
• Oscilloscope (Tektronix 2445)
• 3 dB attenuator (up to 26.5 GHz) (3) (Weinschel 9-3)
• Low attenuation coaxial cable (Gore P2S01S01036.0)
• Detector (Agilent 8473B)
PROCEDURE
1. Connect the equipment as shown in Figure 6-18. The 3 dB attenuators should be at the IN and OUT ports of the pulse modulator and the input to the counter. Turn the equipment on.
Figure 6-18. Pulse Width Accuracy Test Setup
595A/598A COUNTER
SYNTHESIZED SWEEPER
BAND 2
INPUT
OSCILLOSCOPE
PULSE GENERATOR
PULSE
MODULATOR
DETECTOR
3 dB
ATTENUATOR
3 dB
ATTENUATOR
3 dB
ATTENUATOR
LOW ATTENUATION
COAXIAL CABLE

6-23
6/OPERATIONAL VERIFICATION TESTS
2. Set the 595A/598A counter to Band 2, and set resolution to 1.
3. Connect the signal through the detector to the oscilloscope as shown. The detector must be terminated in a low-impedance device, such as a 50 Ω feedthrough, to detect narrow pulses adequately. Set the sweeper frequency to 2 GHz, and set the power to +10 dBm.
4. Set the pulse generator to 1 MHz PRF, 50 ns pulse width, and +3.0 to -0.5 volts.
5. Connect the signal to the counter, and turn pulse width on. Verify that the pulse width is 0.05 μs ±0.02 μs.
PULSE PERIOD ACCURACY TEST
DESCRIPTION
This test verifies that the pulse period accuracy is within ±20 ns.
EQUIPMENT REQUIRED
• Synthesized sweeper (Agilent 83640B)
• Pulse modulator (Agilent 11720A)
• Pulse generator (Wavetek 801)
• Oscilloscope (Tektronix 2445)
• 3 dB attenuators (up to 26.5 GHz) (3) (Weinschel 9-3)
• Low attenuation coaxial cable (Gore P2S01S01036.0)
• Detector (Agilent 8473B)
PROCEDURE
1. Connect the equipment as shown in Figure 6-19. The 3 dB attenuators should be at the IN and OUT ports of the pulse modulator and the input to the counter. Turn the equipment on.
Figure 6-19. Pulse Period Accuracy Test Setup
595A/598A COUNTER
SYNTHESIZED SWEEPER
BAND 2
INPUT
OSCILLOSCOPE
PULSE GENERATOR
PULSE
MODULATOR
DETECTOR
3 dB
ATTENUATOR
3 dB
ATTENUATOR
3 dB
ATTENUATOR
LOW ATTENUATION
COAXIAL CABLE

6-24
Phase Matrix, Inc.TM
595A & 598A
2. Set the 595A/598A counter to Band 2, and set resolution to 1.
3. Connect the signal through the detector to the oscilloscope as shown. The detector must be terminated in a low-impedance device, such as a 50 Ω feedthrough, to detect narrow pulses adequately. Set the sweeper frequency to 2 GHz and the power to +10 dBm.
4. Set the pulse generator to 1 MHz PRF, 50 ns pulse width, and +3.0 to -0.5 volts.
Connect the signal to the counter, and turn pulse period on. Verify that the pulse period is 1 ms ±0.02 ms.