modelling trade-offs in students' choice set when
TRANSCRIPT
University of WollongongResearch Online
Faculty of Business - Papers Faculty of Business
2019
Modelling trade-offs in students' choice set whendetermining universitiesAndriani KusumawatiUniversity of Brawijaya, [email protected]
Nelson PereraUniversity of Wollongong, [email protected]
Venkata K. YanamandramUniversity of Wollongong, [email protected]
Research Online is the open access institutional repository for the University of Wollongong. For further information contact the UOW Library:[email protected]
Publication DetailsKusumawati, A., Perera, N. & Yanamandram, V. (2019). Modelling trade-offs in students' choice set when determining universities.International Journal of Educational Management, 33 (5), 979-989.
Modelling trade-offs in students' choice set when determining universities
AbstractPurpose - The purpose of this paper is to identify the factors influencing Indonesian students' choice ofuniversity by estimating the trade-off students make in selecting a university.
Design/methodology/approach - Conjoint analysis was used to examine the relative importance and thepart-worth scores of the attributes that influence students' public university preferences in Indonesia.
Findings - High-school leavers in Indonesia trade off university preferences and view advice from family,friends, and/or teachers, reputation, and job prospects as important factors for selecting a public university.Two different preference-based segments of prospective students were identified from cluster analysis, andclassified as either a "social networks-based decision" or a "rational decision" segment. A choice simulator wasemployed with three propositions, and the segments were found to have dissimilar preferences.
Research limitations/implications - While this paper provides insights on higher-education consumerchoice, more research is needed that includes samples from different types of higher-education institutionsand fields of study.
Practical implications - A greater understanding of student choice can help to inform marketing practicesand customize marketing strategies for each segment by providing important information to principal partiesinvolved in making university choice decisions.
Originality/value - This paper demonstrates the relevance and value of conjoint analysis as an effectiveanalytical tool for the identification of important choice criteria and its potential contribution to thedevelopment of more effective marketing strategies.
DisciplinesBusiness
Publication DetailsKusumawati, A., Perera, N. & Yanamandram, V. (2019). Modelling trade-offs in students' choice set whendetermining universities. International Journal of Educational Management, 33 (5), 979-989.
This journal article is available at Research Online: https://ro.uow.edu.au/buspapers/1577
2
Modelling Trade-Offs in Students’ Choice Set When Determining
Universities
Abstract
Purpose: This paper identifies the factors influencing Indonesian students’ choice of
university by estimating the trade-off students make in selecting a university.
Design/methodology/approach: Conjoint analysis was used to examine the relative
importance and the part-worth scores of the attributes that influence students’ public
university preferences in Indonesia.
Findings: High-school leavers in Indonesia trade off university preferences and view advice
from family, friends, and/or teachers, reputation, and job prospects as important factors for
selecting a public university. Two different preference-based segments of prospective
students were identified from cluster analysis, and classified as either a “social networks-
based decision” or a “rational decision” segment. A choice simulator was employed with
three propositions, and the segments were found to have dissimilar preferences.
Research limitations/implications: While this paper provides insights on higher-education
consumer choice, more research is needed that includes samples from different types of
higher-education institutions and fields of study.
2
Practical implications: A greater understanding of student choice can help to inform
marketing practices and customize marketing strategies for each segment by providing
important information to principal parties involved in making university choice decisions.
Originality/value: This paper demonstrates the relevance and value of conjoint analysis as
an effective analytical tool for the identification of important choice criteria and its potential
contribution to the development of more effective marketing strategies.
Keywords: Trade-offs, Higher-education marketing, Student choice, Conjoint analysis
Paper type: Research paper
Background to research
University choice is a high-involvement decision with a significant level of perceived risk
(Briggs, 2006). The social and economic context of higher education makes it important for
service providers to understand the preferences of respective customer groups for various
product attributes. The relative weightings of importance for each of these attributes provide
useful cues to explain why different people make different decisions among a range of
choices. Most studies on university choice have required respondents to rate or rank
numerous attributes that may influence their preferences (James et al., 1999). While many of
such studies were conducted in ‘English speaking’ universities in ‘developed nations’ (Lee,
2014; Ahmad and Hussain 2017), a growing stream of studies (Chen, 2008; Al-Fattal and
Ayoubi, 2012; Ayoubi and Massoud, 2012; Al-Fattal and Ayoubi 2013; Lee, 2014; Douglas,
Douglas, McClelland and Davies, 2015) have sought to narrow and define the preferences in
2
contexts outside of the western world. A few other studies have investigated the relative
importance of attributes or social class when determining university choice (e.g. Bruce and
Edgington, 2008; Callender and Jackson, 2008). These approaches may seem efficient;
however, Jackson (1982) argues that it neglects insights into the trade-offs made between
attributes.
Complicated trade-offs that naturally occur in the marketplace are captured by conjoint
analysis data regarding the decisions of customers who are forced to make difficult choices
(Johnson, 1974; Green et al., 2001; Orme, 2005). In such situations, one attribute with good
performance often counterweighs other attributes with poor performance (Hagel and Shaw,
2010). Measuring the relative weightings of the attributes may allow a better understanding
of the choice behaviour of potential higher education students, which, if taken only one at a
time, might not be reliably measurable (Churchill and Iacobucci, 2002).
Several studies have used conjoint experiments to investigate university choice. For example,
Hooley and Lynch (1981) identify course suitability, university location, academic
reputation, distance from home, type of university (modern/old), and advice from parents and
teachers as important factors in students’ decisions to enrol in an institution. Moogan et al.
(2001) investigated the choices of school leavers and identify the following key decision-
making attributes: course content, location, and reputation. Dunnett et al. (2012) investigated
the impact of fee changes on university choices, focusing particularly on full-cost fees for
English undergraduates, and found that students from families with no history of attending
university experience more disutility from higher fees than do other groups. Soutar and
Turner (2002) also studied the choices made by students from Western Australia, finding that
course suitability, academic reputation, job prospects, and teaching quality are the four most
2
important determinants of university preference. Each of the experiments required students to
make trade-offs between a subset of university attributes including course, academic
reputation, and location. More recently, Basha et al. (2016) studied the major influences on
Malaysian and Chinese students’ preferences for international universities. Their results
indicated that Malaysian students prefer to study in the UK, and are more cost sensitive than
Chinese students, who favour Australia and are more motivated by the job prospects that an
institution offers. While a number of important studies have investigated the student decision-
making process, at least two important concerns with prior research limit the understanding
of university choice, as outlined below.
First, generalizing findings from particular countries and contexts can be based on the
mistaken assumption that what works to attract good students for a particular university or
country also applies to others (Dao and Thorpe, 2015; Ahmad and Hussain, 2017). There is a
need to understand the context of these factors to develop a suitably nuanced marketing
response (Kallio, 1995; Kotler and Fox, 1995). Second, most existing studies ask hypothetical
questions; that is, they ask respondents to reflect on the key decision-making factors that
appear to be important to them, rather than exploring the influences on their choices and any
trade-offs in actually choosing a university (Boatwright et al., 1999; Dunn and Wharton,
2003; Hoyt and Brown, 2003; Moogan and Baron, 2003; Kim, 2004; Veloutsou et al., 2004;
Dawes and Brown, 2005; Domino et al., 2006; Tatar and Oktay, 2006; Yamamoto, 2006;
Brown et al., 2009; Fernandez, 2010; Petruzzellis and Romanazzi, 2010; Dao and Thorpe,
2015; Singh, 2016). Carson et al. (1994) warn against using designs that include dominated
alternatives, because the respondent choices do not reveal information about trade-offs between
the levels of different attributes. The need to investigate trade-offs in students’ decision making
lead to three research questions: (1) Do students trade-off between attributes when making
2
evaluations of their university preference? (2) What are the relative levels of importance that
students attach to the factors that influence them in selecting a university? (3) Are there
groups of students for whom different factors are more important?
This paper focuses on providing empirical evidence to better understand the complex
situation of decision-making process by potential higher-education students in Indonesia.
Methodology
The sampling frame consisted of high-school leavers who chose to select a public university.
This sampling frame was chosen for two reasons. First, this population makes up the largest
segment of universities’ prospective students, and they are the major targeted cohort who
enters public universities. Second, these individuals can provide accurate information
regarding their choice processes because they are in the process of selecting a public
university. Indonesian public universities in Java were chosen because that island has the
largest population and the greatest number of public universities. Four out of its six provinces
were chosen as a sample area based on the level of socio-economic status, the number of
students enrolled, and the number of public universities. A judgement sample was drawn for
the study based on two criteria: only high-school leavers who were actively engaged in the
decision to select public autonomous or non-autonomous universities in Java, and individuals
who chose a business and economics study program as their first preference. This was done
using a screening question administered before providing the questionnaire to the respondent.
To encourage more respondents to participate in the study, and to increase the response rate
while preserving respect, the study employed a face-to-face method of distributing the self-
administered questionnaire. Low consistency scores of the validation sample (minimum
2
Kendall’s = 0.40) eliminated some subjects from the analysis to increase the validity and
reliability of the model (Burns and Bush, 2010; Hair et al., 2010). A total of 403 complete
responses were collected, and were assumed sufficient to ensure valid and robust
interpretation of the results.
The attributes of university preference that were included in the study were identified through
a series of preliminary qualitative studies, and validated through a review of the extensive
literature. The exploratory study results identify 25 attributes – too many to consider in a
conjoint study. While the inclusion of all potentially influential attributes would best describe
a hypothetical product, anything in excess of five or six attributes has been argued to
diminish the reliability of conjoint output (Green and Srinivasan, 1990). The conjoint
questionnaire in this current study was derived from six key variables: total expenses;
reputation; proximity; job prospects; advice from family, friends, and/or teachers; and
campus atmosphere. A fractional design that involved subsets of the full design was
performed (Hair et al., 2010), and SPSS/PASW conjoint 18 was used to reduce the size of the
subset (orthogonal array) into 18 combinations of profiles (Ekdahl, 1997). Four holdout cases
were added at the end of the conjoint profile list to ascertain the predictive power of the
model and to validate the results of the later conjoint analysis. This approach was consistent
with the experiment being designed to reflect the final-choice stage, where students have
chosen and identified a small set of universities to which they are confident of gaining entry
(James et al., 1999; Moogan et al., 2001). A rating scale of 1 to 10, poled from “Do not
prefer” to “Do prefer”, was used to judge each combination.
2
Findings and discussion
Socio-demographic profile of the respondents
Consistent with the demographics associated with the population of interest, most of the
respondents were aged between 18 and 20 years. More male (217) than female (186) students
participated, but there were enough subjects from each gender for the purposes of this study.
The majority of participants, (324) graduated from public high schools; 73 graduated from
private high schools; and the remaining six respondents graduated from other high schools.
Trade-offs and conjoint analysis findings
In this study, two conjoint models were developed. First, the aggregate model analysed all
403 responses and assumed homogeneous preferences. Second, the segmented model split the
data resulting from cluster analysis into separate segments.
Pearson’s r and Kendall’s statistics were computed as summary measures of goodness-of-
fit. They are reported as indicators of fit between the model and the obtained data (Green and
Rao, 1971; Green and Srinivasan, 1978; 1990; Green et al., 2001), and are very high for this
analysis for the aggregate sample (0.997 and 0.967), indicating that this study’s analyses are
valid. A strong correlation (Kendall’s = 0.667) was found between the predicted model and
the holdout set, which gives strong confidence in the suitability of the main effects model.
Similarly, the entire sample had a high r (above 0.7) for the predicted model and a score
higher than 0.4 for the holdout set. The results uphold the assumption that high-school
students perceive university choice criteria as bundles of attributes, and consider personal
constraints when selecting a public university (Table 1). Additionally, the importance scores
were computed by dividing the utility range for a particular attribute by the sum of all the
utility ranges (SPSS Inc, 2007). These are reported in Table 1.
2
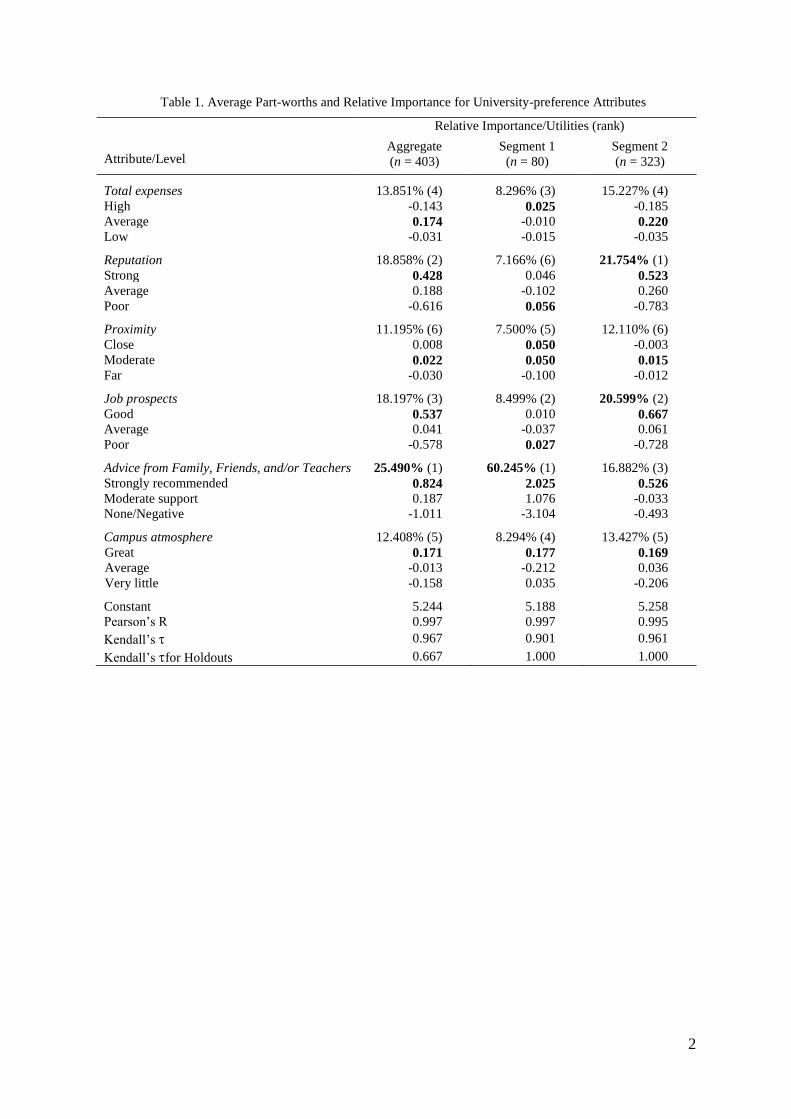
Conjoint analysis revealed the following relative importance of attributes for all respondents:
(1) advice from family, friends, and/or teachers; (2) reputation; (3) job prospects; (4) total
expenses; (5) campus atmosphere; and (6) proximity. Further analysis of the advice from
family, friends, and/or teachers suggests a high preference for support in the form of strong
recommendations (mean utility = 0.824). If this type of support is unavailable, the students in
this sample appear less inclined to attend a university for which their important others express
only moderate support (mean utility = 0.187), and may possibly forego a university education
if there is no support at all (mean utility = −1.011). As suspected, strong recommendations
from family, friends, and/or teachers increased the likelihood of choosing a nearby university.
Although respondents did not consider close proximity (mean utility = 0.008) as the highest
preference, moderate proximity seemed more reasonable (mean utility = 0.022) for them than
greater distance (mean utility = −0.030).
Insert Table 1 here
A closer look at the results revealed that the respondents most preferred average total
expenses (mean utility = 0.174), and demonstrated increasing disutility when total expenses
were high (mean utility = −0.143) and low (mean utility = −0.031). Strong reputation and
increased likelihood of finding a good job contributed positively to overall utility. The
respondents also demonstrated minimum utility for poor job prospects after graduation (mean
utility = −0.578), moderate utility for moderate job prospects (mean utility = 0.22), and a
strong preference for good job prospects (mean utility = 0.537). The respondents in this study
2
also preferred a great campus atmosphere (mean utility = 0.171) and showed increasing
disutility on average (mean utility = −0.013) for very little campus atmosphere (mean utility
= −0.158).
The results presented for the aggregate model suggest that “reference group influence” –
including advice from family, friends, and/or teachers – was significantly more important
than other factors. A high influence of social links in students’ decisions about university
choice has been revealed in many studies (Ceja, 2004; Kim and Schneider, 2005; Perna and
Titus, 2005). For example, parents of first-generation students (in other words, parents who
themselves have not had opportunities to attend college) (Fann et al., 2009), parents of young
women students (Al-Yousef, 2009), and siblings of students (Ceja, 2006) became active
participants in college preparation and planning. The findings also suggest that the
respondents in this study were willing to accept average total expenses, possibly due to
concerns about the reputation of the university as well as the quality of education.
Preliminary cluster analysis was performed through a hierarchical method, using Ward’s
procedure, which was combined with the squared Euclidean distance measure to determine
the number of clusters. Then the cluster membership was found by using a non-hierarchical
method, the K-means method, as suggested by Perera (2008) and Hair et al. (2010). Cluster
analysis identifies two homogeneous student segments. Each group represents a different
preference-based segment, and is substantial in size. The smallest segment, representing
19.85 percent of the sample, is labeled the “social networks-based decision” segment; the
largest segment, representing 80.15 percent of the sample, is labeled the “rational decision”
segment. Again, conjoint analysis was performed on each segment. Table 1 shows what
2
variables have the most impact on driving student membership into different segments. The
validities of the two clusters were highly correlated: for Cluster 1, Pearson’s r = 0.997 and
Kendall’s = 0.901; for Cluster 2, Pearson’s r = 0.995 and Kendall’s = 0.961. The
predicted model and the holdout set for each of those two clusters were perfectly correlated
(Kendall’s = 1.000).
As shown in Table 1, the two clusters differ most on the relative importance placed on advice
from family, friends, and/or teachers; reputation; and job prospects. The first segment placed
the highest importance on advice from family, friends, and/or teachers (relative weight =
60.245 percent), followed by job prospects (8.499 percent) and total expenses (8.296
percent). In contrast to the findings within the aggregate model, reputation was the least
important (7.166 percent), and proximity (7.500 percent) the second least important. The
second segment rated reputation as most important (relative weight = 21.754 percent),
followed by job prospects (20.599 percent); while proximity was the least important (12.110
percent). This group ranked advice from family, friends, and/or teachers third (16.882
percent), followed by total expenses (15.227 percent). Similar to the aggregate model,
campus atmosphere (13.427 percent) and proximity were the least influential (12.110
percent) attributes.
The utility for advice from family, friends, and/or teachers (Table 1) shows that the first
segment valued a strong recommendation from family, friends, and/or teachers (mean utility
= 2.025) and was opposed to another type of support from family, friends, and/or teachers
(none/negative support mean utility = −3.104). Likewise, the second segment also considered
strong recommendations from family, friends, and/or teachers as important. As shown in
2
Table 1, both segments demonstrated disutility from decreases in group reference
recommendations, but the rational decision segment was more price-sensitive. For example,
when there was a strong recommendation from their social reference group, prospective
students in the first segment may not have been sensitive to a high level of total expenses,
even with poor reputation and job prospects. In contrast, the rational decision segment had
high expectations of their preferred university (Table 1), selecting a university with a strong
reputation, good job prospects, great campus atmosphere, and a strong recommendation from
their reference group, but with average total expenses and moderate proximity.
If finding a job is necessary to cover the costs of education, it is not surprising that the two
groups also differ significantly on utility for job prospects. Table 1 suggests that the social
networks-based decision group was satisfied with poor job prospects after graduation (mean
utility = 0.027) with either close or moderate distance from home. However, the rational
decision segment was not satisfied with only an average level of getting a job offer after
graduation, and had a much stronger preference for a good chance of an offer (mean utility =
0.667).
Choice simulator
The final stage of the conjoint analysis is the choice simulator for estimating percent of
respondent choice for specific factor profiles entered into the simulator. Most often, the
current competitors in the market are identified based on specific levels of the choice
attributes. The simulator estimates choice share for the current market. The most common
simulator models include the maximum utility (first-choice model), the average-choice
(Bradley-Terry-Luce) model, and the logit model. The first-choice model identifies the
product with the highest utility as the product of choice. Each respondent is assumed to
choose the profile with the highest utility (max-utility choice rule). After the process is
2
repeated for each respondent’s utility set, the cumulative “votes” for each product are
evaluated as a proportion of the votes or respondents in the sample (that is, “market” share).
The Bradley-Terry-Luce model estimates choice probability in a different fashion: the choice
probability for a given product is based on the utility for that product divided by the sum of
all products in the simulated market. The logit model uses an assigned choice probability that
is proportional to an increasing monotonic function of the alternative’s utility. The choice
probabilities are computed by dividing the logit value for one product by the sum for all other
products in the simulation. These individual choice probabilities are averaged across
respondents. Both probability models tend to give similar predictions (Hair et al., 2010). The
SPSS/PASW 18 conjoint simulator uses the holdout profile (for validity and reliability
checks) and computes a preference score for each respondent. It offers three choice rules:
maximum utility, the Bradley-Terry-Luce probability of choice model, and logit, as presented
in Table 2.
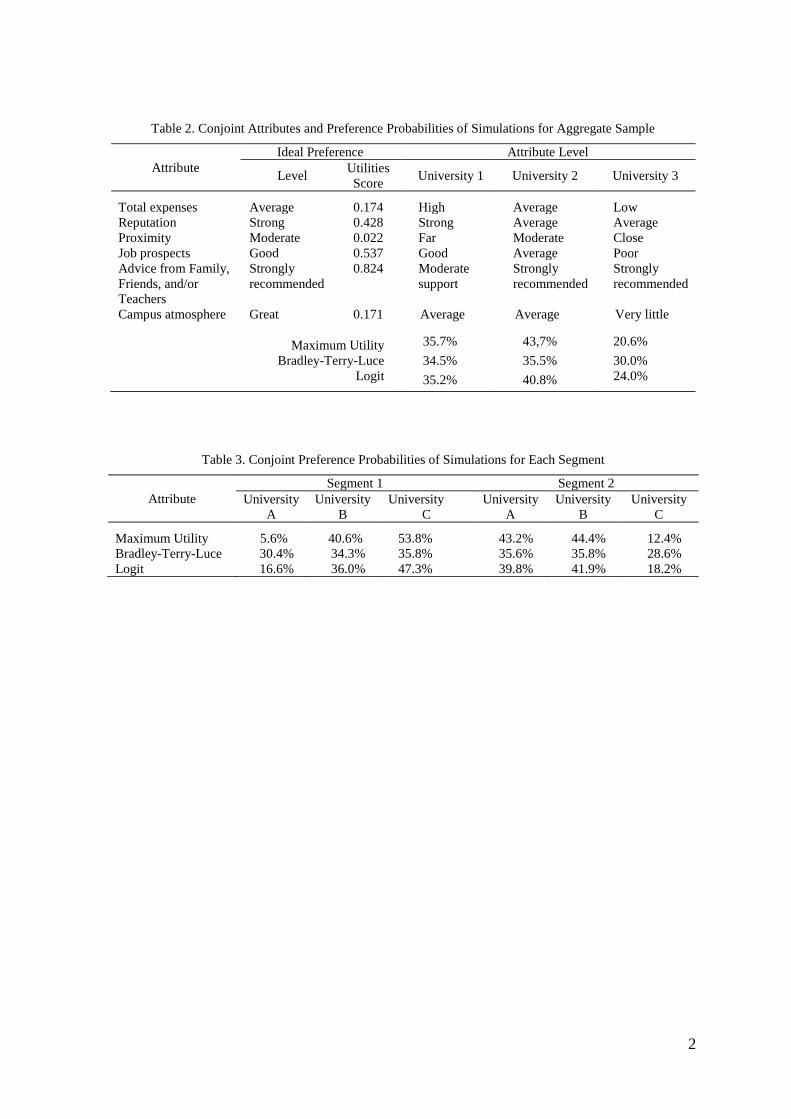
Insert Table 2 here
An ideal preference for the high-school leavers according to this current study is to choose a
university with average total expenses (0.174), a good reputation (0.428), and a moderate
proximity (0.22). Students preferred to choose a university that was strongly recommended
by their family, friends, and/or teachers (0.824), with good job prospects (0.537), and a great
campus atmosphere (0.171). In the simulation process, the ideal preference becomes the more
realistic university choice criteria presented in Table 3. From the three universities, the most
preferable combination for the aggregate sample was University 2. This university holds the
highest probability score in maximum utility for 43.7 percent, Bradley-Terry-Luce for 35.5
2
percent, and logit test for 40.8 percent. The proposition consists of an average level of total
expenses, reputation, job prospects, and campus atmosphere, with moderate proximity, but
strongly recommended by their family, friends, and/or teachers.
Insert Table 3 here
Simulation conducted with the same three concepts on two different segments found that
these segments have dissimilar preferences. Segment 1 places the highest preference on
choice criteria (such as low total expenses, average reputation, close proximity, and strong
recommendations from family, friends, and/or teachers), although these could appear
alongside poor job prospects as well as very little campus atmosphere, as with University C
(Table 3). This concept holds the highest probability score in maximum utility for 44.4
percent, Bradley-Terry-Luce for 35.8 percent, and logit test for 41.9 percent (Table 2). In
contrast, Segment 2 has more rational choice criteria, selecting University 2 as the highest
preference. This university has the highest probability score in maximum utility for 53.8
percent, Bradley-Terry-Luce for 35.8 percent, and logit test for 47.3 percent. This
university’s characteristics include average total expenses, reputation, job prospects and
campus atmosphere, with moderate proximity and a strong recommendation from family,
friends, and/or teachers. The results are consistent between Segment 2 and the aggregate
sample (Table 2). The results reveal that University A was not at all attractive to any of the
segments. This combination shows that, generally, high-school leavers in this research had
realistic choice criteria even though they still depended on their social networks’
recommendations for selecting their preferred university.
2
Conclusion
This study found that the most important determinant of university choice for Indonesian
high-school leavers was advice from family, friends, and/or teachers, which is in contrast to
findings from student choices in developed countries. Interestingly, while that attribute rated
highest in importance, there was only a small gap between the highest- and lowest-rated
attributes. The highest-rated attribute (advice from family, friends, and/or teachers) had a
relative importance of 25.490 percent, while the lowest-rated attribute (proximity) had a
relative importance of 11.195 percent. This suggests that the students’ decision-making
process was complicated. While their final choices may have been determined by the most
important attributes, they did trade-off between the various attributes when making decisions.
This research confirms that prospective students used a subset of attributes when selecting a
university. With the benefit of conjoint analysis, consumer preferences were identified and
described in two models, an aggregate and a segmented model, based on the importance
values and the part-worth utilities obtained. The results also show that while some students
considered high reputation and good job prospects as part of their choice criteria, many
continued to identify the strong influence of social networks. A conjoint simulator test
allowed the preferences of three university choice scenarios that were not actually rated by
consumers to be examined by the aggregate sample and by different segments. These three
possible university combinations captured the actual scenario of reputational diversity in the
Indonesian public university sector, and represented both “old” and “new” universities. This
analysis was also intended to give an insight into the use of conjoint analysis in estimating
relative market shares.
2
Another outcome of the study is its demonstration of the usefulness of the conjoint analysis
approach in overcoming some of the difficulties found in earlier studies, where students often
did not, or could not, discriminate between university attributes and evaluate them as a
whole. By allowing students to choose between attributes, this study focused attention on a
subset of attributes as being important. The results can help university administrators and
recruiters customize their marketing strategies for each segment by providing important
information to the principal parties involved in making university-choice decisions.
Public universities should deliver on the most important criteria identified by prospective
students. Based on the findings of this current study, universities can design the program
specifically to involve family members and the community to perpetuate “the notion of
cultural capital beyond merely the individual” (Tierney, 2004, p. 228).
As a future research direction, to get a benefit from conducting conjoint analysis based on
clustering, surveys can be conducted with specific student segments based on the socio-
economic status of the prospective students, and perhaps in different geographical areas. This
could help determine if there are other relevant importance factors.
2
Table 1. Average Part-worths and Relative Importance for University-preference Attributes
Attribute/Level
Relative Importance/Utilities (rank)
Aggregate
(n = 403)
Segment 1
(n = 80)
Segment 2
(n = 323)
Total expenses 13.851% (4) 8.296% (3) 15.227% (4)
High -0.143 0.025 -0.185
Average 0.174 -0.010 0.220
Low -0.031 -0.015 -0.035
Reputation 18.858% (2) 7.166% (6) 21.754% (1)
Strong 0.428 0.046 0.523
Average 0.188 -0.102 0.260
Poor -0.616 0.056 -0.783
Proximity 11.195% (6) 7.500% (5) 12.110% (6)
Close 0.008 0.050 -0.003
Moderate 0.022 0.050 0.015
Far -0.030 -0.100 -0.012
Job prospects 18.197% (3) 8.499% (2) 20.599% (2)
Good 0.537 0.010 0.667
Average 0.041 -0.037 0.061
Poor -0.578 0.027 -0.728
Advice from Family, Friends, and/or Teachers 25.490% (1) 60.245% (1) 16.882% (3)
Strongly recommended 0.824 2.025 0.526
Moderate support 0.187 1.076 -0.033
None/Negative -1.011 -3.104 -0.493
Campus atmosphere 12.408% (5) 8.294% (4) 13.427% (5)
Great 0.171 0.177 0.169
Average -0.013 -0.212 0.036
Very little -0.158 0.035 -0.206
Constant 5.244 5.188 5.258
Pearson’s R 0.997 0.997 0.995
Kendall’s 0.967 0.901 0.961
Kendall’s for Holdouts 0.667 1.000 1.000
2
Table 2. Conjoint Attributes and Preference Probabilities of Simulations for Aggregate Sample
Attribute
Ideal Preference Attribute Level
Level Utilities
Score University 1 University 2 University 3
Total expenses Average 0.174 High Average Low
Reputation Strong 0.428 Strong Average Average
Proximity Moderate 0.022 Far Moderate Close
Job prospects Good 0.537 Good Average Poor
Advice from Family,
Friends, and/or
Teachers
Strongly
recommended
0.824 Moderate
support
Strongly
recommended
Strongly
recommended
Campus atmosphere Great 0.171 Average Average Very little
Maximum Utility 35.7% 43,7% 20.6%
Bradley-Terry-Luce 34.5% 35.5% 30.0%
Logit 35.2% 40.8% 24.0%
Table 3. Conjoint Preference Probabilities of Simulations for Each Segment
Attribute
Segment 1 Segment 2
University
A
University
B
University
C
University
A
University
B
University
C
Maximum Utility 5.6% 40.6% 53.8% 43.2% 44.4% 12.4%
Bradley-Terry-Luce 30.4% 34.3% 35.8% 35.6% 35.8% 28.6%
Logit 16.6% 36.0% 47.3% 39.8% 41.9% 18.2%
2
References
Ahmad, S. Z., & Hussain, M. (2017). An investigation of the factors determining student
destination choice for higher education in the United Arab Emirates. Studies in Higher
Education, 42(7), 1324-1343.
Al-Fattal, A. and Ayoubi, R.M. (2012). “Understanding Consumer Buyer Behaviour in the
EFL Market: a Case Study of a Leading Provider in Syria”, Education, Business and Society:
Contemporary Middle Eastern Issues, Vol 5, Issue 4, pp. 237-253.
Al-Fattal, A. and Ayoubi, R.M. (2013) “Students Needs and Motives when Attending a
University: Exploring the Syrian Case”, Journal of Marketing for Higher Education,
Vol 23, Issue 2, pp.204-225.
Al-Yousef, H. (2009), “They know nothing about university-neither of them went”: The
effect of parents’ level of education on their involvement in their daughters’ higher
education choices”, Compare: A Journal of Comparative and International Education,
Vol. 39 No. 6, pp. 783–798.
Ayoubi, R.M. and Massoud, H.K. (2012). “Student Aspiration Factors, University Reputation
and the Entry Standards to UK Universities”, European Journal of Social Sciences, Vol
34, Issue 4, pp. 609-621.

2
Basha, N.K., Sweeney, J.C. and Soutar, G.N. (2016), “International students’ university
preferences: how different are Malaysian and Chinese students?” International Journal
of Educational Management, Vol. 30 No. 2, pp. 197–210.
Boatwright, M.A., Ouimet, J.A. and Middleton, T. (1999), “Can high-choice college set be
linked to college-of-enrollment?” College and University, Vol. 75 No. 1, pp. 23.
Briggs, S. (2006), “An exploratory study of the factors influencing undergraduate student
choice: the case of higher education in Scotland”, Studies in Higher Education, Vol. 31
No. 6, pp. 705–722.
Brown, C., Varley, P. and Pal, J. (2009), “University course selection and service marketing”,
Marketing Intelligence & Planning, Vol. 27 No. 3, pp. 310–325.
Bruce, G., & Edgington, R. (2008). Factors influencing word-of-mouth recommendations by
MBA students: An examination of school quality, educational outcomes, and value of
the MBA. Journal of Marketing for Higher Education, 18(1), 79-101.
Burns, A.C. and Bush, R.F. (2010), Marketing Research, 6th edn, Prentice Hall, Upper
Saddle River, New Jersey.
Callender, C., & Jackson, J. (2008). Does the fear of debt constrain choice of university and
subject of study?. Studies in Higher Education, 33(4), 405-429.
Carson, R.T., Louviere, J.J., Anderson, D.A. and Arabie, P. (1994), “Experimental Analysis
of Choice”, Marketing Letters, Vol. 5 No. 4, pp. 351–368.
Ceja, M. (2004), “Chicana College Aspirations and the Role of Parents: Developing
Educational Resiliency”, available at:
http://www.fresnounified.org/dept/planning/edresearch/Career%20Preparation%20Rese
2
arch/Chicano%20College%20Aspirations%20and%20the%20Role%20of%20Parents,
%20Developing%20Educational%20Resiliency.pdf (accessed 20 December 2017).
Ceja, M. (2006), “Understanding the role of parents and siblings as information sources in the
college choice process of Chicana students”, Journal of College Student Development,
Vol. 47 No. 1, pp. 87–104.
Chen, L.H. (2008). Internationalization or international marketing? Two frameworks for
understanding international students' choice of Canadian universities. Journal of
Marketing for Higher Education, 18(1), 1-33.
Churchill, G.A. and Iacobucci, D.J. (2002), Marketing Research: Methodological
Foundations, 8th edn, Harcourt College Publishers, Fort Worth.
Dao, M.T.N. and Thorpe, A. (2015), “What factors influence Vietnamese students’ choice of
university?” International Journal of Educational Management, Vol. 29 No. 5, pp.
666–681.
Dawes, P.L. and Brown, J. (2005), “The composition of consideration and choice sets in
undergraduate university choice: An exploratory study”, Journal of Marketing for
Higher Education, Vol. 14 No. 2, pp. 37–59.
Domino, S., Libraire, T., Lutwiller, D., Superczynski, S. and Tian, R. (2006), “Higher
education marketing concerns: Factors influence students’ choice of colleges”, The
Business Review, Cambridge, Vol. 6 No. 2, pp. 101–111.
Douglas, J., Douglas, A., McClelland. R.J., & Davies, J. (2015). Understanding student
satisfaction and dissatisfaction: An interpretive study in the UK higher education
context. Studies in Higher Education, 40(2), 329-349.

2
Dunn, C. and Wharton, H. (2003), “The Decision Making Process of Students Entering
Higher National Diplomas”, Coventry Business School, Coventry University, available
at: http://www.business.heacademy.ac.uk/resources/reflect/conf/2003/dunn/dunn.pdf
(accessed 20 December 2017).
Dunnett, A., Moorhouse, J., Walsh, C. and Barry, C. (2012), “Choosing a University: A
conjoint analysis of the impact of higher fees on students applying for university in
2012”, Tertiary Education and Management, Vol. 18 No. 3, pp. 199–220.
Ekdahl, F. (1997), “Increased Customer Satisfaction Using Design of Experiments, Conjoint
Analysis and QFD”. Thesis, Division of Quality and Technology and Management,
Departement of Mechanical Engineering, Linköping University, Linköping.
Fann, A., McClafferty Jarsky, K. and McDonough, P.M. (2009), “Parent Involvement in the
College Planning Process: A Case Study of P-20 Collaboration”, Journal of Hispanic
Higher Education, Vol. 8 No. 4, pp. 374–393.
Fernandez, J.L. (2010), “An exploratory study of factors influencing the decisions of students
to study at Universiti Sains Malaysia”, Kajian Malaysia, Vol. 28 No. 2, pp. 107–136.
Green, P.E., Krieger, A.M. and Wind, Y. (2001), “Thirty Years of Conjoint Analysis:
Reflections and Prospects”, Interfaces, Vol. 31 No. 3, pp. S56–S73.
Green, P.E. and Rao, V.R. (1971), “Conjoint measurement for quantifying judgemental data”,
Journal of Marketing Research (pre-1986), Vol. 8 No. 000003, pp. 355–363.
Green, P.E. and Srinivasan, V. (1978), “Conjoint Analysis in Consumer Research: Issues and
Outlook”, The Journal of Consumer Research, Vol. 5 No. 2, pp. 103–123.
Green, P.E. and Srinivasan, V. 1990, “Conjoint analysis in marketing: New developments
with implications for research and practice”, Journal of Marketing, Vol. 54 No. 4, pp.
3–19.
2
Hagel, P. and Shaw, R.N. (2010), “How Important is Study Mode in Student University
Choice?” Higher Education Quarterly, Vol. 64 No. 2, pp. 161–182.
Hair, J.F., Black, W.C., Babin, B.J. and Anderson, R.E. (2010), Multivariate Data Analysis:
A Global Perspective, 7th edn, Pearson Education, Upper Saddle River, New Jersey.
Hooley, G.J. and Lynch, J.E. (1981), “Modelling the Student University Choice Process
Through the Use of Conjoint Measurement Techniques”, European Research, Vol. 9
No. 4, pp. 158.
Hoyt, J.E. and Brown, A.B. (2003), “Identifying college choice factors to successfully market
your institution”, College and University, Vol. 78 No. 4, pp. 3–10.
Jackson, G.A. (1982), “Public efficiency and private choice in higher education”,
Educational Evaluation and Policy Analysis, Vol. 4 No. 2, pp. 237–247.
James, R., Baldwin, G. and McInnis, C. (1999), “Which University? The Factors Influencing
the Choices of Prospective Undergraduates, Evaluations and Investigations
Programme.” Higher Education Division, Canberra, Australian Government Publishing
Service.
Johnson, R.M. (1974), “Trade-off analysis of consumer values”, Journal of Marketing
Research (JMR), Vol. 11 No. 2, pp. 121–127.
Kallio, R.E. (1995), “Factors influencing the college choice decisions of graduate students”,
Research in Higher Education, Vol. 36 No. 1, pp. 109–124.
Kim, D. (2004), “The effect of financial aid on students’ college choice: Differences by racial
groups”, Research in Higher Education, Vol. 45 No. 1, pp. 43–70.
Kim, D.O. and Schneider, B. (2005), “Social Capital in Action: Alignment of Parental
Support in Adolescents’ Transition to Postsecondary Education”, Social Forces, Vol.
84 No. 2, pp. 1181–1206.
2
Kotler, P. and Fox, K.F.A. (1995), Strategic Marketing for Educational Institutions, 2nd edn,
Prentice-Hall, Englewood Cliffs, New Jersey.
Lee, C.F. (2014). An investigation of factors determining the study abroad destination choice:
A case study of Taiwan. Journal of Studies in International Education, 18(4), 362-381.
Moogan, Y.J. and Baron, S. (2003), “An analysis of student characteristics within the student
decision making process”, Journal of Further and Higher Education, Vol. 27 No. 3, pp.
271–287.
Moogan, Y.J., Baron, S. and Bainbridge, S. (2001), “Timings and trade-offs in the marketing
of higher education courses: a conjoint approach”, Marketing Intelligence & Planning,
Vol. 19 No. 3, pp. 179–187.
Orme, B. (2005), Getting Started with Conjoint Analysis: Strategies for Product Design and
Pricing Research, 1st edn, Researcher Publishers, Inc, Madison, Wisconsin.
Perera, N. (2008), Data Analysis with SPSS Version 15, 3rd edn, Pearson Education
Australia.
Perna, L.W. and Titus, M.A. (2005), “The Relationship between Parental Involvement as
Social Capital and College Enrollment: An Examination of Racial/Ethnic Group
Differences”, The Journal of Higher Education, Vol. 76 No. 5, pp. 485–518.
Petruzzellis, L. and Romanazzi, S. (2010), “Educational value: how students choose
university”, The International Journal of Educational Management, Vol. 24 No. 2, pp.
139.
Singh, M.K.M. (2016), “Socio-economic, environmental and personal factors in the choice of
country and higher education institution for studying abroad among international
students in Malaysia”, International Journal of Educational Management, Vol. 30 No.
4, pp. 505–519.
2
Soutar, G.N. and Turner, J.P. (2002), “Students’ preferences for university: A conjoint
analysis”, The International Journal of Educational Management, Vol. 16 No. 1, pp.
40–45.
SPSS Inc. (2007), PASW Conjoint 18. Chicago, SPSS Inc.
Tatar, E. and Oktay, M. (2006), “Search, Choice and Persistence for Higher Education: A
Case Study in Turkey”, Eurasia Journal of Mathematics, Science and Technology
Education, Vol. 2 No. 2, pp. 115–129.
Tierney, W. (2004), Power, identity, and the dilemma of college student departure, in
Braxton, J.M. (Ed.), Reworking the student departure puzzle, Vanderbilt University
Press, Nashville.
Veloutsou, C., Lewis, J.W. and Paton, R.A. (2004), “University selection: information
requirements and importance”, The International Journal of Educational Management,
Vol. 18 No. 2/3, pp. 160–171.
Wilkins, S., & Huisman, J. (2011). International student destination choice: The influence of
home campus experience on the decision to consider branch campuses. Journal of
Marketing for Higher Education, 21(1), 61-83.
Yamamoto, G.T. (2006), “University evaluation-selection: a Turkish case”, The International
Journal of Educational Management, Vol. 20 No. 7, pp. 559–569.