modelling monthly international tourist arrivals and its ... · himalaya (2008) also mentioned that...
TRANSCRIPT
Modelling Monthly International Tourist Arrivals and Its Risk in Nepal
Hari Sharma Neupane* Chandra Lal Shrestha**
& Tara Prasad Upadhyaya***
Abstract
The volume of international tourist arrivals is the prime concern for both the tourism entrepreneurs and policy makers, as the arrivals is directly associated with foreign exchange earnings or export benefits, and tourism induced economic activities. The overall average annual growth of international tourist arrivals in the country over the last 40 years is about 6.65 percent. The mean contribution of tourism sector as a percentage of GDP was 2.67 percent during the last 35 years. This paper explores the risk associated in the Nepalese tourism industry taking account of monthly international tourist arrivals. The symmetric and asymmetric conditional mean and volatility models, GARCH, GARCH-GJR and EGARCH with exogenous ARMA terms were applied for data analysis. The empirical results showed that the long run risk or volatility is persistence in monthly international tourist arrivals and estimated coefficients are statistically significant. The volatility can be inferred as risk or uncertainty associated with international tourist arrivals in Nepalese tourism industry. Therefore, this empirical study envisages sufficient room for intervening or amending the tourism policy to better attract international visitors and promote tourism as a business.
JEL Classification: C 22
Key words: International tourist arrivals, Growth, and Conditional Mean and Volatility
I. INTRODUCTION Over the time, the substantial growth in the tourism business in the world clearly marks tourism as one of the most remarkable economic and social phenomena of the last century. The number of international tourist arrivals illustrated an evolution from a mere 25 million international arrivals in 1950 to an estimated 806 million in 2005, corresponding to an average annual growth rate of 6.5% (UNWTO, 2009a). Moreover,
* Ph.D. Scholar , Senior Agriculture Economist, Department Agriculture, Harihar Bhawan Nepal.
Corresponding Address: Email:[email protected]. Tel. 977-1-5010184/9851127808 ** Associate Professor, Department of Rural Development, Tribhuvan University, Nepal. *** Ph.D. Scholar in Faculty of Commerce, Banaras Hindu University, India. Acknowledgement: We heartily thank anonymous referees for providing valuable comments and
suggestions and NRB Editorial Board for their cooperation.
Modelling Monthly International Tourist Arrivals and Its Risk in Nepal
29
international tourist arrivals in the world grew by 6.9% in 2007, highest growth in Middle East (15.3%), followed by Asia Pacific (10.5%), Africa (8.5%), Europe (5.2%) and Americas (4.9%) in the same year (UNWTO, 2009b). Apparently, tourism exports have become an important sector and a growing source of foreign exchange earnings in many developing countries (Seddighi & Theocharous, 2002). It is a demand-driven, service-oriented industry, experiencing rapid growth and innovation and plays a key role in the growth of the country’s economy (Chu, 2008). The tourism industry, which benefits the transportation, accommodation, catering, entertainment and retailing sectors, has been blooming in the past few decades (Cho, 2003). Furthermore, international tourists have increasingly sought exotic destinations in their pursuit of relaxation, escape, and adventure in the preceding century and recognizing the opportunity to earn valuable foreign currency, developing countries have catered to these desires by encouraging tourism development (Werner, 2003). Economic literature on economic growth and tourism argues that international tourism may affect growth through several ways beyond the direct revenues receipts from tourist. For example, the foreign direct investment associated with this sector can bring managerial skills and technology with potential spillover benefits to other sectors as well. National policies designed to foster tourism, by improving security, stability, and openness, can also enhance growth in other sectors of the economy (Arezki, Cherif, & Piotrowski, 2009). Undeniably, risk or volatility in international tourist arrivals in Nepal would have several impacts on the economy mostly on foreign exchange receipts, imports and exports, and service sectors. 1.1 An Overview of Nepalese Tourism Industry
Nepal has ancient history of tourists arrival. So far, Sir Edmund Hillary and his travel companion in the 1953 from the British Mt Everest expedition were among the first foreigners to visit the region. Presently, this area is one of the Himalaya's premier centers for mountaineering and trekking tourism, as well as a national park (Sagarmatha National Park), and a World Heritage (Stanley, 1993). Some literature argued Boris Lissanevitch was the pioneer of Nepalese tourism industry. “The booming Nepalese tourism industry owes its rise to Boris Lissanevitch-a Russian emerge, when Nepal was still a forbidden mountain kingdom, a Shangri-La out of bounds to the western tourist” (Himalaya, 2008). Himalaya (2008) also mentioned that King Tribhuvan was acquainted with his Club- Club 300 in Kolkata and Boris was invited during King Mahendra’s wedding because of his hospitality. Boris was, eventually, arrived in Nepal in 1951 and opened the country’s first international class hotel -“The Royal Hotel,” presently, known as the Yak & Yeti Hotel. Boris realized Nepal is potential destination for tourists and was also succeed to grant a 15-day visa for a group of 20 foreigners by requesting King Mahendra. He played host to the country’s first batch of tourists in 1955 (Himalaya, 2008). During the more than half a century, Nepalese tourism industry became a country’s biggest industry. The volume of tourist-visitors totaled 602,855 in the year 2010 and this figure is more than 18 percent as compared to year 2009. The composition of tourist arrival comprises
NRB ECONOMIC REVIEW 30
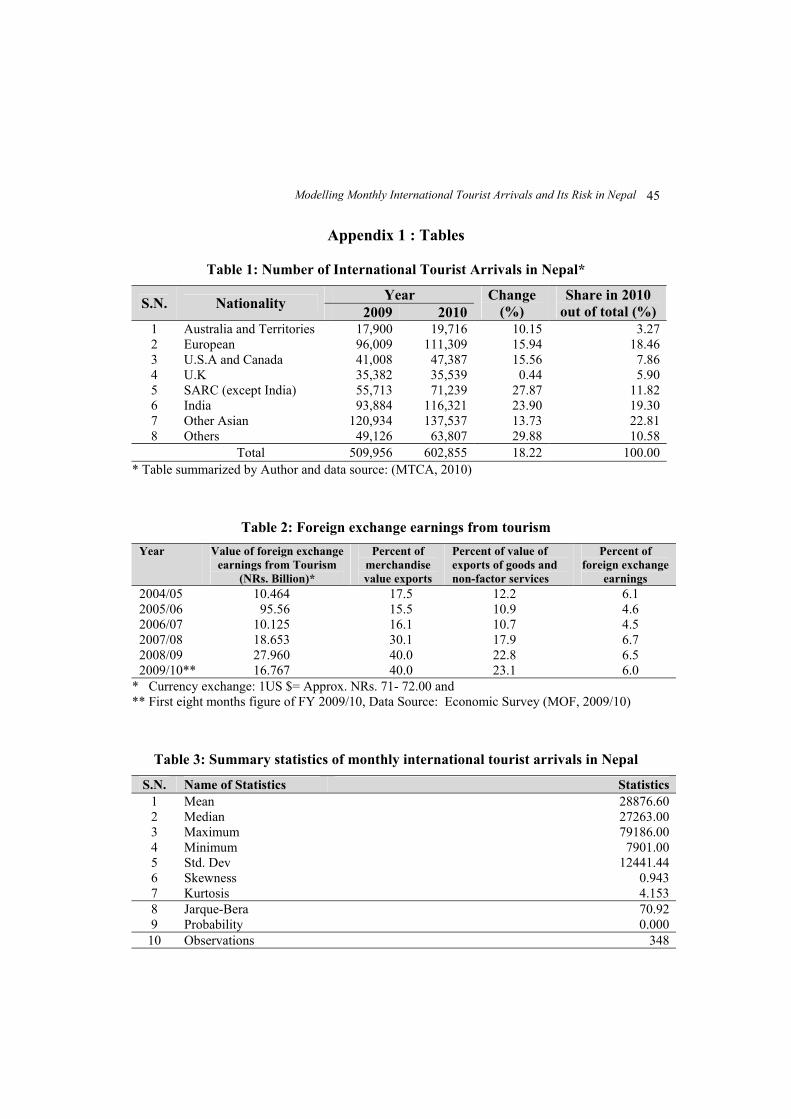
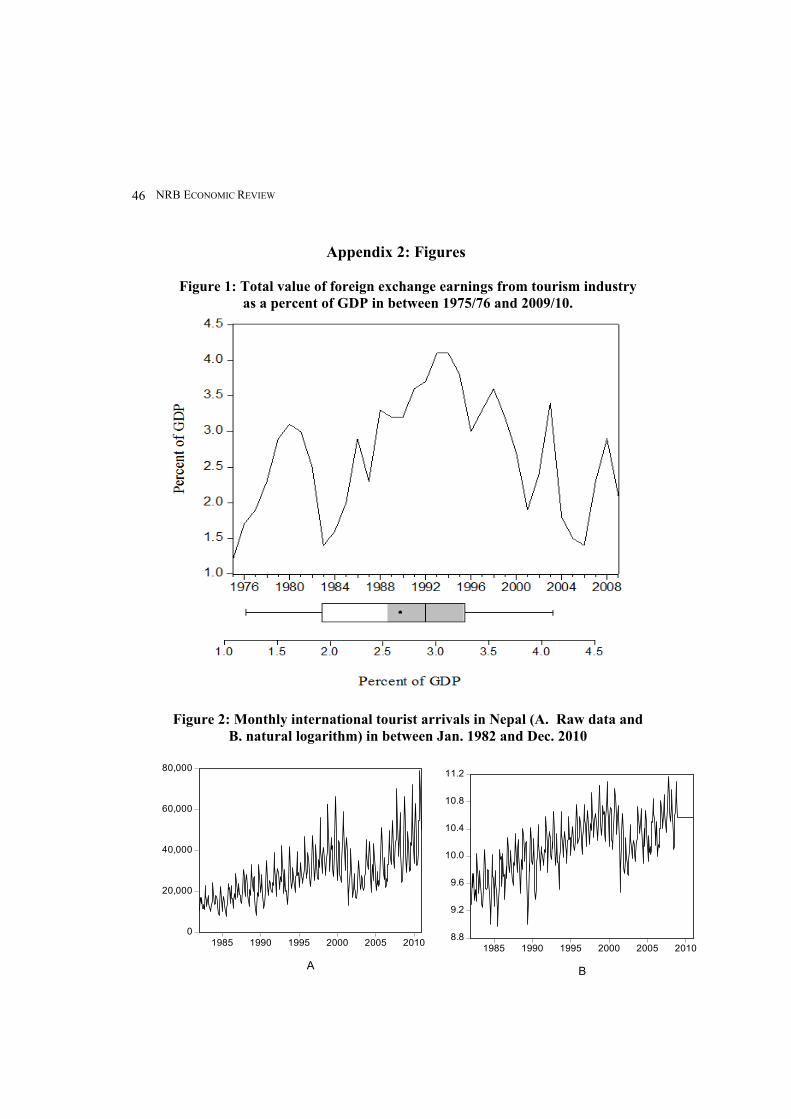
34.63 % from Asian countries except India; 18.46% from Europe; 19.30 % from India; 7.86% from America and Canada; 3.27% from Australia and territories 5.9% from U.K. and remaining 10.58% from the rest of the world (Appendix 1: Table 1). The country is well known for the Mt. Everest and the high Himalayan regions of Nepal have established as a foremost center of mountaineering and trekking route in Asia with an immense potential for tourism development. The small-scale of adventure tourism product of Nepal is able to link this country, possibly, most remote part of the globe, with the global economy and provides new opportunities for country’s economic development. So far, the pace of tourism industry development could not be considered promising from the perspective of economic development. Even if, this sector is contributing substantial share in foreign exchange receipts with unlimited potentiality. Tourism industry is one of the major sources of foreign receipt for Nepal. In the year 2008/09, the foreign earning amounted to NRs.27.96 billion. This figure is 40% of total merchandize export value and 22.8% of total value of exports of goods and non-factorized services (Appendix 1: Table 2). The annual contribution of tourism industry in the national economy during the last 35 years (1975/76–12009/10) as percentage of GDP is depicted in the (Annex 2: Figure 1). The figure reveals that the percent share of value of foreign exchange earnings from tourism in national GDP fluctuated over the time and in 1980, 1981 and in between 1988-1999 was more than 3 percent and reached more than 4 percent in 1992 and 1993. However, the mean contribution of this industry as a percentage of GDP was 2.67. The revised government policies have shown greater concerns about the real value of tourism and its contribution in economic growth and overall tourism development in the country. Furthermore, tourism industry is considered as a major element for poverty alleviation and social equity. The Nepal Tourism Vision 2020, has been issued from the Ministry of Tourism and Civil Aviation with the collaboration of Nepal Tourism Board and concerned industries targeting to attract two millions of tourist by 2020 (MOF, 2009). 1.2 Nepal - A Potential Destination for Tourism Nepal has a wide range of adventurous and mind blowing tourism products and the county holds eight of the world's ten highest peaks in the northern Himalayas. Climbing and mountaineering policy has been revised to explore major adventure products and more than 300 mountain peaks have been opened (NTB, 2009). Despite conventional adventure tourism products (such as mountaineering, trekking and rafting), Nepal holds prospects for promoting many other equally important adventure events such as soft trekking, hiking, paragliding, mountain biking, high altitude marathon, and kayaking (Dahal, 2009). Instead of that, Nepalese tourism could be the one of the principal paths that country can follow to overcome the persistence rural poverty and unemployment in the remote rural life. The policies of tourism commoditization and commercialization in the remote-rural areas may utilize the “potential embedded in its enchanting natural sceneries, mountainous terrain, relatively unadulterated rural-agrarian life, and artistic heritage” (Bhattarai, Conway, & Shrestha, 2005).
Modelling Monthly International Tourist Arrivals and Its Risk in Nepal
31
National efforts to develop tourism infrastructures, for example, travel sites with modern recreational facilities (casinos, amusement parks, complex skyscrapers, and so on), is one of a number of feasible strategies to promote the tourism industry. However, abundance diversity of natural and cultural resources should not be overlooked and widely recognized as essential tourism assets for a country to develop its tourism industry. More specifically, tourist sites which are listed as World Heritage Sites by UNESCO are treated as catholicons in promoting the tourism industry (Yang, Lin, & Han, 2010). The adage “Atithi Devo Bhava” (guests is God)1 and "Atithi Satkar, Nepaliko Sanskar" (hospitality is Nepalese culture) deeply rooted in our culture. Hence, the unparalleled scenic beauty and landscape; cultural and artistic heritages are additional tourist attractions and the country become a popular destination all over the world (MOF, 2001).
II. LITERATURE SURVEY Most of the previous studies that were undertaken on the tourism subjects in Nepal were focused on policy, management; conflicts; energy and environmental issues. Adams focused on cultural approach to tourism capitalism considering Sherpa community (Adams, 1992). Shackley did research in upper mustang (a remote Village in the Himalaya region of Nepal) focusing on the management and socioeconomic aspects of tourism (Shackley, 1994). Hepburn, et al (2002) used ethnographic data, elaborated the ideas of Wittgenstein and Winch, and argues that tourism must be understood in terms of a range of touristic “forms of life” that encompass local cultural meanings (Hepburn, 2002). Additionally, (Nepal, 2000) argued that lack of sufficient management and coherent data, the ecological and environmental; socioeconomic and cultural problems associated with tourism industry will be significantly increased and the author pointed out population growth, poverty, environmental deterioration, and politics are certainly linked with tourism induced environmental problems (Nepal, 2000). Bhattarai et al (2005) mentioned that adventure tourism is a viable economic activity to develop remote areas, but the industry had faced many obstacles because of Maoist war and September 11 impacts, along with its dependency on foreign capital, uneven growth, monopolistic class character, and neglect of rural impoverishment are all preventing it from taking off (Bhattarai, Conway, & Shrestha, 2005). Nyaupane et al (2006) concentrated the study on community involvement and number/type of visitors on tourism impacts in controlled Annapurna region of Nepal and north-west Yunnan, China and explored that level of host involvement in management and number/type of tourists helped explain these destinations’ varying degrees of economic leakage, local control, and socio-economic inequity (Nyaupanea, Moraisb, & Dowlerc, 2006). Study on tourism and rural settlement in Nepal focusing on Annapurna region had been undertaken and concluded that the effects of international tourism on a remote Third
1 http://en.wikipedia.org/wiki/Atithi_Devo_Bhav
NRB ECONOMIC REVIEW 32
World destination are similar to the effects of counter urbanization as in Western countries and changes in the growth, distribution, hierarchies, and appearance of settlements in this region are no different than in other areas affected by increased urban–rural migration (Nepal, 2007). Similarly, research on tourism-induced rural energy consumption in the Annapurna region had been also carried out and findings showed that energy consumption patterns are influenced by altitude; accommodation capacity; energy cost; diversity of energy sources; access to energy-saving technologies; and institutional rules and regulations. The author also claimed that there is clear tourism-induced growth in accommodations and on changing characteristics (Nepal, 2008). The Khumbu Himal was influenced by tourism and modernization as a result, political, social, cultural, and economic factors affect the traditional Buddhist values (Bjønness, 1983). The Mt Everest region has become a premier international mountaineering and trekking destination and that had brought prosperity to many Sherpas. “It, however, had adverse impacts on landscape due to the tremendous growth in tourism since the early 1970s”(Byers, 1987). The majority of visitors were attracted by Nepal’s natural resources and exclusively, “these visitors came to trek in the mountains and for some combination of trekking, jungle safaris, river rafting or ethnic tourism” (Zurick, 1992). Nepal’s spectacular parks and reserves have attracted a large numbers of foreigners and it might be expected that these protected areas would be nurtured as valuable and unique economic assets. (Wells, 1993). The tourism industry requires an element of planning and control to limit the overall supply and location of accommodation, in order to protect the attractiveness of Pokhara as a destination and to secure the profitability of the industry (Pagdin (Divino J.A. and McAleer, 2009), 1995). The tourism industry has left the military and agricultural fields in the area unpopular because of the economic gap it has produced. Marginal social groups are vulnerable but elites are enjoying in Annapurna Region and there are some sign of return of migrated family from Lahure community in Ghandruk (Pandey, Chettri, Kunwar, & Ghimire, 1995). The two economies of Maldives and Nepal were dependent on tourism. Although these countries offer very different attractions to tourists, they are faced with similar problems in terms of adverse environmental impacts of tourism (Brown, Turner, Hameed, & Bateman, 1997). Paudyal studied the determinants of demand share of individual member states in total SAARC arrivals from seven major tourism markets and empirically demonstrated the interdependency among the SAARC countries and found that relative price and regional share are two important link factors for the individual states in the region (Paudyal, 2003).
III. SOURCES OF DATA AND NATURE OF STUDY Availability of data about various aspects of tourism in Nepal is still constrained as in other developing countries because of low capability of data generation and management. Data used for this study were gathered from the authorized sources namely, Government of Nepal, Ministry of Tourism and Civil Aviation, Nepal Tourism Board, and Government of Nepal, Central Bureau of Statistics. The nature of the data is explained in Appendix 2: Figures 2-4. This study is an attempt of quantitative analysis in Nepalese
Modelling Monthly International Tourist Arrivals and Its Risk in Nepal
33
tourism industry in terms of risk associated with international tourist arrivals and other theme, for instance, seasonality, tourism demand analysis, role of tourism in economic development etc. Thus, the purpose of this paper is to explore and model the present scenarios of international tourist arrivals and its volatility in Nepalese tourism industry. The government of Nepal had revised previous tourism policies and the tourism vision 2020 has already been issued. Therefore the findings of this study could be useful for policy implication.
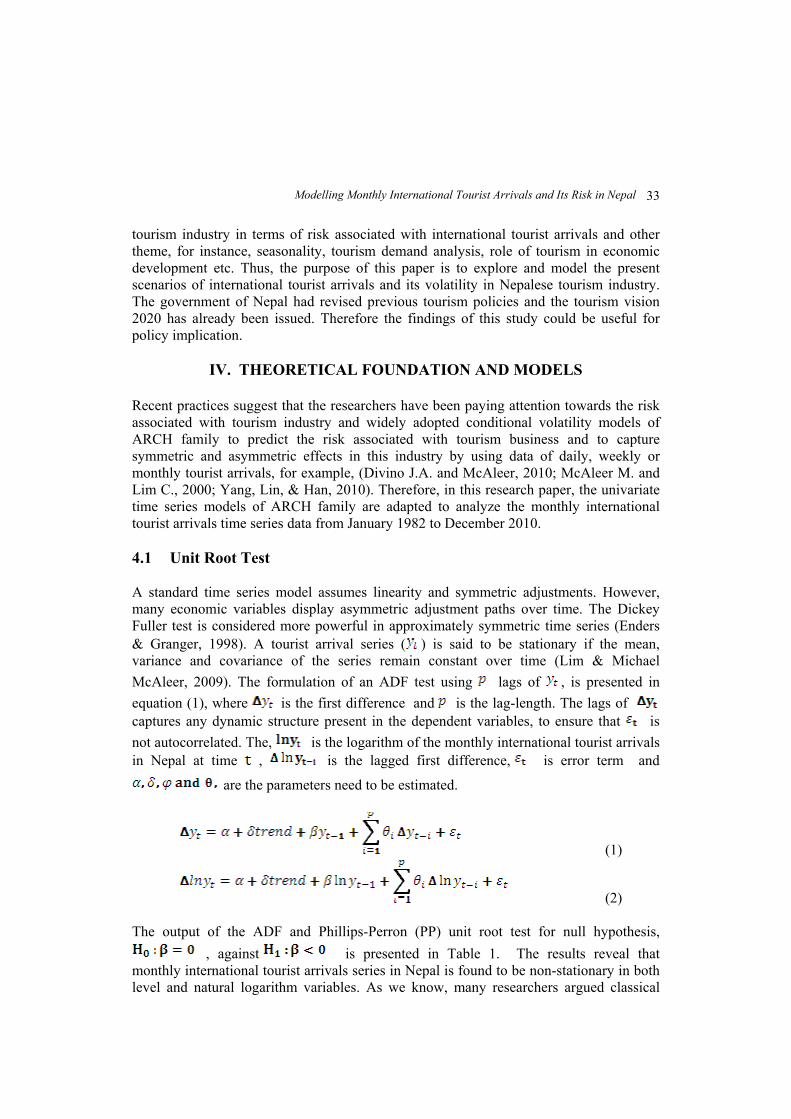
IV. THEORETICAL FOUNDATION AND MODELS Recent practices suggest that the researchers have been paying attention towards the risk associated with tourism industry and widely adopted conditional volatility models of ARCH family to predict the risk associated with tourism business and to capture symmetric and asymmetric effects in this industry by using data of daily, weekly or monthly tourist arrivals, for example, (Divino J.A. and McAleer, 2010; McAleer M. and Lim C., 2000; Yang, Lin, & Han, 2010). Therefore, in this research paper, the univariate time series models of ARCH family are adapted to analyze the monthly international tourist arrivals time series data from January 1982 to December 2010. 4.1 Unit Root Test A standard time series model assumes linearity and symmetric adjustments. However, many economic variables display asymmetric adjustment paths over time. The Dickey Fuller test is considered more powerful in approximately symmetric time series (Enders & Granger, 1998). A tourist arrival series ( ) is said to be stationary if the mean, variance and covariance of the series remain constant over time (Lim & Michael McAleer, 2009). The formulation of an ADF test using lags of , is presented in equation (1), where is the first difference and is the lag-length. The lags of captures any dynamic structure present in the dependent variables, to ensure that is not autocorrelated. The, is the logarithm of the monthly international tourist arrivals in Nepal at time , is the lagged first difference, is error term and
are the parameters need to be estimated.
(1)
(2) The output of the ADF and Phillips-Perron (PP) unit root test for null hypothesis,
, against is presented in Table 1. The results reveal that monthly international tourist arrivals series in Nepal is found to be non-stationary in both level and natural logarithm variables. As we know, many researchers argued classical
NRB ECONOMIC REVIEW 34
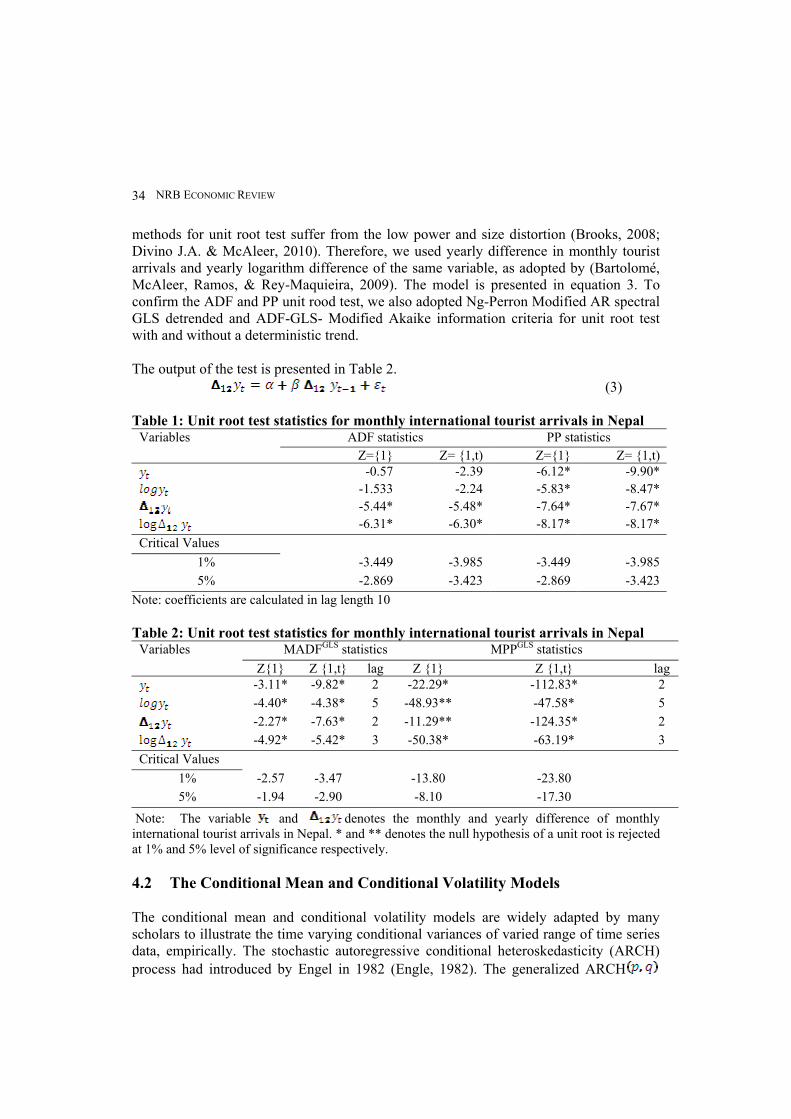
methods for unit root test suffer from the low power and size distortion (Brooks, 2008; Divino J.A. & McAleer, 2010). Therefore, we used yearly difference in monthly tourist arrivals and yearly logarithm difference of the same variable, as adopted by (Bartolomé, McAleer, Ramos, & Rey-Maquieira, 2009). The model is presented in equation 3. To confirm the ADF and PP unit rood test, we also adopted Ng-Perron Modified AR spectral GLS detrended and ADF-GLS- Modified Akaike information criteria for unit root test with and without a deterministic trend. The output of the test is presented in Table 2. (3) Table 1: Unit root test statistics for monthly international tourist arrivals in Nepal
ADF statistics PP statistics Variables Z={1} Z= {1,t) Z={1} Z= {1,t)
-0.57 -2.39 -6.12* -9.90* -1.533 -2.24 -5.83* -8.47* -5.44* -5.48* -7.64* -7.67*
-6.31* -6.30* -8.17* -8.17* Critical Values
1% -3.449 -3.985 -3.449 -3.985 5% -2.869 -3.423 -2.869 -3.423
Note: coefficients are calculated in lag length 10 Table 2: Unit root test statistics for monthly international tourist arrivals in Nepal
MADFGLS statistics MPPGLS statistics Variables Z{1} Z {1,t} lag Z {1} Z {1,t} lag
-3.11* -9.82* 2 -22.29* -112.83* 2 -4.40* -4.38* 5 -48.93** -47.58* 5 -2.27* -7.63* 2 -11.29** -124.35* 2
-4.92* -5.42* 3 -50.38* -63.19* 3 Critical Values
1% -2.57 -3.47 -13.80 -23.80 5% -1.94 -2.90 -8.10 -17.30
Note: The variable and denotes the monthly and yearly difference of monthly international tourist arrivals in Nepal. * and ** denotes the null hypothesis of a unit root is rejected at 1% and 5% level of significance respectively. 4.2 The Conditional Mean and Conditional Volatility Models The conditional mean and conditional volatility models are widely adapted by many scholars to illustrate the time varying conditional variances of varied range of time series data, empirically. The stochastic autoregressive conditional heteroskedasticity (ARCH) process had introduced by Engel in 1982 (Engle, 1982). The generalized ARCH
Modelling Monthly International Tourist Arrivals and Its Risk in Nepal
35
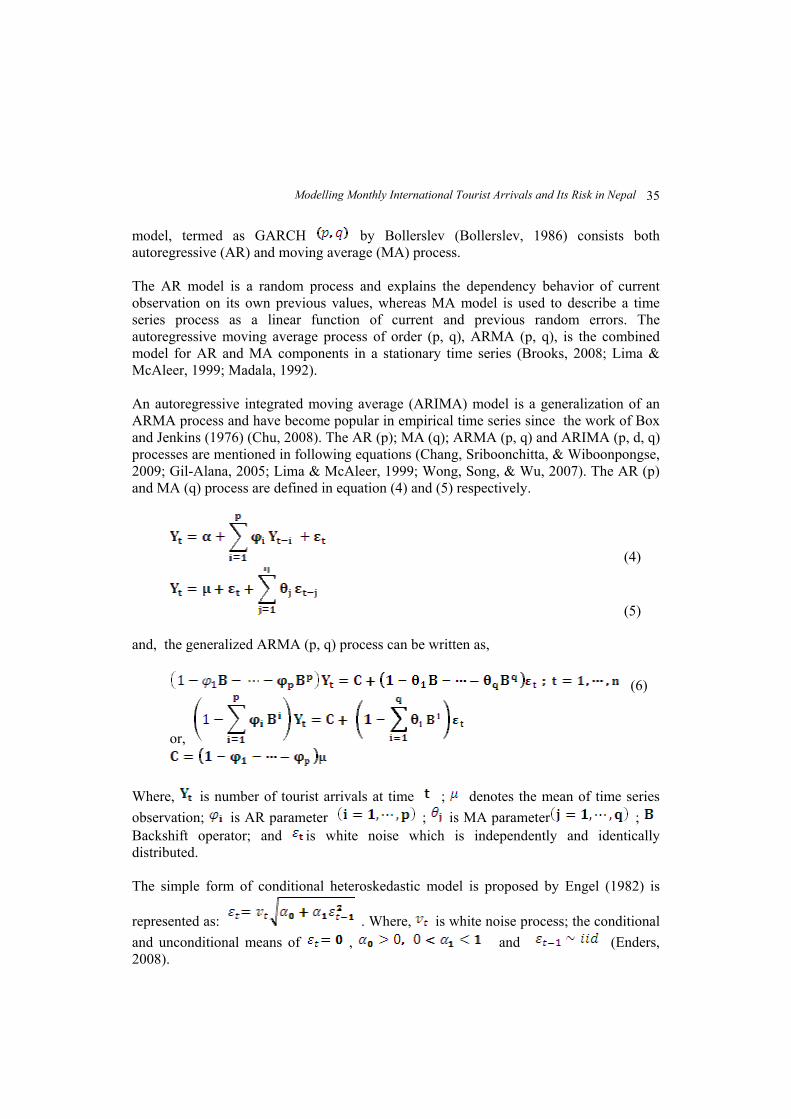
model, termed as GARCH by Bollerslev (Bollerslev, 1986) consists both autoregressive (AR) and moving average (MA) process. The AR model is a random process and explains the dependency behavior of current observation on its own previous values, whereas MA model is used to describe a time series process as a linear function of current and previous random errors. The autoregressive moving average process of order (p, q), ARMA (p, q), is the combined model for AR and MA components in a stationary time series (Brooks, 2008; Lima & McAleer, 1999; Madala, 1992). An autoregressive integrated moving average (ARIMA) model is a generalization of an ARMA process and have become popular in empirical time series since the work of Box and Jenkins (1976) (Chu, 2008). The AR (p); MA (q); ARMA (p, q) and ARIMA (p, d, q) processes are mentioned in following equations (Chang, Sriboonchitta, & Wiboonpongse, 2009; Gil-Alana, 2005; Lima & McAleer, 1999; Wong, Song, & Wu, 2007). The AR (p) and MA (q) process are defined in equation (4) and (5) respectively.
(4)
(5) and, the generalized ARMA (p, q) process can be written as,
(6)
or, Where, is number of tourist arrivals at time ; denotes the mean of time series observation; is AR parameter ; is MA parameter ; Backshift operator; and is white noise which is independently and identically distributed. The simple form of conditional heteroskedastic model is proposed by Engel (1982) is
represented as: . Where, is white noise process; the conditional and unconditional means of , and (Enders, 2008).
NRB ECONOMIC REVIEW 36
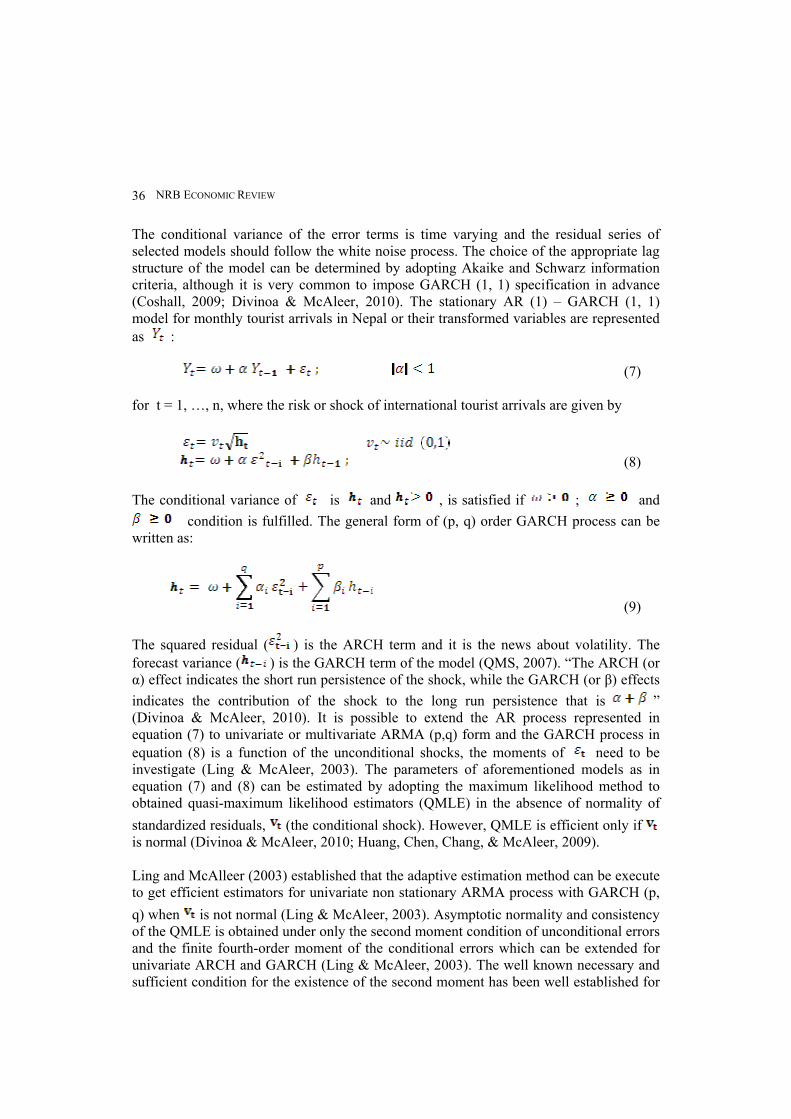
The conditional variance of the error terms is time varying and the residual series of selected models should follow the white noise process. The choice of the appropriate lag structure of the model can be determined by adopting Akaike and Schwarz information criteria, although it is very common to impose GARCH (1, 1) specification in advance (Coshall, 2009; Divinoa & McAleer, 2010). The stationary AR (1) – GARCH (1, 1) model for monthly tourist arrivals in Nepal or their transformed variables are represented as : (7) for t = 1, …, n, where the risk or shock of international tourist arrivals are given by (8) The conditional variance of is and , is satisfied if ; and
condition is fulfilled. The general form of (p, q) order GARCH process can be written as:
(9) The squared residual ( ) is the ARCH term and it is the news about volatility. The forecast variance ( ) is the GARCH term of the model (QMS, 2007). “The ARCH (or α) effect indicates the short run persistence of the shock, while the GARCH (or β) effects indicates the contribution of the shock to the long run persistence that is ” (Divinoa & McAleer, 2010). It is possible to extend the AR process represented in equation (7) to univariate or multivariate ARMA (p,q) form and the GARCH process in equation (8) is a function of the unconditional shocks, the moments of need to be investigate (Ling & McAleer, 2003). The parameters of aforementioned models as in equation (7) and (8) can be estimated by adopting the maximum likelihood method to obtained quasi-maximum likelihood estimators (QMLE) in the absence of normality of standardized residuals, (the conditional shock). However, QMLE is efficient only if is normal (Divinoa & McAleer, 2010; Huang, Chen, Chang, & McAleer, 2009). Ling and McAlleer (2003) established that the adaptive estimation method can be execute to get efficient estimators for univariate non stationary ARMA process with GARCH (p, q) when is not normal (Ling & McAleer, 2003). Asymptotic normality and consistency of the QMLE is obtained under only the second moment condition of unconditional errors and the finite fourth-order moment of the conditional errors which can be extended for univariate ARCH and GARCH (Ling & McAleer, 2003). The well known necessary and sufficient condition for the existence of the second moment has been well established for
Modelling Monthly International Tourist Arrivals and Its Risk in Nepal
37
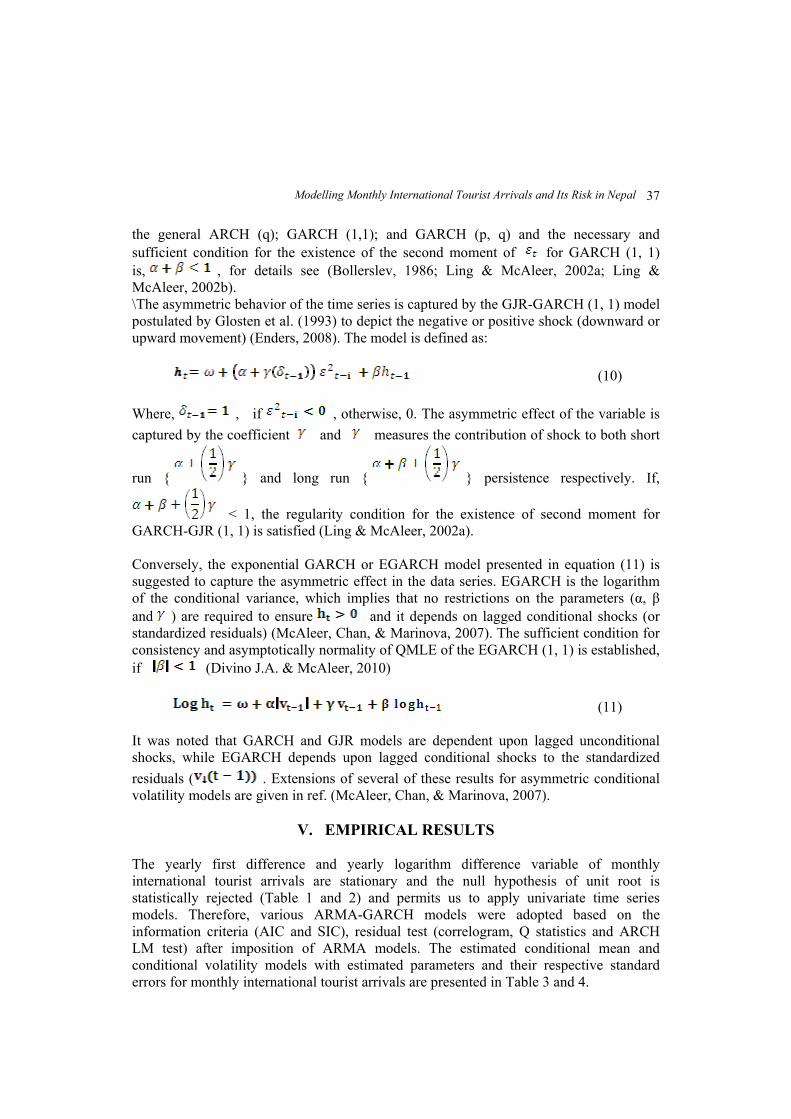
the general ARCH (q); GARCH (1,1); and GARCH (p, q) and the necessary and sufficient condition for the existence of the second moment of for GARCH (1, 1) is, , for details see (Bollerslev, 1986; Ling & McAleer, 2002a; Ling & McAleer, 2002b). \The asymmetric behavior of the time series is captured by the GJR-GARCH (1, 1) model postulated by Glosten et al. (1993) to depict the negative or positive shock (downward or upward movement) (Enders, 2008). The model is defined as: (10) Where, , if , otherwise, 0. The asymmetric effect of the variable is captured by the coefficient and measures the contribution of shock to both short
run { } and long run { } persistence respectively. If,
< 1, the regularity condition for the existence of second moment for GARCH-GJR (1, 1) is satisfied (Ling & McAleer, 2002a). Conversely, the exponential GARCH or EGARCH model presented in equation (11) is suggested to capture the asymmetric effect in the data series. EGARCH is the logarithm of the conditional variance, which implies that no restrictions on the parameters (α, β and ) are required to ensure and it depends on lagged conditional shocks (or standardized residuals) (McAleer, Chan, & Marinova, 2007). The sufficient condition for consistency and asymptotically normality of QMLE of the EGARCH (1, 1) is established, if (Divino J.A. & McAleer, 2010) (11) It was noted that GARCH and GJR models are dependent upon lagged unconditional shocks, while EGARCH depends upon lagged conditional shocks to the standardized residuals ( . Extensions of several of these results for asymmetric conditional volatility models are given in ref. (McAleer, Chan, & Marinova, 2007).
V. EMPIRICAL RESULTS The yearly first difference and yearly logarithm difference variable of monthly international tourist arrivals are stationary and the null hypothesis of unit root is statistically rejected (Table 1 and 2) and permits us to apply univariate time series models. Therefore, various ARMA-GARCH models were adopted based on the information criteria (AIC and SIC), residual test (correlogram, Q statistics and ARCH LM test) after imposition of ARMA models. The estimated conditional mean and conditional volatility models with estimated parameters and their respective standard errors for monthly international tourist arrivals are presented in Table 3 and 4.
NRB ECONOMIC REVIEW 38
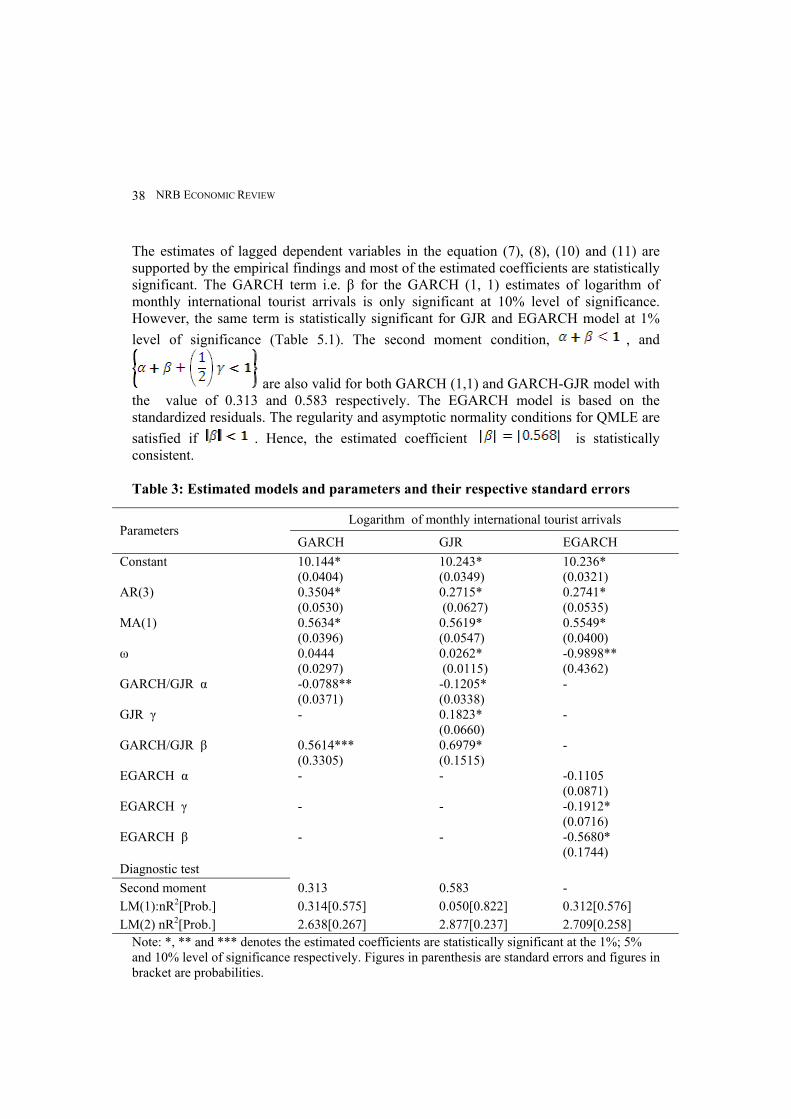
The estimates of lagged dependent variables in the equation (7), (8), (10) and (11) are supported by the empirical findings and most of the estimated coefficients are statistically significant. The GARCH term i.e. β for the GARCH (1, 1) estimates of logarithm of monthly international tourist arrivals is only significant at 10% level of significance. However, the same term is statistically significant for GJR and EGARCH model at 1% level of significance (Table 5.1). The second moment condition, , and
are also valid for both GARCH (1,1) and GARCH-GJR model with the value of 0.313 and 0.583 respectively. The EGARCH model is based on the standardized residuals. The regularity and asymptotic normality conditions for QMLE are satisfied if . Hence, the estimated coefficient is statistically consistent.
Table 3: Estimated models and parameters and their respective standard errors
Note: *, ** and *** denotes the estimated coefficients are statistically significant at the 1%; 5% and 10% level of significance respectively. Figures in parenthesis are standard errors and figures in bracket are probabilities.
Logarithm of monthly international tourist arrivals Parameters
GARCH GJR EGARCH Constant 10.144*
(0.0404) 10.243* (0.0349)
10.236* (0.0321)
AR(3) 0.3504* (0.0530)
0.2715* (0.0627)
0.2741* (0.0535)
MA(1) 0.5634* (0.0396)
0.5619* (0.0547)
0.5549* (0.0400)
ω 0.0444 (0.0297)
0.0262* (0.0115)
-0.9898** (0.4362)
GARCH/GJR α -0.0788** (0.0371)
-0.1205* (0.0338)
-
GJR γ - 0.1823* (0.0660)
-
GARCH/GJR β 0.5614*** (0.3305)
0.6979* (0.1515)
-
EGARCH α - - -0.1105 (0.0871)
EGARCH γ - - -0.1912* (0.0716)
EGARCH β - - -0.5680* (0.1744)
Diagnostic test Second moment 0.313 0.583 - LM(1):nR2[Prob.] 0.314[0.575] 0.050[0.822] 0.312[0.576] LM(2) nR2[Prob.] 2.638[0.267] 2.877[0.237] 2.709[0.258]
Modelling Monthly International Tourist Arrivals and Its Risk in Nepal
39
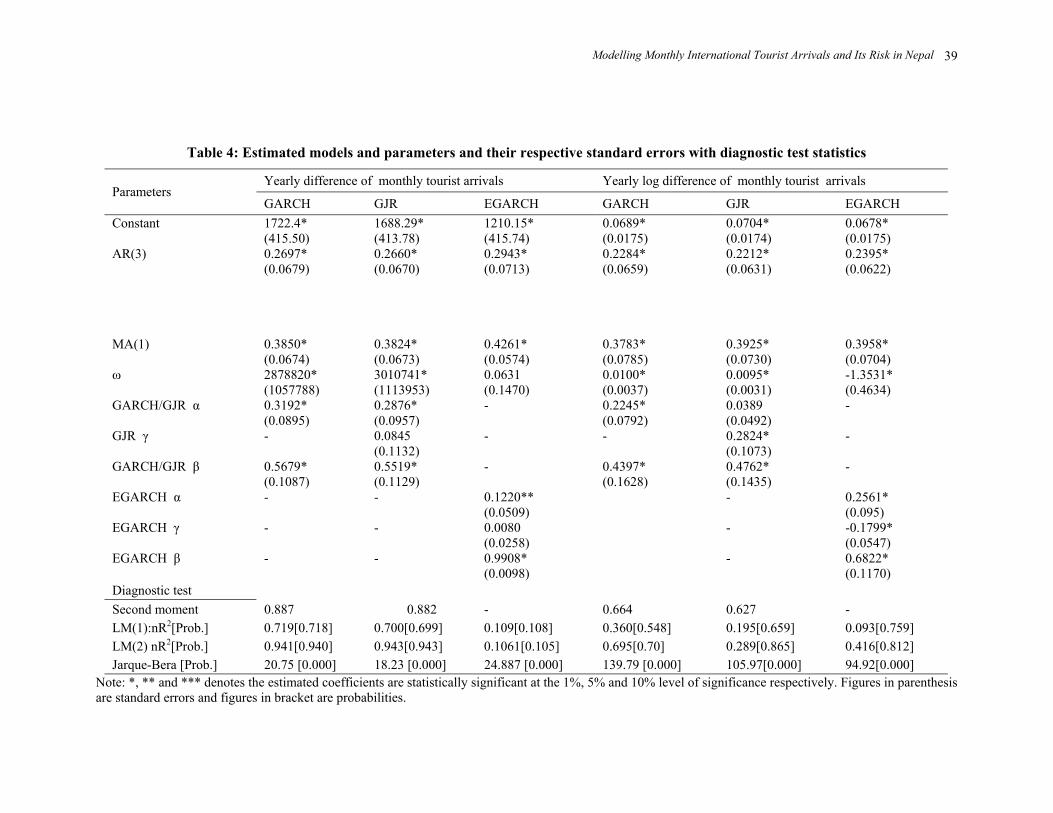
Table 4: Estimated models and parameters and their respective standard errors with diagnostic test statistics
Note: *, ** and *** denotes the estimated coefficients are statistically significant at the 1%, 5% and 10% level of significance respectively. Figures in parenthesis are standard errors and figures in bracket are probabilities.
Yearly difference of monthly tourist arrivals Yearly log difference of monthly tourist arrivals Parameters
GARCH GJR EGARCH GARCH GJR EGARCH Constant 1722.4*
(415.50) 1688.29* (413.78)
1210.15* (415.74)
0.0689* (0.0175)
0.0704* (0.0174)
0.0678* (0.0175)
AR(3) 0.2697* (0.0679)
0.2660* (0.0670)
0.2943* (0.0713)
0.2284* (0.0659)
0.2212* (0.0631)
0.2395* (0.0622)
MA(1) 0.3850* (0.0674)
0.3824* (0.0673)
0.4261* (0.0574)
0.3783* (0.0785)
0.3925* (0.0730)
0.3958* (0.0704)
ω 2878820* (1057788)
3010741* (1113953)
0.0631 (0.1470)
0.0100* (0.0037)
0.0095* (0.0031)
-1.3531* (0.4634)
GARCH/GJR α 0.3192* (0.0895)
0.2876* (0.0957)
- 0.2245* (0.0792)
0.0389 (0.0492)
-
GJR γ - 0.0845 (0.1132)
- - 0.2824* (0.1073)
-
GARCH/GJR β 0.5679* (0.1087)
0.5519* (0.1129)
- 0.4397* (0.1628)
0.4762* (0.1435)
-
EGARCH α - - 0.1220** (0.0509)
- 0.2561* (0.095)
EGARCH γ - - 0.0080 (0.0258)
- -0.1799* (0.0547)
EGARCH β - - 0.9908* (0.0098)
- 0.6822* (0.1170)
Diagnostic test Second moment 0.887 0.882 - 0.664 0.627 - LM(1):nR2[Prob.] 0.719[0.718] 0.700[0.699] 0.109[0.108] 0.360[0.548] 0.195[0.659] 0.093[0.759] LM(2) nR2[Prob.] 0.941[0.940] 0.943[0.943] 0.1061[0.105] 0.695[0.70] 0.289[0.865] 0.416[0.812] Jarque-Bera [Prob.] 20.75 [0.000] 18.23 [0.000] 24.887 [0.000] 139.79 [0.000] 105.97[0.000] 94.92[0.000]
NRB ECONOMIC REVIEW 40
Similarly, the estimated parameters of conditional mean and conditional volatility models for yearly first difference and yearly logarithm difference of the monthly international tourist arrivals are also statistically significant (Table 5.2). The GARCH (1, 1) estimates for both dependent variables (i.e. and ) of monthly international tourist arrivals in Nepal reveals that the short run persistence of shock or risk are 0.391 and 0.224, while the long run persistent of the risk i.e. , are 0.887 and 0.664 respectively and statistically significant at 1% level of significance. The second moment condition is also satisfied. Therefore, estimated QMLE are asymptotically normal. Additionally, the GARCH-GJR (1, 1) estimates demonstrate the asymmetry behavior of the positive or negative shocks of the monthly international tourist arrivals. The estimated coefficients are positive for GJR (1, 1). This results revels that there is more positive shock than negative shock in monthly international tourist arrivals in Nepal over the time and estimated parameter i.e. γ is not statistically significant for yearly first differenced variable. However, the γ is statistically significant for the variables and at 5% and 1% level of the significance respectively. The regularity and asymptotic
normality condition for consistent estimators of QMLE, i.e. , is also satisfied. As we know, the EGARCH (1, 1) is treated as the logarithm of the volatility and the coefficient, represent the magnitude (size effect), which is positive and statistically significant at 5% level of significance for yearly first difference and yearly log difference of monthly international tourist arrivals in Nepal. The coefficient is negative and statistically significant at 1% level of significance for logarithm and yearly log difference variables, while is not satisfied for yearly first differenced variables. The coefficient of the lagged dependent variable is estimated to be 0.568, 0.990, and 0.682 for logarithm, yearly first difference and yearly logarithm difference variables respectively and coefficient are statistically significant, which suggests that the statistical properties of the QMLE for EGARCH (1, 1) will be consistent and asymptotically normal.
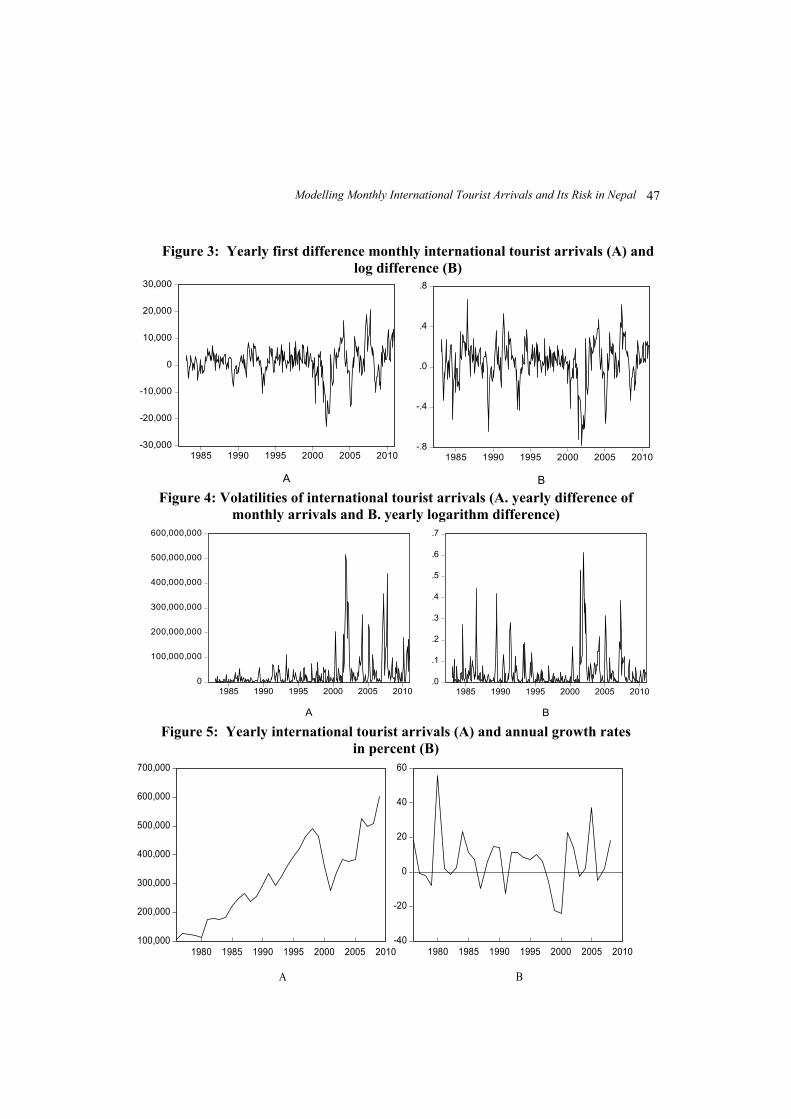
VI. CONCLUSION The natural heavenly landscape and biodiversity, the Mount Everest and high Himalayas, incomparable cultural heritage and other numerous peculiarities have made Nepal a potential tourist destination of the world. Explicitly, the country is also considered as a trekker’s paradise throughout the world. However, the pace for tourism development is still lagging behind as compared to other destinations of the world. The number of the international tourist arrivals in Nepal had been increased sharply by more than 13 folds during last forty years (45,970 in 1970 to 6,02,855 in 2010). The big shock in the annual growth rate of international tourist arrivals was experienced in 2001 and 2002 and the growth rate was dramatically fall down by 22.1 percent and 23.7 percent respectively. This could be because of the security as well as other adverse situation in the country. The overall average annual growth of international tourist arrivals in the country over the
Modelling Monthly International Tourist Arrivals and Its Risk in Nepal
41
last 40 years is about 6.65 percent per annum. The annual mean contribution of foreign receipt from tourism industry as a percentage of GDP was 2.67 percent during the last 35 years. The tourism sector provides a potential room to earn the foreign receipts and poverty reduction by creating employment opportunities. However, the tourism sector has not established as an important economic activity of the Nepalese economy, yet. The potential negative impacts of the international tourism needs to be investigated to administer future tourism demand appropriately. Therefore, it is necessary to model tourism growth over time and volatility of the arrivals to manage tourism industry as a business and for policy improvement. Empirically, the long run risk or volatility of international tourist arrivals is persistence in the Nepalese tourism industry based on the modeled symmetric and asymmetric conditional volatility models (GARCH, GJR and EGARCH) with exogenous ARMA (3, 1) terms. The estimated coefficients are statistically significant and the second moment condition for GARCH (1, 1) and GJR (1, 1) and |β|< 1 in case of EGARCH (1, 1) are satisfied for asymptotic normality of QMLE. Therefore, the volatility can be inferred as risk or uncertainty associated with international tourist arrivals in Nepalese tourism industry. These empirical results envisage sufficient room for intervening or amending the tourism policy to address the problems associated with Nepalese tourism industry and to harness the essence of tourism benefit by promoting tourism as a sustainable business. Further research on volatility by using daily data and extension of modeling considering spatial destination could be an important attempt for policy implications. The quantitative analysis of tourism demand in the Nepalese tourism industry including volatility modeling could be beneficial to translate the tourism policy in its real meaning.
NRB ECONOMIC REVIEW 42
REFERENCES
Adams, V. 1992. “Tourism and Sherpas, Nepal : Reconstruction of Reciprocity.” Annals of
Tourism Research, 19 (3): 534-554.
Arezki, R., Cherif, R., & Piotrowski, a. J. 2009. “Tourism Specialization and Economic Development: Evidence from the UNESCO World Heritage List.” IMF working Paper, WP/09/167: 1-22
Bartolomé, A., McAleer, M., Ramos, V., & Rey-Maquieira, J. 2009. “A risk map of international tourist regions in Spain.” Mathematics and Computers in Simulation 79 (9) : 2741–2758.
Bhattarai, K., Conway, D., & Shrestha, N. 2005. “Tourisim, Terrorism and Turmoil in Nepal.” Annals of Tourism Research 32 (3): 669–688.
Bjønness, I.-M. 1983. “External Economic Dependency and Changing Human Adjustment to Marginal Environment in the High Himalaya, Nepal.” Mountain Research and Development 3 (3) : 263-272.
Bollerslev, T. 1986. “Generalised Autoregressive Conditional Heteroscedasticity.” Journal of Econometrics 31 (3): 307-327.
Brooks, C. 2008. Introductory Econometrics for Finance. New York: Cambridge University Press.
Brown, K., Turner, R. K., Hameed, H., & Bateman, I. 1997. “Environmental Carrying Capacity and Tourism Development in the Maldives and Nepal.” Environmental Conservation 24 (3) : 316-325.
Byers, A. 1987. “An Assessment of Landscape change in the Khumbu Region of Nepal Using Repeat Photography.” Mountain Research and Development 7 (1) : 77-81.
Chang, C.-L., Sriboonchitta, S., & Wiboonpongse, A. 2009. “Modelling and Forecasting Tourism from East Asia to Thailand under Temporal and Spatial Aggregation.” Mathematics and Computers in Simulation 79 (5) :1730–1744.
Cho, V. 2003. “A Comparison of Three Different Approaches to Tourist Arrival Forecasting.” Tourism Managemen 24 (3): 323–330.
Chu, F.-L. 2008. “Analyzing and Forecasting Tourism Demand with ARAR Algorithm.” Tourism Management 29 (6) : 1185– 1196.
Coshall, J. T. 2009. “Combining Volatility and Smoothing Forecasts of UK Demand for International Tourism.” Tourism Management 30 (4) : 495–511.
Dahal, B. 2009. Adventure All the Way, Friday Suppliment . Kathmandu Nepal: Gorkhapatra Daily:http://www.gorkhapatra.org.np/detail.gopa.php? article_id=9891&cat_id=10.
Divinoa, J. A., & McAleer, M. 2010. “Modelling and Forecasting Daily International Mass Tourism to Peru.” Tourism Management 31 (6) : 846-854 .
Enders, W. 2008. Applied Econometrics Time Series (Second Edition). U.K: Wiley and Sons Inc.
Enders, W., & Granger, C. 1998. “Unit-root Test and Asymmetric Adjustment with an Example using the Term Structure of Interest Rates.” Journal of Business and Economic Statistics 16 (3) : 304-311.
Modelling Monthly International Tourist Arrivals and Its Risk in Nepal
43
Engle, R. F. 1982. “Autoregressive Conditional Heteroskedasticity with Estimates of the Varience of United Kingdom Inflation.” Econometrica 50 (4) : 987-1007.
Gil-Alana, L. 2005. “Modelling International Monthly Arrivals using Seasonal Univariate Long-memory Processes.” Tourism Management 26 (6) : 867–878.
Hepburn, S. J. 2002. “Touristic Forms of Life in Nepal.” Annals of Tourism Research 29 (3): 611–630.
Himalaya. (2008, December 15). Boris Lissanevitch – Pioneer of Nepalese Tourism Industry. Retrieved November 5, 2010, from Explore Himalaya: http://www.explorehimalaya. com/blog/boris-lissanevitch-pioneer-nepalese-tourism-industry/ 05 Nov 2009
Huang, B.-W., Chen, M.-G., Chang, C.-L., & McAleer, M. 2009. “Modelling Risk in Agricultural Finance: Application to the Poultry Industry in Taiwan.” Mathematics and Computers in Simulation 79 (5) : 1472-1487.
Lim, C., & Michael McAleer, J. C. 2009. “ARMAX Modelling of International Tourism Demand.” Mathematics and Computers in Simulation 79 (9) : 2879–2888.
Lim, C., & McAleer, M. 1999. "A Seasonal Analysis of Malaysian Tourist Arrivals to Australia." Mathematics and Computers in Simulation 48 (4-6) : 573-583.
Ling, S. & McAleer, M. 2003. "Asymptotic Theory for a Vector ARMA–GARCH Model." Econometric Theory 19 (02): 278–308.
Ling, S., & McAleer, M. 2002b. "Necessary and Sufficient Moment Conditions for the GARCH (p,q) and Asymmetric Power GARCH (p, q) Models." Econometric Theory 18(03):722-729.
Ling, S., & McAleer, M. 2002a. "Stationarity and the Existence of Moments of a Family of GARCH Processes." Journal of Econometrics 106(1) : 109–117.
Maddala, G. 1992. Introduction to Econometrics (Vol. II edition). New York: Macmilian Publishing Company.
McAleer b, M., Chan, F., & Marinova, D. 2007. "An Econometric Analysis of Asymmetric Volatility: Theory and Application to Patents." Journal of Econometrics 139 (2): 259-284.
McAleer M. and Lim C. 2000. A Seasonal Analysis of Asian Tourists Arrivals to Australia. Applied Economics 32 (4) : 499–509.
MOF. 2001. Economic Survey. Kathmandu: Government of Nepal, Ministry of Finance (MOF); Shinga Durbar, Nepal
MOF. 2009. Economic Survey. Kathmandu: Government of Nepal, Ministry of Finance, Shingha Durbar, Nepal
Nepal, S. K. 2007. "Tourism and Rural Settlements Nepal's Annapurna Region." Annals of Tourism Research 34 (4) : 855–875.
Nepal, S. K. 2000. "Tourism in Protected Areas: the Nepalese Himalaya." Annals of Tourism Research 27 (3): 661-681.
Nepal, S. K. 2008. "Tourism-induced Rural Energy Consumption in the Annapurna Region of Nepal." Tourism Management 29 (1) : 89–100.
NTB. 2009. Nepal Tourism Year 2011. Kathmandu: Secretariate of Nepal Tourism Year 2011, Nepal Tourism Board, Tourism Service Centre.
NRB ECONOMIC REVIEW 44
Nyaupanea, G. P., Moraisb, D. B., & Dowlerc, L. 2006. "The Role of Community Involvement and Number/type of Visitors on Tourism Impacts: A Controlled Comparison of Annapurna, Nepaland Northwest Yunnan, China." Tourism Management 27 (6) : 1373–1385.
Pagdin, C. 1995. Assessing Tourism Impacts in the Third World:a Nepal Case Study. Progress in Planning, Elsevier Science Ltd , 44; No 3, pp.185-266.
Pandey, R. N., Chettri, P., Kunwar, R. R., & Ghimire, G. 1995. The Effects of Tourism on Culture and The Environment Nepal. Bangkok: UNESCO Principal Regional Office for Asia and the Pacific, Thailand.
Paudyal, S. 2003. "Applicability of Smeral's Model in Explaining Tourism Share of Member States in SAARC Region." Economic Review: Occasional Paper 15: 58-69.
QMS. 2007. User's Guide Eviews 6. Irvine, CA 92612-2621, USA.
Seddighi, H., & Theocharous, A. 2002. "A Model of Tourism Destination Choice: A Theoretical and Empirical Analysis." Tourism Management 23 (5) : 475-487.
Shackley, M. 1994. "The Land of Lo, Nepal/Tibet : The First Eight Months of Tourism." Tourism Management 15 (1) : 17-26.
Stanley, F. S. 1993. "Tourism, Change and Continutity in the Mount Everest Region, Nepal." The Geographical Review 83 (4) : 410-427.
UNWTO. (2009a). Historical Perspective of World Tourism. World Tourism Organization (UNWTO)) Retrieved November 23, 2009, from http://www.unwto.org/facts/eng/ historical.htm
UNWTO. (2009b). 2009 Tourism Forcast Marked by Uncertainty. 7 (1).
Wells, M. P. 1993. "Neglect of Biological Riches: The Economics of Nature Tourism in Nepal." Biodiversity and Consevation 2 (4) : 445-464.
Werner, C. 2003. "The New Silk Road: Mediators and Tourism Development in Central Asia." Ethnology 42 (2) : 141-159.
Wikipedia. 2010. Autoregressive Moving Average Model. (Wikipedia:The free encyclopedia) Retrieved 01 20, 2010, from Wikipedia:The free encyclopedia: http://en.wikipedia.org/wiki/ Autoregressive_moving_average_model
Wong, K. K., Song, H., & Wu, S. F. 2007. "Tourism Forecasting: To Combine or not to Combine?" Tourism Management 28(4): 1068–1078.
Yang, C.-H., Lin, H.-L., & Han, C.-C. 2010. "Analysis of International Tourist Arrivals in China: The Role ofWorld Heritage Sites." Tourism Management 31 (6) : 827–837.
Zurick, D. 1992. "Adventure Travel and Sustainable Tourism in the Peripheral Economy of Nepal." Annals of the Association of American Geographers 82(4) : 608–28.
Modelling Monthly International Tourist Arrivals and Its Risk in Nepal
45
Appendix 1 : Tables
Table 1: Number of International Tourist Arrivals in Nepal*
Year S.N. Nationality 2009 2010Change
(%) Share in 2010
out of total (%) 1 Australia and Territories 17,900 19,716 10.15 3.27 2 European 96,009 111,309 15.94 18.46 3 U.S.A and Canada 41,008 47,387 15.56 7.86 4 U.K 35,382 35,539 0.44 5.90 5 SARC (except India) 55,713 71,239 27.87 11.82 6 India 93,884 116,321 23.90 19.30 7 Other Asian 120,934 137,537 13.73 22.81 8 Others 49,126 63,807 29.88 10.58
Total 509,956 602,855 18.22 100.00 * Table summarized by Author and data source: (MTCA, 2010)
Table 2: Foreign exchange earnings from tourism Year Value of foreign exchange
earnings from Tourism (NRs. Billion)*
Percent of merchandise value exports
Percent of value of exports of goods and non-factor services
Percent of foreign exchange
earnings 2004/05 10.464 17.5 12.2 6.1 2005/06 95.56 15.5 10.9 4.6 2006/07 10.125 16.1 10.7 4.5 2007/08 18.653 30.1 17.9 6.7 2008/09 27.960 40.0 22.8 6.5 2009/10** 16.767 40.0 23.1 6.0
* Currency exchange: 1US $= Approx. NRs. 71- 72.00 and ** First eight months figure of FY 2009/10, Data Source: Economic Survey (MOF, 2009/10)
Table 3: Summary statistics of monthly international tourist arrivals in Nepal
S.N. Name of Statistics Statistics 1 Mean 28876.60 2 Median 27263.00 3 Maximum 79186.00 4 Minimum 7901.00 5 Std. Dev 12441.44 6 Skewness 0.943 7 Kurtosis 4.153 8 Jarque-Bera 70.92 9 Probability 0.000
10 Observations 348
NRB ECONOMIC REVIEW 46
Appendix 2: Figures
Figure 1: Total value of foreign exchange earnings from tourism industry
as a percent of GDP in between 1975/76 and 2009/10.
Figure 2: Monthly international tourist arrivals in Nepal (A. Raw data and B. natural logarithm) in between Jan. 1982 and Dec. 2010
8.8
9.2
9.6
10.0
10.4
10.8
11.2
1985 1990 1995 2000 2005 2010
B
0
20,000
40,000
60,000
80,000
1985 1990 1995 2000 2005 2010
A
Modelling Monthly International Tourist Arrivals and Its Risk in Nepal
47
Figure 3: Yearly first difference monthly international tourist arrivals (A) and
log difference (B)
-30,000
-20,000
-10,000
0
10,000
20,000
30,000
1985 1990 1995 2000 2005 2010
A
-.8
-.4
.0
.4
.8
1985 1990 1995 2000 2005 2010
BFigure 4: Volatilities of international tourist arrivals (A. yearly difference of
monthly arrivals and B. yearly logarithm difference)
0
100,000,000
200,000,000
300,000,000
400,000,000
500,000,000
600,000,000
1985 1990 1995 2000 2005 2010
A
.0
.1
.2
.3
.4
.5
.6
.7
1985 1990 1995 2000 2005 2010
B
Figure 5: Yearly international tourist arrivals (A) and annual growth rates in percent (B)
-40
-20
0
20
40
60
1980 1985 1990 1995 2000 2005 2010
B
100,000
200,000
300,000
400,000
500,000
600,000
700,000
1980 1985 1990 1995 2000 2005 2010
A