modeling the performance of the anaerobic phased solids digester system for biogas energy production
TRANSCRIPT
b i om a s s a n d b i o e n e r g y 3 5 ( 2 0 1 1 ) 1 2 6 3e1 2 7 2
Avai lab le a t www.sc iencedi rec t .com
ht tp : / /www.e lsev ier . com/ loca te /b iombioe
Modeling the performance of the anaerobic phased solidsdigester system for biogas energy production
Joshua L. Rapport a,*, Ruihong Zhang a, Bryan M. Jenkins a, Bruce R. Hartsough a,Thomas P. Tomich b
aDepartment of Biological and Agricultural Engineering, University of California at Davis, 1 Shields Avenue, Davis,
CA 95616, USAbAgricultural Sustainability Institute, University of California at Davis, 1 Shields Avenue, Davis, CA 95616, USA
a r t i c l e i n f o
Article history:
Received 27 October 2009
Received in revised form
14 December 2010
Accepted 15 December 2010
Available online 20 January 2011
Keywords:
Anaerobic digestion
Biogas
CNG
Waste treatment
Financial modeling
Renewable energy
* Corresponding author. Tel.: þ1 (530) 752 01E-mail addresses: [email protected]
[email protected] (B.R. Hartsough),0961-9534/$ e see front matter ª 2010 Publidoi:10.1016/j.biombioe.2010.12.021
a b s t r a c t
Aprocessmodelwasdevelopedtopredict themassandenergybalancefora full-scale (115 t d�1)
high-solids anaerobic digester using research data from lab and pilot scale (1e3000 kg d�1wet
waste) systems.Costs and revenueswere estimated in consultationwith industry partners and
the 20-year project cash flow, net presentworth (NPW), simple payback, internal rate of return,
andrevenuerequirementswerecalculated.TheNPWwasusedtocomparescenarios inorder to
determine thefinancial viabilityof using a generator for heat andelectricityor apressure swing
adsorption unit for converting biogas to compressed natural gas (CNG).
The full-scale digester consisted of five 786 m3 reactors (one biogasification reactor and
four hydrolysis reactors) treating a 50:50 mix (volatile solids basis) of food and green waste,
of which 17% became biogas, 32% residual solids, and 51% wastewater. The NPW of the
projects were similar whether producing electricity or CNG, as long as the parasitic energy
demand was satisfied with the biogas produced. When producing electricity only, the
power output was 1.2 MW, 7% of which was consumed parasitically. When producing CNG,
the system produced 2 hm3 y�1 natural gas after converting 22% of the biogas to heat and
electricity which supplied the parasitic energy demand. The digester system was finan-
cially viable whether producing electricity or CNG for discount rates of up to 13% y�1
without considering debt (all capital was considered equity), heat sales, feed-in tariffs or
tax credits.
ª 2010 Published by Elsevier Ltd.
1. Introduction scale MSW digesters in the U.S. has been attributed to low
Anaerobic digestion (AD) has been used throughout the U.S.,
primarily to treat agricultural and municipal wastewater [1].
Inmany European countries and in parts of Australia, Canada,
and Japan, full-scale digesters have begun treating municipal
solid waste (MSW) over last 10e20 years [1]. The lack of full-
02; fax: þ1 (530) 752 2640(J.L. Rapport), rhzhang@
[email protected] (Tshed by Elsevier Ltd.
tipping fees, high costs, and limited governmental support.
However, those conditions appear to be changing. In Cal-
ifornia, state regulations have mandated increased diversion
of waste from landfills since 1999, and the recent passage of
the Global Warming Solutions Act [2] may make AD an
attractive option for controlling greenhouse gas emissions
.ucdavis.edu (R. Zhang), [email protected] (B.M. Jenkins),.P. Tomich).
Nomenclature
A reactor surface area (m2)
Acf after-tax cash flow ($ y�1)
EC capital expenses ($ y�1)
CG generator capital cost ($)
CP heat capacity (kJ kg �1 K�1)
EO ordinary expenses ($ y�1)
EG generator operating expenses ($ y�1)
fMCPC moisture content of press cake (% wet basis)
h heat transfer coefficient (Wm�2 K�1)
M depreciation ($ y�1)
Mbg molar mass of biogas (gmol�1)
mBGd mass of dry biogas produced (t)
mf mass of feedstock (t)
MH2O molar mass of water (gmol�1)
mMC mass of water in feedstock (t)
mPC mass of press cake (t)
mTS mass of total solids in feedstock (t)
mVS mass of volatile solids in the feedstock (t)
mWV mass of water vapor exiting via biogas (t)
mWW mass of wastewater (t)
PSat(Tamb) saturation pressure of water vapor at ambient
temperature (kPa)
PSat(Tr) saturation pressure of water vapor at the reactor
temperature (kPa)
Pstd standard pressure (101.325 kPa)
Qf heat required for heating a fixedmass of feedstock
(kWh)
Ql heat loss rate (W)
R revenues ($ y�1)
Rgas gas constant (8.315 Pam3mol�1 K�1)
Rval insulation thermal resistance (m2 KW�1)
Tamb ambient air temperature (K)
TF federal income tax rate (%)
tG annual duration of generator operation (h y�1)
TI income taxes ($ y�1)
Tr internal reactor temperature (K)
TS state income tax rate (%)
Tstd standard temperature (273 K)
VBGamb volume of wet biogas after condensation (m3)
WG generator size (kW)
Y volumetric dry biogas yield (m3 t�1 VS); all gas
volumes were normalized to standard
temperature (Tstd) and pressure (Pstd)
hPC solid/liquid separation solids recovery efficiency
(% of dry total solids recovered)
b i om a s s an d b i o e n e r g y 3 5 ( 2 0 1 1 ) 1 2 6 3e1 2 7 21264
from organic waste treatment while producing renewable
energy.
Researchers at the University of California at Davis, CA (UC
Davis) have built a 3 t d�1 two-stage AD system known as the
Anaerobic Phased Solids (APS) Digester capable of degrading
organic matter with low moisture content [3e5]. Past studies
of the APS Digester found the system to be marginal
economically according to cash flow and revenue requirement
models using preliminary cost estimates, but the results were
highly sensitive to the assumed tipping fees and capital and
operating costs which may have been overestimated [6,7]. A
more recent cost estimate was used for the current model
which was designed to calculate the net present worth (NPW)
and internal rate of return (IRR) as well as the cost of energy
(COE) and cost of waste treatment (COT). For this study, the
aim of the research was to model and evaluate the economic
performance and mass and energy balance of a full-scale APS
Digester, assuming the biogas was used either for electricity
generation with heat recovery or as a compressed natural gas
substitute (CNG). A pressure swing adsorption (PSA) unit
containing a carbon molecular sieve that can remove most of
the carbon dioxide (CO2) and many other trace contaminants
was included in the model. This technology, originally devel-
oped for the natural gas industry, has been used for upgrading
landfill gas to renewable natural gas [8]. A separate H2S
scrubber was also included.
2. Assumptions and calculations used todevelop the model
The purpose of this study was to determine the mass balance
and energy input required for a consistent digester size and
feedstock quality and then compare the energy balance and
financial performance of different biogas usage configurations.
The design of the APS digester has been described previously
[3,9e11]. The system consists of four equally sized hydrolysis
reactors fed solidwaste in phased batches. A recirculation loop
continuously feeds the single biogasification reactor with
leachate from the hydrolysis reactors and recycles inoculum
and undigested material from the biogasification reactor. The
pilot-scale system used as the basis for the theoretical scale up
was developed to treat 3e8 t d�1 of the organic fraction of
municipal solidwaste (OFMSW). For this study, a full-scale APS
Digester was modeled treating 115 t d�1 of a 1:1 mixture (vola-
tile solids basis) of food and green waste based on the average
characteristics and biodegradability of the separate feeds
(Table 1). Samples of food and green waste from municipal
sources in the Bay Area of California have been characterized
and tested separately and together in bench-scale batch and
continuous APS anaerobic digestion trials [12e14]. A model,
implemented inMicrosoft Excel�, was used to size the digester,
calculate themassandenergybalance, andestimate thecapital
and operating costs, revenues and financial performance of the
system.
2.1. APS digester system design
The APS digester system as modeled here included a feed
hopper capable of auguring pre-sorted food and green wastes
into a chopper pump for delivery into one of four hydrolysis
reactors. Two additional chopper pumps were included for
mixing the hydrolysis reactors, and one additional pump was
included formixing the biogasification reactor and transferring
leachate between reactors. A hydrogen sulfide scrubbing and
passive water removal system would be included in all system
designs. A boiler was included in each system in order to
provide heat as needed when recovered heat from the
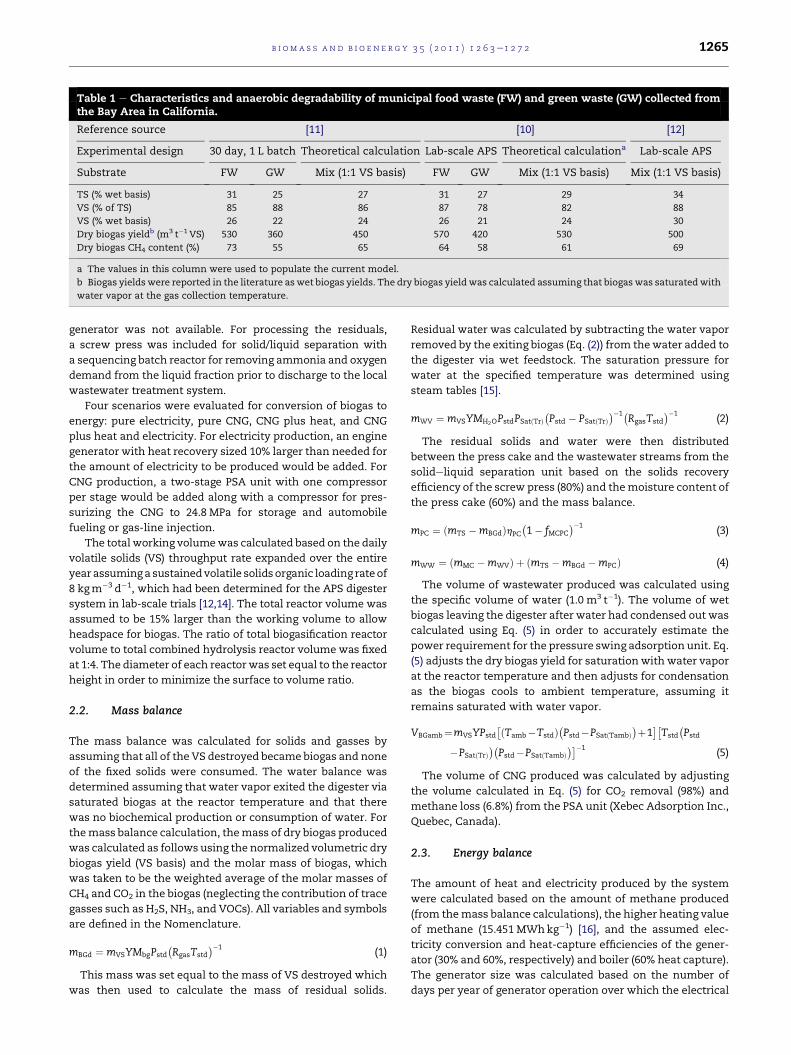
Table 1 e Characteristics and anaerobic degradability of municipal food waste (FW) and green waste (GW) collected fromthe Bay Area in California.
Reference source [11] [10] [12]
Experimental design 30 day, 1 L batch Theoretical calculation Lab-scale APS Theoretical calculationa Lab-scale APS
Substrate FW GW Mix (1:1 VS basis) FW GW Mix (1:1 VS basis) Mix (1:1 VS basis)
TS (% wet basis) 31 25 27 31 27 29 34
VS (% of TS) 85 88 86 87 78 82 88
VS (% wet basis) 26 22 24 26 21 24 30
Dry biogas yieldb (m3 t�1 VS) 530 360 450 570 420 530 500
Dry biogas CH4 content (%) 73 55 65 64 58 61 69
a The values in this column were used to populate the current model.
b Biogas yields were reported in the literature aswet biogas yields. The dry biogas yield was calculated assuming that biogas was saturatedwith
water vapor at the gas collection temperature.
b i om a s s a n d b i o e n e r g y 3 5 ( 2 0 1 1 ) 1 2 6 3e1 2 7 2 1265
generator was not available. For processing the residuals,
a screw press was included for solid/liquid separation with
a sequencing batch reactor for removing ammonia and oxygen
demand from the liquid fraction prior to discharge to the local
wastewater treatment system.
Four scenarios were evaluated for conversion of biogas to
energy: pure electricity, pure CNG, CNG plus heat, and CNG
plus heat and electricity. For electricity production, an engine
generator with heat recovery sized 10% larger than needed for
the amount of electricity to be produced would be added. For
CNG production, a two-stage PSA unit with one compressor
per stage would be added along with a compressor for pres-
surizing the CNG to 24.8 MPa for storage and automobile
fueling or gas-line injection.
The total working volumewas calculated based on the daily
volatile solids (VS) throughput rate expanded over the entire
year assuminga sustainedvolatile solidsorganic loading rate of
8 kgm�3 d�1, which had been determined for the APS digester
system in lab-scale trials [12,14]. The total reactor volume was
assumed to be 15% larger than the working volume to allow
headspace for biogas. The ratio of total biogasification reactor
volume to total combined hydrolysis reactor volume was fixed
at 1:4. The diameter of each reactorwas set equal to the reactor
height in order to minimize the surface to volume ratio.
2.2. Mass balance
The mass balance was calculated for solids and gasses by
assuming that all of the VS destroyed became biogas and none
of the fixed solids were consumed. The water balance was
determined assuming that water vapor exited the digester via
saturated biogas at the reactor temperature and that there
was no biochemical production or consumption of water. For
themass balance calculation, themass of dry biogas produced
was calculated as follows using the normalized volumetric dry
biogas yield (VS basis) and the molar mass of biogas, which
was taken to be the weighted average of the molar masses of
CH4 and CO2 in the biogas (neglecting the contribution of trace
gasses such as H2S, NH3, and VOCs). All variables and symbols
are defined in the Nomenclature.
mBGd ¼ mVSYMbgPstd
�RgasTstd
��1(1)
This mass was set equal to the mass of VS destroyed which
was then used to calculate the mass of residual solids.
Residual water was calculated by subtracting the water vapor
removed by the exiting biogas (Eq. (2)) from thewater added to
the digester via wet feedstock. The saturation pressure for
water at the specified temperature was determined using
steam tables [15].
mWV ¼ mVSYMH2OPstdPSatðTrÞ�Pstd � PSatðTrÞ
��1�RgasTstd
��1(2)
The residual solids and water were then distributed
between the press cake and the wastewater streams from the
solideliquid separation unit based on the solids recovery
efficiency of the screw press (80%) and themoisture content of
the press cake (60%) and the mass balance.
mPC ¼ ðmTS �mBGdÞhPC
�1� fMCPC
��1(3)
mWW ¼ ðmMC �mWVÞ þ ðmTS �mBGd �mPCÞ (4)
The volume of wastewater produced was calculated using
the specific volume of water (1.0 m3 t�1). The volume of wet
biogas leaving the digester after water had condensed out was
calculated using Eq. (5) in order to accurately estimate the
power requirement for the pressure swing adsorption unit. Eq.
(5) adjusts the dry biogas yield for saturation with water vapor
at the reactor temperature and then adjusts for condensation
as the biogas cools to ambient temperature, assuming it
remains saturated with water vapor.
VBGamb¼mVSYPstd
�ðTamb�TstdÞ�Pstd�PSatðTambÞ
�þ1��Tstd
�Pstd
�PSatðTrÞ��Pstd�PSatðTambÞ
���1(5)
The volume of CNG produced was calculated by adjusting
the volume calculated in Eq. (5) for CO2 removal (98%) and
methane loss (6.8%) from the PSA unit (Xebec Adsorption Inc.,
Quebec, Canada).
2.3. Energy balance
The amount of heat and electricity produced by the system
were calculated based on the amount of methane produced
(from themass balance calculations), the higher heating value
of methane (15.451 MWhkg�1) [16], and the assumed elec-
tricity conversion and heat-capture efficiencies of the gener-
ator (30% and 60%, respectively) and boiler (60% heat capture).
The generator size was calculated based on the number of
days per year of generator operation over which the electrical
b i om a s s an d b i o e n e r g y 3 5 ( 2 0 1 1 ) 1 2 6 3e1 2 7 21266
capacitywould be produced (nominally 90% or 329 d y�1). Feed
heating was modeled by assuming the food and green waste
would be heated from the mean annual ambient temperature
to the reactor temperature, assuming the heat capacity of the
feedstock was temperature independent over the small range
of temperatures to which it was exposed.
Qf ¼ mfCpðTr � TambÞ�0:2778 kWh MJ�1
�(6)
Theheat capacity of the feedstockwas assumed to equal that
of water (4.0 kJ kg�1 K�1). The 2007 mean annual temperature
for California was 289 K, according to the National Climatic
Data Center, which was used as the ambient temperature for
this model. The average reactor temperature was 328 K.
Heat losses were calculated using an idealized lumped
model which assumed that reactor contents were homoge-
neous, isotropic, and well mixed, the effects of radiation and
biochemical heat generationwere negligible, and therewas no
contact resistance between surfaces. Heat loss through the
pipes was not included. Heat loss through the heat exchanger
was included in the heat recovery factor of the boiler. The rate
of heat loss was modeled by setting the heat conduction from
the inner wall through the insulation equal to the heat
convection from the outer reactor wall into the ambient air,
resulting in the following equation:
Ql ¼ R�1valh
�R�1val þ h
��1AðTr � TambÞ (7)
The reactor surface areawas calculated based on the system
design. The insulation’s thermal resistancewas assumed to be
that of one-inch thick polyurethane foam as reported by the
manufacturer (1.74 m2 KW�1). The heat transfer coefficient
was nominally estimated to be 50 Wm�2 K�1 as an aggregate
annual average, although this would change depending on
reactor configuration, materials, and site conditions. It was
assumed that the capacity factor applied only to loading, and
that the reactor temperature would be maintained even if the
capacity factor were less than100%. Therefore, the annual
maintenance heat requirement was calculated by extending
the heat loss rate over 365 days, regardless of the actual
number of operational days. The feed heat, however, was
a function of the capacity factor which determined the total
amount of feedstock loaded in a year.
The electrical consumption of the feedstock handling,
circulation, andmixing systems was 2.030 MWhd�1, based on
the pumps’ power ratings and expected durations of operation
as designed by Onsite Power Systems, Inc. This was assumed
to be a function of the capacity factor. The electrical require-
ment for the PSA unit was based on the electrical requirement
of the three compressors required: two for purifying the
biogas (0.116 kWhm�3 each) and one for storing it at the CNG
fueling station pressure of 24.8 MPa (0.212 kWhm�3). The
storage compressor power rating was adjusted for the reduc-
tion in gas volume during purification and combined with the
purification compressors to generate a lumped electrical
power rating per unit volume of biogas processed for the PSA
unit of 0.348 kWhm�3.
2.4. Financial performance
The results of themass and energy balance were fed into the cost
and revenue calculators. The costsweredivided into capital (fixed)
and ordinary (running) expenses. Onsite Power Systems, Inc.
provided cost estimates for a 115 td�1 system based on their
experience building a pilot-scale APS Digester system and costing
systems for industry partners [17]. The capital cost quoted was
normalized for the total reactor volume for all five reactors. The
digester’s capital cost (1.49 $dm�3) included the site development
andpermittingcostsaswellasequipmentandinstallationcostsfor
the reactors,material handling equipment, wastewater treatment
unit (i.e. sequencing batch reactor) and gas treatment equipment
(i.e.H2S scrubber andmoisture removal unit). It didnot include the
cost of MSW sorting and size reduction, since the food and green
wastes were expected to be delivered pre-sorted and the cost of
sorting would be embedded in the reduced tipping fees. The
operating and maintenance cost for the digester included esti-
mates for labor, maintenance, administrative costs and overhead
(i.e. property tax, insurance, and infrastructure expenses) and
came to 8.3% of the capital cost [17].
OtherMSWdigesters have been found to exhibit cost curves
that fit the power equationY¼ aXb, where a and b are constants
with economies of scale occurring when 0< b< 1 and X is the
design capacity in tonsper year [18].MSWdigesters inEuropean
countries cost 1.81 $ (kt y�1)�1 capacity (in 2007 dollars) with
a scaling factor of 0.56 on the digester capacity [18]. Therefore,
a 42 kt y�1 digester would cost 14.7 M$. Assuming a sustained
wetMSW loading rate of 16 kt dm�3 y�1, the specific capital cost
of similarly sized digesters in Europewas 5.60 $ dm�3. Full-scale
MSW digesters have yet to infiltrate the U.S. market; therefore,
the capital costs of full-scale systemshavenot been studied and
may have been underestimated. However, the present digester
system did not include pre-sorting equipment for the MSW,
whichmayaccount for someof the lowercost ascomparedwith
European systems. The cost estimate provided by the vendor
was used here, but the sensitivity of the model to changes in
capital cost was evaluated. Since this model only considered
one size of digester, no scaling factor was included. However,
the generator capital cost was scaled by fitting published cost
data [19] (adjusted by the consumer price index to 2007 dollars)
using a linear regression on the data transformed to fit a power
equation, which resulted in the following equation:
Cgen ¼ 2:267�$ W�1
�W 0:9
G (8)
Generator maintenance costs were also scaled using the
published data, but these costs depend on the total operating
time of the generator as well as generator capacity. Hence, the
annual maintenance cost for the generator was modeled as
follows:
EG ¼ 0:043�$ kWh�1
�W 0:81
G tG (9)
The maintenance cost for the hydrogen sulfide removal unit
was based on the cost of replacing the hydrogen sulfide
absorptive media (5.48 $ kg�1 H2S absorbed), which was in turn
based on the amount of biogas purified and its hydrogen
sulfide content (500 ppm). The PSA unit’s capital cost was 81
$m�3 d�1 treatment capacity. Its operating cost was assumed
to be 5% of the capital cost. The cost of the PSA unit was
assumed to be linear (i.e. a capital cost scaling factor of one
was assumed a priori) within the narrow range of sizes
considered in this model. For this study, it was assumed
that the sequencing batch reactor would provide sufficient
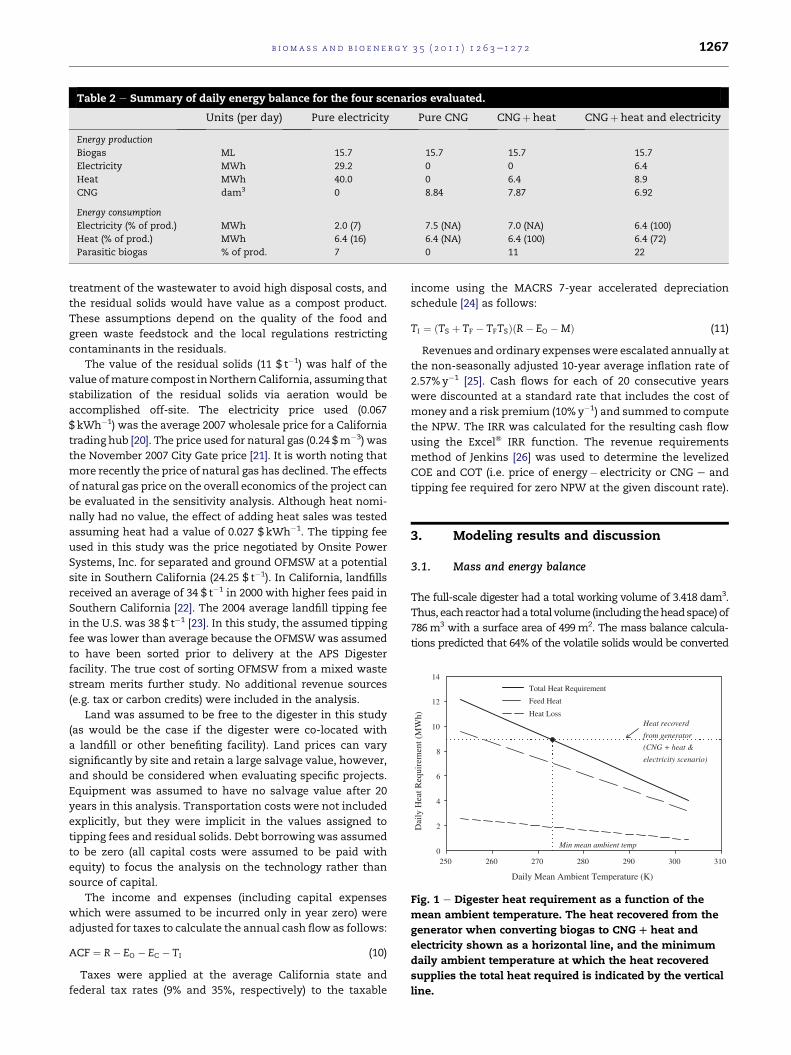
Table 2 e Summary of daily energy balance for the four scenarios evaluated.
Units (per day) Pure electricity Pure CNG CNGþ heat CNGþ heat and electricity
Energy production
Biogas ML 15.7 15.7 15.7 15.7
Electricity MWh 29.2 0 0 6.4
Heat MWh 40.0 0 6.4 8.9
CNG dam3 0 8.84 7.87 6.92
Energy consumption
Electricity (% of prod.) MWh 2.0 (7) 7.5 (NA) 7.0 (NA) 6.4 (100)
Heat (% of prod.) MWh 6.4 (16) 6.4 (NA) 6.4 (100) 6.4 (72)
Parasitic biogas % of prod. 7 0 11 22
Daily Mean Ambient Temperature (K)
250 260 270 280 290 300 310
Dai
ly H
eat R
equi
rem
ent (
MW
h)
0
2
4
6
8
10
12
14
Heat recoverd
from generator
(CNG + heat &
electricity scenario)
Total Heat Requirement
Feed Heat
Heat Loss
Min mean ambient temp
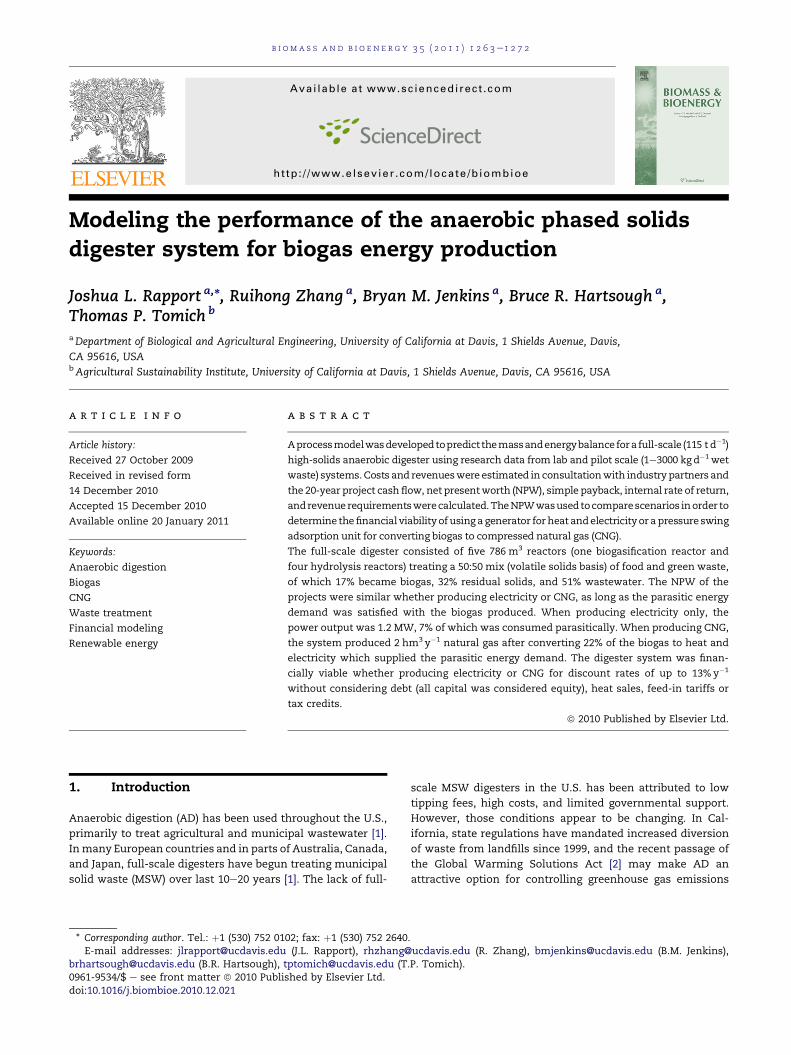
Fig. 1 e Digester heat requirement as a function of the
mean ambient temperature. The heat recovered from the
generator when converting biogas to CNGDheat and
electricity shown as a horizontal line, and the minimum
daily ambient temperature at which the heat recovered
supplies the total heat required is indicated by the vertical
line.
b i om a s s a n d b i o e n e r g y 3 5 ( 2 0 1 1 ) 1 2 6 3e1 2 7 2 1267
treatment of the wastewater to avoid high disposal costs, and
the residual solids would have value as a compost product.
These assumptions depend on the quality of the food and
green waste feedstock and the local regulations restricting
contaminants in the residuals.
The value of the residual solids (11 $ t�1) was half of the
value ofmature compost inNorthernCalifornia, assuming that
stabilization of the residual solids via aeration would be
accomplished off-site. The electricity price used (0.067
$ kWh�1) was the average 2007 wholesale price for a California
trading hub [20]. The price used for natural gas (0.24 $m�3) was
the November 2007 City Gate price [21]. It is worth noting that
more recently the price of natural gas has declined. The effects
of natural gas price on the overall economics of the project can
be evaluated in the sensitivity analysis. Although heat nomi-
nally had no value, the effect of adding heat sales was tested
assuming heat had a value of 0.027 $ kWh�1. The tipping fee
used in this study was the price negotiated by Onsite Power
Systems, Inc. for separated and ground OFMSW at a potential
site in Southern California (24.25 $ t�1). In California, landfills
received an average of 34 $ t�1 in 2000 with higher fees paid in
Southern California [22]. The 2004 average landfill tipping fee
in the U.S. was 38 $ t�1 [23]. In this study, the assumed tipping
fee was lower than average because the OFMSWwas assumed
to have been sorted prior to delivery at the APS Digester
facility. The true cost of sorting OFMSW from a mixed waste
stream merits further study. No additional revenue sources
(e.g. tax or carbon credits) were included in the analysis.
Land was assumed to be free to the digester in this study
(as would be the case if the digester were co-located with
a landfill or other benefiting facility). Land prices can vary
significantly by site and retain a large salvage value, however,
and should be considered when evaluating specific projects.
Equipment was assumed to have no salvage value after 20
years in this analysis. Transportation costs were not included
explicitly, but they were implicit in the values assigned to
tipping fees and residual solids. Debt borrowing was assumed
to be zero (all capital costs were assumed to be paid with
equity) to focus the analysis on the technology rather than
source of capital.
The income and expenses (including capital expenses
which were assumed to be incurred only in year zero) were
adjusted for taxes to calculate the annual cash flow as follows:
ACF ¼ R� EO � EC � TI (10)
Taxes were applied at the average California state and
federal tax rates (9% and 35%, respectively) to the taxable
income using the MACRS 7-year accelerated depreciation
schedule [24] as follows:
TI ¼ ðTS þ TF � TFTSÞðR� EO �MÞ (11)
Revenues and ordinary expenseswere escalated annually at
the non-seasonally adjusted 10-year average inflation rate of
2.57% y�1 [25]. Cash flows for each of 20 consecutive years
were discounted at a standard rate that includes the cost of
money and a risk premium (10% y�1) and summed to compute
the NPW. The IRR was calculated for the resulting cash flow
using the Excel� IRR function. The revenue requirements
method of Jenkins [26] was used to determine the levelized
COE and COT (i.e. price of energy� electricity or CNG e and
tipping fee required for zero NPW at the given discount rate).
3. Modeling results and discussion
3.1. Mass and energy balance
The full-scale digester had a total working volume of 3.418 dam3.
Thus, eachreactorhada total volume (including theheadspace) of
786m3 with a surface area of 499m2. The mass balance calcula-
tions predicted that 64% of the volatile solids would be converted
b i om a s s an d b i o e n e r g y 3 5 ( 2 0 1 1 ) 1 2 6 3e1 2 7 21268
into biogas, resulting in 17%of the feedstockmassbeing converted
tovapor-saturatedbiogas (containing1.8 t d�1water vapor). Biogas
and methane would be produced at a rate of 4.21 and
2.17m3m�3 d�1, respectively, or 15.7 and 8.8 dam3d�1 in total.
Adjusted for the VS content of the feedstock, the biogas and
methane yields were 166 and 90m3 t�1 wet waste. Based on its
energy content the biogashadapre-conversionpower potential of
4.1 MW, or 848 kWht�1, and a total electrical production capacity
of 1.2 MW or 255 kWht�1 wet waste. The remaining volatile and
fixed solids andwaterwould exit the systemas 36 t d�1 press cake
and 59m3d�1 wastewater (32% and 51% of the feedstock mass,
respectively). The wastewater stream would consists of 5% TS, of
which 62% were VS, prior to treatment in the sequencing batch
reactor.
The digester required 6.4 MWhd�1 of heat, on average, (21%
due toheat lossesand79%due to feedheating) and2.0 MWhd�1
electricity. The compressors required for operating the PSA and
Pure E
lectri
city
Pure C
NG
CNG + H
eat
CNG + H
eat &
Elec
tricit
y
Cap
ital C
ost (
2007
M$)
0
2
4
6
8
10
Digester
Generator
PSA Unit
Contingency
Pure E
lectri
city
Pure C
NG
CNG + H
eat
CNG + H
eat &
Elec
tricit
y
Ann
ual E
xpen
ses
(200
7 M
$)
0.0
0.2
0.4
0.6
0.8
1.0
1.2
Digeste
Genera
PSA Un
H2S Re
Utilitie
Conting
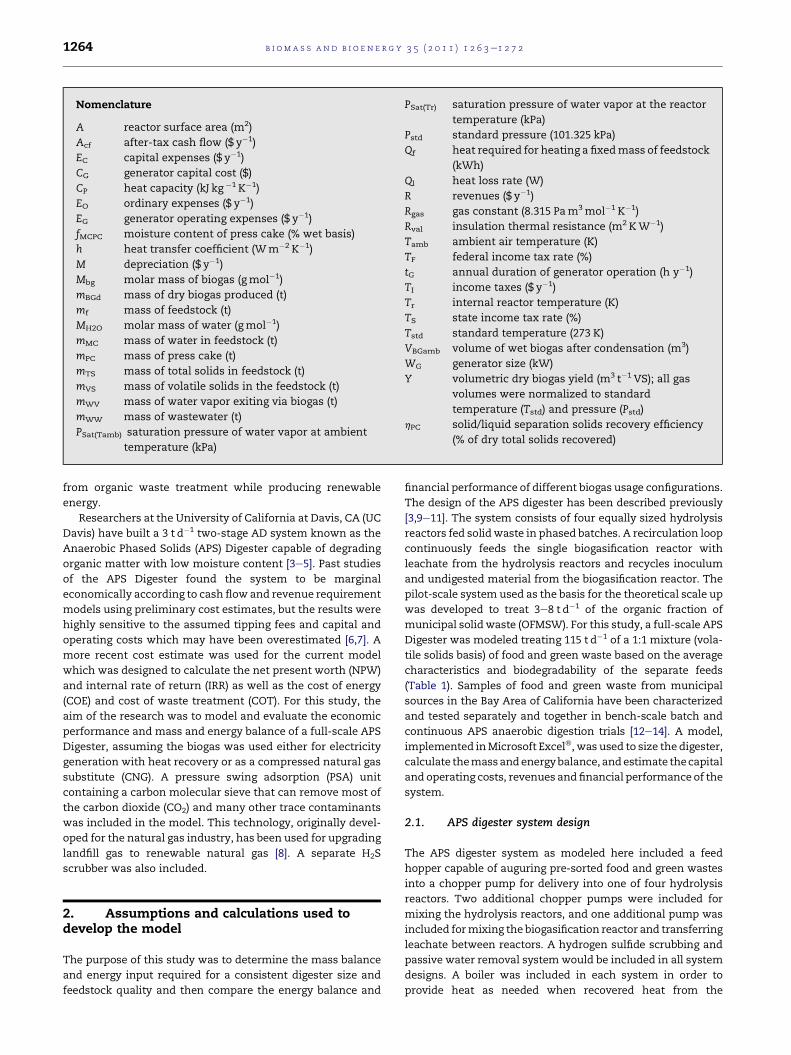
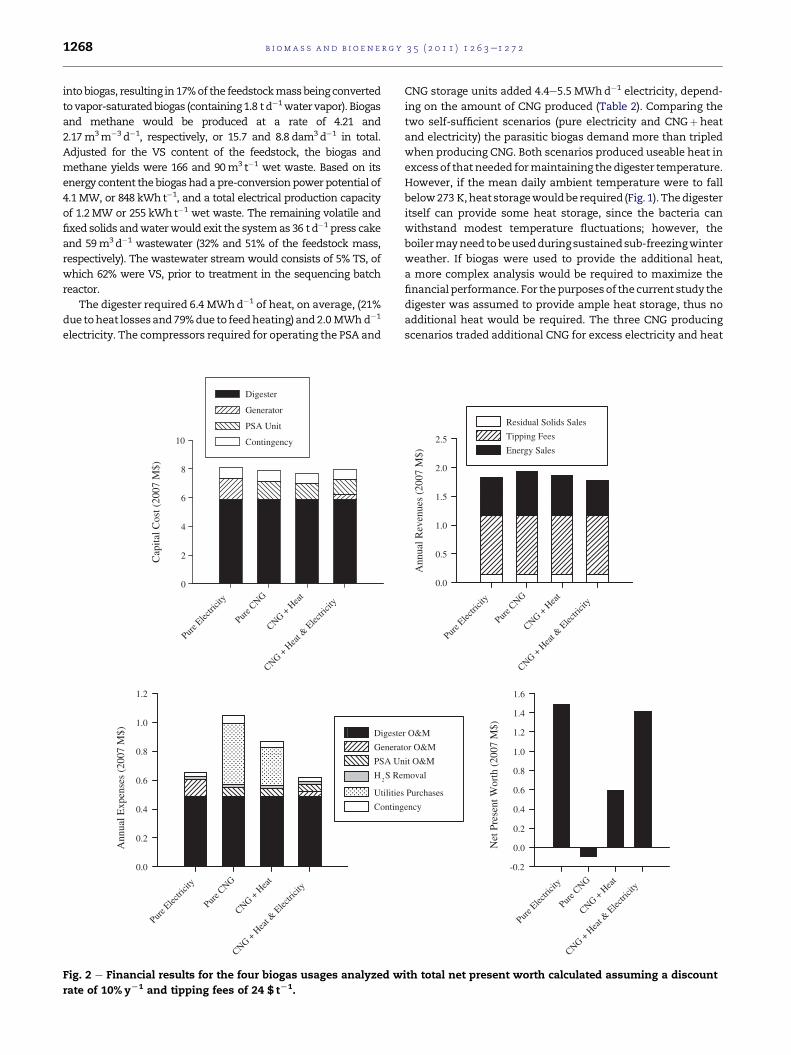
Fig. 2 e Financial results for the four biogas usages analyzed w
rate of 10% yL1 and tipping fees of 24 $ tL1.
CNG storage units added 4.4e5.5 MWhd�1 electricity, depend-
ing on the amount of CNG produced (Table 2). Comparing the
two self-sufficient scenarios (pure electricity and CNGþheat
and electricity) the parasitic biogas demand more than tripled
when producing CNG. Both scenarios produced useable heat in
excess of that needed formaintaining thedigester temperature.
However, if the mean daily ambient temperature were to fall
below273 K,heat storagewouldbe required (Fig. 1). Thedigester
itself can provide some heat storage, since the bacteria can
withstand modest temperature fluctuations; however, the
boilermayneedtobeusedduringsustainedsub-freezingwinter
weather. If biogas were used to provide the additional heat,
a more complex analysis would be required to maximize the
financial performance. For thepurposesof thecurrent study the
digester was assumed to provide ample heat storage, thus no
additional heat would be required. The three CNG producing
scenarios traded additional CNG for excess electricity and heat
Pure E
lectri
city
Pure C
NG
CNG + H
eat
CNG + H
eat &
Elec
tricit
y
Ann
ual R
even
ues
(200
7 M
$)
0.0
0.5
1.0
1.5
2.0
2.5
Residual Solids Sales
Tipping Fees
Energy Sales
r O&M
tor O&M
it O&M
moval
s Purchases
ency
Pure E
lectri
city
Pure C
NG
CNG + H
eat
CNG + H
eat &
Elec
tricit
y
Net
Pre
sent
Wor
th (
2007
M$)
-0.2
0.0
0.2
0.4
0.6
0.8
1.0
1.2
1.4
1.6
ith total net present worth calculated assuming a discount
Energy price ($ per unit energy)
0.0 0.1 0.2 0.3 0.4 0.5 0.6 0.7 0.8
Rat
e of
ret
urn
(% y
-1)
8
10
12
14
16
18
20
22
24
26
Tipping fee ($ t-1
)
10 20 30 40 50 60
Electricity price ($ kWh-1) for Pure Electricity option
CNG price ($ m-3) for CNG + Heat & Electricity option
Tipping fee ($ t-1
) for both options
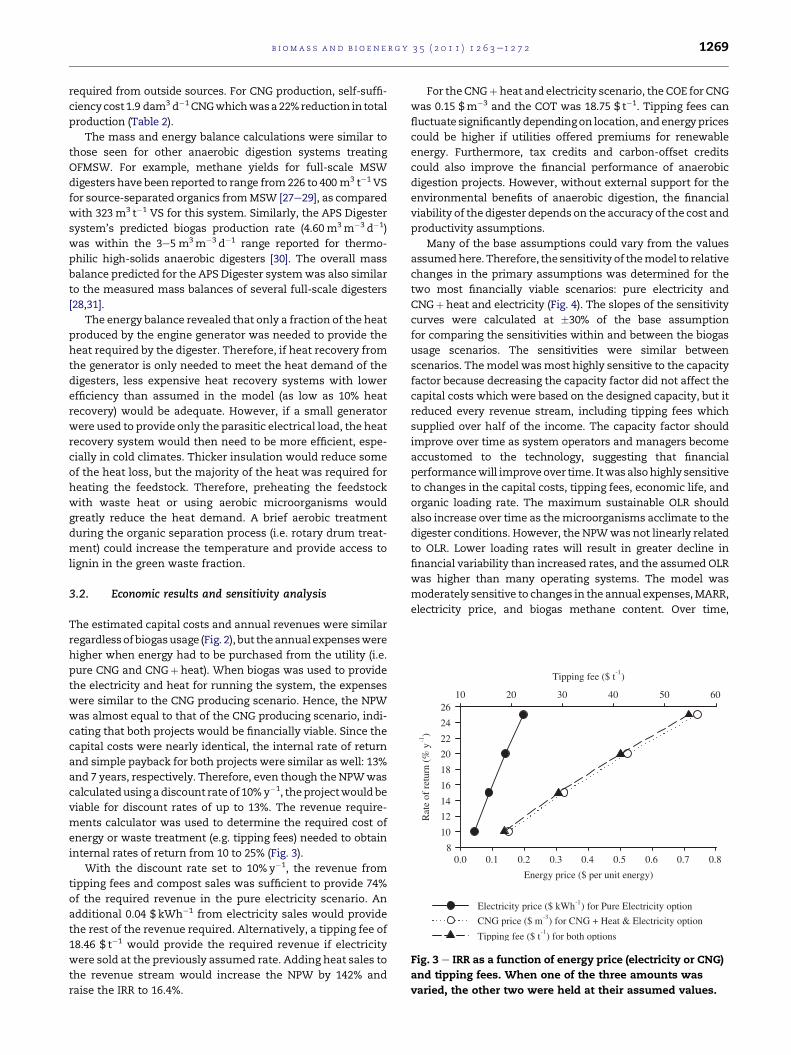
Fig. 3 e IRR as a function of energy price (electricity or CNG)
and tipping fees. When one of the three amounts was
varied, the other two were held at their assumed values.
b i om a s s a n d b i o e n e r g y 3 5 ( 2 0 1 1 ) 1 2 6 3e1 2 7 2 1269
required from outside sources. For CNG production, self-suffi-
ciencycost1.9 dam3 d�1CNGwhichwasa22%reduction in total
production (Table 2).
The mass and energy balance calculations were similar to
those seen for other anaerobic digestion systems treating
OFMSW. For example, methane yields for full-scale MSW
digesters have been reported to range from226 to 400 m3 t�1 VS
for source-separated organics fromMSW [27e29], as compared
with 323 m3 t�1 VS for this system. Similarly, the APS Digester
system’s predicted biogas production rate (4.60 m3m�3 d�1)
was within the 3e5 m3m�3 d�1 range reported for thermo-
philic high-solids anaerobic digesters [30]. The overall mass
balance predicted for the APS Digester systemwas also similar
to the measured mass balances of several full-scale digesters
[28,31].
The energy balance revealed that only a fraction of the heat
produced by the engine generator was needed to provide the
heat required by the digester. Therefore, if heat recovery from
the generator is only needed to meet the heat demand of the
digesters, less expensive heat recovery systems with lower
efficiency than assumed in the model (as low as 10% heat
recovery) would be adequate. However, if a small generator
were used to provide only the parasitic electrical load, the heat
recovery system would then need to be more efficient, espe-
cially in cold climates. Thicker insulation would reduce some
of the heat loss, but the majority of the heat was required for
heating the feedstock. Therefore, preheating the feedstock
with waste heat or using aerobic microorganisms would
greatly reduce the heat demand. A brief aerobic treatment
during the organic separation process (i.e. rotary drum treat-
ment) could increase the temperature and provide access to
lignin in the green waste fraction.
3.2. Economic results and sensitivity analysis
The estimated capital costs and annual revenues were similar
regardlessofbiogasusage (Fig. 2), but theannual expenseswere
higher when energy had to be purchased from the utility (i.e.
pure CNG and CNGþheat). When biogas was used to provide
the electricity and heat for running the system, the expenses
were similar to the CNG producing scenario. Hence, the NPW
was almost equal to that of the CNG producing scenario, indi-
cating that both projects would be financially viable. Since the
capital costs were nearly identical, the internal rate of return
and simple payback for both projects were similar as well: 13%
and 7 years, respectively. Therefore, even though theNPWwas
calculatedusing adiscount rate of 10% y�1, theprojectwouldbe
viable for discount rates of up to 13%. The revenue require-
ments calculator was used to determine the required cost of
energy or waste treatment (e.g. tipping fees) needed to obtain
internal rates of return from 10 to 25% (Fig. 3).
With the discount rate set to 10% y�1, the revenue from
tipping fees and compost sales was sufficient to provide 74%
of the required revenue in the pure electricity scenario. An
additional 0.04 $ kWh�1 from electricity sales would provide
the rest of the revenue required. Alternatively, a tipping fee of
18.46 $ t�1 would provide the required revenue if electricity
were sold at the previously assumed rate. Adding heat sales to
the revenue stream would increase the NPW by 142% and
raise the IRR to 16.4%.
For theCNGþheat and electricity scenario, the COE for CNG
was 0.15 $m�3 and the COT was 18.75 $ t�1. Tipping fees can
fluctuate significantly dependingon location, andenergyprices
could be higher if utilities offered premiums for renewable
energy. Furthermore, tax credits and carbon-offset credits
could also improve the financial performance of anaerobic
digestion projects. However, without external support for the
environmental benefits of anaerobic digestion, the financial
viability of thedigester depends on the accuracy of the cost and
productivity assumptions.
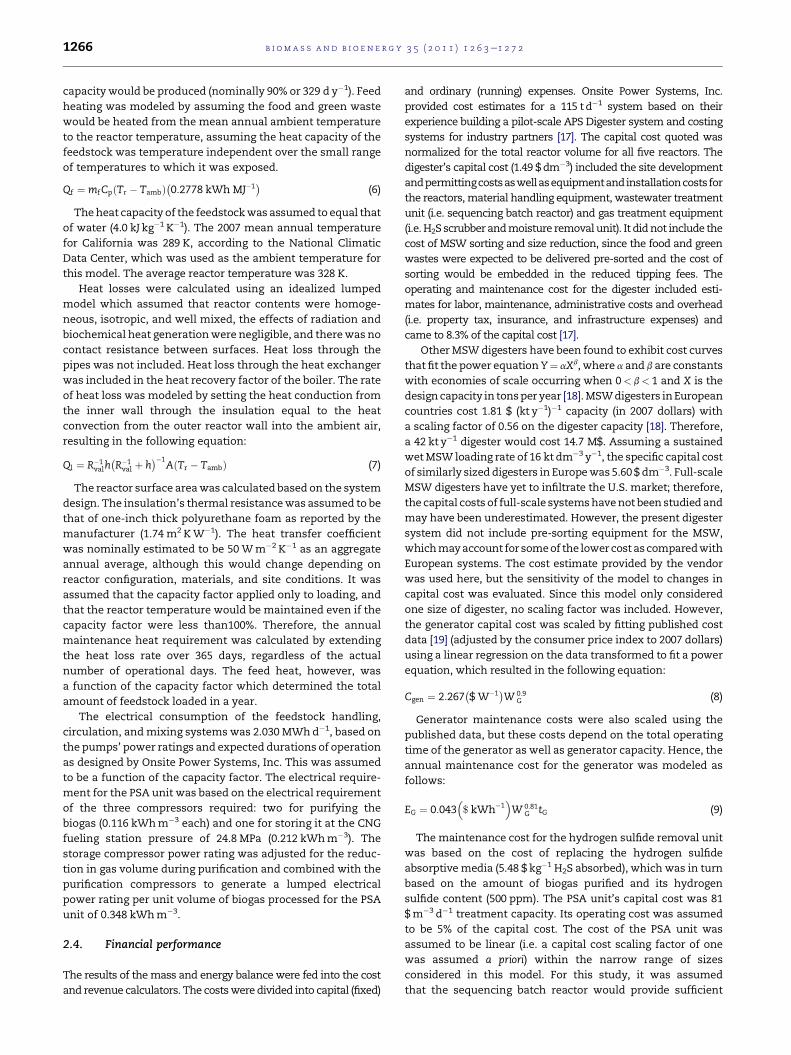
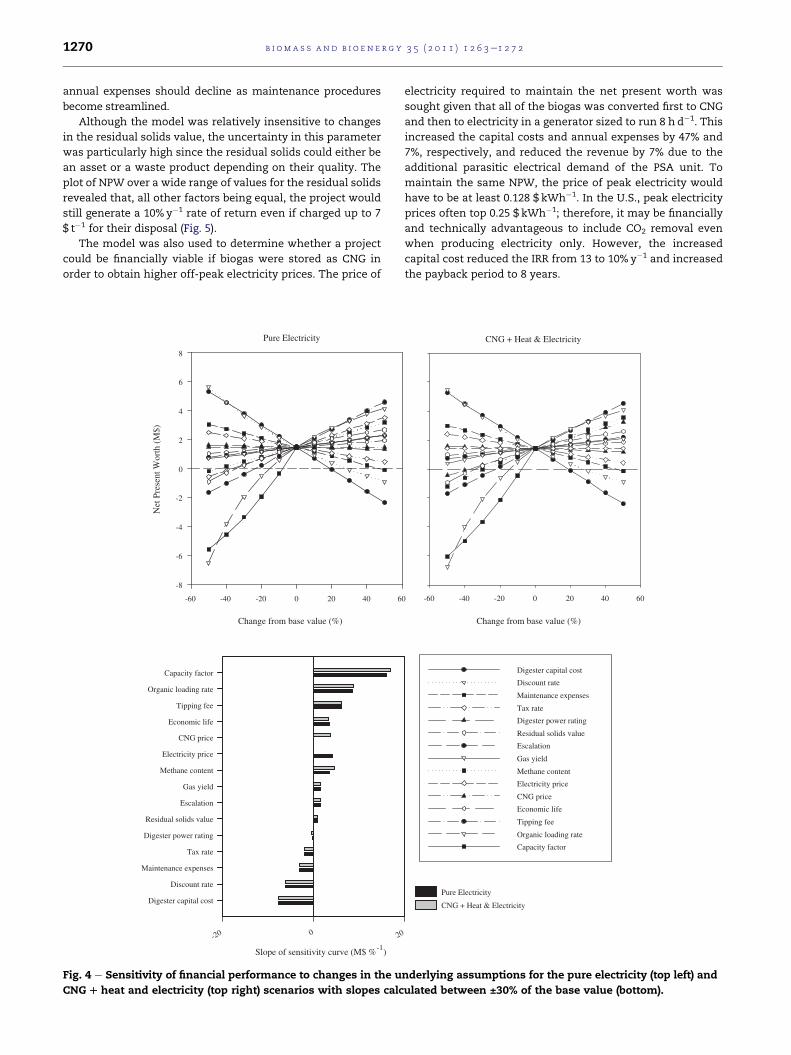
Many of the base assumptions could vary from the values
assumedhere. Therefore, the sensitivity of themodel to relative
changes in the primary assumptions was determined for the
two most financially viable scenarios: pure electricity and
CNGþheat and electricity (Fig. 4). The slopes of the sensitivity
curves were calculated at �30% of the base assumption
for comparing the sensitivities within and between the biogas
usage scenarios. The sensitivities were similar between
scenarios. Themodel wasmost highly sensitive to the capacity
factor because decreasing the capacity factor did not affect the
capital costs which were based on the designed capacity, but it
reduced every revenue stream, including tipping fees which
supplied over half of the income. The capacity factor should
improve over time as system operators and managers become
accustomed to the technology, suggesting that financial
performancewill improve over time. Itwas alsohighly sensitive
to changes in the capital costs, tipping fees, economic life, and
organic loading rate. The maximum sustainable OLR should
also increase over time as themicroorganisms acclimate to the
digester conditions. However, the NPWwas not linearly related
to OLR. Lower loading rates will result in greater decline in
financial variability than increased rates, and the assumed OLR
was higher than many operating systems. The model was
moderately sensitive to changes in the annual expenses,MARR,
electricity price, and biogas methane content. Over time,
b i om a s s an d b i o e n e r g y 3 5 ( 2 0 1 1 ) 1 2 6 3e1 2 7 21270
annual expenses should decline as maintenance procedures
become streamlined.
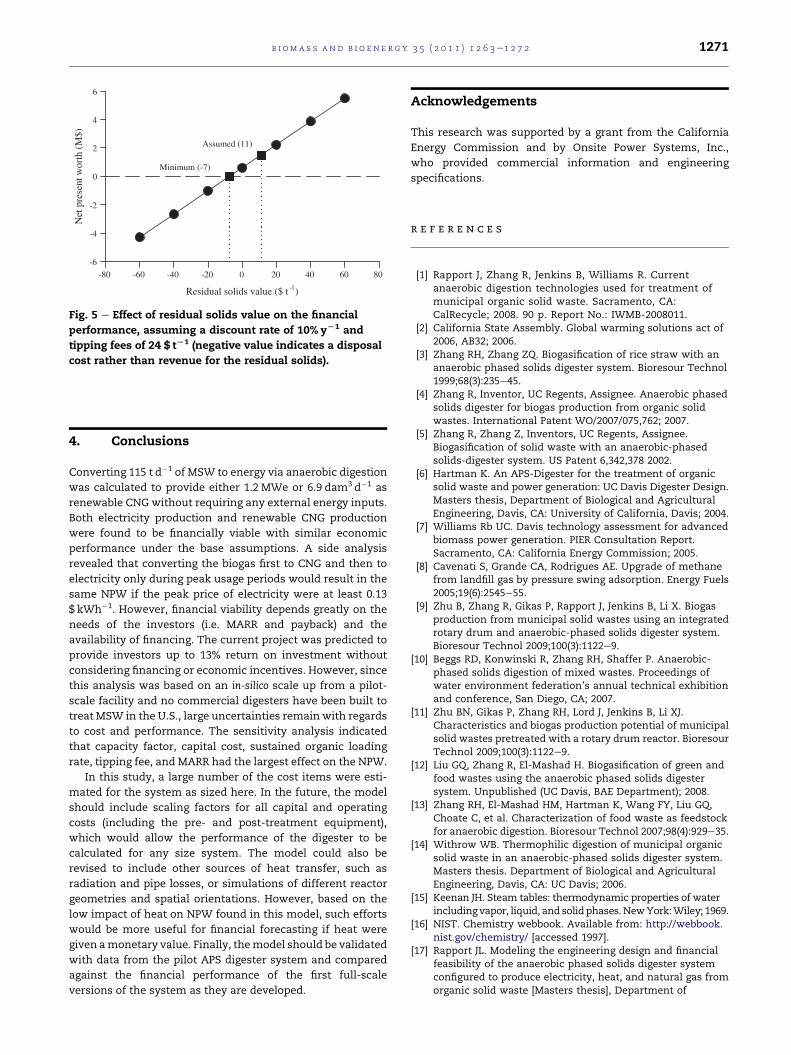
Although the model was relatively insensitive to changes
in the residual solids value, the uncertainty in this parameter
was particularly high since the residual solids could either be
an asset or a waste product depending on their quality. The
plot of NPW over a wide range of values for the residual solids
revealed that, all other factors being equal, the project would
still generate a 10% y�1 rate of return even if charged up to 7
$ t�1 for their disposal (Fig. 5).
The model was also used to determine whether a project
could be financially viable if biogas were stored as CNG in
order to obtain higher off-peak electricity prices. The price of
Pure Electricity
Change from base value (%)
-60 -40 -20 0 20 40 6
Net
Pre
sent
Wor
th (
M$)
-8
-6
-4
-2
0
2
4
6
8
Slope of sensitivity curve (M$ %-1)
-20 0 2
Digester capital cost
Discount rate
Maintenance expenses
Tax rate
Digester power rating
Residual solids value
Escalation
Gas yield
Methane content
Electricity price
CNG price
Economic life
Tipping fee
Organic loading rate
Capacity factor
Fig. 4 e Sensitivity of financial performance to changes in the u
CNGDheat and electricity (top right) scenarios with slopes calc
electricity required to maintain the net present worth was
sought given that all of the biogas was converted first to CNG
and then to electricity in a generator sized to run 8 h d�1. This
increased the capital costs and annual expenses by 47% and
7%, respectively, and reduced the revenue by 7% due to the
additional parasitic electrical demand of the PSA unit. To
maintain the same NPW, the price of peak electricity would
have to be at least 0.128 $ kWh�1. In the U.S., peak electricity
prices often top 0.25 $ kWh�1; therefore, it may be financially
and technically advantageous to include CO2 removal even
when producing electricity only. However, the increased
capital cost reduced the IRR from 13 to 10% y�1 and increased
the payback period to 8 years.
0
Digester capital cost
Discount rate
Maintenance expenses
Tax rate
Digester power rating
Residual solids value
Escalation
Gas yield
Methane content
Electricity price
CNG price
Economic life
Tipping fee
Organic loading rate
Capacity factor
CNG + Heat & Electricity
Change from base value (%)
-60 -40 -20 0 20 40 60
0
Pure Electricity
CNG + Heat & Electricity
nderlying assumptions for the pure electricity (top left) and
ulated between ±30% of the base value (bottom).
Residual solids value ($ t-1)
-80 -60 -40 -20 0 20 40 60 80
Net
pre
sent
wor
th (
M$)
-6
-4
-2
0
2
4
6
Assumed (11)
Minimum (-7)
Fig. 5 e Effect of residual solids value on the financial
performance, assuming a discount rate of 10% yL1 and
tipping fees of 24 $ tL1 (negative value indicates a disposal
cost rather than revenue for the residual solids).
b i om a s s a n d b i o e n e r g y 3 5 ( 2 0 1 1 ) 1 2 6 3e1 2 7 2 1271
4. Conclusions
Converting 115 t d�1 of MSW to energy via anaerobic digestion
was calculated to provide either 1.2 MWe or 6.9 dam3 d�1 as
renewable CNG without requiring any external energy inputs.
Both electricity production and renewable CNG production
were found to be financially viable with similar economic
performance under the base assumptions. A side analysis
revealed that converting the biogas first to CNG and then to
electricity only during peak usage periods would result in the
same NPW if the peak price of electricity were at least 0.13
$ kWh�1. However, financial viability depends greatly on the
needs of the investors (i.e. MARR and payback) and the
availability of financing. The current project was predicted to
provide investors up to 13% return on investment without
considering financing or economic incentives. However, since
this analysis was based on an in-silico scale up from a pilot-
scale facility and no commercial digesters have been built to
treat MSW in the U.S., large uncertainties remain with regards
to cost and performance. The sensitivity analysis indicated
that capacity factor, capital cost, sustained organic loading
rate, tipping fee, and MARR had the largest effect on the NPW.
In this study, a large number of the cost items were esti-
mated for the system as sized here. In the future, the model
should include scaling factors for all capital and operating
costs (including the pre- and post-treatment equipment),
which would allow the performance of the digester to be
calculated for any size system. The model could also be
revised to include other sources of heat transfer, such as
radiation and pipe losses, or simulations of different reactor
geometries and spatial orientations. However, based on the
low impact of heat on NPW found in this model, such efforts
would be more useful for financial forecasting if heat were
given amonetary value. Finally, themodel should be validated
with data from the pilot APS digester system and compared
against the financial performance of the first full-scale
versions of the system as they are developed.
Acknowledgements
This research was supported by a grant from the California
Energy Commission and by Onsite Power Systems, Inc.,
who provided commercial information and engineering
specifications.
r e f e r e n c e s
[1] Rapport J, Zhang R, Jenkins B, Williams R. Currentanaerobic digestion technologies used for treatment ofmunicipal organic solid waste. Sacramento, CA:CalRecycle; 2008. 90 p. Report No.: IWMB-2008011.
[2] California State Assembly. Global warming solutions act of2006, AB32; 2006.
[3] Zhang RH, Zhang ZQ. Biogasification of rice straw with ananaerobic phased solids digester system. Bioresour Technol1999;68(3):235e45.
[4] Zhang R, Inventor, UC Regents, Assignee. Anaerobic phasedsolids digester for biogas production from organic solidwastes. International Patent WO/2007/075,762; 2007.
[5] Zhang R, Zhang Z, Inventors, UC Regents, Assignee.Biogasification of solid waste with an anaerobic-phasedsolids-digester system. US Patent 6,342,378 2002.
[6] Hartman K. An APS-Digester for the treatment of organicsolid waste and power generation: UC Davis Digester Design.Masters thesis, Department of Biological and AgriculturalEngineering, Davis, CA: University of California, Davis; 2004.
[7] Williams Rb UC. Davis technology assessment for advancedbiomass power generation. PIER Consultation Report.Sacramento, CA: California Energy Commission; 2005.
[8] Cavenati S, Grande CA, Rodrigues AE. Upgrade of methanefrom landfill gas by pressure swing adsorption. Energy Fuels2005;19(6):2545e55.
[9] Zhu B, Zhang R, Gikas P, Rapport J, Jenkins B, Li X. Biogasproduction from municipal solid wastes using an integratedrotary drum and anaerobic-phased solids digester system.Bioresour Technol 2009;100(3):1122e9.
[10] Beggs RD, Konwinski R, Zhang RH, Shaffer P. Anaerobic-phased solids digestion of mixed wastes. Proceedings ofwater environment federation’s annual technical exhibitionand conference, San Diego, CA; 2007.
[11] Zhu BN, Gikas P, Zhang RH, Lord J, Jenkins B, Li XJ.Characteristics and biogas production potential of municipalsolid wastes pretreated with a rotary drum reactor. BioresourTechnol 2009;100(3):1122e9.
[12] Liu GQ, Zhang R, El-Mashad H. Biogasification of green andfood wastes using the anaerobic phased solids digestersystem. Unpublished (UC Davis, BAE Department); 2008.
[13] Zhang RH, El-Mashad HM, Hartman K, Wang FY, Liu GQ,Choate C, et al. Characterization of food waste as feedstockfor anaerobic digestion. Bioresour Technol 2007;98(4):929e35.
[14] Withrow WB. Thermophilic digestion of municipal organicsolid waste in an anaerobic-phased solids digester system.Masters thesis. Department of Biological and AgriculturalEngineering, Davis, CA: UC Davis; 2006.
[15] Keenan JH. Steam tables: thermodynamic properties of waterincluding vapor, liquid, and solidphases.NewYork:Wiley; 1969.
[16] NIST. Chemistry webbook. Available from: http://webbook.nist.gov/chemistry/ [accessed 1997].
[17] Rapport JL. Modeling the engineering design and financialfeasibility of the anaerobic phased solids digester systemconfigured to produce electricity, heat, and natural gas fromorganic solid waste [Masters thesis], Department of
b i om a s s an d b i o e n e r g y 3 5 ( 2 0 1 1 ) 1 2 6 3e1 2 7 21272
Biological and Agricultural Engineering, Davis, CA:University of California, Davis; 2008.
[18] Tsilemou K, Panagiotakopoulos D. Approximate costfunctions for solid waste treatment facilities. Waste ManageRes 2006;24(4):310e22.
[19] Goldstein L, Hedman B, Knowles D, Freedman S, Woods R,Schweizer T. Gas-fired distributed energy resourcetechnology characterizations. National Renewable EnergyLaboratory; 2003 Nov.. 226 p. Report No.: NREL/TP-620-34783.
[20] EIA. Electricity: wholesale market data. Available from:http://www.eia.doe.gov/cneaf/electricity/epa/epa_sum.html[accessed 2008 March].
[21] EIA. Natural gas prices. Available from: http://www.eia.gov/dnav/ng/ng_pri_sum_dcu_nus_m.htm [accessed 2008March].
[22] CalRecycle, California Department of Resources Recyclingand Recovery. Available from: http://www.calrecycle.ca.gov/.Sacramento [cited March 2008].
[23] Repa EW. 2005 tip fee survey. In: NSWMA research bulletin.Washington, D.C.: National Solid Wastes ManagementAssociation; 2005.
[24] IRS. How to depreciate property, publication 946.Washington DC: Department of the Treasury, InternalRevenue Service; 2006.
[25] BLS. Bureau of Labor Statistics consumer price index.Available from: http://www.bls.gov/cpi/ [accessed 2008].
[26] Jenkins BM. Background for the energy cost calculator.Available from: http://faculty.engineering.ucdavis.edu/jenkins/CBC/Calculator/index.html [accessed 16.02.08].
[27] Saint-Joly C, Desbois S, Lotti JP. Determinant impact of wastecollectionandcompositiononanaerobicdigestionperformance:industrial results. Water Sci Technol 2000;41(3):291e7.
[28] Bolzonella D, Pavan P, Mace S, Cecchi F. Dry anaerobicdigestion of differently sorted organic municipal solid waste:a full-scale experience. Water Sci Technol 2006;53(8):23e32.
[29] De Baere L. Anaerobic digestion of solid waste: state-of-the-art. Water Sci Technol 2000;41(3):283e90.
[30] Hartmann H, Ahring BK. Strategies for the anaerobicdigestion of the organic fraction of municipal solid waste: anoverview. Water Sci Technol 2006;53(8):7e22.
[31] ten Brummeler E. Full scale experience with the BIOCELprocess. Water Sci Technol 2000;41(3):299e304.