modeling of emulsion copolymerization reactors: … · modeling of emulsion copolymerization...
TRANSCRIPT
Juraj Kosek Alexandr Zubov Richard Pokorný Martin Kroupa Michal Vonka
Modeling of emulsion copolymerization reactors: from kinetics and thermodynamics to the dispersion stability
14. January 2015 Frankfurt, Germany
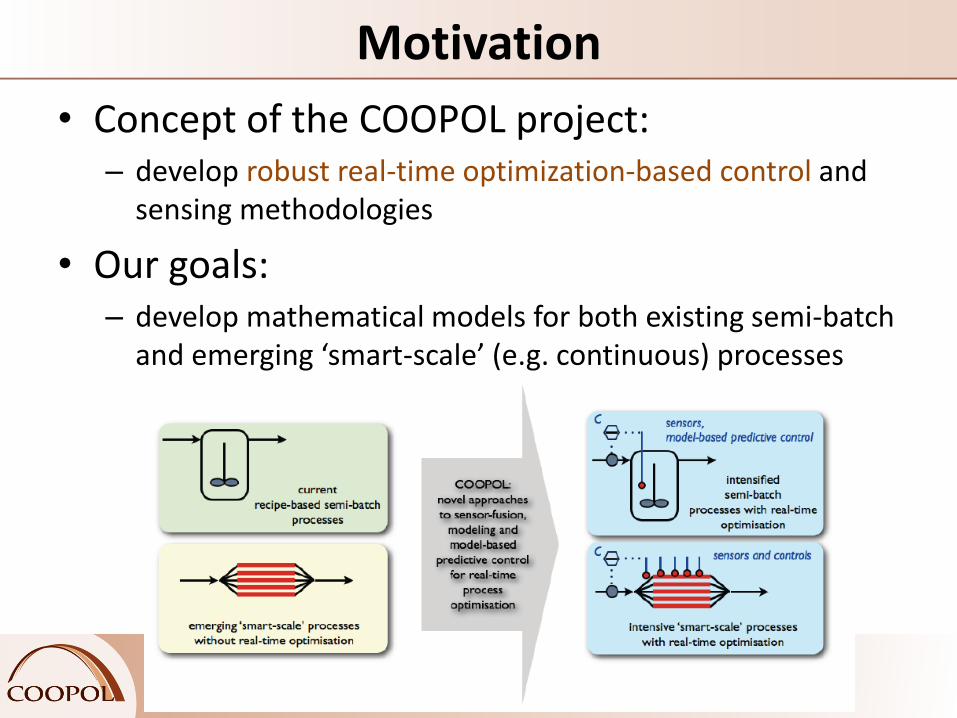
Motivation
• Concept of the COOPOL project: – develop robust real-time optimization-based control and
sensing methodologies
• Our goals: – develop mathematical models for both existing semi-batch
and emerging ‘smart-scale’ (e.g. continuous) processes

Strategy to achieve our goals • Starting point:
– Models of emulsion copolymerization previously developed (i) by our group(A), and (ii) by group of prof. Engell at TUD(B)
• Adaptation and improvement of models to our problem:
– semi-batch: 4 monomers (two of them water soluble), seed
– smart-scale: 2 monomers (insoluble in water), unseeded
• Model reduction – models suitable for on-line process control (robust and fast)
Smart-scale reactor Courtesy of Fabian Lueth, University of Hamburg
reaction mixture
feed of reactants
cooling water
input cooling water output
A. Zubov, J. Pokorny, J. Kosek: Styrene-butadiene rubber (SBR) production by emulsion polymerization: Dynamic modeling and intensification of the process. Chemical Engineering Journal 207-208, 414-420 (2012).
B. H. Brandt: Online Anwendungen komplexer Modelle von Reaktionssystemen am Beispiel der Emulsions-Polymerisation. Report, TU Dortmund (2009).
feed of reactants
cooling water input
cooling water output
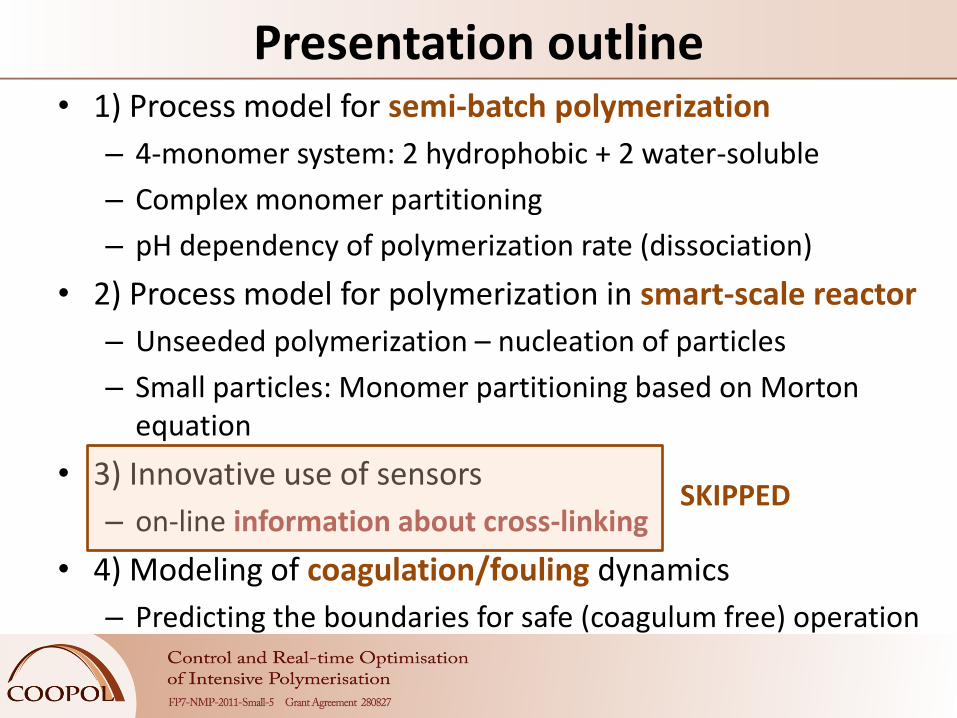
Presentation outline • 1) Process model for semi-batch polymerization
– 4-monomer system: 2 hydrophobic + 2 water-soluble
– Complex monomer partitioning
– pH dependency of polymerization rate (dissociation)
• 2) Process model for polymerization in smart-scale reactor
– Unseeded polymerization – nucleation of particles
– Small particles: Monomer partitioning based on Morton equation
• 3) Innovative use of sensors
– on-line information about cross-linking
• 4) Modeling of coagulation/fouling dynamics
– Predicting the boundaries for safe (coagulum free) operation
SKIPPED
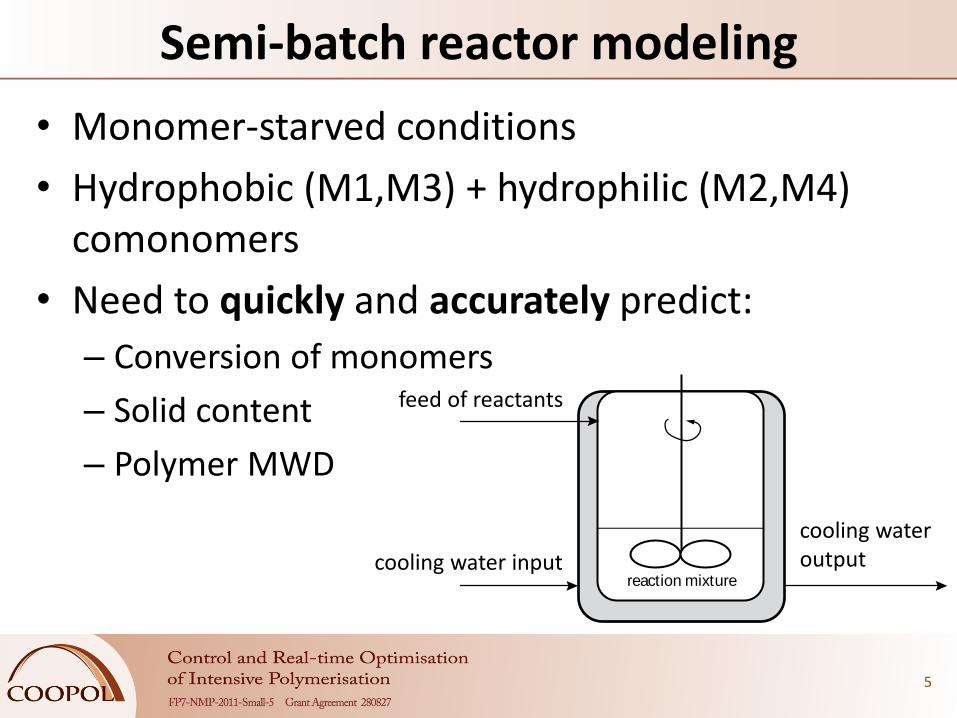
Semi-batch reactor modeling
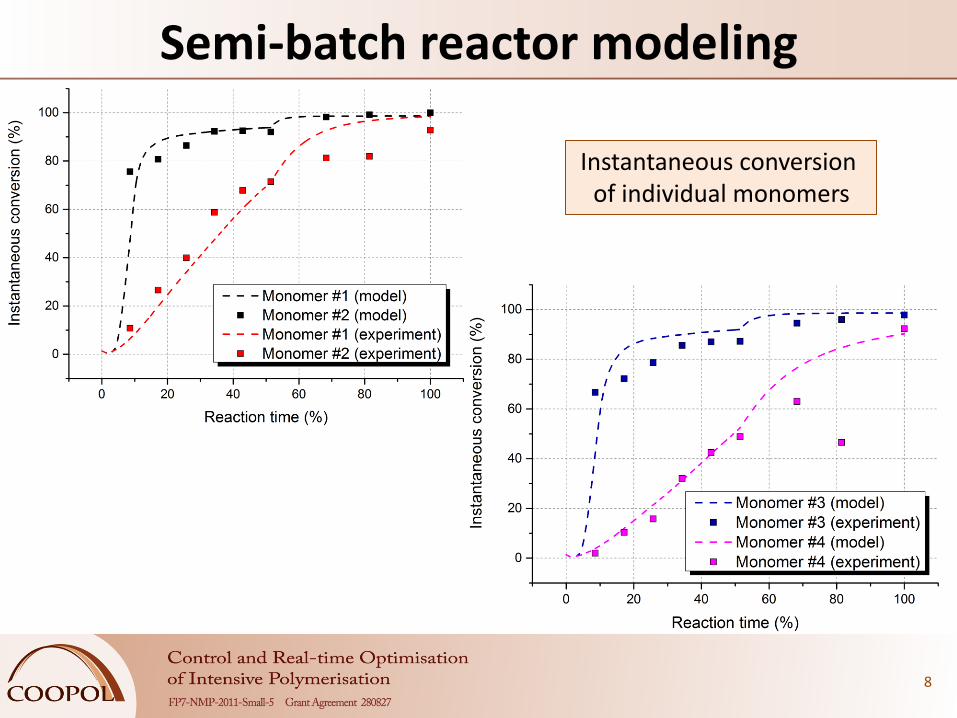
• Monomer-starved conditions
• Hydrophobic (M1,M3) + hydrophilic (M2,M4) comonomers
• Need to quickly and accurately predict:
– Conversion of monomers
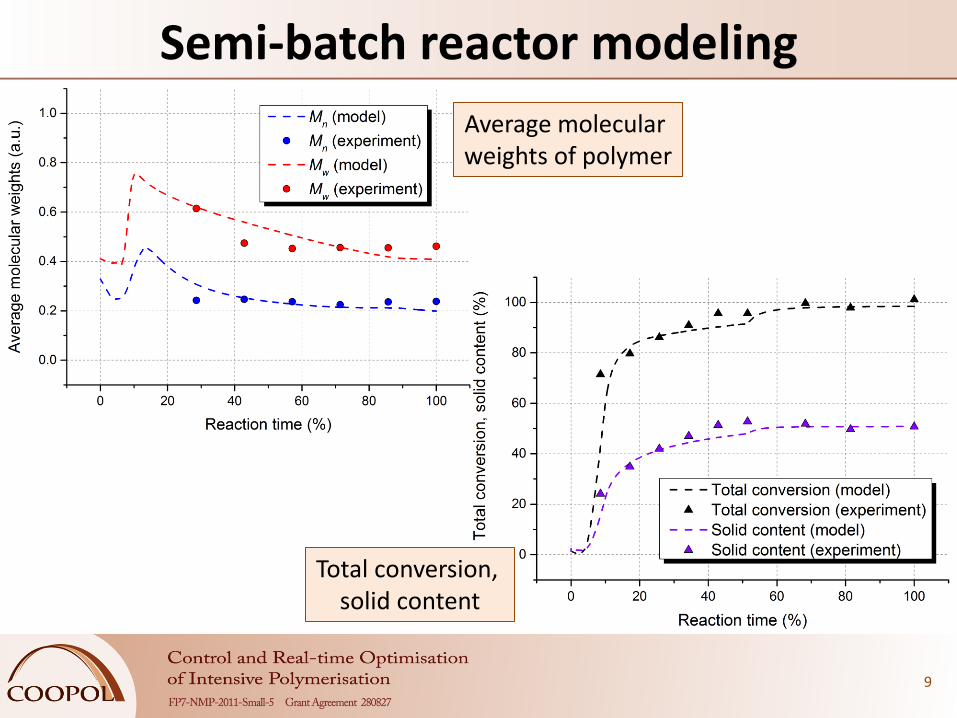
– Solid content
– Polymer MWD
5
reaction mixture
feed of reactants
cooling water
input cooling water output
feed of reactants
cooling water input
cooling water output

Semi-batch reactor modeling
6
• Separation of reaction medium into:
– Emulsion copolymerization (M1+M3) in polymer phase.
– Solution copolymerization (M2+M4) in water.
• Model formulated as system of ODE based on:
– Material balance of non-polymeric species in all phases.
– Material balance of radicals in polymer and aqueous phase.
– Population balance of polymer moments (summed over polymer and aqueous phase).
– Heat balance of reaction mixture and cooling jacket.
Semi-batch reactor modeling
7
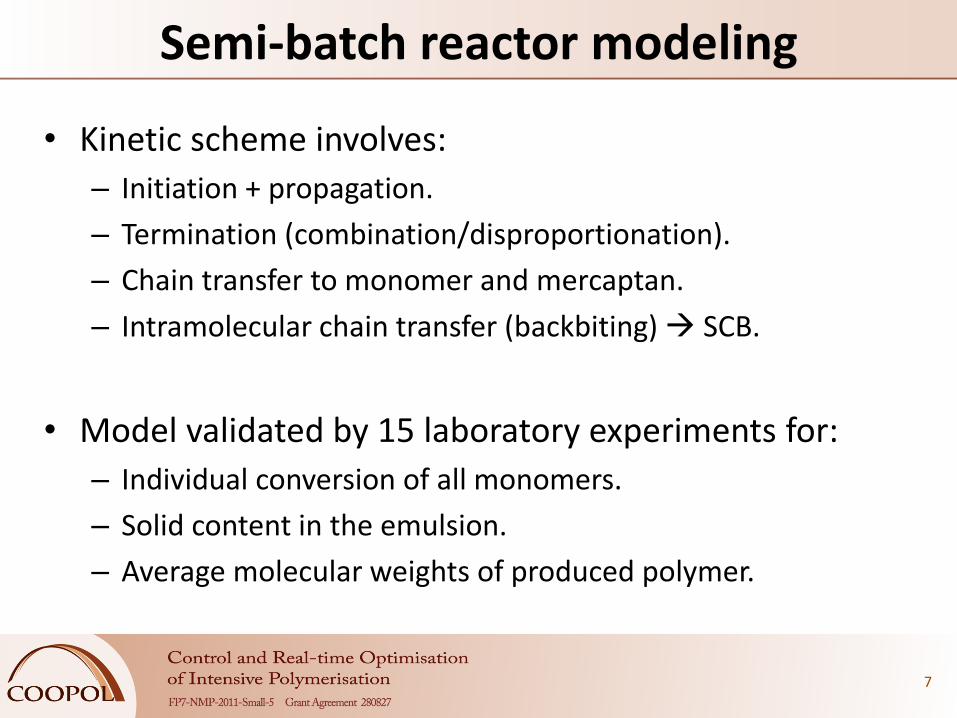
• Kinetic scheme involves:
– Initiation + propagation.
– Termination (combination/disproportionation).
– Chain transfer to monomer and mercaptan.
– Intramolecular chain transfer (backbiting) SCB.
• Model validated by 15 laboratory experiments for:
– Individual conversion of all monomers.
– Solid content in the emulsion.
– Average molecular weights of produced polymer.
Semi-batch reactor modeling
8
Instantaneous conversion of individual monomers
Semi-batch reactor modeling
9
Average molecular weights of polymer
Total conversion, solid content
„Smart-scale“ reactor modeling
10
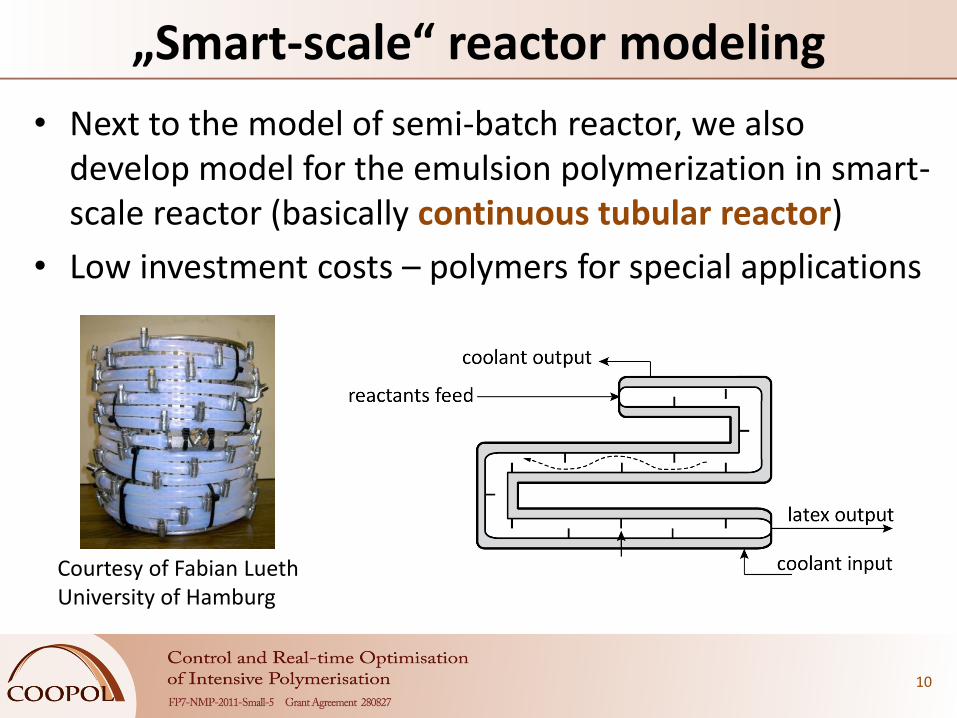
• Next to the model of semi-batch reactor, we also develop model for the emulsion polymerization in smart-scale reactor (basically continuous tubular reactor)
• Low investment costs – polymers for special applications
Courtesy of Fabian Lueth University of Hamburg
2
2
zD
zv
te
„Smart-scale“ reactor modeling
11
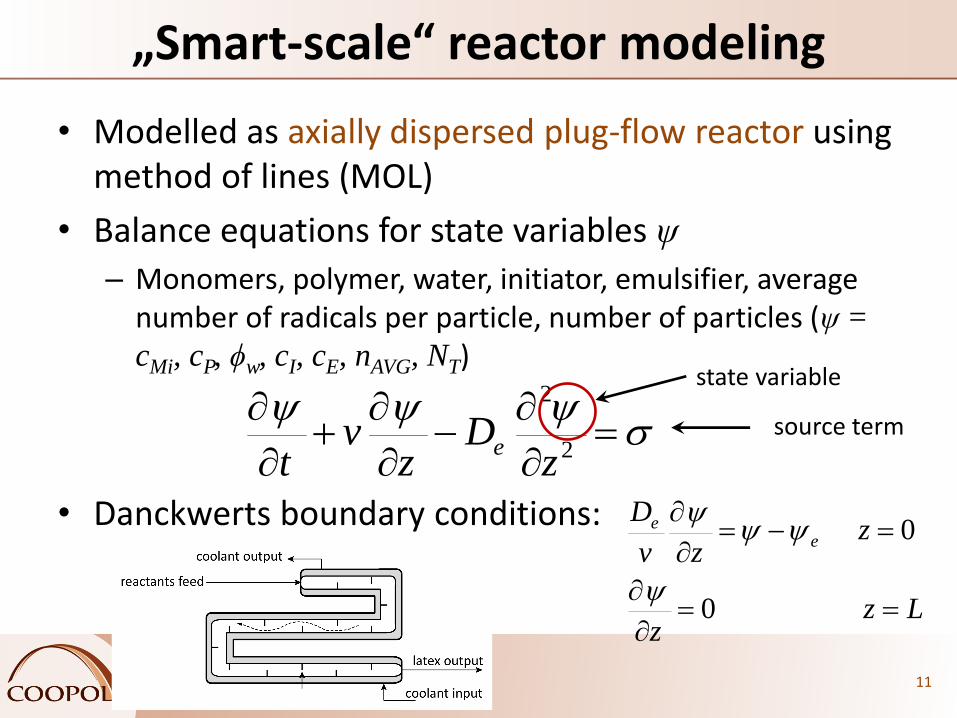
• Modelled as axially dispersed plug-flow reactor using method of lines (MOL)
• Balance equations for state variables ψ
– Monomers, polymer, water, initiator, emulsifier, average number of radicals per particle, number of particles (ψ =
cMi, cP, ϕw, cI, cE, nAVG, NT)
• Danckwerts boundary conditions:
state variable
Lzz
zzv
De
e
0
0
source term
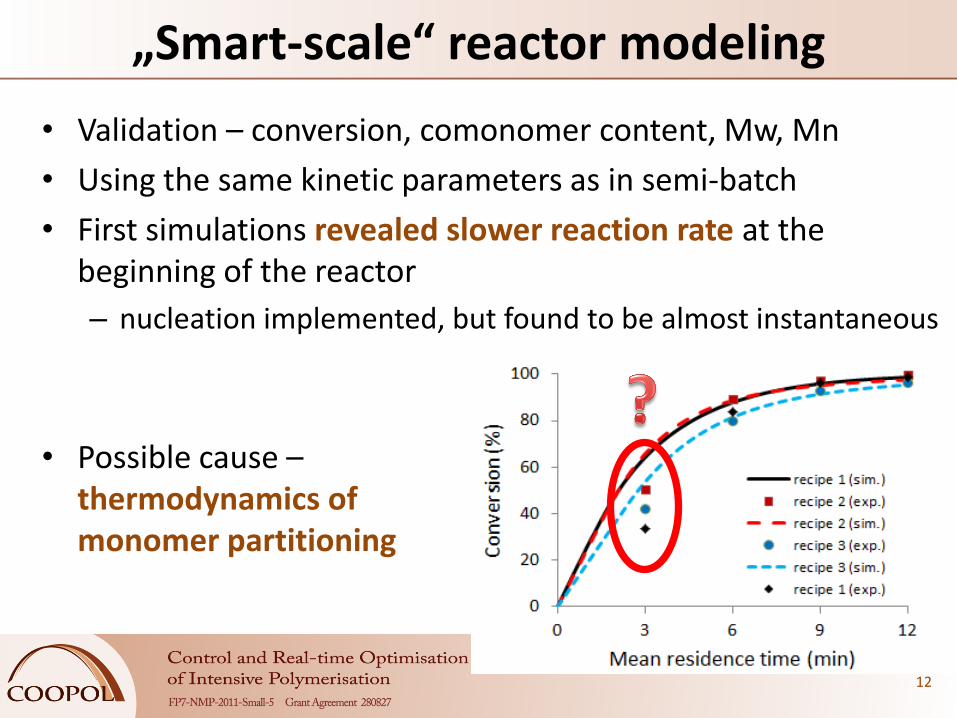
• Validation – conversion, comonomer content, Mw, Mn
• Using the same kinetic parameters as in semi-batch
• First simulations revealed slower reaction rate at the beginning of the reactor
– nucleation implemented, but found to be almost instantaneous
„Smart-scale“ reactor modeling
12
• Possible cause – thermodynamics of monomer partitioning
13
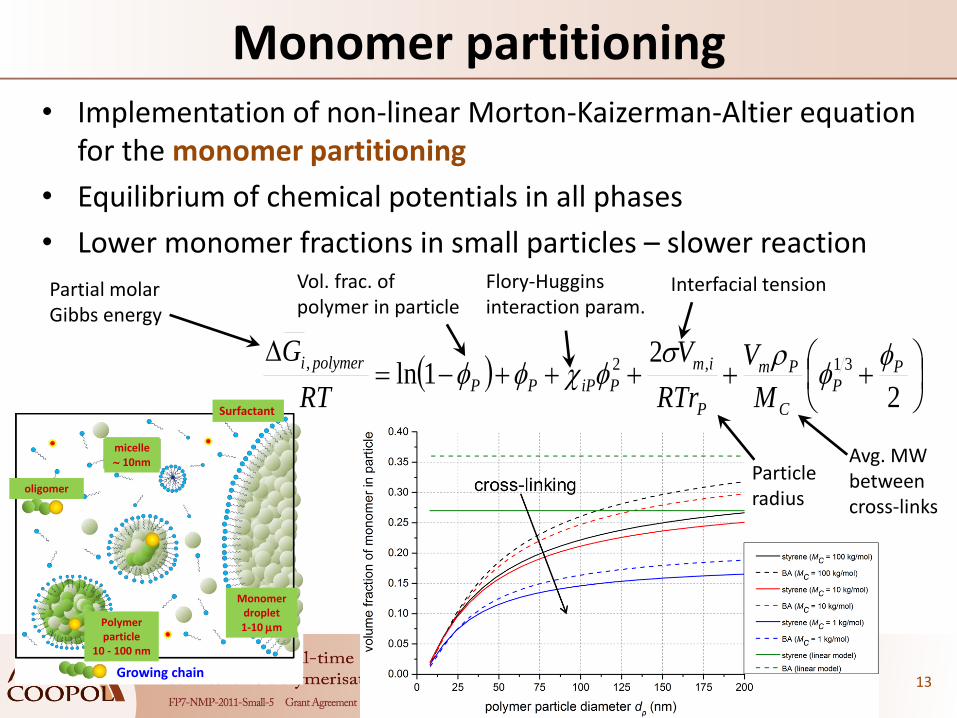
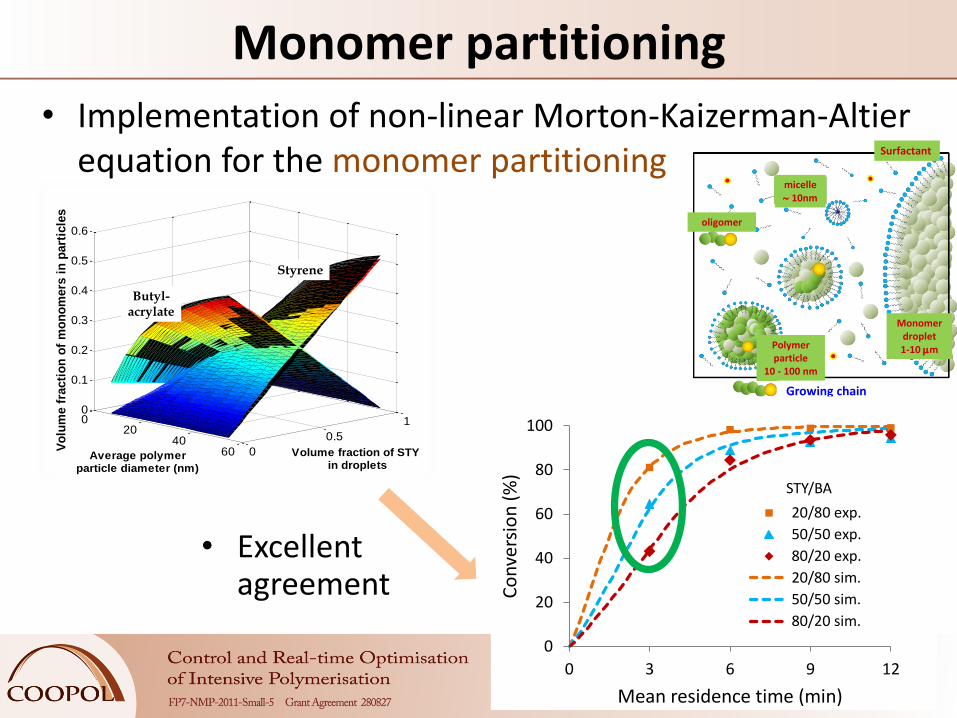
• Implementation of non-linear Morton-Kaizerman-Altier equation for the monomer partitioning
• Equilibrium of chemical potentials in all phases
• Lower monomer fractions in small particles – slower reaction
Monomer partitioning
Surfactant
Monomer droplet1-10 mPolymer
particle10 - 100 nm
oligomer
micelle 10nm
Growing chain
2
21ln 31,2, P
P
C
Pm
P
im
PiPPP
polymeri
M
V
RTr
V
RT
G
Partial molar Gibbs energy
Vol. frac. of polymer in particle
Flory-Huggins interaction param.
Interfacial tension
Particle radius
Avg. MW between cross-links
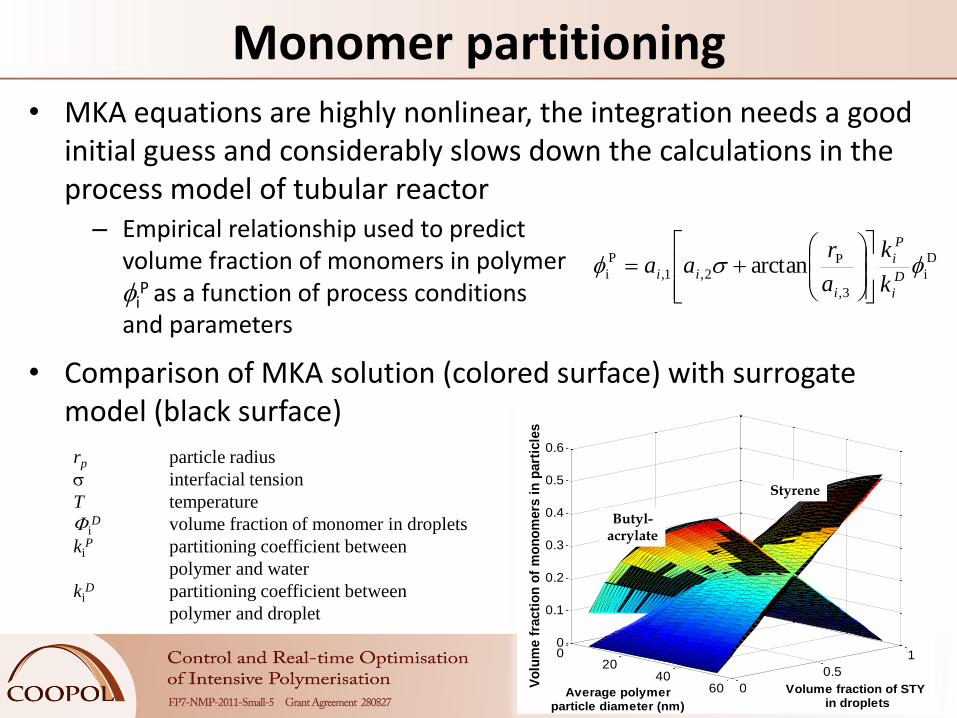
• MKA equations are highly nonlinear, the integration needs a good initial guess and considerably slows down the calculations in the process model of tubular reactor
• Comparison of MKA solution (colored surface) with surrogate model (black surface)
Monomer partitioning
14
D
i
3,
P2,1,
P
i arctan D
i
P
i
i
iik
k
a
raa
rp particle radius
interfacial tension
T temperature
iD volume fraction of monomer in droplets
kiP partitioning coefficient between
polymer and water
kiD partitioning coefficient between
polymer and droplet
– Empirical relationship used to predict volume fraction of monomers in polymer i
P as a function of process conditions and parameters
020
4060 0
0.5
10
0.1
0.2
0.3
0.4
0.5
0.6
Volume fraction of STY in droplets
Average polymerparticle diameter (nm)
Vo
lum
e f
racti
on
of
mo
no
mers
in
part
icle
s
Styrene
Butyl-acrylate
15
• Implementation of non-linear Morton-Kaizerman-Altier equation for the monomer partitioning
Monomer partitioning
• Excellent agreement
Surfactant
Monomer droplet1-10 mPolymer
particle10 - 100 nm
oligomer
micelle 10nm
Growing chain
0
20
40
60
80
100
0 3 6 9 12
Co
nve
rsio
n (
%)
Mean residence time (min)
20/80 exp.
50/50 exp.
80/20 exp.
20/80 sim.
50/50 sim.
80/20 sim.
STY/BA
020
4060 0
0.5
10
0.1
0.2
0.3
0.4
0.5
0.6
Volume fraction of STY in droplets
Average polymerparticle diameter (nm)
Vo
lum
e f
racti
on
of
mo
no
mers
in
part
icle
s
Styrene
Butyl-acrylate
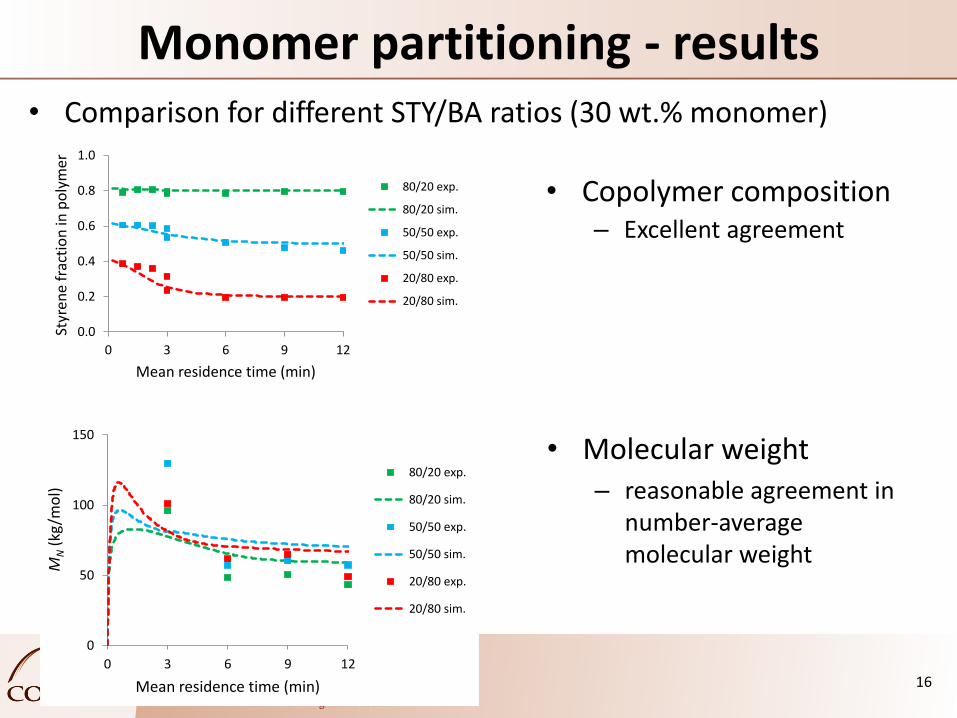
• Comparison for different STY/BA ratios (30 wt.% monomer)
Monomer partitioning - results
16
• Copolymer composition – Excellent agreement
0.0
0.2
0.4
0.6
0.8
1.0
0 3 6 9 12
Styr
ene
frac
tio
n in
po
lym
er
Mean residence time (min)
80/20 exp.
80/20 sim.
50/50 exp.
50/50 sim.
20/80 exp.
20/80 sim.
• Molecular weight – reasonable agreement in
number-average molecular weight
0
50
100
150
0 3 6 9 12
MN
(kg/
mo
l)
Mean residence time (min)
80/20 exp.
80/20 sim.
50/50 exp.
50/50 sim.
20/80 exp.
20/80 sim.
Motivation – Coagulation
http://en.wikipedia.org/wiki/Emulsion_polymerization
17
Stabilized dispersions are encountered in various applications
Food, cosmetics, etc.
Emulsion & suspension polymerization
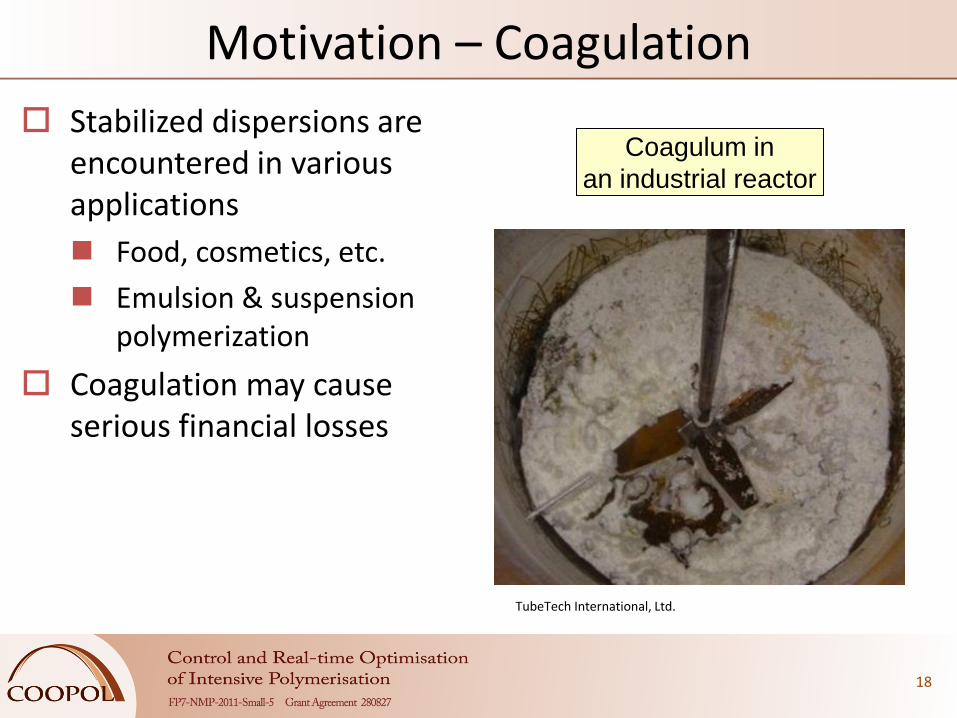
Motivation – Coagulation
18
Stabilized dispersions are encountered in various applications
Food, cosmetics, etc.
Emulsion & suspension polymerization
Coagulation may cause serious financial losses
Coagulum in
an industrial reactor
TubeTech International, Ltd.
Motivation – Coagulation
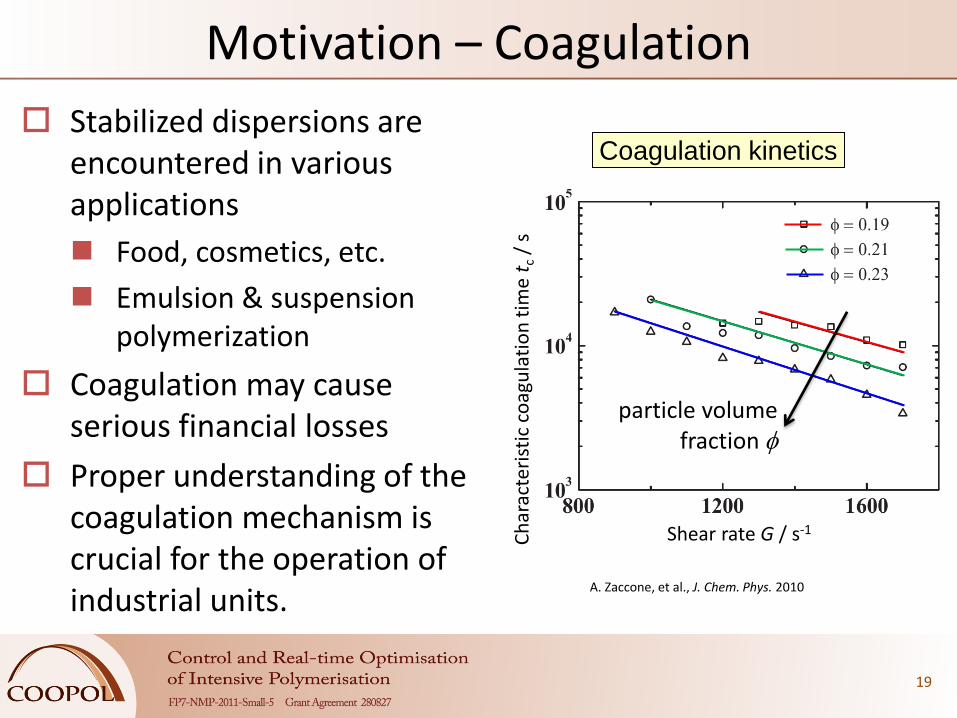
A. Zaccone, et al., J. Chem. Phys. 2010
19
Stabilized dispersions are encountered in various applications
Food, cosmetics, etc.
Emulsion & suspension polymerization
Coagulation may cause serious financial losses
Proper understanding of the coagulation mechanism is crucial for the operation of industrial units.
Coagulation kinetics
Shear rate G / s-1 Ch
arac
teri
stic
co
agu
lati
on
tim
e t c
/ s
particle volume fraction
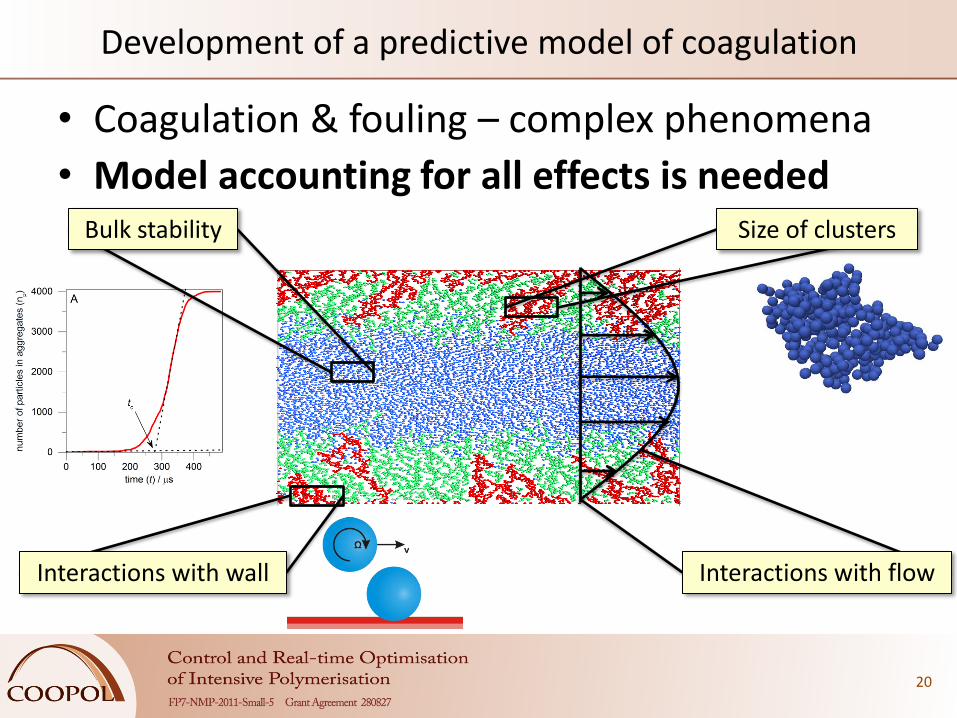
Development of a predictive model of coagulation
• Coagulation & fouling – complex phenomena
20
Bulk stability Size of clusters
Interactions with wall Interactions with flow
• Model accounting for all effects is needed

Advantages of the DEM model
• Large number of particles (currently 5000) – Enables modeling of crowded systems – Captures interactions between many clusters instead of
simulations with a single cluster
21
Rp
F F
• Direct incorporation of inter-particle forces – Our model describes interaction of particles that are
elastic, adhesive and stabilized – Particle-fluid interaction is modeled by two-way coupling
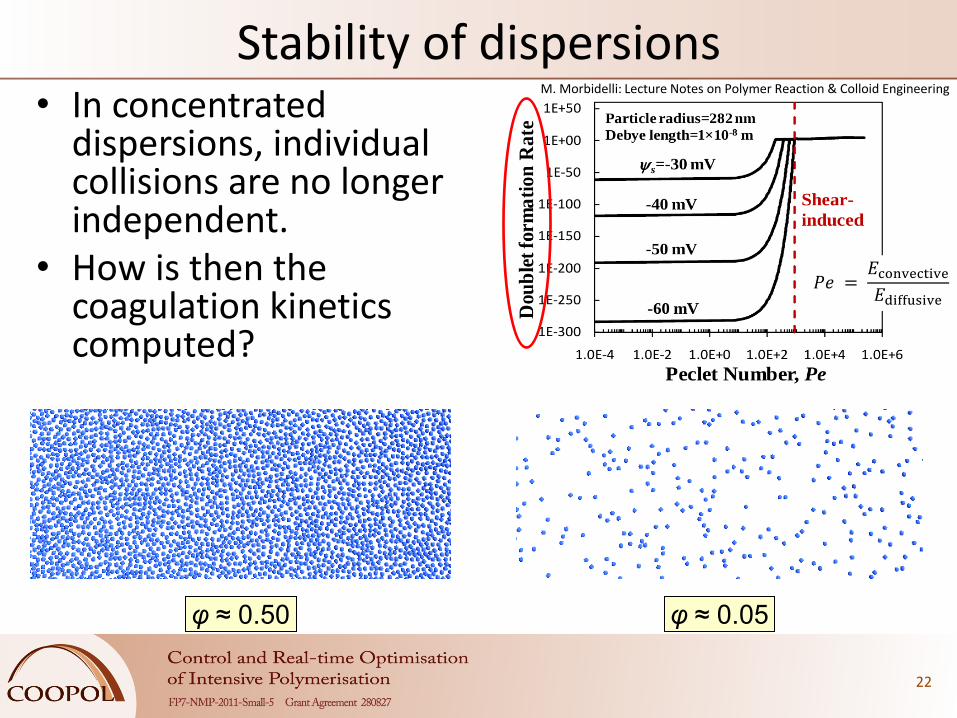
Stability of dispersions • In concentrated
dispersions, individual collisions are no longer independent.
• How is then the coagulation kinetics computed?
22
φ ≈ 0.05 φ ≈ 0.50
M. Morbidelli: Lecture Notes on Polymer Reaction & Colloid Engineering
𝑃𝑒 = 𝐸convective
𝐸diffusive
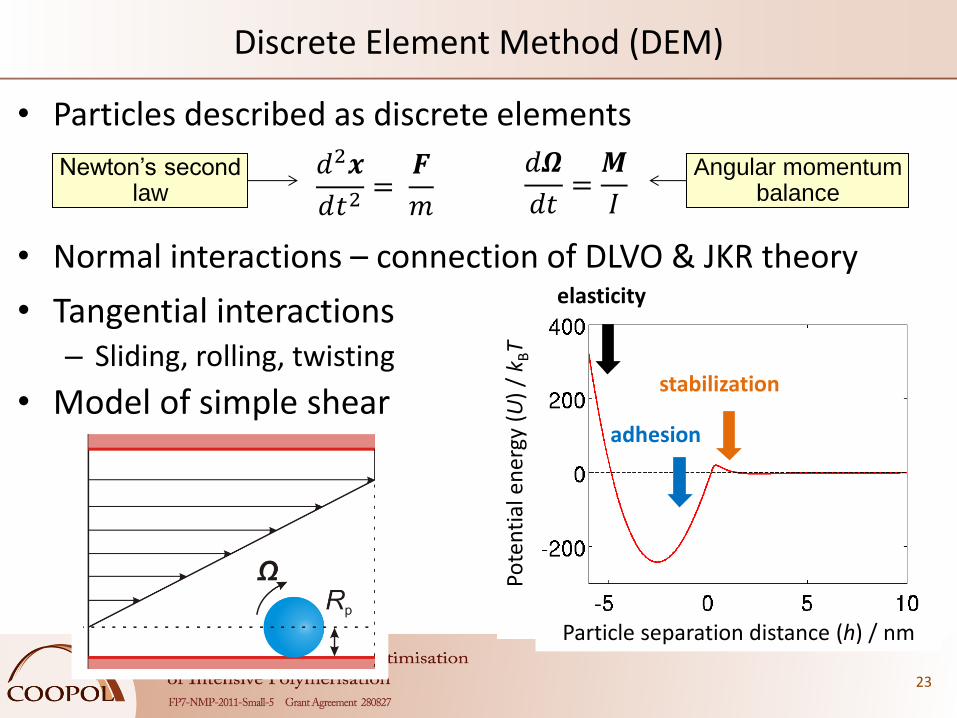
Discrete Element Method (DEM)
• Particles described as discrete elements
• Normal interactions – connection of DLVO & JKR theory
𝑑2𝒙
𝑑𝑡2=
𝑭
𝑚
𝑑𝜴
𝑑𝑡=
𝑴
𝐼
Newton’s second law
Angular momentum balance
Particle separation distance (h) / nm
Pote
nti
al e
ner
gy (
U)
/ k B
T
elasticity
adhesion
stabilization
• Tangential interactions – Sliding, rolling, twisting
• Model of simple shear
23
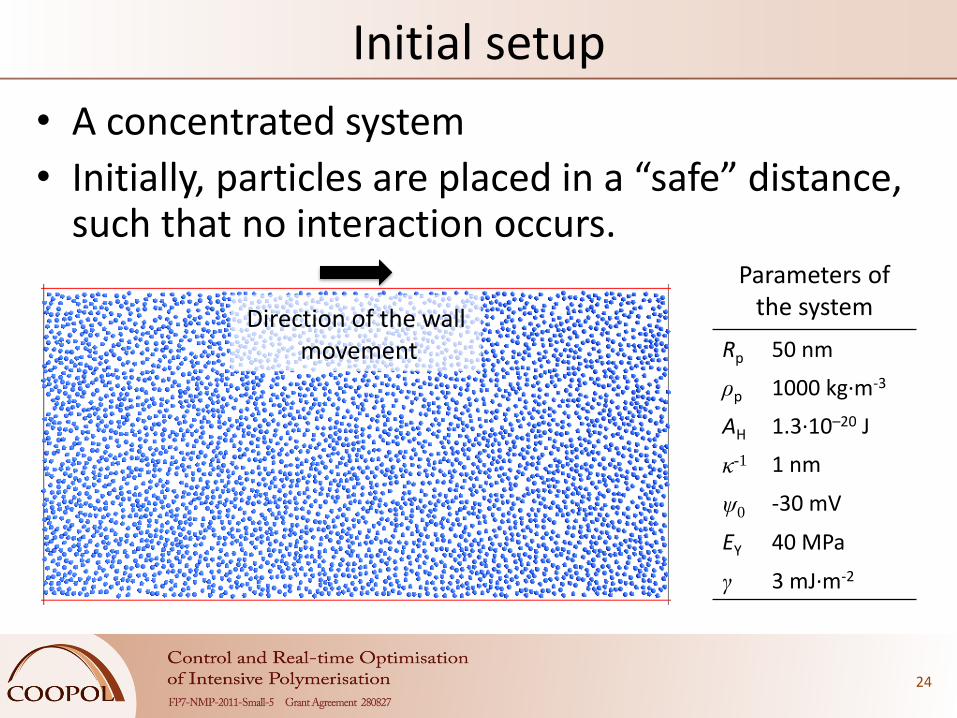
Initial setup
• A concentrated system
• Initially, particles are placed in a “safe” distance, such that no interaction occurs.
24
Direction of the wall movement Rp 50 nm
ρp 1000 kg·m-3
AH 1.3·10–20 J
κ-1 1 nm
ψ0 -30 mV
EY 40 MPa
γ 3 mJ·m-2
Parameters of the system
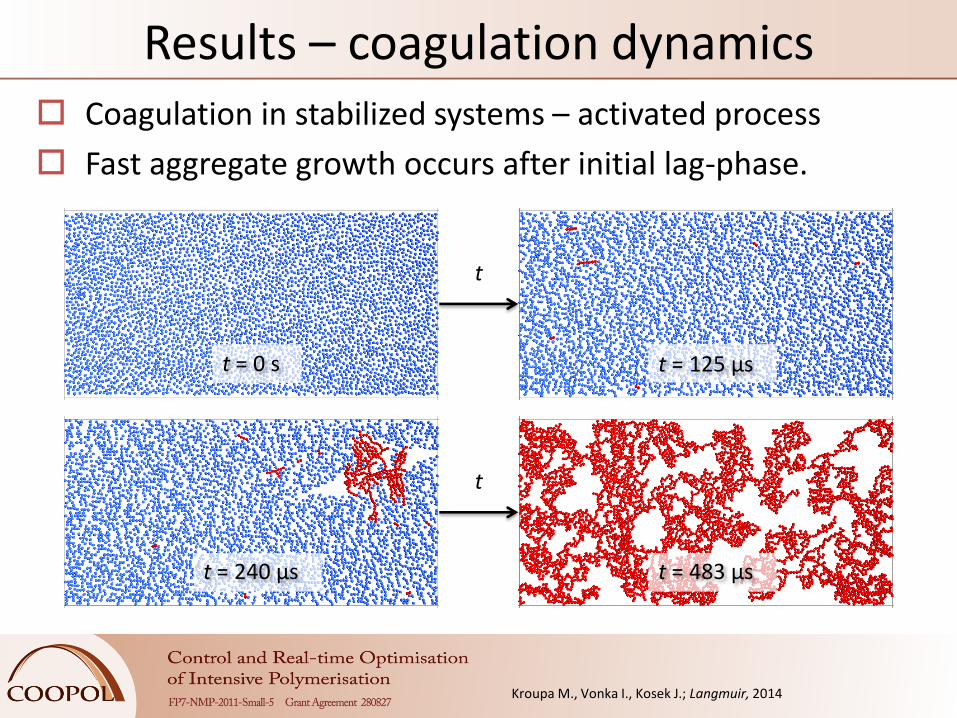
Results – coagulation dynamics
t = 0 s
t
t
t = 125 μs
t = 483 μs t = 240 μs
Coagulation in stabilized systems – activated process
Fast aggregate growth occurs after initial lag-phase.
Kroupa M., Vonka I., Kosek J.; Langmuir, 2014
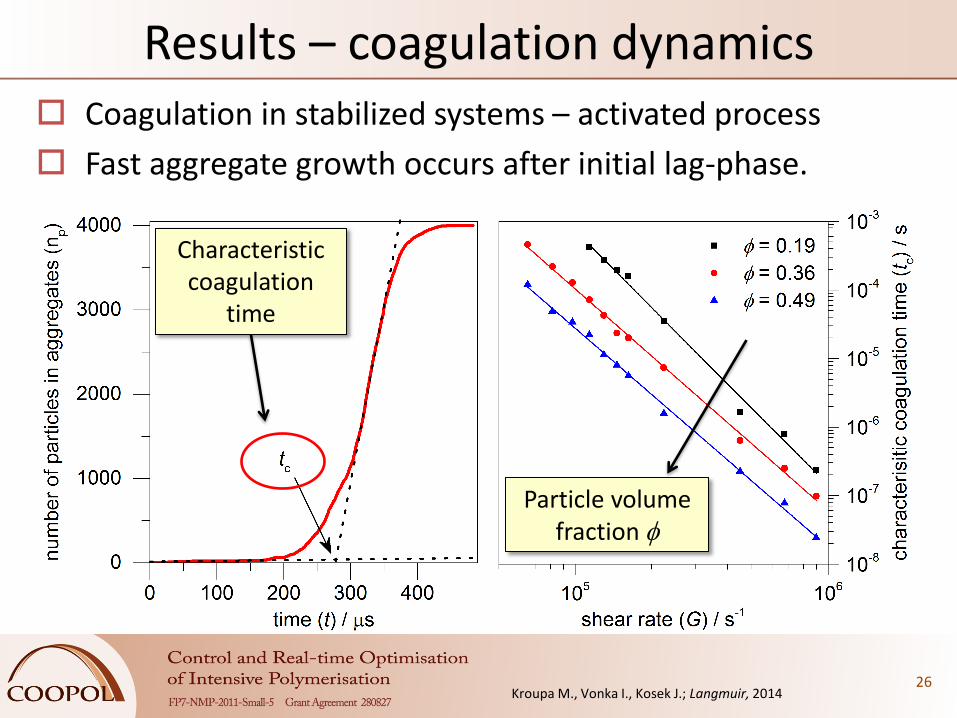
Results – coagulation dynamics
26
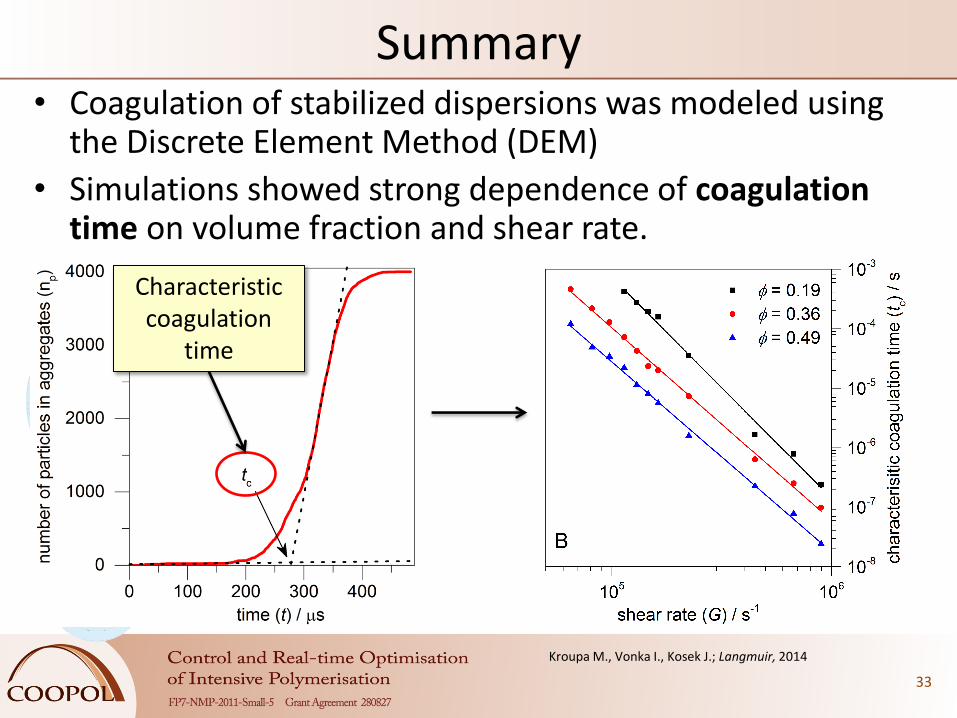
Characteristic coagulation
time
Coagulation in stabilized systems – activated process
Fast aggregate growth occurs after initial lag-phase.
Particle volume fraction
Kroupa M., Vonka I., Kosek J.; Langmuir, 2014
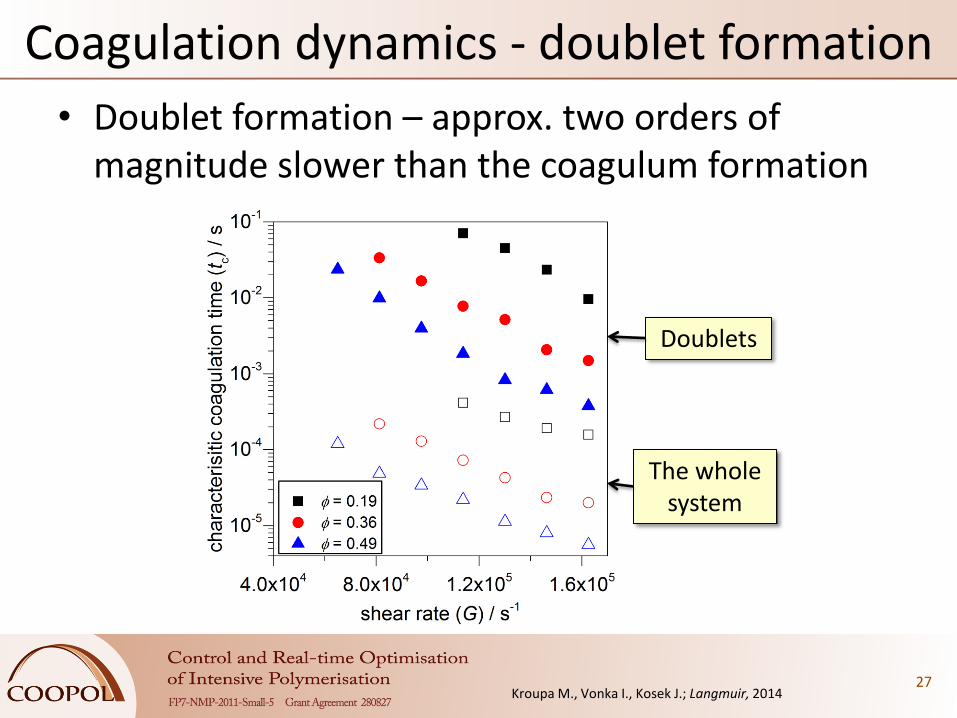
Coagulation dynamics - doublet formation
• Doublet formation – approx. two orders of magnitude slower than the coagulum formation
27
The whole system
Doublets
Kroupa M., Vonka I., Kosek J.; Langmuir, 2014
Size of the resulting clusters
28
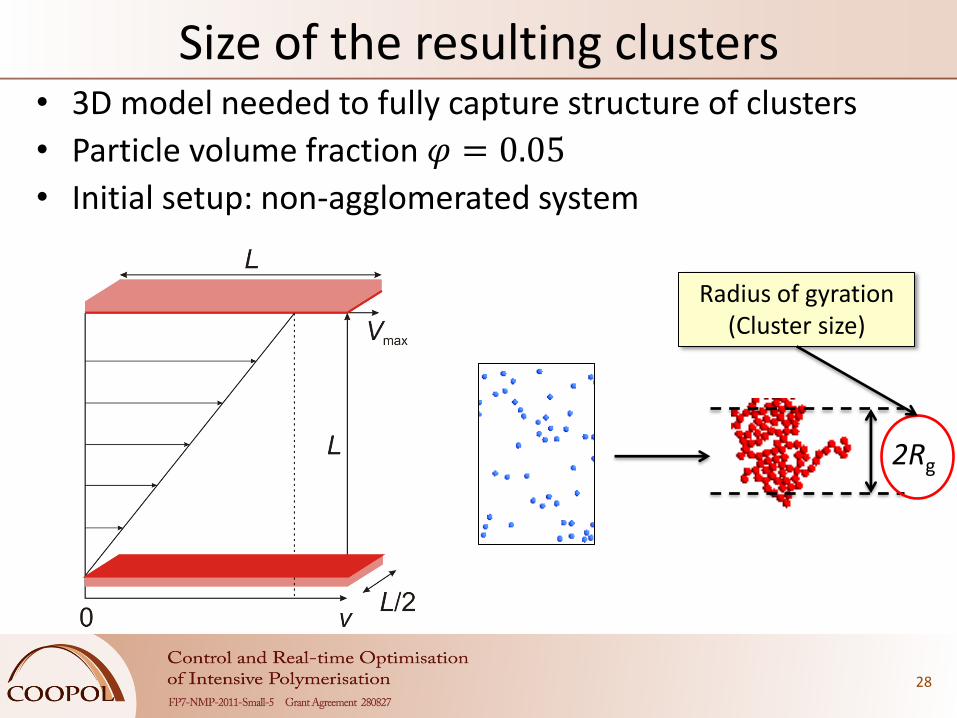
• 3D model needed to fully capture structure of clusters
• Particle volume fraction 𝜑 = 0.05
• Initial setup: non-agglomerated system
2Rg
Radius of gyration (Cluster size)
Size of the resulting clusters
29
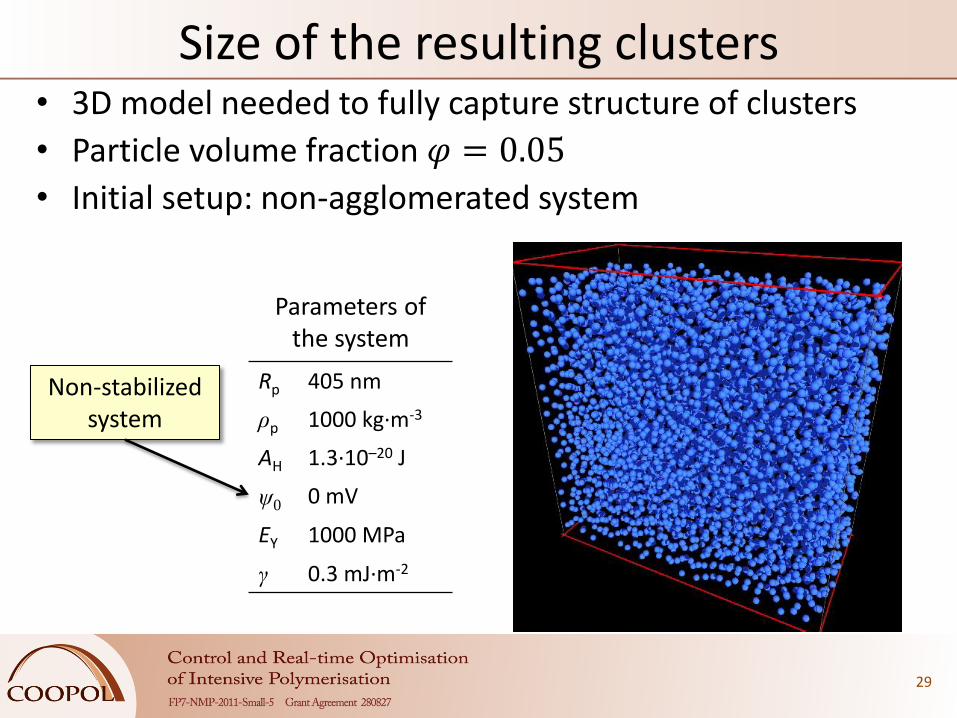
• 3D model needed to fully capture structure of clusters
• Particle volume fraction 𝜑 = 0.05
• Initial setup: non-agglomerated system
Rp 405 nm
ρp 1000 kg·m-3
AH 1.3·10–20 J
ψ0 0 mV
EY 1000 MPa
γ 0.3 mJ·m-2
Parameters of the system
Non-stabilized system

30
• Coagulation in non-stabilized system (no energy barrier)
• At the beginning controlled solely by coagulation
• The final size of aggregates is the result of interplay between coagulation and breakage
Size of clusters – non-stabilized
Surface energy γ (mJ·m-2)
Shear rate G (s-1)
31
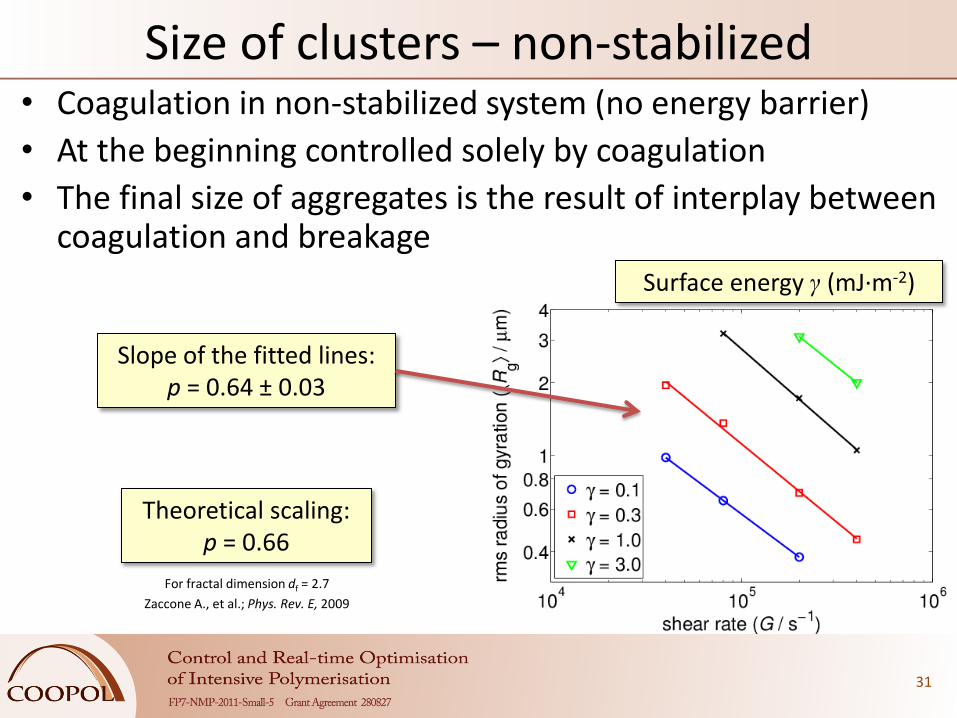
• Coagulation in non-stabilized system (no energy barrier)
• At the beginning controlled solely by coagulation
• The final size of aggregates is the result of interplay between coagulation and breakage
Size of clusters – non-stabilized
Surface energy γ (mJ·m-2)
Slope of the fitted lines: p = 0.64 ± 0.03
Theoretical scaling: p = 0.66
For fractal dimension df = 2.7
Zaccone A., et al.; Phys. Rev. E, 2009
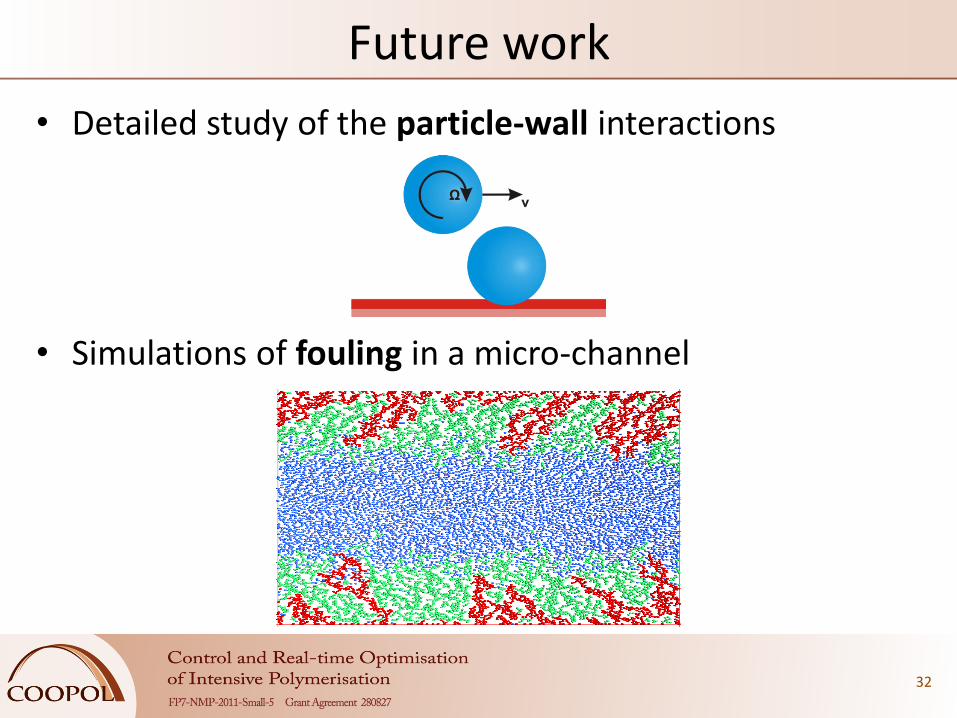
• Detailed study of the particle-wall interactions
32
Future work
• Simulations of fouling in a micro-channel
Characteristic coagulation
time
Summary
33
• Coagulation of stabilized dispersions was modeled using the Discrete Element Method (DEM)
• Simulations showed strong dependence of coagulation time on volume fraction and shear rate.
Kroupa M., Vonka I., Kosek J.; Langmuir, 2014
Summary
34
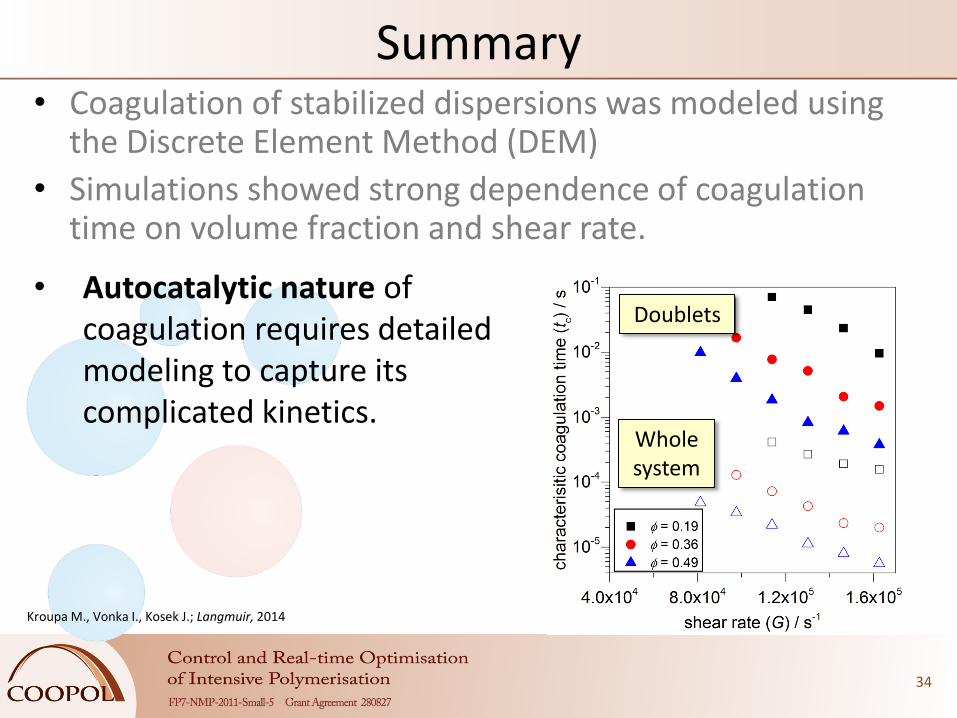
• Coagulation of stabilized dispersions was modeled using the Discrete Element Method (DEM)
• Simulations showed strong dependence of coagulation time on volume fraction and shear rate.
Kroupa M., Vonka I., Kosek J.; Langmuir, 2014
• Autocatalytic nature of coagulation requires detailed modeling to capture its complicated kinetics.
Whole system
Doublets
Summary
35
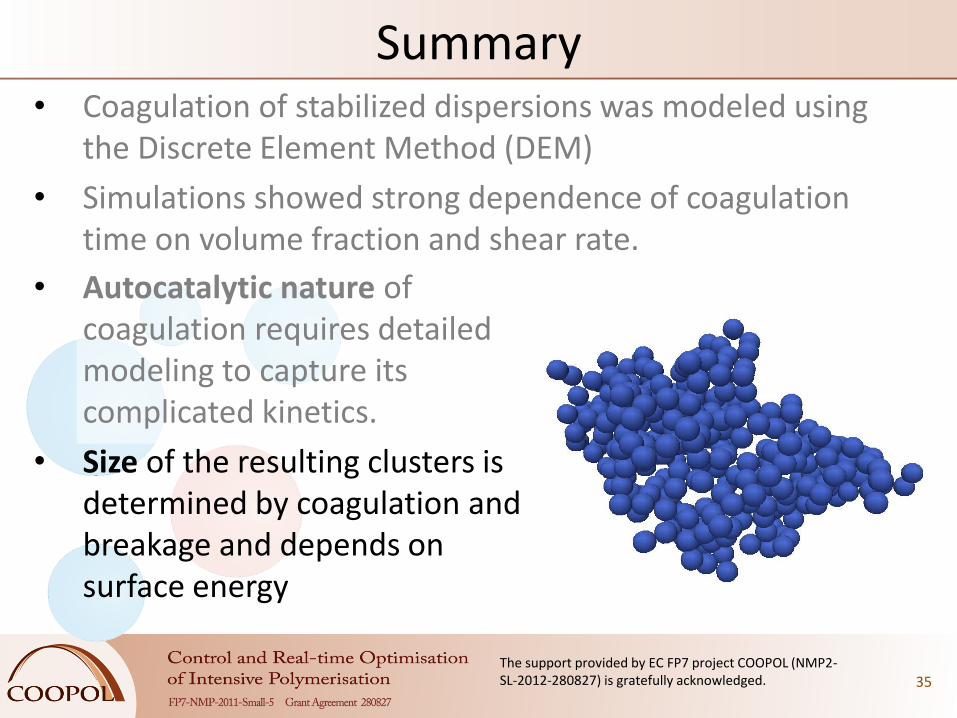
• Autocatalytic nature of coagulation requires detailed modeling to capture its complicated kinetics.
• Size of the resulting clusters is determined by coagulation and breakage and depends on surface energy
• Coagulation of stabilized dispersions was modeled using the Discrete Element Method (DEM)
• Simulations showed strong dependence of coagulation time on volume fraction and shear rate.
The support provided by EC FP7 project COOPOL (NMP2-SL-2012-280827) is gratefully acknowledged.
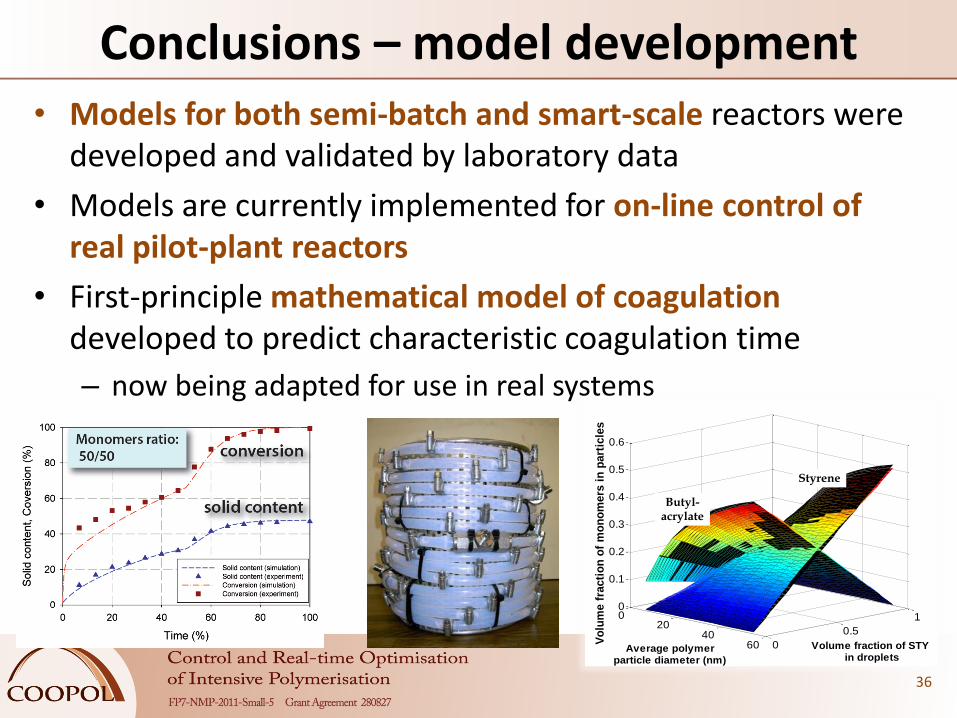
Conclusions – model development • Models for both semi-batch and smart-scale reactors were
developed and validated by laboratory data
• Models are currently implemented for on-line control of real pilot-plant reactors
• First-principle mathematical model of coagulation developed to predict characteristic coagulation time
– now being adapted for use in real systems
36
020
4060 0
0.5
10
0.1
0.2
0.3
0.4
0.5
0.6
Volume fraction of STY in droplets
Average polymerparticle diameter (nm)
Vo
lum
e f
racti
on
of
mo
no
mers
in
part
icle
s
Styrene
Butyl-acrylate
38