modeling anaerobic digestion of aquatic plants by rumen cultures: cattail as an example
TRANSCRIPT
w a t e r r e s e a r c h 4 3 ( 2 0 0 9 ) 2 0 4 7 – 2 0 5 5
Avai lab le a t www.sc iencedi rec t .com
journa l homepage : www.e lsev ie r . com/ loca te /wat res
Modeling anaerobic digestion of aquatic plants by rumencultures: Cattail as an example
Bai-Hang Zhaoa, Zheng-Bo Yuea, Bing-Jie Nia, Yang Mua, Han-Qing Yua,*, Hideki Haradab
aDepartment of Chemistry, University of Science & Technology of China, Hefei, 230026 ChinabDepartment of Civil Engineering, Tohoku University, Sendai 980-8579, Japan
a r t i c l e i n f o
Article history:
Received 29 September 2008
Received in revised form
19 December 2008
Accepted 5 February 2009
Published online 14 February 2009
Keywords:
Anaerobic digestion
Aquatic plant
Cattail
Hydrolysis
Modeling
Rumen microbes
Lignocellulose
* Corresponding author. Tel.: þ86 551 360759E-mail address: [email protected] (H.-Q.
0043-1354/$ – see front matter ª 2009 Elsevidoi:10.1016/j.watres.2009.02.006
a b s t r a c t
Despite of the significance of the anaerobic digestion of lignocellulosic materials, only
a limited number of studies have been carried out to evaluate the lignocellulosic digestion
kinetics, and information about the modeling of this process is limited. In this work,
a mathematical model, based on the Anaerobic Digestion Model No.1 (ADM1), was devel-
oped to describe the anaerobic conversion of lignocellulose-rich aquatic plants, with cattail
as an example, by rumen microbes. Cattail was fractionated into slowly hydrolysable
fraction (SHF), readily hydrolysable fraction (RHF) and inert fraction in the model. The SHF
was hydrolyzed by rumen microbes and resulted in the production of RHF. The SHF and
RHF had different hydrolysis rates but both with surface-limiting kinetics. The rumen
microbial population diversity, including the cattail-, butyrate-, acetate- and H2-degraders,
was all incorporated in the model structure. Experiments were carried out to identify the
parameters and to calibrate and validate this model. The simulation results match the
experimental data, implying that the fractionation of cattail into two biodegradation parts,
i.e., SHF and RHF, and modeling their hydrolysis rate with a surface-limiting kinetics were
appropriate. The model was capable of simulating the anaerobic biodegradation of cattail
by the rumen cultures.
ª 2009 Elsevier Ltd. All rights reserved.
1. Introduction (Ribes et al., 2004), it is found that this equation is unable to
The Anaerobic Digestion Model No.1 (ADM1) has been
proposed in early 2000s (Batstone et al., 2002), and has been
widely used to describe the anaerobic degradation of both
dissolved substrates and particulate, such as distillery
wastewater, dairy wastewater, cattle manure, primary sludge,
and municipal wastes (Tartakovsky et al., 2002; Flotats et al.,
2006; Vlyssides et al., 2007; Yasui et al., 2008). In ADM1, the
first-order kinetic equation is used to describe the hydrolysis
and microbial decay, and the Monod equation is used to
interpret the soluble components uptake and gas production.
Although the Monod equation is successfully used in
modeling the kinetics of cultures utilizing simple substrates
2; fax: þ86 551 3601592.Yu).er Ltd. All rights reserved
well predict the anaerobic hydrolysis of organic materials,
such as lignocellulosic wastes, because of their complexity in
composition and the multiple-hydrolysis process.
Recently, anaerobic conversion of lignocellulosic materials
is attracting increasing interests, attributed to the energy
crisis and their huge amount of annual production (Macias-
Corral et al., 2008). Lignocellulosic materials are usually the
main component of several types of agricultural, municipal,
and industrial wastes, e.g., corn stover, waste wood, and
paper. They can also be produced from the growth and
harvest of aquatic plants. Aquatic plant has been increasingly
used in phytoremediation for polluted water and contami-
nated soil (Yavitt and Knapp, 1998; DeLaune et al., 1999;
.
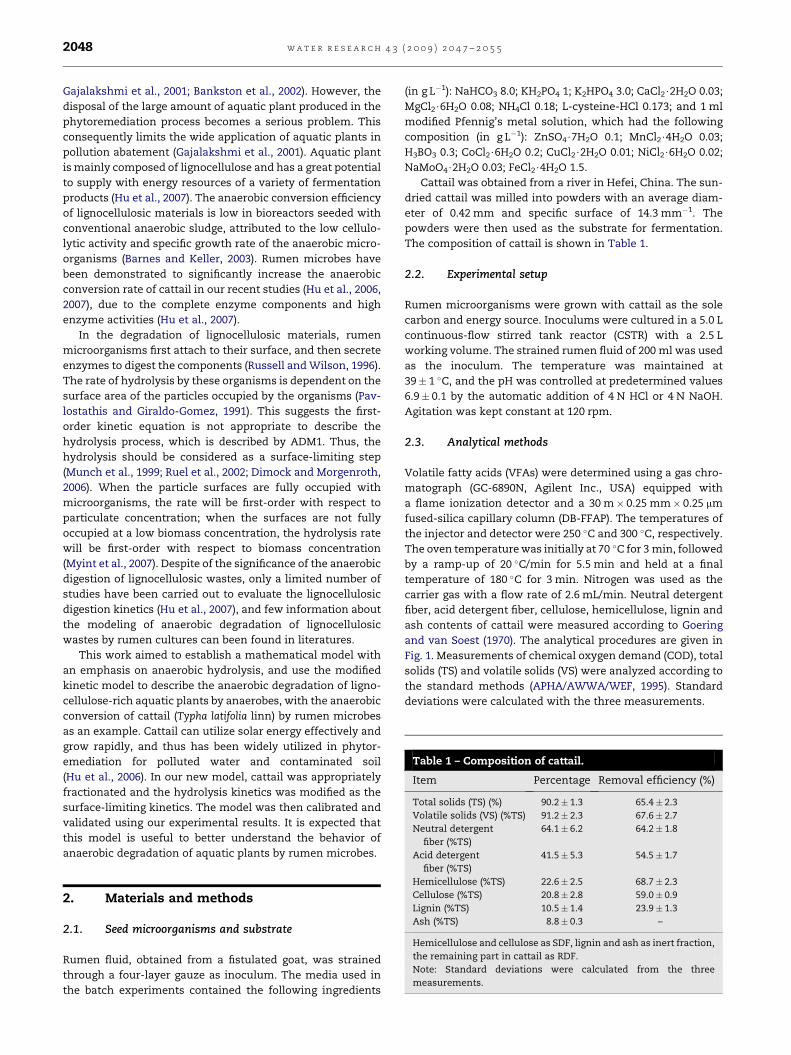
Table 1 – Composition of cattail.
Item Percentage Removal efficiency (%)
Total solids (TS) (%) 90.2� 1.3 65.4� 2.3
Volatile solids (VS) (%TS) 91.2� 2.3 67.6� 2.7
Neutral detergent
fiber (%TS)
64.1� 6.2 64.2� 1.8
Acid detergent 41.5� 5.3 54.5� 1.7
w a t e r r e s e a r c h 4 3 ( 2 0 0 9 ) 2 0 4 7 – 2 0 5 52048
Gajalakshmi et al., 2001; Bankston et al., 2002). However, the
disposal of the large amount of aquatic plant produced in the
phytoremediation process becomes a serious problem. This
consequently limits the wide application of aquatic plants in
pollution abatement (Gajalakshmi et al., 2001). Aquatic plant
is mainly composed of lignocellulose and has a great potential
to supply with energy resources of a variety of fermentation
products (Hu et al., 2007). The anaerobic conversion efficiency
of lignocellulosic materials is low in bioreactors seeded with
conventional anaerobic sludge, attributed to the low cellulo-
lytic activity and specific growth rate of the anaerobic micro-
organisms (Barnes and Keller, 2003). Rumen microbes have
been demonstrated to significantly increase the anaerobic
conversion rate of cattail in our recent studies (Hu et al., 2006,
2007), due to the complete enzyme components and high
enzyme activities (Hu et al., 2007).
In the degradation of lignocellulosic materials, rumen
microorganisms first attach to their surface, and then secrete
enzymes to digest the components (Russell and Wilson, 1996).
The rate of hydrolysis by these organisms is dependent on the
surface area of the particles occupied by the organisms (Pav-
lostathis and Giraldo-Gomez, 1991). This suggests the first-
order kinetic equation is not appropriate to describe the
hydrolysis process, which is described by ADM1. Thus, the
hydrolysis should be considered as a surface-limiting step
(Munch et al., 1999; Ruel et al., 2002; Dimock and Morgenroth,
2006). When the particle surfaces are fully occupied with
microorganisms, the rate will be first-order with respect to
particulate concentration; when the surfaces are not fully
occupied at a low biomass concentration, the hydrolysis rate
will be first-order with respect to biomass concentration
(Myint et al., 2007). Despite of the significance of the anaerobic
digestion of lignocellulosic wastes, only a limited number of
studies have been carried out to evaluate the lignocellulosic
digestion kinetics (Hu et al., 2007), and few information about
the modeling of anaerobic degradation of lignocellulosic
wastes by rumen cultures can been found in literatures.
This work aimed to establish a mathematical model with
an emphasis on anaerobic hydrolysis, and use the modified
kinetic model to describe the anaerobic degradation of ligno-
cellulose-rich aquatic plants by anaerobes, with the anaerobic
conversion of cattail (Typha latifolia linn) by rumen microbes
as an example. Cattail can utilize solar energy effectively and
grow rapidly, and thus has been widely utilized in phytor-
emediation for polluted water and contaminated soil
(Hu et al., 2006). In our new model, cattail was appropriately
fractionated and the hydrolysis kinetics was modified as the
surface-limiting kinetics. The model was then calibrated and
validated using our experimental results. It is expected that
this model is useful to better understand the behavior of
anaerobic degradation of aquatic plants by rumen microbes.
fiber (%TS)
Hemicellulose (%TS) 22.6� 2.5 68.7� 2.3
Cellulose (%TS) 20.8� 2.8 59.0� 0.9
Lignin (%TS) 10.5� 1.4 23.9� 1.3
Ash (%TS) 8.8� 0.3 –
Hemicellulose and cellulose as SDF, lignin and ash as inert fraction,
the remaining part in cattail as RDF.
Note: Standard deviations were calculated from the three
measurements.
2. Materials and methods
2.1. Seed microorganisms and substrate
Rumen fluid, obtained from a fistulated goat, was strained
through a four-layer gauze as inoculum. The media used in
the batch experiments contained the following ingredients
(in g L�1): NaHCO3 8.0; KH2PO4 1; K2HPO4 3.0; CaCl2$2H2O 0.03;
MgCl2$6H2O 0.08; NH4Cl 0.18; L-cysteine-HCl 0.173; and 1 ml
modified Pfennig’s metal solution, which had the following
composition (in g L�1): ZnSO4$7H2O 0.1; MnCl2$4H2O 0.03;
H3BO3 0.3; CoCl2$6H2O 0.2; CuCl2$2H2O 0.01; NiCl2$6H2O 0.02;
NaMoO4$2H2O 0.03; FeCl2$4H2O 1.5.
Cattail was obtained from a river in Hefei, China. The sun-
dried cattail was milled into powders with an average diam-
eter of 0.42 mm and specific surface of 14.3 mm�1. The
powders were then used as the substrate for fermentation.
The composition of cattail is shown in Table 1.
2.2. Experimental setup
Rumen microorganisms were grown with cattail as the sole
carbon and energy source. Inoculums were cultured in a 5.0 L
continuous-flow stirred tank reactor (CSTR) with a 2.5 L
working volume. The strained rumen fluid of 200 ml was used
as the inoculum. The temperature was maintained at
39� 1 �C, and the pH was controlled at predetermined values
6.9� 0.1 by the automatic addition of 4 N HCl or 4 N NaOH.
Agitation was kept constant at 120 rpm.
2.3. Analytical methods
Volatile fatty acids (VFAs) were determined using a gas chro-
matograph (GC-6890N, Agilent Inc., USA) equipped with
a flame ionization detector and a 30 m� 0.25 mm� 0.25 mm
fused-silica capillary column (DB-FFAP). The temperatures of
the injector and detector were 250 �C and 300 �C, respectively.
The oven temperature was initially at 70 �C for 3 min, followed
by a ramp-up of 20 �C/min for 5.5 min and held at a final
temperature of 180 �C for 3 min. Nitrogen was used as the
carrier gas with a flow rate of 2.6 mL/min. Neutral detergent
fiber, acid detergent fiber, cellulose, hemicellulose, lignin and
ash contents of cattail were measured according to Goering
and van Soest (1970). The analytical procedures are given in
Fig. 1. Measurements of chemical oxygen demand (COD), total
solids (TS) and volatile solids (VS) were analyzed according to
the standard methods (APHA/AWWA/WEF, 1995). Standard
deviations were calculated with the three measurements.
Cellulose, Hemicellulose, Lignin and Ash(NDF)
Cell contents
Cellulose, Lignin and Ash(ADF) Hemicellulose
Cattail
Lignin and AshCellulose
AshLignin
Digest with neutral detergent
Digest with acid detergent
Digest with 72 sulfuric acid
Remained at 650°C for 4 h
Fig. 1 – Analytical procedures for cattail.
w a t e r r e s e a r c h 4 3 ( 2 0 0 9 ) 2 0 4 7 – 2 0 5 5 2049
Biogas was measured using the water displacement
method. Biogas was analyzed by another gas chromatograph
(SP-6800, Lunan Co., China) equipped with a thermal
conductivity detector and a 1.5 m� 2 mm stainless-steel
column packed with 5 A molecular sieves. The temperatures
of the injector, detector and column were kept at 100, 105 and
60 �C, respectively. Argon was used as the carrier gas at a flow
rate of 30 mL/min.
3. Model development and simulation
This kinetic model describes the relationships among three
species: substrate, products and microorganisms; eleven bio-
processes; and four kinds of microbes. In addition to the
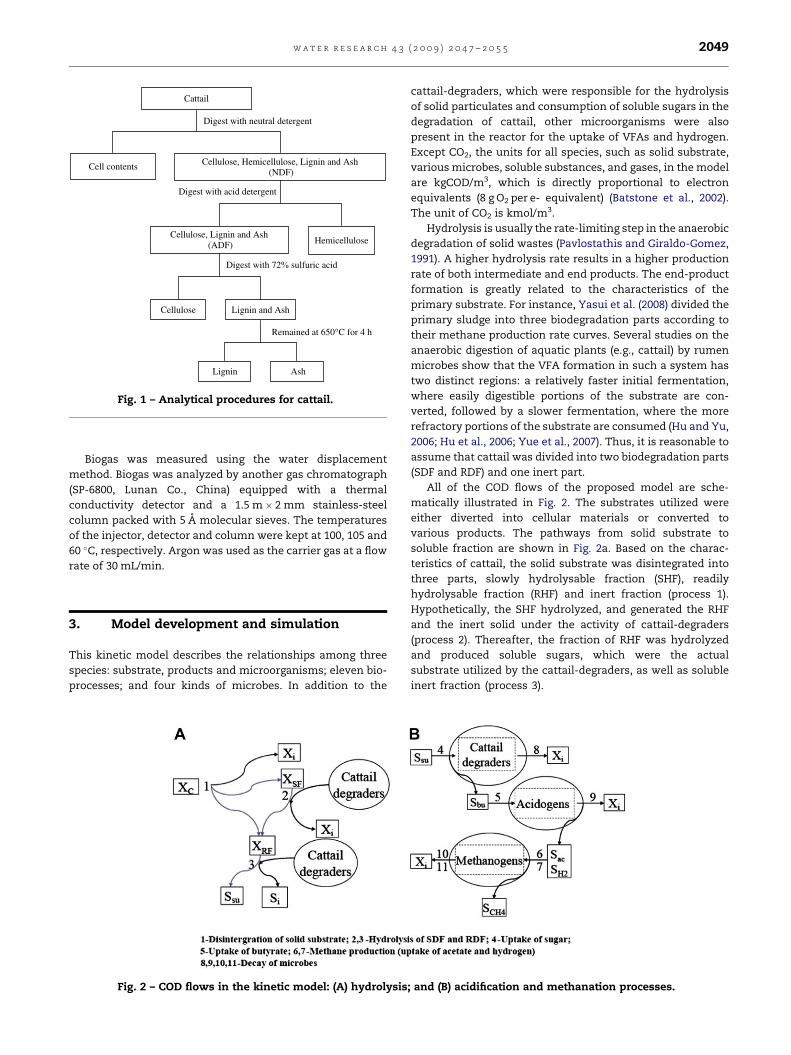
Fig. 2 – COD flows in the kinetic model: (A) hydrolysis
cattail-degraders, which were responsible for the hydrolysis
of solid particulates and consumption of soluble sugars in the
degradation of cattail, other microorganisms were also
present in the reactor for the uptake of VFAs and hydrogen.
Except CO2, the units for all species, such as solid substrate,
various microbes, soluble substances, and gases, in the model
are kgCOD/m3, which is directly proportional to electron
equivalents (8 g O2 per e- equivalent) (Batstone et al., 2002).
The unit of CO2 is kmol/m3.
Hydrolysis is usually the rate-limiting step in the anaerobic
degradation of solid wastes (Pavlostathis and Giraldo-Gomez,
1991). A higher hydrolysis rate results in a higher production
rate of both intermediate and end products. The end-product
formation is greatly related to the characteristics of the
primary substrate. For instance, Yasui et al. (2008) divided the
primary sludge into three biodegradation parts according to
their methane production rate curves. Several studies on the
anaerobic digestion of aquatic plants (e.g., cattail) by rumen
microbes show that the VFA formation in such a system has
two distinct regions: a relatively faster initial fermentation,
where easily digestible portions of the substrate are con-
verted, followed by a slower fermentation, where the more
refractory portions of the substrate are consumed (Hu and Yu,
2006; Hu et al., 2006; Yue et al., 2007). Thus, it is reasonable to
assume that cattail was divided into two biodegradation parts
(SDF and RDF) and one inert part.
All of the COD flows of the proposed model are sche-
matically illustrated in Fig. 2. The substrates utilized were
either diverted into cellular materials or converted to
various products. The pathways from solid substrate to
soluble fraction are shown in Fig. 2a. Based on the charac-
teristics of cattail, the solid substrate was disintegrated into
three parts, slowly hydrolysable fraction (SHF), readily
hydrolysable fraction (RHF) and inert fraction (process 1).
Hypothetically, the SHF hydrolyzed, and generated the RHF
and the inert solid under the activity of cattail-degraders
(process 2). Thereafter, the fraction of RHF was hydrolyzed
and produced soluble sugars, which were the actual
substrate utilized by the cattail-degraders, as well as soluble
inert fraction (process 3).
; and (B) acidification and methanation processes.
Ta
ble
2–
Pete
rso
n’s
ma
trix
for
CO
Dco
nse
rva
tio
nin
the
est
ab
lish
ed
mo
del.
jP
roce
ssX
CX
SF
XR
FS
su
Sb
uS
pr
Sa
cS
H2
SC
O2
SC
H4
Xi
Si
rj[k
gC
OD
/(m
3d
)]
1D
isin
tegra
tio
n�
1f S
F,C
f RF,C
fi, C
k dis
XC
2H
yd
roly
sis
of
SH
F�
1f R
F,S
Ffi
, SF
k hy
d;S
FX
SF=X
ca
Kh
yd;S
Fþ
XS
F=X
caX
ca
3H
yd
roly
sis
of
RH
F�
1f s
u,R
Ffi
,RF
k hy
d;R
FX
RF=X
ca
Kh
yd;R
Fþ
XR
F=X
caX
ca4
Up
tak
eo
fsu
ga
r�
1f b
u;s
uð1�
YcaÞ
f pr;
suð1�
YcaÞ
f ac;
suð1�
YcaÞ
f H2;s
uð1�
YcaÞ
�P
cðC
iÞyi;4
k m;s
uS
suK
s;suþ
Ssu
Xca
5U
pta
ke
of
bu
tyra
te�
10:8ð1�
Yb
uÞ
0:2ð1�
Yb
uÞ
k m;b
uS
bu
Ks;
buþ
Sb
uX
bu
6U
pta
ke
of
ace
tate
�P
cðC
iÞyi;6
1�
Ya
c
k m;a
cS
ac
Ks;
acþ
S acX
ac
7U
pta
ke
of
hy
dro
gen
�1
�P
cðC
iÞyi;7
1�
YH
2
k m;H
2
SH
2K
S;H
2þ
S H2X
H2
8D
eca
yo
fX
ca
k decX
ca
9D
eca
yo
fX
bu
k decX
bu
10
Deca
yo
fX
ac
k decX
ac
11
Deca
yo
fX
H2
k decX
H2
w a t e r r e s e a r c h 4 3 ( 2 0 0 9 ) 2 0 4 7 – 2 0 5 52050
Fig. 2b shows the relationships of the various soluble frac-
tions and relevant microorganisms, the approach of substrate
transformation, and the microbial growth and decay. The
soluble component and the gas were removed by relevant
microorganisms in the processes 4–7. The growth of four types
of microorganisms was coupling with the substrates uptake in
the processes 4–7. The processes 8–11 represented the decay of
microorganisms, i.e., the cattail-, butyrate-, acetate-, and
H2-degraders. The microbial decay in the processes 8–11
released inert residual particulate compounds, which didn’t
participate in the biochemical reactions.
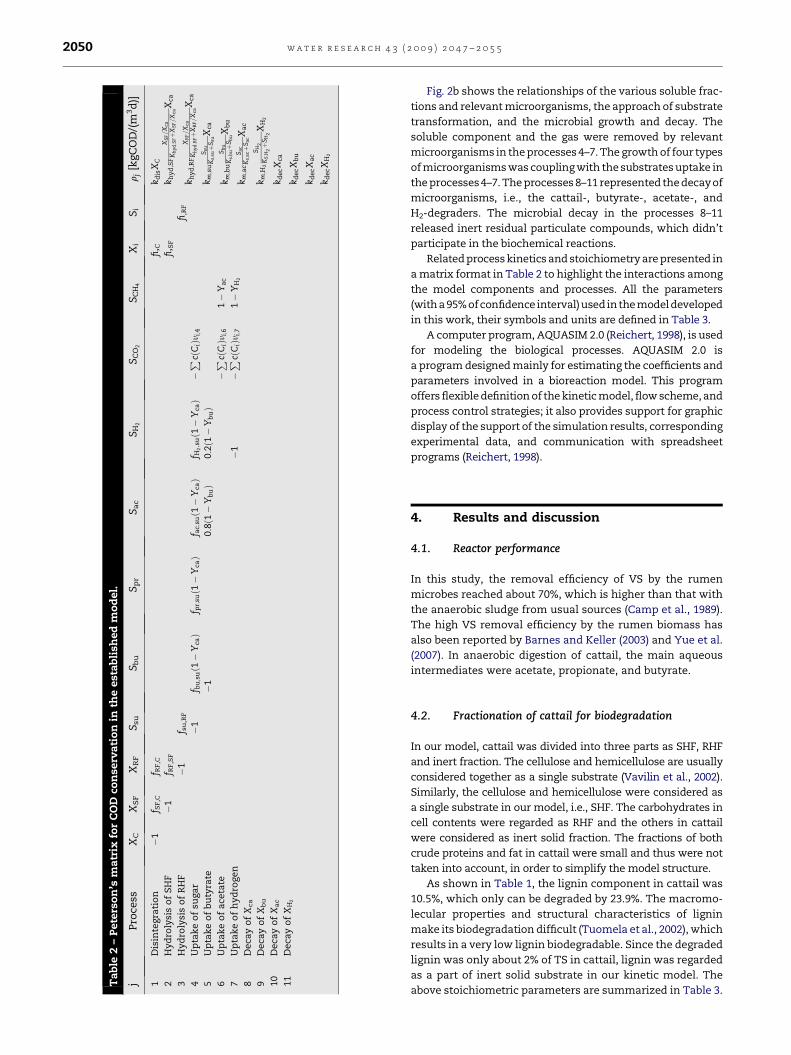
Related process kinetics and stoichiometry are presented in
a matrix format in Table 2 to highlight the interactions among
the model components and processes. All the parameters
(with a 95% ofconfidence interval)usedinthe model developed
in this work, their symbols and units are defined in Table 3.
A computer program, AQUASIM 2.0 (Reichert, 1998), is used
for modeling the biological processes. AQUASIM 2.0 is
a program designed mainly for estimating the coefficients and
parameters involved in a bioreaction model. This program
offers flexible definition of the kinetic model, flow scheme, and
process control strategies; it also provides support for graphic
display of the support of the simulation results, corresponding
experimental data, and communication with spreadsheet
programs (Reichert, 1998).
4. Results and discussion
4.1. Reactor performance
In this study, the removal efficiency of VS by the rumen
microbes reached about 70%, which is higher than that with
the anaerobic sludge from usual sources (Camp et al., 1989).
The high VS removal efficiency by the rumen biomass has
also been reported by Barnes and Keller (2003) and Yue et al.
(2007). In anaerobic digestion of cattail, the main aqueous
intermediates were acetate, propionate, and butyrate.
4.2. Fractionation of cattail for biodegradation
In our model, cattail was divided into three parts as SHF, RHF
and inert fraction. The cellulose and hemicellulose are usually
considered together as a single substrate (Vavilin et al., 2002).
Similarly, the cellulose and hemicellulose were considered as
a single substrate in our model, i.e., SHF. The carbohydrates in
cell contents were regarded as RHF and the others in cattail
were considered as inert solid fraction. The fractions of both
crude proteins and fat in cattail were small and thus were not
taken into account, in order to simplify the model structure.
As shown in Table 1, the lignin component in cattail was
10.5%, which only can be degraded by 23.9%. The macromo-
lecular properties and structural characteristics of lignin
make its biodegradation difficult (Tuomela et al., 2002), which
results in a very low lignin biodegradable. Since the degraded
lignin was only about 2% of TS in cattail, lignin was regarded
as a part of inert solid substrate in our kinetic model. The
above stoichiometric parameters are summarized in Table 3.
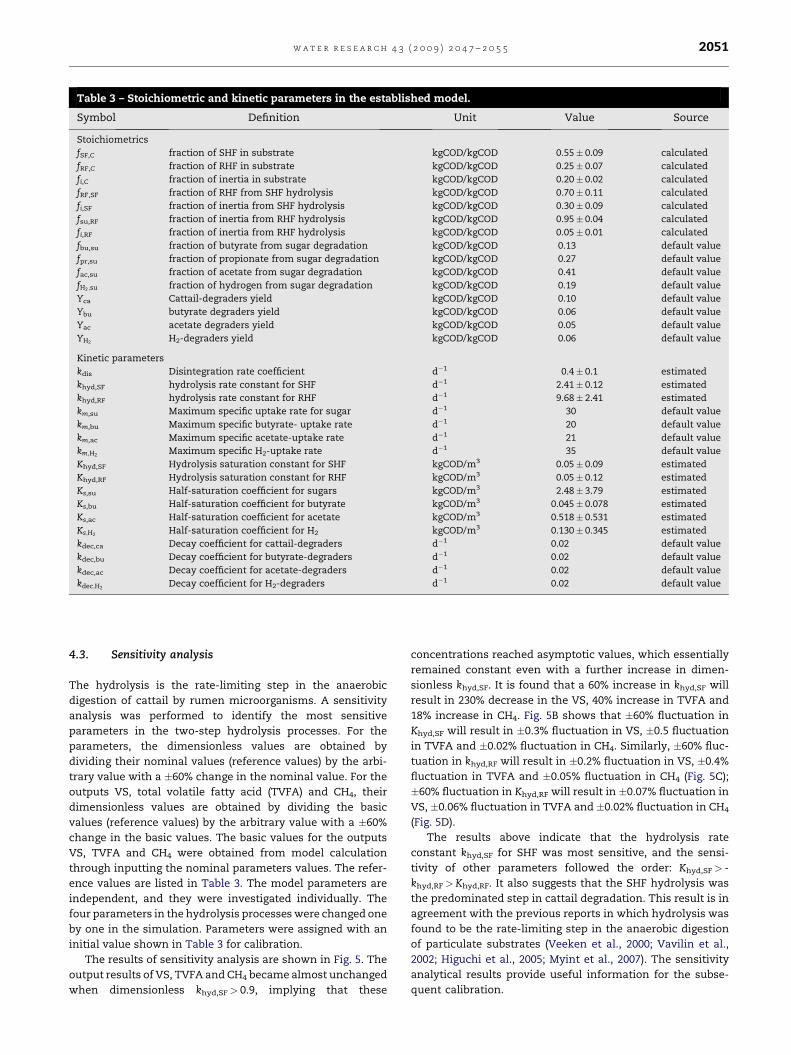
Table 3 – Stoichiometric and kinetic parameters in the established model.
Symbol Definition Unit Value Source
Stoichiometrics
fSF,C fraction of SHF in substrate kgCOD/kgCOD 0.55� 0.09 calculated
fRF,C fraction of RHF in substrate kgCOD/kgCOD 0.25� 0.07 calculated
fi,C fraction of inertia in substrate kgCOD/kgCOD 0.20� 0.02 calculated
fRF,SF fraction of RHF from SHF hydrolysis kgCOD/kgCOD 0.70� 0.11 calculated
fi,SF fraction of inertia from SHF hydrolysis kgCOD/kgCOD 0.30� 0.09 calculated
fsu,RF fraction of inertia from RHF hydrolysis kgCOD/kgCOD 0.95� 0.04 calculated
fi,RF fraction of inertia from RHF hydrolysis kgCOD/kgCOD 0.05� 0.01 calculated
fbu,su fraction of butyrate from sugar degradation kgCOD/kgCOD 0.13 default value
fpr,su fraction of propionate from sugar degradation kgCOD/kgCOD 0.27 default value
fac,su fraction of acetate from sugar degradation kgCOD/kgCOD 0.41 default value
fH2 ;su fraction of hydrogen from sugar degradation kgCOD/kgCOD 0.19 default value
Yca Cattail-degraders yield kgCOD/kgCOD 0.10 default value
Ybu butyrate degraders yield kgCOD/kgCOD 0.06 default value
Yac acetate degraders yield kgCOD/kgCOD 0.05 default value
YH2 H2-degraders yield kgCOD/kgCOD 0.06 default value
Kinetic parameters
kdis Disintegration rate coefficient d�1 0.4� 0.1 estimated
khyd,SF hydrolysis rate constant for SHF d�1 2.41� 0.12 estimated
khyd,RF hydrolysis rate constant for RHF d�1 9.68� 2.41 estimated
km,su Maximum specific uptake rate for sugar d�1 30 default value
km,bu Maximum specific butyrate- uptake rate d�1 20 default value
km,ac Maximum specific acetate-uptake rate d�1 21 default value
km;H2 Maximum specific H2-uptake rate d�1 35 default value
Khyd,SF Hydrolysis saturation constant for SHF kgCOD/m3 0.05� 0.09 estimated
Khyd,RF Hydrolysis saturation constant for RHF kgCOD/m3 0.05� 0.12 estimated
Ks,su Half-saturation coefficient for sugars kgCOD/m3 2.48� 3.79 estimated
Ks,bu Half-saturation coefficient for butyrate kgCOD/m3 0.045� 0.078 estimated
Ks,ac Half-saturation coefficient for acetate kgCOD/m3 0.518� 0.531 estimated
Ks;H2 Half-saturation coefficient for H2 kgCOD/m3 0.130� 0.345 estimated
kdec,ca Decay coefficient for cattail-degraders d�1 0.02 default value
kdec,bu Decay coefficient for butyrate-degraders d�1 0.02 default value
kdec,ac Decay coefficient for acetate-degraders d�1 0.02 default value
kdec;H2Decay coefficient for H2-degraders d�1 0.02 default value
w a t e r r e s e a r c h 4 3 ( 2 0 0 9 ) 2 0 4 7 – 2 0 5 5 2051
4.3. Sensitivity analysis
The hydrolysis is the rate-limiting step in the anaerobic
digestion of cattail by rumen microorganisms. A sensitivity
analysis was performed to identify the most sensitive
parameters in the two-step hydrolysis processes. For the
parameters, the dimensionless values are obtained by
dividing their nominal values (reference values) by the arbi-
trary value with a �60% change in the nominal value. For the
outputs VS, total volatile fatty acid (TVFA) and CH4, their
dimensionless values are obtained by dividing the basic
values (reference values) by the arbitrary value with a �60%
change in the basic values. The basic values for the outputs
VS, TVFA and CH4 were obtained from model calculation
through inputting the nominal parameters values. The refer-
ence values are listed in Table 3. The model parameters are
independent, and they were investigated individually. The
four parameters in the hydrolysis processes were changed one
by one in the simulation. Parameters were assigned with an
initial value shown in Table 3 for calibration.
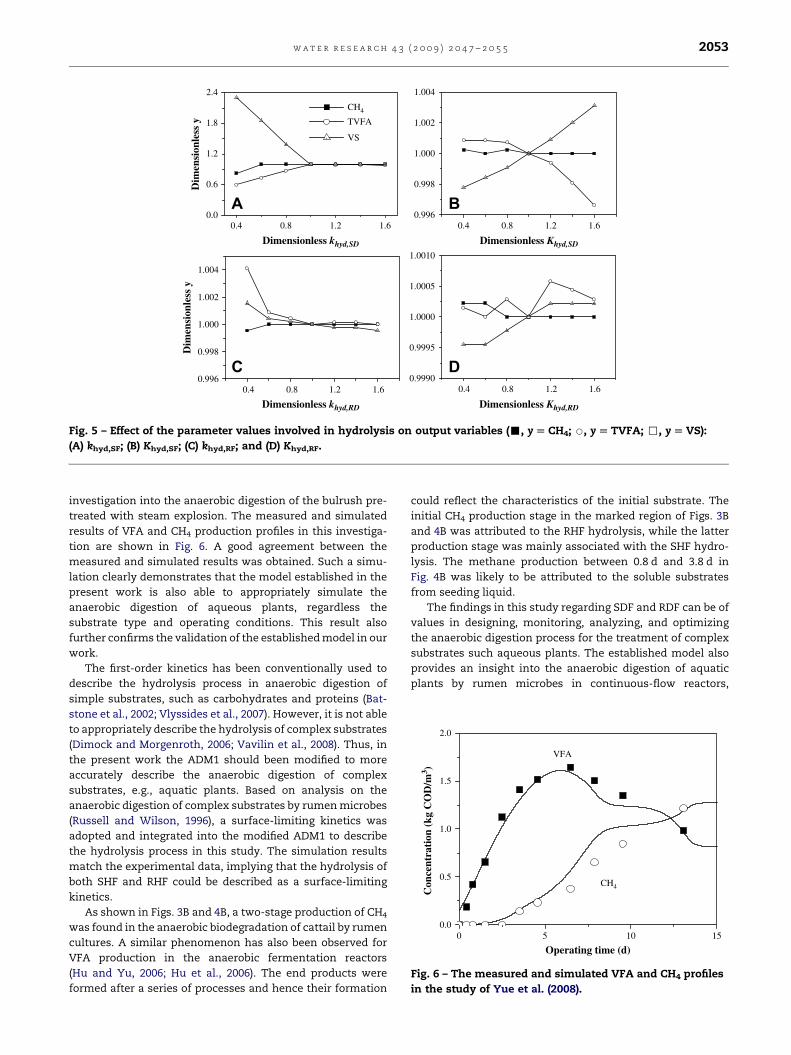
The results of sensitivity analysis are shown in Fig. 5. The
output results of VS, TVFA and CH4 became almost unchanged
when dimensionless khyd,SF> 0.9, implying that these
concentrations reached asymptotic values, which essentially
remained constant even with a further increase in dimen-
sionless khyd,SF. It is found that a 60% increase in khyd,SF will
result in 230% decrease in the VS, 40% increase in TVFA and
18% increase in CH4. Fig. 5B shows that �60% fluctuation in
Khyd,SF will result in �0.3% fluctuation in VS, �0.5 fluctuation
in TVFA and �0.02% fluctuation in CH4. Similarly, �60% fluc-
tuation in khyd,RF will result in �0.2% fluctuation in VS, �0.4%
fluctuation in TVFA and �0.05% fluctuation in CH4 (Fig. 5C);
�60% fluctuation in Khyd,RF will result in �0.07% fluctuation in
VS, �0.06% fluctuation in TVFA and �0.02% fluctuation in CH4
(Fig. 5D).
The results above indicate that the hydrolysis rate
constant khyd,SF for SHF was most sensitive, and the sensi-
tivity of other parameters followed the order: Khyd,SF> -
khyd,RF> Khyd,RF. It also suggests that the SHF hydrolysis was
the predominated step in cattail degradation. This result is in
agreement with the previous reports in which hydrolysis was
found to be the rate-limiting step in the anaerobic digestion
of particulate substrates (Veeken et al., 2000; Vavilin et al.,
2002; Higuchi et al., 2005; Myint et al., 2007). The sensitivity
analytical results provide useful information for the subse-
quent calibration.
0 2 4 6 8 100.0
0.7
1.4
2.1
2.8
0 2 4 6 8 100.0
0.6
1.2
1.8
2.4
Acetate
Propionate
Butyrate
VF
A (
kg C
OD
/m3 )
CH
4 (k
g C
OD
/m3 )
Operating time (d)
A
B
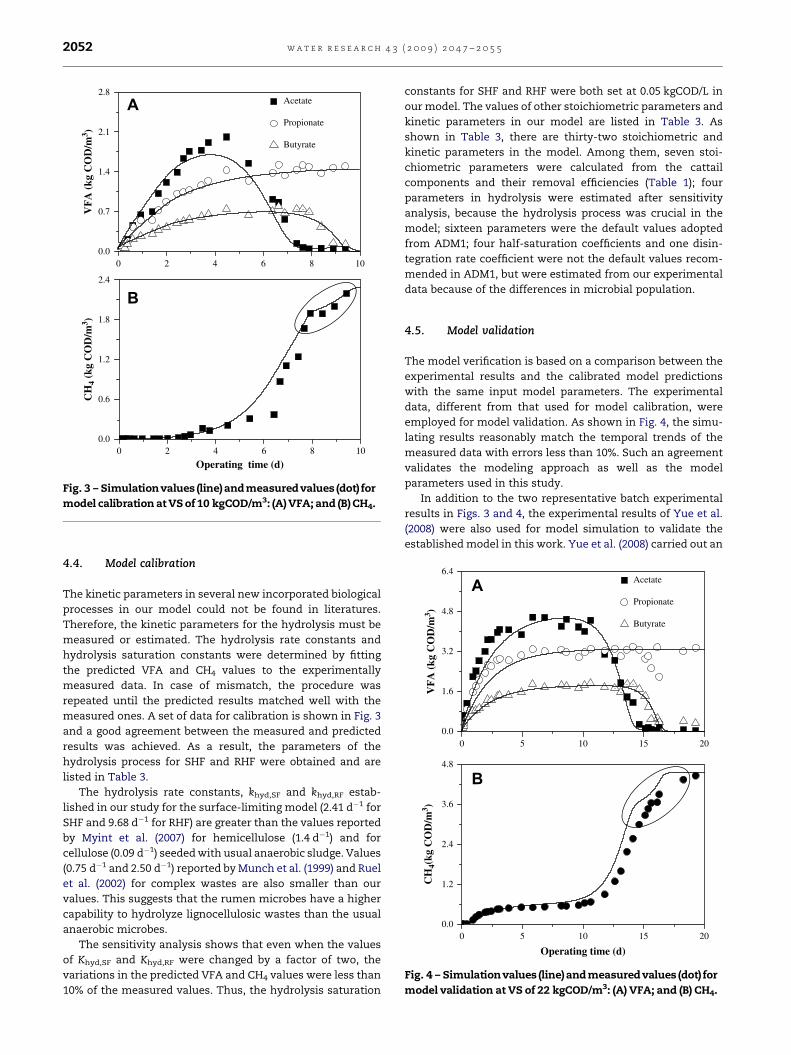
Fig. 3 – Simulationvalues (line) andmeasuredvalues (dot) for
model calibration at VS of 10 kgCOD/m3: (A) VFA; and (B) CH4.
0 5 10 15 200.0
1.2
2.4
3.6
4.8
0 5 10 15 200.0
1.6
3.2
4.8
6.4
CH
4(kg
CO
D/m
3 )
Operating time (d)
B
Acetate
Propionate
Butyrate
VF
A (
kg C
OD
/m3 )
A
Fig. 4 – Simulationvalues (line) and measured values (dot) for
model validation at VS of 22 kgCOD/m3: (A) VFA; and (B) CH4.
w a t e r r e s e a r c h 4 3 ( 2 0 0 9 ) 2 0 4 7 – 2 0 5 52052
4.4. Model calibration
The kinetic parameters in several new incorporated biological
processes in our model could not be found in literatures.
Therefore, the kinetic parameters for the hydrolysis must be
measured or estimated. The hydrolysis rate constants and
hydrolysis saturation constants were determined by fitting
the predicted VFA and CH4 values to the experimentally
measured data. In case of mismatch, the procedure was
repeated until the predicted results matched well with the
measured ones. A set of data for calibration is shown in Fig. 3
and a good agreement between the measured and predicted
results was achieved. As a result, the parameters of the
hydrolysis process for SHF and RHF were obtained and are
listed in Table 3.
The hydrolysis rate constants, khyd,SF and khyd,RF estab-
lished in our study for the surface-limiting model (2.41 d�1 for
SHF and 9.68 d�1 for RHF) are greater than the values reported
by Myint et al. (2007) for hemicellulose (1.4 d�1) and for
cellulose (0.09 d�1) seeded with usual anaerobic sludge. Values
(0.75 d�1 and 2.50 d�1) reported by Munch et al. (1999) and Ruel
et al. (2002) for complex wastes are also smaller than our
values. This suggests that the rumen microbes have a higher
capability to hydrolyze lignocellulosic wastes than the usual
anaerobic microbes.
The sensitivity analysis shows that even when the values
of Khyd,SF and Khyd,RF were changed by a factor of two, the
variations in the predicted VFA and CH4 values were less than
10% of the measured values. Thus, the hydrolysis saturation
constants for SHF and RHF were both set at 0.05 kgCOD/L in
our model. The values of other stoichiometric parameters and
kinetic parameters in our model are listed in Table 3. As
shown in Table 3, there are thirty-two stoichiometric and
kinetic parameters in the model. Among them, seven stoi-
chiometric parameters were calculated from the cattail
components and their removal efficiencies (Table 1); four
parameters in hydrolysis were estimated after sensitivity
analysis, because the hydrolysis process was crucial in the
model; sixteen parameters were the default values adopted
from ADM1; four half-saturation coefficients and one disin-
tegration rate coefficient were not the default values recom-
mended in ADM1, but were estimated from our experimental
data because of the differences in microbial population.
4.5. Model validation
The model verification is based on a comparison between the
experimental results and the calibrated model predictions
with the same input model parameters. The experimental
data, different from that used for model calibration, were
employed for model validation. As shown in Fig. 4, the simu-
lating results reasonably match the temporal trends of the
measured data with errors less than 10%. Such an agreement
validates the modeling approach as well as the model
parameters used in this study.
In addition to the two representative batch experimental
results in Figs. 3 and 4, the experimental results of Yue et al.
(2008) were also used for model simulation to validate the
established model in this work. Yue et al. (2008) carried out an
0.9990
0.9995
1.0000
1.0005
1.0010
0.998
1.000
1.002
1.004
0.4 0.8 1.2 1.60.4 0.8 1.2 1.60.996
0.998
1.000
1.002
1.004
0.00.4 0.8 1.2 1.6
0.9960.4 0.8 1.2 1.6
0.6
1.2
1.8
2.4
Dimensionless Khyd,SD
Dim
ensi
onle
ss y
Dim
ensi
onle
ss y
Dimensionless khyd,SD
Dimensionless Khyd,RDDimensionless khyd,RD
CH4
TVFA
VS
A B
C D
Fig. 5 – Effect of the parameter values involved in hydrolysis on output variables (-, y [ CH4; B, y [ TVFA; ,, y [ VS):
(A) khyd,SF; (B) Khyd,SF; (C) khyd,RF; and (D) Khyd,RF.
0 5 10 150.0
0.5
1.0
1.5
2.0
Con
cent
rati
on (
kg C
OD
/m3 )
Operating time (d)
VFA
CH4
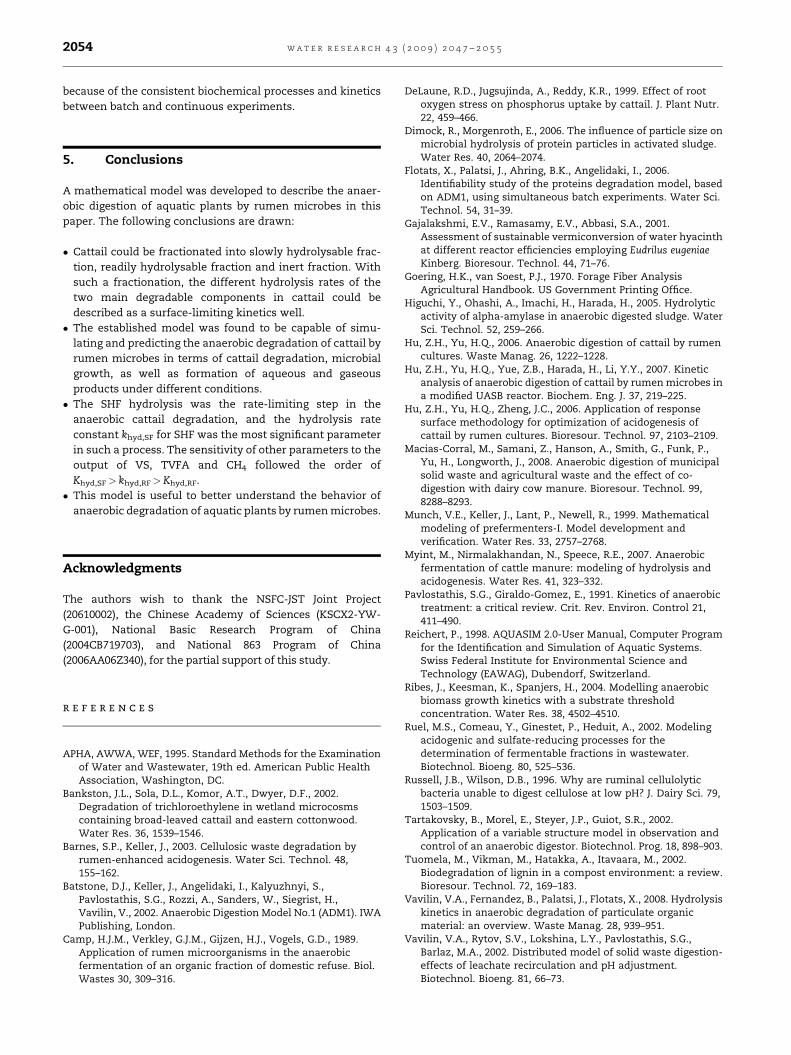
Fig. 6 – The measured and simulated VFA and CH4 profiles
in the study of Yue et al. (2008).
w a t e r r e s e a r c h 4 3 ( 2 0 0 9 ) 2 0 4 7 – 2 0 5 5 2053
investigation into the anaerobic digestion of the bulrush pre-
treated with steam explosion. The measured and simulated
results of VFA and CH4 production profiles in this investiga-
tion are shown in Fig. 6. A good agreement between the
measured and simulated results was obtained. Such a simu-
lation clearly demonstrates that the model established in the
present work is also able to appropriately simulate the
anaerobic digestion of aqueous plants, regardless the
substrate type and operating conditions. This result also
further confirms the validation of the established model in our
work.
The first-order kinetics has been conventionally used to
describe the hydrolysis process in anaerobic digestion of
simple substrates, such as carbohydrates and proteins (Bat-
stone et al., 2002; Vlyssides et al., 2007). However, it is not able
to appropriately describe the hydrolysis of complex substrates
(Dimock and Morgenroth, 2006; Vavilin et al., 2008). Thus, in
the present work the ADM1 should been modified to more
accurately describe the anaerobic digestion of complex
substrates, e.g., aquatic plants. Based on analysis on the
anaerobic digestion of complex substrates by rumen microbes
(Russell and Wilson, 1996), a surface-limiting kinetics was
adopted and integrated into the modified ADM1 to describe
the hydrolysis process in this study. The simulation results
match the experimental data, implying that the hydrolysis of
both SHF and RHF could be described as a surface-limiting
kinetics.
As shown in Figs. 3B and 4B, a two-stage production of CH4
was found in the anaerobic biodegradation of cattail by rumen
cultures. A similar phenomenon has also been observed for
VFA production in the anaerobic fermentation reactors
(Hu and Yu, 2006; Hu et al., 2006). The end products were
formed after a series of processes and hence their formation
could reflect the characteristics of the initial substrate. The
initial CH4 production stage in the marked region of Figs. 3B
and 4B was attributed to the RHF hydrolysis, while the latter
production stage was mainly associated with the SHF hydro-
lysis. The methane production between 0.8 d and 3.8 d in
Fig. 4B was likely to be attributed to the soluble substrates
from seeding liquid.
The findings in this study regarding SDF and RDF can be of
values in designing, monitoring, analyzing, and optimizing
the anaerobic digestion process for the treatment of complex
substrates such aqueous plants. The established model also
provides an insight into the anaerobic digestion of aquatic
plants by rumen microbes in continuous-flow reactors,
w a t e r r e s e a r c h 4 3 ( 2 0 0 9 ) 2 0 4 7 – 2 0 5 52054
because of the consistent biochemical processes and kinetics
between batch and continuous experiments.
5. Conclusions
A mathematical model was developed to describe the anaer-
obic digestion of aquatic plants by rumen microbes in this
paper. The following conclusions are drawn:
� Cattail could be fractionated into slowly hydrolysable frac-
tion, readily hydrolysable fraction and inert fraction. With
such a fractionation, the different hydrolysis rates of the
two main degradable components in cattail could be
described as a surface-limiting kinetics well.
� The established model was found to be capable of simu-
lating and predicting the anaerobic degradation of cattail by
rumen microbes in terms of cattail degradation, microbial
growth, as well as formation of aqueous and gaseous
products under different conditions.
� The SHF hydrolysis was the rate-limiting step in the
anaerobic cattail degradation, and the hydrolysis rate
constant khyd,SF for SHF was the most significant parameter
in such a process. The sensitivity of other parameters to the
output of VS, TVFA and CH4 followed the order of
Khyd,SF> khyd,RF> Khyd,RF.
� This model is useful to better understand the behavior of
anaerobic degradation of aquatic plants by rumen microbes.
Acknowledgments
The authors wish to thank the NSFC-JST Joint Project
(20610002), the Chinese Academy of Sciences (KSCX2-YW-
G-001), National Basic Research Program of China
(2004CB719703), and National 863 Program of China
(2006AA06Z340), for the partial support of this study.
r e f e r e n c e s
APHA, AWWA, WEF, 1995. Standard Methods for the Examinationof Water and Wastewater, 19th ed. American Public HealthAssociation, Washington, DC.
Bankston, J.L., Sola, D.L., Komor, A.T., Dwyer, D.F., 2002.Degradation of trichloroethylene in wetland microcosmscontaining broad-leaved cattail and eastern cottonwood.Water Res. 36, 1539–1546.
Barnes, S.P., Keller, J., 2003. Cellulosic waste degradation byrumen-enhanced acidogenesis. Water Sci. Technol. 48,155–162.
Batstone, D.J., Keller, J., Angelidaki, I., Kalyuzhnyi, S.,Pavlostathis, S.G., Rozzi, A., Sanders, W., Siegrist, H.,Vavilin, V., 2002. Anaerobic Digestion Model No.1 (ADM1). IWAPublishing, London.
Camp, H.J.M., Verkley, G.J.M., Gijzen, H.J., Vogels, G.D., 1989.Application of rumen microorganisms in the anaerobicfermentation of an organic fraction of domestic refuse. Biol.Wastes 30, 309–316.
DeLaune, R.D., Jugsujinda, A., Reddy, K.R., 1999. Effect of rootoxygen stress on phosphorus uptake by cattail. J. Plant Nutr.22, 459–466.
Dimock, R., Morgenroth, E., 2006. The influence of particle size onmicrobial hydrolysis of protein particles in activated sludge.Water Res. 40, 2064–2074.
Flotats, X., Palatsi, J., Ahring, B.K., Angelidaki, I., 2006.Identifiability study of the proteins degradation model, basedon ADM1, using simultaneous batch experiments. Water Sci.Technol. 54, 31–39.
Gajalakshmi, E.V., Ramasamy, E.V., Abbasi, S.A., 2001.Assessment of sustainable vermiconversion of water hyacinthat different reactor efficiencies employing Eudrilus eugeniaeKinberg. Bioresour. Technol. 44, 71–76.
Goering, H.K., van Soest, P.J., 1970. Forage Fiber AnalysisAgricultural Handbook. US Government Printing Office.
Higuchi, Y., Ohashi, A., Imachi, H., Harada, H., 2005. Hydrolyticactivity of alpha-amylase in anaerobic digested sludge. WaterSci. Technol. 52, 259–266.
Hu, Z.H., Yu, H.Q., 2006. Anaerobic digestion of cattail by rumencultures. Waste Manag. 26, 1222–1228.
Hu, Z.H., Yu, H.Q., Yue, Z.B., Harada, H., Li, Y.Y., 2007. Kineticanalysis of anaerobic digestion of cattail by rumen microbes ina modified UASB reactor. Biochem. Eng. J. 37, 219–225.
Hu, Z.H., Yu, H.Q., Zheng, J.C., 2006. Application of responsesurface methodology for optimization of acidogenesis ofcattail by rumen cultures. Bioresour. Technol. 97, 2103–2109.
Macias-Corral, M., Samani, Z., Hanson, A., Smith, G., Funk, P.,Yu, H., Longworth, J., 2008. Anaerobic digestion of municipalsolid waste and agricultural waste and the effect of co-digestion with dairy cow manure. Bioresour. Technol. 99,8288–8293.
Munch, V.E., Keller, J., Lant, P., Newell, R., 1999. Mathematicalmodeling of prefermenters-I. Model development andverification. Water Res. 33, 2757–2768.
Myint, M., Nirmalakhandan, N., Speece, R.E., 2007. Anaerobicfermentation of cattle manure: modeling of hydrolysis andacidogenesis. Water Res. 41, 323–332.
Pavlostathis, S.G., Giraldo-Gomez, E., 1991. Kinetics of anaerobictreatment: a critical review. Crit. Rev. Environ. Control 21,411–490.
Reichert, P., 1998. AQUASIM 2.0-User Manual, Computer Programfor the Identification and Simulation of Aquatic Systems.Swiss Federal Institute for Environmental Science andTechnology (EAWAG), Dubendorf, Switzerland.
Ribes, J., Keesman, K., Spanjers, H., 2004. Modelling anaerobicbiomass growth kinetics with a substrate thresholdconcentration. Water Res. 38, 4502–4510.
Ruel, M.S., Comeau, Y., Ginestet, P., Heduit, A., 2002. Modelingacidogenic and sulfate-reducing processes for thedetermination of fermentable fractions in wastewater.Biotechnol. Bioeng. 80, 525–536.
Russell, J.B., Wilson, D.B., 1996. Why are ruminal cellulolyticbacteria unable to digest cellulose at low pH? J. Dairy Sci. 79,1503–1509.
Tartakovsky, B., Morel, E., Steyer, J.P., Guiot, S.R., 2002.Application of a variable structure model in observation andcontrol of an anaerobic digestor. Biotechnol. Prog. 18, 898–903.
Tuomela, M., Vikman, M., Hatakka, A., Itavaara, M., 2002.Biodegradation of lignin in a compost environment: a review.Bioresour. Technol. 72, 169–183.
Vavilin, V.A., Fernandez, B., Palatsi, J., Flotats, X., 2008. Hydrolysiskinetics in anaerobic degradation of particulate organicmaterial: an overview. Waste Manag. 28, 939–951.
Vavilin, V.A., Rytov, S.V., Lokshina, L.Y., Pavlostathis, S.G.,Barlaz, M.A., 2002. Distributed model of solid waste digestion-effects of leachate recirculation and pH adjustment.Biotechnol. Bioeng. 81, 66–73.
w a t e r r e s e a r c h 4 3 ( 2 0 0 9 ) 2 0 4 7 – 2 0 5 5 2055
Veeken, A., Kalyuzhnyi, S., Scharff, H., Hamelers, B., 2000. Effectof pH and VFA on hydrolysis and organic waste. ASCE J.Environ. Eng. 126, 1076–1081.
Vlyssides, A., Barampouti, E.M., Mai, S., 2007. Effect of ferrousion on the biological activity in a UASB reactor:mathematical modeling and verification. Biotechnol. Bioeng.96, 853–861.
Yasui, H., Goel, R., Li, Y.Y., Noike, T., 2008. Modified ADM1structure for modelling municipal primary sludge hydrolysis.Water Res. 42, 249–259.
Yavitt, J.B., Knapp, A.K., 1998. Aspects of methane flow fromsediment through emergent cattail (Typha latifolia) plants. NewPhytol. 139, 495–503.
Yue, Z.B., Liu, R.H., Yu, H.Q., Chen, H.Z., Yu, B., Harada, H., Li, Y.Y.,2008. Enhanced anaerobic ruminal degradation of bulrushthrough steam explosion pretreatment. Ind. Eng. Chem. Res.47, 5899–5905.
Yue, Z.B., Yu, H.Q., Harada, H., Li, Y.Y., 2007. Optimization ofanaerobic acidogenesis of an aquatic plant, Canna indica L., byrumen cultures. Water Res. 41, 2361–2370.