mochol, gabriela and hermoso-mendizabal, ainhoa and sakata ...... mochol, gabriela and...
TRANSCRIPT

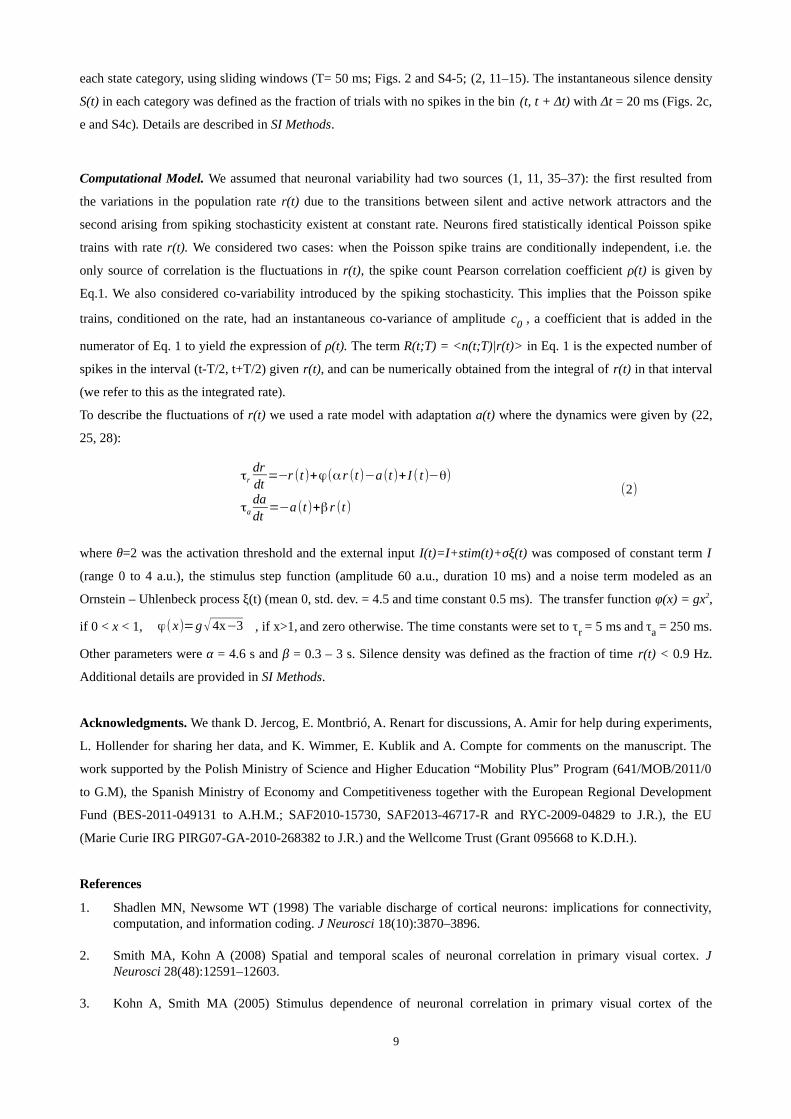
Mochol, Gabriela and Hermoso-Mendizabal, Ainhoa and Sakata, Shuzo
and Harris, Kenneth D. and de la Rocha, Jaime (2015) Stochastic
transitions into silence cause noise correlations in cortical circuits.
Proceedings of the National Academy of Sciences, 112 (11). 3529–3534.
ISSN 1091-6490 , http://dx.doi.org/10.1073/pnas.1410509112
This version is available at https://strathprints.strath.ac.uk/53786/
Strathprints is designed to allow users to access the research output of the University of
Strathclyde. Unless otherwise explicitly stated on the manuscript, Copyright © and Moral Rights
for the papers on this site are retained by the individual authors and/or other copyright owners.
Please check the manuscript for details of any other licences that may have been applied. You
may not engage in further distribution of the material for any profitmaking activities or any
commercial gain. You may freely distribute both the url (https://strathprints.strath.ac.uk/) and the
content of this paper for research or private study, educational, or not-for-profit purposes without
prior permission or charge.
Any correspondence concerning this service should be sent to the Strathprints administrator:
The Strathprints institutional repository (https://strathprints.strath.ac.uk) is a digital archive of University of Strathclyde research
outputs. It has been developed to disseminate open access research outputs, expose data about those outputs, and enable the
management and persistent access to Strathclyde's intellectual output.
Title Page.
Classification:BIOLOGICAL SCIENCES: Neuroscience
Title:
Stochastic transitions into silence cause noise correlations in cortical circuits.
Short title:The relation between neuronal correlations and silence.
Authors:
Gabriela Mochol1,2, Ainhoa Hermoso-Mendizabal2, Shuzo Sakata 3, Kenneth D. Harris4, Jaime de la Rocha2.
[1] Nencki Institute of Experimental Biology
3 Pasteur street, 02-093 Warsaw, Poland.
[2] IDIBAPS
Rossello 149 – 153, 08036 Barcelona, Spain.
[3] University of Strathclyde
Centre for Neuroscience,
Strathclyde Institute of Pharmacy and Biomedical Sciences,
161 CathedralStreet, Glasgow G4 0RE, United Kingdom.
[4] University College London
Institute of Neurology; Department of Neuroscience, Physiology, and Pharmacology
21 University Street, London WC1E 6DE, United Kingdom
Corresponding author:Jaime de la Rocha
IDIBAPS
Rossello 149 – 153, 08036 Barcelona, Spain.
Phone: (+34) 932275400 Ext. 4307
Key words:
neuronal variability, noise correlations, brain state, auditory cortex, up and down dynamics, rate model, stochastic
network dynamics
1
Significance Statement
Neurons in the cerebral cortex emit action potentials in a seemingly random manner. One puzzling aspect of this
neuronal “noise” is that it is correlated among neighboring neurons, something thought to reflect the tendency of
neurons to fire together. Here we recorded the activity from populations of cortical neurons in rats and found that
correlations could be largely explained by the tendency of cortical neurons to stop firing together. A computational
network model whose activity alternated between periods of activity and silence was able to reproduce the pattern of
correlations found in the experiments. Our findings shed light on the mechanisms causing neuronal variability and
may contribute to elucidate its role in a neural code.
Abstract
The spiking activity of cortical neurons is highly variable. This variability is generally correlated among nearby
neurons, an effect commonly interpreted to reflect the co-activation of neurons due to anatomically shared inputs.
Recent findings however indicate that correlations can be dynamically modulated, suggesting that the underlying
mechanisms are not well understood. Here we investigate the hypothesis that correlations are dominated by neuronal
co-inactivation: the occurrence of brief silent periods during which all neurons in the local network stop firing. We
recorded spiking activity from large populations of neurons in the auditory cortex of anesthetized rats across different
brain states. During spontaneous activity, the reduction of correlation accompanying brain state desynchronization was
largely explained by a decrease in the density of the silent periods. The presentation of a stimulus caused an initial
drop of correlations followed by a rebound, a time-course that was mimicked by the instantaneous silence density. We
built a rate network model with fluctuation-driven transitions between a silent and an active attractor and assumed that
neurons fired Poisson spike trains with a rate following the model dynamics. Variations of the network external input
altered the transition rate into the silent attractor and reproduced the relation between correlation and silence density
found in the data, both in spontaneous and evoked conditions. This suggests that the observed changes in correlation,
occurring gradually with brain state variations or abruptly with sensory stimulation, are due to changes in the
likeliness of the micro-circuit to transiently cease firing.
\body
Introduction
Neuronal noise correlations are defined as common fluctuations in the spiking activity of neurons under conditions of
constant sensory input or motor output. Traditionally they have been thought to arise from the dense connectivity of
the cortex, such that neighboring neurons sharing a fraction of their inputs should also share a fraction of their output
variability (1). Several observations are consistent with this hypothesis: pair-wise correlations in the cortex decrease
with cell pair distance (2) or with the difference in stimulus selectivity (3), dependencies that could follow from a
variation in shared input given the anatomy of cortical circuits. Recent findings however challenge this simple
interpretation. Recordings in the primate visual cortex have shown that attention or task context can change correlation
structure (4–6) and that the magnitude of averaged correlation can be very low (7). In anesthetized rodents,
correlations decrease with brain state desynchronization (8, 9) or when animals switch from quiet wakefulness to
active whisking during waking (10). Moreover the commonly observed drop of spiking variability following stimulus
onset (11–13) seems to occur jointly with a transient decrease in correlation (2, 14, 15). These observations suggest
that correlations reflect the dynamical state of the circuit more than its hard-wired connectivity.
Despite substantial progress in understanding the mechanisms giving rise to large individual variability in recurrent
2
networks (9, 16–18), we still lack a canonical model that can generate correlations with the same magnitude and
spatio-temporal structure as those observed in cortical circuits. Balanced networks for instance, a common model that
reproduces the large variability of cortical neurons (9, 18, 19), show near zero averaged correlations (9). Numerous
studies have investigated the generation of synchronous firing (20), but whether short bursts of population activity
can quantitatively account for the spike count correlations found in the data is unclear. Recurrent networks can also
generate fast oscillations in the population activity but, in a regime of low rates, typical of cortical circuits, average
spike count correlations are negligible (21). Network models producing non-zero average correlations are those
exhibiting up and down dynamics (22–29). Most of these studies have focused on investigating the mechanisms
underlying the slow oscillatory activity observed in cortical slices (30), under anesthesia (31, 32) or during slow wave
sleep (33). Only recently the impact of up and down switching on trial-to-trial response variability (25) and on the
probability distribution of multi-unit activity (29) across brain states has been investigated. Whether the alternation
between up and down phases could quantitatively account for the pair-wise correlations observed in different brain
states and describe their stimulus evoked dynamics remains an open question.
To investigate the mechanisms producing correlated firing we recorded the spiking activity of large populations of
neurons from the auditory cortex of anesthetized rats. During spontaneous activity, changes in correlation were largely
explained by variation of the occurrence rate of periods during which neurons in the circuit stopped firing.
Furthermore, the time course of correlation in response to an acoustic stimulus reflected the transient variation of this
silence density. A computational rate model with fluctuation-driven transitions between silent and active attractors
could explain the experimentally observed time course of correlation and its relation to silence density. Our findings
suggest that the dynamics of these transitions play a fundamental role in generating noise correlations among cortical
neurons.
Results
We recorded spontaneous and stimulus evoked population activity from the primary auditory cortex (A1) of urethane-
anesthetized rats (n = 6) using multi-site silicon microelectrodes. We sorted spikes off-line and obtained multiple spike
trains from isolated single units (range: 44 - 147) as well as some spike trains from multi-unit activity (range: 3 -103;
Fig. 1a). During the experiments, the brain activity underwent spontaneous transitions across a continuum of brain
states varying between a synchronized state exhibiting alternations between active and silent periods (Fig. 1a, right),
called up and down phases respectively (30–33), and a desynchronized state with no apparent up and down
alternations (Fig. 1a, left; (9, 25)). To quantitatively characterize the full spectrum of brain states we used silence
density (S) computed from the pooled population activity of merged single and multi-units during spontaneous
conditions. Spontaneous conditions referred to the activity during 1.5 second intervals preceding each stimulus. We
divided each recording session into adjacent 50 second epochs, sufficiently short to capture fast brain state transitions
and long enough to obtain good estimates of the spiking statistics. In each epoch we computed S as the fraction of 20
ms bins during which the spontaneous population activity had zero spikes (Fig. 1a, brackets above rasters). The epochs
with relatively high values of S were classified as the synchronized brain state (Fig. 1a, right). During those epochs,
silent periods, obtained by merging consecutive empty bins, captured mostly down periods. The epochs with S close to
zero showing shorter and less frequent silent periods, were classified as the desynchronized brain state (Fig. 1a, left ).
We chose 20 ms bins as the discretization yielding the maximal discriminability between brain states (Fig. S1): finer
binning saturated the S to one, whereas longer bins missed brief silences yielding near zero S for all epochs. Moreover,
3
we controlled that the variations of S across epochs were not explained by changes in the pooled population rate (Fig.
S2a-b, see SI Methods) and that they mimicked the state changes derived independently from the spectral density of
local field potential (LFP; Fig. S2c; (8)).
Relationship between spontaneous correlations and silence density in A1. We first asked whether variations in
silence density could explain the state dependence of correlations between pairs of single units. For each epoch, we
obtained the spontaneous spike count correlation coefficient ρ computed across time during spontaneous activity using
a count window T = 100 ms and averaged across single unit pairs (Fig. 1c). As expected, ρ was larger during
synchronized state epochs where the population activity fluctuated between silent and active periods (9, 34).
Interestingly, the relationship between correlation and S was linear and had a very small intercept ρ0 (Fig. 1d). This
behavior was robustly observed across experiments (Fig. S3) and over a broad range of count windows T (Figs. 1e-f).
Moreover, the density of high activity periods, defined as bins with spike counts above a certain threshold, did not
show the same co-variation with ρ (Fig. 1b), showing that the density S was particularly predictive of correlation
magnitude. We next asked whether correlations were solely due to the occurrence of silent periods among otherwise
uncorrelated activity. To test this, we generated a surrogate data set in which, for each epoch, silent periods were
removed and the remaining periods with spikes were concatenated to form a continuous recording with S = 0 (see SI
Methods). Correlations in this data set were weak in all epochs (Fig. 1c-f) suggesting that the increase in ρ
accompanying brain state synchronization in the original data was mediated by an increase in the silent period
probability and that the additional mechanism producing the offset correlation ρ0 remained relatively constant.
The dynamics of correlation during stimulus evoked responses. We next studied the dynamics of the population in
response to short acoustic clicks (duration 5 ms, inter click interval 2.5 or 3.5 s). We used a sliding spike count
window (T= 50 ms) and computed the averaged instantaneous rate, spike count correlation ρ(t) (2, 14, 15) and spike
count Fano factor (11–13) by performing the statistics across repeated stimulus presentations and averaged over single
units or single-unit pairs (see Methods). Similarly, we computed the instantaneous silence density S(t) using 20 ms
bins. To reveal the impact of brain state, we grouped trials depending on whether they occurred in epochs of low ( S <
0.05), intermediate (0.05 ≤ S ≤ 0.2) or high (0.2 < S) brain state synchronization (Figs. 1a and 2). Despite a difference
in spontaneous baseline rate across states, the averaged peak response was roughly independent of state (Fig. 2a). The
dynamics of S(t) showed a fast drop to a near zero value in all states followed by a fast rebound whose magnitude
depended on the cortical state. Except in the most synchronized epochs, the rebound showed an overshoot above the
baseline S(t) revealing that, after the initial increase in population rate, the stimulus tended to increase the probability
of the circuit to go into silence (Figs. 2b and S4b). After the rebound, the more synchronized epochs showed a second
drop followed by a slow recovery to baseline (Figs. 2b and S4b). Interestingly, instantaneous average correlation
exhibited almost identical time course as S(t) in each of the different brain states (Figs. 2c and S4c). Thus, the linear
relation between correlation and S found during spontaneous activity, was approximately maintained instantaneously
during evoked responses (Fig. 2d). The instantaneous Fano factor followed qualitatively similar dynamics and brain
state dependence to correlation except that the range of spanned values was narrower (Fig. S5).
Computational rate model reproduces ρ − S relation across brain state changes. To understand the mechanisms
underlying correlations and their relation with silence density we analyzed a model with two sources of neuronal
4
variability: the first reflecting variations in the firing rate r and the second reflecting the spiking stochasticity existent
at constant rate (1, 11, 35–37). Under this assumption spike count correlations could be explained, at least in part, if
the rate variability was correlated across neurons (35, 37) . For example it has been shown that individual spike count
statistics can be described by a Poisson process in which the rate varies from trial to trial following a broad unimodal
distribution (37). We tested this model in spontaneous conditions across different brain states and compared it with a
model in which the rate followed a bimodal distribution reflecting network transitions between a silent (r =0) and an
active state (r > 0). We found that the statistics of population spike counts and particularly pair-wise covariance, were
better described by the bimodal model, especially during synchronized epochs when ρ and S were largest (Fig. S6).
This suggests that silent periods reflected separable events in the circuit dynamics rather than periods of very low rate
drawn from a unimodal distribution.
Assuming that rate variations are mainly produced by the network transitions into silence, we initially considered that
neurons fired conditionally independent Poisson spike trains with the same varying rate r(t). Under these assumptions
the spike count correlation coefficient ρ(t) reads (see SI Methods):
where R (t ;T )=∫t−T /2
t+T /2r(t ' )dt ' , named integrated rate, is the expected number of spikes elicited by each neuron in
the interval (t-T/2, t+T/2) given r(t). The mean (angle brackets) and variance of R(t; T) in Eq. 1 are taken with respect
to the rate variability. In the absence of transitions, r(t) is approximately constant and both Var[R(t;T)] and ρ(t) are
zero. This is consistent with the spontaneous activity data if the small offset correlation ρ0 at S = 0 is neglected (Figs.
1d and S3). To describe the dynamics of network transitions, we used a two-dimensional dynamical model (22, 25)
that allowed a mechanistic interpretation of the rate variability during spontaneous and evoked conditions (Fig. 3a).
The model can be considered a mean-field description of a population of recurrently coupled excitatory neurons with
mean rate r(t), that receive an external input I(t) and exhibit rate adaptation a(t) (see Methods). Because of the
concavity of the transfer function and the recurrent coupling, the network can exhibit bi-stability with a silent attractor
and an active attractor with low rate (Fig. 3b) (22). To determine whether the model could reproduce the state-
dependence of spontaneous correlations, we simulated its dynamics using a fluctuating external input and computed
the mean rate, the silence density (defined as the fraction of time with r(t) below a silence threshold) and the
correlation (Eq. 1, count window T = 100 ms) for a range of I and β values (Fig. 3d). The statistics were performed
across time. We chose an axis in the bistable region of the (I, β) plane (squares in Fig. 3d) where the model reproduced
the approximately linear ρ −S relation found in the data (compare Figs. 3e and 1d). Beyond this region the model
yielded much higher S values revealing that, as S approaches one (complete silence), correlation tends to zero (Fig. 3e
gray area). Thus, the ρ − S relation is generally non-monotonic but it can be approximately linear for the range of S
values found in the data (i.e. S<0.5). Finally, we relaxed the condition that spiking was conditionally independent
across neurons and explored how the correlation changed when a small constant spiking co-variability term was
introduced (see SI Methods). This caused a shift in the ρ − S relationship (Fig. 3e) which mimicked the offset ρ0
observed in the experimental data (Figs. 1d and S3).
Although in the model both active and silent attractors were stable across brain states, the transition rate varied due to
changes in the effective size of their basins of attraction. In the desynchronized state the active basin of attraction was
5
ρ(t)=Var [R (t ;T )]
Var [R( t ;T )]+⟨R (t ;T )⟩(1)
effectively large because the active fixed point was far from the basin's border, whereas the silent basin of attraction
was small (Fig. 3f top). Therefore, the system remained active most of the time and the external fluctuations triggered
sporadic and short transitions into silence (Fig. 3f top) yielding low S and small ρ (Fig. 3d). Decreasing I took the
system towards the synchronized state (Fig. 3d squares) where the active attractor was shifted closer to the basin's
border whereas the silent attractor was moved further (Fig. 3f bottom). Thus, excursions to the silent branch were
more frequent and lasted longer yielding high S and larger ρ (Fig 3d and f bottom). Because transitions were triggered
by fluctuations, the duration of silent and active periods was very irregular and the temporal structure of the rate did
not show an oscillatory behavior. This non-rhythmic pattern during synchronized epochs was also observed in the
data.
As an alternative to the bistable model, we considered a monostable dynamical model that produced Gaussian-like
fluctuations in r(t). Silent periods were not caused by network transitions but simply reflected large downwards
deflections of r(t) that were mirrored by upwards deflections of a similar magnitude (Fig. S7e). In this unimodal
model, states of high correlation are associated with an increased population rate variance yielding larger density of
both silent and high activity events. In contrast, high activity density in spontaneous data did not systematically
increase with ρ, a feature better captured by the bistable model (Figs. 1b and S7).
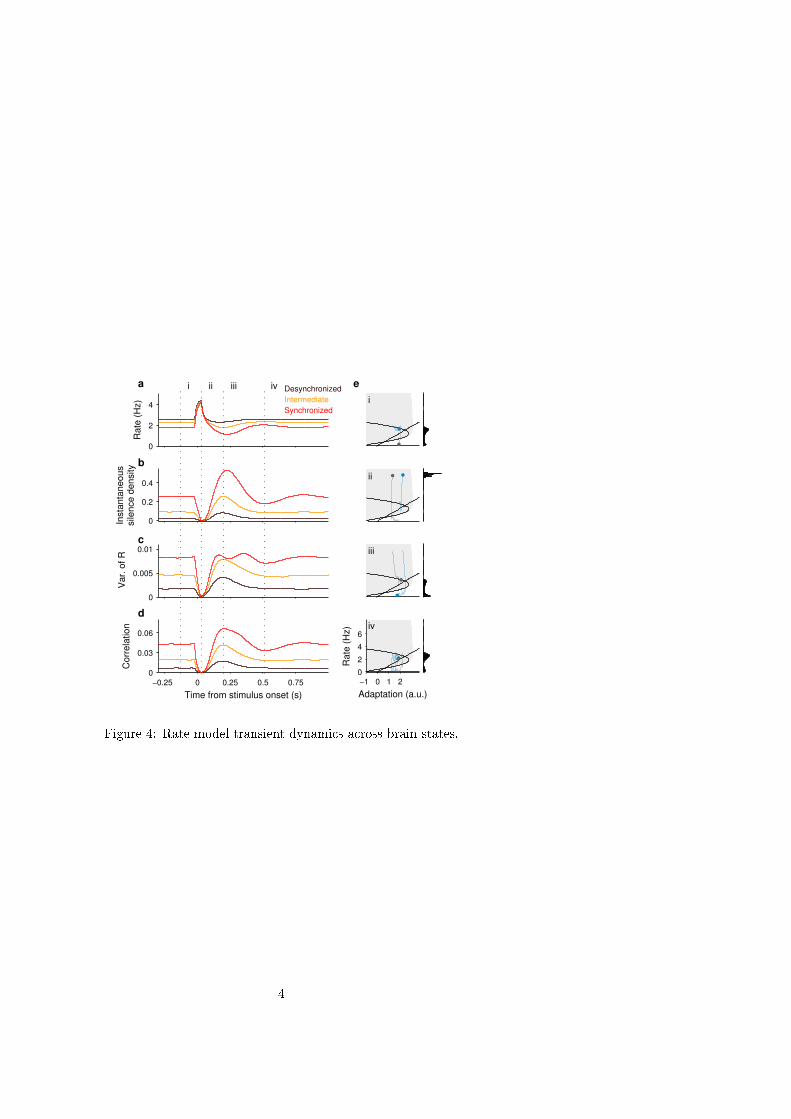
Rate model reproduces the evoked dynamics of correlation. The network model also reproduced the state-
dependent dynamics of correlation during click evoked responses. A brief current step was presented for each of the
three (I, β) combinations representing different brain states (Fig. 3f), and the mean instantaneous rate r(t), integrated
rate variance, S(t) and ρ(t) were computed across repeated trials (Fig. 4). Because the stimulus produced a stereotyped
response independently of whether the network was in the silent or active branch (Fig. 4e, ii), S(t) dropped to zero and
the mean peak rate was the same for all brain states. This caused that the rate variance, and in turn ρ(t), also dropped to
near zero values (Fig. 4c-d, ii and Movies S1, S2). After the peak response, the rate was suppressed below baseline
due to a rebound of the silence density (Fig. 4a-b, iii). This was a consequence of the response-evoked increase in
adaptation: adapted trajectories run closer to the border of the active basin of attraction which increased their
probability to fall into the silent branch (see Fig. 4e, iii, blue traces). The rebound in S(t) led to an increase in rate
variance which, combined with a reduced r(t), produced a prominent rebound in correlation (Fig. 4a-d iii and Movies
S1, S2). In the synchronized state, the rebound in ρ(t) was followed by a second smaller drop (Fig. 4b iii-iv red trace)
reflecting that the system exhibited a weak oscillatory behavior in relaxing back to equilibrium. The model predicted
that ρ(t) in response to stimuli recruiting more adaptation should show a larger rebound and a more pronounced
second drop (Fig. S8).
Lastly we searched for the minimal model reproducing the key aspects of the correlation evoked dynamics. A
simplified bistable model with no adaptation was sufficient to reproduce the strong drop in ρ(t) (Fig. S9). An
additional mechanism that transiently increased the post stimulus silence probability (e.g. short-term depression of the
feed-forward synaptic afferents) was necessary to generate the rebound (Fig. S9). Negative feedback mechanisms,
such as rate adaptation or synaptic short-term depression in the recurrent connections (20), could generate the rebound
and, in addition, cause the second small drop in ρ(t) observed in the synchronized state. The monostable Gaussian
model behaved qualitatively different than the bistable model (Fig. S9) suggesting that the non-linearity underlying the
transitions into silence was necessary to reproduced the dynamics of ρ(t).
6
Discussion
We have shown that average spike count correlations among neighboring neurons can be largely explained by
transient excursions of the cortical circuit into silence. A rate network model with adaptation showing stochastic
transitions between two attractors reproduced the ρ − S relation observed during spontaneous and evoked conditions.
Two recent studies have proposed that fluctuations in neuronal excitability cause noise correlations in monkey visual
cortex (34, 37). While in one study correlated fluctuations of excitability only accounted for a fraction of the total
correlation (37), in the other fluctuations “resembling up and down states”, explained almost all measured correlations
(34). We extended these findings by showing that, during cortical synchronization, a bimodal distribution of the
excitability captures the statistics of population spike counts in the rat auditory cortex more accurately than the
previously proposed unimodal model ((37); Fig. S6). We showed that stochastic transitions into silence seems to be the
mechanism generating bimodal fluctuations in excitability. Modeling these transitions allowed us to understand the
dynamics of correlation caused by sensory stimulation. We showed that correlations measured for spontaneous activity
across brain states exhibited a tight relationship with silence density (Fig. 1d) and that, unexpectedly, this relationship
was preserved instantaneously during evoked responses (Fig. 2d). The correlation ρ0 found during spontaneous
activity in the absence of silent periods (Fig. 1c-d) could be due to a number of factors (e.g. very slow rate co-
fluctuations) but does not seem to reflect the irreducible effect of the connectivity as correlation dropped to near zero
values during evoked responses (Fig. 2c and S4c).
We hypothesized that cortical networks can be described as a bistable system with an active and a silent attractor.
During active periods the network produces Poisson-like, low rate, asynchronous activity due to balance between
excitation and inhibition (9, 38). Fluctuations arising from external inputs or from the internal spiking activity during
active periods, would generate transitions between the two attractors. It is not clear however, how to build such
bistable network. Balanced networks at low rates show a linear input-output relation (38) whereas bi-stability requires
nonlinearities (24, 27, 39). Extensive theoretical work has aimed to reconcile multi-stability and irregular firing,
mainly in the context of persistent activity circuits (22, 40, 41). We simplified the problem and, assuming a balanced
state during active periods, built a rate network model to investigate the transition dynamics between the two
attractors. In contrast to previous network models of up/down transitions which, due to a strong fatigue mechanism
(e.g. spike frequency adaptation), operate in the oscillatory regime (Fig. 3c, top right) (24, 28, 39), our model displays
weak adaptation and relies on fluctuations to escape from the otherwise stable attractors (26, 27). Moreover by
increasing the external input I, plus optionally decreasing the adaptation strength β, the network becomes
desynchronized (Fig. 3d-f), as shown in previous models (23, 25, 39, 42). Desynchronization is also thought to
decrease the synaptic efficacy of intracortical connections. In our model, this would decrease the curvature of the rate
nullcline and remove the silent branch, effectively linearizing the system (25). Our findings suggest that
desynchronization implies moving away from the bifurcation, which increases the region around the fixed point where
the system behaves linearly (Fig. 4). But they also show that certain features, such as correlation rebound, cannot be
captured by a linear system and require the existence of a silent branch (Fig. S9).
Several studies have recently modeled (13, 16–18) the dynamics of stimulus-evoked neuronal variability (11). The
proposed mechanisms range from suppression of an ongoing chaotic state (16), to the quenching of variability
produced by the transitions of the network among multiple discrete states (17, 18) or along a line attractor (13). Our
7
model shares the idea that the stimulus puts the system away from the bifurcation where network state transitions
occur. There are however two main differences. First, except in (13), the average correlation in these networks was
negligible. This is because either neuronal variability across the network was independent (16) or because the
transitions between network discrete states involved the coordination of small subpopulations of cells (17, 18).
Second, the nature of multi-stability in these models followed from a specific connectivity structure such as clustered
connections (17, 18) or local connectivity following a ring topology (13). Our bistable network does not rely on a
particular structured connectivity, what could explain why the effect is ubiquitously observed across cortical areas
with different connectivity schemes (11).
Although our experiments were performed under urethane anesthesia, silent periods also occur during waking. Global
dynamics resembling up and down switching have been observed in rodents during quiescent wakefulness (43, 44) or
during a perceptual task (45) as well as in awake primates (46). Previous studies have hypothesized that correlations
could impact the encoding of information in large networks. Our results contribute to build a mechanistic framework
for recent findings showing that, depending on variables such as sleep pressure, task engagement, locomotion or
sensory stimulation, circuits exhibit different dynamics that shape the structure of correlations. Whether these
correlations ultimately impact information encoding will depend on how efficiently animals process sensory
information under these different brain states (45, 47), a question that needs to be further investigated.
Methods
Experimental Techniques. All experiments were carried out in accordance with protocols approved by the animal
Ethics Committee of the University of Barcelona and by the Rutgers University Animal Care and Use Committee. Six
rats (Sprague-Dawley; 250-400 g) were anesthetized with urethane (1.5 g/Kg b.w.) and silicon microelectrodes
(Neuronexus) with 32 or 64 channels were inserted in deep layers (depth 600-1200 μm) of the primary auditory cortex
(A1). We simultaneously recorded the spiking activity from many single and multi-units (means 86 and 45,
respectively) and the local field potential (LFP) in response to acoustic clicks (5 ms square pulses; inter-stimulus-
interval 2.5 or 3.5 s). Details on the techniques and spikes sorting procedures are described in SI Methods.
Data Analysis. Long continuous recordings (mean ~ 2 h) were divided into 50 second epochs and brain state was
estimated in each epoch based on spontaneous pooled population activity, i.e. the merge of single and multi unit spike
trains during the 1.5 s intervals preceding each stimulus presentation. Brain state was quantified using silence density
(S) defined as the fraction of 20 ms time bins with no population activity (i.e. zero spikes; Fig. 1b,d-f black). Silent
and active periods were obtained from the merge of consecutive empty and non-empty bins, respectively. High activity
density (Fig. 1b gray) was computed, similarly to S, as the fraction of time bins with a spike count above a given fixed
threshold. We computed averaged spontaneous correlation ρ(T) as the Pearson correlation coefficient between the
spike counts of neuronal pairs computed across time (count window T = 100 ms) and averaged over all single unit
pairs (Fig. 1c-f). A surrogate data set was created to assess the amount of correlation during active periods (Fig. 1c-f
blue): silent periods were removed from spontaneous activity and the remaining active periods were concatenated to
form, for each epoch, a continuous recording with S = 0.
To analyze evoked activity we used S to classify epochs into three brain state categories: desynchronized (S ≤ 0.05),
intermediate (0.05 < S < 0.2) and synchronized (S ≥ 0.2). We computed the mean population-averaged instantaneous
rate, correlation ρ(t) (Pearson correlation coefficient) and spike count Fano factor across stimulus repetitions within
8
each state category, using sliding windows (T= 50 ms; Figs. 2 and S4-5; (2, 11–15). The instantaneous silence density
S(t) in each category was defined as the fraction of trials with no spikes in the bin (t, t + Δt) with Δt = 20 ms (Figs. 2c,
e and S4c). Details are described in SI Methods.
Computational Model. We assumed that neuronal variability had two sources (1, 11, 35–37): the first resulted from
the variations in the population rate r(t) due to the transitions between silent and active network attractors and the
second arising from spiking stochasticity existent at constant rate. Neurons fired statistically identical Poisson spike
trains with rate r(t). We considered two cases: when the Poisson spike trains are conditionally independent, i.e. the
only source of correlation is the fluctuations in r(t), the spike count Pearson correlation coefficient ρ(t) is given by
Eq.1. We also considered co-variability introduced by the spiking stochasticity. This implies that the Poisson spike
trains, conditioned on the rate, had an instantaneous co-variance of amplitude c0
, a coefficient that is added in the
numerator of Eq. 1 to yield the expression of ρ(t). The term R(t;T) = <n(t;T)|r(t)> in Eq. 1 is the expected number of
spikes in the interval (t-T/2, t+T/2) given r(t), and can be numerically obtained from the integral of r(t) in that interval
(we refer to this as the integrated rate).
To describe the fluctuations of r(t) we used a rate model with adaptation a(t) where the dynamics were given by (22,
25, 28):
where θ=2 was the activation threshold and the external input I(t)=I+stim(t)+σξ(t) was composed of constant term I
(range 0 to 4 a.u.), the stimulus step function (amplitude 60 a.u., duration 10 ms) and a noise term modeled as an
Ornstein – Uhlenbeck process ξ(t) (mean 0, std. dev. = 4.5 and time constant 0.5 ms). The transfer function φ(x) = gx2,
if 0 < x < 1, ϕ(x)=g√4x−3 , if x>1, and zero otherwise. The time constants were set to τr = 5 ms
and
τa
= 250 ms.
Other parameters were α = 4.6 s and β = 0.3 – 3 s. Silence density was defined as the fraction of time r(t) < 0.9 Hz.
Additional details are provided in SI Methods.
Acknowledgments. We thank D. Jercog, E. Montbrió, A. Renart for discussions, A. Amir for help during experiments,
L. Hollender for sharing her data, and K. Wimmer, E. Kublik and A. Compte for comments on the manuscript. The
work supported by the Polish Ministry of Science and Higher Education “Mobility Plus” Program (641/MOB/2011/0
to G.M), the Spanish Ministry of Economy and Competitiveness together with the European Regional Development
Fund (BES-2011-049131 to A.H.M.; SAF2010-15730, SAF2013-46717-R and RYC-2009-04829 to J.R.), the EU
(Marie Curie IRG PIRG07-GA-2010-268382 to J.R.) and the Wellcome Trust (Grant 095668 to K.D.H.).
References
1. Shadlen MN, Newsome WT (1998) The variable discharge of cortical neurons: implications for connectivity,
computation, and information coding. J Neurosci 18(10):3870–3896.
2. Smith MA, Kohn A (2008) Spatial and temporal scales of neuronal correlation in primary visual cortex. J
Neurosci 28(48):12591–12603.
3. Kohn A, Smith MA (2005) Stimulus dependence of neuronal correlation in primary visual cortex of the
9
τr
dr
dt=−r (t)+ϕ(α r (t)−a(t)+I ( t)−θ)
τa
da
dt=−a(t)+β r (t)
(2)
macaque. J Neurosci 25(14):3661–3673.
4. Cohen MR, Maunsell JHR (2009) Attention improves performance primarily by reducing interneuronal
correlations. Nat Neurosci 12(12):1594–1600.
5. Mitchell JF, Sundberg KA, Reynolds JH (2009) Spatial attention decorrelates intrinsic activity fluctuations in
macaque area V4. Neuron 63(6):879–888.
6. Cohen MR, Newsome WT (2008) Context-dependent changes in functional circuitry in visual area MT. Neuron
60(1):162–173.
7. Ecker AS, et al. (2010) Decorrelated neuronal firing in cortical microcircuits. Science 327(5965):584–587.
8. Goard M, Dan Y (2009) Basal forebrain activation enhances cortical coding of natural scenes. Nat Neurosci
12(11):1444–1449.
9. Renart A, et al. (2010) The asynchronous state in cortical circuits. Science 327(5965):587–590.
10. Poulet JFA, Petersen CCH (2008) Internal brain state regulates membrane potential synchrony in barrel cortex
of behaving mice. Nature 454(7206):881–885.
11. Churchland MM, et al. (2010) Stimulus onset quenches neural variability: a widespread cortical phenomenon.
Nat Neurosci 13(3):369–378.
12. Mochol G, Wójcik DK, Wypych M, Wróbel A, Waleszczyk WJ (2010) Variability of visual responses of
superior colliculus neurons depends on stimulus velocity. J Neurosci 30(9):3199–3209.
13. Ponce-Alvarez A, Thiele A, Albright TD, Stoner GR, Deco G (2013) Stimulus-dependent variability and noise
correlations in cortical MT neurons. Proc Natl Acad Sci U S A 110(32):13162–13167.
14. Oram MW (2011) Visual stimulation decorrelates neuronal activity. J Neurophysiol 105(2):942–957.
15. Middleton JW, Omar C, Doiron B, Simons DJ (2012) Neural correlation is stimulus modulated by feedforward
inhibitory circuitry. J Neurosci 32(2):506–518.
16. Rajan K, Abbott LF, Sompolinsky H (2010) Stimulus-dependent suppression of chaos in recurrent neural
networks. Phys Rev E 82(1 Pt 1):011903.
17. Deco G, Hugues E (2012) Neural network mechanisms underlying stimulus driven variability reduction. PLoS
Comput Biol 8(3):e1002395.
18. Litwin-Kumar A, Doiron B (2012) Slow dynamics and high variability in balanced cortical networks with
clustered connections. Nat Neurosci 15(11):1498–1505.
19. Amit DJ, Brunel N (1997) Model of global spontaneous activity and local structured activity during delay
periods in the cerebral cortex. Cereb Cortex N Y N 1991 7(3):237–252.
20. Tsodyks M, Uziel A, Markram H (2000) Synchrony generation in recurrent networks with frequency-dependent
synapses. J Neurosci Off J Soc Neurosci 20(1):RC50.
21. Brunel N, Hakim V (1999) Fast global oscillations in networks of integrate-and-fire neurons with low firing
rates. Neural Comput 11(7):1621–1671.
22. Latham PE, Richmond BJ, Nelson PG, Nirenberg S (2000) Intrinsic dynamics in neuronal networks. I. Theory.
J Neurophysiol 83(2):808–827.
23. Bazhenov M, Timofeev I, Steriade M, Sejnowski TJ (2002) Model of thalamocortical slow-wave sleep
oscillations and transitions to activated States. J Neurosci 22(19):8691–8704.
10
24. Compte A, Sanchez-Vives MV, McCormick DA, Wang X-J (2003) Cellular and network mechanisms of slow
oscillatory activity (<1 Hz) and wave propagations in a cortical network model. J Neurophysiol 89(5):2707–
2725.
25. Curto C, Sakata S, Marguet S, Itskov V, Harris KD (2009) A simple model of cortical dynamics explains
variability and state dependence of sensory responses in urethane-anesthetized auditory cortex. J Neurosci
29(34):10600–10612.
26. Deco G, Martí D, Ledberg A, Reig R, Sanchez Vives MV (2009) Effective reduced diffusion-models: a data
driven approach to the analysis of neuronal dynamics. PLoS Comput Biol 5(12):e1000587.
27. Mejias JF, Kappen HJ, Torres JJ (2010) Irregular dynamics in up and down cortical states. PloS One
5(11):e13651.
28. Mattia M, Sanchez-Vives MV (2012) Exploring the spectrum of dynamical regimes and timescales in
spontaneous cortical activity. Cogn Neurodyn 6(3):239–250.
29. Okun M, et al. (2012) Population rate dynamics and multineuron firing patterns in sensory cortex. J Neurosci
Off J Soc Neurosci 32(48):17108–17119.
30. Sanchez-Vives MV, McCormick DA (2000) Cellular and network mechanisms of rhythmic recurrent activity in
neocortex. Nat Neurosci 3(10):1027–1034.
31. Steriade M, Nuñez A, Amzica F (1993) A novel slow (< 1 Hz) oscillation of neocortical neurons in vivo:
depolarizing and hyperpolarizing components. J Neurosci 13(8):3252–3265.
32. Cowan RL, Wilson CJ (1994) Spontaneous firing patterns and axonal projections of single corticostriatal
neurons in the rat medial agranular cortex. J Neurophysiol 71(1):17–32.
33. Steriade M, Timofeev I, Grenier F (2001) Natural waking and sleep states: a view from inside neocortical
neurons. J Neurophysiol 85(5):1969–1985.
34. Ecker AS, et al. (2014) State Dependence of Noise Correlations in Macaque Primary Visual Cortex. Neuron
82(1):235–248.
35. Staude B, Rotter S, Grün S (2008) Can spike coordination be differentiated from rate covariation? Neural
Comput 20(8):1973–1999.
36. Churchland AK, et al. (2011) Variance as a signature of neural computations during decision making. Neuron
69(4):818–831.
37. Goris RLT, Movshon JA, Simoncelli EP (2014) Partitioning neuronal variability. Nat Neurosci.
38. Van Vreeswijk C, Sompolinsky H (1996) Chaos in neuronal networks with balanced excitatory and inhibitory
activity. Science 274(5293):1724–1726.
39. Hill S, Tononi G (2005) Modeling sleep and wakefulness in the thalamocortical system. J Neurophysiol
93(3):1671–1698.
40. Renart A, Moreno-Bote R, Wang X-J, Parga N (2007) Mean-driven and fluctuation-driven persistent activity in
recurrent networks. Neural Comput 19(1):1–46.
41. Mongillo G, Hansel D, van Vreeswijk C (2012) Bistability and spatiotemporal irregularity in neuronal networks
with nonlinear synaptic transmission. Phys Rev Lett 108(15):158101.
42. Destexhe A (2009) Self-sustained asynchronous irregular states and Up-Down states in thalamic, cortical and
thalamocortical networks of nonlinear integrate-and-fire neurons. J Comput Neurosci 27(3):493–506.
43. Petersen CCH, Hahn TTG, Mehta M, Grinvald A, Sakmann B (2003) Interaction of sensory responses with
11
spontaneous depolarization in layer 2/3 barrel cortex. Proc Natl Acad Sci U S A 100(23):13638–13643.
44. Luczak A, Barthó P, Marguet SL, Buzsáki G, Harris KD (2007) Sequential structure of neocortical spontaneous
activity in vivo. Proc Natl Acad Sci U S A 104(1):347–352.
45. Sachidhanandam S, Sreenivasan V, Kyriakatos A, Kremer Y, Petersen CCH (2013) Membrane potential
correlates of sensory perception in mouse barrel cortex. Nat Neurosci 16(11):1671–1677.
46. Tan AYY, Chen Y, Scholl B, Seidemann E, Priebe NJ (2014) Sensory stimulation shifts visual cortex from
synchronous to asynchronous states. Nature 509(7499):226–229.
47. Vyazovskiy VV, et al. (2011) Local sleep in awake rats. Nature 472(7344):443–447.
Figure Legends
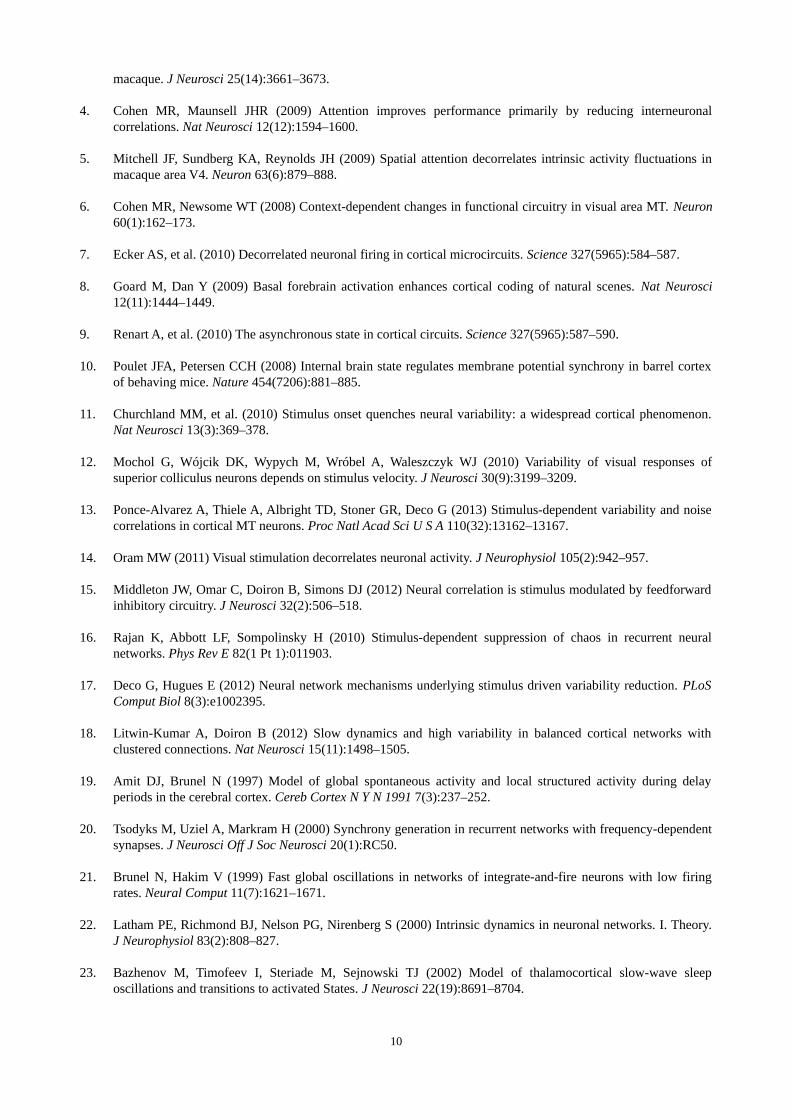
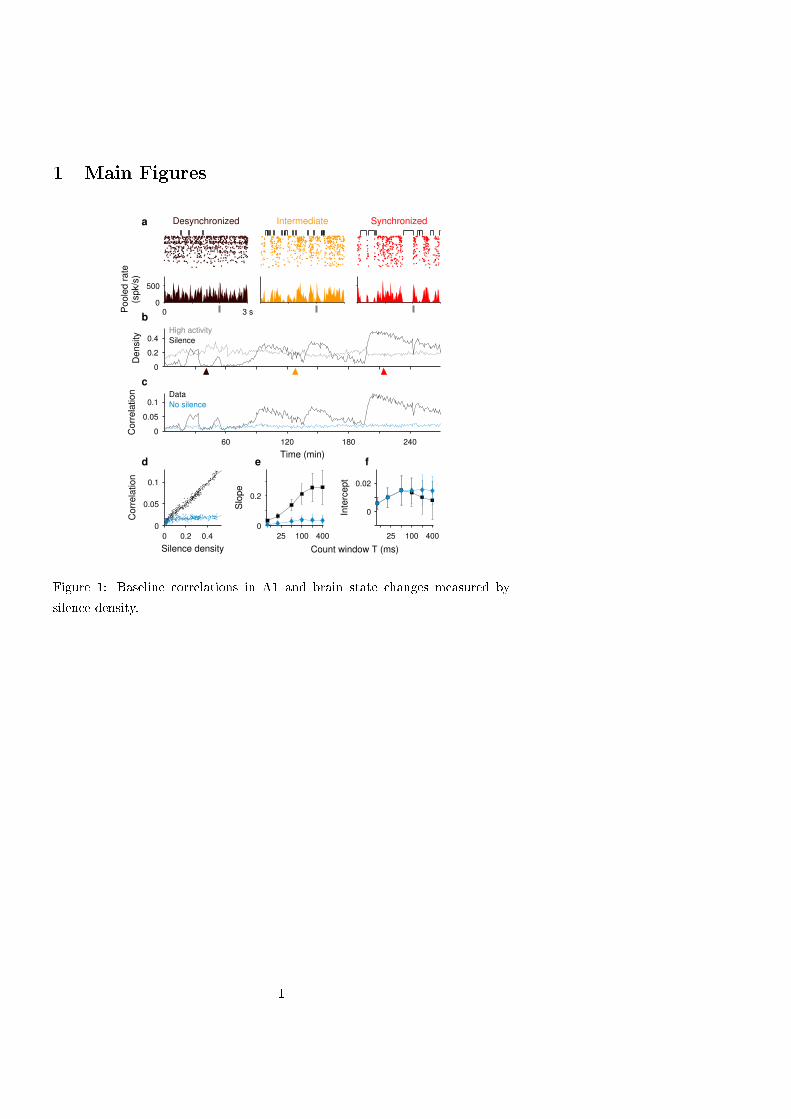
Figure 1. The relation between correlations and silence density during spontaneous activity in A1. a. Spike raster-
grams (top) and pooled population rate (bottom, bin 20 ms) from single and multi-unit spike trains (n = 84) during
epochs of desynchronized (brown), intermediate (orange) and synchronized (red) brain state. Top brackets indicate
silent periods, i.e. consecutive 20 ms bins with no spikes. Vertical gray bar marks stimulus onset. b-c. Silence density
S (b black) and averaged spontaneous spike count correlations ρ (c) obtained across 50 s epochs in one recording
session. High activity density, i.e. fraction of bins with more than six spikes, is shown for comparison (b gray; the
threshold six was chosen to match the averages of the two densities). Correlations were averaged over pairs of
recorded single units (black; n=3240 pairs, count window T=100 ms) and surrogate data (blue) obtained by removing
all silent periods. Arrowheads indicate fragments shown in (a). d. ρ versus S for the two sets in c. Each dot represents
a 50 s epoch. Linear fits from experimental and surrogate data (lines) have slopes 0.22 and 0.019 and intercepts 0.007
and 0.012, respectively. e-f. Slope (e) and correlation intercept (f) from the linear fit of ρ vs. S as a function of count
window size T (mean ± SD over n=6 animals). Colors as in c-d.
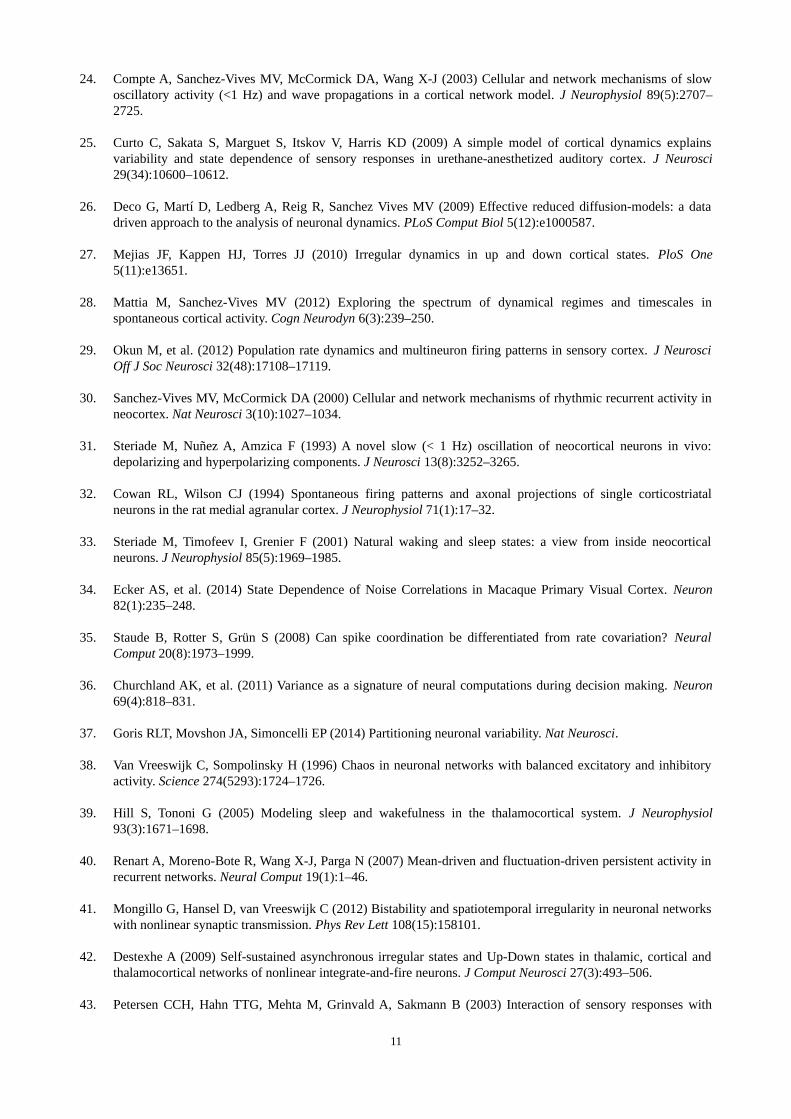
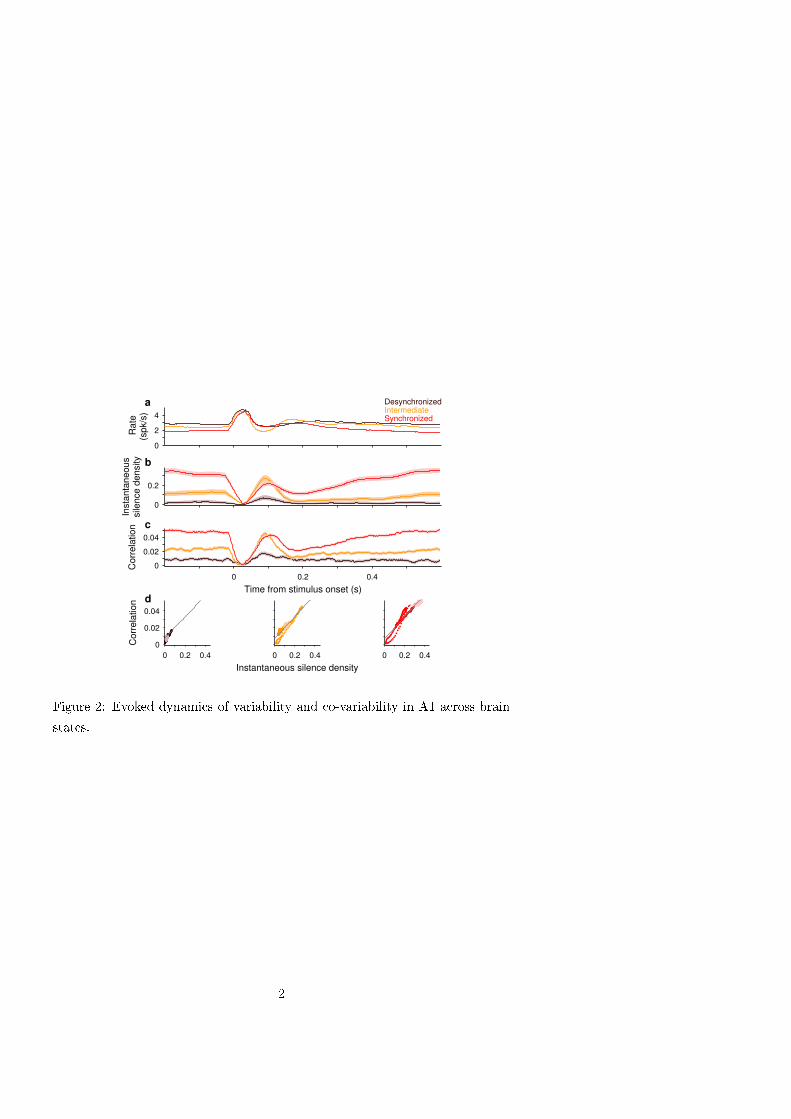
Figure 2. Evoked dynamics of correlations in A1 across brain states.
a-c. Mean population-averaged rate r(t) (a, n = 81 single units), instantaneous silence density S(t) (b), average
instantaneous correlation ρ(t) (c, n= 3240 pairs) in response to a click stimulus during the desynchronized (brown),
intermediate (orange) and synchronized (red) epochs observed in one experiment (same as in Fig. 1a-d). Statistics
were obtained across stimulus repetitions within the given brain state. Rate and correlation used T=50 ms sliding
windows (time step 2 ms). d. Instantaneous correlation ρ(t) vs. S(t) for each brain state in (b-c). Darker dots
correspond to the interval (-25, 515) ms with zero being the stimulus onset. Gray lines show the linear fit to the
spontaneous ρ vs. S relation (Fig. 1d). Shaded areas in c illustrate 95% confidence bands (bootstrap).
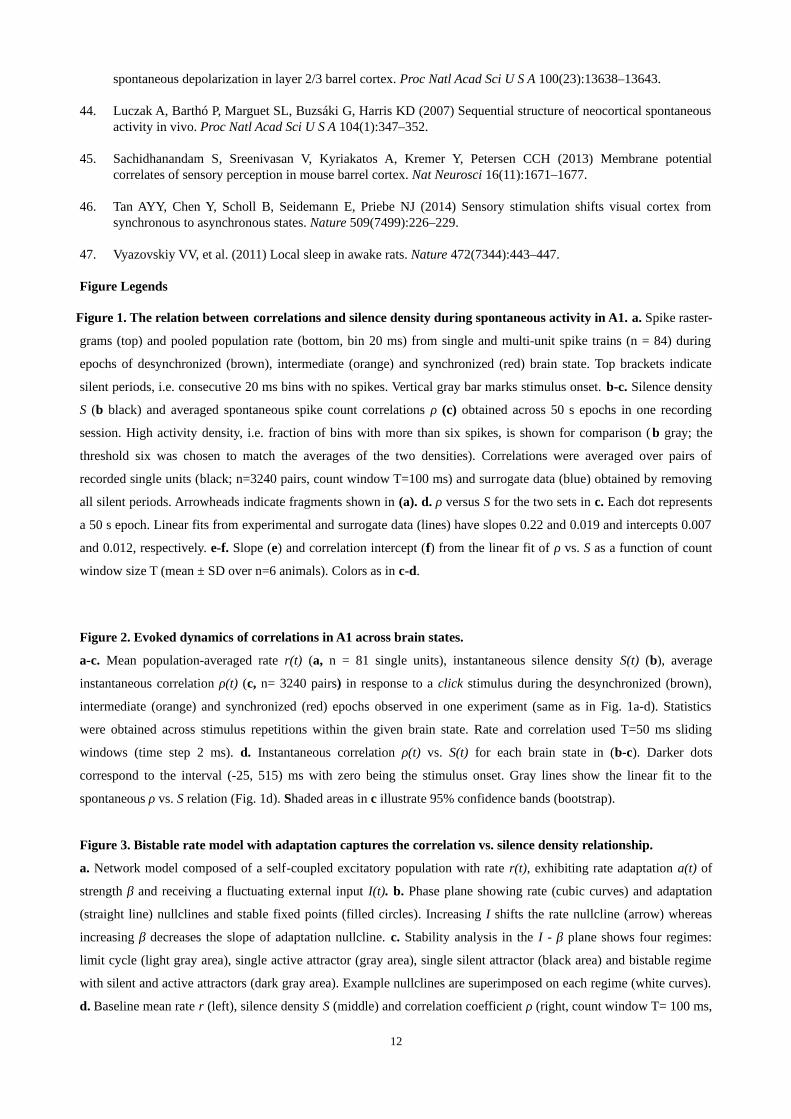
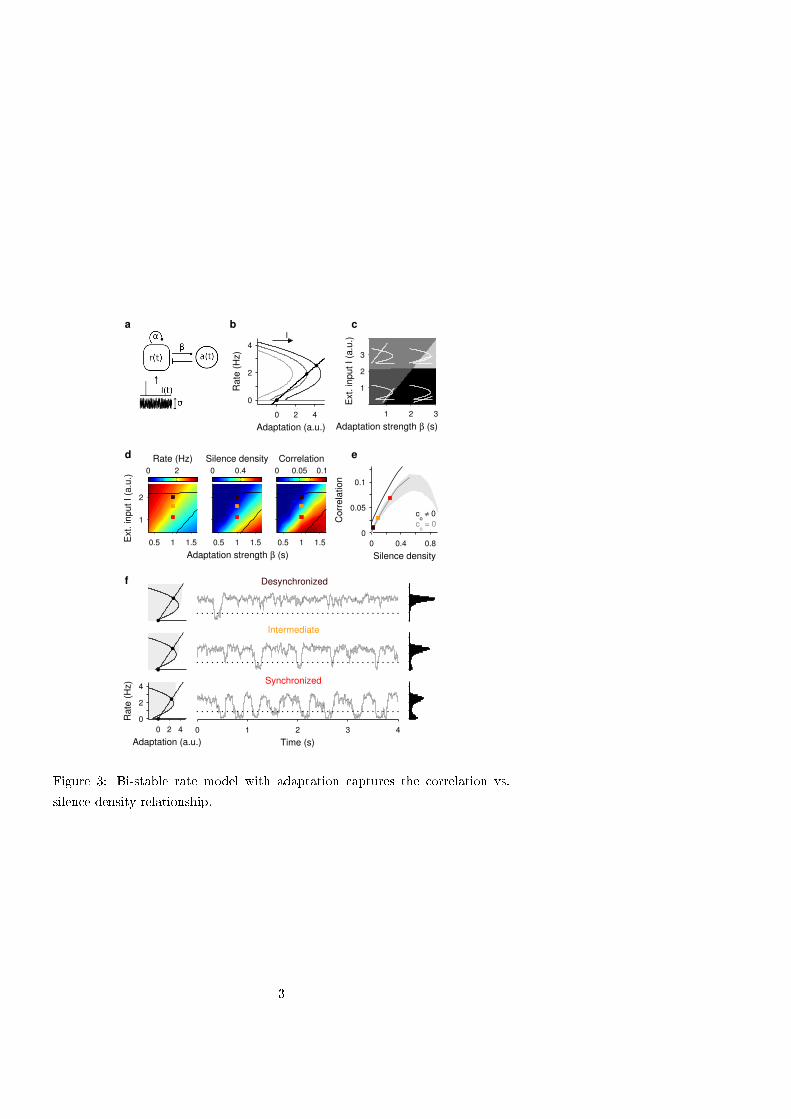
Figure 3. Bistable rate model with adaptation captures the correlation vs. silence density relationship.
a. Network model composed of a self-coupled excitatory population with rate r(t), exhibiting rate adaptation a(t) of
strength β and receiving a fluctuating external input I(t). b. Phase plane showing rate (cubic curves) and adaptation
(straight line) nullclines and stable fixed points (filled circles). Increasing I shifts the rate nullcline (arrow) whereas
increasing β decreases the slope of adaptation nullcline. c. Stability analysis in the I - β plane shows four regimes:
limit cycle (light gray area), single active attractor (gray area), single silent attractor (black area) and bistable regime
with silent and active attractors (dark gray area). Example nullclines are superimposed on each regime (white curves).
d. Baseline mean rate r (left), silence density S (middle) and correlation coefficient ρ (right, count window T= 100 ms,
12
Eq. 1) as a function of I and β (black lines mark borders of bistable regime). Increasing I at fixed β causes an increase
in r and a decrease in S and ρ mimicking the transition towards the desynchronized state. e. ρ vs. S relationship
obtained along the desynchronization axis β = 1 and I varying from 0.4 to 4 for conditionally independent spiking (c0
= 0, gray line) and non-zero spiking co-variability (c0
= 0.01, black line). Shaded area shows the ρ − S pairs obtained
in the model when sampling the region of the (I, β) plane shown in (c). f. Network spontaneous activity for three (β, I)
pairs (squares in d-e) chosen to reproduce the different brain state categories (Fig. 2): desynchronized (top),
intermediate (middle) and synchronized (bottom). For each state, phase plane (left; as in b), example rate trace
middle) and rate histogram (right) are shown. Gray area in the phase planes shows the basin of attraction of active
fixed point. Dotted lines indicate silence detection threshold. Values for each brain state were β = 1 s. and I = 1.1, 1.6
and 2 a.u.
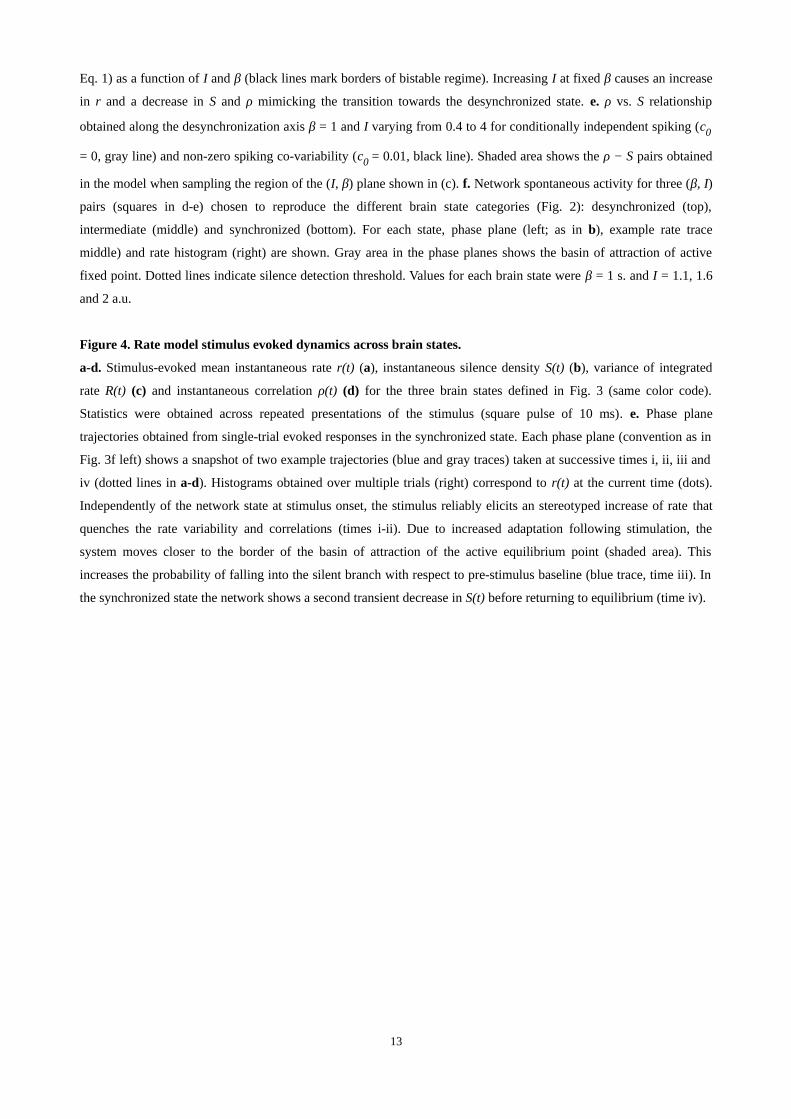
Figure 4. Rate model stimulus evoked dynamics across brain states.
a-d. Stimulus-evoked mean instantaneous rate r(t) (a), instantaneous silence density S(t) (b), variance of integrated
rate R(t) (c) and instantaneous correlation ρ(t) (d) for the three brain states defined in Fig. 3 (same color code).
Statistics were obtained across repeated presentations of the stimulus (square pulse of 10 ms). e. Phase plane
trajectories obtained from single-trial evoked responses in the synchronized state. Each phase plane (convention as in
Fig. 3f left) shows a snapshot of two example trajectories (blue and gray traces) taken at successive times i, ii, iii and
iv (dotted lines in a-d). Histograms obtained over multiple trials (right) correspond to r(t) at the current time (dots).
Independently of the network state at stimulus onset, the stimulus reliably elicits an stereotyped increase of rate that
quenches the rate variability and correlations (times i-ii). Due to increased adaptation following stimulation, the
system moves closer to the border of the basin of attraction of the active equilibrium point (shaded area). This
increases the probability of falling into the silent branch with respect to pre-stimulus baseline (blue trace, time iii). In
the synchronized state the network shows a second transient decrease in S(t) before returning to equilibrium (time iv).
13
1 Main Figures
0
500
0
Desynchronized
0 3 s0
500
Po
ole
d r
ate
(s
pk/s
)
Intermediate Synchronized
0
0.2
0.4
De
nsity
60 120 180 240
0
0.05
0.1
Time (min)
Co
rre
latio
n
0 0.2 0.4
0
0.05
0.1
Silence density
Corr
ela
tion
25 100 400
0
0.2
Count window T (ms)
Slo
pe
25 100 400
0
0.02
Inte
rcept
Data
No silence
Silence
High activity
a
b
c
d e f
Figure 1: Baseline correlations in A1 and brain state changes measured by
silence density.
1
0
2
4
R
ate
(s
pk/s
)
0
0.2
Insta
nta
neous
sile
nce d
ensity
0 0.2 0.4
0
0.02
0.04
Time from stimulus onset (s)
Corr
ela
tion
0 0.2 0.4
0
0.02
0.04
Corr
ela
tion
0 0.2 0.4
Instantaneous silence density
0 0.2 0.4
DesynchronizedIntermediateSynchronized
a
b
c
d
Figure 2: Evoked dynamics of variability and co-variability in A1 across brain
states.
2
0 2 4
0
2
4
Adaptation (a.u.)
Ra
te (
Hz)
1 2 3
1
2
3
Adaptation strength β (s)
Ext. in
pu
t I (a
.u.)
Adaptation (a.u.)
Rate
(H
z)
0 2 4
0
2
4
0 1 2 3 4
Time (s)
Ext.
input
I (a
.u.)
Rate (Hz)
0.5 1 1.5
1
2
0 2
Adaptation strength β (s)
Silence density
0.5 1 1.5
0 0.4
Correlation
0.5 1 1.5
0 0.05 0.1
0 0.4 0.8
0
0.05
0.1
Silence density
Corr
ela
tion
Desynchronized
Intermediate
Synchronized
co ≠ 0
co = 0
I
a b c
d e
f
Figure 3: Bi-stable rate model with adaptation captures the correlation vs.
silence density relationship.
3
0
2
4
Ra
te (
Hz)
0
0.2
0.4
Insta
nta
neous
sile
nce d
ensity
0
0.005
0.01
Var.
of
R
−0.25 0 0.25 0.5 0.75
0
0.03
0.06
Corr
ela
tion
Time from stimulus onset (s) Adaptation (a.u.)
Rate
(H
z)
−1 0 1 20
2
4
6
Desynchronized
Intermediate
Synchronized
i ii iii iv
i
ii
iii
iv
a
b
c
d
e
Figure 4: Rate model transient dynamics across brain states.
4