mobility management: state of the states report - utc.uic.edu · state to compile information of...
TRANSCRIPT
March 2019
Mobility Management: State of the States Report
2 Mobility Management: State of the States Report
Prepared by: The Urban Transportation Center at the University of Illinois - Chicago
Primary authors: P.S. Sriraj, PhD, Director, Urban Transportation Center at UIC Em Hall, PhD Student, UIC College of Urban Planning and Public Affairs Michael McCarthy, MUPP Student, UIC College of Urban Planning and Public Affairs Lise Dirks, Senior Associate, Urban Transportation Center at UIC
For questions about this report, please contact Judy Shanley, Ph.D. at Easterseals, NCMM Co-Director: [email protected]
About the National Center for Mobility Management (NCMM) The National Center for Mobility Management is a national technical assistance center funded through a cooperative agreement with the Federal Transit Administration, and operated through a consortium of three national organizations—the American Public Transportation Association, the Community Transportation Association of America, and Easterseals Inc. The mission of the Center is to promote customer-centered mobility strategies that advance good health, economic vitality, self-sufficiency, and community.
About the Urban Transportation Center (UTC)
The Urban Transportation Center (UTC) is a research unit dedicated to innovative transportation research and education that provides technical assistance on urban transportation planning, policy, operations, finance and management. Part of the College of Urban Planning & Public Affairs at the University of Illinois at Chicago (UIC), the UTC is a nationally-recognized innovator in research, education and engagement that benefits transportation networks in cities and metropolitan areas across America.
3 Mobility Management: State of the States Report
Table of Contents ACKNOWLEDGEMENTS ................................................................................................................................. 4
EXECUTIVE SUMMARY .................................................................................................................................. 5
INTRODUCTION ............................................................................................................................................. 7
LITERATURE REVIEW ..................................................................................................................................... 8
DEFINITIONS ................................................................................................................................................ 15
METHODOLOGY .......................................................................................................................................... 17
RESPONSE RATE ...................................................................................................................................... 19
FINDINGS ..................................................................................................................................................... 21
Performance Management ..................................................................................................................... 26
Internal and External Activities ............................................................................................................... 27
Challenges and Successes ....................................................................................................................... 29
CONCLUSIONS ............................................................................................................................................. 31
NEXT STEPS ................................................................................................................................................. 32
APPENDIX A ................................................................................................................................................. 33
REFERENCES ................................................................................................................................................ 36
4 Mobility Management: State of the States Report
ACKNOWLEDGEMENTS
This research was completed through funding provided by the Federal Transit Administration
(FTA) and the National Center for Mobility Management. The research team would like to thank
transportation officials from statewide mobility management programs across the country for
their participation in interviews with the research team. The views within this document are
those of the authors alone.
5 Mobility Management: State of the States Report
EXECUTIVE SUMMARY
Mobility management is designed to respond to the individual needs of each rider, regardless
of where they live or how they choose to get around. Mobility management networks are
networks that are designed to improve the overall mobility overall for any given trip, regardless
of the rider characteristics, mode, or geography. Mobility management thrives when there is a
coordinated effort and combining of assets among private organizations and public agencies, all
working together in pursuit of better service delivery at lower costs. This report terms it as
mobility management networks. While these networks exist around the country, there is not a
lot known about their role, their influence in providing mobility as a service (MaaS), or their
ability in affecting mobility of individuals. It is the objective of this report to shed light on these
mobility management networks at the state level with the help of an electronic survey of state
mobility managers and affiliated stakeholders.
The survey was sent to 49 transportation professionals, each representing a different state.
Thirty-five names on the list were provided by the National Center for Mobility Management,
and 14 names were provided by the UIC research team; Participants were recruited via emails
sent by P.S. Sriraj, with follow-up correspondence from Judy Shanley. All participants in this
study were volunteers.
Out of 49 surveys sent, 28 were opened and 21 were completed. Two states responded directly
to NCMM that their state did not have a statewide network; for the purposes of this research
they are recorded as having received and completed the survey.
The results indicate that the statewide mobility management networks have a strong public
transit component. Almost all those that responded, indicated that the networks in their
respective states are either led by associations of public transit agencies, or are led by the
public transit department within their state DOT.
Nine of the 14 responding statewide networks were established through governor's initiatives
and executive orders or through state legislation. All of these states have or have had State
6 Mobility Management: State of the States Report
Coordinating Committees, five of which are currently active and four currently inactive. Eight of
the 14 respondents name the state Department of Transportation as the lead or co-leading
agency for their statewide mobility management network. Funding and affiliated networks for
these agencies reflect the state DOT leadership. All of these agencies cite state DOT and/or
Federal funds passed through the state DOT as their funding source. Five of the eight DOT-led
network representatives identified funding through the Section 5310 Program. Additionally,
one mentioned Section 5311 and another listed the Rural Transit Assistance Program as funding
sources. A majority of the respondents indicated not having formal performance measurement
systems for gauging their network’s performance. As for the internal and external activities of
the networks, the most common internal activity seems to be convening meetings, and other
network-related communications. The most common external activity seems to be developing
information packets for dissemination to other stakeholders.
The challenges facing these mobility management networks can be classified into the following
types: coordination at various geographic levels; securing adequate funding and ensuring that
funders perceive that their dollars are well spent; performance/outcome measurement of the
impact of the network(s); and onboarding and training of mobility management professionals.
It is in this context the comment from the network managers that they would like to learn from
and share “success stories” of mobility networks to other states and agencies assumes
significance. This report and derivatives of this report can be used to help mobility managers
embark on continuous learning that benefits all which will potentially help them overcome
some of the above-mentioned challenges.
7 Mobility Management: State of the States Report
INTRODUCTION
Mobility improvement is becoming the goal of many transportation systems and agencies as
new technologies and new ways of traveling emerge and individual preferences to trips evolve.
Mobility improvement often times is plagued by lack of continuity and communication between
services and between stakeholders. As the discussion in the transportation sector moves from
improving ridership for specific services, or reducing congestion and on to mobility
management, the role of mobility management networks, which facilitate mobility
management with the goal of providing Mobility as a Service (MaaS) becomes very intrinsic and
central. While these networks seemingly have an important role to play, not much is known
about their structure and functionality around the various states of the country.
These networks can provide a useful lens through which to view comprehensive transportation
coordination efforts that emphasize the needs of disadvantaged riders, while simultaneously
improving services for all riders. The goal of this phase of research is to collect and analyze the
organizational structure, day-to-day operations, best practices, and challenges inherent to
mobility management networks and the individuals who take part in them, either as leaders or
participants. This information will shed light on several aspects of these networks including but
not limited to their structure, and activities at the state level. The information is collected in
two ways: (1) an electronic survey of network managers in each state; and (2) a scan of each
state to compile information of the existing mobility mechanisms and services.
This report presents these findings in two ways: a narrative overview and state profiles that
combine demographic information with survey findings. The report concludes with a set of
recommendations for transportation professionals interested in improving existing or
implementing new statewide mobility management networks as well as understanding barriers
to the formation and sustainability of these networks at the state level.
8 Mobility Management: State of the States Report
LITERATURE REVIEW
The concept of mobility management embraces a wide scope of programs and services. For the
purposes of this report, special attention is paid to research that addresses mobility
management practices and programs designed to emphasize the coordination of transportation
services for people with disabilities, seniors, and other transit-dependent populations.
Mobility management is designed to respond to the individual needs of each rider, regardless
of where they live or how they choose to get around (Burkhardt & McLary, n.d., pg. 1).
Mobility management networks are networks that are designed to improve overall mobility for
any given trip, regardless of the rider characteristics, mode, or geography. From isolated rural
areas with no public transportation options to large urban areas with complex, multi-modal
networks, no area is too large or too small to benefit from increased coordination of
transportation services, according to proponents and practitioners of mobility management
(Burkhardt & McLary, n.d.; Majumdar, Sen, Highsmith, & Cherrington, 2013; Mattson et al.,
2017). Mobility management also recognizes that riders often use multiple types of
transportation throughout their travels (Ellis, 2009, pgs. 3, 5) and, accordingly, seeks to create a
seamless, multi-modal experience for all riders, a trend in the overall transportation sector that
is being fueled by the rise of Intelligent Transportation Systems (ITS) and Mobility as a Service
(MaaS) applications (U.S. Dept. of Transportation, 2011, pgs. 3-4; Jittrapirom, Caiati, Feneri,
Ebrahimigharehbaghi, Alonso-González, & Narayan, 2017, pg. 15).
Mobility management thrives when there is a coordinated effort and combining of assets
among private organizations and public agencies, all working together in pursuit of better
service delivery at lower costs (Mattson et al., 2017, 78; Majumdar, 2012, pg. 267). We call this
a mobility management network. While end-users report improved transportation service
delivery via mobility management (Mattson et al., 88), the complex nature of these networks
complicates measuring performance in an agreed-upon, consistent manner. As a result,
individual states use varying means to measure performance at the network level, including
traditional (that is, those measurements already in use by public transit agencies), FTA-provided
9 Mobility Management: State of the States Report
criteria, regionally designed criteria, or a combination thereof (Majumdar et al., 2013, pgs. 288-
289). To remedy this, Mattson et al. call for a “more robust evaluation framework” that is
focused on strategic outcomes that grow out of an agreed-upon set of terminology and
methods (2017, pgs. 79-80). At the end user level, measurement is somewhat more
straightforward: surveys are one tool that is used consistently and effectively (Majumdar et al.,
2012, pg. 267; Friedman & Rizzolo, 2016; Mattson et al., 2017, pg. 81). It is worth noting that
any state-level assessment of mobility management must take into account the differences
between urban and rural riders and networks (Majumdar et al., 2013, pgs. 292-294; KFH Group,
Inc. 2018).
While aspects of mobility management have been informally implemented by the human
service sector for decades, formal mobility management networks have been in existence in the
US for just over a decade (Mattson, Miller, Goodwill, Sriraj, & Hough, 2017, pg. 78). Executive
Order 13330 established the Coordinating Council on Access and Mobility (CCAM), a federal
interagency charged with coordinating federal funding programs that focused on a “special
population, which included the elderly, disadvantaged, and lower income individuals,” in 2004
(Mujamdar, Sen, & Park, 2012, pg. 266). In 2005, Congress passed the Safe, Accountable,
Flexible, Efficient Transportation Equity Act: A Legacy for Users (SAFETEA-LU), which included
mobility management as an eligible capital cost under the Enhanced Mobility of Seniors and
Individuals with Disabilities (Section 5310), Job Access Reverse Commute (JARC), and New
Freedom programs (Ellis, 2009, pgs. 2-3; “Mobility management,” 2007).
In 2007, CCAM created the United We Ride initiative for the purpose of addressing the
fragmented nature of transportation service delivery to clients served by human service
organizations; however, the original intent of that initiative can be observed in mobility
management programs at the state, regional, and local levels, as the profiles in this report
demonstrate (“United We Ride,” 2007). In 2013, the JARC and New Freedom programs were
eliminated and folded into Section 5310 (“Job Access Reverse Commute / New Freedom /
Section 5310,” n.d.). At the federal level, FTA has brought many of the synergistic activities to
10 Mobility Management: State of the States Report
mobility management by recommending the development of statewide transportation
coordination plans, as well as the identification of cost-sharing opportunities to leverage the 80
federally funded transportation programs to improve overall mobility. The 80 funding
programs emanate from different federal departments including but not limited to Department
of Health and Human Services, Department of Labor, Department of Energy, Department of
Justice, etc. The varied and diverse nature of the constituencies that these federal departments
strive to serve, means that the intersection of transportation and these other
departmental/programmatic objectives does not happen symbiotically. It becomes essential
for a dedicated entity to exploit the synergies to improve overall mobility for a region or a state.
This could be served by mobility managers and mobility management networks.
For a mobility manager or a network to be successful, it is important to understand the
landscape of the various stakeholder groups that are involved in improving mobility for specific
constituent groups.
These stakeholders include the riders, and those public agencies and private entities that
provide the transportation services. While mobility managers have been somewhat successful
in identifying the needs of their target audience, the success has not necessarily translated
across population groups and the silo-based approach to mobility management has been
unable to overcome systemic deficiencies. It is in this context that mobility management
networks have assumed significance.
Mobility management networks focus on improving the partnerships with and among service
providers – usually in the form of human service or social service organizations (the terms are
usually used interchangeably) and the presence of a dedicated mobility management
coordinator. Unlike human service transportation coordinators, who are often constrained by
geography and therefore limited in the service areas they can cover, mobility management
coordinators can marshal the resources needed to partner across transportation agencies and
geographic areas, providing a broader network of coverage for riders (Mattson et al., 2017, pg.
78). In addition, mobility management coordinators often play in shaping policy that affects
11 Mobility Management: State of the States Report
riders and members of the network (Mattson et al., 2017, pg. 78; Burkhardt & McLary, n.d., pg.
1.). These policy improvements do not operate in isolation; to the contrary, policies advocated
by mobility management professionals can have a positive spillover effect to the broader
ridership. As one example, Haveman, Tillmann, Stöppler, Kvas, & Monninger have developed a
“social-ecological model of mobility and traffic participation” for individuals with intellectual
disabilities (ID) that emphasizes that public transit riders with ID’s social and physical
environments can be greatly improved when supported by policies designed to improve
mobility and accessibility for all riders (2013, pgs. 290-291).
Although all riders can stand to benefit from effective mobility management practices, it is
those special populations of people with disabilities, the elderly, low-income individuals,
transit-dependent, or otherwise disadvantaged riders who stand to gain the most. Riders with
disabilities and aging riders, especially, face barriers to using public transportation, causing
them to miss out on employment and community integration opportunities (Clarke, Ailshire, &
Lantz, 2009, pg. 1675; (Sze & Christensen, 2017, pg 67; U.S. Dept. of Transportation, 2002).
According to the 2002 National Transportation Availability and Use Survey, nearly 23% of riders
with disabilities require specialized assistance or equipment to travel outside the home, while
less than 1% of non-disabled riders do. (U.S. Dept. of Transportation, 2002). Riders with
disabilities have difficulty getting the transportation they need at nearly four times the rate of
non-disabled riders. (U.S. Dept. of Transportation, 2002). These barriers are even more
pronounced in rural areas, where infrequent or unreliable paratransit services are the only form
of transportation available (KFH Group, Inc., 2018, pg. 1; Sylvestre et al., 2007, pg. 27). Surveys
of riders with disabilities consistently demonstrate that availability of accessible transportation
options improves quality of life and decreases social isolation (Sze & Christensen, 2017, pg 67;
Mattson et al., 2017; Sylvestre, Gaudry, & Christopher, 2007; Clarke, Ailshire, & Lantz, 2009;
Jansuwan, Christensen, & Chen, 2013).
The Need
12 Mobility Management: State of the States Report
With the rapid advancements in technology in the delivery of public transportation services,
why do we continue to need mobility management? Why go to the trouble to create
coordinated networks when seemingly any type of transportation option can be made available
easily with the advances in technology? Four reasons emerge from the literature: the still-
significant barriers to the use of public transportation for disabled, elderly, and other
disadvantaged riders; the limited public transit options for disadvantaged rural riders; the lack
of integration among modes of transportation in urban areas, resulting in service gaps, despite
the increased availability of new technologies such as MaaS; and the capacity of mobility
management coordinators to shape policy that can increase the cost and efficiency of public
transportation for all riders.
For disadvantaged riders, statewide networks or coordinating councils can build a network of
collaborators that have the capacity to engage state-level leaders – legislators, the governor -
around shared goals of equitable access to transportation, and by extension improved quality
of life, for all riders (Farber & Reed, pg. 4; Bond, Brown, & Wood, 2017, pg. 711). At least one
state, Wisconsin, has implemented a statewide mobility management program in large part to
serve the needs of those riders covered under Section 5310 (Wisconsin Department of
Transportation, Bureau of Transit, Local Roads, Railroads and Harbors, 2015). While statewide efforts
such as this have been studied by academics and agencies alike, less is known about the
experiences of the end users; this is a topic ripe for further research (Mattson et al., 2017, pg.
84).
Disadvantaged rural riders, particularly older adults, face additional mobility barriers in the
form of larger distances between activity sites and fewer public transportation options as
private automobile travel became the preferred mode of choice (Pucher & Renne, 2005, pg.
171; Kostyniuk, St. Louis, Zanier, Eby, & Molnar, 2012, pgs. 304; Majumdar et al., 2014, pg.
283). Additionally, many rural households are reliant on cars as their primary form of
transportation. When older adults are no longer able to drive, or a household cannot afford to
purchase a car, individuals are further disadvantaged (Pucher & Renne, 2005, pg. 168;
13 Mobility Management: State of the States Report
Kerschner, 2006 as cited in Wood, Brown, Bond, & Suguri, 2016, pg. 155). One survey of 40
agency administrators serving older adults living in rural and small communities found that local
governments were slightly more likely than state governments to partner in the delivery of
transportation services (20 versus 16), but the impact and outcomes of building local versus
state partnerships was not explored (Wood et al., 2016, pg. 160). This suggests that while
state-level partnerships are valuable in the delivery of rural mobility programs – they were the
second most frequently cited among all types of partnerships – the specific advantages of state-
level government partnerships requires further exploration.
Elimination of service gaps and increased integration among modes in public transportation,
including paratransit, are cited in the literature as significant issues that affect disadvantaged
riders (Myers & Ravensloot, 2016, pgs. 79-81; Bezyak, Sabella, & Gattis, 2017, pg. 53). Mobility
management networks, however, have been shown to mitigate these challenges (Federal
Transportation Administration, 2007; Wisconsin Department of Transportation, Bureau of
Transit, Local Roads, Railroads and Harbors, 2015, pg. 4). Indeed, areas rural and urban alike
still lack seamless integration among varying modes of transit, and these gaps can take a variety
of forms, including geographic, time-of-day, and accessibility for those with physical or
developmental disabilities, or who otherwise require additional assistance to navigate public
transportation (Federal Transportation Administration, 2007; Bond et al., 2017, pg. 708;
Friedman and Rizzolo, 2016, pgs. 169-170). Majumdar et al. suggest that a decrease in service
gaps as measured by a decrease in the percentage of the population living in “unserved” areas
is one outcome measure that could be incorporated into state-level mobility management
performance measures (2014, pg. 296).
Although less prevalent in the literature, the role of mobility management coordinators in
collaborating with state-level policymakers is an important emerging topic. Coordinators, for
example, might serve as skilled intermediaries between human services providers and state
legislators by translating local transit or land-use needs into meaningful statewide policies
(Federal Transportation Administration, 2007). Because they are able to monitor mobility
14 Mobility Management: State of the States Report
management programs at various levels (community-wide, regional, etc.) statewide
coordinators can also play a role in establishing partnerships and programs that transcend
geographic boundaries (Mattson et al., 2017, pg., 78). These types of partnerships in turn can
help bridge the urban/rural divide, as well as offer solutions for service delivery gaps.
The Ideal Network
Mobility management networks are often virtual networks. There may be no physical markers
of their presence, and they are heavily dependent on the willingness of disparate actors and
agencies to partner and collaborate for the greater good in both informal and formal ways.
They are complex entities that rely on varying and sometimes intermittent funding availability
in order to carry out their function. Although mobility management programs and services vary
widely in how they operate depending on geographic location, service area, and funding
sources, there are certain aspects that are consistent across all mobility management networks
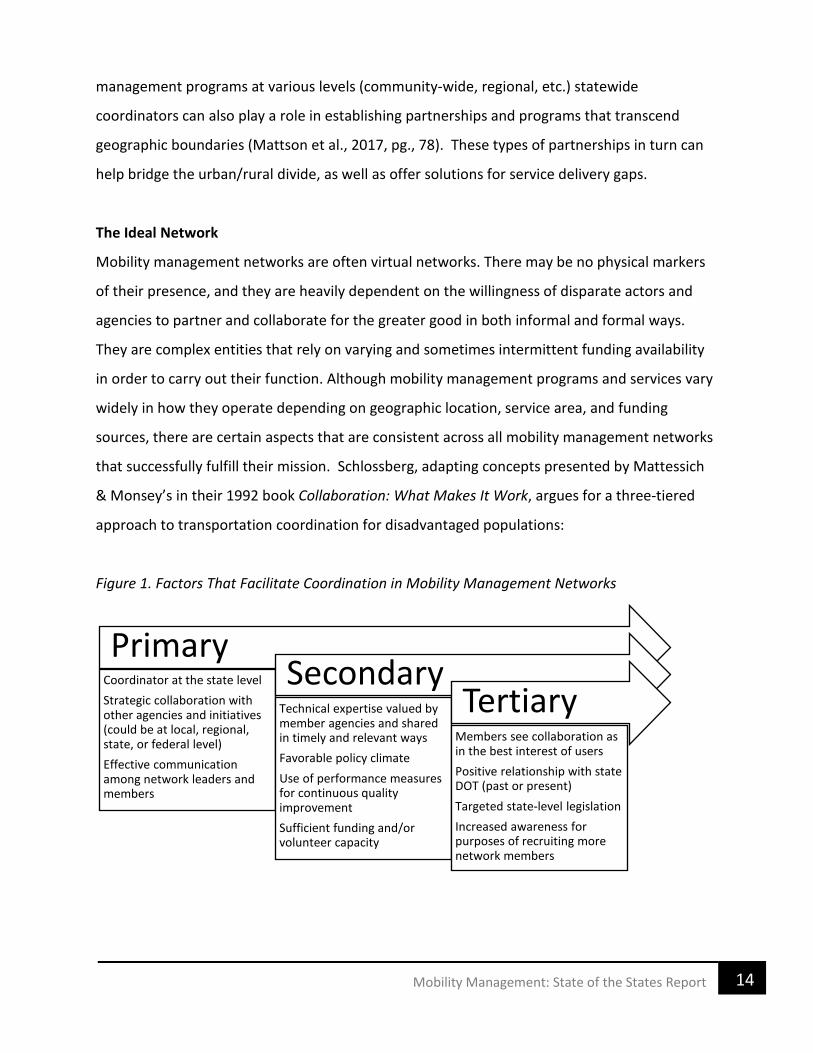
that successfully fulfill their mission. Schlossberg, adapting concepts presented by Mattessich
& Monsey’s in their 1992 book Collaboration: What Makes It Work, argues for a three-tiered
approach to transportation coordination for disadvantaged populations:
Figure 1. Factors That Facilitate Coordination in Mobility Management Networks
PrimaryCoordinator at the state levelStrategic collaboration with other agencies and initiatives (could be at local, regional, state, or federal level)Effective communication among network leaders and members
SecondaryTechnical expertise valued by member agencies and shared in timely and relevant waysFavorable policy climateUse of performance measures for continuous quality improvementSufficient funding and/or volunteer capacity
TertiaryMembers see collaboration as in the best interest of usersPositive relationship with state DOT (past or present)Targeted state-level legislationIncreased awareness for purposes of recruiting more network members
15 Mobility Management: State of the States Report
DEFINITIONS
Prior to the start of this research, the research team, with the support of Easterseals, an NCMM
partner, agreed upon consistent definitions of the terminology used in data collection and
reporting. The following section defines the terminology and describes the research approach
used in this study. Mobility management is an approach to designing and delivering
transportation services that starts and ends with the customer. It begins with a community
vision in which the entire mobility network—public transit, private operators, cycling and
walking, volunteer drivers, and others—works together with customers, planners, and
stakeholders to deliver the mobility options that best meet the community's needs.
Mobility management:
• encourages innovation and flexibility to reach the "right fit" solution for customers
• plans for sustainability
• strives for easy information and referral to assist customers in learning about and using
services
• continually incorporates customer feedback as services are evaluated and adjusted
A Mobility Management Network is comprised of the agencies, organizations, and/or
participants who lead efforts to improve integration across mobility options; make public and
private transit more attractive and easier to use, especially for people with disabilities; identify
innovative solutions; as well as reduce and re-distribute travel demand to help unlock the
capacity of transport systems.
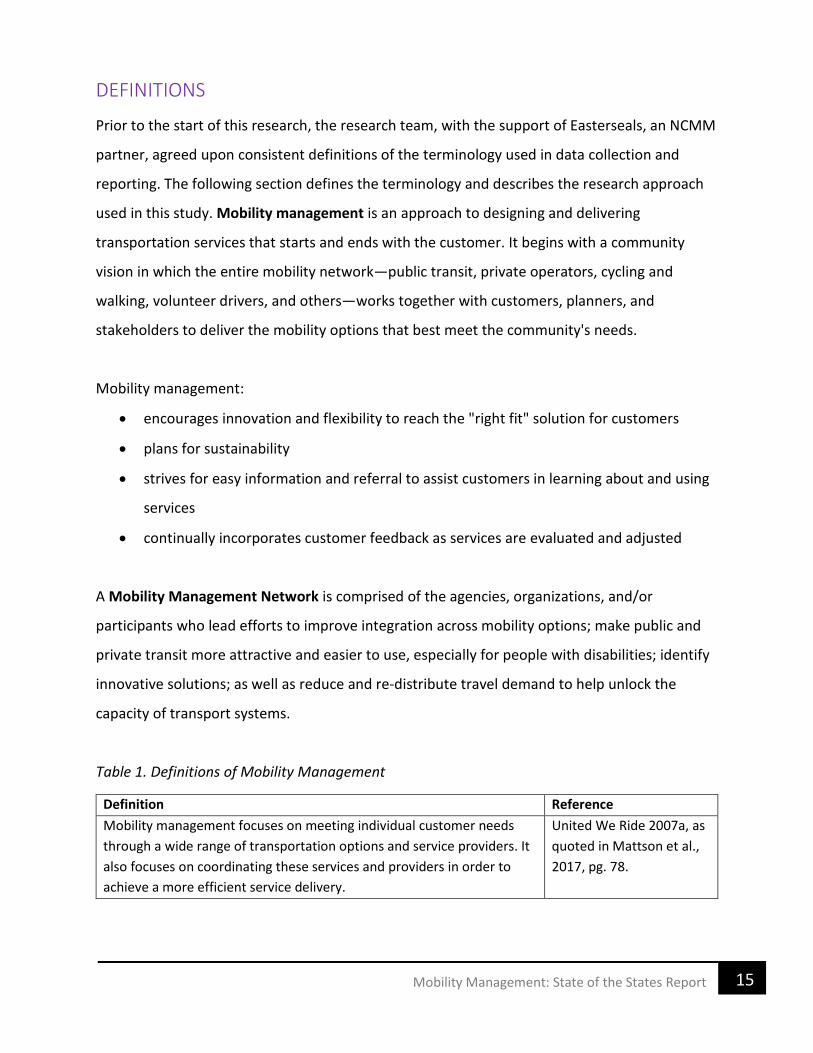
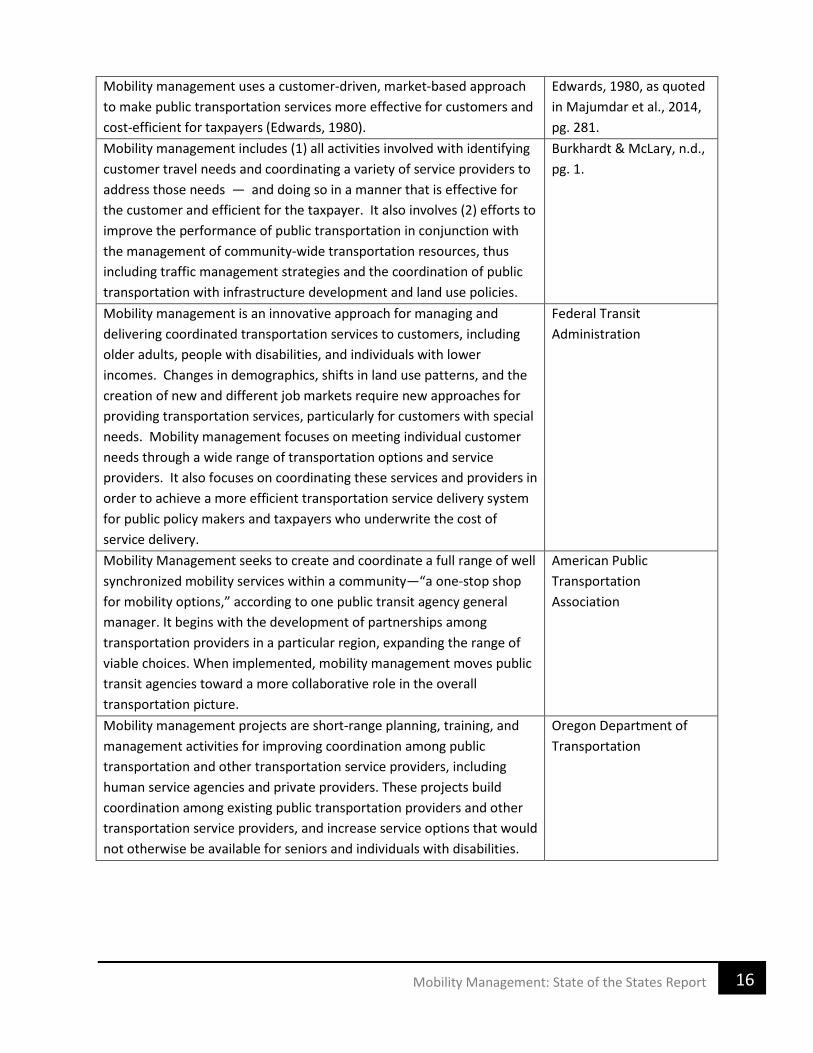
Table 1. Definitions of Mobility Management
Definition Reference Mobility management focuses on meeting individual customer needs through a wide range of transportation options and service providers. It also focuses on coordinating these services and providers in order to achieve a more efficient service delivery.
United We Ride 2007a, as quoted in Mattson et al., 2017, pg. 78.
16 Mobility Management: State of the States Report
Mobility management uses a customer-driven, market-based approach to make public transportation services more effective for customers and cost-efficient for taxpayers (Edwards, 1980).
Edwards, 1980, as quoted in Majumdar et al., 2014, pg. 281.
Mobility management includes (1) all activities involved with identifying customer travel needs and coordinating a variety of service providers to address those needs — and doing so in a manner that is effective for the customer and efficient for the taxpayer. It also involves (2) efforts to improve the performance of public transportation in conjunction with the management of community-wide transportation resources, thus including traffic management strategies and the coordination of public transportation with infrastructure development and land use policies.
Burkhardt & McLary, n.d., pg. 1.
Mobility management is an innovative approach for managing and delivering coordinated transportation services to customers, including older adults, people with disabilities, and individuals with lower incomes. Changes in demographics, shifts in land use patterns, and the creation of new and different job markets require new approaches for providing transportation services, particularly for customers with special needs. Mobility management focuses on meeting individual customer needs through a wide range of transportation options and service providers. It also focuses on coordinating these services and providers in order to achieve a more efficient transportation service delivery system for public policy makers and taxpayers who underwrite the cost of service delivery.
Federal Transit Administration
Mobility Management seeks to create and coordinate a full range of well synchronized mobility services within a community—“a one-stop shop for mobility options,” according to one public transit agency general manager. It begins with the development of partnerships among transportation providers in a particular region, expanding the range of viable choices. When implemented, mobility management moves public transit agencies toward a more collaborative role in the overall transportation picture.
American Public Transportation Association
Mobility management projects are short-range planning, training, and management activities for improving coordination among public transportation and other transportation service providers, including human service agencies and private providers. These projects build coordination among existing public transportation providers and other transportation service providers, and increase service options that would not otherwise be available for seniors and individuals with disabilities.
Oregon Department of Transportation
17 Mobility Management: State of the States Report
METHODOLOGY
Participants
Participants in this research included 49 transportation professionals, each representing a
different state. Thirty-five names on the list were provided by the National Center for Mobility
Management, and 14 names were provided by the UIC research team; no contact could be
identified for the state of Wyoming. Participants were recruited via emails sent by P.S. Sriraj,
with follow-up correspondence from Judy Shanley. All participants in this study were
volunteers.
Materials
All participants signed an informed consent form, which contained information about the
purpose of the study, who was conducting it, and how the data collected would be used.
Additional materials included a web-based survey (see Appendix A) and the “Informed
Consent” required by the Institutional Review Board (IRB) at UIC.
Design and Procedure
The research team identified the potential survey respondents through a combination of
approaches: locating examples of mobility management networks via web searches and
identification of participants by NCMM/Easterseals. Researchers maintained a spreadsheet of
the subjects that associate the email addresses and phone numbers with the name of the
agency. This data is not sensitive because many agencies post their contact information on
publicly-accessible websites. The researchers will store this spreadsheet in a shared folder on
the University-provided Box.com service. Box.com encrypts data in transit and in storage and
the folder is shared only among the named researchers. This spreadsheet will be separated
from survey responses and interview notes, although researchers with access to both sets of
data will be able to associate data with the respondent’s personal information. It is necessary to
store these identifiers to facilitate phone interviews based on the survey responses. This list
was also shared with the FTA for their feedback before the potential participants were
contacted.
18 Mobility Management: State of the States Report
Researchers then contacted a staff member or leader of the government agency, service
provider, or other organization that facilitates the mobility management network as a Network
Leader via email. This email message informed subjects about the research being conducted
and their rights to decline to participate. A link to the web-based survey was included in that
email. The research in this report represents part one of a two-part data collection approach:
(1) an online survey of every individual/agency identified above. It is anticipated that this online
survey will then be followed by a (2) phone interview of a subset of the respondents to the
online survey in the next phase of this project.
Because of the use of human subjects, this research was submitted to the Institutional Review
Board (IRB) for "Exempt Review," defined as follows: "When it is determined that the
involvement of human subjects is in one of the six exempt categories listed in the Regulations
[45 CFR 46.101(b)], it is exempt. The exempt categories include certain educational practices
and tests, innocuous surveys of adults, study of existing data, public service programs and food
evaluations. Any research study involving human subjects thought to be exempt must be
submitted to the OPRS for an exemption determination. Exemption review is performed by
senior OPRS staff and designated IRB members." The research team submitted a Claim of
Exemption and Research Protocol, as well as informed consent language, as part of the IRB
application. The research team's request for an exempt review was granted by IRB. The specific
exemption category under 45 CFR 46.101(b) is: 2.
The survey was designed such that the respondents would be presented an informed consent
form/language (see Appendix B “Informed Consent for Web Survey”) at the outset, as required
by the IRB. The intent was that the respondents who did not provide consent would exit the
survey, while those who consented would proceed to respond to the questions in the survey;
however, all respondents gave consent.
The online survey instrument is structured to include questions in the multiple-choice/short
answer format. The data are coded and identified by the name of the agency and not by the
19 Mobility Management: State of the States Report
name of the individual responding to the survey. Respondents spent an average of seven
minutes and 50 seconds completing the survey.
The online survey was conducted using the University-provided Qualtrics service. When the
survey concluded, the data was exported and stored on the University-provided Box.com
service, where the data is encrypted, and only the researchers had access to it. Survey data will
be deleted from Qualtrics at the conclusion of this research.
RESPONSE RATE
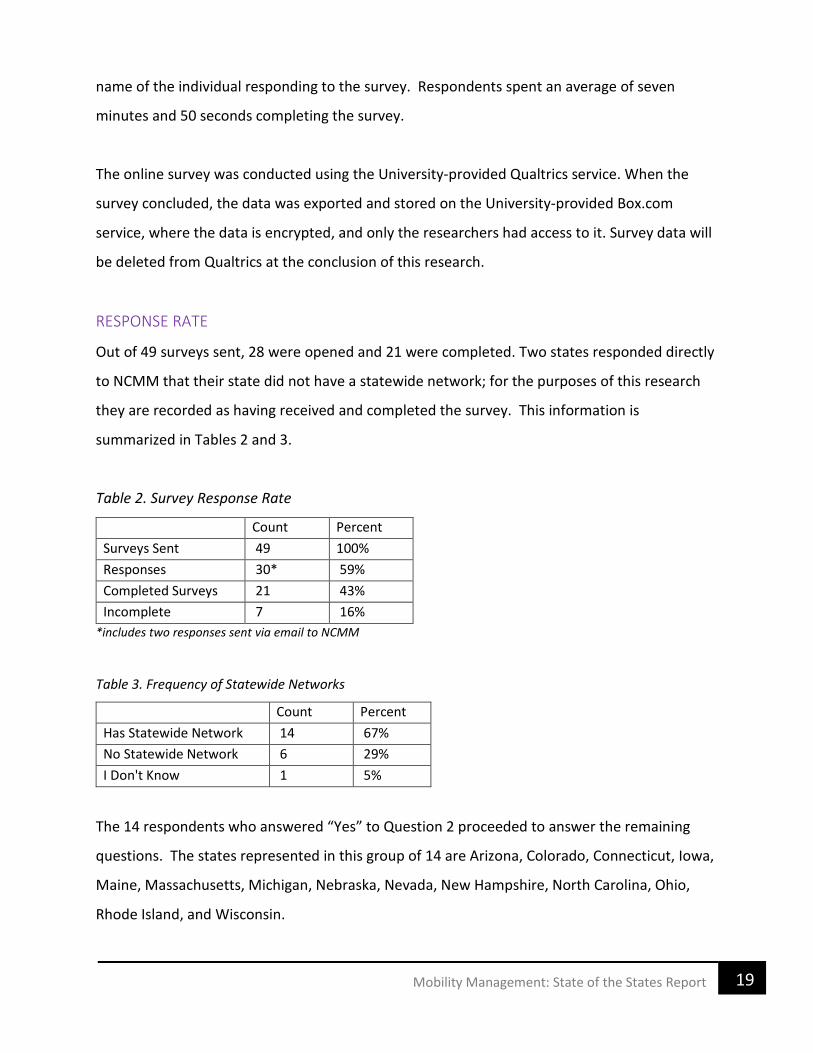
Out of 49 surveys sent, 28 were opened and 21 were completed. Two states responded directly
to NCMM that their state did not have a statewide network; for the purposes of this research
they are recorded as having received and completed the survey. This information is
summarized in Tables 2 and 3.
Table 2. Survey Response Rate
Count Percent Surveys Sent 49 100% Responses 30* 59% Completed Surveys 21 43% Incomplete 7 16%
*includes two responses sent via email to NCMM
Table 3. Frequency of Statewide Networks
Count Percent Has Statewide Network 14 67% No Statewide Network 6 29% I Don't Know 1 5%
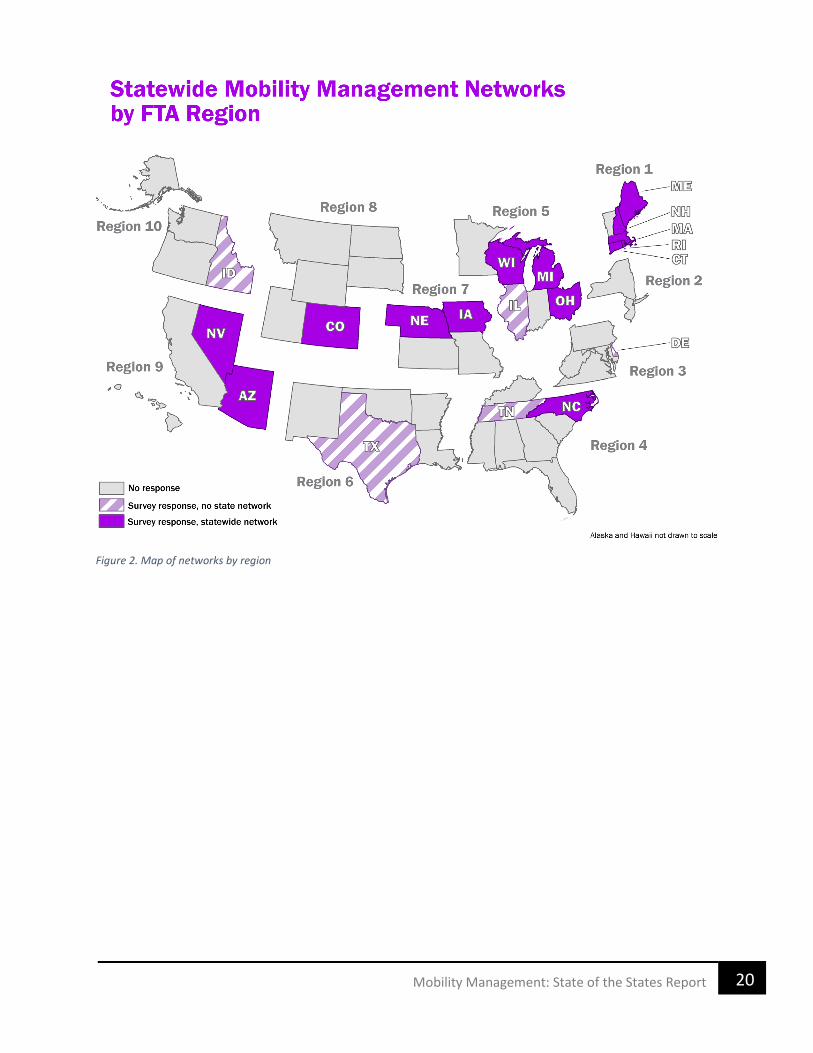
The 14 respondents who answered “Yes” to Question 2 proceeded to answer the remaining
questions. The states represented in this group of 14 are Arizona, Colorado, Connecticut, Iowa,
Maine, Massachusetts, Michigan, Nebraska, Nevada, New Hampshire, North Carolina, Ohio,
Rhode Island, and Wisconsin.
20 Mobility Management: State of the States Report
Figure 2. Map of networks by region
21 Mobility Management: State of the States Report
FINDINGS
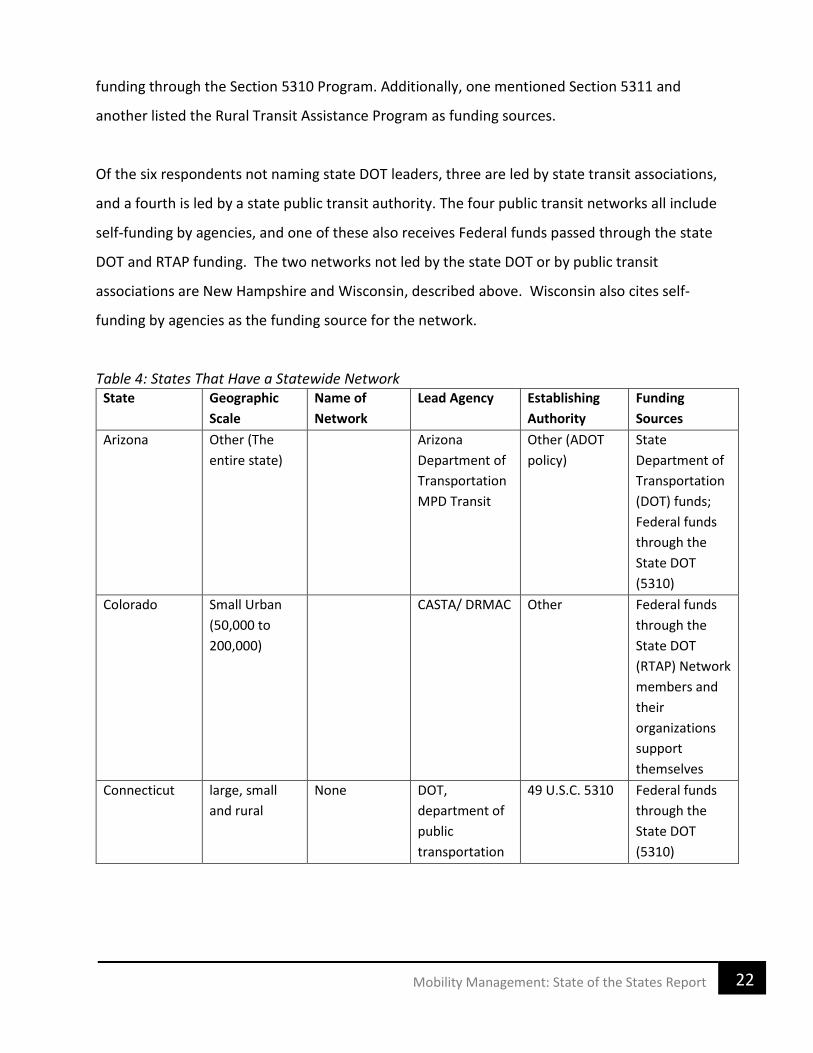
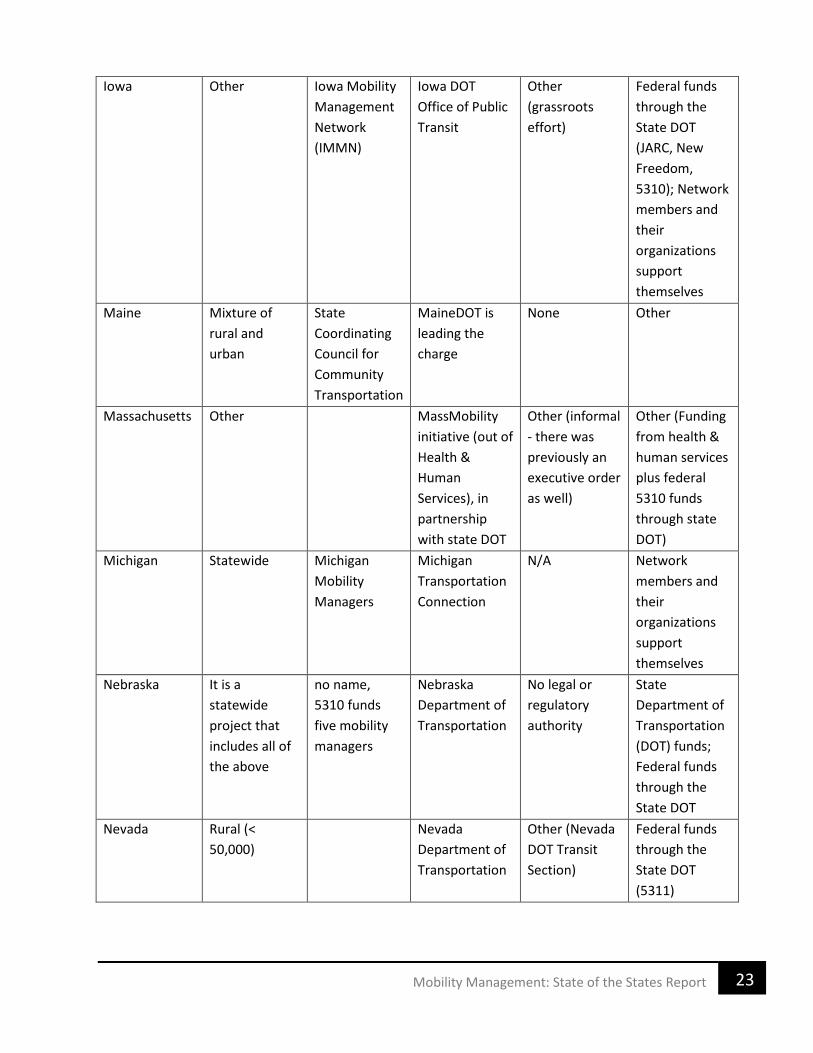
Respondents were asked about their state’s network, including geographic scale, the name of
the network, which agency leads it, the legal or regulatory authority for establishing this
network, and how the network is funded. This information is summarized in Table 4.
The statewide mobility management networks have a strong public transit component. Almost
all those that responded, indicated that the networks in their respective states are either led by
associations of public transit agencies, or are led by the public transit department within their
state DOT. Two exceptions are the New Hampshire Mobility Management Network and the
Wisconsin Association of Mobility Managers. The New Hampshire network consists of
community transportation services provided by volunteer drivers and led by Easter Seals. This
program functions within the State Coordinating Council for Community Transportation, which
engages with public and human service transportation providers in their statewide coordination
and mobility management efforts. The other exception, the Wisconsin Association of Mobility
Managers emerged from an intensive training program begun by the Wisconsin Department of
Transportation, and currently offers training and a certificate program, advocacy and seminars
to promote professional development for mobility managers. Members include human service
transportation providers, public transit providers, veteran organizations, senior service
providers and independent living centers, among others.
Nine of the 14 responding statewide networks were established through governor's initiatives
and executive orders or through state legislation. All of these states have or have had State
Coordinating Committees, five of which are currently active and four currently inactive. The
three of the five states without a legislative or governor's mandate are led and funded through
their state Department of Transportation. Eight of the 14 respondents name the state
Department of Transportation as the lead or co-leading agency for their statewide mobility
management network. Funding and affiliated networks for these agencies reflect the state DOT
leadership. All of these agencies cite state DOT and/or Federal funds passed through the state
DOT as their funding source. Five of the eight DOT-led network representatives identified
22 Mobility Management: State of the States Report
funding through the Section 5310 Program. Additionally, one mentioned Section 5311 and
another listed the Rural Transit Assistance Program as funding sources.
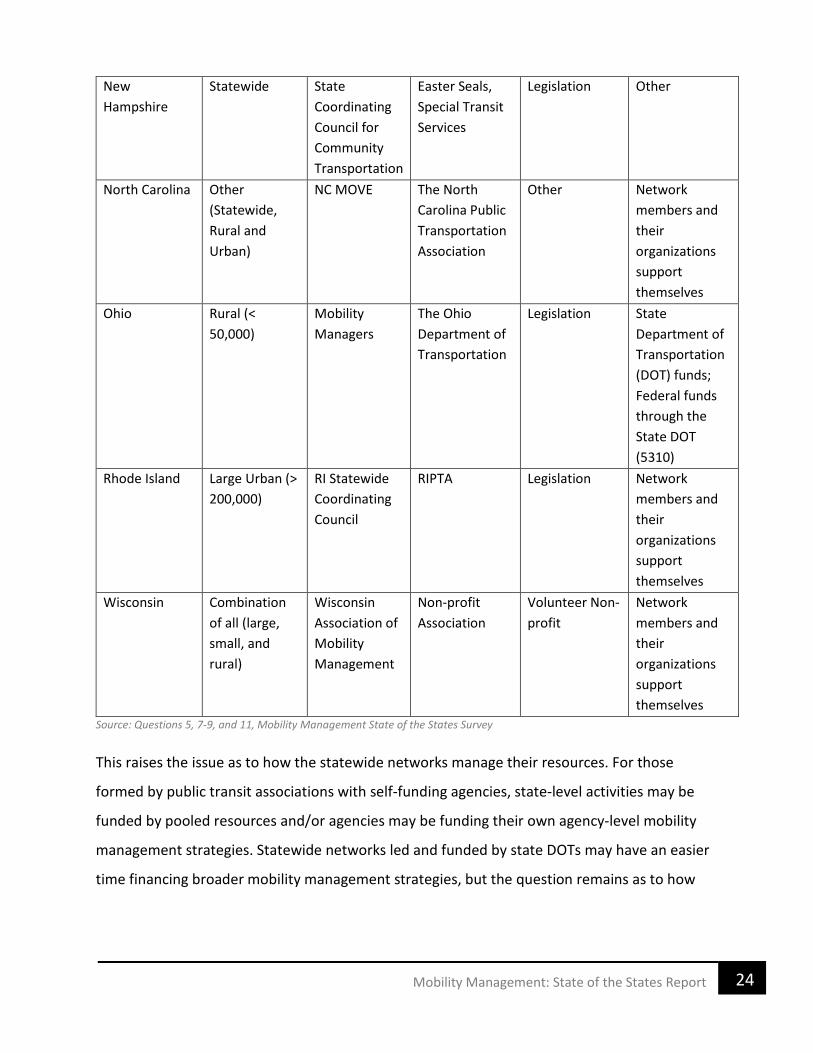
Of the six respondents not naming state DOT leaders, three are led by state transit associations,
and a fourth is led by a state public transit authority. The four public transit networks all include
self-funding by agencies, and one of these also receives Federal funds passed through the state
DOT and RTAP funding. The two networks not led by the state DOT or by public transit
associations are New Hampshire and Wisconsin, described above. Wisconsin also cites self-
funding by agencies as the funding source for the network.
Table 4: States That Have a Statewide Network State Geographic
Scale Name of Network
Lead Agency Establishing Authority
Funding Sources
Arizona Other (The entire state)
Arizona Department of Transportation MPD Transit
Other (ADOT policy)
State Department of Transportation (DOT) funds; Federal funds through the State DOT (5310)
Colorado Small Urban (50,000 to 200,000)
CASTA/ DRMAC Other Federal funds through the State DOT (RTAP) Network members and their organizations support themselves
Connecticut large, small and rural
None DOT, department of public transportation
49 U.S.C. 5310 Federal funds through the State DOT (5310)
23 Mobility Management: State of the States Report
Iowa Other Iowa Mobility Management Network (IMMN)
Iowa DOT Office of Public Transit
Other (grassroots effort)
Federal funds through the State DOT (JARC, New Freedom, 5310); Network members and their organizations support themselves
Maine Mixture of rural and urban
State Coordinating Council for Community Transportation
MaineDOT is leading the charge
None Other
Massachusetts Other MassMobility initiative (out of Health & Human Services), in partnership with state DOT
Other (informal - there was previously an executive order as well)
Other (Funding from health & human services plus federal 5310 funds through state DOT)
Michigan Statewide Michigan Mobility Managers
Michigan Transportation Connection
N/A Network members and their organizations support themselves
Nebraska It is a statewide project that includes all of the above
no name, 5310 funds five mobility managers
Nebraska Department of Transportation
No legal or regulatory authority
State Department of Transportation (DOT) funds; Federal funds through the State DOT
Nevada Rural (< 50,000)
Nevada Department of Transportation
Other (Nevada DOT Transit Section)
Federal funds through the State DOT (5311)
24 Mobility Management: State of the States Report
New Hampshire
Statewide State Coordinating Council for Community Transportation
Easter Seals, Special Transit Services
Legislation Other
North Carolina Other (Statewide, Rural and Urban)
NC MOVE The North Carolina Public Transportation Association
Other Network members and their organizations support themselves
Ohio Rural (< 50,000)
Mobility Managers
The Ohio Department of Transportation
Legislation State Department of Transportation (DOT) funds; Federal funds through the State DOT (5310)
Rhode Island Large Urban (> 200,000)
RI Statewide Coordinating Council
RIPTA Legislation Network members and their organizations support themselves
Wisconsin Combination of all (large, small, and rural)
Wisconsin Association of Mobility Management
Non-profit Association
Volunteer Non-profit
Network members and their organizations support themselves
Source: Questions 5, 7-9, and 11, Mobility Management State of the States Survey
This raises the issue as to how the statewide networks manage their resources. For those
formed by public transit associations with self-funding agencies, state-level activities may be
funded by pooled resources and/or agencies may be funding their own agency-level mobility
management strategies. Statewide networks led and funded by state DOTs may have an easier
time financing broader mobility management strategies, but the question remains as to how
25 Mobility Management: State of the States Report
the individual needs of participants are met. These issues will be addressed in the planned
phone interviews.
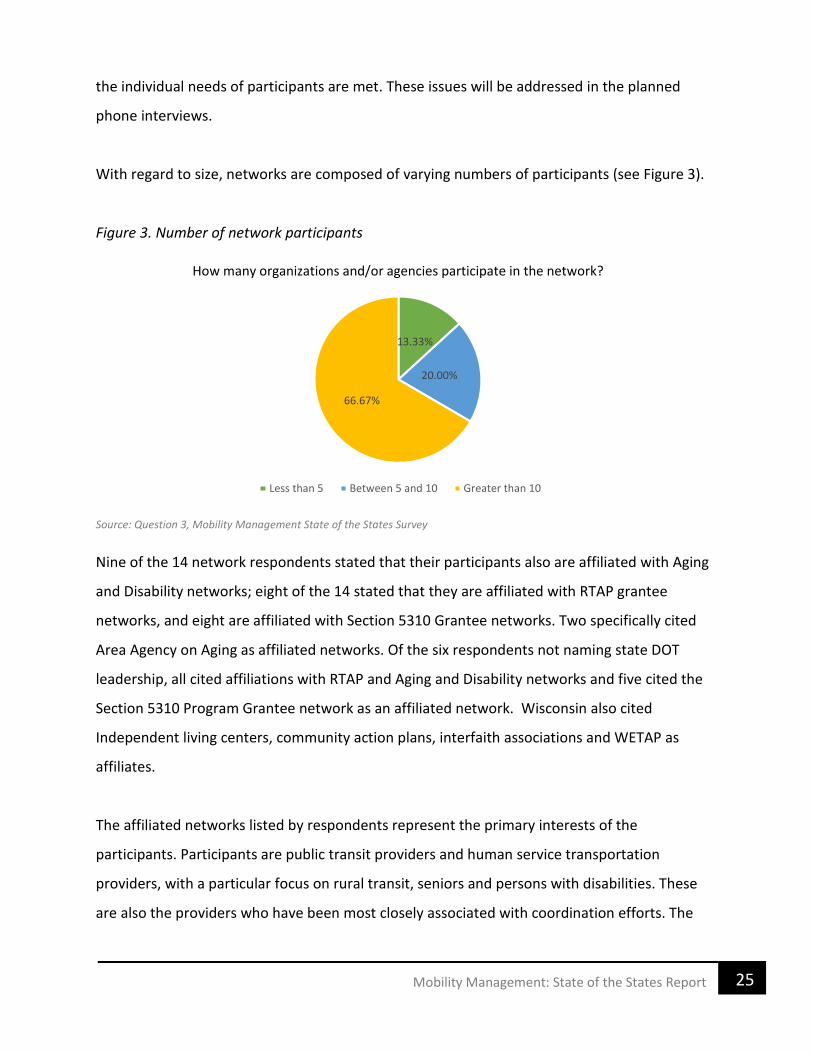
With regard to size, networks are composed of varying numbers of participants (see Figure 3).
Figure 3. Number of network participants
Source: Question 3, Mobility Management State of the States Survey
Nine of the 14 network respondents stated that their participants also are affiliated with Aging
and Disability networks; eight of the 14 stated that they are affiliated with RTAP grantee
networks, and eight are affiliated with Section 5310 Grantee networks. Two specifically cited
Area Agency on Aging as affiliated networks. Of the six respondents not naming state DOT
leadership, all cited affiliations with RTAP and Aging and Disability networks and five cited the
Section 5310 Program Grantee network as an affiliated network. Wisconsin also cited
Independent living centers, community action plans, interfaith associations and WETAP as
affiliates.
The affiliated networks listed by respondents represent the primary interests of the
participants. Participants are public transit providers and human service transportation
providers, with a particular focus on rural transit, seniors and persons with disabilities. These
are also the providers who have been most closely associated with coordination efforts. The
13.33%
20.00%
66.67%
How many organizations and/or agencies participate in the network?
Less than 5 Between 5 and 10 Greater than 10
26 Mobility Management: State of the States Report
establishment of these programs and networks follows from the federal mandate for
coordinated transportation and for state DOTs to implement coordinated Human Service
Transportation Plans. A shift in focus on mobility management is a natural progression of focus
from coordinated services to improving market access to services. The implementation of
mobility management strategies in response to federal initiatives is reflected in the survey
results. Eight of the 14 respondents affirmed that their networks were similarly aligned with the
Coordinating Council on Access and Mobility.
Performance Management
Five of 14 respondents had documented methods for measuring individual performance of
mobility management professionals within their network. Common measurements include
monthly or quarterly reporting on the number of meetings and trainings held and/or attended,
the number of individuals who participate in meetings and/or trainings, the number of
referrals, and the number of individuals served. Some ways that marketing efforts are
measured include website analytics and the number of collateral materials distributed. Persons
with disabilities, older adults, and veterans are specific groups whose participation is tracked.
One respondent noted the opportunity to share “success stories” in the notes section of
mobility managers’ monthly reports, indicating a desire to share among the network and learn
from those efforts that yield positive outcomes. In this instance, the statewide coordinator
tracks each report against the network’s six strategies and their accompanying goals, providing
follow-up as necessary.
Only one network – Connecticut’s – identified a means of measuring the performances of the
network as a whole, via quarterly meetings among the five mobility managers on staff. While
nine of the respondents were able to articulate the mission for their network (see State
Profiles), only Connecticut indicated any strategic planning activity, with each of their five
mobility managers developing their own missions and strategic plans. Two other networks
indicated that they were in the process of articulating their missions.
27 Mobility Management: State of the States Report
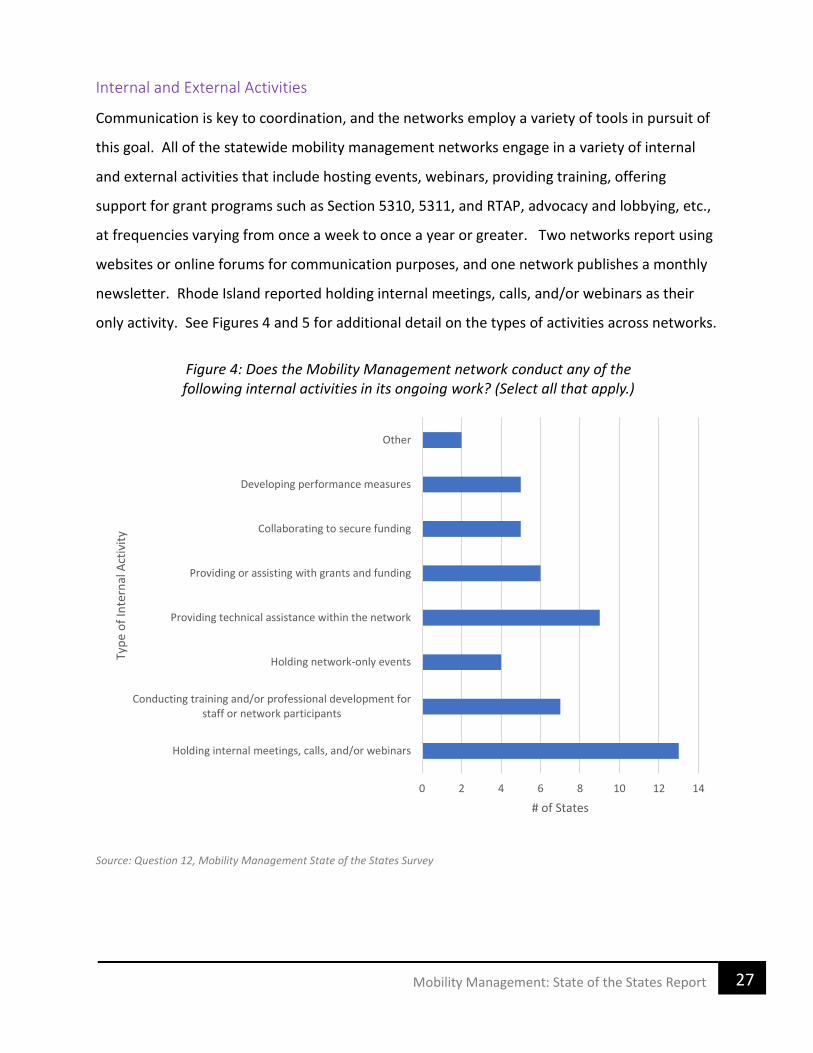
Internal and External Activities
Communication is key to coordination, and the networks employ a variety of tools in pursuit of
this goal. All of the statewide mobility management networks engage in a variety of internal
and external activities that include hosting events, webinars, providing training, offering
support for grant programs such as Section 5310, 5311, and RTAP, advocacy and lobbying, etc.,
at frequencies varying from once a week to once a year or greater. Two networks report using
websites or online forums for communication purposes, and one network publishes a monthly
newsletter. Rhode Island reported holding internal meetings, calls, and/or webinars as their
only activity. See Figures 4 and 5 for additional detail on the types of activities across networks.
Source: Question 12, Mobility Management State of the States Survey
0 2 4 6 8 10 12 14
Holding internal meetings, calls, and/or webinars
Conducting training and/or professional development forstaff or network participants
Holding network-only events
Providing technical assistance within the network
Providing or assisting with grants and funding
Collaborating to secure funding
Developing performance measures
Other
# of States
Type
of I
nter
nal A
ctiv
ity
Figure 4: Does the Mobility Management network conduct any of the following internal activities in its ongoing work? (Select all that apply.)
28 Mobility Management: State of the States Report
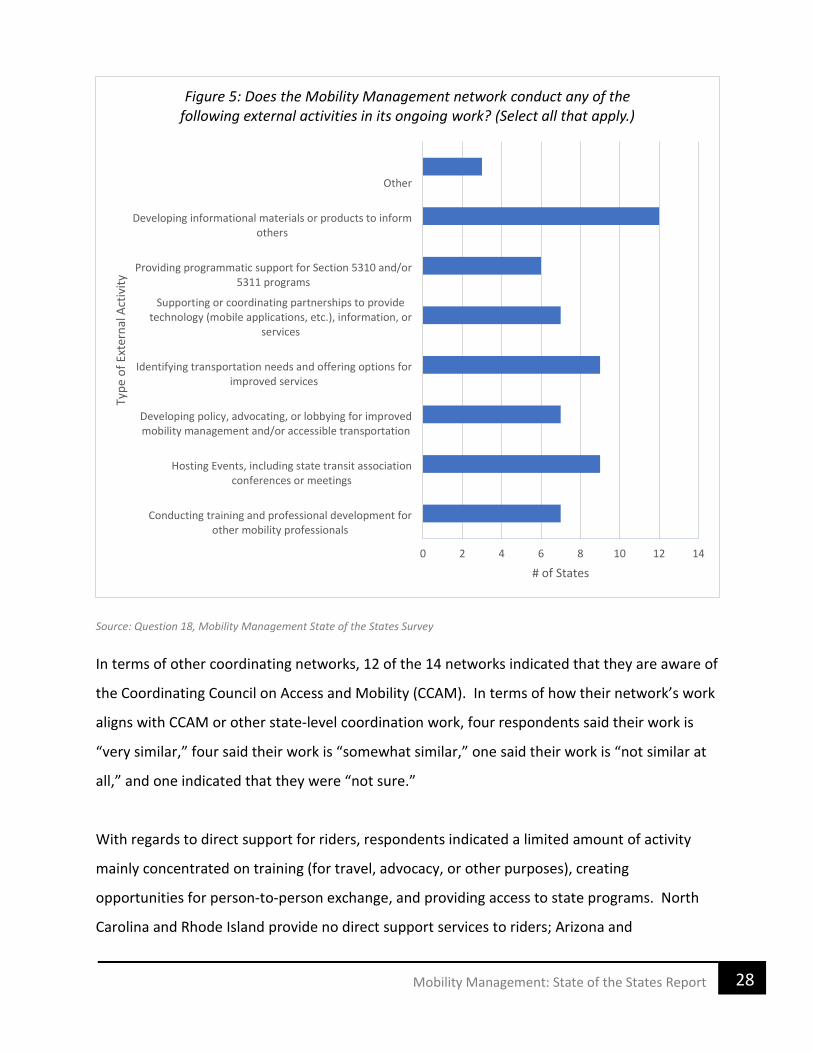
Source: Question 18, Mobility Management State of the States Survey
In terms of other coordinating networks, 12 of the 14 networks indicated that they are aware of
the Coordinating Council on Access and Mobility (CCAM). In terms of how their network’s work
aligns with CCAM or other state-level coordination work, four respondents said their work is
“very similar,” four said their work is “somewhat similar,” one said their work is “not similar at
all,” and one indicated that they were “not sure.”
With regards to direct support for riders, respondents indicated a limited amount of activity
mainly concentrated on training (for travel, advocacy, or other purposes), creating
opportunities for person-to-person exchange, and providing access to state programs. North
Carolina and Rhode Island provide no direct support services to riders; Arizona and
0 2 4 6 8 10 12 14
Conducting training and professional development forother mobility professionals
Hosting Events, including state transit associationconferences or meetings
Developing policy, advocating, or lobbying for improvedmobility management and/or accessible transportation
Identifying transportation needs and offering options forimproved services
Supporting or coordinating partnerships to providetechnology (mobile applications, etc.), information, or
services
Providing programmatic support for Section 5310 and/or5311 programs
Developing informational materials or products to informothers
Other
# of States
Type
of E
xter
nal A
ctiv
ity
Figure 5: Does the Mobility Management network conduct any of the following external activities in its ongoing work? (Select all that apply.)
29 Mobility Management: State of the States Report
Massachusetts are unsure if any riders receive direct services through the network. Only Ohio
provided an estimate of number of riders served per month: 7,567.
Challenges and Successes
The challenges facing these mobility management networks fall under four main areas:
coordination at various geographic levels, taking into account the different needs of rural
versus urban riders; securing adequate funding and ensuring that funders perceive that their
dollars are well spent; conveying the value of the network by measuring outcomes; and
onboarding and training of mobility management professionals. While respondents admitted
that addressing these challenges was an ongoing effort, they did offer a few solutions to
specific concerns.
In Iowa, the network has been operational for nearly a decade but has been tracking
performance measures for only 18 months or so. They hope to be able to begin to analyze
those measures in order to demonstrate the network’s worth to the community. In Ohio,
county-to-county travel has proved an impediment to coordinating at a regional level. As a
result, the network has set a state-level goal of building regional “teams” of mobility managers
to prioritize and address challenges as they occur. That network is also working to build a
virtual catalog of high-quality training materials for new mobility managers and has instituted a
mentor program that pairs up seasoned mobility managers with new ones. In North Carolina,
the network was struggling to promote itself and recruit new members. As a solution to that
challenge, NC MOVE joined the North Carolina Public Transportation Association (NCPTA) so
that the network could operate as an NCPTA peer group while still accepting members not
affiliated with NCPTA. As part of its membership benefits, NCPTA distributes information about
NC MOVE to over 400 NCPTA members and provides limited financial support to the network.
“The network is working to improve transportation services available to community members by advocating to providers and local
government, addressing gaps in service and planning for future goals.”
30 Mobility Management: State of the States Report
When asked how their network has achieved success, the most common response mentions
some form of improving communication and collaboration among internal teams and with
external partners. Growth in membership and increased visibility of the network are also cited
as markers of success. Access to statewide resources is key: in Ohio, the network has
established alliances with the Department of Developmental Disabilities and the Senior Corps’
RSVP program, overseen by the Corporation for National and Community Service in order to
advocate for those agencies’ local efforts when possible. In Nevada, members of the network
are collaborating in order to identify coverage gaps and determine how to fill them. Iowa has
transformed a grassroots initiative into a mature network and credits the ongoing support of
the state DOT for helping the network achieve success: “Of those communities being served by
mobility managers, we can systematically prove that the community has a greater acceptance
of public transit, and stronger knowledge of services available. As compared to transit systems
[in Iowa] without mobility management, we are constantly out in the community and creating
new services that the community needs.”
“We are talking on a regular basis, sharing data, and looking for success stories elsewhere that we can leverage.”
31 Mobility Management: State of the States Report
CONCLUSIONS
Strong political backing is necessary as evidenced by the fact that most networks were brought
into existence with legislative action, with the network being led by the respective state DOTs.
The sustainability of the networks seems to be contingent on the availability of federal funds
(5310 or other formula program funds) or some other dedicated source of funding. Where
existing, the networks are of considerable size in terms of the number of participants with
many respondents indicating that their networks consist of greater than 10 participants.
Agencies such as Aging and Disability, RTAP, and other 5310 grantees were listed as being
affiliates to the mobility management networks.
The network managers responded that they would like to share “success stories” of mobility
networks to other states and agencies so that there is continuous learning that benefits all.
With this in mind, the performance of the network participants are measured through frequent
reporting, ridership tracking, and population groups catered to. Apart from these reporting and
tracking mechanisms, the respondents also indicated that they offered frequent training and
webinars, etc. These findings are indicative of the interest and desire on the part of the
network managers to propagate information and learn from others. While the electronic
survey has resulted in some interesting findings, it has also sparked the need to understand the
network management in a much more in-depth manner. With this in mind, the research team is
intending to conduct telephone interviews with the network managers to glean more
understanding of the functioning of these mobility networks that can be used to share best
practices with everyone.
32 Mobility Management: State of the States Report
NEXT STEPS
For phase two of this project, the research team will be conducting phone interviews with those
states that have indicated the presence of a statewide mobility management program. One
goal of these interviews is to further understand the issues and challenges facing the networks,
and determine what resources coordinators need in order to continue to improve service
delivery across their state networks.
Combined, the web surveys and phone interviews will help the research team generate
materials that will help to improve guidance for those states without statewide networks that
are looking to implement mobility management at that level. These states may already have
local or regional mobility management programs in place, or they may be administering
programs that serve specific populations (rural, veterans, etc.) but be looking to expand their
coordination to encompass a broader ridership base. Regardless of the size or scope of the
program, we believe that the research collected and analyzed via the survey and interviews will
have broad applicability to the field of mobility management as a whole.

33 Mobility Management: State of the States Report
APPENDIX A Web-based Survey You were identified as a leader in Mobility Management (definition pop-up) in your state. Your responses to this survey will contribute to understanding the state of the practice, and will assist those interested in implementing mobility management.
1. Please select the state or territory you work in... (dropdown) 2. Does your state have a Mobility Management network? A Mobility Management
Network is comprised of the agencies, organizations, and/or participants who lead efforts to improve integration across mobility options.
a. Yes – Continue b. No – Link to NCMM to learn more c. I do not know; If so, Please forward the survey to whoever will be the
appropriate individual to respond to this survey. Thanks. 3. What is the geographic scale of the network?
a. Large Urban (> 200,000) b. Small Urban (50,000 to 200,000) c. Rural (< 50,000) d. Other: _______
4. What is the name of this network, if any? 5. Which agency leads the network? 6. What is the public website for this network, if any? 7. What is the legal or regulatory authority for establishing this network, if any?
a. Executive Order b. Legislation c. Other: _______
8. Does your mobility management network have a mission and strategic plan? Please describe.
9. How is the network funded? Select all that apply. a. State Department of Transportation (DOT) funds b. Non-DOT state funds c. Federal funds through the State DOT; please identify the funding
source:___________ d. Network members and their organizations support themselves e. Other:___________
10. How many organizations and/or agencies participate in the network? a. Less than 5 b. Between 5 and 10 c. Greater than 10
11. Are your mobility management network members also part of other state networks such as:
a. National Rural Transit Assistance Program b. 5310 grantee network c. Aging and Disability Resource Network
34 Mobility Management: State of the States Report
d. AAA Network e. Other, please explain:___________
12. Do you measure the performance of individual Mobility Management professionals who participate in the network?
a. Yes b. No
13. (If #12 Yes) Please describe the metrics and methods used to measure individual performance.
14. Do you measure the performance of the network as a whole? a. Yes b. No
15. (If #14 Yes) Please describe the metrics and methods used to measure network performance.
16. Does the Mobility Management network conduct any of the following internal activities in its ongoing work?
a. Holding internal meetings, calls, and/or webinars b. Conducting training and/or professional development for staff or network
participants c. Holding network-only events d. Providing technical assistance within the network e. Providing or assisting with grants and funding f. Collaborating to secure funding g. Developing performance measures h. Other: _______
17. How frequently do the internal activities happen? a. Once a week b. Once every two weeks c. Once a month d. Once a quarter e. Once a year or greater
18. Does the Mobility Management network conduct any of the following external activities in its ongoing work?
a. Conducting training and professional development for other mobility professionals
b. Hosting Events, including state transit association conferences or meetings c. Developing policy, advocating, or lobbying for improved mobility management
and/or accessible transportation d. Identifying transportation needs and offering options for improved services e. Supporting or coordinating partnerships to provide technology (mobile
applications, etc.), information, or services f. Providing programmatic support for Section 5310 and/or 5311 programs g. Developing informational materials or products to inform others h. Other: _______
19. How frequently do the external activities happen?
35 Mobility Management: State of the States Report
a. Once a week b. Once every two weeks c. Once a month d. Once a quarter e. Once a year or greater
20. Which of the following tools does the network use to communicate? a. Website/Online Forum b. Email group (Google Group, listserv) c. In-person meetings d. Conference Call e. Other: _______
21. Are you aware of the Coordinating Council on Access and Mobility? (a) Yes (b) No 22. (If #21 yes), how does your Mobility Management network goals align with the
Coordinating Council on Access and Mobility (CCAM) efforts? Please explain. a. Not similar at all: _______ b. Somewhat similar: _______ c. Very similar: _______ d. Not sure: _______
23. Does the Mobility Management network provide any of the following support services directly to riders?
a. Training (Travel, Advocacy, or other) b. Funding c. Opportunities for person-to-person exchange d. Access to state programs e. Other: _______ f. Not sure
24. How many riders per month are served by the network? 25. What challenges has the network faced? What were the solutions to these challenges? 26. How has the network achieved success?
36 Mobility Management: State of the States Report
REFERENCES A. Vishwanath, H. S. Gan, S. Kalyanaraman, S. Winter, & I. Mareels. (2015). Personalized public
transportation: A mobility model and its application to Melbourne. IEEE Intelligent Transportation Systems Magazine, 7(4), 37-48. doi:10.1109/MITS.2015.2474975
American Public Transportation Association. (2012). Mobility Management Customer-Focused Public Transportation [Brochure].
Bascom, G. W., & Christensen, K. M. (2017). The impacts of limited transportation access on persons with disabilities' social participation. Journal of Transport & Health, 7(B), 227-234. doi:10.1016/j.jth.2017.10.002
Bezyak, J. L., Sabella, S. A., & Gattis, R. H. (2017). Public transportation: An investigation of barriers for people with disabilities. Journal of Disability Policy Studies, 28(1), 52-60. doi:10.1177/1044207317702070
Bond, M., Brown, J. R., & Wood, J. (2017). Adapting to challenge: examining older adult transportation in rural communities. Case Studies on Transport Policy, 5(4), 707–715. doi:10.1016/j.cstp.2017.07.004
Burkhardt, J., & Garrity, R. (2012). Sharing the costs of human services transportation. Transportation Research Record: Journal of the Transportation Research Board, (2277), 57-64. Retrieved from http://trrjournalonline.trb.org/doi/abs/10.3141/2277-07.
Burkhardt, J., & McLary, J. (n.d.). The business case for mobility management. Retrieved from https://www.apta.com/resources/mobility/Documents/Business-Case-for-Mobility-Management.pdf.
Clarke, P. J., Ailshire, J. A., Nieuwenhuijsen, E. R., & de Kleijn – de Vrankrijker, Marijke W. (2011). Participation among adults with disability: The role of the urban environment. Social Science & Medicine, 72(10), 1674-84. doi:10.1016/j.socscimed.2011.03.025
Clarke, P., Ailshire, J. A., & Lantz, P. (2009). Urban built environments and trajectories of mobility disability: Findings from a national sample of community-dwelling American adults (1986–2001). Social Science & Medicine, 69(6):964-70. doi:10.1016/j.socscimed.2009.06.041
Ellis, E. (2009). Mobility management. AARP Public Policy Institute. Washington, DC.
European Conference of Ministers of Transport. (2006). Improving access to public transport: Guidelines for transport personnel. Paris: ECMT Publications. doi:10.1787/9789282113295-en
Federal Transportation Administration. (2007). Mobility management. Washington, DC.
Federal Transportation Administration. (2007). United We Ride. Washington, DC.
Friedman, C., & Rizzolo, M. C. (2016). The state of transportation for people with intellectual and developmental disabilities in Medicaid home and community-based services 1915(c)
37 Mobility Management: State of the States Report
waivers. Journal of Disability Policy Studies, 27(3), 168-177. doi:10.1177/1044207316644413
Haveman, M., Tillmann, V., Stöppler, R., Kvas, Š, & Monninger, D. (2013). Mobility and public transport use abilities of children and young adults with intellectual disabilities: Results from the 3-year Nordhorn public transportation intervention study. Journal of Policy and Practice in Intellectual Disabilities, 10(4), 289-299. doi:10.1111/jppi.12059
Jansuwan, S., Christensen, K. M., & Chen, A. (2013). Assessing the transportation needs of low-mobility individuals: Case study of a small urban community in Utah. Journal of Urban Planning and Development, 139(2), 104-114. doi:10.1061/(ASCE)UP.1943-5444.0000142
Jittrapirom, P., Caiati, V., Feneri, A., Ebrahimigharehbaghi, S., Alonso-González, M. J., & Narayan, J. (2017). Mobility as a service: a critical review of definition, assessments of schemes, and key challenges. Urban Planning, 2(2), 13-25. doi:10.17645/up.v2i2.931.
Job Access Reverse Commute / New Freedom / Section 5310. (n.d.). Regional Transportation Authority Mapping and Statistics (RTAMS). Retrieved from http://www.rtams.org/rtams/planningProgram.jsp?id=5
KFH Group, Inc. (2018). Successful Mobility Management Practices for Improving Transportation Services in Small Urban and Rural Areas. National Cooperative Highway Research Program (NCHRP) Project 20-65(68). Retrieved from http://apps.trb.org/cmsfeed/TRBNetProjectDisplay.asp?ProjectID=4157.
Kostyniuk, L. P., R. M. St. Louis, N. Zanier, D. W. Eby, & L. J. Molnar (2012). Transportation, mobility, and older adults in rural Michigan. Lansing, MI: University of Michigan Transportation Research Institute Behavioral Sciences Group.
Kroeger, D., Andrle, S., & Hallock, P. (2005). Part 1: Planning: Coordination of Transit and School Busing in Iowa. Transportation Research Record: Journal of the Transportation Research Board, (1927), 1-10. doi:10.3141/1927-01
Majumdar, S. R., Sen, L., Highsmith, M. K., & Cherrington, L. (2013). The case of performance measurement in mobility management programs. Public Performance & Management Review, 37(2), 280-301. doi:10.2753/PMR1530-9576370205
Majumdar, S. R., Sen, L., & Park, S. (2013). The feasibility of mobility management in the United States. Public Works Management & Policy, 18(3), 263-278. doi:10.1177/1087724X12469795
Martens, K. (2018). Ageing, impairments and travel: Priority setting for an inclusive transport system. Paper presented at the 92th Annual Meeting Transportation Research Board, Washington, DC.
Mattson, J., Miller, J., Goodwill, J., Sriraj, P.S., & Hough, J. (2017). Impacts of mobility management and human service transportation coordination efforts and end-user quality of life. Journal of the Transportation Research Forum 56(1), 77-92.
38 Mobility Management: State of the States Report
Myers, A., & Ravesloot, C. (2016). Navigating time and space: How Americans with disabilities use time and transportation. Community Development, 47(1), 75-90. doi:10.1080/15575330.2015.1111399
Nathalie P. Voorhees Center for Neighborhood and Community Improvement (2014). Planning Transportation to Meet the Needs of an Aging Illinois: An Assessment. Chicago, IL.
Page, S. (2016). A strategic framework for building civic capacity. Urban Affairs Review, 52(4), 439-470. doi:10.1177/1078087415596848
Pucher, J., & Renne, J. (2005). Rural mobility and mode choice: Evidence from the 2001 national household travel survey. Transportation, 32(2), 165–186. doi:10.1007/s11116-004-5508-3
Rodman, W., Berez, D., & Moser, S. (2016). The national mobility management initiative: state DOTs connecting specialized transportation users and rides. NCHRP 20-65(60)
Rall, J., & Myers, A. (2015). State Human Service Transportation Coordinating Councils: An Overview and State Profiles. National Conference of State Legislatures.
Sarawut, J., Christensen, K. M., & Anthony, C. (2013). Assessing the transportation needs of low-mobility individuals: Case study of a small urban community in Utah. Journal of Urban Planning and Development, 139(2), 104-114. doi:10.1061/(ASCE)UP.1943-5444.0000142
Schlossberg, M. (2004). Coordination as a strategy for serving the transportation disadvantaged: a comparative framework of local and state roles. Public Works Management & Policy, 9(2), 132-144. doi:10.1177/1087724X04268562
Sriraj, P. S., Dirks, L., & Singh, H. (2010). Developing an information management system for public and specialized transportation providers of Illinois: A web-based, interactive system. Transportation Research Record, 2145(1), 91-99. doi:10.3141/2145-11
Stati Uniti d'America. (1993). Accessible transportation and mobility. Washington, D.C.: National Academy Press.
Sylvestre, G., Gaudry, L., & Christopher, G. (2007). Mobility options for the aging population of Manitoba: an action plan for regional solutions. Winnipeg, MB: The Institute of Urban Studies.
Sze, N. N., & Christensen, K. M. (2017). Access to urban transportation system for individuals with disabilities. IATSS Research, 41(2), 66-73. doi:10.1016/j.iatssr.2017.05.002
U.S. Dept. of Transportation (2002). 2002 National Transportation Availability and Use Survey. Washington, DC: Bureau of Transportation Statistics.
U.S. Dept. of Transportation (2011). Technological innovations in transportation for people with disabilities: Workshop summary report, February 23, 2011. Washington, D.C.
United States. Congress. Senate Committee on Health, Education, Labor, and Pensions. (2014). The Americans with Disabilities Act and accessible transportation: Challenges and opportunities: Hearing of the committee on health, education, labor, and pensions, united
39 Mobility Management: State of the States Report
states senate, one hundred twelfth congress, first session, November 17, 2011. Washington: U.S. Government Printing Office.
Wisconsin Department of Transportation, Bureau of Transit, Local Roads, Railroads and Harbors. (2015). Mobility management practices in Wisconsin. Retrieved from http://wisconsindot.gov/Documents/doing-bus/local-gov/astnce-pgms/transit/mob-prac.pdf.
Wood, J., Brown, J.R., Bond, M., & Suguri, V. (2016). Older adult transportation in rural communities: results of an agency survey. Journal of Public Transportation, 19(2), 154-167.
40 Mobility Management: State of the States Report
The National Center for Mobility Management (NCMM; www.nationalcenterformobilitymanagement.org) is a national technical assistance center created to facilitate communities in adopting mobility management strategies. The NCMM is funded through a cooperative agreement with the Federal Transit Administration, and is operated through a consortium of three national organizations – the American Public Transportation Association, the Community Transportation Association of America, and Easterseals. Content in this document is disseminated by NCMM in the interest of information exchange. Neither the NCMM nor the U.S. DOT, FTA assumes liability for its contents or use.