mobile apps and transportation -...
TRANSCRIPT
O C T O B E R 2 0 1 6
S u s a n S h a h e e n , P h . D .
E l l i o t M a r t i n , P H . D .
A d a m C o h e n
A p o o r va M u s u n u r i
A b h i n av B h at ta c h a r y ya
Mobile Apps and Transportation:A Review of Smartphone Apps and a Study of User Response to Multimodal Traveler Information
Final Report
tsrc
A Rev
view of Sm
Mob
martphone
bile Apps a
Apps andTravele
Fin
Susan S
Elliot M
Ada
Apoor
Abhinav
Oct
and Trans
d a Study oer Informa
nal Report
Shaheen, P
Martin, Ph
am Cohen
va Musun
Bhattach
tober 2016
sportation
of User Reation
t
Ph.D.
h.D.
n
nuri
haryya
6
n:
esponse too Multimo
1
odal
TR0003 (REV 10/98)TECHNICAL REPORT DOCUMENTATION PAGESTATE OF CALIFORNIA • DEPARTMENT OF TRANSPORTATION
Reproduction of completed page authorized.
1. REPORT NUMBER 2. GOVERNMENT ASSOCIATION NUMBER 3. RECIPIENT'S CATALOG NUMBER
4. TITLE AND SUBTITLE
Mobile Apps and Transportation: A Review of Smartphone Apps and A Study of User Response to Multimodal Traveler Information
5. REPORT DATE
October 20166. PERFORMING ORGANIZATION CODE
N/A7. AUTHOR
Susan Shaheen, Elliot Martin, Adam Cohen, Apoorva Musunuri, Abhinav Bhattacharyya
8. PERFORMING ORGANIZATION REPORT NO.
N/A9. PERFORMING ORGANIZATION NAME AND ADDRESS
University of California at Berkeley Institute of Transportation Studies Berkeley, CA 94720
10. WORK UNIT NUMBER
N/A11. CONTRACT OR GRANT NUMBER
XXXXX12. SPONSORING AGENCY AND ADDRESS
California Department of Transportation (Caltrans) Division of Research, Innovation and System Information, MS-83 1227 O Street Sacramento, CA 95814
13. TYPE OF REPORT AND PERIOD COVERED
Final Report, April 2015 - October 2016
14. SPONSORING AGENCY CODE
N/A15. SUPPLEMENTARY NOTES
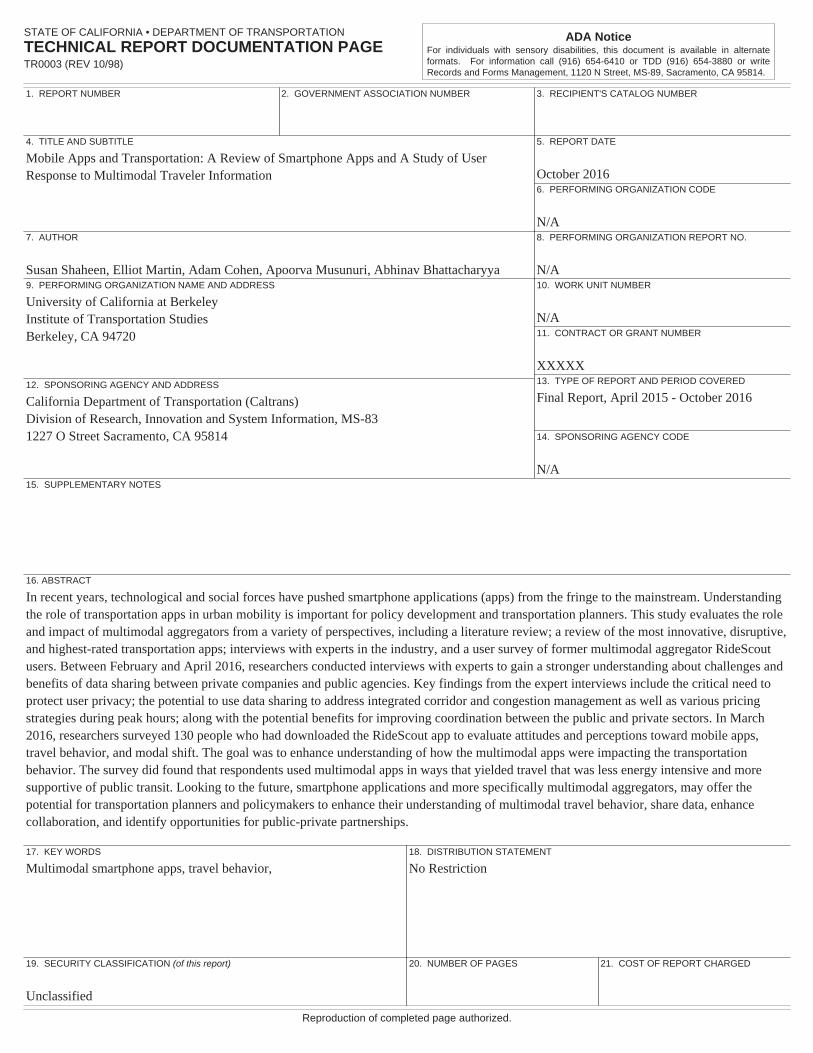
16. ABSTRACT
In recent years, technological and social forces have pushed smartphone applications (apps) from the fringe to the mainstream. Understanding the role of transportation apps in urban mobility is important for policy development and transportation planners. This study evaluates the role and impact of multimodal aggregators from a variety of perspectives, including a literature review; a review of the most innovative, disruptive, and highest-rated transportation apps; interviews with experts in the industry, and a user survey of former multimodal aggregator RideScout users. Between February and April 2016, researchers conducted interviews with experts to gain a stronger understanding about challenges and benefits of data sharing between private companies and public agencies. Key findings from the expert interviews include the critical need to protect user privacy; the potential to use data sharing to address integrated corridor and congestion management as well as various pricing strategies during peak hours; along with the potential benefits for improving coordination between the public and private sectors. In March 2016, researchers surveyed 130 people who had downloaded the RideScout app to evaluate attitudes and perceptions toward mobile apps, travel behavior, and modal shift. The goal was to enhance understanding of how the multimodal apps were impacting the transportation behavior. The survey did found that respondents used multimodal apps in ways that yielded travel that was less energy intensive and more supportive of public transit. Looking to the future, smartphone applications and more specifically multimodal aggregators, may offer the potential for transportation planners and policymakers to enhance their understanding of multimodal travel behavior, share data, enhance collaboration, and identify opportunities for public-private partnerships.
17. KEY WORDS
Multimodal smartphone apps, travel behavior, 18. DISTRIBUTION STATEMENT
No Restriction
19. SECURITY CLASSIFICATION (of this report)
Unclassified
20. NUMBER OF PAGES 21. COST OF REPORT CHARGED
For individuals with sensory disabilities, this document is available in alternate formats. For information call (916) 654-6410 or TDD (916) 654-3880 or write Records and Forms Management, 1120 N Street, MS-89, Sacramento, CA 95814.
ADA Notice
2
Table of Contents
Disclaimer Statement ...................................................................................................................... 6
Disclosure Statement ...................................................................................................................... 6
Acknowledgments........................................................................................................................... 6
Executive Summary ........................................................................................................................ 7
1. Introduction ............................................................................................................................. 9
1.1. Overview .......................................................................................................................... 9
1.2. Problem and Objectives ................................................................................................... 9
2. Background ............................................................................................................................... 11
2.1. The Emergence of Mobility Apps and Their Impact on Multimodal Travel ................. 11
2.2. Multimodal Travel .......................................................................................................... 11
2.2.1 Socioeconomic and Behavioral Research .................................................................... 11
2.2.2 Multimodal Modeling .................................................................................................. 12
2.3. Smartphone Apps ........................................................................................................... 12
2.4. Mobility Apps Impacting Transportation ....................................................................... 14
2.5. Case Studies of Select Multimodal Mobility Apps ........................................................ 15
2.6. Impacts of Mobile Apps on Travel Behavior ................................................................. 18
3. Review of Smartphone Apps ................................................................................................ 20
3.1. App Shortlist Methodology ............................................................................................ 20
3.1.1. Cataloging ............................................................................................................... 21
3.1.2. Process of Elimination ............................................................................................ 22
3.1.3. Categorizing ............................................................................................................ 22
3.1.4. Specific Procedures ................................................................................................. 24
3.2. Most Innovative Apps .................................................................................................... 25
3.3. Most Disruptive Apps .................................................................................................... 31
3.4. Highest-Rated Apps ....................................................................................................... 38
4. Expert Interviews .................................................................................................................. 43
4.1. Overview ........................................................................................................................ 43
4.2. Methodology .................................................................................................................. 43
4.3. Questionnaire and Experts ............................................................................................. 43
4.4. Expert Interview Key Findings ...................................................................................... 44
3
4.4.1. Private Companies on Data Sharing ....................................................................... 45
4.4.2. Public Agencies on Data Sharing ........................................................................... 45
4.4.3. Most Beneficial Data Sharing Collaboration .......................................................... 45
4.4.4. Types of Data Being Collected and Shared ............................................................ 46
4.4.5. Privacy Concerns .................................................................................................... 46
4.4.6. Benefits to The End User ........................................................................................ 47
4.4.7. Recommendations For Improving Data Sharing Collaborations ............................ 47
4.4.8. Contributions to City Planning Process .................................................................. 47
4.4.9. Collecting Person Miles Traveled (PMT) ............................................................... 48
4.4.10. Future of Data Sharing in The Next 5-10 Years ................................................. 48
5. User Survey and Results ....................................................................................................... 49
5.1. Methodology .................................................................................................................. 49
5.2. Results ............................................................................................................................ 49
5.2.1. Socio-Demographic Analysis of the Sample Population ........................................ 49
5.2.2. General Travel Behavior ......................................................................................... 53
5.2.3. Most Recent Multimodal App Use ......................................................................... 56
5.2.4. Travel Changes ....................................................................................................... 60
5.2.5. Money Spent on Transportation.............................................................................. 66
5.2.6. Mobile Payment Apps and Public Transit .............................................................. 69
5.2.7. Future of Multimodal and Public Transit Apps ...................................................... 74
6. Conclusions and Key Takeaways ......................................................................................... 76
References ..................................................................................................................................... 78
4
Table of Tables Table 1 Sub‐Categories of Mobility Apps (FHWA, 2016) .............................................................. 14 Table 2 Benefits of Mobility Apps (FHWA, 2016) ......................................................................... 19 Table of Figures Figure 1 Five key phases in the evolution of mobile apps (Credit: FHWA, 2016). ....................... 13 Figure 2 Screenshots of Citymapper app (Build Me a Site, 2014). ............................................... 16 Figure 3 Screenshots of TripGo app (MacTrast, 2015). ................................................................ 17 Figure 4 Screenshots of former RideScout app. ........................................................................... 18 Figure 5 Screenshot of Metropia .................................................................................................. 26 Figure 6 Screen Shot of Drivewise Mobile .................................................................................... 27 Figure 7 Screenshot of Best Parking ............................................................................................. 28 Figure 8 Screenshot of Drop Car ................................................................................................... 29 Figure 9 Screenshot of OnStar Remote Link ................................................................................. 30 Figure 10 Screenshot of the Former RideScout ............................................................................ 31 Figure 11 Screeenshot of Uber ..................................................................................................... 33 Figure 12 Screenshot of Via .......................................................................................................... 34 Figure 13 Screenshot of Spotcycle ................................................................................................ 35 Figure 14 Screenshot of Zipcar ..................................................................................................... 36 Figure 15 Screenshot of Carma ..................................................................................................... 37 Figure 16 Screenshot of GasBuddy ............................................................................................... 38 Figure 17 Screenshot of Family Locator ........................................................................................ 39 Figure 18 Screenshot of Trucker Path Pro .................................................................................... 40 Figure 19 Screenshot of GrubHub ................................................................................................ 41 Figure 20 Screenshot of CityMapper ............................................................................................ 42 Figure 21 Gender of the Sample Population ................................................................................. 50 Figure 22 Age of the Sample Population ...................................................................................... 50 Figure 23 Highest Level of Education of the Sample Population ................................................ 51 Figure 24 Race or Ethnicity of Respondents ................................................................................ 52 Figure 25 Approximate Gross Household Income of Respondents in 2015 ................................ 53 Figure 26 Transportation Mode Use during a Typical Month among Respondents ..................... 54 Figure 27 Frequency of Private Vehicle Use ................................................................................ 55 Figure 28 Frequency of Walking, Bicycling, Urban Rail, and Bus .............................................. 55 Figure 29 Frequency of Using Shared Ride Services ................................................................... 56 Figure 30 When People Use Multimodal Transportation Apps .................................................... 57 Figure 31 Purpose of Most Recent Trip with A Multimodal Transportation app ........................ 58 Figure 32 Time of Day Most Recent Trip with A Multimodal Transportation App Was Started 59 Figure 33 Day of the Week of Most Recent Trip with A Multimodal Transportation App ......... 60 Figure 34 Frequency of Overall Driving ...................................................................................... 61 Figure 35 Amount of Decrease/Increase in Driving ..................................................................... 61 Figure 36 Mode split for people after using multimodal transportation apps ............................... 62 Figure 37 Use of Multimodal Transportation App(s) That Decrease Mode Frequency ............... 63
5
Figure 38 Use of Multimodal Transportation App(s) That Increase Mode Frequency ................ 63 Figure 39 Change in Wait Time Due to Multimodal Transportation App(s) ............................... 64 Figure 40 Certainty of Travel Mode before Multimodal Transportation App Use ...................... 65 Figure 41 Trip Purposes for Not Using Multimodal Transportation App(s) ................................ 66 Figure 42 Average Spent Per Month on Transportation ............................................................... 67 Figure 43 Use of Pre-Tax Dollars Spent Through Employer ....................................................... 67 Figure 44 Reasons for Not Using Pre-Tax Dollars on Transportation ......................................... 68 Figure 45 Average Pre-Tax Dollars Spent Per Month on Transportation .................................... 69 Figure 46 Average Pre-Tax Dollars Spent Per Month on Parking ............................................... 69 Figure 47 Use of Mobile Payment Apps for Public Transit Services ........................................... 70 Figure 48 Reasons for Not Using Mobile Payment Apps for Public Transit ............................... 71 Figure 49 Effect of Mobile Payment Features for Public Transit on Usage ................................. 72 Figure 50 Impact on People’s Overall Driving Due to Public Transit Mobile Payment App(s) .. 73 Figure 51 Change in Public Transit User Experience Due to Mobile Payment Apps For Public Transit ........................................................................................................................................... 74 Figure 52 Effect of Mobile Payment Features on Public Transit Boarding Times ...................... 74 Figure 53 Top Additional Features People Would Like On Public Transit App .......................... 75
6
Disclaimer Statement The contents of this report reflect the views of the author(s) who is (are) responsible for the facts and the accuracy of the data presented herein. The contents do not necessarily reflect the official views or policies of the STATE OF CALIFORNIA or the FEDERAL HIGHWAY ADMINISTRATION. This report does not constitute a standard, specification, or regulation.
Disclosure Statement The contractor is free to copyright material, including interim reports and final reports, developed under the contract with the provision that the Department and the FHWA reserve a royalty-free, non-exclusive and irrevocable license to reproduce, publish or otherwise use, and to authorize others to use, the work for government purposes.
Acknowledgments The authors extend their appreciation to a number people who made this research possible. Within the UC Berkeley Transportation Sustainability Research Center, the authors thank Rachel Finson and Michael Fratoni. The authors would also like to thank Joseph Kopser and Regina Clewlow of RideScout (now Moovel) for their collaboration on this study. Finally, the authors thank Michael Cassidy, Karen Frick, and Madonna Camel of UC Connect for sponsoring and administering this study. The facts and opinions expressed within this document are the responsibility of the authors.
7
Executive Summary In recent years, technological and social forces have pushed smartphone applications (apps) from the fringe to the mainstream. Understanding the role of transportation apps in urban mobility is important for policy development and transportation planners. This study evaluates the role and impact of multimodal aggregators from a variety of perspectives, including a literature review; a review of the most innovative, disruptive, and highest-rated transportation apps; interviews with experts in the industry, and a user survey of former multimodal aggregator RideScout1 users. Between February and April 2016, researchers conducted interviews with experts to gain a stronger understanding about challenges and benefits of data sharing between private companies and public agencies. Key findings from the expert interviews include the critical need to protect user privacy; the potential to use data sharing to address integrated corridor and congestion management as well as various pricing strategies during peak hours; along with the potential benefits for improving coordination between the public and private sectors. In March 2016, researchers surveyed 130 people who had downloaded the RideScout app to evaluate attitudes and perceptions toward mobile apps, travel behavior, and modal shift. The goal was to enhance understanding of how the multimodal apps were impacting the transportation behavior. The demographic profile of multimodal app users suggests that they are in fact relatively well distributed by age, in that 50% of respondents were ages 40 and over. But the distribution of age and race/ethnicity was less representative of the US population more broadly. Respondents were more educated and on balance more likely to be Caucasian relative to the general population. They also had higher incomes than the general population, with 42% of respondents living households with incomes greater than $100,000. However, the survey did find that respondents used multimodal apps in ways that yielded travel that was less energy intensive and more supportive of public transit. For example, 38% of respondents reported driving less as a result of using multimodal apps. Furthermore, 56% of respondents noted that these apps increase their bus use, and 43% reported an increase in rail use. In all cases, those reporting a decline in public transit use or walking and bicycling were far less in number. Thus, the broader conclusion from the survey found that the apps were enabling some people to travel in ways that would be considered more publicly benevolent. In addition, multimodal transportation apps were reported to reduce wait times, as half of respondents reported reduced wait times as a result of multimodal apps. For an additional subsample of respondents, the capability of mobile payments on these apps was also found to improve their experience with public transit and enable faster boarding times. In general, the survey found that multimodal apps were a benefit to the survey respondents. The results apply to the population of those who downloaded the app and who found utility in using it. Overall, the survey indicated that such apps were beneficial to those who could use them. Looking to the future, smartphone applications and more specifically multimodal aggregators, offer the potential for transportation planners and policymakers to enhance their understanding of
1 In April 2016, RideScout and GlobeSherpa merged to become moovel North America, LLC., a subsidiary of Daimler AG.

8
multimodal travel behavior, share data, enhance collaboration, and identify opportunities for public-private partnerships. These efforts may lead to new insights in travel behavior, while at the same time, providing a platform for information that is useful and influences travel behavior in positive ways.
9
1. Introduction
1.1. Overview The proliferation of innovative mobility options within American cities in recent years has greatly enhanced transportation alternatives for the public. Smartphone applications (apps) have recently emerged as tools for aggregating information about transportation options available to travelers within urban regions. These apps may have a number of applications beyond simply giving consumers information about travel. For example, multimodal aggregators may collect information on modal selection, time of travel, transfer points, and journey lengths (time and distance). While multimodal apps may not offer a complete picture, since users may use more than one smartphone app for their mobility needs, smartphone apps do offer a window into multimodal travel behavior that has historically been difficult to measure and understand by transportation planners. To support our understanding of this emerging application, this study completed a thorough literature review covering smartphone apps, travel behavior, and effects of apps on transportation. In conjunction with the literature review, the team prepared a matrix of leading and emerging smartphone apps to provide an understanding of the range and potential of these tools to support transportation demand management and planning. A series of interviews were conducted with experts from government transportation authorities and private transportation companies to gain insights into the data protocols and the concept of sharing data between the private and public sectors. Finally, the users of a multimodal app were surveyed to gain an understanding of how multimodal apps (in general) are used and how multimodal trip aggregators (broadly speaking) can impact travel behavior. The results, summarized in this report, advances understanding of multimodal travel facilitated through smartphone apps.
1.2. Problem and Objectives The U.S. passenger transportation landscape has begun a structural shift due to the introduction of shared mobility systems, particularly in urban areas. Although the beginnings of this shift are limited, Millennials (defined loosely as born from the early 1980s to around 2000) are increasingly using smartphone applications and other information technology (IT) to expand their mobility options. Nearly 70 percent of Millennials use multiple modes several times each week (APTA, 2013). Multimodal travelers (characterized by automobile use and at least one other travel mode during the week) increased their usage of alternatives to the private auto between 2001 and 2009 (Buehler and Hamre, 2013). This shift toward multimodal transportation represents an opportunity to promote more sustainable and accessible/equitable mobility options (Shaheen and Christensen, 2014). Smartphone apps are changing how people view mobility and travel. Shared mobility apps are facilitating a transformative trend: Transportation as a Service (TaaS), incorporating shared modes, such as carsharing (short-term access to a vehicle fleet); bikesharing (shared access to a bike fleet); shared ride services (e.g., Uber, Lyft, Carma Carpool), as well as public transportation and taxis with e-hail capabilities. Multimodal trip aggregators, are mobile apps that provide users with information on surface transportation options from any one location to anywhere else within a metropolitan region. These apps provide this information by aggregating information (e.g., public transit, carsharing, bikesharing, walking, bicycling, and available shared
10
rides services (shuttles, for-hire vehicle services, carpooling etc.). Examples of such apps include Swiftly, which aggregates information for public transit and other modes, such as Lyft and Uber, and helps users navigate travel across multiple agencies and jurisdictions. While these apps improve the availability of static and real-time information, they also have the potential to offer a number of broader benefits. For the user, the primary multimodal trip aggregators offer greater convenience by making multimodal information easier and more convenient to access, ultimately simplifying the user experience. Trip aggregators provide instant access to information about the modes, timetables, costs, and transfer points within a given service area. Trip aggregators also raise awareness of non-motorized travel, which can lead to emission reductions, energy savings, and congestion mitigation.
11
2. Background 2.1. The Emergence of Mobility Apps and Their Impact on Multimodal Travel
Multimodal travel involves the use of more than one travel mode for passenger or goods movement. Transportation experts have often touted the various benefits of passenger multimodalism as a way to curtail travel by the private automobile and to promote more sustainable transportation. Addressing the first- and last-mile gap has been a major challenge in passenger transportation. The first and last mile refers to travelers accessing or egressing public transit mainlines (e.g., subway/metro or commuter rail stations) using “feeder” modes (e.g., private auto, bus, bicycling, walking). Other modes can effectively serve as first-and-last mile connections, particularly in areas with lower levels of public transit service (e.g., rural and suburban communities). With the advancement of technology, multimodal trip chaining and innovative travel modes are becoming more common. With the widespread usage of smartphones and mobile devices, travelers are able to access more information about the transportation modes available to them. Public agencies and third-party companies have been developing apps to lower information barriers and encourage more multimodal travel. This chapter includes four sections. First, we review the literature surrounding multimodal travel, focusing on the most recent studies and the impact of the burgeoning mobile app industry. Next, we discuss mobile apps catering to multimodal travel. Third, we explore potential behavioral impacts due to multimodal travel apps. Finally, we conclude with policy opportunities, challenges, and recommendations for future research. 2.2. Multimodal Travel The literature surrounding multimodal travel can be categorized into socioeconomic and travel behavior research, as well as trip modeling analyses, which are collectively described in the following sections.
2.2.1 Socioeconomic and Behavioral Research Research into multimodal passenger travel and behavior has focused mainly in Western Europe, with fewer and more localized studies being conducted in North America (Buehler and Hamre, 2015). Recent research in Western Europe has documented a stagnation of overall travel and a trend among younger adults employing multimodalism, i.e., a combination of driving, public transit, and active transportation (bicycling and walking). The existing body of literature points to key socioeconomic factors that contribute to increased multimodal travel behavior. These include younger age, living in households without children, and living in urban areas with access to public transportation. Kuhnimhof et al. (2012) found that men aged 18 to 29 reduced driving due to increased multimodalism and decreased personal automobile ownership. Nobis (2007) similarly found a correlation between age and multimodalism, with younger adults and older adults exhibiting increased multimodal travel in

12
Germany. Adults with children (typically middle-aged) were more likely to travel by private auto (Kuhnimhof et al., 2006). Moreover, it was noted that multimodalism remains an urban phenomenon, since alternative modes are most available in cities (Nobis, 2007). Not surprisingly, access to high-quality public transportation has increased multimodalism (Kuhnimhof et al., 2006). Associations of multimodalism and gender were inconclusive. Recent research on multimodal travel in the U.S. reveals similar findings. Buehler and Hamre (2015) analyzed the 2001 and 2009 National Household Travel Surveys (NHTS) and found that the majority of Americans are “multimodal car users,” i.e., those who drive but make at least one trip weekly by public transit, bicycling, or walking. Only 28% are mono-modal, reliant on private auto during the week. Buehler and Hamre assert that the majority of American travel behavior lies on a “spectrum” between car-only and walk-/bike-/public transit-only, and public policy could focus on moving travelers along the spectrum toward increased multimodalism. Encouraging increased multimodalism has been a focus of researchers as well. Diana and Mokhtarian (2009) compared datasets from the San Francisco Bay Area and metropolitan areas in France and identified car users who were willing to increase public transit use. Those already engaged in and familiar with alternative modes, though infrequent, were more willing to increase multimodal behavior over time. Trip purpose is an important aspect of multimodal behavior. Kuhnimhof et al. (2006) found that for multimodal travelers in Germany, they employ public transit for specific purposes, such as commuting, but travel by car for all purposes. Multimodal travelers will often choose public transit when it is clearly the better option compared to the private car.
2.2.2 Multimodal Modeling Researchers have been developing models to make trip planning and travel more efficient. Nuzzolo et al. (2014) developed an Advanced Traveler Advisory Tool (ATAT) used to advise and guide users on multimodal trips with both path and modal choices. The ATAT concept was developed into a mobile app tested in Rome, Italy. Researchers concluded that the experiment warranted further path choice modeling. Traveler information systems, such as ATAT, have been the topic of research since prior to the advent of smartphones and mobile apps. Chorus et al. (2007) researched the literature of the time and predicted the development of a next generation of Advanced Traveler Information Services resulting in mobile, multimodal, dynamic, and personal travel information services. Mobile apps of today appear to have fulfilled that prediction. While there are private-sector companies that have developed mobile apps for trip planning (discussed later in this chapter), the technology is relatively new and evolving very rapidly. Thus, formal studies are limited on the effects of these apps on travel behavior.
2.3. Smartphone Apps As smartphones have become more prevalent (according to the Pew Research Center, nearly two-thirds of Americans own a smartphone (Smith, 2015)), smartphone applications (commonly referred to as “apps”) have become part of everyday life. Apps are computer programs designed
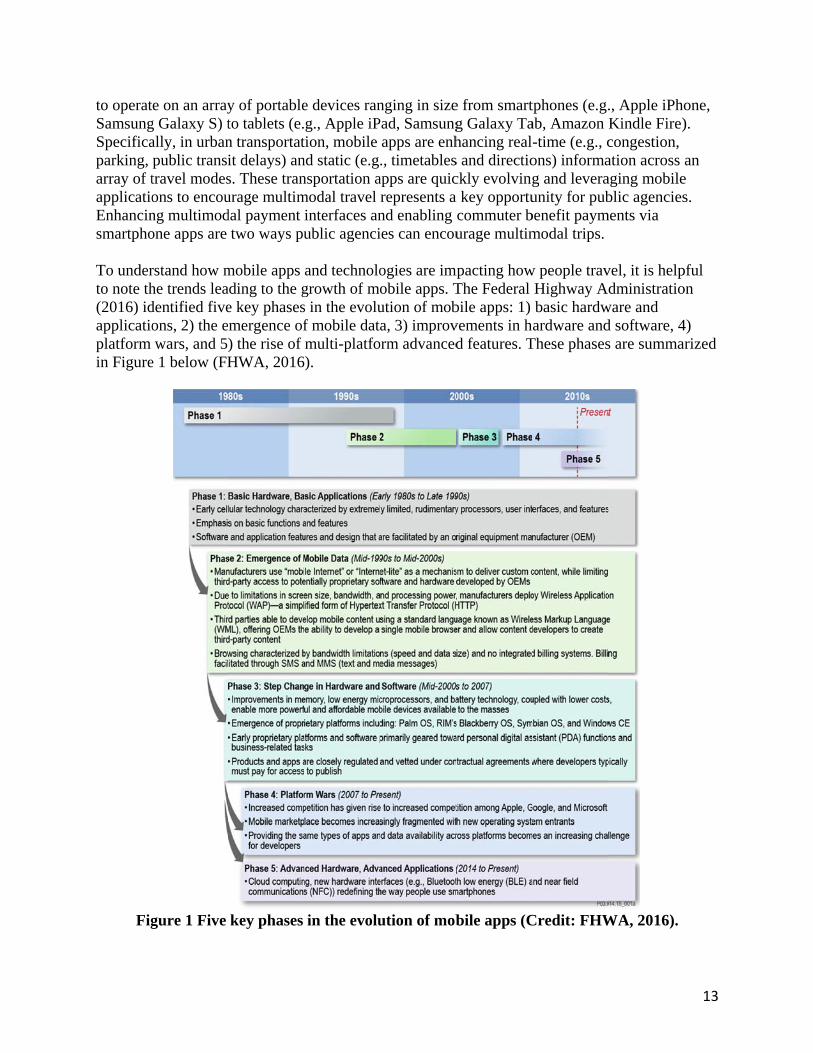
to operatSamsungSpecificaparking, array of tapplicatioEnhancinsmartpho To underto note th(2016) idapplicatioplatform in Figure
Fig
e on an arrayg Galaxy S) tally, in urbanpublic transitravel modesons to encoung multimodone apps are
rstand how mhe trends leadentified fiveons, 2) the ewars, and 5
e 1 below (FH
gure 1 Five
y of portableto tablets (e.n transportatit delays) ans. These tranurage multimdal payment
two ways pu
mobile apps ading to the ge key phasesmergence of) the rise of HWA, 2016
key phases
e devices rang., Apple iP
tion, mobile nd static (e.gnsportation amodal travel interfaces anublic agenci
and technologrowth of mos in the evoluf mobile datamulti-platfo).
in the evolu
nging in sizePad, Samsung
apps are enh., timetables
apps are quicrepresents a nd enabling ies can encou
ogies are impobile apps. Tution of moba, 3) improv
orm advanced
ution of mob
e from smartg Galaxy Tahancing reals and directiockly evolvinga key opportucommuter burage multim
mpacting howThe Federal bile apps: 1) vements in hd features. T
bile apps (C
tphones (e.g.ab, Amazon -time (e.g., cons) informag and leveraunity for pub
benefit paymmodal trips.
w people travHighway Abasic hardwardware and
These phases
Credit: FHW
., Apple iPhoKindle Fire)congestion, ation across aging mobileblic agencies
ments via
vel, it is helpdministratio
ware and d software, 4s are summar
WA, 2016).
13
one, ).
an e s.
pful on
4) rized
14
Most recently, in Phase 5, cloud computing and new hardware interfaces are changing the way people interact with smartphones. In addition to new features, such as Bluetooth Low Energy (BLE) and near field communications (NFC), other trends are changing how users interact with apps include:
1. Wider use of data sources: Transportation apps are increasingly drawing upon numerous data feeds, traffic sensors, device GPS data, self-reported roadway incidents—to offer more accurate predictions of travel and arrival times to the user.
2. Greater use of data sharing among apps and services: Apps are increasingly pulling data from multiple sources and third-party apps to offer summary overviews of important information.
3. Functional disaggregation: Apps are becoming less multi-functional and are focusing on fewer key functions.
4. Bundled apps as services: New aggregator services—either new apps or native functions of operating systems—are assembling data and functions from multiple apps, without the user having to rely on individual dedicated apps for a diverse set of functions.
These trends are leading to more seamless, targeted, tailored, and real-time services for the app user. In the near future, searching on-demand mobility options may involve a single app calling several different apps for different functions (such as mapping, scheduling, ride providers, social media, and more) so that users are not burdened by manually switching between multiple apps. 2.4. Mobility Apps Impacting Transportation There are four types of apps impacting transportation (FHWA, 2016). When categorized by their primary function, they consist of the following types: 1) mobility apps; 2) vehicle connectivity apps; 3) smart parking apps; and 4) courier network services (CNS) apps. This report focuses on mobility apps, which includes a special type of app called “mobility aggregators.” Mobility aggregators are apps that take information from many different mobility providers and help users decide which options are available, what they cost, and how long they will take to complete a trip. In general, mobility apps assist users in planning, understanding, and enhancing a user’s transportation choices and modal selection. FHWA (2016) categorizes mobility apps into eight sub-categories, described in Table 1 below.
Table 1 Sub-Categories of Mobility Apps (FHWA, 2016)
Sub-Category Description Business-to-Consumer (B2C) Sharing Apps
Apps that sell the use of shared transportation vehicles from a business to an individual consumer, including one-way and roundtrip trip carsharing (e.g., Zipcar).
Mobility Trackers Apps that track the speed, heading, and elapsed travel time of a traveler. These apps often include both wayfinding and fitness functions that are colored by metrics, such as caloric consumption while walking (e.g., GPS Tracker Pro).
Peer-to-Peer (P2P) Sharing Apps
Apps that enable private owners of transportation vehicles to share them peer-to-peer with others, generally for a fee (e.g., Spinlister).
Public Transit Apps Apps that enable the user to search public transit routes, schedules, near-term arrival
15
predictions, and connections. These apps may also include a ticketing feature, thereby providing the traveler with easier booking and payment for public transit services (e.g., Washington, DC’s Metrorail and Metrobus).
Real-Time Information Apps
Apps that display real-time travel information across multiple modes including current traffic data, public transit wait times, and bikesharing and parking availability (e.g., Snarl).
Ridesourcing/TNC Apps
Apps that provide a platform for sourcing rides. This category is expansive in its definition so as to include “ridesplitting” services in which fares and rides are split among multiple strangers who are traveling in the same direction (e.g., UberPOOL and Lyft Line).
Taxi e-Hail Apps Apps that supplement street-hails by allowing location-aware, on-demand hailing of regulated city taxicabs (e.g., Flywheel).
Trip Aggregator Apps Apps that route users by considering multiple modes of transportation and providing the user with travel times, connection information, and distance and trip cost (e.g., Transit App).
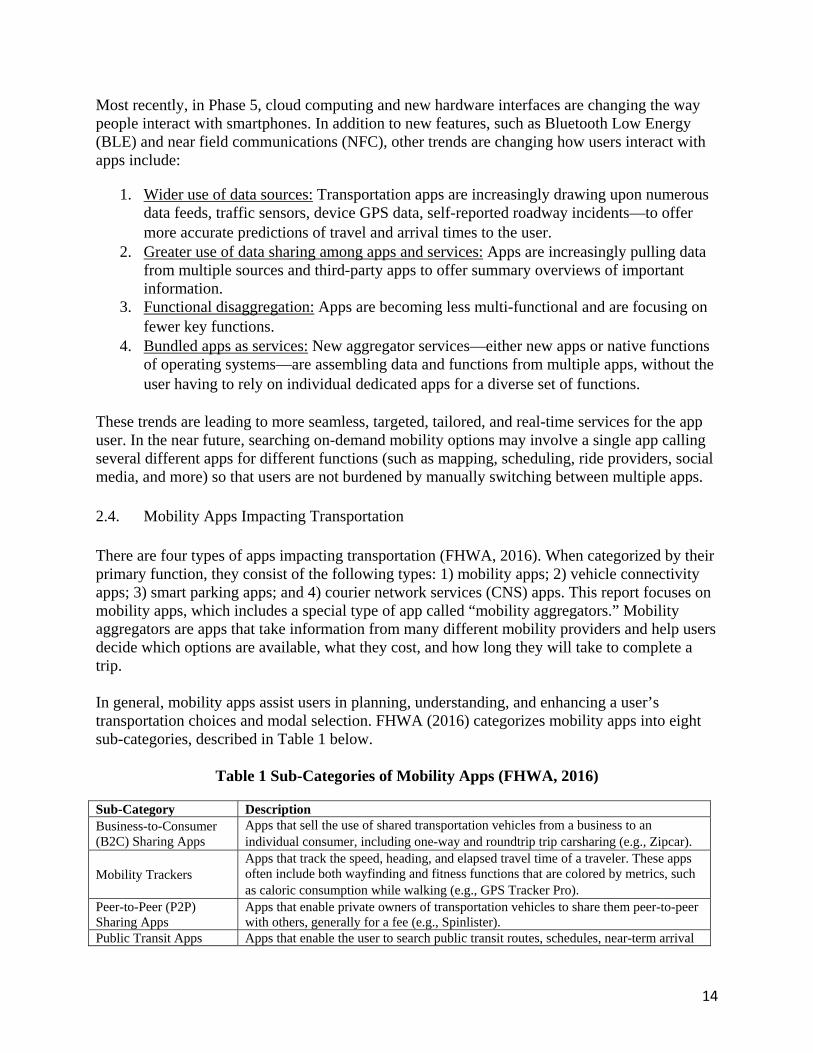
The Transportation Sustainability Research Center at the University of California, Berkeley conducted a mobility apps review of apps available in the U.S. mainstream marketplace. The app review excluded applications specific to the Asian and European markets and apps unavailable in English. The review identified 83 transportation-related mobile apps from four marketplaces with more than 10,000 total downloads (FHWA, 2016). Of the eight sub-categories, trip aggregator apps aim to aggregate travel modes and serve as a portal for multimodal information dissemination. Trip aggregators provide users multimodal trip planning functionality, timetables, and real-time arrival/departure information. Examples of trip aggregators include Transit App, Moovit, the former RideScout app (discussed in more detail below), and Swiftly. 2.5. Case Studies of Select Multimodal Mobility Apps
There are a number of multimodal apps currently on the market. Some have become more popular among consumers in global cities. This report reviews the following apps: Citymapper, TripGo, Metropia, and Google Now as well as the former RideScout aggregator. Citymapper is a multimodal trip planning app available for the desktop, Android, and iPhone. It consolidates real-time information for driving, public transit, carsharing, bikesharing, bicycling, and walking in over 30 cities worldwide. The app allows the user to set arrival and departure times and also gives suggestions based on travel time, cost, mode choices, and calories burned.
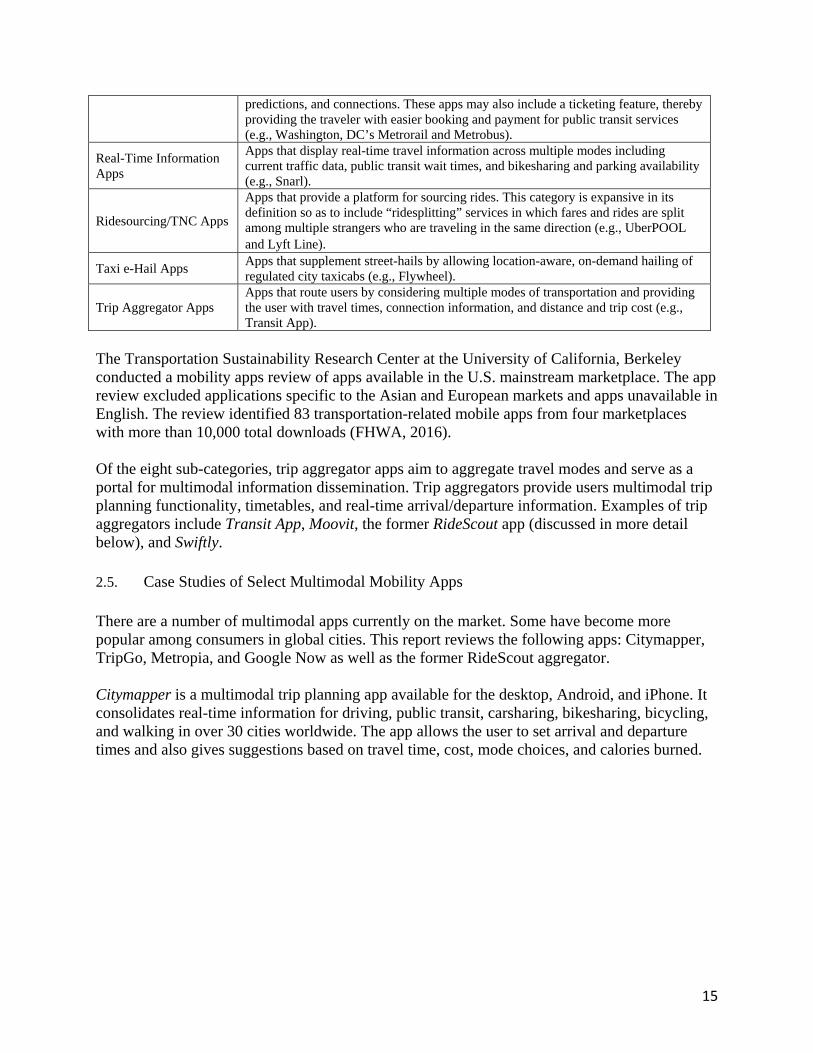
TripGo iallows usand convincludingintegrateallows usmake sur
Figure
s another musers to set thvenience. Usg: arrival tims driving, pusers to createre the user ar
e 2 Screensh
ultimodal triheir relative ping utility th
me, trip duratublic transit, e agendas forrives on tim
hots of City
ip planning apriorities amheory and ustion, approxiridesharing,
or various dame. Figure 3 p
mapper app
app, availablmong saving m
er input, theimate cost, a, carsharing,
ays of the weprovides sam
p (Build Me
le for Andromoney, savi
e app provideand carbon d, and bikeshaeek and creatmple screens
e a Site, 201
oid and iPhoning time, thees route sugg
dioxide emisaring. Moreotes routes anshots of the T
4).
ne. The app e environmengestions sions. TripGover, the appnd schedulesTripGo app.
16
nt,
Go p s to
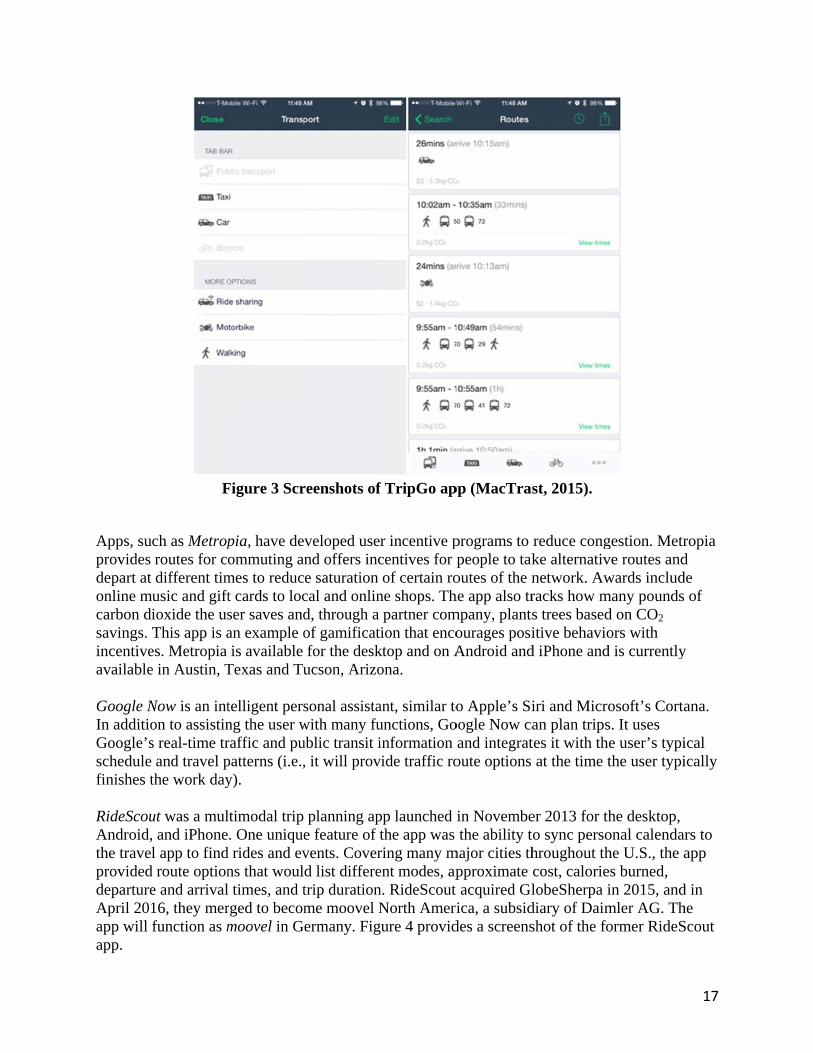
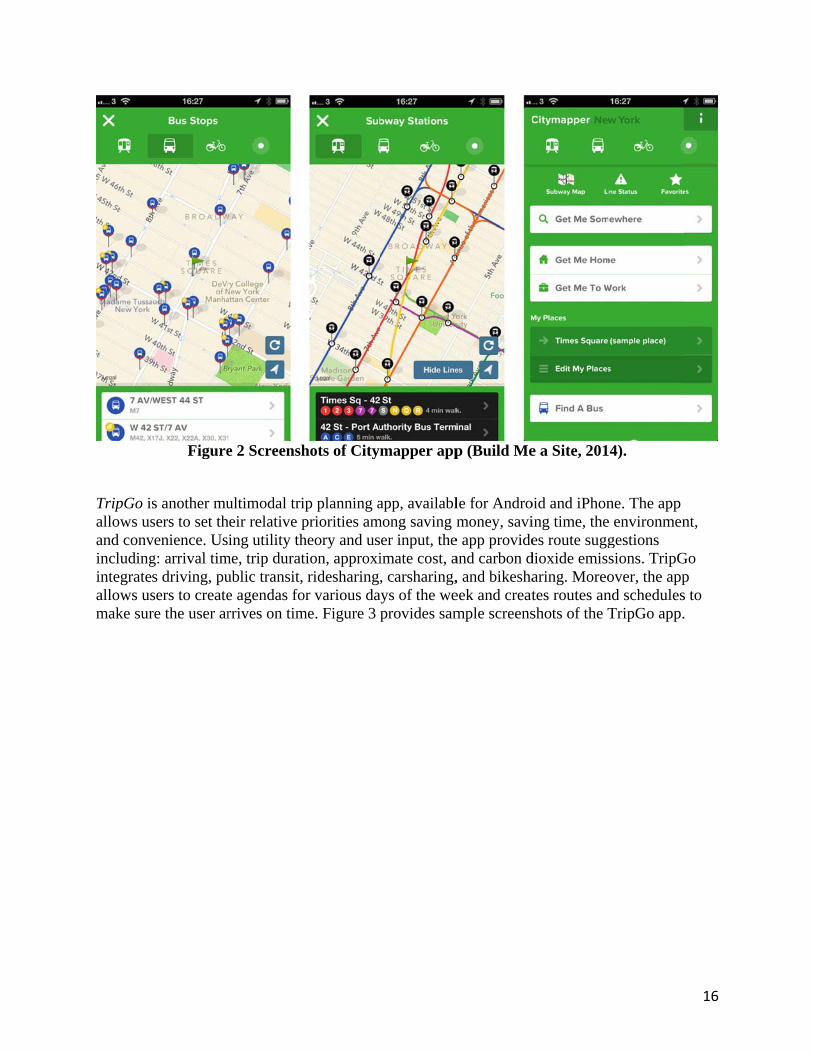
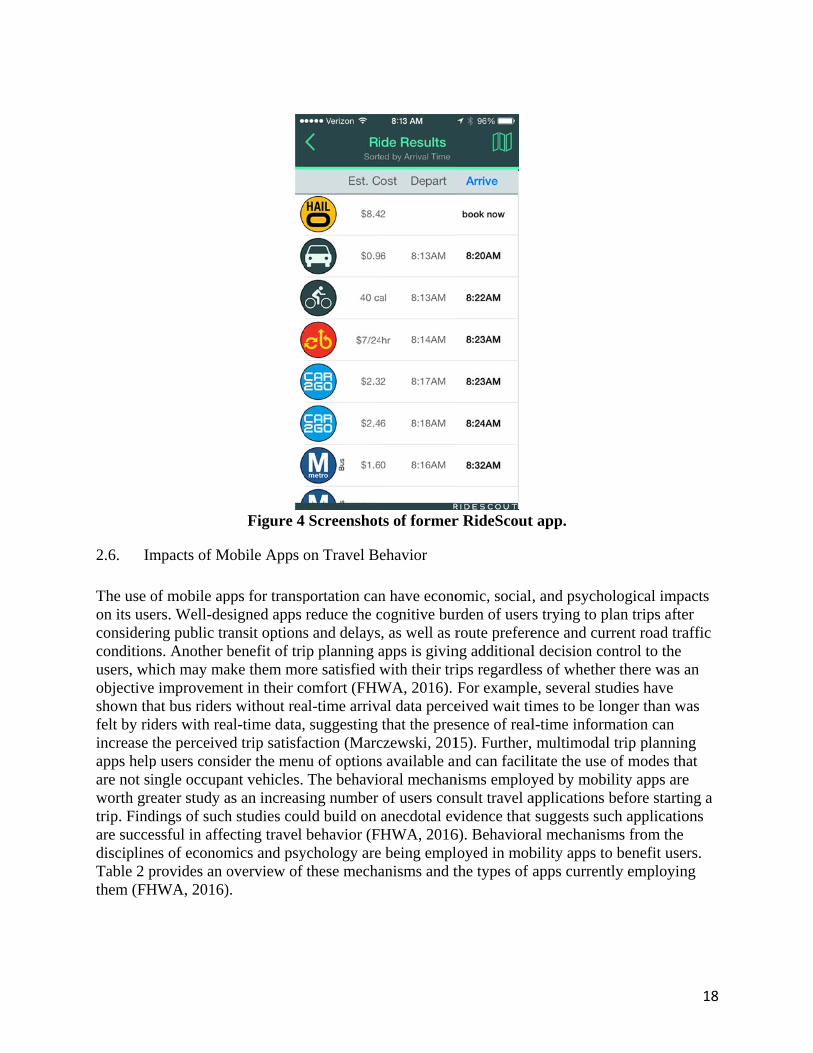
Apps, suprovides depart at online mcarbon disavings. incentiveavailable Google NIn additioGoogle’sschedule finishes t RideScouAndroid,the travelprovideddepartureApril 201app will app.
F
ch as Metroproutes for codifferent timusic and giftioxide the usThis app is a
es. Metropia e in Austin, T
Now is an inton to assistins real-time trand travel p
the work day
ut was a mul, and iPhonel app to find
d route optione and arrival16, they merfunction as m
Figure 3 Scr
pia, have deommuting an
mes to reduct cards to locser saves andan example ois available
Texas and Tu
telligent persng the user wraffic and pupatterns (i.e.,y).
ltimodal trip . One unique
d rides and evns that woull times, and trged to becommoovel in G
reenshots of
veloped usend offers ince saturation cal and onlind, through a of gamificatfor the desk
ucson, Arizo
sonal assistawith many fuublic transit i, it will prov
planning ape feature of tvents. Coverd list differetrip durationme moovel Nermany. Fig
f TripGo ap
r incentive pcentives for pof certain ro
ne shops. Thpartner comion that enco
ktop and on Aona.
ant, similar tounctions, Goinformation
vide traffic ro
pp launched the app was ring many ment modes, apn. RideScout North Ameri
gure 4 provid
pp (MacTras
programs to people to takoutes of the nhe app also trmpany, plantsourages posiAndroid and
o Apple’s Sioogle Now caand integrat
oute options
in Novembethe ability t
major cities thpproximate acquired Glica, a subsid
des a screens
st, 2015).
reduce congke alternativnetwork. Awracks how ms trees baseditive behavio
d iPhone and
iri and Microan plan tripstes it with that the time t
er 2013 for thto sync persohroughout thcost, calorielobeSherpa i
diary of Daimshot of the fo
gestion. Metrve routes andwards includ
many poundsd on CO2 ors with
d is currently
osoft’s Cortas. It uses e user’s typithe user typi
he desktop, onal calendahe U.S., the aes burned, in 2015, andmler AG. Thormer RideS
17
ropia d de of
y
ana.
ical ically
ars to app
d in he Scout
2.6. Im
The use oon its useconsidericonditionusers, whobjectiveshown thfelt by ridincrease apps helpare not siworth gretrip. Findare succedisciplineTable 2 pthem (FH
mpacts of M
of mobile apers. Well-desing public trns. Another bhich may mae improvemehat bus ridersders with reathe perceivep users consiingle occupaeater study adings of suchessful in affees of economprovides an oHWA, 2016)
Figure 4
Mobile Apps o
pps for transpsigned apps ansit optionsbenefit of triake them moent in their cs without reaal-time data,ed trip satisfaider the menant vehicles. as an increash studies couecting travel mics and psyoverview of ).
Screenshot
on Travel Be
portation canreduce the cs and delaysip planning a
ore satisfied womfort (FHWal-time arriv, suggesting action (Marcnu of options
The behaviosing number uld build on behavior (F
ychology arethese mecha
ts of former
ehavior
n have econocognitive bur, as well as rapps is givinwith their triWA, 2016). al data percethat the pres
czewski, 201s available anoral mechanof users conanecdotal evHWA, 2016
e being emplanisms and t
r RideScout
omic, socialrden of userroute prefere
ng additionalips regardlesFor exampleeived wait tisence of real15). Further, nd can facili
nisms employnsult travel avidence that 6). Behavioraloyed in mobthe types of
t app.
, and psychos trying to pence and curl decision coss of whethee, several stuimes to be lol-time inform multimodalitate the use yed by mobiapplications suggests suc
al mechanismbility apps toapps current
ological implan trips afterrent road traontrol to the er there was udies have onger than wmation can l trip planninof modes th
ility apps arebefore startich applicatioms from the o benefit usetly employin
18
acts er affic
an
was
ng hat e ing a ons
ers. ng
19
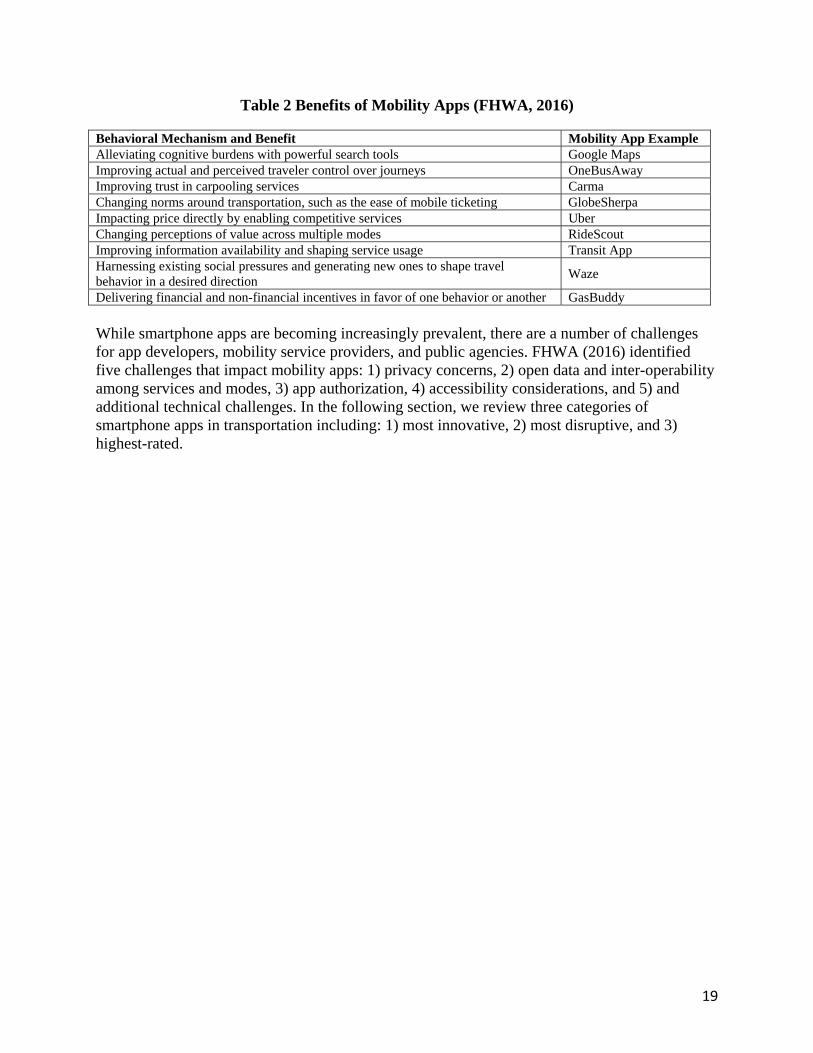
Table 2 Benefits of Mobility Apps (FHWA, 2016)
Behavioral Mechanism and Benefit Mobility App Example Alleviating cognitive burdens with powerful search tools Google Maps Improving actual and perceived traveler control over journeys OneBusAway Improving trust in carpooling services Carma Changing norms around transportation, such as the ease of mobile ticketing GlobeSherpa Impacting price directly by enabling competitive services Uber Changing perceptions of value across multiple modes RideScout Improving information availability and shaping service usage Transit App Harnessing existing social pressures and generating new ones to shape travel behavior in a desired direction
Waze
Delivering financial and non-financial incentives in favor of one behavior or another GasBuddy While smartphone apps are becoming increasingly prevalent, there are a number of challenges for app developers, mobility service providers, and public agencies. FHWA (2016) identified five challenges that impact mobility apps: 1) privacy concerns, 2) open data and inter-operability among services and modes, 3) app authorization, 4) accessibility considerations, and 5) and additional technical challenges. In the following section, we review three categories of smartphone apps in transportation including: 1) most innovative, 2) most disruptive, and 3) highest-rated.
20
3. Review of Smartphone Apps
3.1. App Shortlist Methodology To further understanding of the types of transportation apps available, we conducted a smartphone application market analysis between October 2015 and March 2016 (TSRC, unpublished data, 2015-16). A total of 80 unique transportation apps were identified on the Apple App Store (iOS), the Google Play Store (Android), and the Microsoft Store (Windows 10 Mobile). An app had to be available on at least two of the three marketplaces to be considered in this analysis. As part of this review, we sought to catalog three different types of smartphone applications:
● Most Innovative - apps that have either the most unique features, address a unique transportation challenge, or both;
● Most Disruptive - apps that have transformed or are most likely to disrupt incumbent transportation modes, services, or behaviors. These apps are disruptive in the sense that they modify modal selection (the services people choose to take), such as shifting from driving a private vehicle to using carsharing and/or ridesourcing (Lyft/Uber) services; and
● Highest-rated - apps featuring the highest average star ratings across all three marketplaces.
We considered a category documenting the “most downloaded” apps but were unable to do so because several shortcomings of the app marketplace download counts were identified, such as:
1. The app marketplaces do not account for the same app being downloaded on multiple devices by the same person. 2. The app marketplaces do not track, if an app is used after it has been downloaded. Users may download an app, but never use it. 3. Non-specific or unavailable download counts:
i. Apple and Microsoft’s app marketplaces do not release number of downloads data publically.
ii. The Google Play Store displays non-specific download data using data ranges (e.g., 500,000-1,000,000 downloads).
Due to these shortcomings, the number of app downloads could not be analyzed. To overcome this limitation, we created a “shortlisting” criterion, based on a combination of visibility and star ratings. The methodology for cataloging the apps into each of the three categories is outlined below.
21
3.1.1. Cataloging To catalog the array of transportation apps currently available to users, we manually screened three smartphone application marketplaces—Google Play Store for Android, Apple App Store for iOS, and Microsoft Store for Windows 10 Mobile. This was performed by reviewing relevant app categories (e.g., transportation, navigation, etc.) and conducting searches expected to yield relevant apps (e.g., mobility, parking, etc.). Due to the high number of apps, we only considered relevant apps on the first three pages of search inquiries. Also, for a more robust comparison across marketplaces, only apps that were available on at least two of the three marketplaces were considered in the analysis. Differences in search terms and app keywords are the primary limitations of this approach. Additionally, apps that are downloaded more frequently (including repeat downloads by the same user on multiple devices) are likely to appear at the beginning of app searches. Lastly, not of all the 80 apps identified are available on the Windows store yet, as it was a relatively new operating system launched in Q4 of 2015. All three app marketplaces display app ratings ranging from 1 to 5 stars. All three marketplaces also provide data on how many people rated an app. These data were collected from all app stores manually. Both of these data points were combined to develop an aggregated ranking for each as prescribed below:
1. First, a weighted average star rating was identified for each app across all three stores, in proportion of the number of star rating votes for each store.
2. Weighted Average Star Ratings Based Rank: All apps were given a rank based
on this weighted average star rating, such that the app with the highest combined star rating value was given a rank of 1.
3. Number of Votes based Rank: For each app store, all the apps were ranked
based on the number of people who voted for the app. This resulted in a total of 3 ranks for each app namely: 1) “Number of Votes Based Rank for App Store,” 2) “Number of Votes Based Rank for Play Store, and 3) “Number of Votes Based Rank for Windows.” Here, the highest rank was given to the app with the most number of votes among the apps considered from that app store. This was done to account for apps with the same weighted average star ratings based rank but with a different number of votes.
4. Weighted Average Votes Based Rank: This was calculated by weighting the above three Number of Votes Based Ranks in proportion of the market shares of each of their operating systems (i.e., 52.8% for Android, 43.6% for iOS and 2.7% for Windows).
5. Average Rank: Then, an average ranking for each app was computed by averaging the weighted average star ratings based rank and weighted average votes based rank.
6. Final Rank: Apps were re-ranked into whole numbers (to avoid decimals).
22
3.1.2. Process of Elimination
Finally, the five apps with the best final rank, i.e., smallest rank value, in each sub-functionality were kept and the others were eliminated. For example, if there were six apps in a sub-functionality ranked 3, 8, 56, 24, 15 and 35 respectively, the third app with a ranking of 56 was eliminated and the other five were kept. This entire process resulted in a matrix of 80 apps, ranging over the varied functionalities of the transportation app space. (Note: some sub-functionalities had fewer than five apps either because of limited apps in the sub-functionality itself or apps not meeting the criteria for our analysis by being absent from two marketplaces.) This list of 80 apps was the starting point for our categorization of apps into three categories defined by us. It is recognized that the ‘current leading apps’ is a dynamically changing concept. The rankings of the apps done at the time of the analysis will most certainly change as the sector evolves. 3.1.3. Categorizing We organized the cataloged apps according to six core functionalities impacting transportation. Many of the core functionalities included numerous subcategories (FHWA, 2016). These six core functionalities and subcategories include:
1) Mobility Apps assist users in planning or understanding their transportation choices and may enhance access to alternative modes (Jones, 2013).
● Business-to-Consumer (B2C) Sharing Apps sell the use of shared transportation vehicles from a business to an individual consumer, including one-way and roundtrip trip carsharing (e.g., Zipcar). This category also includes bikesharing (e.g., Citi Bike) and microtransit (a privately owned and operated shared transportation system that can have fixed routes and schedules as well as flexible routes and on-demand scheduling. The vehicles generally include vans and buses (e.g., Bridj) (Shaheen et al., 2014).
● Mobility Trackers track the speed, heading, and elapsed travel time of a traveler. These apps may include both wayfinding and fitness functions that are colored by metrics, such as caloric consumption while walking (e.g., GPS Tracker Pro).
● Peer-to-Peer (P2P) Sharing Apps enable private owners of transportation vehicles to share them peer-to-peer with others, generally for a fee (e.g., Spinlister).
● Public Transit Apps enable the user to search public transit routes, schedules, near-term arrival predictions, and connections. These apps may
23
also include a ticketing feature, thereby providing the traveler with easier booking and payment for public transit services (e.g., Washington DC’s Metrorail and Metrobus). Ten apps were shortlisted in this category by first looking at the top ten cities with highest public transit ridership (APTA Factbook 2015, Appendix B). Then, for each of these ten cities, the cataloguing formula were applied to find the current leading public transit app for that city.
● Real-Time Information Apps display real-time travel information across multiple modes including current traffic data, public transit wait times, and bikesharing and parking availability (e.g., Snarl).
● Ridesourcing/TNC Apps provide a platform for sourcing rides. This category is expansive in its definition so as to include “ridesplitting” services in which fares and rides are split among multiple strangers who are traveling in the same direction (e.g., UberPOOL and Lyft Line).
● Taxi e-Hail Apps supplement street-hails by allowing location-aware, on-demand hailing of regulated city taxicabs (e.g., Flywheel).
● Trip Aggregator Apps route users by considering multiple modes of transportation and providing the user with travel times, connection information, and distance and trip cost (e.g., RideScout).
2) Vehicle Connectivity Apps allow remote access to a vehicle through an
integrated electronic system that can be used in times of emergencies (e.g., locked out of a car, asking for help when in an accident, etc.). The connected vehicle apps are either auto manufacturer operated (e.g. General Motor’s OnStar) or independently owned apps (e.g., Directed Smart Start).
3) Smart Parking Apps provide information on parking cost, dynamic space
availability, and payment channels. These apps are often paired with smart parking systems (e.g., SFpark).
● e-Parking Apps provide important information regarding real-time parking cost and availability (e.g., Park Whiz) and accessible payment channels for parking (e.g., Parkmobile).
● e-Valet Apps provide for-hire parking service where drivers use an app to dispatch valet drivers to pick-up, park, and return vehicles. In addition to parking, some of these services also offer fueling, cleaning, and other vehicle services. Valet Parking Apps provide the ease of on-demand valet parking with flexible drop off and return locations (e.g., Luxe).
24
4) Courier Network Services (CNSs) Apps provide for-hire delivery services for monetary compensation using an online application or platform (such as a website or smartphone app) to connect couriers using their personal vehicles, bicycles, or scooters with freight (e.g., packages, food).
● Peer-to-Peer (P2P) Delivery Service Apps enable private drivers to collect a fee for delivering cargo using their private automobiles (e.g., Roadie).
● Paired On-Demand Courier Service Apps allow for-hire ride services to also conduct package deliveries (e.g., UberEATS).
5) Environment and Energy Consumption Apps track environmental
impacts and the energy consumption of travel behavior (e.g., Refill). This category also includes eco-driving/eco-routing apps that encourage environmentally conscious driving by providing real-time feedback on driving behavior as related to energy use, efficient routing information, or both. This category also includes apps that help locate car-charging stations for electric cars (e.g., greenMeter).
6) Insurance Apps generally tie a traveler’s behavior, especially as a driver,
to an individual’s insurance premiums and user experience. These apps enable users to opt for pay-per-mile automobile insurance (e.g., Metromile) and other usage-based pricing and incentives, related to distance, time-of-travel, and safe driving (e.g., Allstate’s usage-based insurance app).
3.1.4. Specific Procedures The final step in our methodology was to apply a specific procedure for each of the three app categories (most innovative, most disruptive, and highest-rated). These specific procedures are outlined below. Most Innovative: From the catalog of 80 apps, five apps were selected as the most innovative, based on the following methodology:
1. First, innovations in mobility that address unique transportation challenges were identified. These include driving apps that encourage lower energy consumption and address congestion through smart driving and ecorouting, insurance-based apps that reward fuel efficient and safe driving through lower insurance premiums, smart parking apps that aid in parking management, vehicle connectivity apps that allow remote access to one’s personal vehicle, and trip aggregator apps that combine multiple modes of transport into one platform to encourage and facilitate multimodality.
25
2. Then, in each of these sub-functionalities, the most unique app was identified. Uniqueness was captured by comparing the features and attributes of all the apps in this sub-category and finding the app that offers the most unique set of functionalities. For instance, looking at the Vehicle Connectivity Apps sub-category, we find that all the apps allow users to remotely lock/unlock, start/stop, and honk/turn on lights of their cars. But, unlike the others in this subcategory, OnStar RemoteLink App allows users to also check their vehicle status in terms of fuel and oil levels and even tire pressure, thus making it the most innovative in this sub-category.
3. Then, of these shortlisted apps, the five most unique apps were selected based on
a combination of steps 1 and 2. Most Disruptive: From the catalogue of 80 apps, five apps were selected as the most disruptive in the following manner:
1. Disruptive trends in mobility that change incumbent transportation modes, services, or behavior were identified. Disruptive trends may also cause a change in modal selection among users. For instance, ridesourcing represents one disruptive trend as it is changing the way people view on-demand mobility and use of for-hire vehicle services. Then, for each disruptive trend, the smartphone app that came first and is still in existence was identified. For this, we looked at the date each app was launched, which corresponds to the app marketplace it was first launched in. Additionally, new versions of the app, name changes, and acquisitions were taken into account.
2. Finally, the top five most disruptive apps were selected as a combination of steps
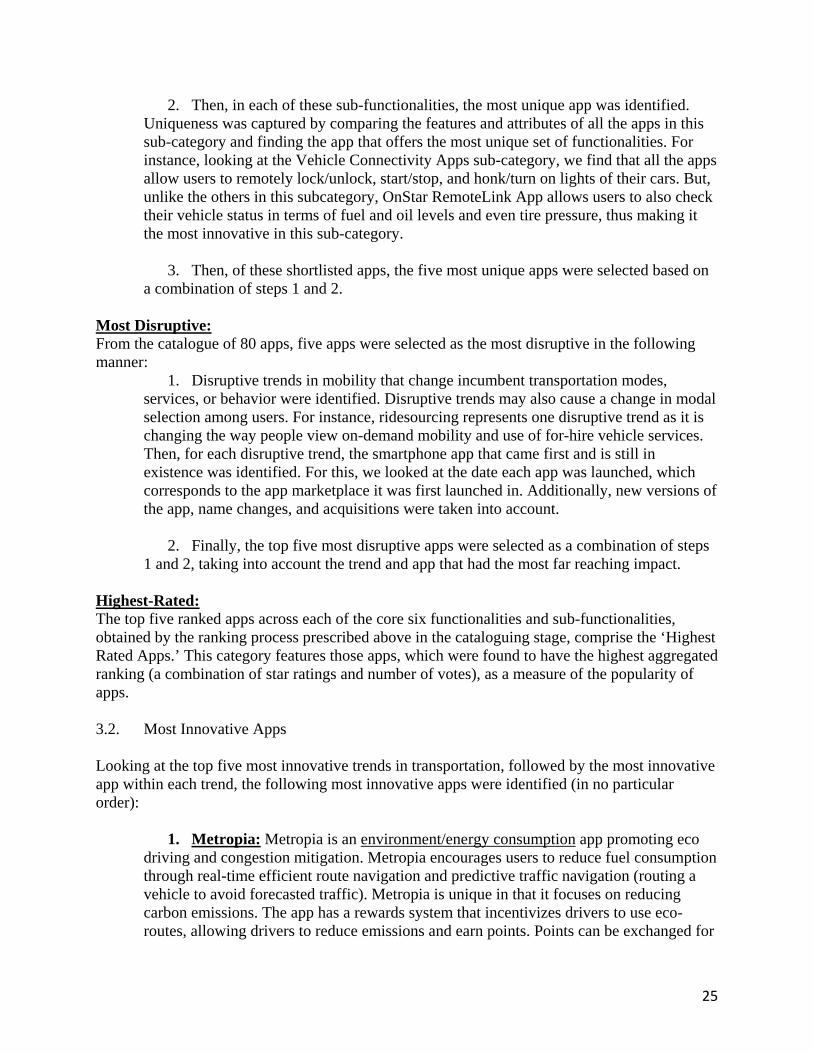
1 and 2, taking into account the trend and app that had the most far reaching impact. Highest-Rated: The top five ranked apps across each of the core six functionalities and sub-functionalities, obtained by the ranking process prescribed above in the cataloguing stage, comprise the ‘Highest Rated Apps.’ This category features those apps, which were found to have the highest aggregated ranking (a combination of star ratings and number of votes), as a measure of the popularity of apps. 3.2. Most Innovative Apps Looking at the top five most innovative trends in transportation, followed by the most innovative app within each trend, the following most innovative apps were identified (in no particular order):
1. Metropia: Metropia is an environment/energy consumption app promoting eco driving and congestion mitigation. Metropia encourages users to reduce fuel consumption through real-time efficient route navigation and predictive traffic navigation (routing a vehicle to avoid forecasted traffic). Metropia is unique in that it focuses on reducing carbon emissions. The app has a rewards system that incentivizes drivers to use eco-routes, allowing drivers to reduce emissions and earn points. Points can be exchanged for
gpAad
ift cards. Melant a tree. M
Although Medvertising re
etropia also hMetropia is a
etropia does nevenue. The
F
has a “Planta free app avnot have anyuser interfac
Figure 5 Scr
-a-Tree” Provailable on Gy premium fce is shown b
eenshot of M
ogram, allowGoogle Play features for pbelow:
Metropia
wing users toand Apple’s
purchase, the
o trade pointss App Store.e app genera
26
s to . ates

reloinfodrApr
2. Driveewards safe ower insurannnovative in or discount crivers to driv
Apple’s App rovide real-t
ewise Mobiledriving. Unl
nce premiumits category
coupons, giftve safer. DriStore. The a
time informa
Figure
e by Allstatlike other ap
ms, Drivewisey. Employingft cards and oivewise Mobapp does notation. Drivew
e 6 Screen S
te: Drivewisepps in this cae also allowsg gamificatioother offers, bile is a free t have any pawise Mobile
Shot of Driv
e Mobile is aategory that rs users to eaon, this app aproviding enapp availabl
aid premiume’s interface
vewise Mob
an insurancereward goodarn points, mallows usersnhanced incle on Google
m features ancan be view
ile
e app that d driving wit
making it the s to trade poientives for e Play and
nd does not wed below:
27
th most
ints
ththavnoisv
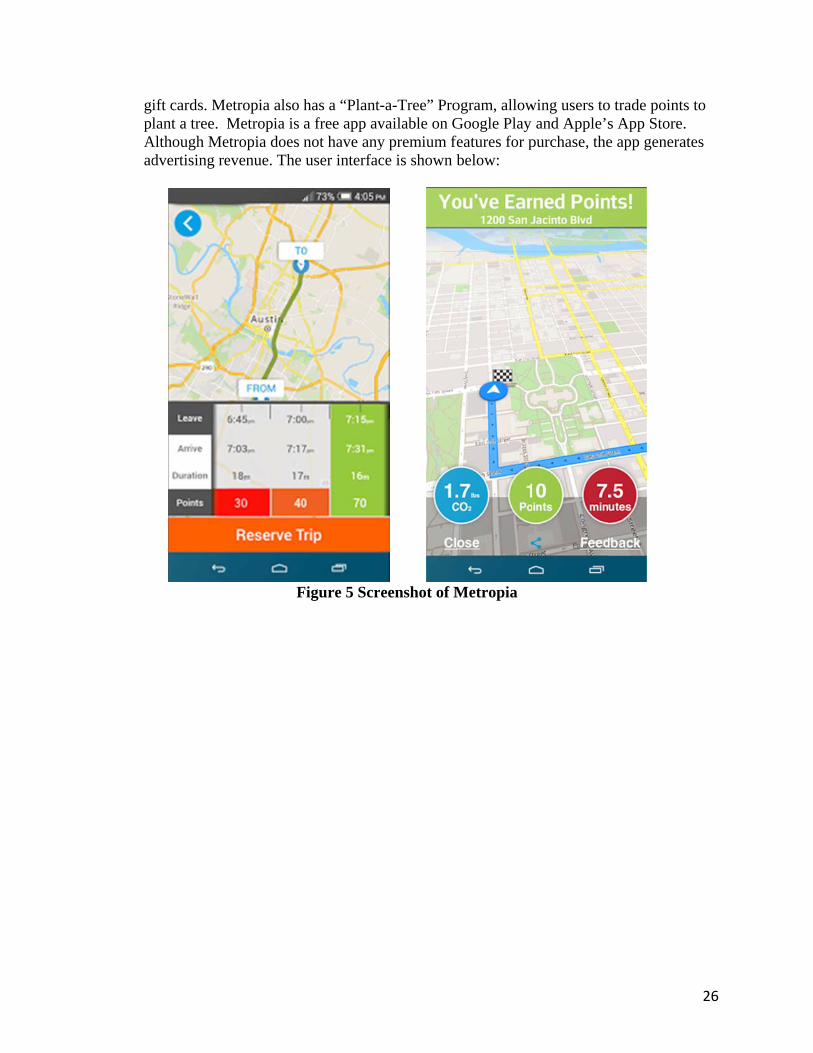
3. Best Phe cheapest ahat allow usevailable spacot have any ffering gift cs available oniewed below
Parking: Beand most coners to pay foces and viewpremium pa
cards to usern Google Pl
w.
Fig
est Parking isnvenient parr parking on
w pricing in aaid features. rs who can fiay and Appl
gure 7 Scree
s a location-rking spacesn the spot, Beadvance fromIt employs g
find inaccurale’s App Sto
enshot of Be
-based smart. Unlike moest Parking am their smargamificationate informatiore. Best Park
est Parking
t parking appst parking mallows usersrtphones. Ben and incentivion on the apking’s interf
p that identifmanagement s to look for est Parking dvization by
pp. Best Parkface can be
28
fies apps
does
king
vDmdgappdb
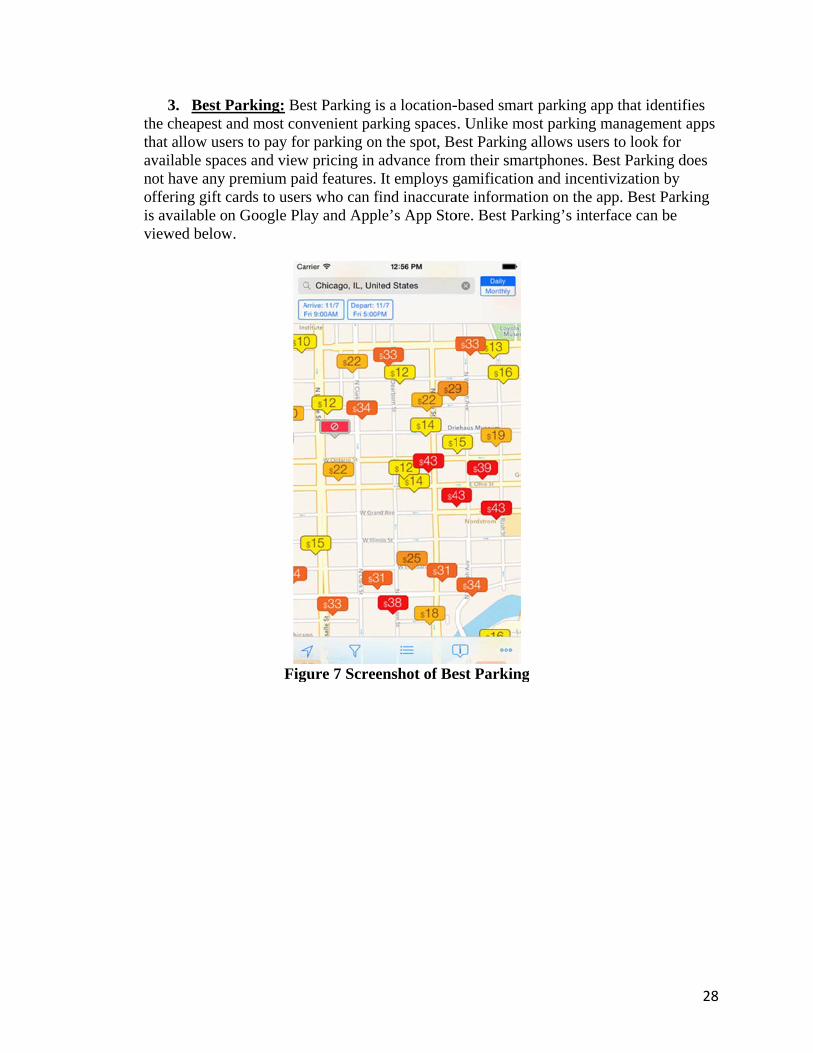
4. DropCalet service
DropCar givemultiple servi
oes his/her warage for thepp in this anaid features.oes not empelow:
Car: DropCfor car owne
e users the flice packageswork, valet ae user to pick
nalysis. Drop. DropCar geloy gamifica
F
Car is an e-Vers. DropCarlexibility to cs (e.g., valet and car storak up later). T
pCar is a freeenerates reveation or ince
Figure 8 Scre
alet smart par provides cachoose wherfor the day,
age for severThese featuree Android anenue throughentivization.
eenshot of D
arking app thar wash and re a valet wi, valet who wral days, andes make it thnd iOS app th fees for serDropCar’s i
Drop Car
hat providesgas refillingll pick up th
waits in the cd car transferhe most innothat does notrvices providinterface can
s on-demandg services. heir car and ocar while ther to a nearbyovative e-Vat offer additided. DropCa
n be viewed
29
d
offers e user
y alet ional ar
OtualbOAsesh
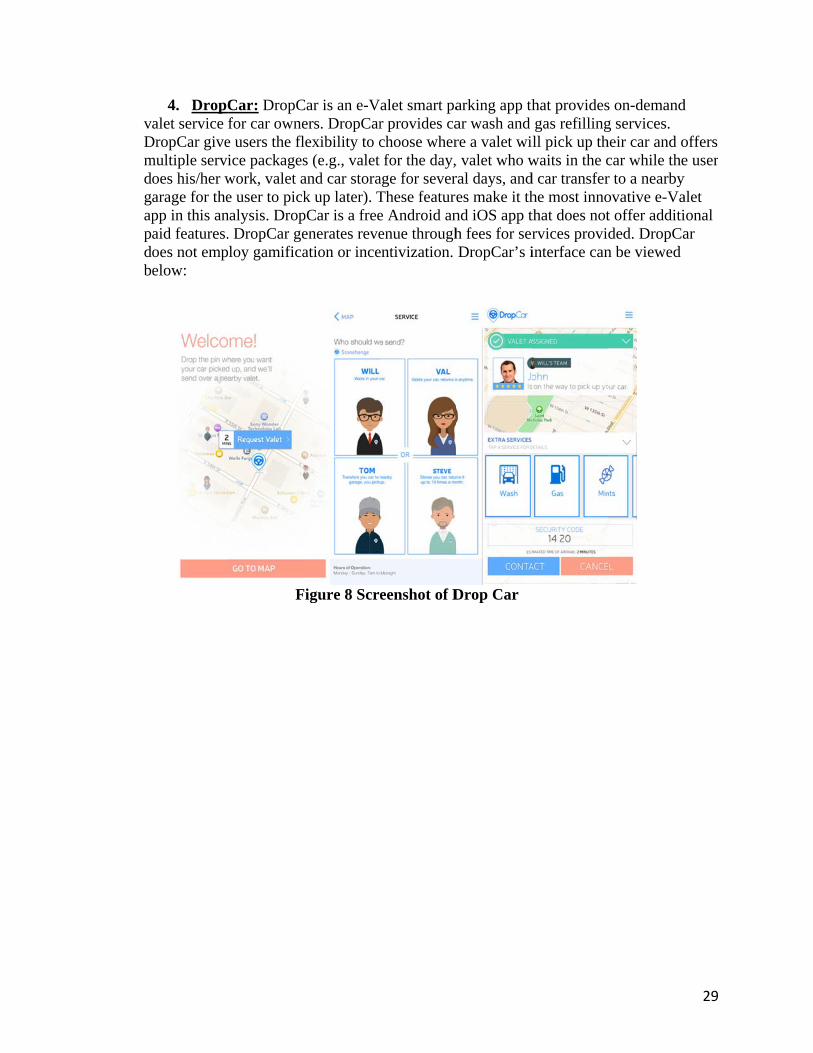
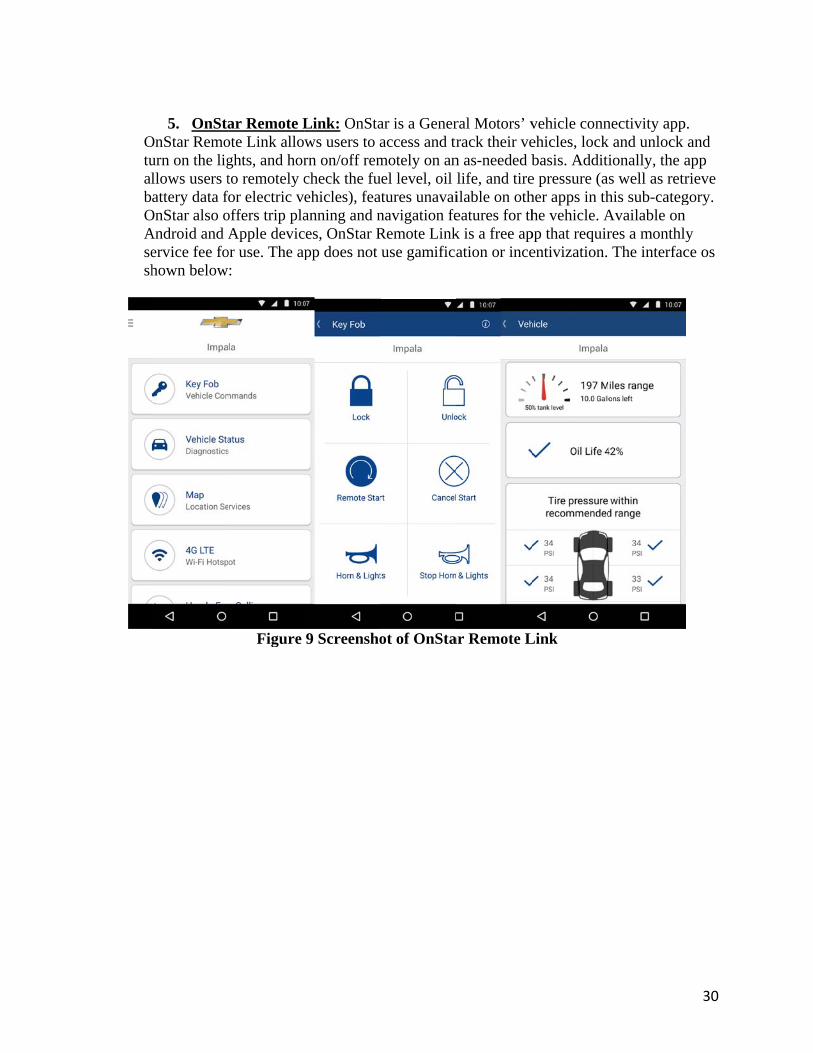
5. OnStaOnStar Remourn on the ligllows users tattery data f
OnStar also oAndroid and Aervice fee fohown below
ar Remote Lote Link alloghts, and horto remotely cfor electric voffers trip plaApple devic
or use. The ap:
Figure
Link: OnStaws users to arn on/off remcheck the fuehicles), feaanning and n
ces, OnStar Rpp does not
9 Screensho
ar is a Generaccess and trmotely on anuel level, oil atures unavainavigation feRemote Linkuse gamifica
ot of OnSta
ral Motors’ vrack their ve
n as-needed blife, and tireilable on otheatures for thk is a free apation or ince
ar Remote L
vehicle connehicles, lockbasis. Additi
e pressure (aher apps in thhe vehicle. A
pp that requirentivization.
Link
nectivity appk and unlock ionally, the as well as retrhis sub-categAvailable onres a monthlThe interfac
30
p. and app rieve gory. n ly ce os

ticapdcainavApr
3.3. M Disruptivservices, mobility were idendisruptiv
6. RideSime informatarsharing, rilanning by destination analories burnencludes new vailable on o
Apple Stores.remium feat
Most Disrupt
ve trends in mor prevalentconsumers. ntified as the
ve impacts on
Scout: the fotion on multdesourcing,
displaying alnd allows used. Recentlyfeatures, su
other trip agg. The app didtures. RideSc
Figure 1
tive Apps
mobility inct behaviors. Of the trend
e most disrupn the transpo
ormer RideStiple transporbiking, and
ll options of ers to choos
y, RideScoutch as mobilegregator appd not employcout’s forme
10 Screensho
lude trends tDisruptive t
ds consideredptive, takingortation netw
cout was a frtation modewalking). Rtransportatioe routes and
t and GlobeSe ticketing fops. RideScouy incentivizaer interface c
ot of the Fo
that impact itrends may ad in this repog into accounwork and use
free trip aggres (e.g., publ
RideScout heon between
d modal optioSherpa mergor public tranut was availaation and gamcan be seen b
rmer RideS
incumbent tralso impact mort, the follont the depth er behavior. T
regator app, lic transit, calps users in ma given origons based oned to form mnsit, which iable on Googamification abelow.
Scout
ransportationmodal selectowing five apand breadth These trends
offering reaarpool, multimodal
gin and n time, cost, moovel. Moois not yet gle Play and
and did not h
n modes, tion among pp sub-categof their
s include:
31
al-
trip
and ovel
d have
gories
32
1. Ridesourcing/Transportation Network Companies (TNCs) – These apps are providing a new for-hire transportation option, changing the incumbent taxi/livery industry causing new advancements in e-Hail dispatch, offering a variety of flexible route and sharing options, such as ridesplitting, and mainstreaming the concept of on-demand mobility.
2. Microtransit – is mainstreaming the concept of private sector public transportation
options, often times employing on-demand dispatch and flexible routing service characteristics.
3. Bikesharing – Bikesharing programs promote active transportation modes through
the short-term rental of publically shared and on-demand bicycle rentals. Bikesharing systems can increase public transit ridership by adding another first-and-last mile connection.
4. Carsharing – Provides short-term vehicle access without the cost and
responsibilities of vehicle ownership. Studies of carsharing show a reduction in vehicle ownership and greenhouse gas emissions. Today, there are at least 4.8 million carsharing members sharing vehicles worldwide.
5. Peer-to-Peer Sharing - is changing predominant ownership models. Under peer-
to-peer service models, owners are able to share their vehicles, bicycles, and other transportation modes with other users for a fee, reducing overall ownership costs for the lessor and ownership needs for the lessee.
Next, we review the shortlisted apps from each of these five trends, using the methodology described. The following five apps were selected as the most disruptive (in no particular order):
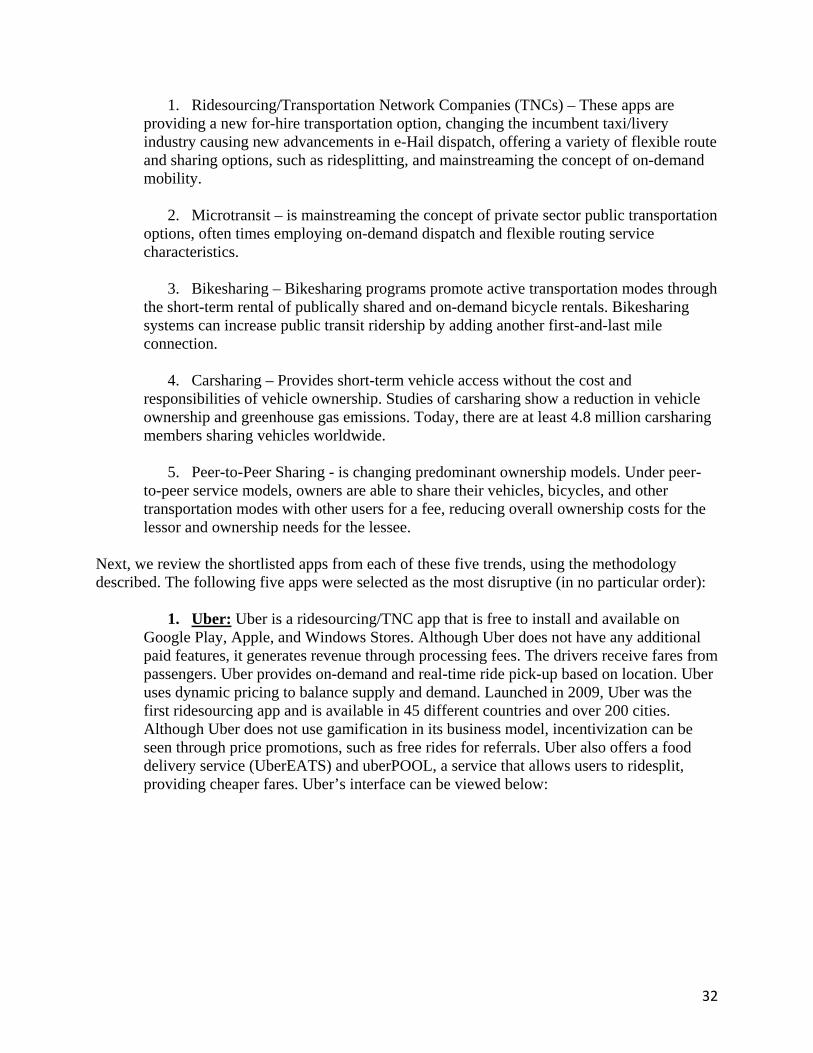
1. Uber: Uber is a ridesourcing/TNC app that is free to install and available on Google Play, Apple, and Windows Stores. Although Uber does not have any additional paid features, it generates revenue through processing fees. The drivers receive fares from passengers. Uber provides on-demand and real-time ride pick-up based on location. Uber uses dynamic pricing to balance supply and demand. Launched in 2009, Uber was the first ridesourcing app and is available in 45 different countries and over 200 cities. Although Uber does not use gamification in its business model, incentivization can be seen through price promotions, such as free rides for referrals. Uber also offers a food delivery service (UberEATS) and uberPOOL, a service that allows users to ridesplit, providing cheaper fares. Uber’s interface can be viewed below:
F
Figure 11 SScreeenshot of Uber
33
riNemprth
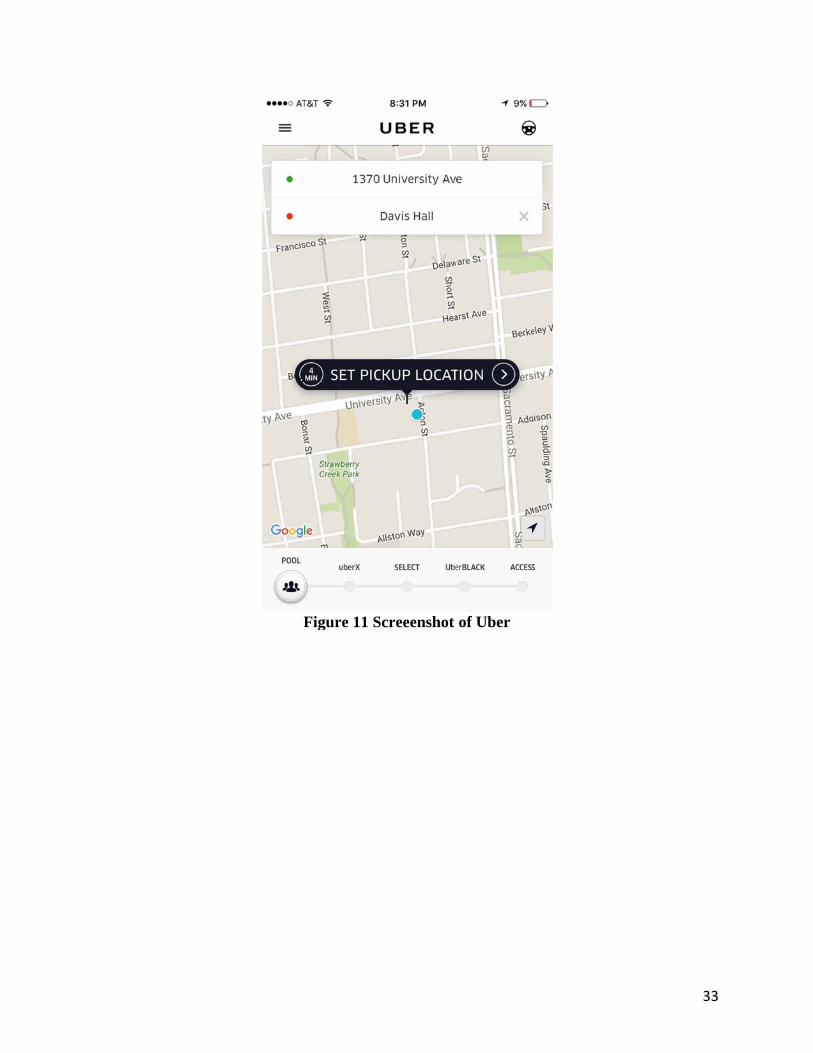
2. Via: Viders real tim
New York Cimploys incerepayment fhe app. The V
Via is a micrme, based onity and Chicantivization t
feature that gVia app app
rotransit app their locatioago. The appthrough two gives a discoears below:
Figure 12
p offering shaon. Via was p is free for dmeans: 1) fr
ount on the ri
Screenshot
ared rides inlaunched in download onree ride/credide fare whe
of Via
n private shu2012, and it
n Android andit for referraen ride credit
uttles, pairingt is availablend iOS. Via al and 2) its t is purchase
34
g e in
ed on
oppreaseavauTTgap
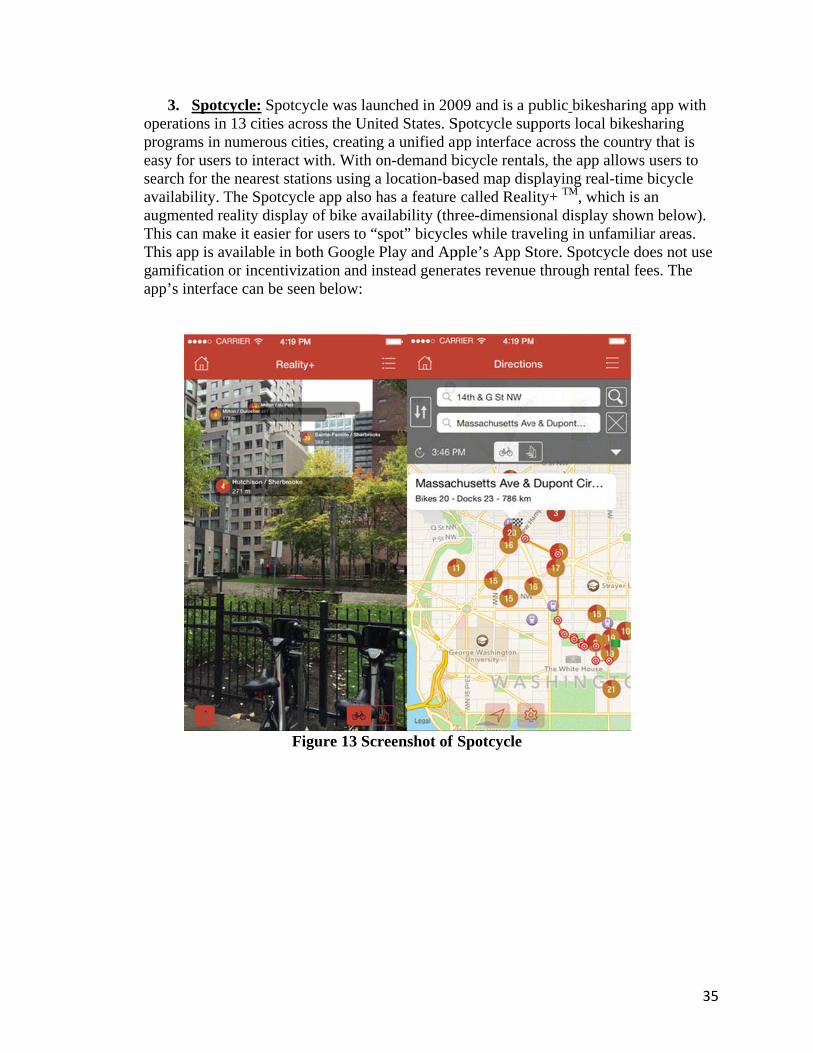
3. Spotcperations in rograms in nasy for usersearch for thevailability. Tugmented re
This can makThis app is av
amification pp’s interfac
cycle: Spotcy13 cities acr
numerous cits to interact we nearest statThe Spotcycleality displayke it easier fovailable in boor incentiviz
ce can be see
Fi
ycle was lauross the Unitties, creatingwith. With otions using ale app also hy of bike avaor users to “soth Google Pzation and inen below:
igure 13 Scr
unched in 200ted States. Sg a unified apon-demand ba location-bahas a feature ailability (thrspot” bicyclePlay and Apnstead gener
reenshot of
09 and is a pSpotcycle suppp interface
bicycle rentaased map dis called Realree-dimensioes while trav
pple’s App Srates revenue
Spotcycle
public bikeshpports local across the c
als, the app asplaying reality+ TM, whional display veling in unfStore. Spotcye through ren
haring app wbikesharing
country that allows users l-time bicyclich is an shown belo
familiar areaycle does notntal fees. Th
35
with
is to
le
ow). as. t use
he
btobyfedvtr
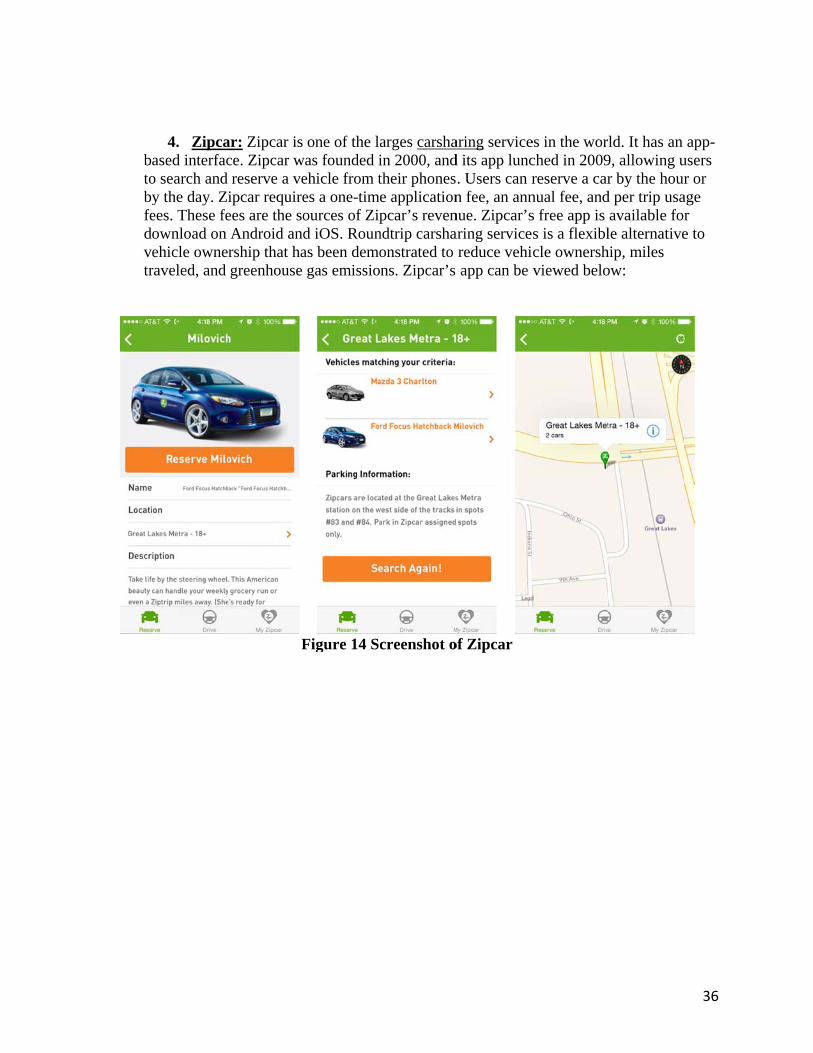
4. Zipcaased interfaco search and y the day. Zees. These feownload on ehicle owneraveled, and
ar: Zipcar is ce. Zipcar wreserve a ve
ipcar requireees are the soAndroid andrship that hagreenhouse
F
one of the lawas founded iehicle from tes a one-timeources of Zipd iOS. Rounas been demogas emissio
Figure 14 Sc
arges carshain 2000, andtheir phonese applicationpcar’s reven
ndtrip carshaonstrated to ns. Zipcar’s
creenshot o
aring serviced its app lunc. Users can rn fee, an annnue. Zipcar’saring servicereduce vehiapp can be
of Zipcar
es in the worched in 2009reserve a carnual fee, ands free app is s is a flexiblcle ownershviewed belo
ld. It has an 9, allowing ur by the hour
d per trip usaavailable forle alternative
hip, miles ow:
36
app-users r or
age r e to
bpCmCvb
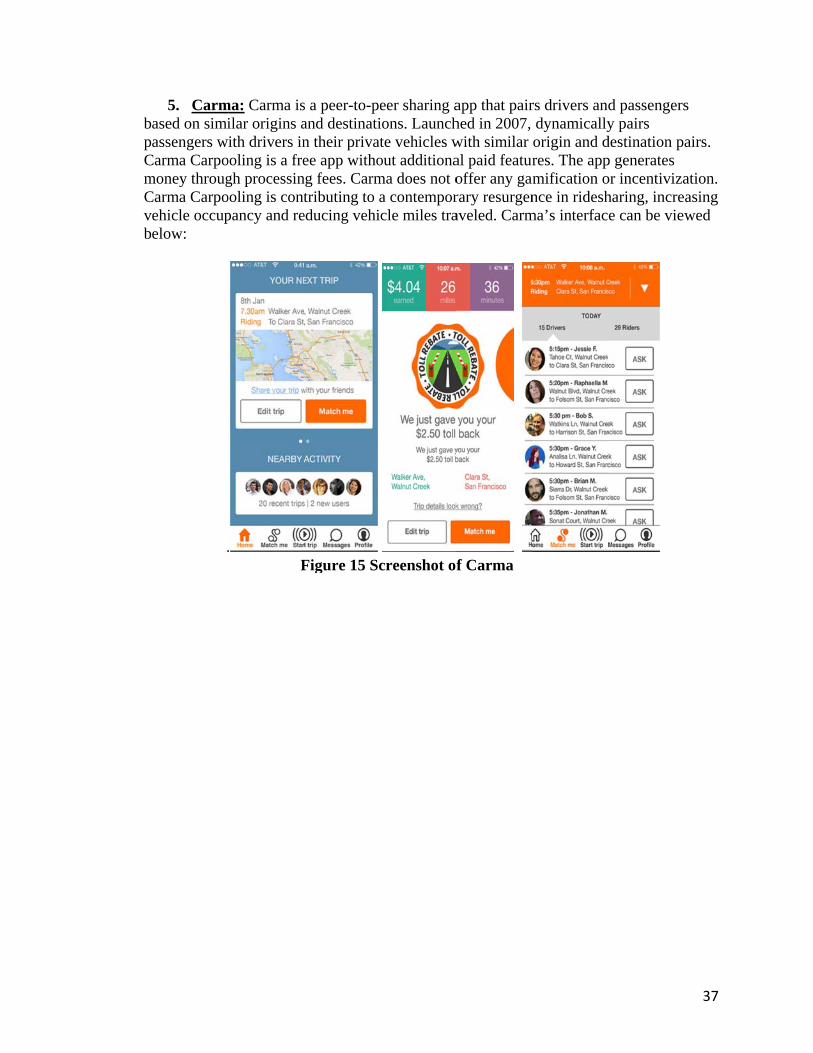
5. Carmased on simiassengers w
Carma Carpomoney througCarma Carpo
ehicle occupelow:
.
ma: Carma isilar origins aith drivers in
ooling is a fregh processinooling is contpancy and re
.F
s a peer-to-peand destinatin their privatee app witho
ng fees. Carmtributing to a
educing vehi
Figure 15 Sc
eer sharing aions. Launchte vehicles wout additionama does not oa contemporcle miles tra
creenshot o
app that pairhed in 2007, with similar al paid featuroffer any gamrary resurgenaveled. Carm
f Carma
rs drivers anddynamicallyorigin and dres. The appmification once in ridesh
ma’s interfac
d passengersy pairs
destination pp generates or incentivizaharing, incree can be view
37
s
airs.
ation. asing wed
3.4. H
raScogdrWrewfetrG
Highest-Rate
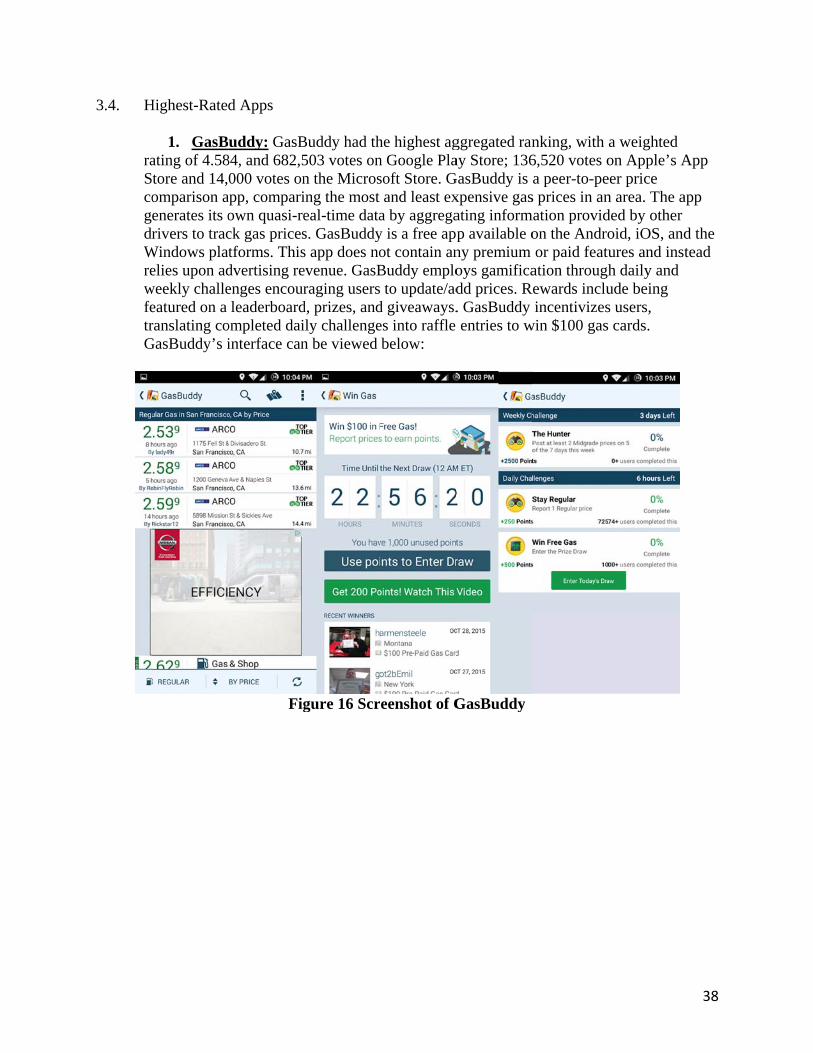
1. GasBating of 4.58tore and 14,omparison aenerates its orivers to trac
Windows plaelies upon ad
weekly challeeatured on a ranslating co
GasBuddy’s i
d Apps
uddy: GasB84, and 682,5000 votes on
app, compariown quasi-reck gas pricestforms. Thisdvertising reenges encourleaderboard
ompleted daiinterface can
Fig
Buddy had th503 votes onn the Microsing the most eal-time datas. GasBuddys app does noevenue. GasBraging users
d, prizes, andily challengen be viewed
gure 16 Scr
he highest agn Google Plasoft Store. Gand least ex
a by aggregay is a free appot contain anBuddy emplo to update/ad
d giveaways.es into raffle below:
eenshot of G
ggregated ranay Store; 136
GasBuddy is xpensive gasating informp available ony premium oys gamificadd prices. R. GasBuddy entries to w
GasBuddy
nking, with 6,520 votes oa peer-to-pe
s prices in anmation provid
on the Androor paid featu
ation throughRewards inclu
incentivizeswin $100 gas
a weighted on Apple’s A
eer price n area. The aded by other oid, iOS, andures and insth daily and ude being s users, cards.
38
App
app
d the tead
wAlofaasprg
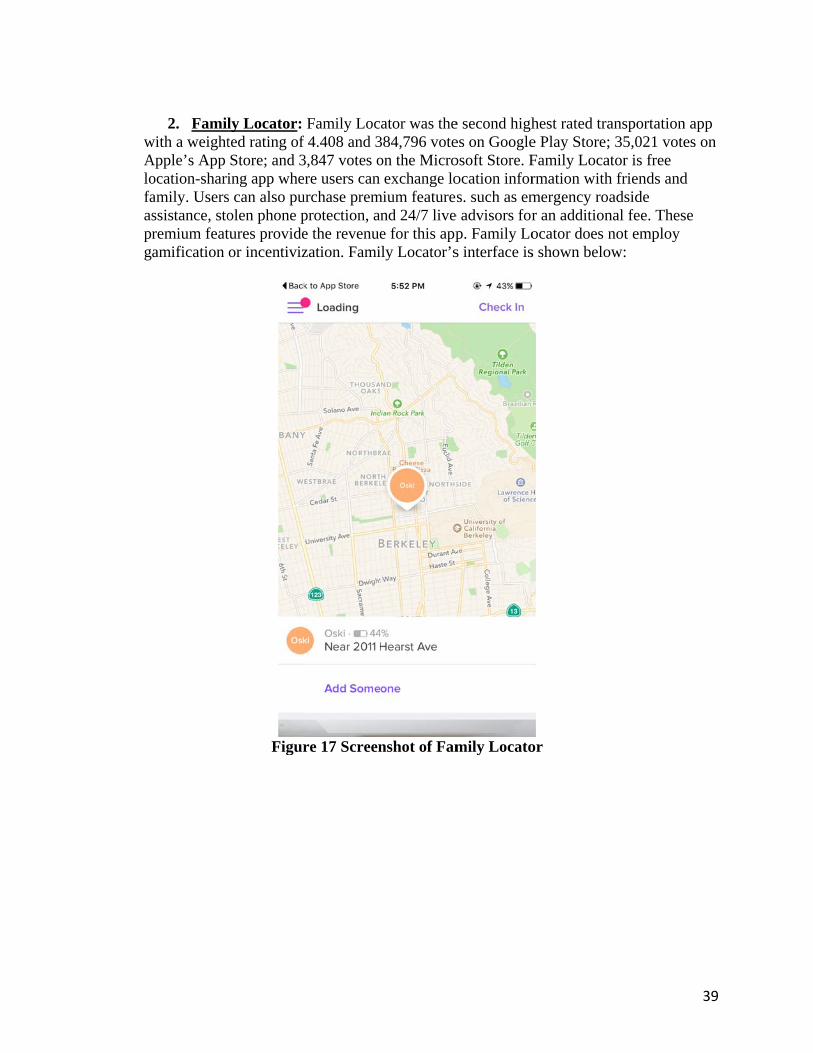
2. Familwith a weightApple’s App ocation-shariamily. Usersssistance, storemium featamification
ly Locator: ted rating of Store; and 3ing app whes can also puolen phone ptures provideor incentiviz
Figur
Family Locf 4.408 and 33,847 votes ore users can
urchase premprotection, ae the revenuezation. Fami
re 17 Screen
ator was the384,796 voteon the Microexchange lo
mium featurend 24/7 livee for this appily Locator’s
nshot of Fam
e second highes on Googleosoft Store. Focation infors. such as em
e advisors forp. Family Los interface is
mily Locato
hest rated trae Play Store;Family Locarmation withmergency ror an additionocator does ns shown belo
or
ansportation; 35,021 voteator is free h friends andadside
nal fee. Thesnot employ
ow:
39
n app es on
d
se
thSTbywCfrPb
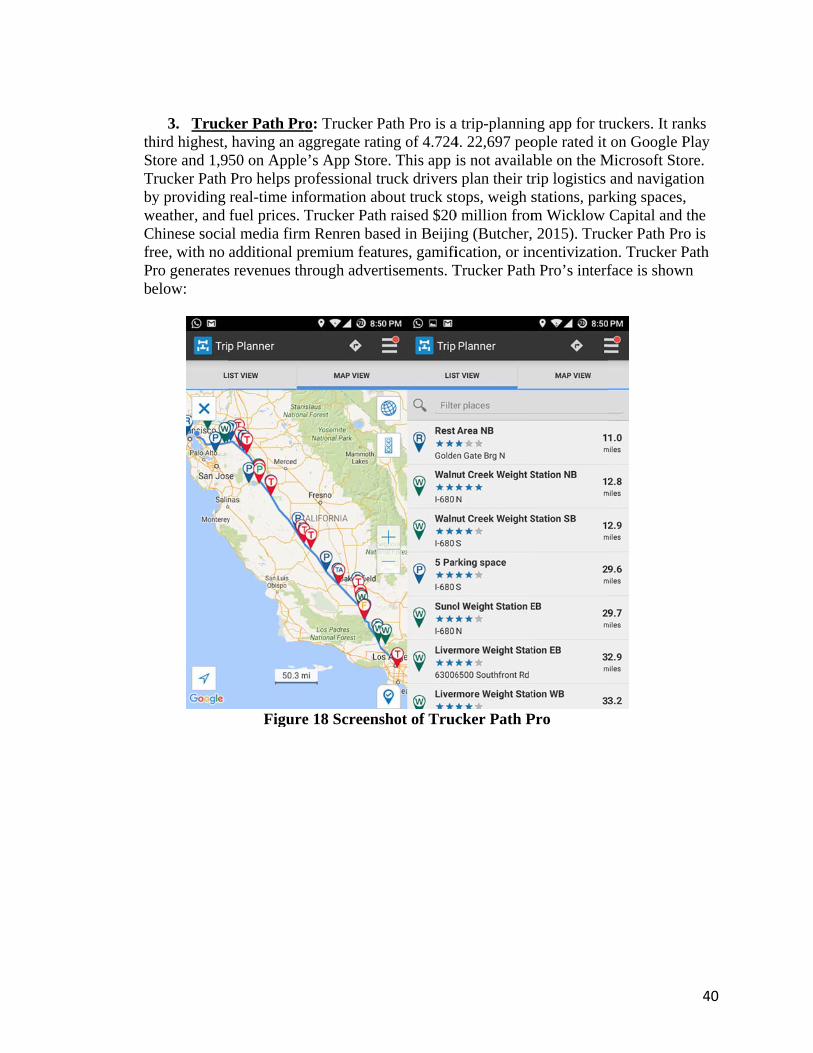
3. Truckhird highest, tore and 1,9
Trucker Path y providing
weather, and Chinese sociaree, with no ro generateselow:
ker Path Prhaving an a50 on ApplePro helps prreal-time inffuel prices.
al media firmadditional p
s revenues th
Figure
ro: Trucker Paggregate rate’s App Storrofessional tformation abTrucker Path
m Renren baremium feat
hrough adver
e 18 Screens
Path Pro is ating of 4.724re. This app itruck driversbout truck sth raised $20sed in Beijintures, gamifirtisements. T
shot of Truc
a trip-plannin4. 22,697 peois not availa
s plan their trtops, weigh s
0 million fromng (Butcher,ication, or inTrucker Path
cker Path P
ng app for truople rated it
able on the Mrip logistics stations, parkm Wicklow 2015). Truc
ncentivizatioh Pro’s interf
Pro
ruckers. It ranon Google P
Microsoft Stoand navigatking spaces,Capital and cker Path Proon. Trucker Pface is show
40
nks Play ore. ion , the o is Path
wn
anonancrGupr
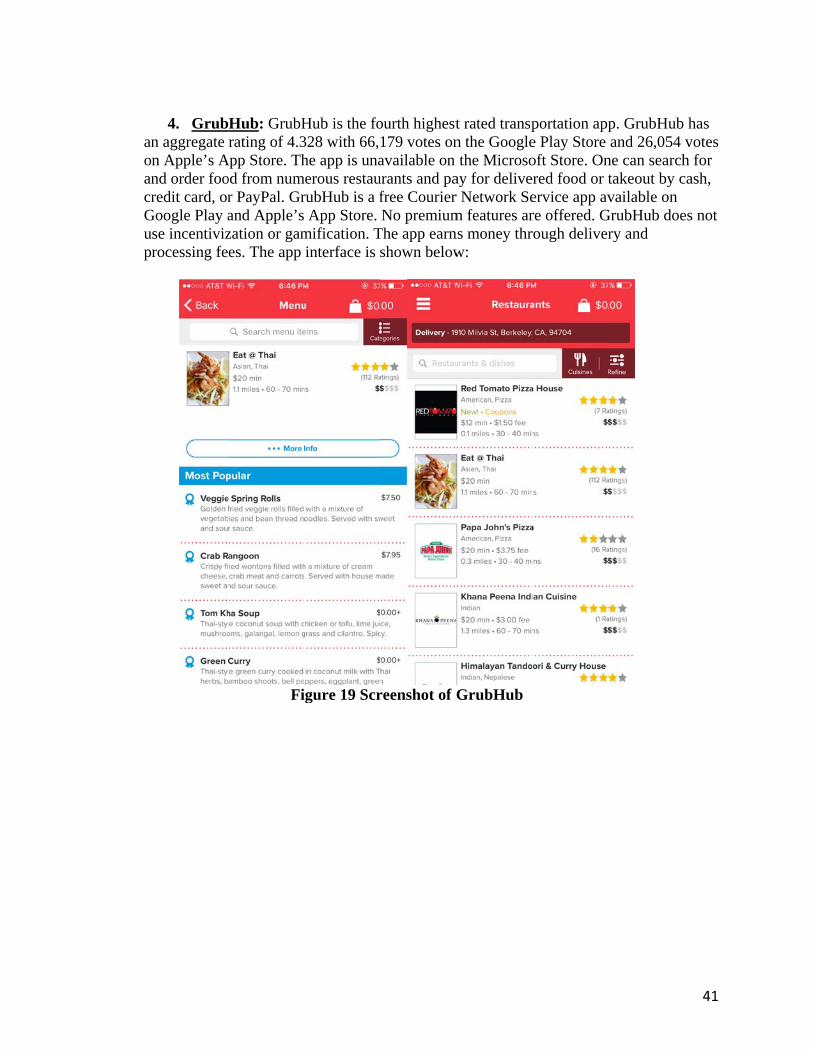
4. Grubn aggregate n Apple’s And order fooredit card, or
Google Play ase incentivizrocessing fe
Hub: GrubHrating of 4.3
App Store. Thod from numr PayPal. Grand Apple’szation or games. The app
Fi
Hub is the fo328 with 66,he app is una
merous restaurubHub is a f App Store.
mification. Tinterface is
igure 19 Scr
ourth highest179 votes onavailable on
urants and pafree CourierNo premium
The app earnshown below
reenshot of G
t rated transpn the Googlethe Microso
ay for deliver Network Sem features arns money thrw:
GrubHub
portation appe Play Store oft Store. Onered food or tervice app avre offered. Grough deliver
p. GrubHub and 26,054
ne can searchtakeout by cvailable on
GrubHub doery and
41
has votes h for cash,
es not
anavre(ecacywMb
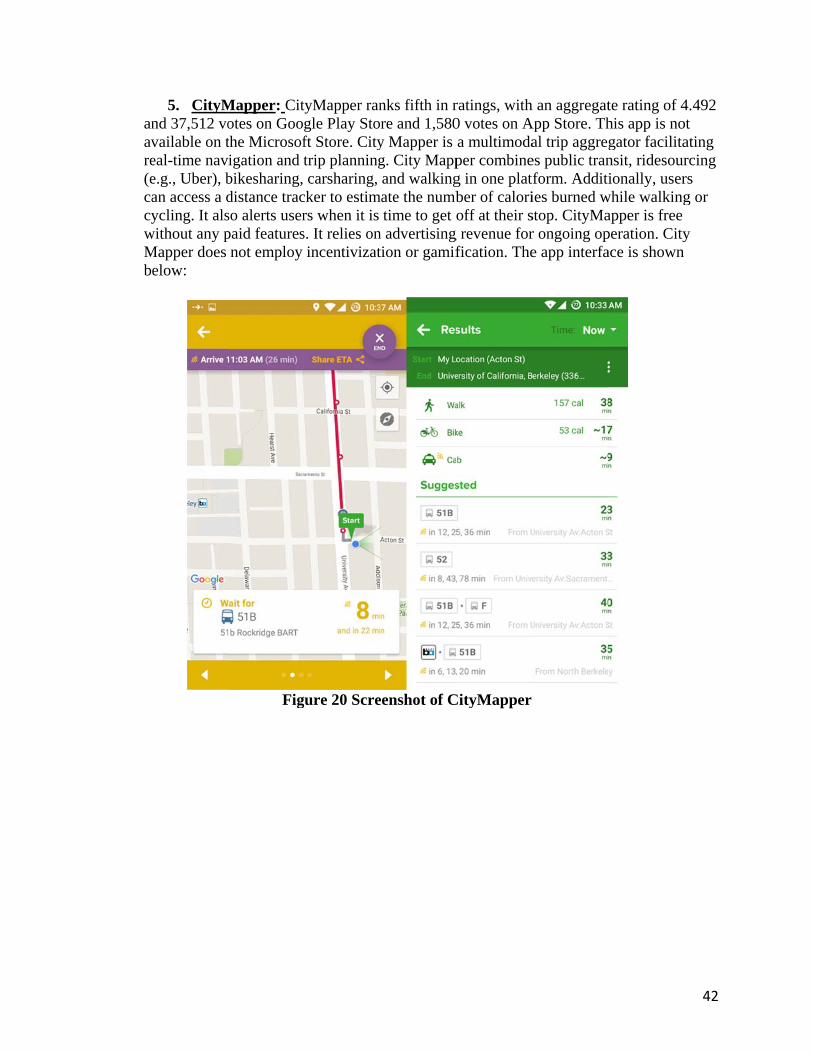
5. CityMnd 37,512 vovailable on teal-time nave.g., Uber), ban access a dycling. It als
without any pMapper does
elow:
Mapper: Citotes on Googthe Microsofigation and tbikesharing, distance tracso alerts userpaid featuresnot employ
Fig
tyMapper rangle Play Stoft Store. Citytrip planningcarsharing,
cker to estimrs when it is s. It relies onincentivizat
ure 20 Scre
nks fifth in rre and 1,580
y Mapper is g. City Mappand walking
mate the numbtime to get o
n advertising tion or gamif
eenshot of C
ratings, with0 votes on Aa multimodaper combineg in one platber of calorioff at their s
g revenue forfication. The
CityMapper
h an aggregatApp Store. Th
al trip aggreges public trantform. Additiies burned wstop. CityMar ongoing ope app interfa
te rating of 4his app is nogator facilitansit, ridesourionally, user
while walkingapper is free peration. Cityace is shown
42
4.492 ot ating rcing rs g or
y
43
4. Expert Interviews
4.1. Overview As individuals are becoming increasingly multimodal, understanding and planning for transportation requires a shift from measuring vehicle miles traveled (VMT) to measuring person miles traveled (PMT). Smartphones have the potential to capture PMT, both through the movements of the phone and through the use of apps to book multimodal transportation. Tracking and accessing data from smartphones raises a variety of important concerns pertaining to privacy and the protection of personally identifiable information (PII). At the same time, the sharing of data among and between private companies and public agencies could significantly improve multimodal transportation access and planning for individuals, transportation companies, and public agencies. This could provide a dynamic source of relevant data and improve the multimodal travel database for transportation demand management and planning purposes. Between February and April 2016, we conducted interviews with experts to gain a stronger understanding about the challenges and benefits of data sharing between private companies and public agencies. In addition to investigating the current practices of data sharing, experts were also asked about their recommendations for a better sharing platform and their hope for leveraging data for urban planning purposes. Experts were invited to participate from both private companies and public agencies to provide both perspectives. The goal is to inform practitioners about the challenges and the benefits of data sharing to improve multimodal transportation options, while potentially providing direction toward resolving some of the challenges surrounding privacy and PII. 4.2. Methodology We contacted a total of 14 experts via email and telephone with an invitation to participate in an interview. The experts were identified via public sources, such as publications and online activity. Among the six executives from the transportation private sector that were contacted, four agreed to participate. Among the seven officials from government transportation planning agencies that were contacted, two agreed to participate. There were two separate questionnaires to reflect the expertise of both the private and public sector participants. The questionnaire was sent to experts in advance of the interview, if requested. Most interviews were between 30 and 45 minutes in duration. 4.3. Questionnaire and Experts We developed a structured interview questionnaire that covered the following subject areas:
• Data sharing pipelines between the government and private companies; • Incentives to encourage companies to share data openly; • Current practices for sharing data at their organizations/company; • The benefits of data sharing to the end user; • Recommendations for improving user experience, including data sharing;
44
• Privacy considerations for data sharing and protecting the end user; • Ways to leverage data for city planning purposes; and • Future of data sharing in the next five to ten years.
The six experts represented the following occupations and backgrounds:
• Chief Executive Officer (CEO) of a microtransit operator (private company) that is currently operating in a limited number of major U.S. cities;
• Vice President of Legal Affairs at an on-demand ridesharing company, currently operating in a limited number of major urban cities in the U.S.;
• Co-Founder of a private company that builds data-driven software applications to improve urban mobility;
• Vice President of a software company specializing in mobile application development for transit agencies and parking management companies;
• Director of Innovation at a planning agency for a major city in the U.S.; and • Chief Information Officer at a municipal planning organization of a major city in
the U.S. Additional expertise and characteristics of the interview participants and their companies include:
• A city that has recently collaborated with transportation companies to provide better dynamic information to users, which has improved their public transit planning process as well.
• An agency goal to apply a data driven approach to their planning process. • A company that provides a secure technology platform for public transit service
operators interested in moving to open payments, open data, and mobile fare collection with minimal infrastructure investment.
• A company uses machine-learning algorithms to inform smarter routing patterns, allowing for a dynamic transportation system.
• A company dynamically matches drivers and riders. • A company analyzes real-time multimodal information to provide users the fastest
and most affordable ways to get around town. • A company that aides the government by providing software tools to help cities
and public transit agencies improve operational efficiency, make smarter investments, and better engage riders.
4.4. Expert Interview Key Findings The expert interviews highlighted many challenges, advantages, and concerns pertaining to data sharing among and between the private and public sectors.
45
4.4.1. Private Companies on Data Sharing
• The four representatives from private companies expressed strong enthusiasm to share their data with governmental agencies provided there was a mutually beneficial agreement.
• The interviews indicated the importance of recognizing that each company has different goals and as such has differing needs for types of data that they could leverage. The experts emphasized that there cannot be a one-size-fits-all agreement drafted by the government that applies to all private companies that they partner with.
• One of the experts revealed that private companies are nervous about sharing data because they do not want to lend competitive advantage to other private companies in an ever-evolving, competitive marketplace. This was a common concern for sharing data with other private companies, but not as much with public agencies.
• The interviewees noted that the more data they have, the more robust the algorithms will be, which can be used in a multitude of ways to solve urban mobility problems such as congestion, parking, and petroleum reliance.
4.4.2. Public Agencies on Data Sharing
• The experts from the public agencies also showed great eagerness to improve their data resources by entering into collaboration with the private companies operating in their respective cities.
• One of the experts suggested the government could serve as an enabler to third parties. General Transit Feed Specification (GTFS) is a classic example, and it has been the basis for taking advantage of multimodal routing and mode decision support tools.
• The experts agreed that data sharing will lead to better visibility for shared mobility, providing more insight into how people travel around the city, and this will improve operations in the short term and infrastructure in the long term.
• One expert also mentioned that better data sharing can encourage people to use shared mobility services more and decrease their use of drive alone because they will have easy access to real-time planning tools to make their trips efficiently.
4.4.3. Most Beneficial Data Sharing Collaboration
• One expert explained how public agencies can lead the charge of planning transportation projects, while the private companies can facilitate and provide valuable input. This individual noted that the brand and culture of a public agency can be complemented with the technical expertise of a private company for better infrastructure planning as a whole.
• The experts noted that public agencies and private companies working together for the use of data also helps to provide better visibility for both public transit as well as transportation apps because this can provide real-time trip planning tools to the users.
46
• One example that was provided was that a city planning agency could incentivize use of an app and in turn get access to their database for demand management and forecasting processes.
• Anonymizing travel data can help to provide a detailed snapshot of how a city moves in discrete blocks of time throughout the day and in different parts of the city.
4.4.4. Types of Data Being Collected and Shared
• Three of the experts from private companies said their company currently has some type of a data sharing collaboration with the city planning agency where they operate.
• One of the companies has all its data in an open framework that can be accessed by the public. They anonymize the data so that no personal information of users is revealed.
• The most common data types being collected by these companies are origin-destination (OD) pairs, modal share, factors for choosing a particular mode (metadata), and time and distance.
• Three of the experts from private companies said they share trip level data with public transit agencies for better insight into their demand patterns.
• One expert said they need geographic and temporal fidelity but do not require individual trip data for improving their day-to-day operation algorithms.
• One of the experts said their company shares information on trips, pickup date, and license number with their governmental partner. They do not provide disembarking data because of security regulations.
4.4.5. Privacy Concerns
• All the experts (both public and private sector) unanimously agreed on the importance of having strict privacy protocols when it comes to sharing user data.
• The experts agreed that sharing application programming interfaces (APIs) is the most efficient method to share data because this gives maximum flexibility and provides a standardized format.
• Concerns were raised because the current recommendations on data sharing are very broad and did not specify individual problems that might occur.
• One of the experts suggested having the privacy policies written in clear, plain English instead of long legal jargon. There should be clear instructions on who they can contact in case of a privacy breach in addition to having a robust data infrastructure and multiple security tests that ensure that a privacy breach does not occur in the first place.
• Users need to be made aware that allowing companies to share their data will benefit all users with better routing infrastructure, more efficient planning mechanisms, and an overall superior travel experience.
• One of the experts said their company anonymizes IDs every 24 hours and bundles them in monthly overviews within a dashboard setting.
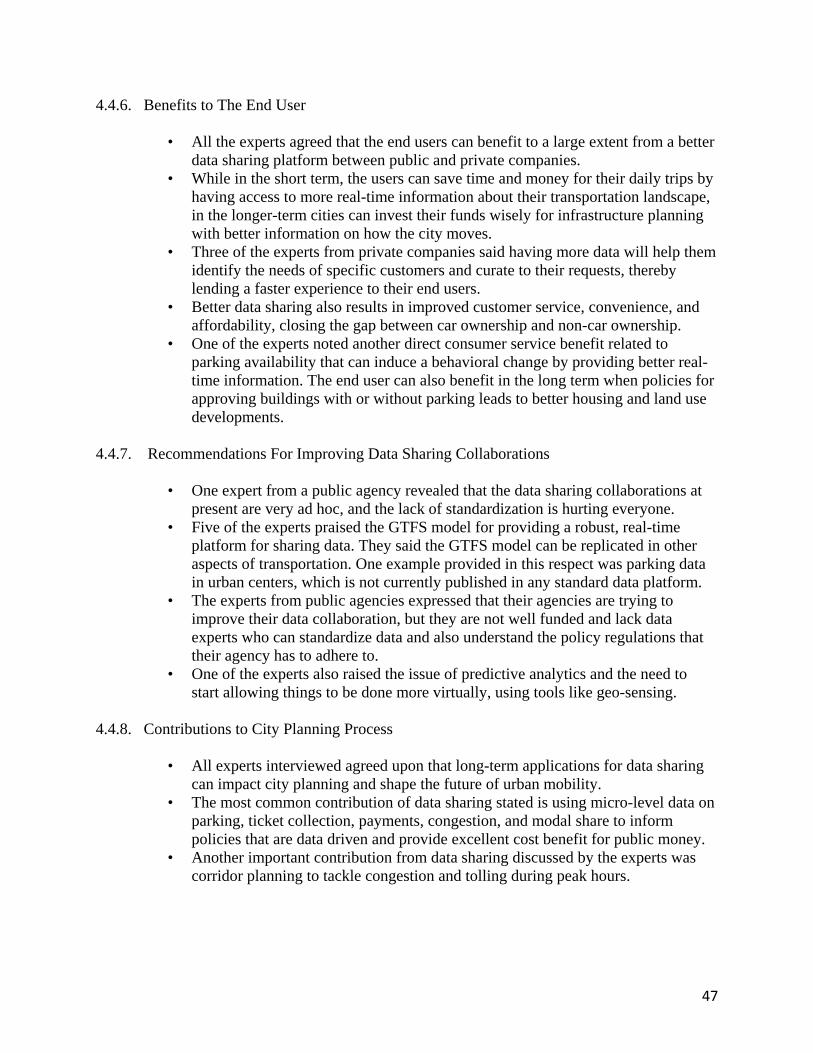
47
4.4.6. Benefits to The End User
• All the experts agreed that the end users can benefit to a large extent from a better data sharing platform between public and private companies.
• While in the short term, the users can save time and money for their daily trips by having access to more real-time information about their transportation landscape, in the longer-term cities can invest their funds wisely for infrastructure planning with better information on how the city moves.
• Three of the experts from private companies said having more data will help them identify the needs of specific customers and curate to their requests, thereby lending a faster experience to their end users.
• Better data sharing also results in improved customer service, convenience, and affordability, closing the gap between car ownership and non-car ownership.
• One of the experts noted another direct consumer service benefit related to parking availability that can induce a behavioral change by providing better real-time information. The end user can also benefit in the long term when policies for approving buildings with or without parking leads to better housing and land use developments.
4.4.7. Recommendations For Improving Data Sharing Collaborations
• One expert from a public agency revealed that the data sharing collaborations at present are very ad hoc, and the lack of standardization is hurting everyone.
• Five of the experts praised the GTFS model for providing a robust, real-time platform for sharing data. They said the GTFS model can be replicated in other aspects of transportation. One example provided in this respect was parking data in urban centers, which is not currently published in any standard data platform.
• The experts from public agencies expressed that their agencies are trying to improve their data collaboration, but they are not well funded and lack data experts who can standardize data and also understand the policy regulations that their agency has to adhere to.
• One of the experts also raised the issue of predictive analytics and the need to start allowing things to be done more virtually, using tools like geo-sensing.
4.4.8. Contributions to City Planning Process
• All experts interviewed agreed upon that long-term applications for data sharing can impact city planning and shape the future of urban mobility.
• The most common contribution of data sharing stated is using micro-level data on parking, ticket collection, payments, congestion, and modal share to inform policies that are data driven and provide excellent cost benefit for public money.
• Another important contribution from data sharing discussed by the experts was corridor planning to tackle congestion and tolling during peak hours.
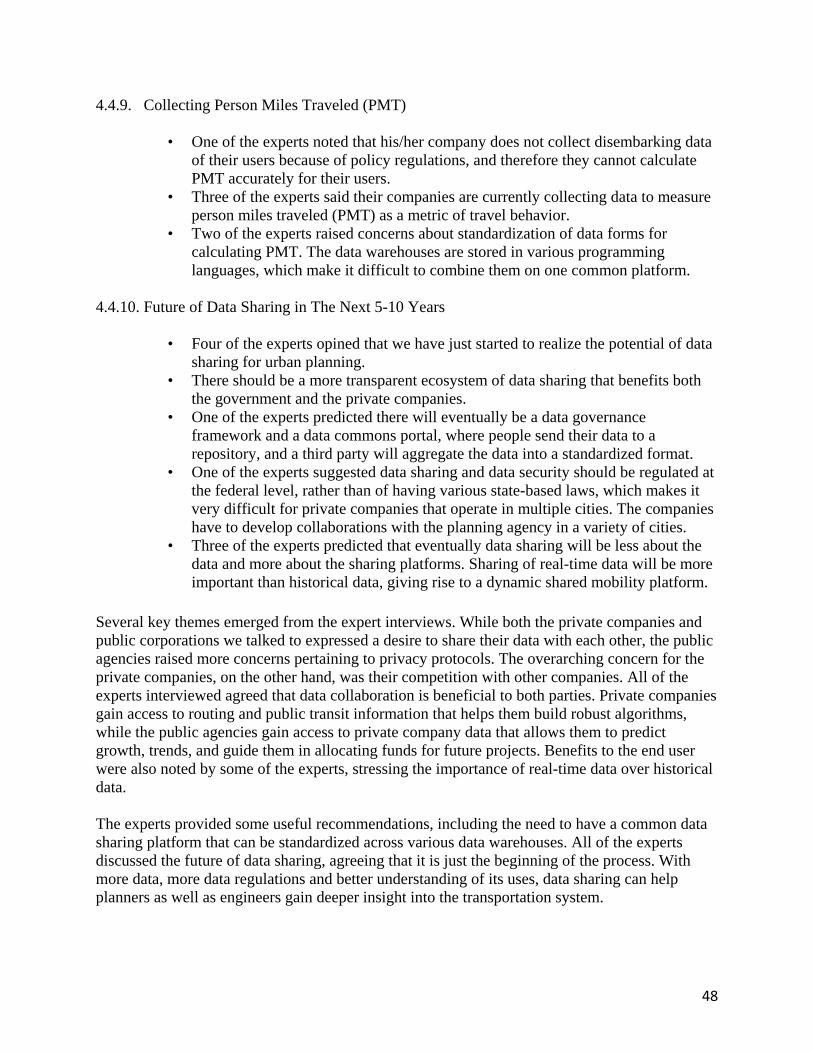
48
4.4.9. Collecting Person Miles Traveled (PMT)
• One of the experts noted that his/her company does not collect disembarking data of their users because of policy regulations, and therefore they cannot calculate PMT accurately for their users.
• Three of the experts said their companies are currently collecting data to measure person miles traveled (PMT) as a metric of travel behavior.
• Two of the experts raised concerns about standardization of data forms for calculating PMT. The data warehouses are stored in various programming languages, which make it difficult to combine them on one common platform.
4.4.10. Future of Data Sharing in The Next 5-10 Years
• Four of the experts opined that we have just started to realize the potential of data sharing for urban planning.
• There should be a more transparent ecosystem of data sharing that benefits both the government and the private companies.
• One of the experts predicted there will eventually be a data governance framework and a data commons portal, where people send their data to a repository, and a third party will aggregate the data into a standardized format.
• One of the experts suggested data sharing and data security should be regulated at the federal level, rather than of having various state-based laws, which makes it very difficult for private companies that operate in multiple cities. The companies have to develop collaborations with the planning agency in a variety of cities.
• Three of the experts predicted that eventually data sharing will be less about the data and more about the sharing platforms. Sharing of real-time data will be more important than historical data, giving rise to a dynamic shared mobility platform.
Several key themes emerged from the expert interviews. While both the private companies and public corporations we talked to expressed a desire to share their data with each other, the public agencies raised more concerns pertaining to privacy protocols. The overarching concern for the private companies, on the other hand, was their competition with other companies. All of the experts interviewed agreed that data collaboration is beneficial to both parties. Private companies gain access to routing and public transit information that helps them build robust algorithms, while the public agencies gain access to private company data that allows them to predict growth, trends, and guide them in allocating funds for future projects. Benefits to the end user were also noted by some of the experts, stressing the importance of real-time data over historical data. The experts provided some useful recommendations, including the need to have a common data sharing platform that can be standardized across various data warehouses. All of the experts discussed the future of data sharing, agreeing that it is just the beginning of the process. With more data, more data regulations and better understanding of its uses, data sharing can help planners as well as engineers gain deeper insight into the transportation system.
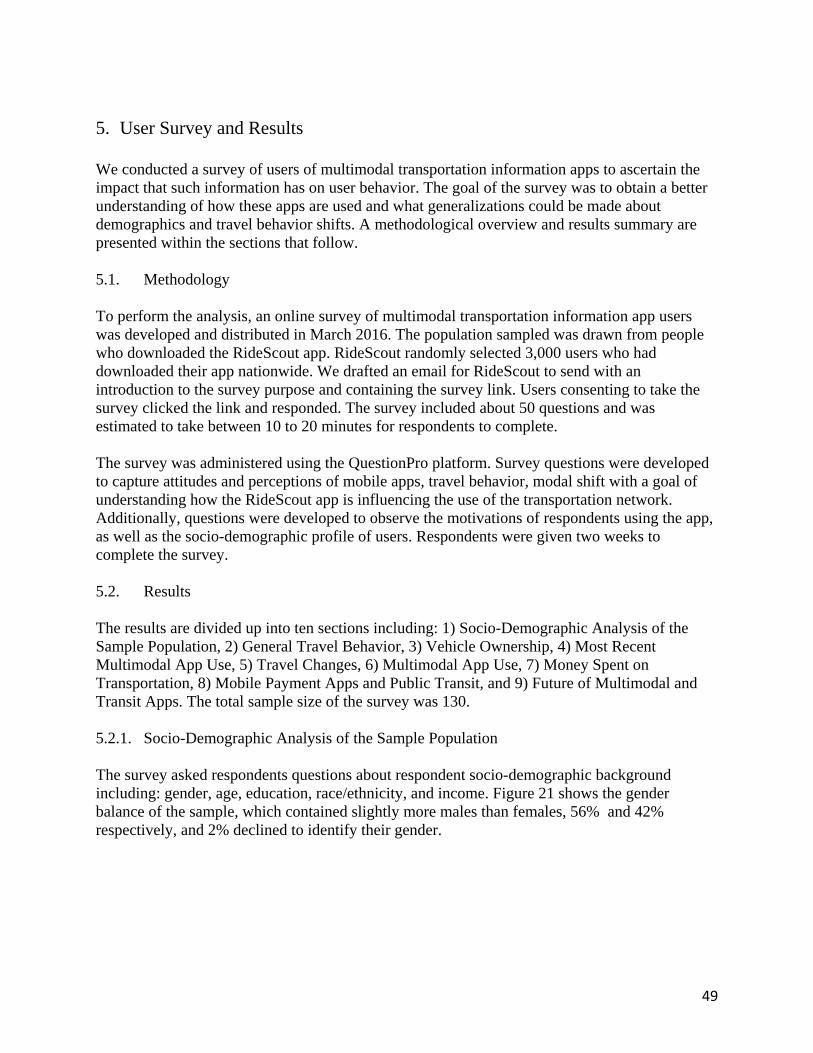
49
5. User Survey and Results
We conducted a survey of users of multimodal transportation information apps to ascertain the impact that such information has on user behavior. The goal of the survey was to obtain a better understanding of how these apps are used and what generalizations could be made about demographics and travel behavior shifts. A methodological overview and results summary are presented within the sections that follow. 5.1. Methodology To perform the analysis, an online survey of multimodal transportation information app users was developed and distributed in March 2016. The population sampled was drawn from people who downloaded the RideScout app. RideScout randomly selected 3,000 users who had downloaded their app nationwide. We drafted an email for RideScout to send with an introduction to the survey purpose and containing the survey link. Users consenting to take the survey clicked the link and responded. The survey included about 50 questions and was estimated to take between 10 to 20 minutes for respondents to complete. The survey was administered using the QuestionPro platform. Survey questions were developed to capture attitudes and perceptions of mobile apps, travel behavior, modal shift with a goal of understanding how the RideScout app is influencing the use of the transportation network. Additionally, questions were developed to observe the motivations of respondents using the app, as well as the socio-demographic profile of users. Respondents were given two weeks to complete the survey. 5.2. Results The results are divided up into ten sections including: 1) Socio-Demographic Analysis of the Sample Population, 2) General Travel Behavior, 3) Vehicle Ownership, 4) Most Recent Multimodal App Use, 5) Travel Changes, 6) Multimodal App Use, 7) Money Spent on Transportation, 8) Mobile Payment Apps and Public Transit, and 9) Future of Multimodal and Transit Apps. The total sample size of the survey was 130. 5.2.1. Socio-Demographic Analysis of the Sample Population The survey asked respondents questions about respondent socio-demographic background including: gender, age, education, race/ethnicity, and income. Figure 21 shows the gender balance of the sample, which contained slightly more males than females, 56% and 42% respectively, and 2% declined to identify their gender.
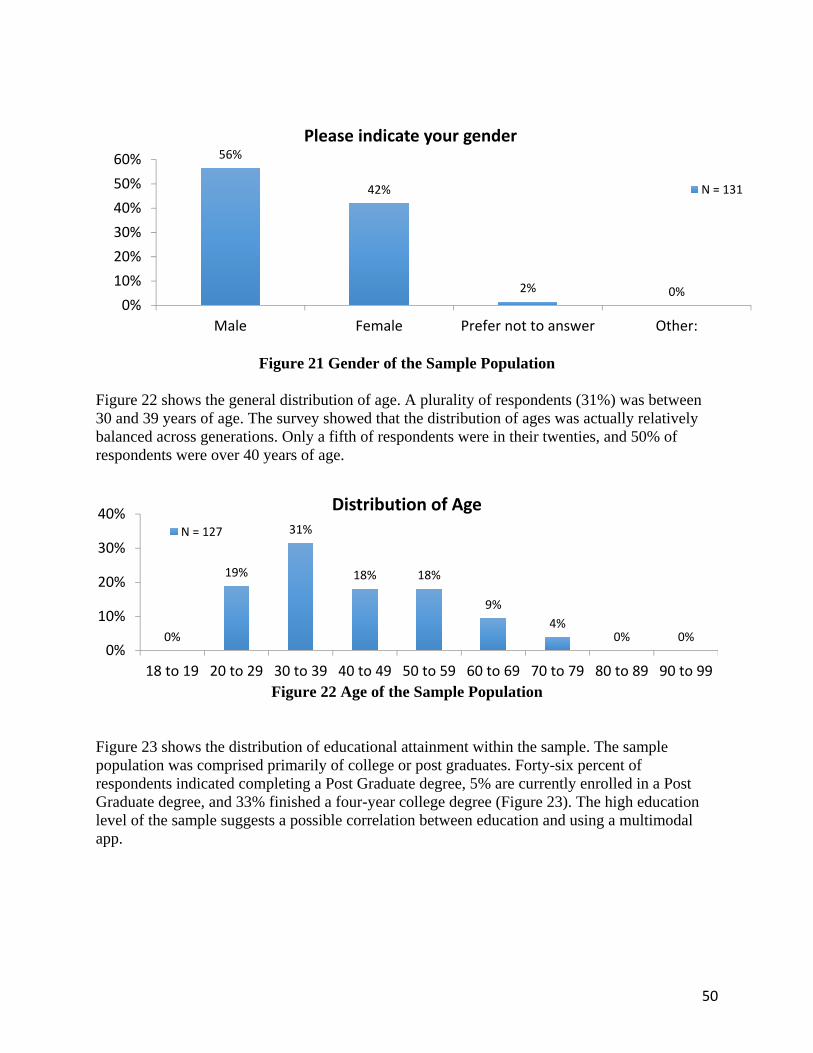
50
Figure 21 Gender of the Sample Population
Figure 22 shows the general distribution of age. A plurality of respondents (31%) was between 30 and 39 years of age. The survey showed that the distribution of ages was actually relatively balanced across generations. Only a fifth of respondents were in their twenties, and 50% of respondents were over 40 years of age.
Figure 22 Age of the Sample Population
Figure 23 shows the distribution of educational attainment within the sample. The sample population was comprised primarily of college or post graduates. Forty-six percent of respondents indicated completing a Post Graduate degree, 5% are currently enrolled in a Post Graduate degree, and 33% finished a four-year college degree (Figure 23). The high education level of the sample suggests a possible correlation between education and using a multimodal app.
56%
42%
2% 0%0%
10%
20%
30%
40%
50%
60%
Male Female Prefer not to answer Other:
Please indicate your gender
N = 131
0%
19%
31%
18% 18%
9%
4%0% 0%
0%
10%
20%
30%
40%
18 to 19 20 to 29 30 to 39 40 to 49 50 to 59 60 to 69 70 to 79 80 to 89 90 to 99
Distribution of Age
N = 127

51
Figure 23 Highest Level of Education of the Sample Population
Figure 24 shows the self-identified racial/ethnic breakdown of the sample. The sample was overwhelmingly Caucasian/White at 86% of the sample, while 5% reported being Hispanic or Latino, 4% were African American, 7% were Asian, and 4% preferred not to answer
0%
1%
6%
0%
5%
2%
33%
5%
46%
1%
1%
0% 10% 20% 30% 40% 50%
Less than high school
Currently in high school
High school/GED
Currently in 2‐year college
2‐year college degree
Currently in 4‐year college
4‐year college degree
Currently in post‐graduate degree
Post‐graduate degree (MA, MS, PhD, MD,…
Prefer not to answer
Other, please specify:
What is the highest level of education you have completed?
N = 128
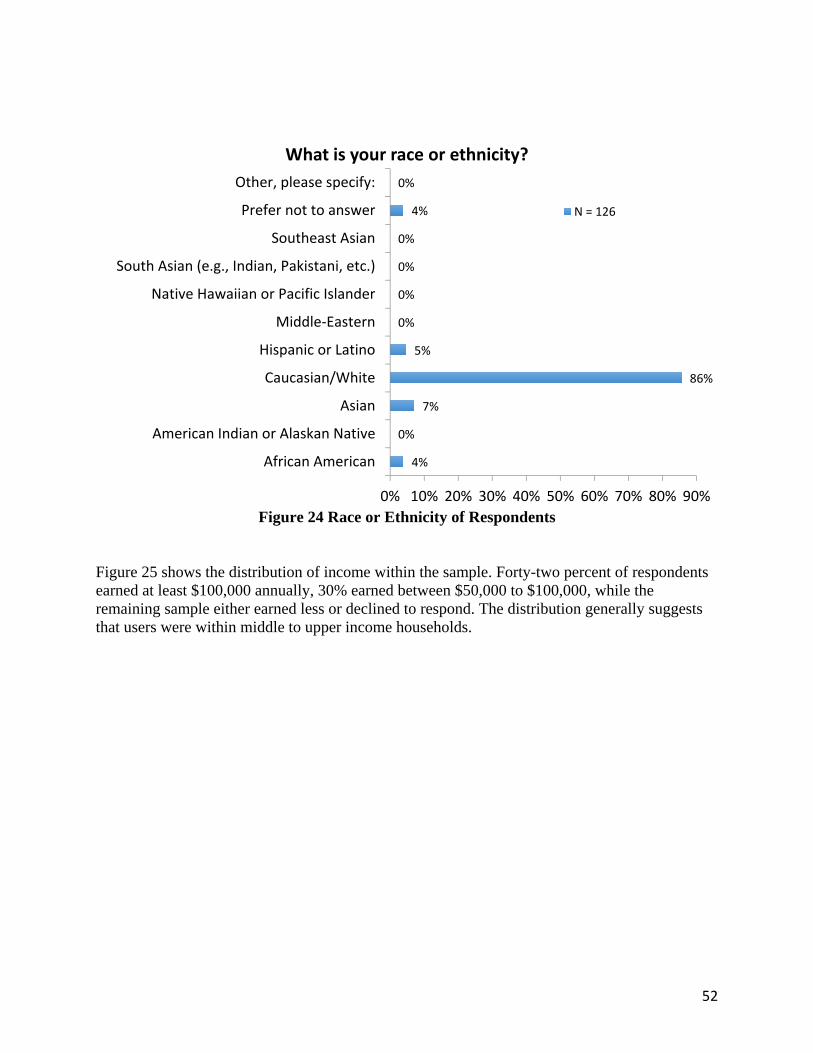
52
Figure 24 Race or Ethnicity of Respondents
Figure 25 shows the distribution of income within the sample. Forty-two percent of respondents earned at least $100,000 annually, 30% earned between $50,000 to $100,000, while the remaining sample either earned less or declined to respond. The distribution generally suggests that users were within middle to upper income households.
4%
0%
7%
86%
5%
0%
0%
0%
0%
4%
0%
0% 10% 20% 30% 40% 50% 60% 70% 80% 90%
African American
American Indian or Alaskan Native
Asian
Caucasian/White
Hispanic or Latino
Middle‐Eastern
Native Hawaiian or Pacific Islander
South Asian (e.g., Indian, Pakistani, etc.)
Southeast Asian
Prefer not to answer
Other, please specify:
What is your race or ethnicity?
N = 126
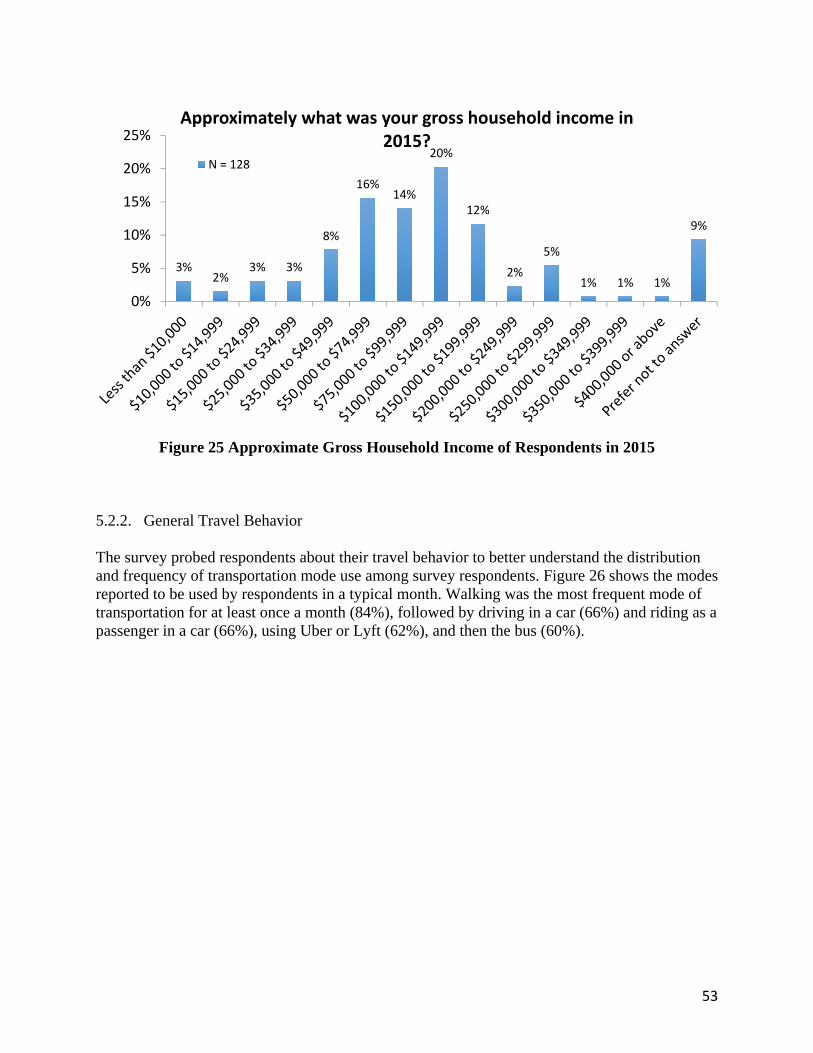
53
Figure 25 Approximate Gross Household Income of Respondents in 2015
5.2.2. General Travel Behavior The survey probed respondents about their travel behavior to better understand the distribution and frequency of transportation mode use among survey respondents. Figure 26 shows the modes reported to be used by respondents in a typical month. Walking was the most frequent mode of transportation for at least once a month (84%), followed by driving in a car (66%) and riding as a passenger in a car (66%), using Uber or Lyft (62%), and then the bus (60%).
3%2%
3% 3%
8%
16%14%
20%
12%
2%
5%
1% 1% 1%
9%
0%
5%
10%
15%
20%
25%Approximately what was your gross household income in
2015?N = 128
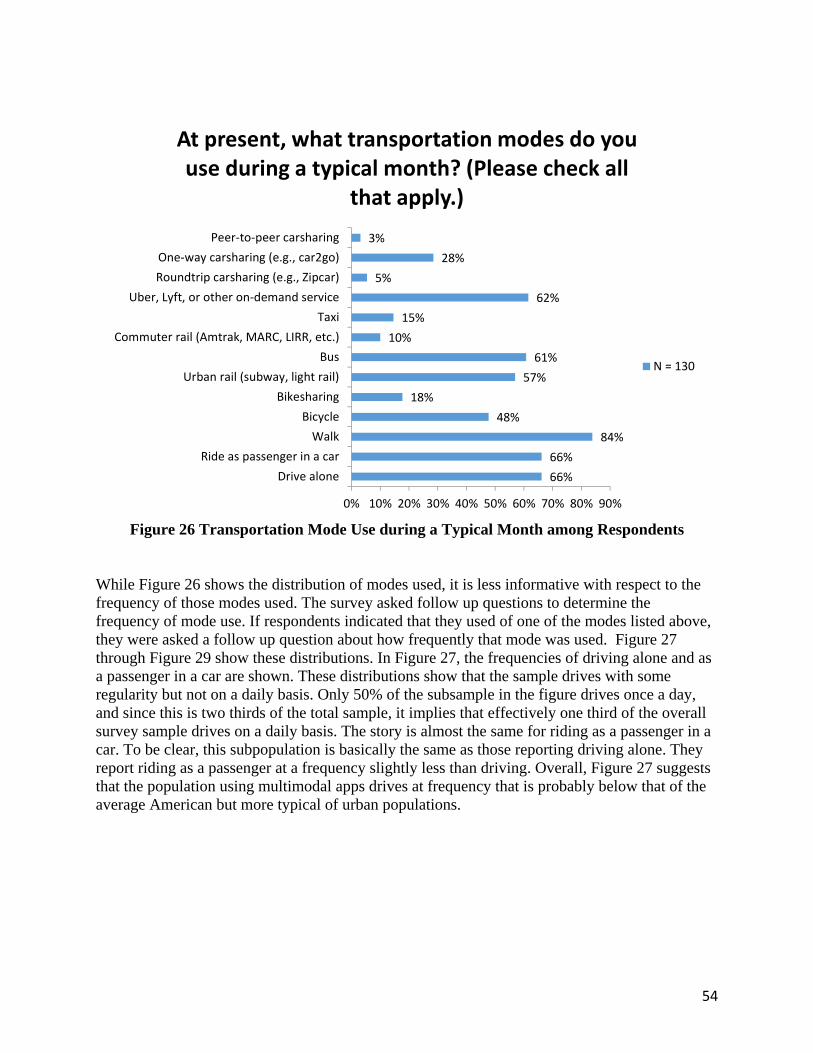
54
Figure 26 Transportation Mode Use during a Typical Month among Respondents
While Figure 26 shows the distribution of modes used, it is less informative with respect to the frequency of those modes used. The survey asked follow up questions to determine the frequency of mode use. If respondents indicated that they used of one of the modes listed above, they were asked a follow up question about how frequently that mode was used. Figure 27 through Figure 29 show these distributions. In Figure 27, the frequencies of driving alone and as a passenger in a car are shown. These distributions show that the sample drives with some regularity but not on a daily basis. Only 50% of the subsample in the figure drives once a day, and since this is two thirds of the total sample, it implies that effectively one third of the overall survey sample drives on a daily basis. The story is almost the same for riding as a passenger in a car. To be clear, this subpopulation is basically the same as those reporting driving alone. They report riding as a passenger at a frequency slightly less than driving. Overall, Figure 27 suggests that the population using multimodal apps drives at frequency that is probably below that of the average American but more typical of urban populations.
66%
66%
84%
48%
18%
57%
61%
10%
15%
62%
5%
28%
3%
0% 10% 20% 30% 40% 50% 60% 70% 80% 90%
Drive alone
Ride as passenger in a car
Walk
Bicycle
Bikesharing
Urban rail (subway, light rail)
Bus
Commuter rail (Amtrak, MARC, LIRR, etc.)
Taxi
Uber, Lyft, or other on‐demand service
Roundtrip carsharing (e.g., Zipcar)
One‐way carsharing (e.g., car2go)
Peer‐to‐peer carsharing
At present, what transportation modes do you use during a typical month? (Please check all
that apply.)
N = 130
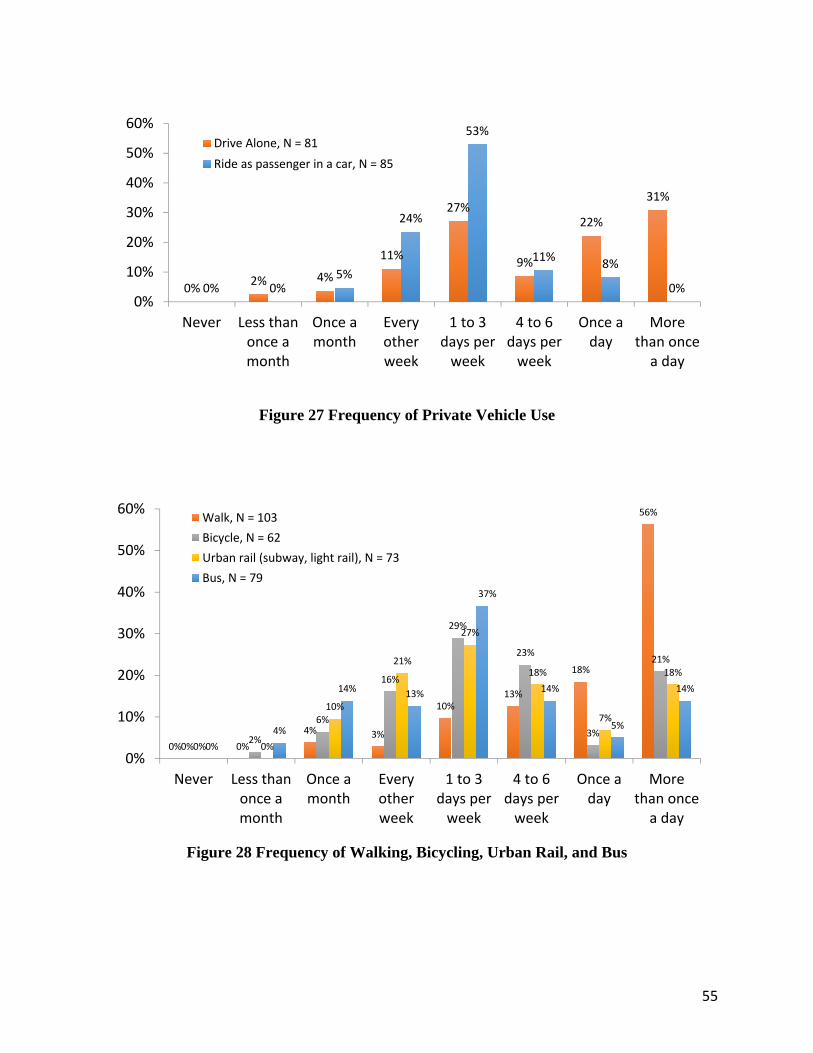
55
Figure 27 Frequency of Private Vehicle Use
Figure 28 Frequency of Walking, Bicycling, Urban Rail, and Bus
0%2% 4%
11%
27%
9%
22%
31%
0% 0%5%
24%
53%
11%8%
0%0%
10%
20%
30%
40%
50%
60%
Never Less thanonce amonth
Once amonth
Everyotherweek
1 to 3days perweek
4 to 6days perweek
Once aday
Morethan oncea day
Drive Alone, N = 81
Ride as passenger in a car, N = 85
0% 0%
4% 3%
10%13%
18%
56%
0%2%
6%
16%
29%
23%
3%
21%
0% 0%
10%
21%
27%
18%
7%
18%
0%
4%
14% 13%
37%
14%
5%
14%
0%
10%
20%
30%
40%
50%
60%
Never Less thanonce amonth
Once amonth
Everyotherweek
1 to 3days perweek
4 to 6days perweek
Once aday
Morethan oncea day
Walk, N = 103
Bicycle, N = 62
Urban rail (subway, light rail), N = 73
Bus, N = 79
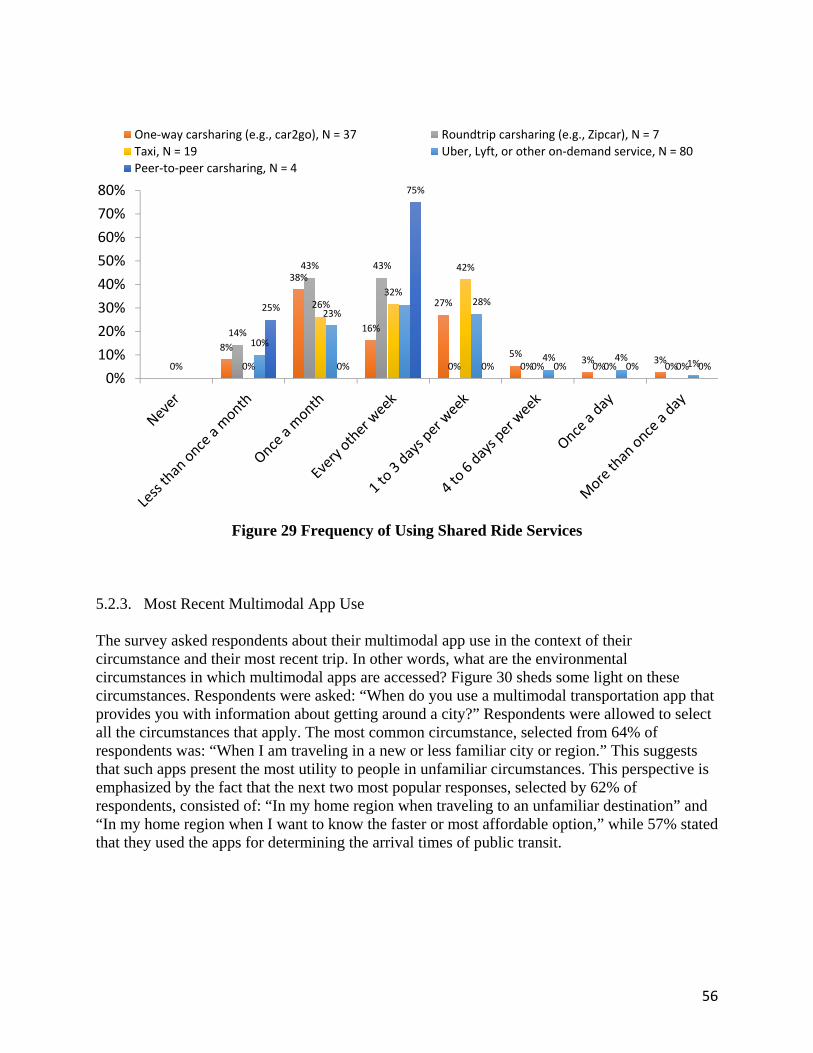
56
Figure 29 Frequency of Using Shared Ride Services
5.2.3. Most Recent Multimodal App Use The survey asked respondents about their multimodal app use in the context of their circumstance and their most recent trip. In other words, what are the environmental circumstances in which multimodal apps are accessed? Figure 30 sheds some light on these circumstances. Respondents were asked: “When do you use a multimodal transportation app that provides you with information about getting around a city?” Respondents were allowed to select all the circumstances that apply. The most common circumstance, selected from 64% of respondents was: “When I am traveling in a new or less familiar city or region.” This suggests that such apps present the most utility to people in unfamiliar circumstances. This perspective is emphasized by the fact that the next two most popular responses, selected by 62% of respondents, consisted of: “In my home region when traveling to an unfamiliar destination” and “In my home region when I want to know the faster or most affordable option,” while 57% stated that they used the apps for determining the arrival times of public transit.
8%
38%
16%
27%
5%3% 3%
14%
43% 43%
0% 0% 0% 0%0% 0%
26%32%
42%
0% 0% 0%
10%
23%28%
4% 4%1%
25%
0%
75%
0% 0% 0% 0%
0%
10%
20%
30%
40%
50%
60%
70%
80%
One‐way carsharing (e.g., car2go), N = 37 Roundtrip carsharing (e.g., Zipcar), N = 7
Taxi, N = 19 Uber, Lyft, or other on‐demand service, N = 80
Peer‐to‐peer carsharing, N = 4
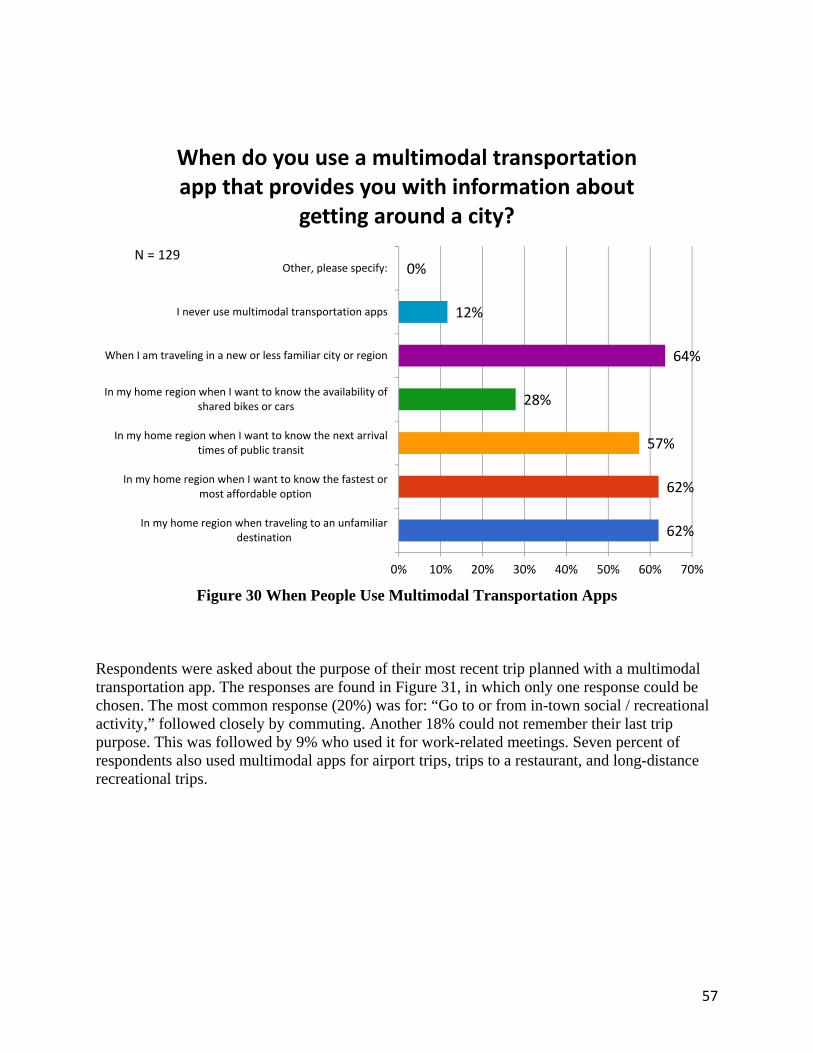
57
Figure 30 When People Use Multimodal Transportation Apps
Respondents were asked about the purpose of their most recent trip planned with a multimodal transportation app. The responses are found in Figure 31, in which only one response could be chosen. The most common response (20%) was for: “Go to or from in-town social / recreational activity,” followed closely by commuting. Another 18% could not remember their last trip purpose. This was followed by 9% who used it for work-related meetings. Seven percent of respondents also used multimodal apps for airport trips, trips to a restaurant, and long-distance recreational trips.
62%
62%
57%
28%
64%
12%
0%
In my home region when traveling to an unfamiliardestination
In my home region when I want to know the fastest ormost affordable option
In my home region when I want to know the next arrivaltimes of public transit
In my home region when I want to know the availability ofshared bikes or cars
When I am traveling in a new or less familiar city or region
I never use multimodal transportation apps
Other, please specify:
0% 10% 20% 30% 40% 50% 60% 70%
When do you use a multimodal transportation app that provides you with information about
getting around a city?
N = 129
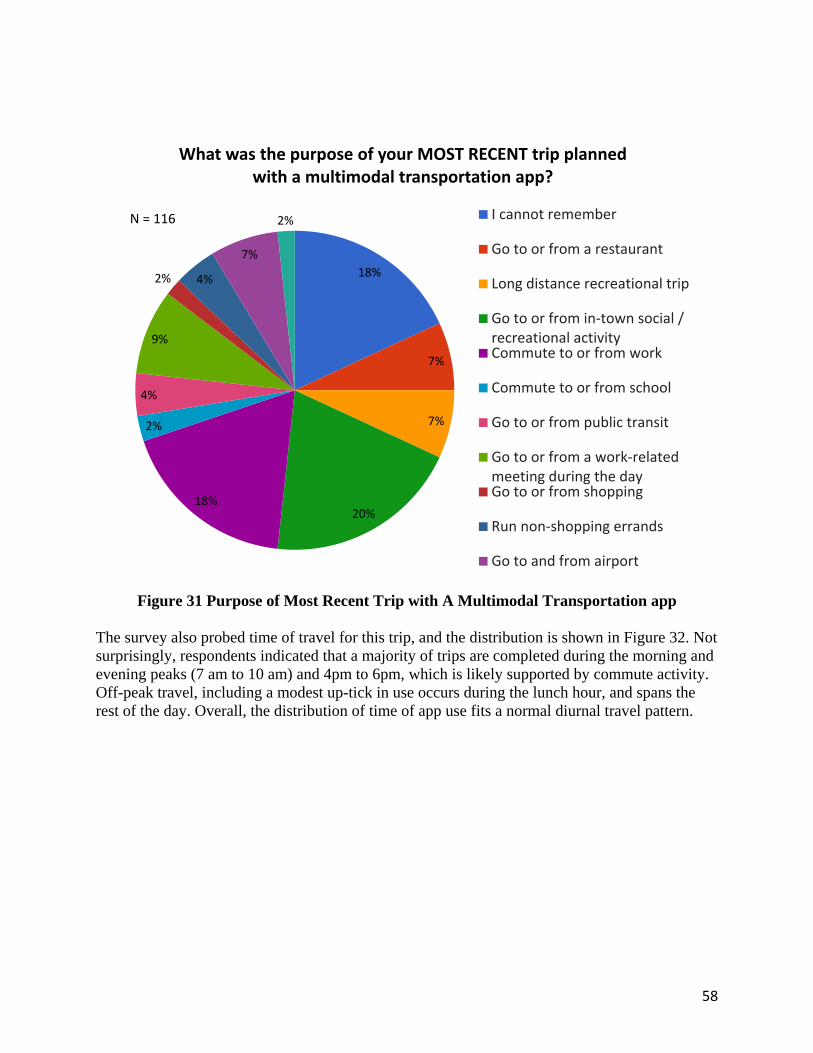
58
Figure 31 Purpose of Most Recent Trip with A Multimodal Transportation app
The survey also probed time of travel for this trip, and the distribution is shown in Figure 32. Not surprisingly, respondents indicated that a majority of trips are completed during the morning and evening peaks (7 am to 10 am) and 4pm to 6pm, which is likely supported by commute activity. Off-peak travel, including a modest up-tick in use occurs during the lunch hour, and spans the rest of the day. Overall, the distribution of time of app use fits a normal diurnal travel pattern.
18%
7%
7%
20%18%
2%
4%
9%
2% 4%
7%
2%
What was the purpose of your MOST RECENT trip planned with a multimodal transportation app?
I cannot remember
Go to or from a restaurant
Long distance recreational trip
Go to or from in‐town social /recreational activityCommute to or from work
Commute to or from school
Go to or from public transit
Go to or from a work‐relatedmeeting during the dayGo to or from shopping
Run non‐shopping errands
Go to and from airport
N = 116
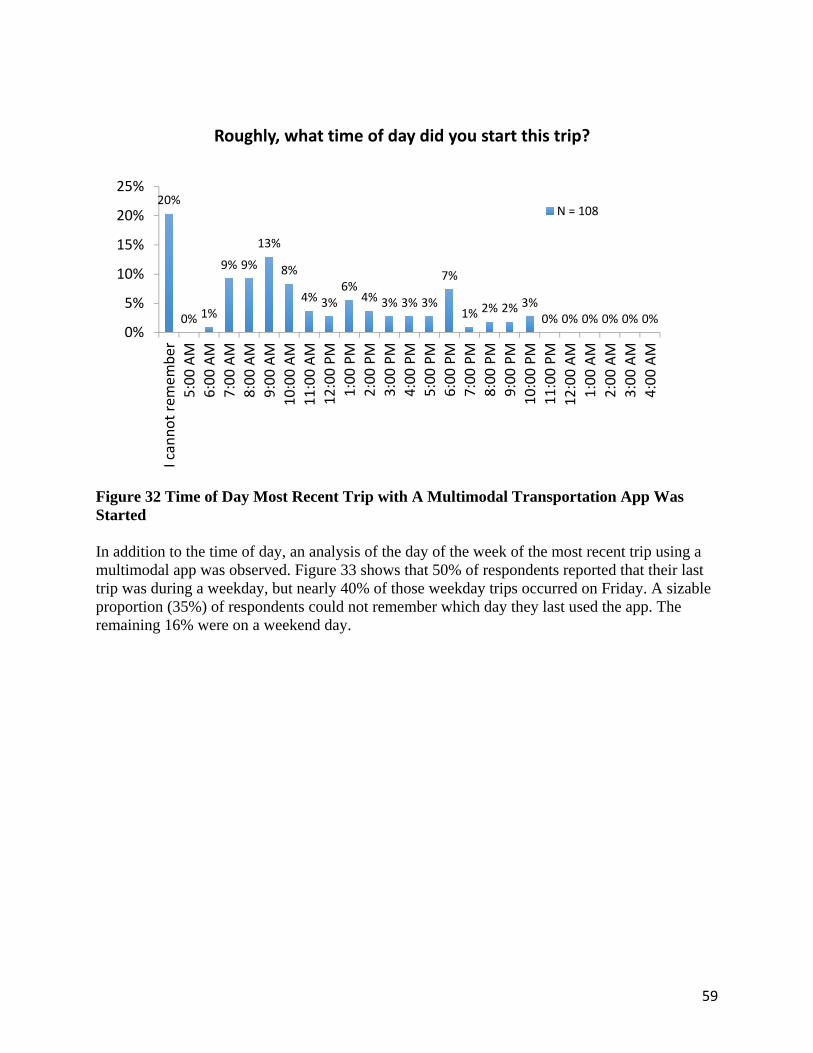
59
Figure 32 Time of Day Most Recent Trip with A Multimodal Transportation App Was Started In addition to the time of day, an analysis of the day of the week of the most recent trip using a multimodal app was observed. Figure 33 shows that 50% of respondents reported that their last trip was during a weekday, but nearly 40% of those weekday trips occurred on Friday. A sizable proportion (35%) of respondents could not remember which day they last used the app. The remaining 16% were on a weekend day.
20%
0% 1%
9% 9%
13%
8%
4% 3%6%
4% 3% 3% 3%
7%
1% 2% 2% 3%0% 0% 0% 0% 0% 0%
0%
5%
10%
15%
20%
25%I cannot remem
ber
5:00 AM
6:00 AM
7:00 AM
8:00 AM
9:00 AM
10:00 AM
11:00 AM
12:00 PM
1:00 PM
2:00 PM
3:00 PM
4:00 PM
5:00 PM
6:00 PM
7:00 PM
8:00 PM
9:00 PM
10:00 PM
11:00 PM
12:00 AM
1:00 AM
2:00 AM
3:00 AM
4:00 AM
Roughly, what time of day did you start this trip?
N = 108
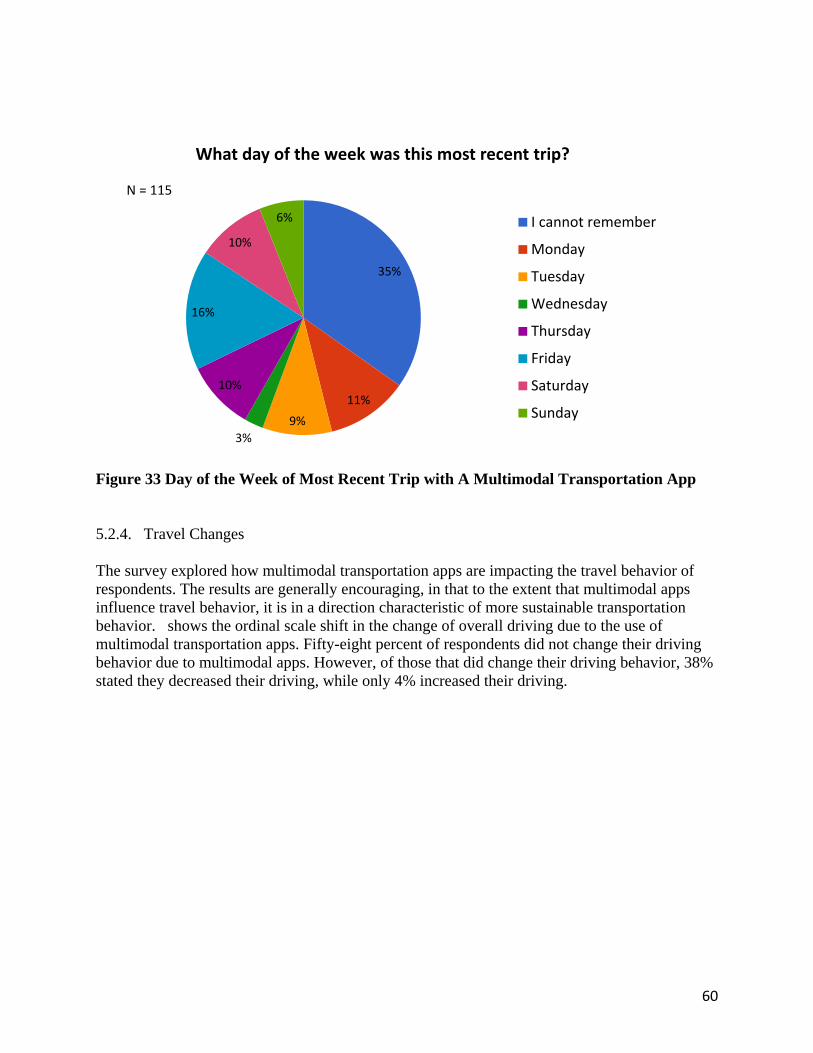
60
Figure 33 Day of the Week of Most Recent Trip with A Multimodal Transportation App 5.2.4. Travel Changes The survey explored how multimodal transportation apps are impacting the travel behavior of respondents. The results are generally encouraging, in that to the extent that multimodal apps influence travel behavior, it is in a direction characteristic of more sustainable transportation behavior. shows the ordinal scale shift in the change of overall driving due to the use of multimodal transportation apps. Fifty-eight percent of respondents did not change their driving behavior due to multimodal apps. However, of those that did change their driving behavior, 38% stated they decreased their driving, while only 4% increased their driving.
35%
11%
9%
3%
10%
16%
10%
6%
What day of the week was this most recent trip?
I cannot remember
Monday
Tuesday
Wednesday
Thursday
Friday
Saturday
Sunday
N = 115
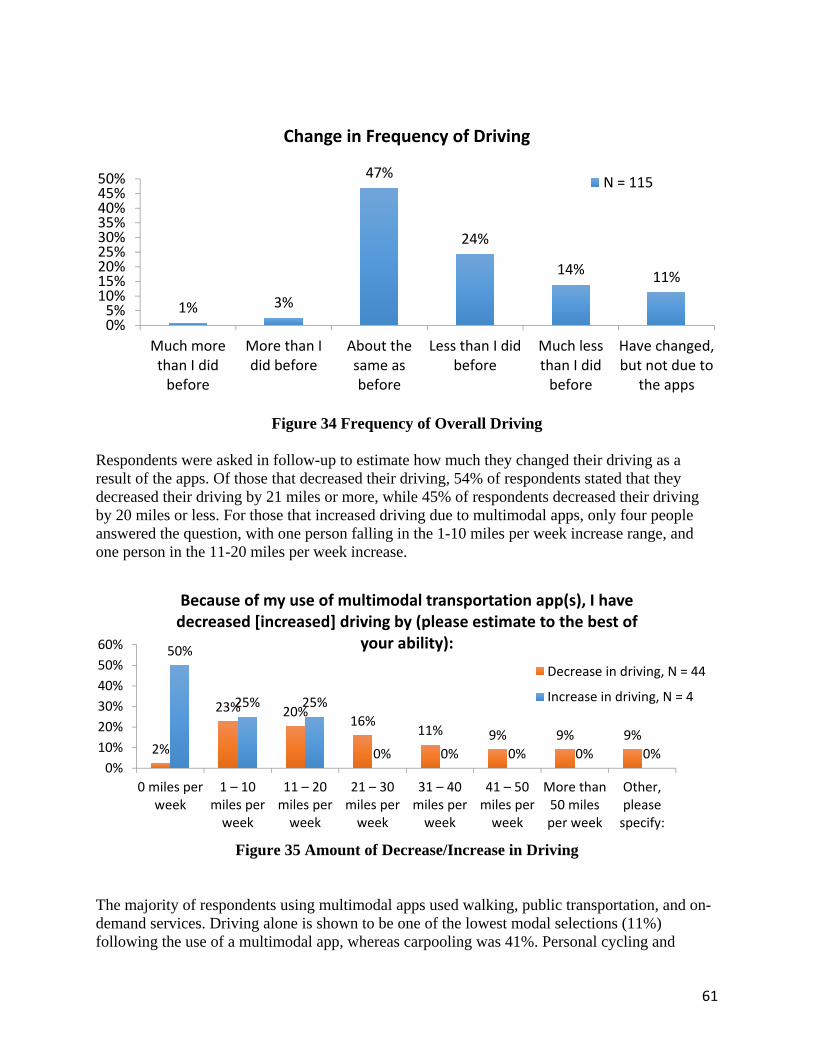
61
Figure 34 Frequency of Overall Driving
Respondents were asked in follow-up to estimate how much they changed their driving as a result of the apps. Of those that decreased their driving, 54% of respondents stated that they decreased their driving by 21 miles or more, while 45% of respondents decreased their driving by 20 miles or less. For those that increased driving due to multimodal apps, only four people answered the question, with one person falling in the 1-10 miles per week increase range, and one person in the 11-20 miles per week increase.
Figure 35 Amount of Decrease/Increase in Driving
The majority of respondents using multimodal apps used walking, public transportation, and on-demand services. Driving alone is shown to be one of the lowest modal selections (11%) following the use of a multimodal app, whereas carpooling was 41%. Personal cycling and
1% 3%
47%
24%
14% 11%
0%5%10%15%20%25%30%35%40%45%50%
Much morethan I didbefore
More than Idid before
About thesame asbefore
Less than I didbefore
Much lessthan I didbefore
Have changed,but not due to
the apps
Change in Frequency of Driving
N = 115
2%
23% 20%16%
11% 9% 9% 9%
50%
25% 25%
0% 0% 0% 0% 0%0%
10%
20%
30%
40%
50%
60%
0 miles perweek
1 – 10 miles per week
11 – 20 miles per week
21 – 30 miles per week
31 – 40 miles per week
41 – 50 miles per week
More than50 milesper week
Other,pleasespecify:
Because of my use of multimodal transportation app(s), I have decreased [increased] driving by (please estimate to the best of
your ability):
Decrease in driving, N = 44
Increase in driving, N = 4
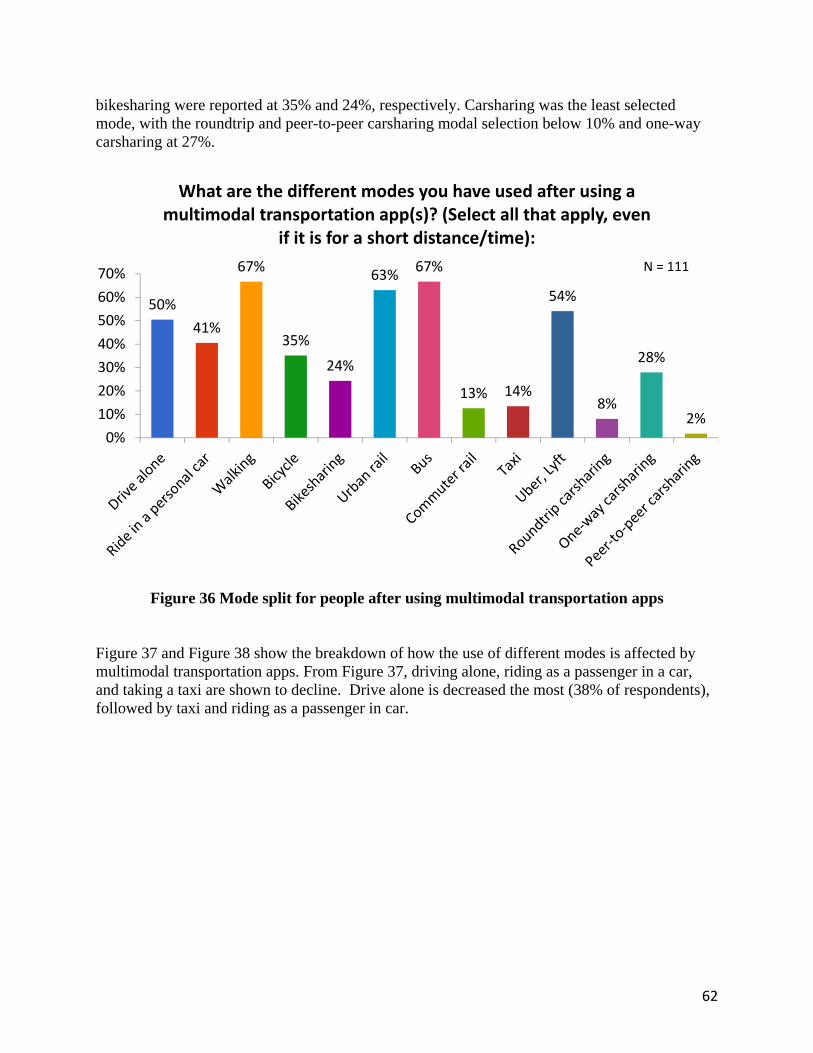
62
bikesharing were reported at 35% and 24%, respectively. Carsharing was the least selected mode, with the roundtrip and peer-to-peer carsharing modal selection below 10% and one-way carsharing at 27%.
Figure 36 Mode split for people after using multimodal transportation apps
Figure 37 and Figure 38 show the breakdown of how the use of different modes is affected by multimodal transportation apps. From Figure 37, driving alone, riding as a passenger in a car, and taking a taxi are shown to decline. Drive alone is decreased the most (38% of respondents), followed by taxi and riding as a passenger in car.
50%
41%
67%
35%
24%
63%67%
13% 14%
54%
8%
28%
2%0%
10%
20%
30%
40%
50%
60%
70%
What are the different modes you have used after using a multimodal transportation app(s)? (Select all that apply, even
if it is for a short distance/time):
N = 111
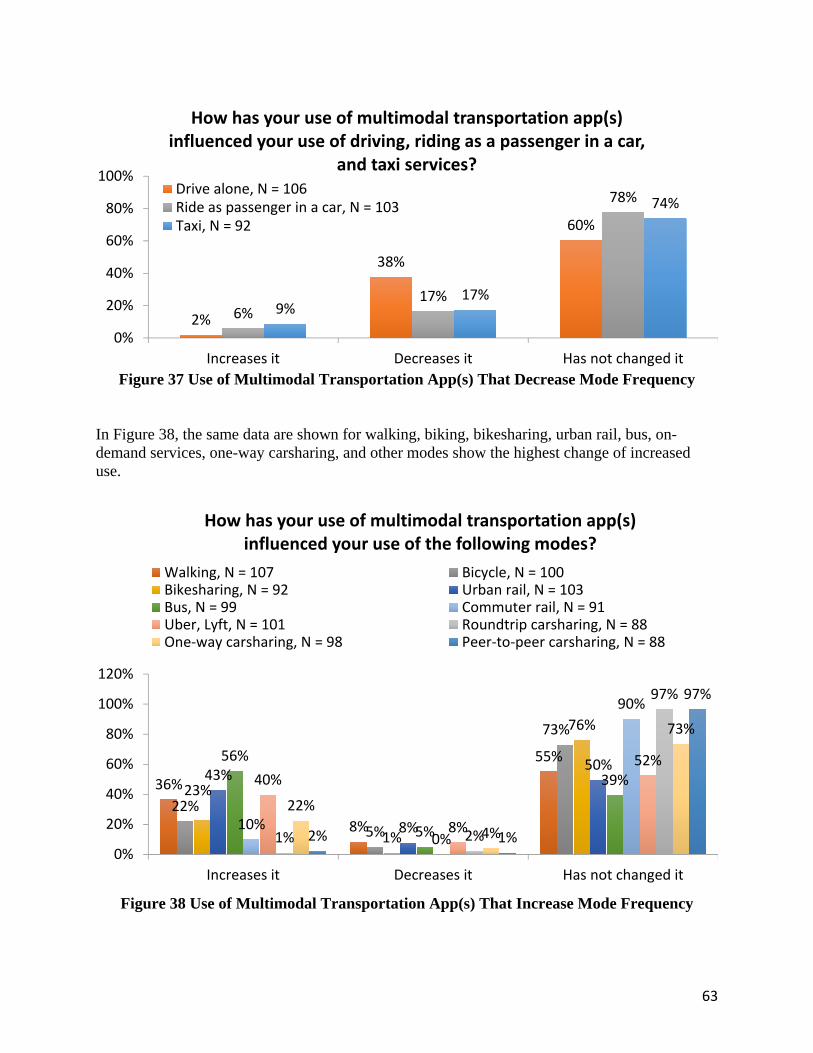
63
Figure 37 Use of Multimodal Transportation App(s) That Decrease Mode Frequency
In Figure 38, the same data are shown for walking, biking, bikesharing, urban rail, bus, on-demand services, one-way carsharing, and other modes show the highest change of increased use.
Figure 38 Use of Multimodal Transportation App(s) That Increase Mode Frequency
2%
38%
60%
6%17%
78%
9%17%
74%
0%
20%
40%
60%
80%
100%
Increases it Decreases it Has not changed it
How has your use of multimodal transportation app(s) influenced your use of driving, riding as a passenger in a car,
and taxi services?Drive alone, N = 106Ride as passenger in a car, N = 103Taxi, N = 92
36%
8%
55%
22%
5%
73%
23%
1%
76%
43%
8%
50%56%
5%
39%
10%0%
90%
40%
8%
52%
1% 2%
97%
22%
4%
73%
2% 1%
97%
0%
20%
40%
60%
80%
100%
120%
Increases it Decreases it Has not changed it
How has your use of multimodal transportation app(s) influenced your use of the following modes?
Walking, N = 107 Bicycle, N = 100Bikesharing, N = 92 Urban rail, N = 103Bus, N = 99 Commuter rail, N = 91Uber, Lyft, N = 101 Roundtrip carsharing, N = 88One‐way carsharing, N = 98 Peer‐to‐peer carsharing, N = 88
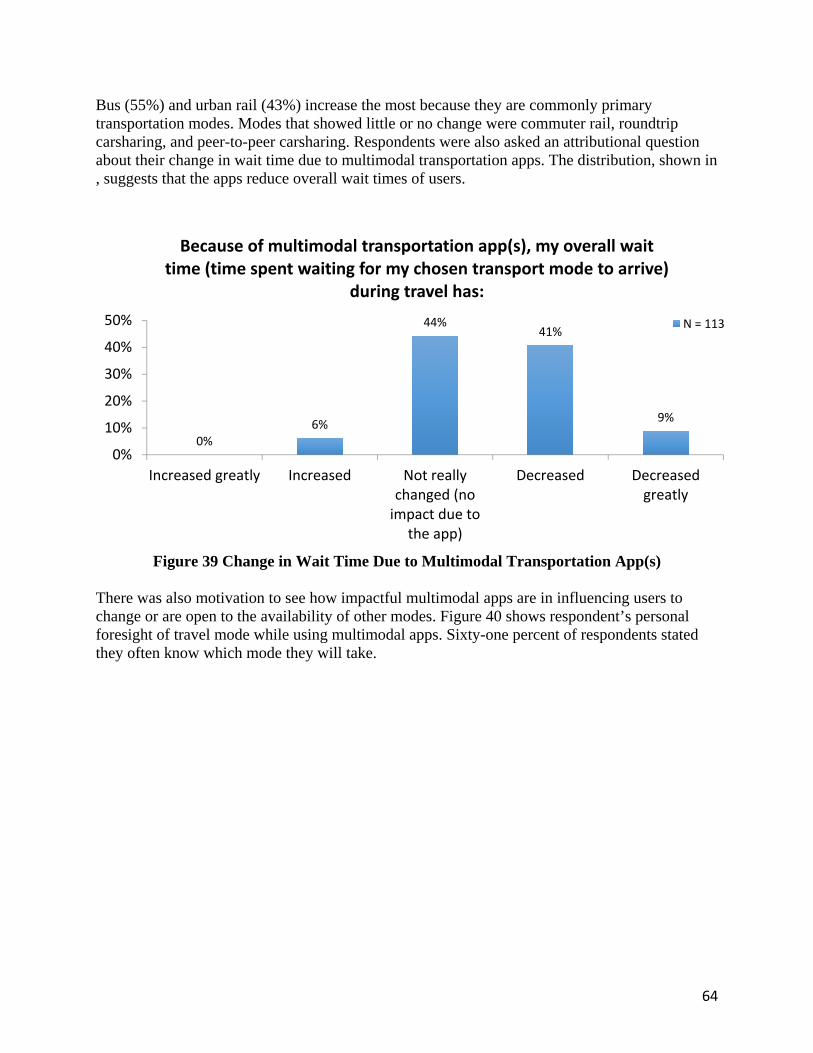
64
Bus (55%) and urban rail (43%) increase the most because they are commonly primary transportation modes. Modes that showed little or no change were commuter rail, roundtrip carsharing, and peer-to-peer carsharing. Respondents were also asked an attributional question about their change in wait time due to multimodal transportation apps. The distribution, shown in , suggests that the apps reduce overall wait times of users.
Figure 39 Change in Wait Time Due to Multimodal Transportation App(s)
There was also motivation to see how impactful multimodal apps are in influencing users to change or are open to the availability of other modes. Figure 40 shows respondent’s personal foresight of travel mode while using multimodal apps. Sixty-one percent of respondents stated they often know which mode they will take.
0%6%
44%41%
9%
0%
10%
20%
30%
40%
50%
Increased greatly Increased Not reallychanged (noimpact due to
the app)
Decreased Decreasedgreatly
Because of multimodal transportation app(s), my overall wait time (time spent waiting for my chosen transport mode to arrive)
during travel has:
N = 113
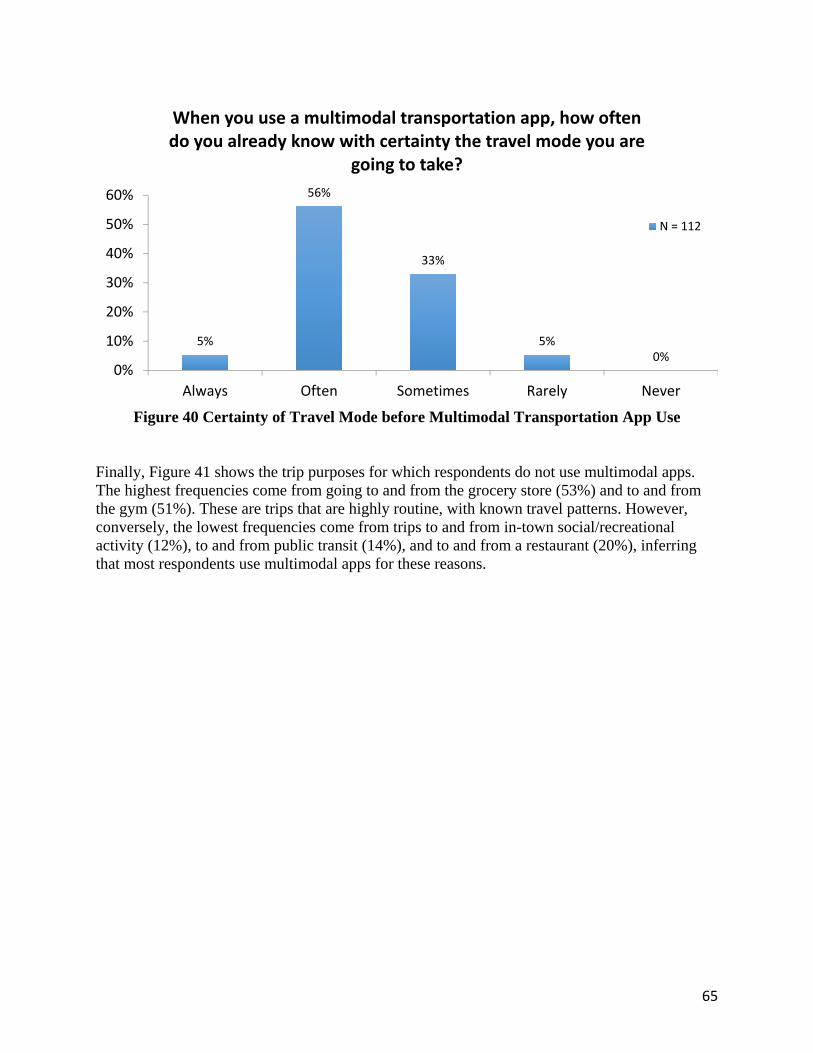
65
Figure 40 Certainty of Travel Mode before Multimodal Transportation App Use
Finally, Figure 41 shows the trip purposes for which respondents do not use multimodal apps. The highest frequencies come from going to and from the grocery store (53%) and to and from the gym (51%). These are trips that are highly routine, with known travel patterns. However, conversely, the lowest frequencies come from trips to and from in-town social/recreational activity (12%), to and from public transit (14%), and to and from a restaurant (20%), inferring that most respondents use multimodal apps for these reasons.
5%
56%
33%
5%0%
0%
10%
20%
30%
40%
50%
60%
Always Often Sometimes Rarely Never
When you use a multimodal transportation app, how often do you already know with certainty the travel mode you are
going to take?
N = 112
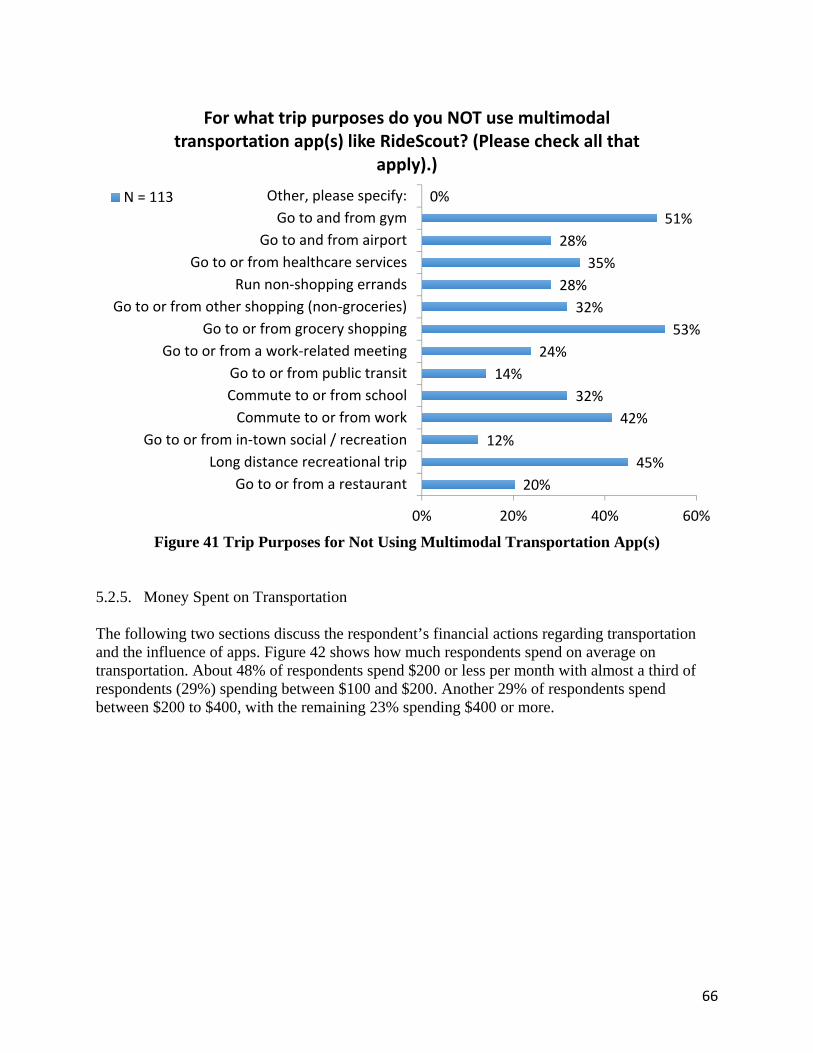
66
Figure 41 Trip Purposes for Not Using Multimodal Transportation App(s)
5.2.5. Money Spent on Transportation The following two sections discuss the respondent’s financial actions regarding transportation and the influence of apps. Figure 42 shows how much respondents spend on average on transportation. About 48% of respondents spend $200 or less per month with almost a third of respondents (29%) spending between $100 and $200. Another 29% of respondents spend between $200 to $400, with the remaining 23% spending $400 or more.
20%
45%
12%
42%
32%
14%
24%
53%
32%
28%
35%
28%
51%
0%
0% 20% 40% 60%
Go to or from a restaurant
Long distance recreational trip
Go to or from in‐town social / recreation
Commute to or from work
Commute to or from school
Go to or from public transit
Go to or from a work‐related meeting
Go to or from grocery shopping
Go to or from other shopping (non‐groceries)
Run non‐shopping errands
Go to or from healthcare services
Go to and from airport
Go to and from gym
Other, please specify:
For what trip purposes do you NOT use multimodal transportation app(s) like RideScout? (Please check all that
apply).)
N = 113
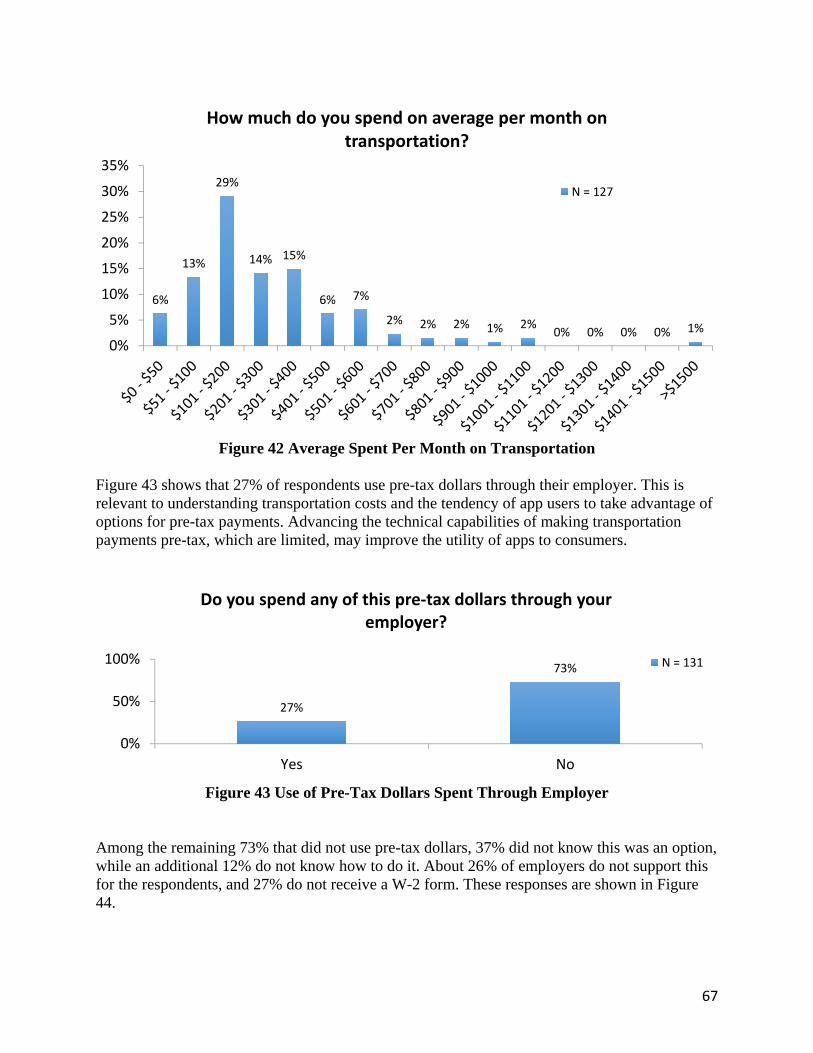
67
Figure 42 Average Spent Per Month on Transportation
Figure 43 shows that 27% of respondents use pre-tax dollars through their employer. This is relevant to understanding transportation costs and the tendency of app users to take advantage of options for pre-tax payments. Advancing the technical capabilities of making transportation payments pre-tax, which are limited, may improve the utility of apps to consumers.
Figure 43 Use of Pre-Tax Dollars Spent Through Employer
Among the remaining 73% that did not use pre-tax dollars, 37% did not know this was an option, while an additional 12% do not know how to do it. About 26% of employers do not support this for the respondents, and 27% do not receive a W-2 form. These responses are shown in Figure 44.
6%
13%
29%
14% 15%
6% 7%
2% 2% 2% 1% 2%0% 0% 0% 0% 1%
0%
5%
10%
15%
20%
25%
30%
35%
How much do you spend on average per month on transportation?
N = 127
27%
73%
0%
50%
100%
Yes No
Do you spend any of this pre‐tax dollars through your employer?
N = 131
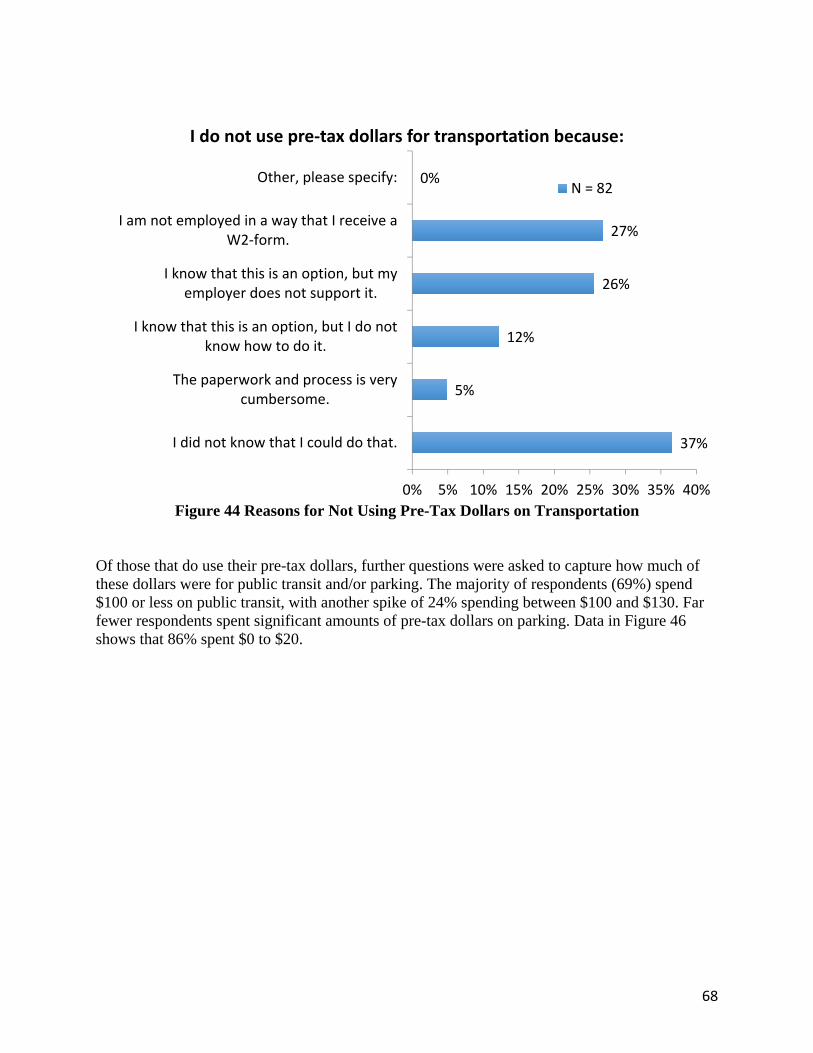
68
Figure 44 Reasons for Not Using Pre-Tax Dollars on Transportation
Of those that do use their pre-tax dollars, further questions were asked to capture how much of these dollars were for public transit and/or parking. The majority of respondents (69%) spend $100 or less on public transit, with another spike of 24% spending between $100 and $130. Far fewer respondents spent significant amounts of pre-tax dollars on parking. Data in Figure 46 shows that 86% spent $0 to $20.
37%
5%
12%
26%
27%
0%
0% 5% 10% 15% 20% 25% 30% 35% 40%
I did not know that I could do that.
The paperwork and process is verycumbersome.
I know that this is an option, but I do notknow how to do it.
I know that this is an option, but myemployer does not support it.
I am not employed in a way that I receive aW2‐form.
Other, please specify:
I do not use pre‐tax dollars for transportation because:
N = 82
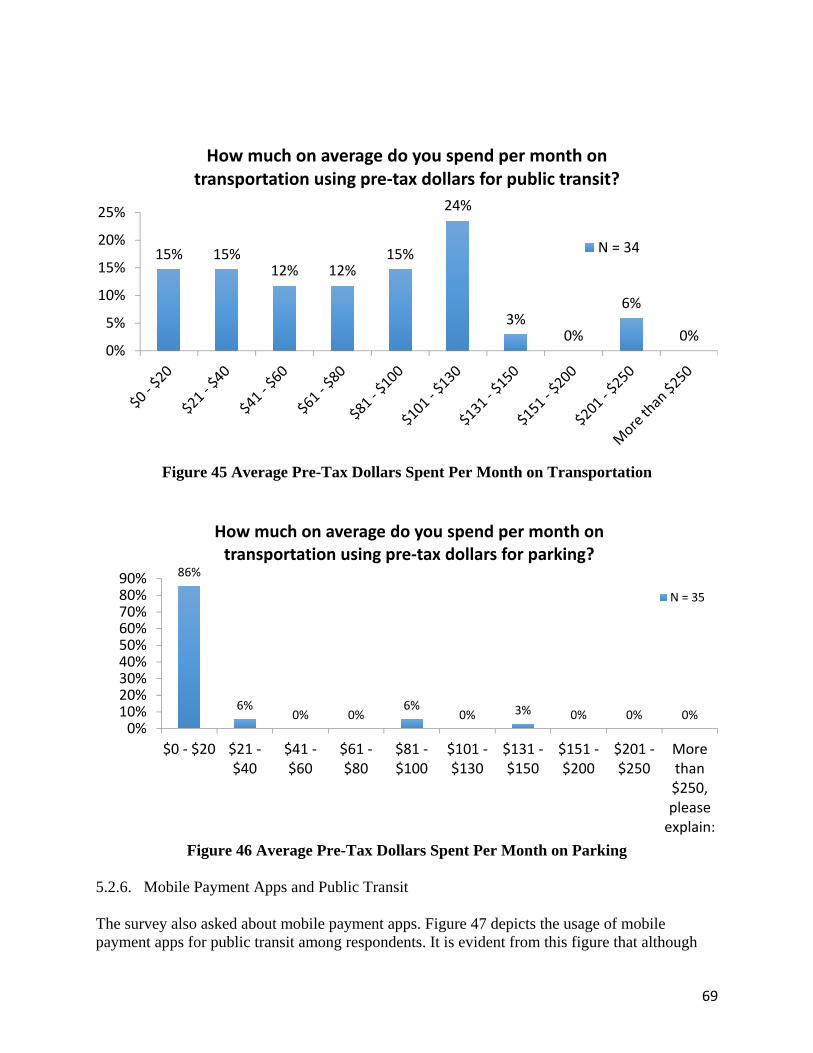
69
Figure 45 Average Pre-Tax Dollars Spent Per Month on Transportation
Figure 46 Average Pre-Tax Dollars Spent Per Month on Parking
5.2.6. Mobile Payment Apps and Public Transit The survey also asked about mobile payment apps. Figure 47 depicts the usage of mobile payment apps for public transit among respondents. It is evident from this figure that although
15% 15%12% 12%
15%
24%
3%0%
6%
0%0%
5%
10%
15%
20%
25%
How much on average do you spend per month on transportation using pre‐tax dollars for public transit?
N = 34
86%
6%0% 0%
6%0% 3% 0% 0% 0%
0%10%20%30%40%50%60%70%80%90%
$0 ‐ $20 $21 ‐$40
$41 ‐$60
$61 ‐$80
$81 ‐$100
$101 ‐$130
$131 ‐$150
$151 ‐$200
$201 ‐$250
Morethan$250,pleaseexplain:
How much on average do you spend per month on transportation using pre‐tax dollars for parking?
N = 35
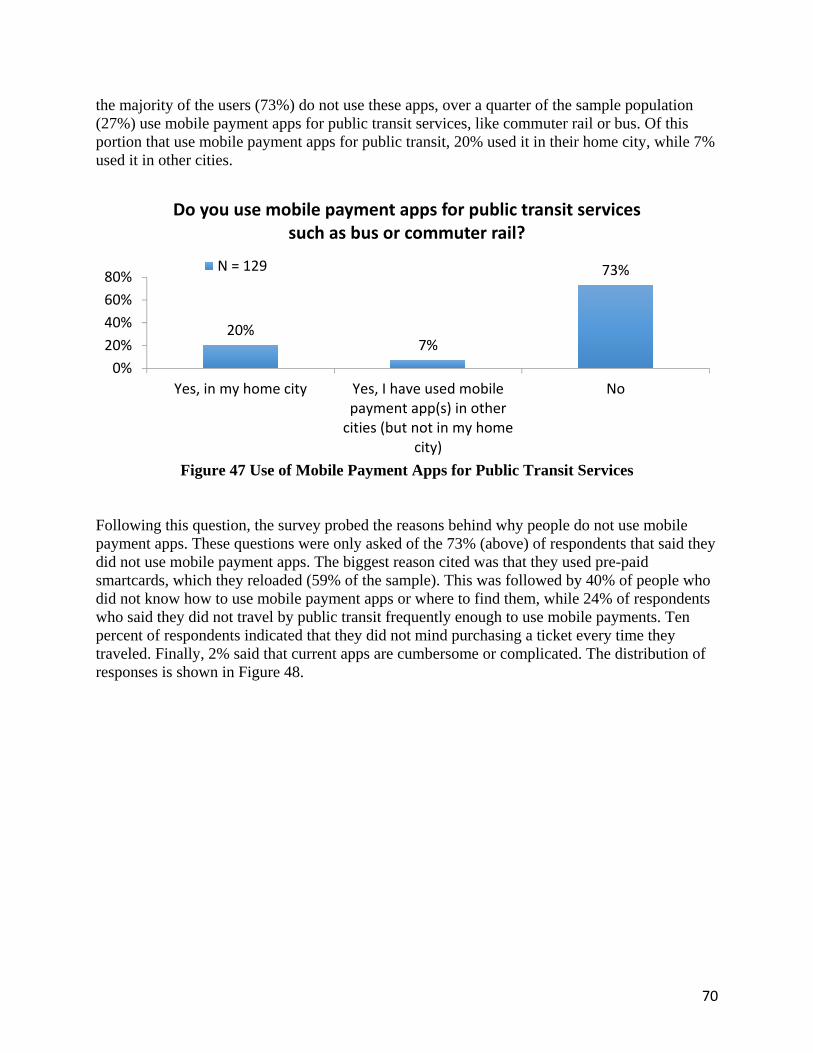
70
the majority of the users (73%) do not use these apps, over a quarter of the sample population (27%) use mobile payment apps for public transit services, like commuter rail or bus. Of this portion that use mobile payment apps for public transit, 20% used it in their home city, while 7% used it in other cities.
Figure 47 Use of Mobile Payment Apps for Public Transit Services
Following this question, the survey probed the reasons behind why people do not use mobile payment apps. These questions were only asked of the 73% (above) of respondents that said they did not use mobile payment apps. The biggest reason cited was that they used pre-paid smartcards, which they reloaded (59% of the sample). This was followed by 40% of people who did not know how to use mobile payment apps or where to find them, while 24% of respondents who said they did not travel by public transit frequently enough to use mobile payments. Ten percent of respondents indicated that they did not mind purchasing a ticket every time they traveled. Finally, 2% said that current apps are cumbersome or complicated. The distribution of responses is shown in Figure 48.
20%7%
73%
0%
20%
40%
60%
80%
Yes, in my home city Yes, I have used mobilepayment app(s) in othercities (but not in my home
city)
No
Do you use mobile payment apps for public transit services such as bus or commuter rail?
N = 129
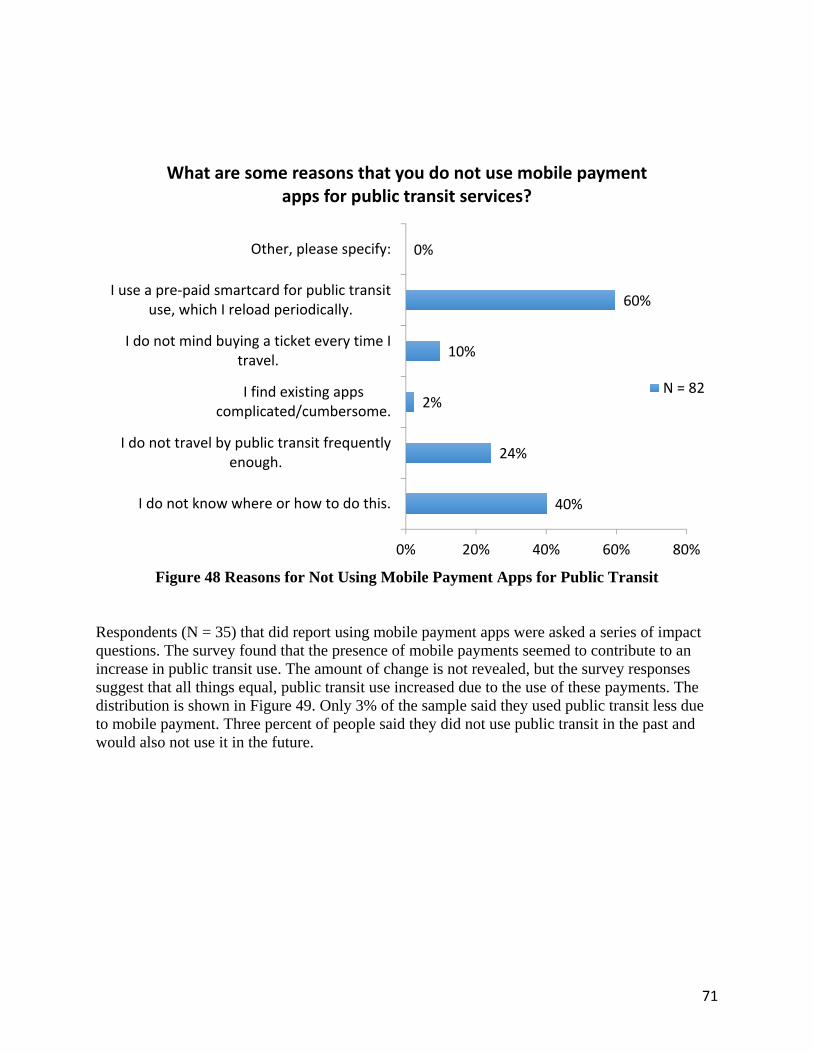
71
Figure 48 Reasons for Not Using Mobile Payment Apps for Public Transit
Respondents (N = 35) that did report using mobile payment apps were asked a series of impact questions. The survey found that the presence of mobile payments seemed to contribute to an increase in public transit use. The amount of change is not revealed, but the survey responses suggest that all things equal, public transit use increased due to the use of these payments. The distribution is shown in Figure 49. Only 3% of the sample said they used public transit less due to mobile payment. Three percent of people said they did not use public transit in the past and would also not use it in the future.
40%
24%
2%
10%
60%
0%
0% 20% 40% 60% 80%
I do not know where or how to do this.
I do not travel by public transit frequentlyenough.
I find existing appscomplicated/cumbersome.
I do not mind buying a ticket every time Itravel.
I use a pre‐paid smartcard for public transituse, which I reload periodically.
Other, please specify:
What are some reasons that you do not use mobile payment apps for public transit services?
N = 82
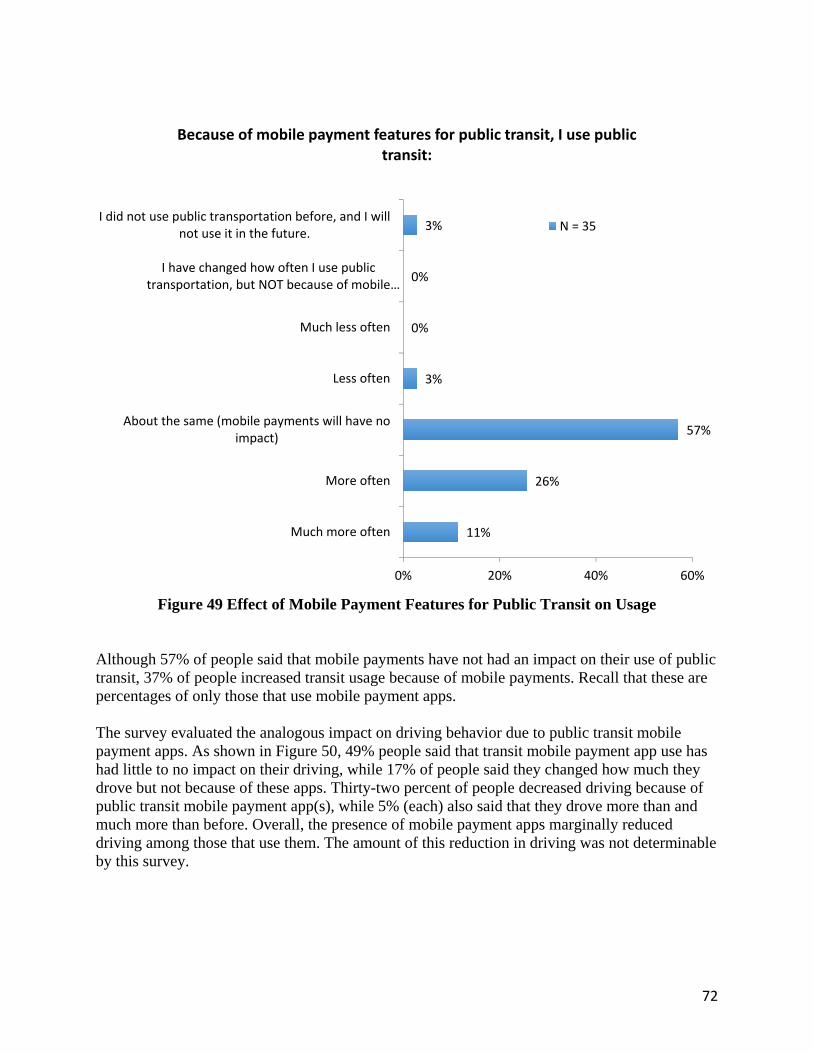
72
Figure 49 Effect of Mobile Payment Features for Public Transit on Usage
Although 57% of people said that mobile payments have not had an impact on their use of public transit, 37% of people increased transit usage because of mobile payments. Recall that these are percentages of only those that use mobile payment apps. The survey evaluated the analogous impact on driving behavior due to public transit mobile payment apps. As shown in Figure 50, 49% people said that transit mobile payment app use has had little to no impact on their driving, while 17% of people said they changed how much they drove but not because of these apps. Thirty-two percent of people decreased driving because of public transit mobile payment app(s), while 5% (each) also said that they drove more than and much more than before. Overall, the presence of mobile payment apps marginally reduced driving among those that use them. The amount of this reduction in driving was not determinable by this survey.
11%
26%
57%
3%
0%
0%
3%
0% 20% 40% 60%
Much more often
More often
About the same (mobile payments will have noimpact)
Less often
Much less often
I have changed how often I use publictransportation, but NOT because of mobile…
I did not use public transportation before, and I willnot use it in the future.
Because of mobile payment features for public transit, I use public transit:
N = 35
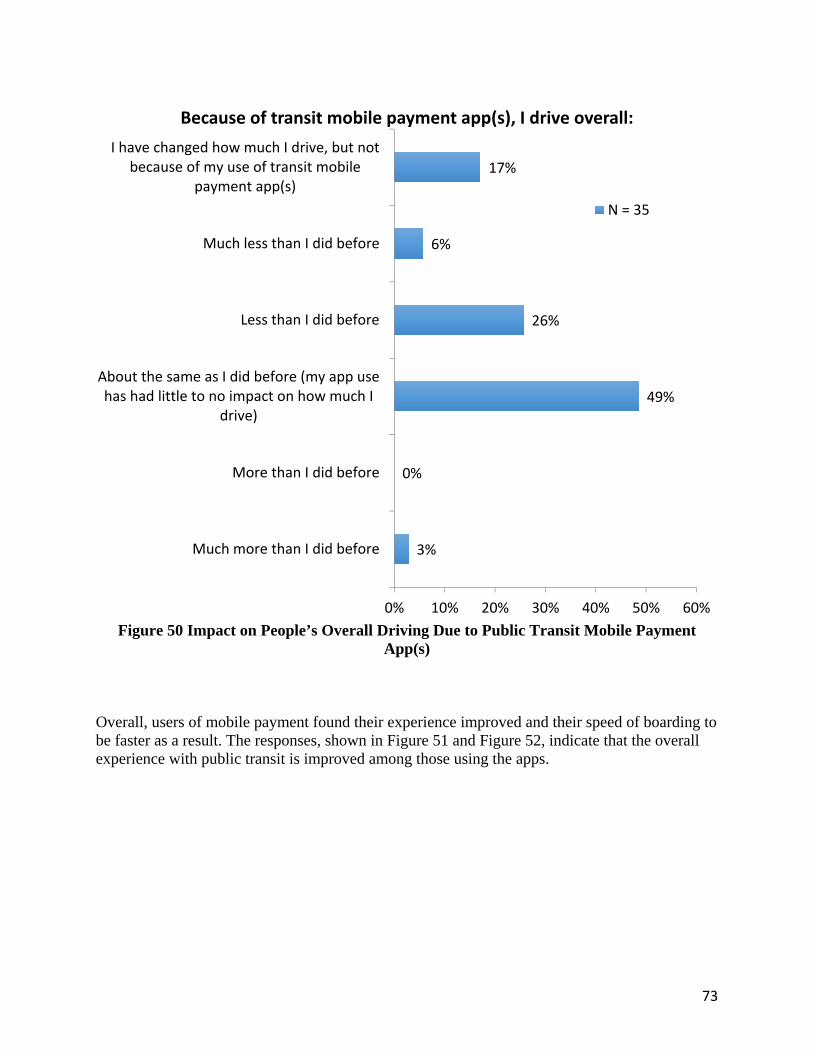
73
Figure 50 Impact on People’s Overall Driving Due to Public Transit Mobile Payment
App(s) Overall, users of mobile payment found their experience improved and their speed of boarding to be faster as a result. The responses, shown in Figure 51 and Figure 52, indicate that the overall experience with public transit is improved among those using the apps.
3%
0%
49%
26%
6%
17%
0% 10% 20% 30% 40% 50% 60%
Much more than I did before
More than I did before
About the same as I did before (my app usehas had little to no impact on how much I
drive)
Less than I did before
Much less than I did before
I have changed how much I drive, but notbecause of my use of transit mobile
payment app(s)
Because of transit mobile payment app(s), I drive overall:
N = 35
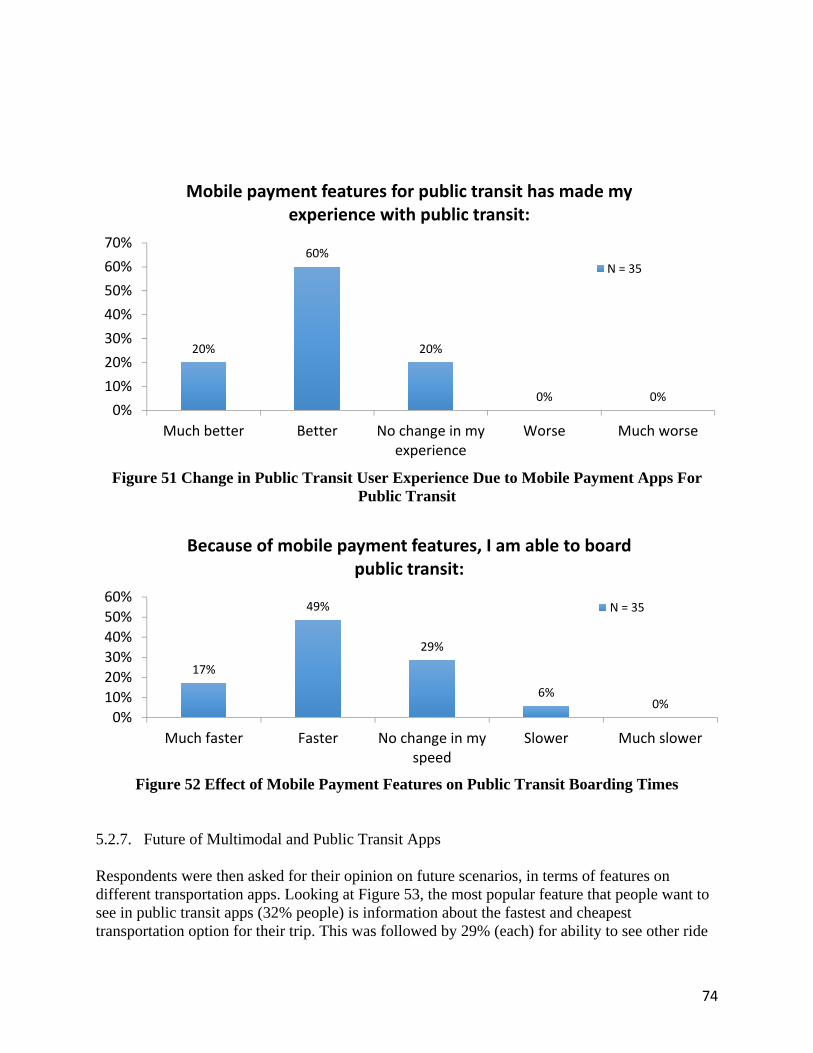
74
Figure 51 Change in Public Transit User Experience Due to Mobile Payment Apps For
Public Transit
Figure 52 Effect of Mobile Payment Features on Public Transit Boarding Times
5.2.7. Future of Multimodal and Public Transit Apps Respondents were then asked for their opinion on future scenarios, in terms of features on different transportation apps. Looking at Figure 53, the most popular feature that people want to see in public transit apps (32% people) is information about the fastest and cheapest transportation option for their trip. This was followed by 29% (each) for ability to see other ride
20%
60%
20%
0% 0%0%
10%
20%
30%
40%
50%
60%
70%
Much better Better No change in myexperience
Worse Much worse
Mobile payment features for public transit has made my experience with public transit:
N = 35
17%
49%
29%
6%0%
0%
10%
20%
30%
40%
50%
60%
Much faster Faster No change in myspeed
Slower Much slower
Because of mobile payment features, I am able to board public transit:
N = 35
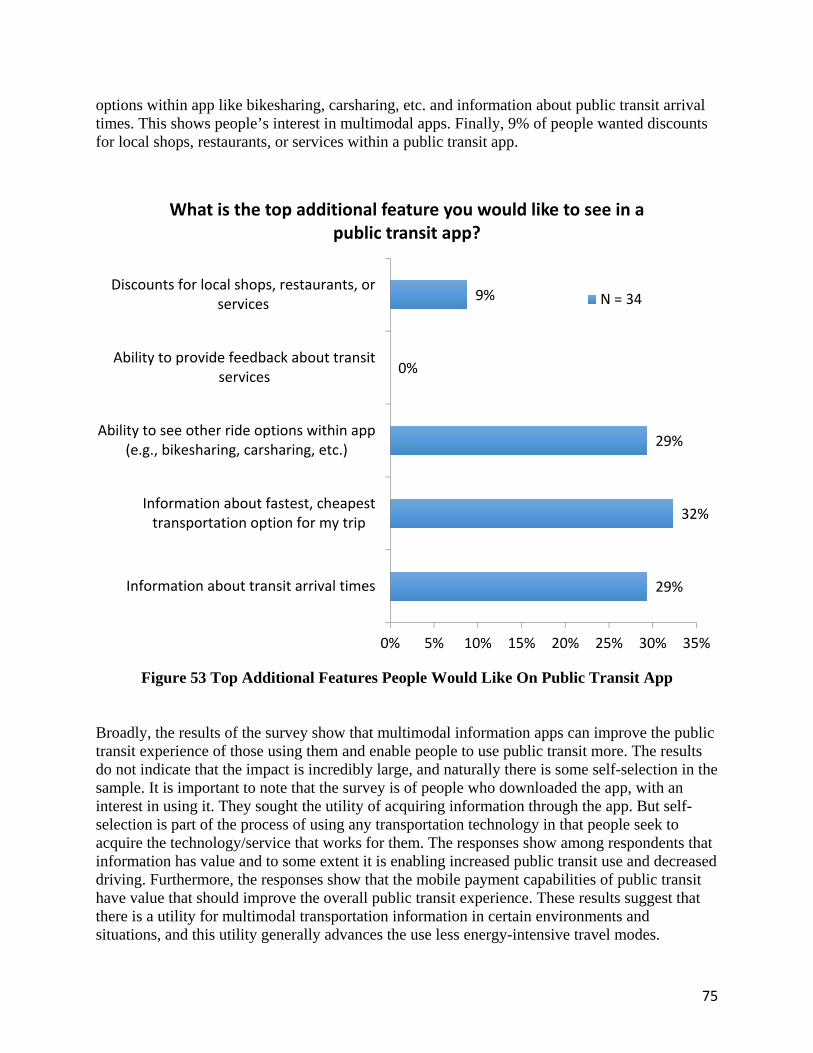
75
options within app like bikesharing, carsharing, etc. and information about public transit arrival times. This shows people’s interest in multimodal apps. Finally, 9% of people wanted discounts for local shops, restaurants, or services within a public transit app.
Figure 53 Top Additional Features People Would Like On Public Transit App
Broadly, the results of the survey show that multimodal information apps can improve the public transit experience of those using them and enable people to use public transit more. The results do not indicate that the impact is incredibly large, and naturally there is some self-selection in the sample. It is important to note that the survey is of people who downloaded the app, with an interest in using it. They sought the utility of acquiring information through the app. But self-selection is part of the process of using any transportation technology in that people seek to acquire the technology/service that works for them. The responses show among respondents that information has value and to some extent it is enabling increased public transit use and decreased driving. Furthermore, the responses show that the mobile payment capabilities of public transit have value that should improve the overall public transit experience. These results suggest that there is a utility for multimodal transportation information in certain environments and situations, and this utility generally advances the use less energy-intensive travel modes.
29%
32%
29%
0%
9%
0% 5% 10% 15% 20% 25% 30% 35%
Information about transit arrival times
Information about fastest, cheapesttransportation option for my trip
Ability to see other ride options within app(e.g., bikesharing, carsharing, etc.)
Ability to provide feedback about transitservices
Discounts for local shops, restaurants, orservices
What is the top additional feature you would like to see in a public transit app?
N = 34
76
6. Conclusions and Key Takeaways Smartphone apps are transforming urban mobility in the 21st century. Beginning with early traveler information systems, technology has evolved from simple driving and static public transit information into dynamic, personal, multimodal trip planning and guidance apps. There has been an evolution in the development of these applications. Building on information derived from first generation single-mode applications, multimodal applications are beginning to integrate real-time information from a number of different sources. Shared mobility services, rapidly expanding in urban areas, are adding to the options now available to travelers. As these applications continue to develop, their integration with the broader array of real-time transportation information and mobile payment systems will undoubtedly improve. Research has begun to evaluate the impacts of these improved applications of multimodal information as the market continues to evolve. Through a review of the literature, an analysis of multimodal apps, a series of expert interviews, and a user survey of former RideScout users, this report documents several key findings. The United States has long been recognized as a car dependent society, and public policy could focus on moving travelers along the “spectrum” toward increased multimodalism, even within the more car dependent households of the country. Smartphone apps prevalent today can be used toward that end, providing real-time information to travelers and lowering barriers to multimodalism. Specifically, mobility apps are providing multimodal trip planning, incentivizing alternative travel modes and non-peak-period travel, and enhancing trust among shared mobility services. The interviews conducted among experts at transportation planning agencies, private transportation companies, and software development companies revealed the importance of data sharing without necessitating one-size-fits-all agreements among companies/agencies with varying goals. Most companies interviewed already had a type of data sharing collaboration with a city planning agency to share data including: origin-destination pairs, modal share, and known factors for users choosing a particular mode, as well as trip time and distance. Data privacy has remained a concern noted by both the public and private experts interviewed. Nevertheless, all the experts surveyed agreed that end users can benefit from a better data sharing platform between the public and private sectors. They agreed that data sharing for urban planning has unprecedented potential. The user survey sheds light on the way people use multimodal trip aggregators and how data dynamic data sharing platforms can improve the real-time feed for these aggregator apps. The demographic profile of respondents found them to young, but not exceptionally young, with 50% of respondents 40 years old or older. The sample was well educated, with 79% of respondents having a 4-year degree or higher. The sample was 86% Caucasian, with relatively high incomes, 42% of respondents earning a household income of at least $100,000. Hence, users of such apps are likely not representative of the general population. The survey explored how and when
77
people used multimodal apps to make travel decisions. The survey found that among the most common purposes for recent trips planned included: in-town social recreational activities, commute to and from work, and go to and from work-related meetings during the day. The survey found that the time of use of the apps during the day was an unremarkable distribution that is consistent with the general peak and off-peak periods of daily travel. With respect to the day of week, the survey found that there was a slight balance toward Friday use. Otherwise the apps were more broadly used during week days, with only 13% of use on weekends. The survey found that users used public transit more and drove less as a result of using multimodal apps. About 38% of the sample reported driving less frequently as a result of a multimodal information app, while 4% reported driving more and the rest reported no change. Analogously, more respondents reported that they use bus and urban rail more because of multimodal transportation apps. In addition, more respondents reported that they walk and bicycle more, as well. Very few respondents (less than 10% in all cases) reported that they decreased their use of these modes as a result of their app usage. Half of the respondents reported that these apps had reduced their wait times with public transit, while only 6% had reported an increase. The survey explored mobile payments within these apps for public transit. We found among those that had used the apps, a vast majority had an improved experience and faster boarding time with public transit. Overall, the results suggest that multimodal apps have some potential to improve the function and utility of public transit, even if the population using the software is a subset of the broader traveling public. Smartphone apps have become a mainstay of the mobile experience. With increasing choices and in capabilities, the utility of apps has enhanced the experience and capacity of people to achieve important daily objectives standing almost anywhere in the country. These benefits have broadly extended to transportation in a very real way, with a number of different multimodal apps that have expanded access to operational information about mobility options, with urban transportation, as well as freight, sharing, insurance, gamification, among other arenas. We found among mobile app users that these enhancements have a benefit to the user experience, as well as to the broader transportation system. The apps were found to reduce driving and increase public transit use, even if only among a minority of users. The broad conclusion is that information, as provided on these platforms, can make a difference in a positive way. The magnitude of this difference is a function of the quality of the app, the quality of the public transit system, and the utility of the information provided. It is clear that information can play a role in advancing public policy objectives related to reducing the energy intensity of mobility. Expanding commuter benefits to incentivize multimodal trips could encourage the use of a broader variety of modes and services. This could be enabled by allowing smartphone apps access to pre-tax commuter accounts (e.g., journeys could be paid for by using pre-tax payroll deductions), employer-provided use (e.g., mechanisms that allow employers to pay for commute expenses directly to an app service provider), and providing app-based commuter incentives linked to a user’s modal choice (e.g., incentives for carpooling or riding public transit, calculated and awarded based on a person’s app account). These policies and other technical enhancements may work together to improve public transit operations and provide greater mobility at a reduced personal and environmental cost.
78
References APTA (2013) Millennials and Mobility: Understanding the Millennial Mindset. American Public Transit Association. Buehler, R. and Hamre, A. (2015). The multimodal majority? Driving, walking, cycling, and public transportation use among American adults. Transportation, Vol. 42, No. 6, pp. 1081-1101. Buehler, R. and A. Hamre (2013) “Trends and Determinants of Multimodal Travel in the USA,” Mid- Atlantic University Transportation Research Consortium, University Park, PA. Build Me a Site (2014) “Citymapper: London’s Best Travel App?” Build Me a Site, 2014, Availabe at http://buildmeasite.com/citymapper-londons-best-travel-app/. Butcher, M. (2015) “Trucker Path Raises $20M to Claim The Uber of Truckers Moniker” TechCrunch, June 30th, 2015. https://techcrunch.com/2015/06/30/trucker-path-raises-20m-to-claim-the-uber-for-truckers-moniker/ Chorus, C. G., Molin, E. J. E., and Van Wee, B. (2006). Use and Effects of Advanced Traveller Information Services (ATIS): A Review of the Literature. Transport Reviews, Vol. 26, No. 2, pp. 127-149. Diana, M. and Mokhtarian, P. L. (2009). Desire to change one’s multimodality and its relationship to the use of different transport means. Transportation Research Part F, No. 12, pp. 107-119. FHWA (2016). Smartphone Applications to Influence Travel Choices: Practices and Policies. Report No. FHWA-HOP-16-023, Federal Highway Administration, U.S. Department of Transportation, March 2016. FHWA Office of Highway Policy Information (2014) Traffic Volume Trends. November 2013. California Division of Traffic Operations (2014) Traffic Counts. Traffic and Vehicle Data Systems Unit. Caltrans. Kuhnimhof, T., Buehler, R., Wirtz, M., and Kalinowska, D. (2012). Travel trends among young adults in Germany: increasing multimodality and declining car use for men. Journal of Transportation Geography, No. 24, pp. 443–450. Kuhnimhof, T., Chlond, B., and von der Ruhren, S. (2006). Users of transport modes and multimodal travel behavior steps toward understanding travelers’ options and choices. Transportation Research Record, No. 1985, pp. 40-48.
79
MacTrast (2015). “Review: TripGo – Route & Transit Planner for iOS Devices.” MacTrast, April 22, 2015, available at: http://www.mactrast.com/2015/04/review-tripgo-route-transit-planner/. Marczewski, A. (2012). Gamification: A Simple Introduction and a Bit More. Seattle, WA: Amazon Digital Services. Nobis, C. (2007). Multimodality: facets and causes of sustainable mobility behavior. Transportation Research Record, No. 2010, pp. 35-44. Nuzzolo, A., Crisalli, U., Comi, A., and Rosati, L. (2014). An Advanced Traveler Advisory Tool Based on Individual Preferences. XI Congreso de Ingenieria del Transporte (CIT 2014), Vol. 160, pp. 539-547. Shaheen, S. and M. Christensen. (2014) “The Future of Transportation Has Two Big Barriers to Entry,” Atlantic Cities, http://www.theatlanticcities.com/commute/2014/04/true-future-transportation- has-two-big-barriers-entry/8933/2014. Shaheen S., N. Chan, A. Bansal and A. Cohen (2014). “Shared Mobility A Sustainability & Technologies Workshop: Definitions, Industry Developments and Early Understanding” Smith, A. (2015). “U.S. Smartphone Use in 2015,” Pew Research Center, April 1, 2015, http://www.pewinternet.org/2015/04/01/us-smartphone-use-in-2015/.