mnps high school student performance trends
TRANSCRIPT
MNPS Department of Research, Assessment & Evaluation - 8/17/2015 1
MNPS High School Student Performance Trends
This report reviews the performance of Metropolitan Nashville Public Schools (MNPS) high school
students in recent years for a variety of academic and non-academic measures. Assessment results from
state high school End of Course (EOC) exams and ACT college entrance exams are included in the report,
as well as high school graduation rates and dropout rates. Non-academic measures include student
attendance rates and discipline rates.
End of Course Exams
The Tennessee Department of Education (TDOE) mandates that End of Course exams be administered at
the end of the school year in several high school courses. The state adopted new exams aligned to new
state academic standards in English/Language Arts, Mathematics and Science in the 2009-10 school
year. New EOC assessments were administered that year in English I, English II, Algebra I, and Biology I.
In 2011-12, the state added exams in English III and Algebra II. The newest EOC exam, Chemistry, was
first administered in the 2013-14 school year.
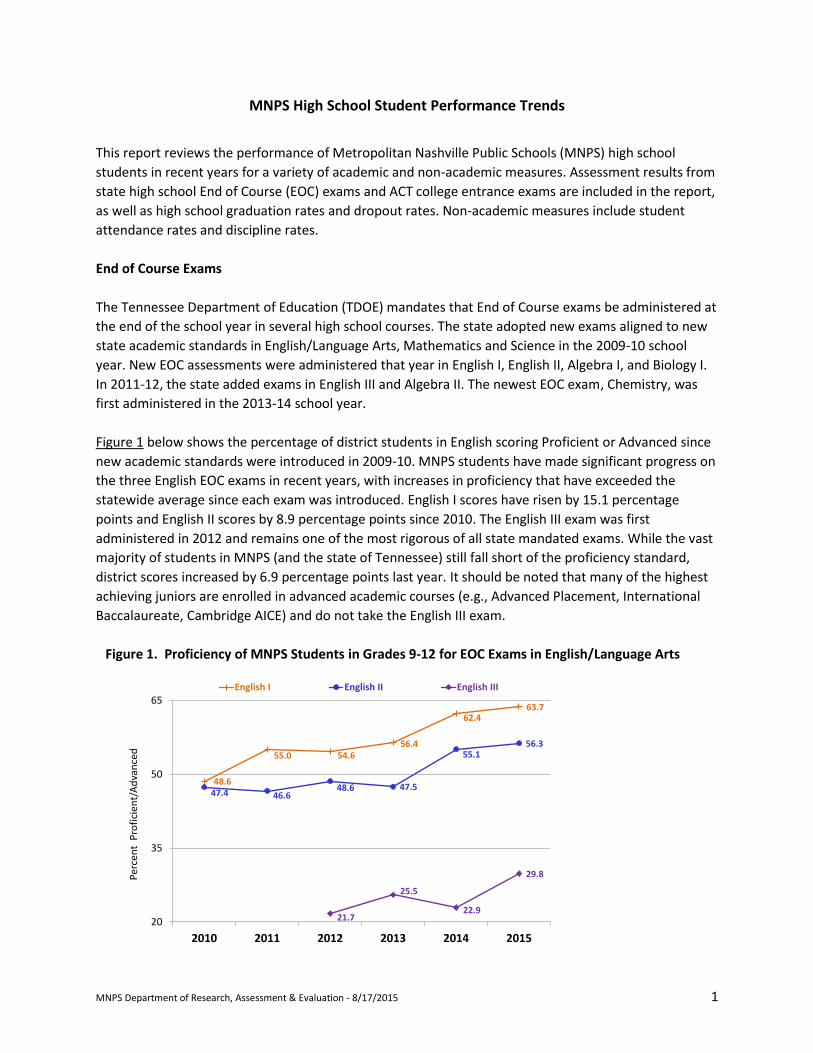
Figure 1 below shows the percentage of district students in English scoring Proficient or Advanced since
new academic standards were introduced in 2009-10. MNPS students have made significant progress on
the three English EOC exams in recent years, with increases in proficiency that have exceeded the
statewide average since each exam was introduced. English I scores have risen by 15.1 percentage
points and English II scores by 8.9 percentage points since 2010. The English III exam was first
administered in 2012 and remains one of the most rigorous of all state mandated exams. While the vast
majority of students in MNPS (and the state of Tennessee) still fall short of the proficiency standard,
district scores increased by 6.9 percentage points last year. It should be noted that many of the highest
achieving juniors are enrolled in advanced academic courses (e.g., Advanced Placement, International
Baccalaureate, Cambridge AICE) and do not take the English III exam.
Figure 1. Proficiency of MNPS Students in Grades 9-12 for EOC Exams in English/Language Arts
48.6
55.0 54.656.4
62.463.7
47.4 46.648.6 47.5
55.156.3
21.7
25.5
22.9
29.8
20
35
50
65
2010 2011 2012 2013 2014 2015
Perc
ent
Pro
fici
ent/
Ad
van
ced
English I English II English III
MNPS Department of Research, Assessment & Evaluation - 8/17/2015 2
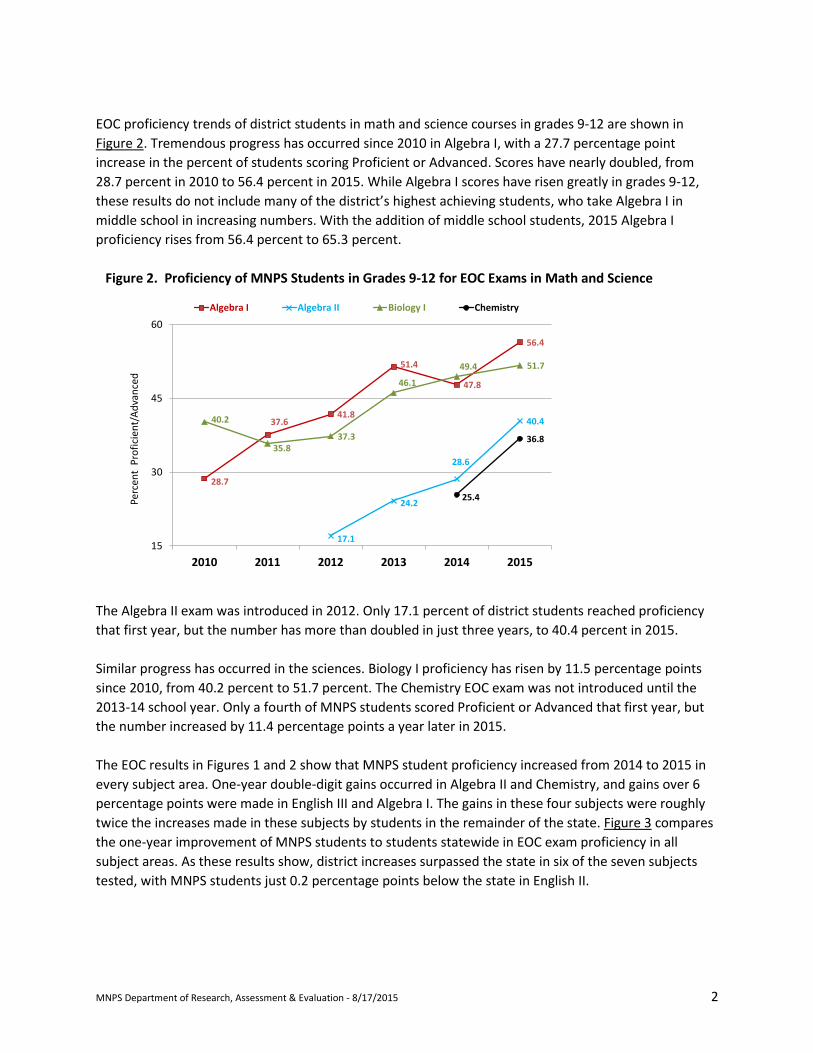
EOC proficiency trends of district students in math and science courses in grades 9-12 are shown in
Figure 2. Tremendous progress has occurred since 2010 in Algebra I, with a 27.7 percentage point
increase in the percent of students scoring Proficient or Advanced. Scores have nearly doubled, from
28.7 percent in 2010 to 56.4 percent in 2015. While Algebra I scores have risen greatly in grades 9-12,
these results do not include many of the district’s highest achieving students, who take Algebra I in
middle school in increasing numbers. With the addition of middle school students, 2015 Algebra I
proficiency rises from 56.4 percent to 65.3 percent.
Figure 2. Proficiency of MNPS Students in Grades 9-12 for EOC Exams in Math and Science
The Algebra II exam was introduced in 2012. Only 17.1 percent of district students reached proficiency
that first year, but the number has more than doubled in just three years, to 40.4 percent in 2015.
Similar progress has occurred in the sciences. Biology I proficiency has risen by 11.5 percentage points
since 2010, from 40.2 percent to 51.7 percent. The Chemistry EOC exam was not introduced until the
2013-14 school year. Only a fourth of MNPS students scored Proficient or Advanced that first year, but
the number increased by 11.4 percentage points a year later in 2015.
The EOC results in Figures 1 and 2 show that MNPS student proficiency increased from 2014 to 2015 in
every subject area. One-year double-digit gains occurred in Algebra II and Chemistry, and gains over 6
percentage points were made in English III and Algebra I. The gains in these four subjects were roughly
twice the increases made in these subjects by students in the remainder of the state. Figure 3 compares
the one-year improvement of MNPS students to students statewide in EOC exam proficiency in all
subject areas. As these results show, district increases surpassed the state in six of the seven subjects
tested, with MNPS students just 0.2 percentage points below the state in English II.
28.7
37.641.8
51.4
47.8
56.4
17.1
24.2
28.6
40.440.2
35.837.3
46.1
49.4 51.7
25.4
36.8
15
30
45
60
2010 2011 2012 2013 2014 2015
Perc
ent
Pro
fici
ent/
Ad
van
ced
Algebra I Algebra II Biology I Chemistry

MNPS Department of Research, Assessment & Evaluation - 8/17/2015 3
Figure 3. Comparison of MNPS and Tennessee 1-Year EOC Proficiency Increases in 2014-2015
Achievement Gap
While there continue to be significant achievement gaps between various traditionally disadvantaged
student subgroups and their peers in MNPS, these gaps are smaller than those statewide for every one
of the eight high school achievement gap measures included in the state accountability system. For each
of two broad subject areas, Algebra (Algebra I and Algebra II EOC results combined) and English (English
II and English III EOCs combined), the TDOE computes the gap in proficiency between a student
subgroup and its comparison group for four different subgroups – an Ethnic subgroup composed of
Black, Hispanic and Native American students; Economically Disadvantaged students; Limited English
Proficient students (LEP); and Students with Disabilities (SWD). Figure 4 compares the achievement gaps
for each of these four subgroups in each of the two subject areas.
Figure 4. Comparison of MNPS and Tennessee High School Achievement Gaps in 2014-2015
1.3% 1.2%
6.9%
8.6%
11.8%
2.3%
11.4%
0.4%1.4%
3.6% 3.2%
6.3%
1.7%
6.5%
-2%
0%
2%
4%
6%
8%
10%
12%
English I English II English III Algebra I Algebra II Biology I Chemistry
% P
/A In
crea
seGrades 9-12MNPS TN
13
16
22
25
32
42
37
42
5
7
15
22
25
34
32
31
0 10 20 30 40 50
Ethnic (Alg I/Alg II)
Ethnic (Eng II/Eng III)
Econ Disadv (Alg I/Alg II)
Econ Disadv (Eng II/Eng III)
LEP (Alg I/Alg II)
LEP (Eng II/Eng III)
SWD (Alg I/Alg II)
SWD (Eng II/Eng III)
Gap in Percent Proficient/Advanced
MNPS
TN
Wider GapNo Gap
MNPS Department of Research, Assessment & Evaluation - 8/17/2015 4
The one-year results for 2014-15 show that both Black and Hispanic students in MNPS had increases in
proficiency in each subject area and closed the achievement gap in both Algebra and English. The same
was true for the Economically Disadvantaged subgroup. Limited English Proficient students had higher
proficiency and closed the gap in English courses, but not in high school math. Students with Disabilities
had higher achievement in most subject areas but did not close the achievement gap.
ACT Exam
Students in Tennessee public schools are required to take the ACT college entrance exam before exiting
high school. District results are not yet available for the senior class of 2015, but Table 1 shows the
number of students tested in each of the five previous classes, the average score for each subject and
the Composite, and the percentage of students scoring a 21 or above on the Composite. A score of 21 is
the minimum score required for a Tennessee student to qualify for a Hope Scholarship and is often used
as a benchmark for college readiness.
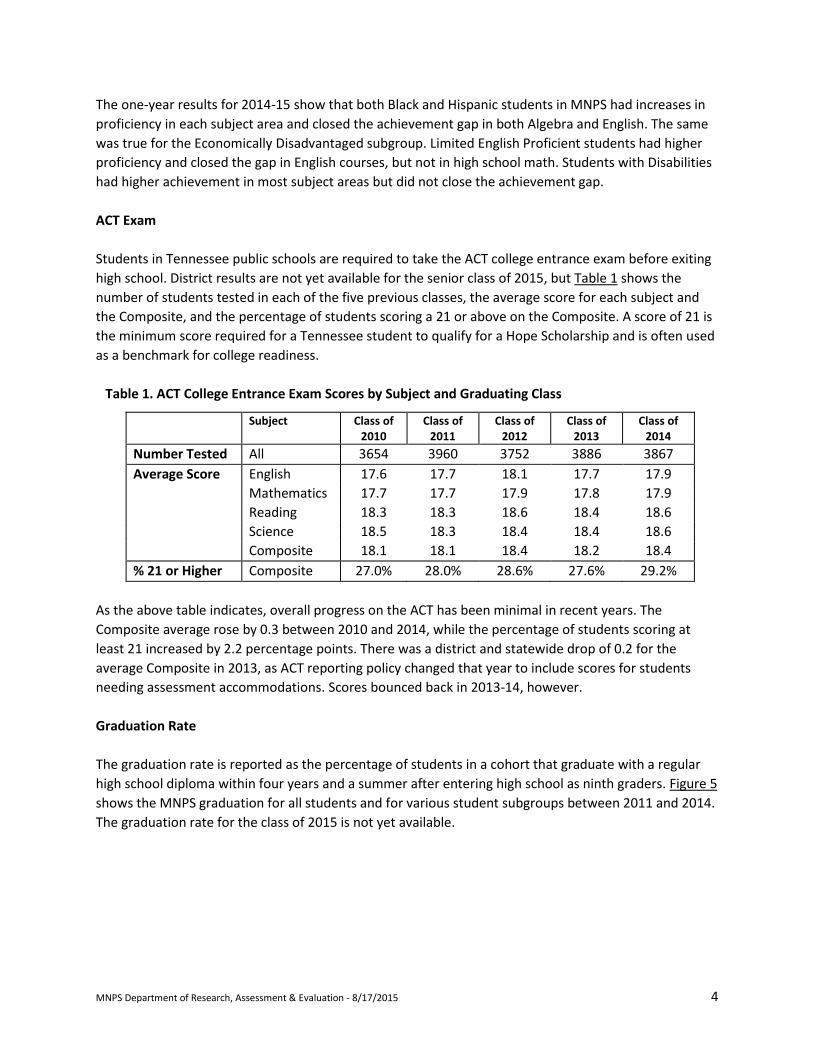
Table 1. ACT College Entrance Exam Scores by Subject and Graduating Class
Subject Class of 2010
Class of 2011
Class of 2012
Class of 2013
Class of 2014
Number Tested All 3654 3960 3752 3886 3867
Average Score English 17.6 17.7 18.1 17.7 17.9
Mathematics 17.7 17.7 17.9 17.8 17.9
Reading 18.3 18.3 18.6 18.4 18.6
Science 18.5 18.3 18.4 18.4 18.6
Composite 18.1 18.1 18.4 18.2 18.4
% 21 or Higher Composite 27.0% 28.0% 28.6% 27.6% 29.2%
As the above table indicates, overall progress on the ACT has been minimal in recent years. The
Composite average rose by 0.3 between 2010 and 2014, while the percentage of students scoring at
least 21 increased by 2.2 percentage points. There was a district and statewide drop of 0.2 for the
average Composite in 2013, as ACT reporting policy changed that year to include scores for students
needing assessment accommodations. Scores bounced back in 2013-14, however.
Graduation Rate
The graduation rate is reported as the percentage of students in a cohort that graduate with a regular
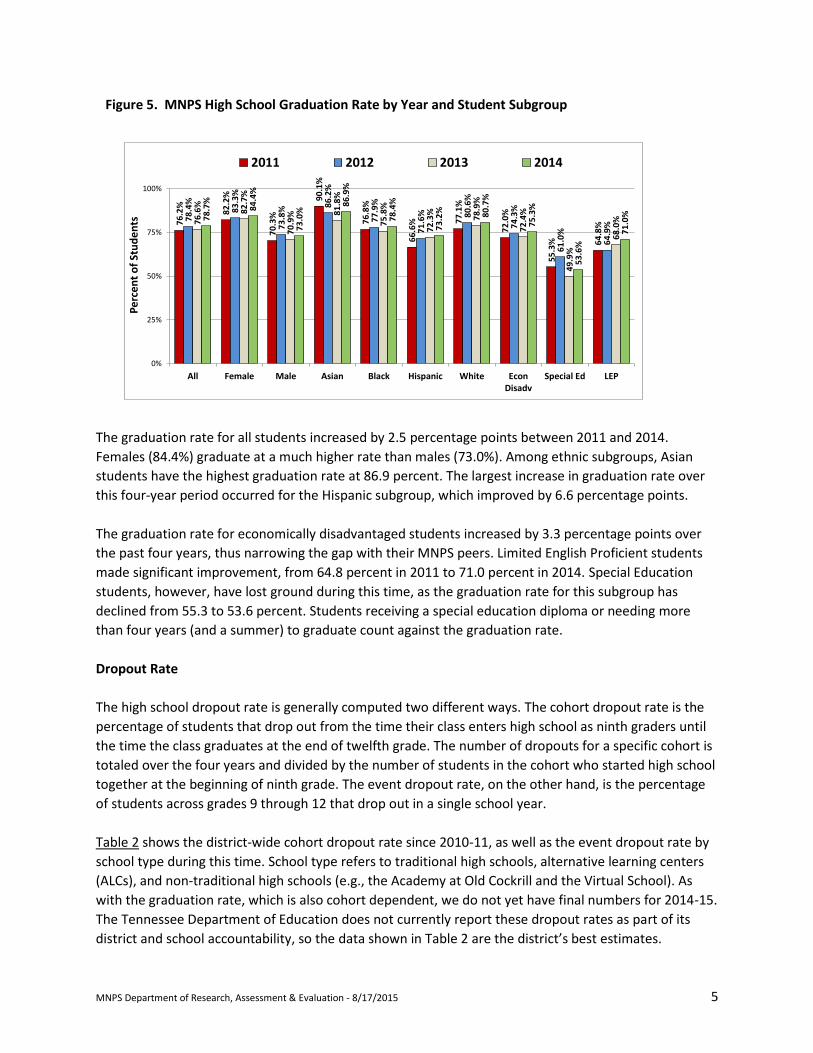
high school diploma within four years and a summer after entering high school as ninth graders. Figure 5
shows the MNPS graduation for all students and for various student subgroups between 2011 and 2014.
The graduation rate for the class of 2015 is not yet available.
MNPS Department of Research, Assessment & Evaluation - 8/17/2015 5
Figure 5. MNPS High School Graduation Rate by Year and Student Subgroup
The graduation rate for all students increased by 2.5 percentage points between 2011 and 2014.
Females (84.4%) graduate at a much higher rate than males (73.0%). Among ethnic subgroups, Asian
students have the highest graduation rate at 86.9 percent. The largest increase in graduation rate over
this four-year period occurred for the Hispanic subgroup, which improved by 6.6 percentage points.
The graduation rate for economically disadvantaged students increased by 3.3 percentage points over
the past four years, thus narrowing the gap with their MNPS peers. Limited English Proficient students
made significant improvement, from 64.8 percent in 2011 to 71.0 percent in 2014. Special Education
students, however, have lost ground during this time, as the graduation rate for this subgroup has
declined from 55.3 to 53.6 percent. Students receiving a special education diploma or needing more
than four years (and a summer) to graduate count against the graduation rate.
Dropout Rate
The high school dropout rate is generally computed two different ways. The cohort dropout rate is the
percentage of students that drop out from the time their class enters high school as ninth graders until
the time the class graduates at the end of twelfth grade. The number of dropouts for a specific cohort is
totaled over the four years and divided by the number of students in the cohort who started high school
together at the beginning of ninth grade. The event dropout rate, on the other hand, is the percentage
of students across grades 9 through 12 that drop out in a single school year.
Table 2 shows the district-wide cohort dropout rate since 2010-11, as well as the event dropout rate by
school type during this time. School type refers to traditional high schools, alternative learning centers
(ALCs), and non-traditional high schools (e.g., the Academy at Old Cockrill and the Virtual School). As
with the graduation rate, which is also cohort dependent, we do not yet have final numbers for 2014-15.
The Tennessee Department of Education does not currently report these dropout rates as part of its
district and school accountability, so the data shown in Table 2 are the district’s best estimates.
76
.2%
82
.2%
70
.3%
90
.1%
76
.8%
66
.6% 7
7.1
%
72
.0%
55
.3% 6
4.8
%
78
.4%
83
.3%
73
.8%
86
.2%
77
.9%
71
.6% 80
.6%
74
.3%
61
.0%
64
.9%7
6.6
%
82
.7%
70
.9% 8
1.8
%
75
.8%
72
.3%
78
.9%
72
.4%
49
.9%
68
.0%7
8.7
%
84
.4%
73
.0%
86
.9%
78
.4%
73
.2% 80
.7%
75
.3%
53
.6%
71
.0%
0%
25%
50%
75%
100%
All Female Male Asian Black Hispanic White EconDisadv
Special Ed LEP
Pe
rce
nt
of
Stu
de
nts
2011 2012 2013 2014

MNPS Department of Research, Assessment & Evaluation - 8/17/2015 6
Table 2. High School Cohort and Event Dropout Rates by Year
2010-2011 2011-2012 2012-2013 2013-2014 2014-2015
Cohort Dropout Rate 15.7% 14.9% 15.9% 15.7% NA
Event Dropout Rate
Traditional HS 2.1% 1.9% 2.1% 2.4% 2.2%
ALC 0.1% 0.0% 0.6% 0.3% 0.6%
Non-Traditional HS 10.8% 7.9% 7.5% 9.0% 10.8%
As one can see in Table 2, dropout rates have been relatively steady in recent years. Over the four years
they are expected to remain in high school, the district typically loses between 15 and 16 percent of its
students. Roughly two percent of students drop out of traditional high schools each year, while between
seven and 11 percent of students in non-traditional high schools drop out annually.
Student Attendance
Student attendance is well documented to be positively correlated to student achievement. The average
daily attendance rate of high school students over the past five years is shown in Table 3, by school type.
This rate indicates the percentage of enrolled students in attendance on an average day during the
school year. As the first row of the table shows, approximately 93 percent of high school students are in
attendance daily in traditional high schools. Non-traditional high schools typically have a slightly higher
attendance rate, while attendance is significantly lower in alternative learning centers.
Table 3. High School Average Daily Attendance by School Type and Year
2010-2011 2011-2012 2012-2013 2013-2014 2014-2015
Traditional HS 92.6% 93.1% 93.2% 93.3% 92.9%
ALC 73.8% 76.9% 74.3% 81.1% 78.9%
Non-Traditional HS 92.1% 96.1% 95.4% 94.9% 93.2%
Average daily attendance, of course, does not tell the whole story of student attendance, as there is
tremendous variation in the number of days that students are absent during the course of the school
year. Educating students to high standards is obviously difficult when they are chronically absent from
school. The district generally defines chronic absence as a rate of absence that meets or exceeds 10
percent of the days the student is enrolled.
Table 4 presents the distribution of days absent among students in traditional high schools for each of
the past five school years. As one can see, the percentage of students with perfect attendance has fallen
somewhat during this time to 9 percent in 2014-15. The number of students with 15-19 days absent
increased last year from 4 percent in previous years to 5 percent, and there was also a 2 percentage
point increase in the number of students missing 20 or more days.

MNPS Department of Research, Assessment & Evaluation - 8/17/2015 7
Table 4. Traditional High School Student Distribution of Number of Days Absent
# Days Absent 2010-2011 2011-2012 2012-2013 2013-2014 2014-2015
0 13% 14% 12% 10% 9% 1 - 4 43% 43% 42% 42% 39% 5 - 9 25% 25% 26% 28% 28%
10 - 14 10% 9% 10% 10% 11% 15 - 19 4% 4% 4% 4% 5%
20 or more 5% 5% 5% 5% 7%
Student Discipline
Table 5 provides five years of discipline data for high school students. The first section of the table
shows the number of discipline incidents reported each school year, by school type. The second portion
of the table shows the percentage of students involved in one or more discipline incidents during the
year. These results show a steady decline in both the number of incidents and the number of students
involved in traditional high schools, particularly in the past four years. The number of incidents has
declined by more than eleven thousand since 2011-12, while the percentage of students has dropped
from 46.1 percent to 39.9 percent during this time.
Table 5. High School Discipline Counts by School Type and Year
2010-2011 2011-2012 2012-2013 2013-2014 2014-2015
Number of Incidents
Traditional HS 49,183 49,307 42,750 40,059 38,019
ALC 1,013 1,272 1,550 1,520 1,335
Non-Traditional HS 2 1 138 141 64
Percent of Students
Traditional HS 45.0% 46.1% 44.4% 42.6% 39.9%
ALC 46.5% 51.2% 54.2% 53.1% 53.2%
Non-Traditional HS 0.3% 0.1% 5.4% 5.1% 3.3%