mlpa crestwood investor presentation_june 2016
TRANSCRIPT
Presentation Title Presentation Subtitle
Crestwood Midstream Partners LP Crestwood Equity Partners LP
Connections for America’s Energy ™
™
Presentation Title Presentation Subtitle
Crestwood Midstream Partners LP Crestwood Equity Partners LP
Connections for America’s Energy ™
™
Presentation Title Presentation Subtitle
Crestwood Midstream Partners LP Crestwood Equity Partners LP
Connections for America’s Energy ™
™
5/31/2016
Presentation Title Presentation Subtitle
Crestwood Midstream Partners LP Crestwood Equity Partners LP
Connections for America’s Energy ™
™
Presentation Title Presentation Subtitle
Crestwood Midstream Partners LP Crestwood Equity Partners LP
Connections for America’s Energy ™
™ Connections for America’s Energy ™
™
Investor Presentation June 2016
Connections for America’s Energy ™ ™ ™ ™ ™ ™
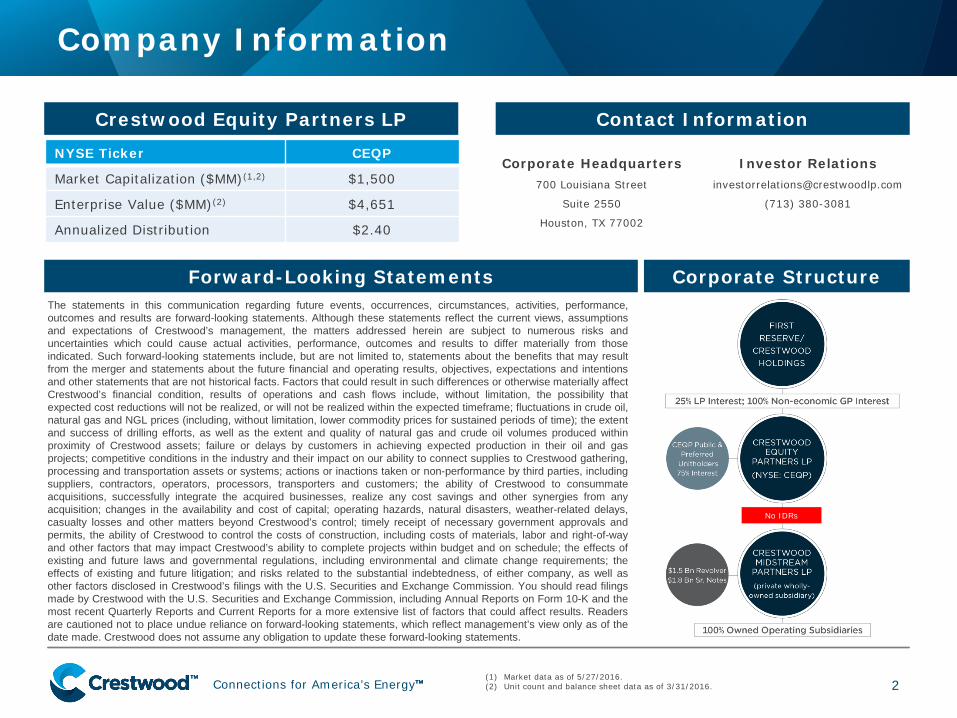
The statements in this communication regarding future events, occurrences, circumstances, activities, performance, outcomes and results are forward-looking statements. Although these statements reflect the current views, assumptions and expectations of Crestwood’s management, the matters addressed herein are subject to numerous risks and uncertainties which could cause actual activities, performance, outcomes and results to differ materially from those indicated. Such forward-looking statements include, but are not limited to, statements about the benefits that may result from the merger and statements about the future financial and operating results, objectives, expectations and intentions and other statements that are not historical facts. Factors that could result in such differences or otherwise materially affect Crestwood’s financial condition, results of operations and cash flows include, without limitation, the possibility that expected cost reductions will not be realized, or will not be realized within the expected timeframe; fluctuations in crude oil, natural gas and NGL prices (including, without limitation, lower commodity prices for sustained periods of time); the extent and success of drilling efforts, as well as the extent and quality of natural gas and crude oil volumes produced within proximity of Crestwood assets; failure or delays by customers in achieving expected production in their oil and gas projects; competitive conditions in the industry and their impact on our ability to connect supplies to Crestwood gathering, processing and transportation assets or systems; actions or inactions taken or non-performance by third parties, including suppliers, contractors, operators, processors, transporters and customers; the ability of Crestwood to consummate acquisitions, successfully integrate the acquired businesses, realize any cost savings and other synergies from any acquisition; changes in the availability and cost of capital; operating hazards, natural disasters, weather-related delays, casualty losses and other matters beyond Crestwood’s control; timely receipt of necessary government approvals and permits, the ability of Crestwood to control the costs of construction, including costs of materials, labor and right-of-way and other factors that may impact Crestwood’s ability to complete projects within budget and on schedule; the effects of existing and future laws and governmental regulations, including environmental and climate change requirements; the effects of existing and future litigation; and risks related to the substantial indebtedness, of either company, as well as other factors disclosed in Crestwood’s filings with the U.S. Securities and Exchange Commission. You should read filings made by Crestwood with the U.S. Securities and Exchange Commission, including Annual Reports on Form 10-K and the most recent Quarterly Reports and Current Reports for a more extensive list of factors that could affect results. Readers are cautioned not to place undue reliance on forward-looking statements, which reflect management’s view only as of the date made. Crestwood does not assume any obligation to update these forward-looking statements.
Company Information
2
Forward-Looking Statements
Contact Information
Corporate Headquarters 700 Louisiana Street
Suite 2550
Houston, TX 77002
(1) Market data as of 5/27/2016. (2) Unit count and balance sheet data as of 3/31/2016.
Crestwood Equity Partners LP NYSE Ticker CEQP
Market Capitalization ($MM)(1,2) $1,500
Enterprise Value ($MM)(2) $4,651
Annualized Distribution $2.40
Investor Relations [email protected]
(713) 380-3081
No IDRs
Corporate Structure
Connections for America’s Energy ™ ™ ™ ™ ™ ™
Key Investor Highlights
3

Connections for America’s Energy ™ ™ ™ ™ ™ ™
Key Investor Highlights
4
• Financially sound midstream MLP
• Low-cost partnership structure
• Diversified business portfolio
• Strong balance sheet
• Leading distribution coverage
• Strong GP/BoD/MGMT sponsorship
~$450MM 2016E Adjusted EBITDA(1)
3.9x 2016E Leverage Ratio
1.7x FY 2016 Coverage Ratio; 1.4x Fully-Diluted
No GP IDRs
Significant Insider Ownership; ~32% LP units
Marcellus, Bakken, Delaware-Permian, PRB Niobrara, Barnett, Fayetteville
(1) Please see accompanying tables of non-GAAP reconciliations.
Connections for America’s Energy ™ ™ ™ ™ ™ ™
Competitive Repositioning Strategy
5
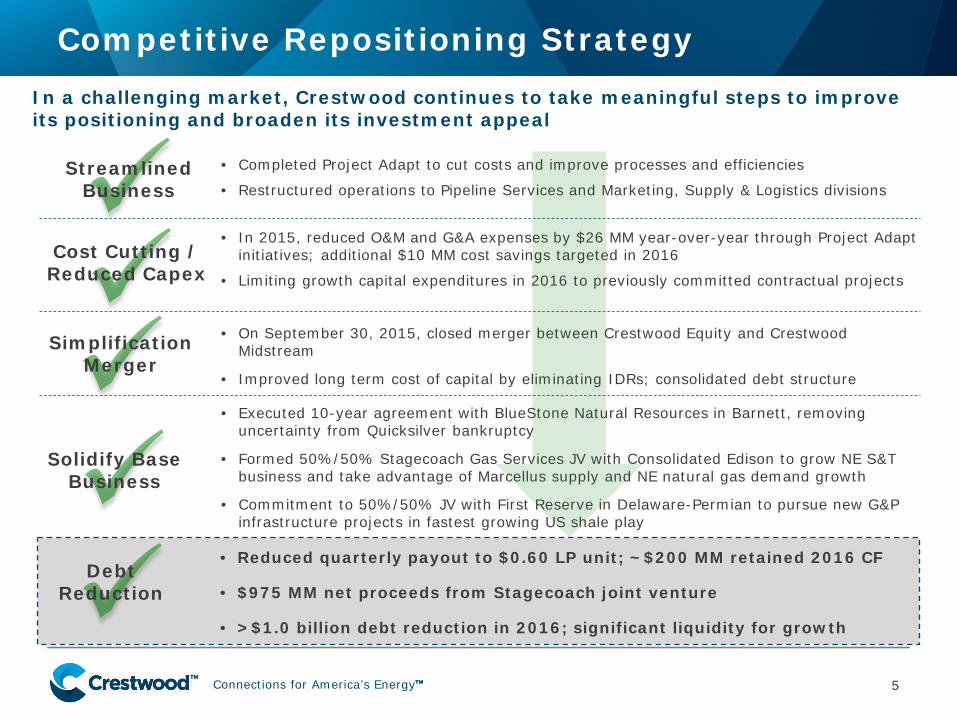
In a challenging market, Crestwood continues to take meaningful steps to improve its positioning and broaden its investment appeal
• In 2015, reduced O&M and G&A expenses by $26 MM year-over-year through Project Adapt initiatives; additional $10 MM cost savings targeted in 2016
• Limiting growth capital expenditures in 2016 to previously committed contractual projects
Simplification Merger
Cost Cutting / Reduced Capex
• Completed Project Adapt to cut costs and improve processes and efficiencies
• Restructured operations to Pipeline Services and Marketing, Supply & Logistics divisions
• On September 30, 2015, closed merger between Crestwood Equity and Crestwood Midstream
• Improved long term cost of capital by eliminating IDRs; consolidated debt structure
Debt Reduction
• Reduced quarterly payout to $0.60 LP unit; ~$200 MM retained 2016 CF
• $975 MM net proceeds from Stagecoach joint venture
• >$1.0 billion debt reduction in 2016; significant liquidity for growth
Streamlined Business
• Executed 10-year agreement with BlueStone Natural Resources in Barnett, removing uncertainty from Quicksilver bankruptcy
• Formed 50%/50% Stagecoach Gas Services JV with Consolidated Edison to grow NE S&T business and take advantage of Marcellus supply and NE natural gas demand growth
• Commitment to 50%/50% JV with First Reserve in Delaware-Permian to pursue new G&P infrastructure projects in fastest growing US shale play
Solidify Base Business

Connections for America’s Energy ™ ™ ™ ™ ™ ™
Transformation in the Numbers…
6
FY 2015
4.8x Leverage Ratio
3.8x Leverage Ratio
0.96x Coverage Ratio
1.9x Coverage Ratio
$400MM Available Liquidity(3)
$735MM Available Liquidity(3)
65% Cash Flow Margin(1)
70% Cash Flow Margin(1)
FY 2014
PF Q1 2016(2)
Q1 2016
O&M and G&A Cost Savings
Substantial Deleveraging
Sustainable Distribution
(1) Cash flow margin is calculated by dividing Adj. EBITDA into Net Revenue. (2) Assumes Con Edison joint venture closes on June 1, 2016 and proceeds of $975 million
are used to pay down debt. (3) Calculated as borrowing capacity pursuant to Crestwood’s financial leverage covenant of
5.5x. Crestwood has $1.5Bn of commitments available under its revolving credit facility.
Connections for America’s Energy ™ ™ ™ ™ ™ ™
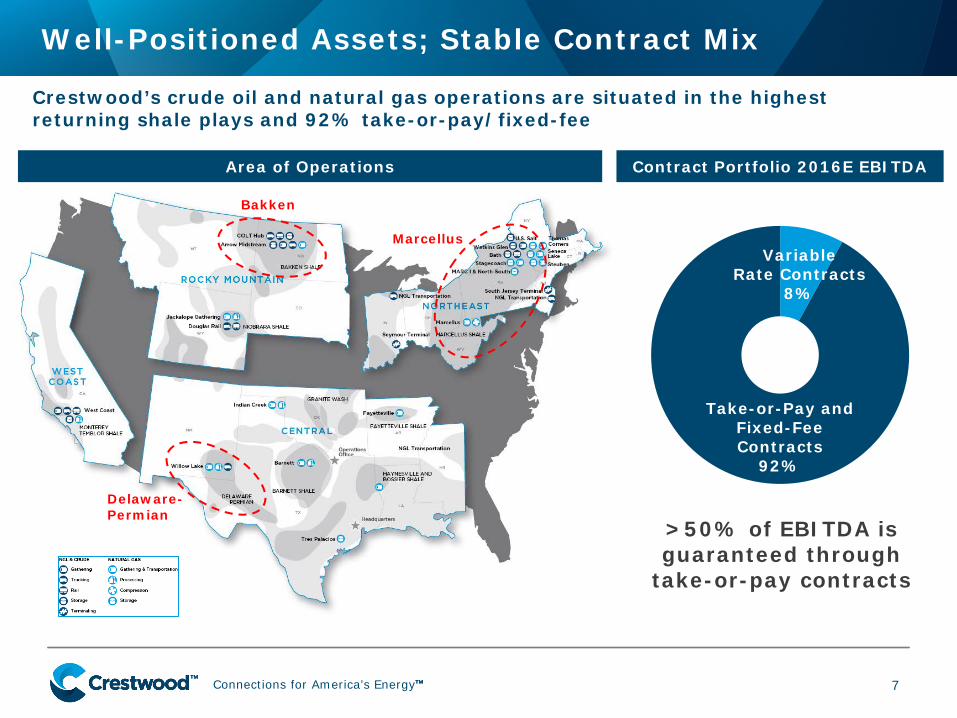
Well-Positioned Assets; Stable Contract Mix
7
Contract Portfolio 2016E EBITDA
Variable Rate Contracts
8%
Take-or-Pay and Fixed-Fee Contracts
92%
>50% of EBITDA is guaranteed through
take-or-pay contracts
Area of Operations
Crestwood’s crude oil and natural gas operations are situated in the highest returning shale plays and 92% take-or-pay/fixed-fee
Delaware-Permian
Bakken
Marcellus
Connections for America’s Energy ™ ™ ™ ™ ™ ™
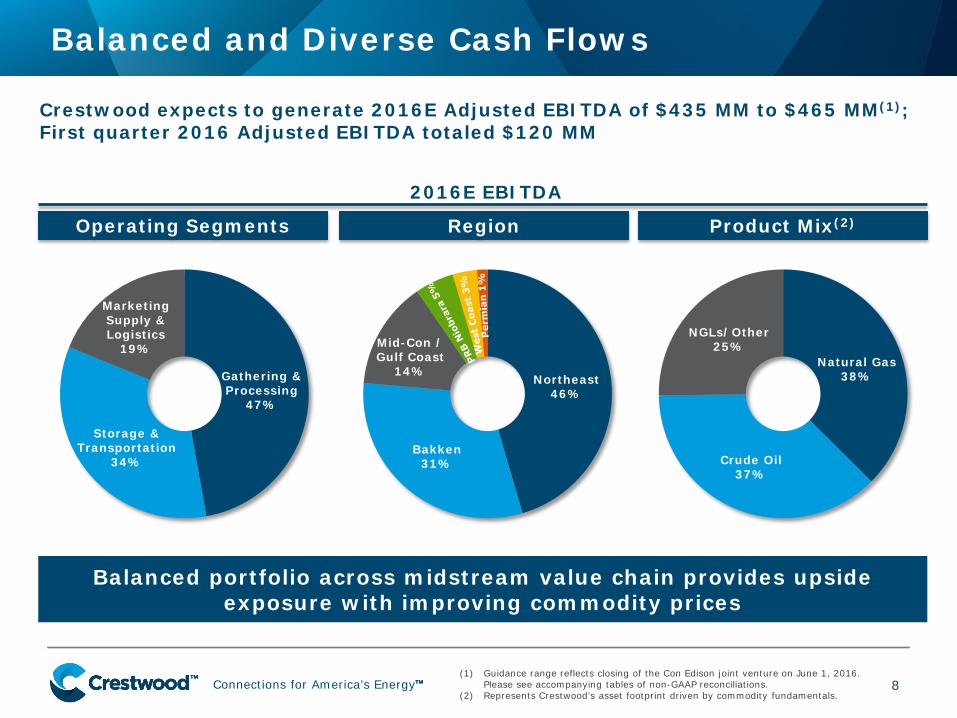
Balanced and Diverse Cash Flows
8
Crestwood expects to generate 2016E Adjusted EBITDA of $435 MM to $465 MM(1); First quarter 2016 Adjusted EBITDA totaled $120 MM
Gathering & Processing
47%
Storage & Transportation
34%
Marketing Supply & Logistics
19%
2016E EBITDA
Natural Gas 38%
Crude Oil 37%
NGLs/Other 25%
Balanced portfolio across midstream value chain provides upside exposure with improving commodity prices
(1) Guidance range reflects closing of the Con Edison joint venture on June 1, 2016. Please see accompanying tables of non-GAAP reconciliations.
(2) Represents Crestwood’s asset footprint driven by commodity fundamentals.
Operating Segments Region Product Mix(2)
Northeast 46%
Bakken 31%
Mid-Con / Gulf Coast
14%
Connections for America’s Energy ™ ™ ™ ™ ™ ™
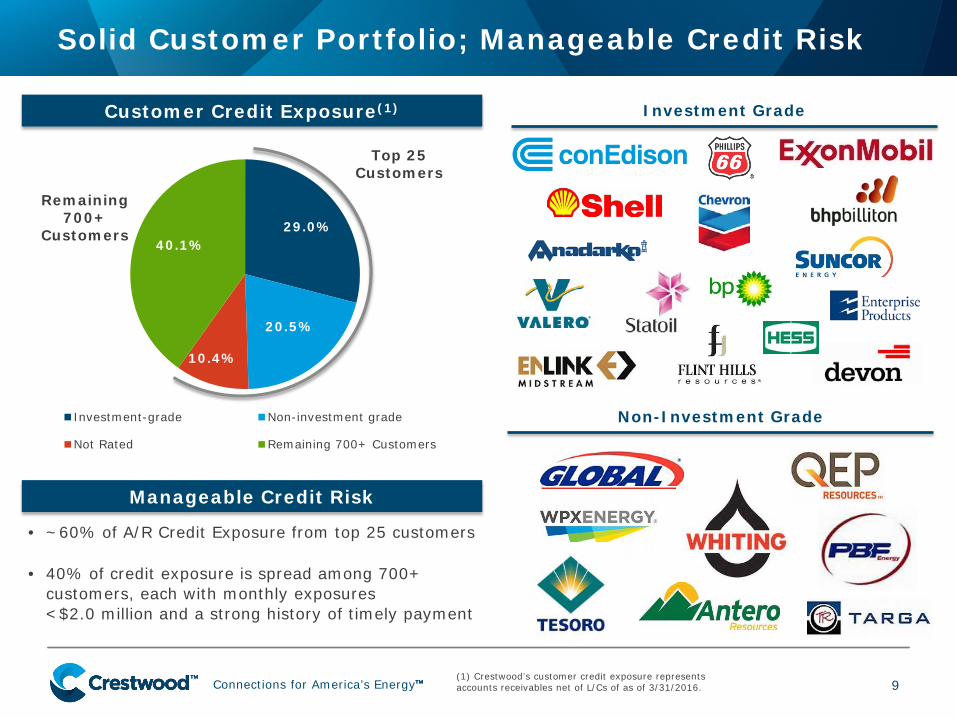
Solid Customer Portfolio; Manageable Credit Risk
9
29.0%
20.5%
10.4%
40.1%
Investment-grade Non-investment grade
Not Rated Remaining 700+ Customers
• ~60% of A/R Credit Exposure from top 25 customers
• 40% of credit exposure is spread among 700+ customers, each with monthly exposures <$2.0 million and a strong history of timely payment
Top 25 Customers
Remaining 700+
Customers
(1) Crestwood’s customer credit exposure represents accounts receivables net of L/Cs of as of 3/31/2016.
Customer Credit Exposure(1)
Manageable Credit Risk
Investment Grade
Non-Investment Grade
Connections for America’s Energy ™ ™ ™ ™ ™ ™
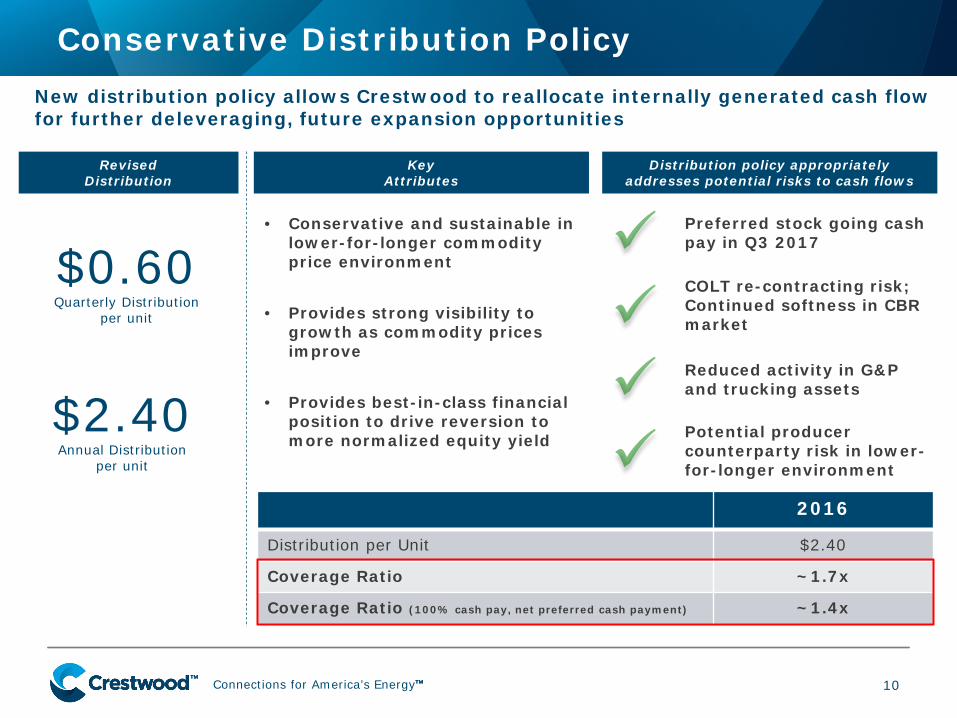
Conservative Distribution Policy
10
Preferred stock going cash pay in Q3 2017
COLT re-contracting risk; Continued softness in CBR market
Reduced activity in G&P and trucking assets
Potential producer counterparty risk in lower-for-longer environment
Distribution policy appropriately addresses potential risks to cash flows
$0.60 Quarterly Distribution
per unit
$2.40 Annual Distribution
per unit
Revised Distribution
Key Attributes
2016
Distribution per Unit $2.40
Coverage Ratio ~1.7x
Coverage Ratio (100% cash pay, net preferred cash payment) ~1.4x
• Conservative and sustainable in lower-for-longer commodity price environment
• Provides strong visibility to growth as commodity prices improve
• Provides best-in-class financial position to drive reversion to more normalized equity yield
New distribution policy allows Crestwood to reallocate internally generated cash flow for further deleveraging, future expansion opportunities
Connections for America’s Energy ™ ™ ™ ™ ™ ™
Top-Tier Balance Sheet and Coverage Ratio
11
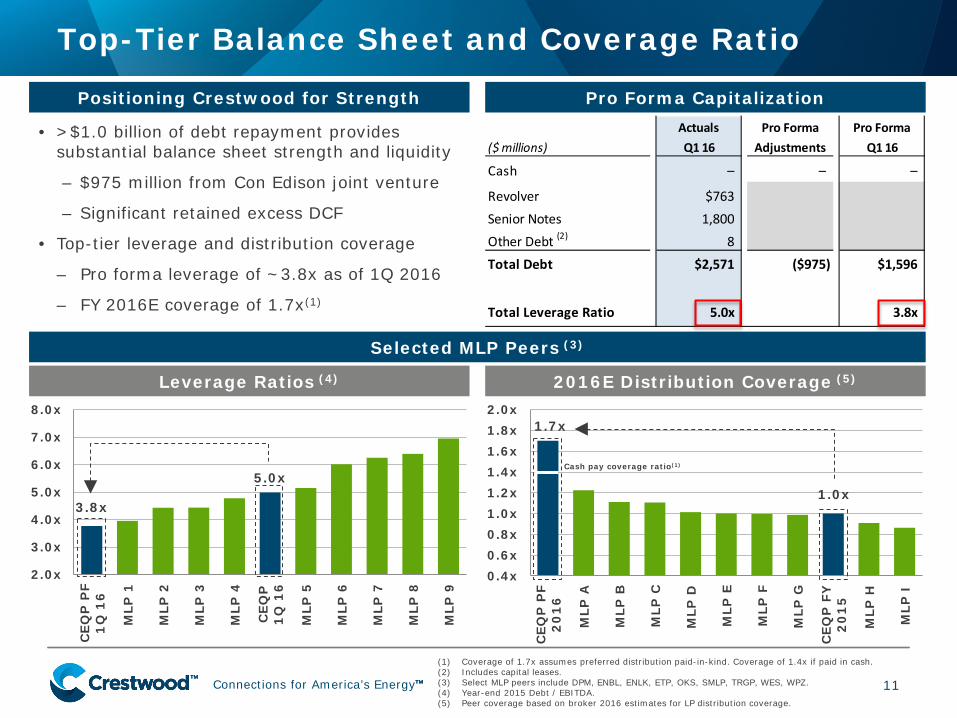
(1) Coverage of 1.7x assumes preferred distribution paid-in-kind. Coverage of 1.4x if paid in cash. (2) Includes capital leases. (3) Select MLP peers include DPM, ENBL, ENLK, ETP, OKS, SMLP, TRGP, WES, WPZ. (4) Year-end 2015 Debt / EBITDA. (5) Peer coverage based on broker 2016 estimates for LP distribution coverage.
Actuals Pro Forma Pro Forma($ millions) Q1 16 Adjustments Q1 16
Cash – – –
Revolver $763Senior Notes 1,800Other Debt (2) 8Total Debt $2,571 ($975) $1,596
Total Leverage Ratio 5.0x 3.8x
1.7x
1.0x
0.4x0.6x0.8x1.0x1.2x1.4x1.6x1.8x2.0x
CEQ
P P
F2
01
6
MLP
A
MLP
B
MLP
C
MLP
D
MLP
E
MLP
F
MLP
G
CEQ
P F
Y2
01
5
MLP
H
MLP
I
Selected MLP Peers (3)
• >$1.0 billion of debt repayment provides substantial balance sheet strength and liquidity
– $975 million from Con Edison joint venture
– Significant retained excess DCF
• Top-tier leverage and distribution coverage
– Pro forma leverage of ~3.8x as of 1Q 2016
– FY 2016E coverage of 1.7x(1)
Pro Forma Capitalization Positioning Crestwood for Strength
3.8x
5.0x
2.0x
3.0x
4.0x
5.0x
6.0x
7.0x
8.0x
CEQ
P P
F1
Q 1
6
MLP
1
MLP
2
MLP
3
MLP
4
CEQ
P1
Q 1
6
MLP
5
MLP
6
MLP
7
MLP
8
MLP
9
Leverage Ratios (4) 2016E Distribution Coverage (5)
Cash pay coverage ratio(1)
Connections for America’s Energy ™ ™ ™ ™ ™ ™
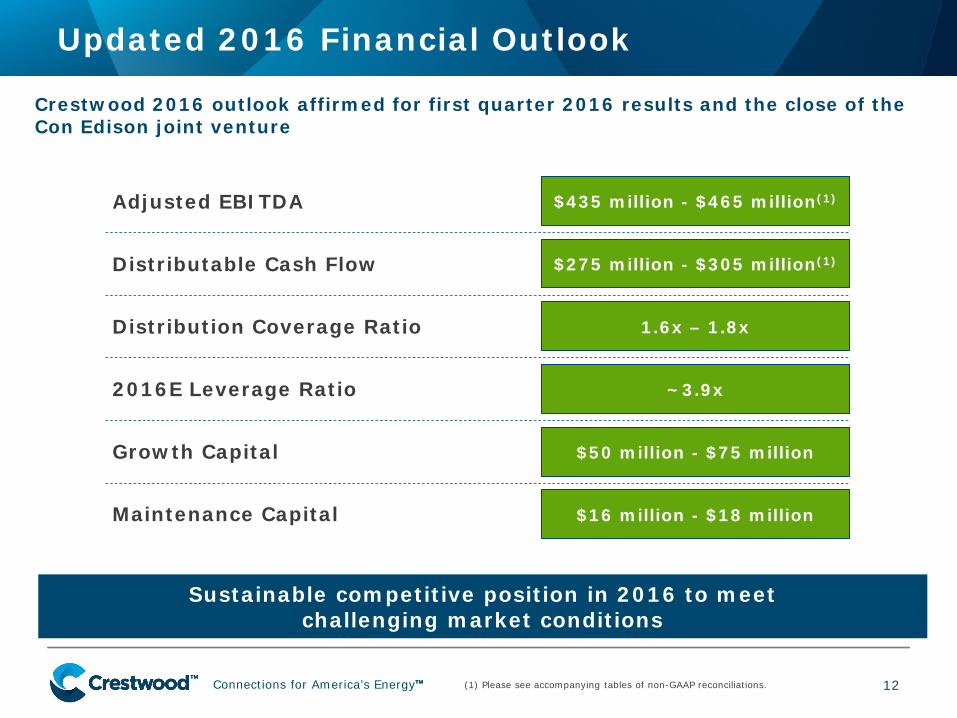
Updated 2016 Financial Outlook
12
Crestwood 2016 outlook affirmed for first quarter 2016 results and the close of the Con Edison joint venture
Sustainable competitive position in 2016 to meet challenging market conditions
Adjusted EBITDA
Distributable Cash Flow
Distribution Coverage Ratio
2016E Leverage Ratio
Growth Capital
Maintenance Capital
1.6x – 1.8x
~3.9x
$50 million - $75 million
$16 million - $18 million
(1) Please see accompanying tables of non-GAAP reconciliations.
$435 million - $465 million(1)
$275 million - $305 million(1)
Connections for America’s Energy ™ ™ ™ ™ ™ ™
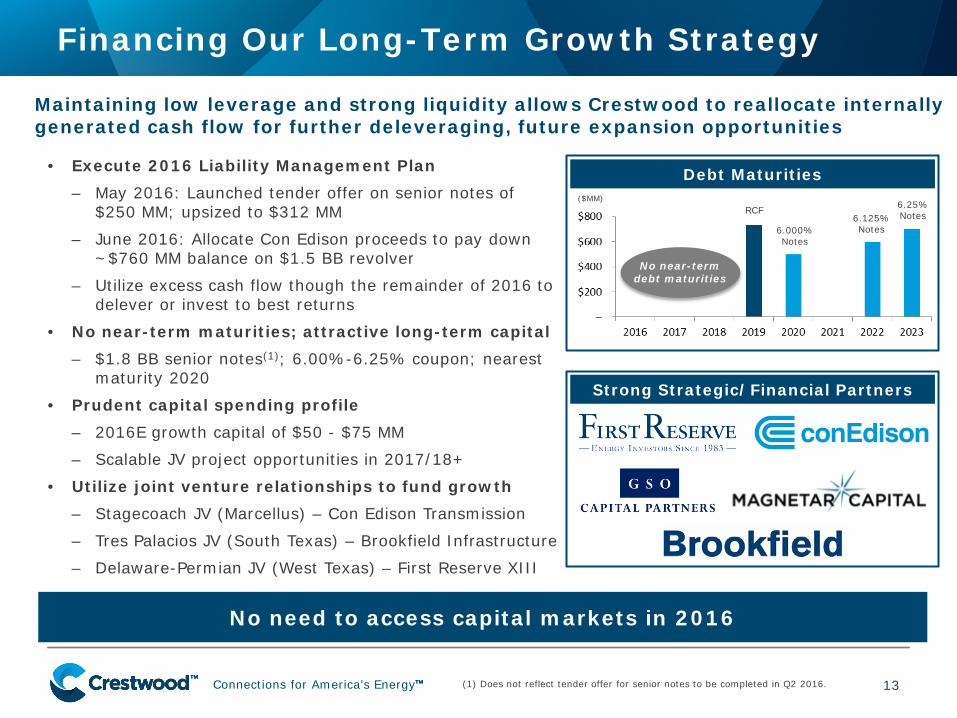
• Execute 2016 Liability Management Plan – May 2016: Launched tender offer on senior notes of
$250 MM; upsized to $312 MM
– June 2016: Allocate Con Edison proceeds to pay down ~$760 MM balance on $1.5 BB revolver
– Utilize excess cash flow though the remainder of 2016 to delever or invest to best returns
• No near-term maturities; attractive long-term capital – $1.8 BB senior notes(1); 6.00%-6.25% coupon; nearest
maturity 2020
• Prudent capital spending profile – 2016E growth capital of $50 - $75 MM
– Scalable JV project opportunities in 2017/18+
• Utilize joint venture relationships to fund growth – Stagecoach JV (Marcellus) – Con Edison Transmission
– Tres Palacios JV (South Texas) – Brookfield Infrastructure
– Delaware-Permian JV (West Texas) – First Reserve XIII
Financing Our Long-Term Growth Strategy
13
Debt Maturities
No near-term debt maturities
RCF
6.000% Notes
6.125% Notes
6.25% Notes
($MM)
Maintaining low leverage and strong liquidity allows Crestwood to reallocate internally generated cash flow for further deleveraging, future expansion opportunities
No need to access capital markets in 2016
(1) Does not reflect tender offer for senior notes to be completed in Q2 2016.
Strong Strategic/Financial Partners
Connections for America’s Energy ™ ™ ™ ™ ™ ™
Long-Term Outlook
14
Connections for America’s Energy ™ ™ ™ ™ ™ ™ 15
Long-Term Outlook: Competitive Assets With Leverage to Improving Commodity Prices
Crestwood is located in the right regions to benefit from cyclical recovery
• Repositioned the partnership in 2016 by strengthening our balance sheet
• Continue to reduce costs, improve operating margins, strengthen customer relationships and consolidate asset position in the areas that we operate
• Significant unused capacity allows for volume growth as commodity prices improve without significant capital investment
• Optimization activities underway in Barnett, COLT, Tres Palacios, NGL transportation business; evaluate opportunities to prudently expand core assets organically or through acquisition
• Marcellus, Bakken and Delaware-Permian asset positions have substantial long-term growth potential through incremental midstream infrastructure projects due to superior supply economics or market demand
Connections for America’s Energy ™ ™ ™ ™ ™ ™ 16
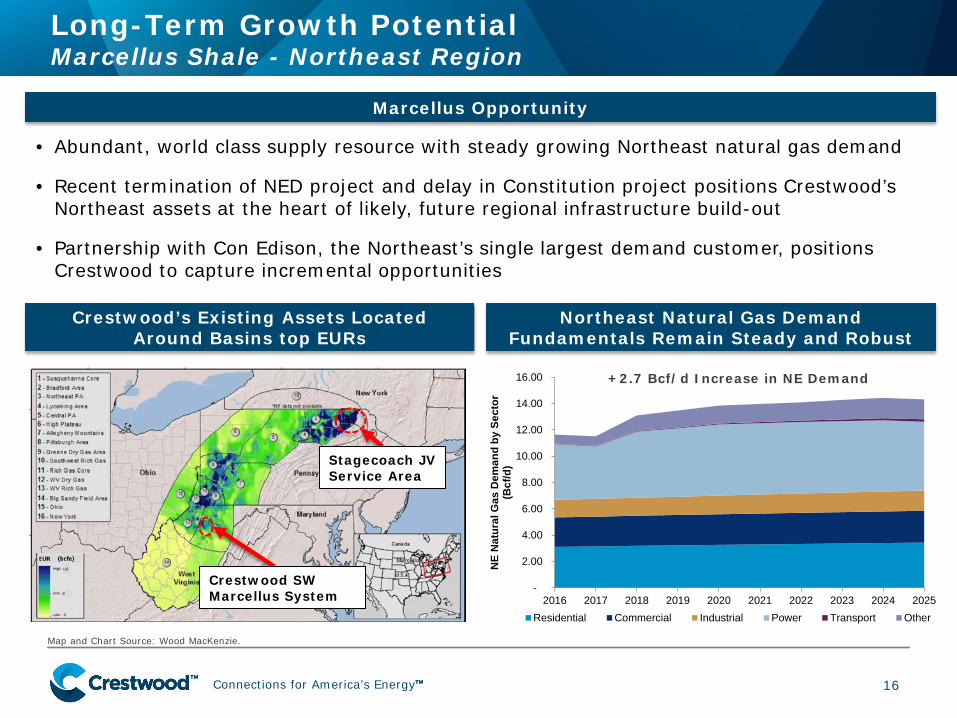
Long-Term Growth Potential Marcellus Shale - Northeast Region
• Abundant, world class supply resource with steady growing Northeast natural gas demand
• Recent termination of NED project and delay in Constitution project positions Crestwood’s Northeast assets at the heart of likely, future regional infrastructure build-out
• Partnership with Con Edison, the Northeast’s single largest demand customer, positions Crestwood to capture incremental opportunities
Marcellus Opportunity
Crestwood’s Existing Assets Located Around Basins top EURs
Northeast Natural Gas Demand Fundamentals Remain Steady and Robust
Stagecoach JV Service Area
Crestwood SW Marcellus System
Map and Chart Source: Wood MacKenzie.
-
2.00
4.00
6.00
8.00
10.00
12.00
14.00
16.00
2016 2017 2018 2019 2020 2021 2022 2023 2024 2025
NE
Nat
ural
Gas
Dem
and
by S
ecto
r (B
cf/d
)
Residential Commercial Industrial Power Transport Other
+2.7 Bcf/d Increase in NE Demand
Connections for America’s Energy ™ ™ ™ ™ ™ ™ 17
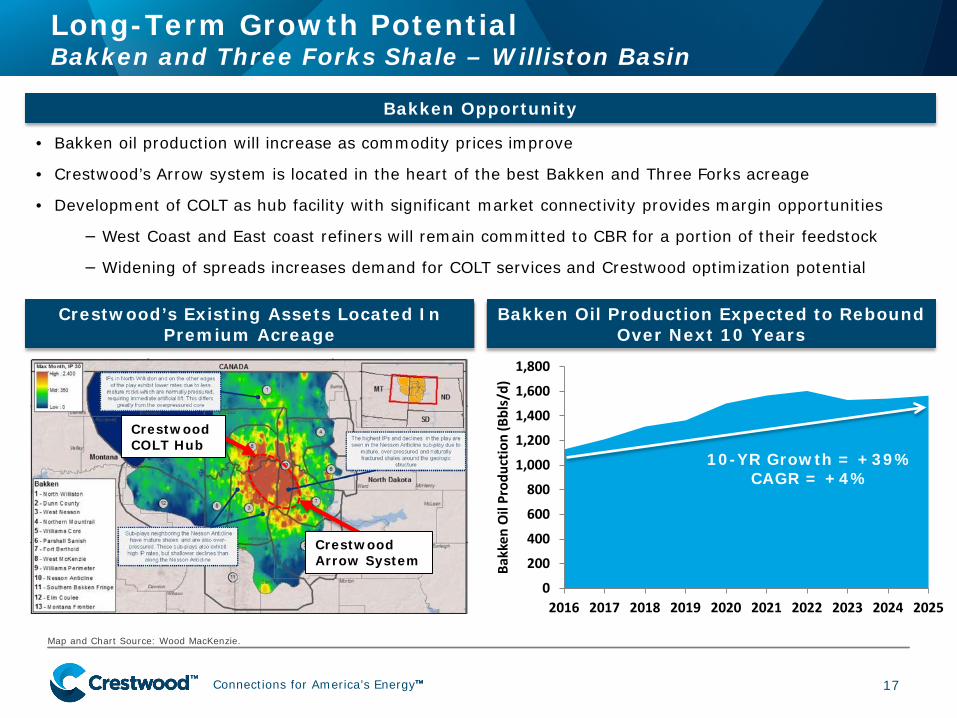
Long-Term Growth Potential Bakken and Three Forks Shale – Williston Basin
• Bakken oil production will increase as commodity prices improve
• Crestwood’s Arrow system is located in the heart of the best Bakken and Three Forks acreage
• Development of COLT as hub facility with significant market connectivity provides margin opportunities
− West Coast and East coast refiners will remain committed to CBR for a portion of their feedstock
− Widening of spreads increases demand for COLT services and Crestwood optimization potential
Crestwood Arrow System
Crestwood COLT Hub
Bakken Opportunity
Crestwood’s Existing Assets Located In Premium Acreage
Bakken Oil Production Expected to Rebound Over Next 10 Years
Map and Chart Source: Wood MacKenzie.
0
200
400
600
800
1,000
1,200
1,400
1,600
1,800
2016 2017 2018 2019 2020 2021 2022 2023 2024 2025
Bakk
en O
il Pr
oduc
tion
(Bbl
s/d)
10-YR Growth = +39% CAGR = +4%
Connections for America’s Energy ™ ™ ™ ™ ™ ™ 18
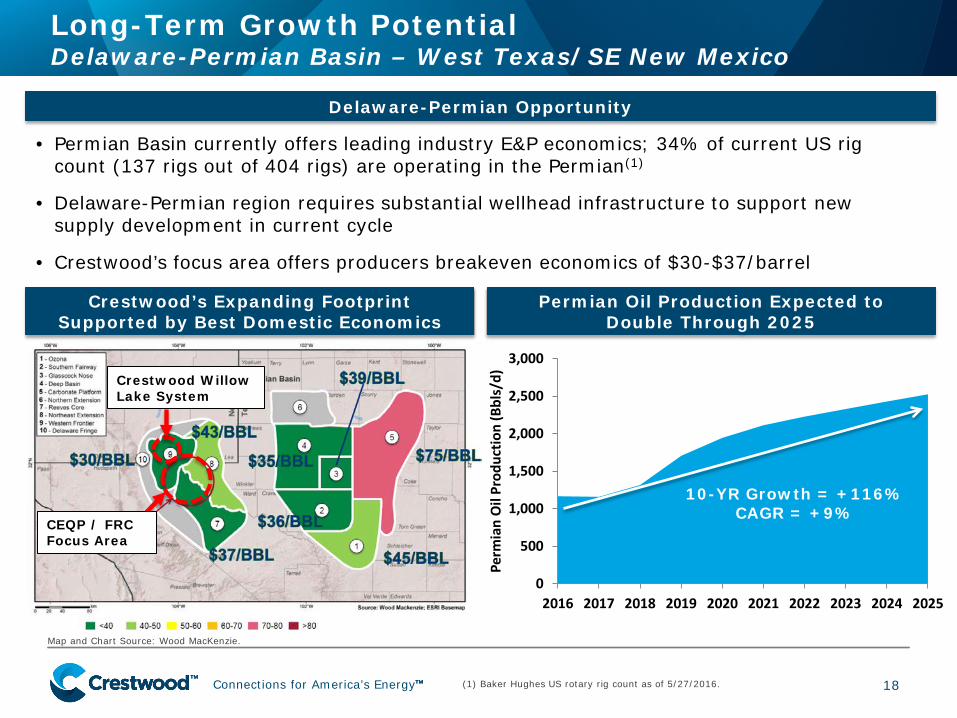
Long-Term Growth Potential Delaware-Permian Basin – West Texas/SE New Mexico
• Permian Basin currently offers leading industry E&P economics; 34% of current US rig count (137 rigs out of 404 rigs) are operating in the Permian(1)
• Delaware-Permian region requires substantial wellhead infrastructure to support new supply development in current cycle
• Crestwood’s focus area offers producers breakeven economics of $30-$37/barrel
CEQP / FRC Focus Area
Crestwood Willow Lake System
Crestwood’s Expanding Footprint Supported by Best Domestic Economics
Permian Oil Production Expected to Double Through 2025
Delaware-Permian Opportunity
Map and Chart Source: Wood MacKenzie.
0
500
1,000
1,500
2,000
2,500
3,000
2016 2017 2018 2019 2020 2021 2022 2023 2024 2025
Perm
ian
Oil
Prod
uctio
n (B
bls/
d)10-YR Growth = +116%
CAGR = +9%
(1) Baker Hughes US rotary rig count as of 5/27/2016.
Connections for America’s Energy ™ ™ ™ ™ ™ ™ 19
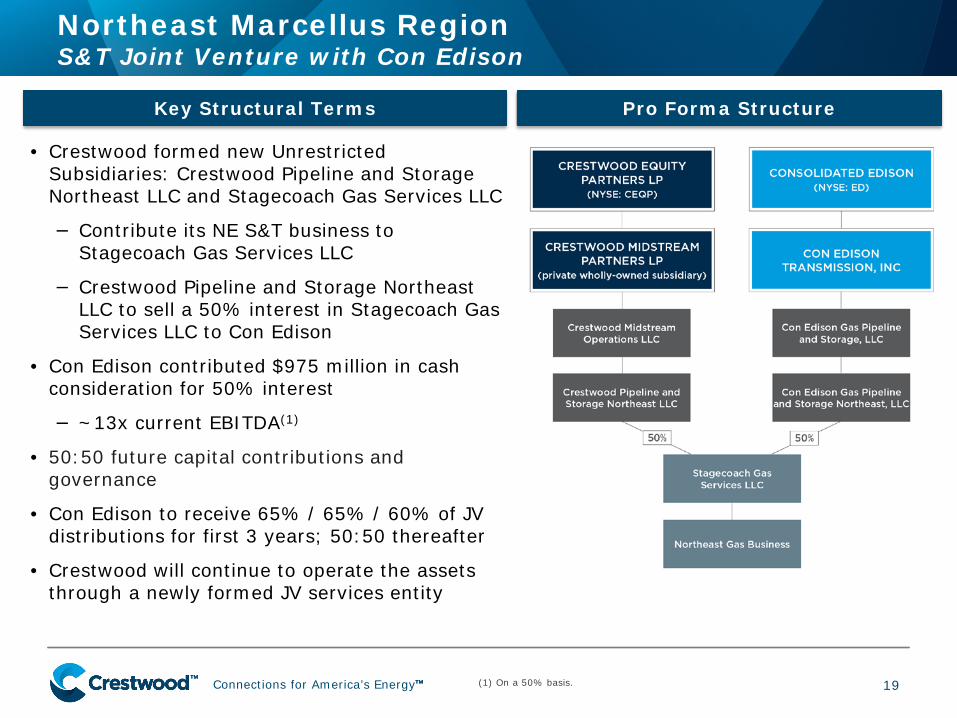
• Crestwood formed new Unrestricted Subsidiaries: Crestwood Pipeline and Storage Northeast LLC and Stagecoach Gas Services LLC
− Contribute its NE S&T business to Stagecoach Gas Services LLC
− Crestwood Pipeline and Storage Northeast LLC to sell a 50% interest in Stagecoach Gas Services LLC to Con Edison
• Con Edison contributed $975 million in cash consideration for 50% interest
− ~13x current EBITDA(1)
• 50:50 future capital contributions and governance
• Con Edison to receive 65% / 65% / 60% of JV distributions for first 3 years; 50:50 thereafter
• Crestwood will continue to operate the assets through a newly formed JV services entity
Pro Forma Structure Key Structural Terms
Northeast Marcellus Region S&T Joint Venture with Con Edison
(1) On a 50% basis.
Connections for America’s Energy ™ ™ ™ ™ ™ ™ 20
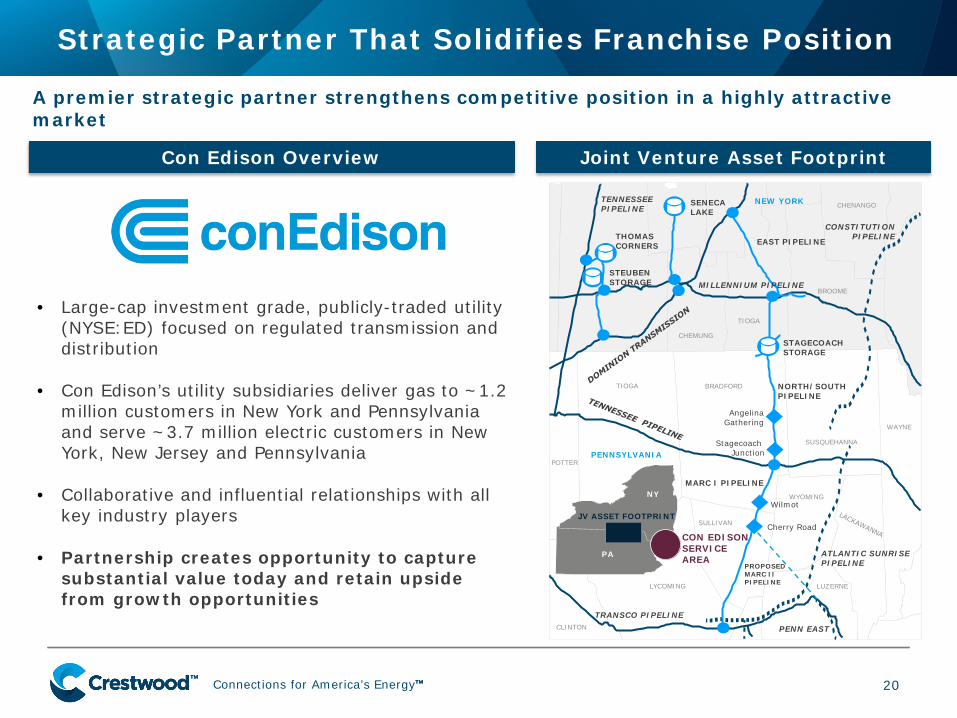
Con Edison Overview
A premier strategic partner strengthens competitive position in a highly attractive market
Strategic Partner That Solidifies Franchise Position
• Large-cap investment grade, publicly-traded utility (NYSE:ED) focused on regulated transmission and distribution
• Con Edison’s utility subsidiaries deliver gas to ~1.2 million customers in New York and Pennsylvania and serve ~3.7 million electric customers in New York, New Jersey and Pennsylvania
• Collaborative and influential relationships with all key industry players
• Partnership creates opportunity to capture substantial value today and retain upside from growth opportunities
Joint Venture Asset Footprint
TIOGA
TENNESSEE PIPELINE
SENECA LAKE
POTTER
CLINTON
PA
NY
TIOGA
STEUBEN STORAGE
PENNSYLVANIA
THOMAS CORNERS
MILLENNIUM PIPELINE
BRADFORD
SUSQUEHANNA
SULLIVAN
LYCOMING
TRANSCO PIPELINE
NEW YORK
EAST PIPELINE
CHENANGO
BROOME
CONSTITUTION PIPELINE
WAYNE
Stagecoach Junction
Angelina Gathering
NORTH/SOUTH PIPELINE
Cherry Road
ATLANTIC SUNRISE PIPELINE
LUZERNE
WYOMING
CHEMUNG
MARC I PIPELINE
STAGECOACH STORAGE
JV ASSET FOOTPRINT
CON EDISON SERVICE AREA
PENN EAST
PROPOSED MARC II PIPELINE
Wilmot
Connections for America’s Energy ™ ™ ™ ™ ™ ™
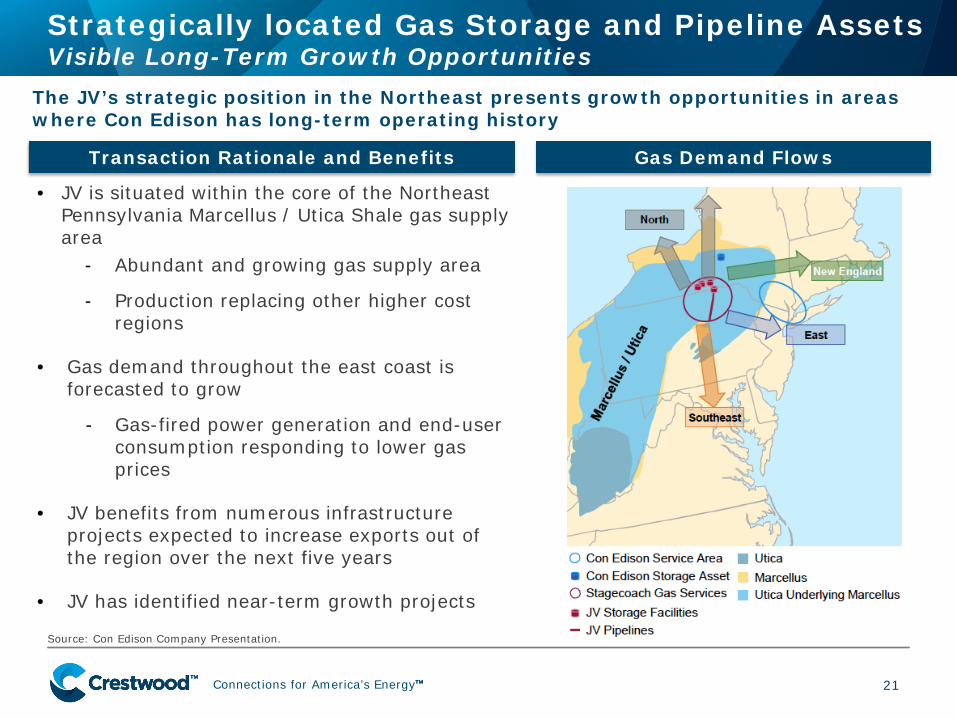
Strategically located Gas Storage and Pipeline Assets Visible Long-Term Growth Opportunities
21
Transaction Rationale and Benefits
The JV’s strategic position in the Northeast presents growth opportunities in areas where Con Edison has long-term operating history
• JV is situated within the core of the Northeast Pennsylvania Marcellus / Utica Shale gas supply area
- Abundant and growing gas supply area
- Production replacing other higher cost regions
• Gas demand throughout the east coast is forecasted to grow
- Gas-fired power generation and end-user consumption responding to lower gas prices
• JV benefits from numerous infrastructure projects expected to increase exports out of the region over the next five years
• JV has identified near-term growth projects
Gas Demand Flows
Source: Con Edison Company Presentation.
Connections for America’s Energy ™ ™ ™ ™ ™ ™
0
25
50
75
100
125
Q1:14 Q2:14 Q3:14 Q4:14 Q1:15 Q2:15 Q3:15 Q4:15 Q1:16
Gat
herin
g Vo
lum
es (M
boe/
d)
Crude Oil Natural Gas Water
$0
$5
$10
$15
$20
$25
Q1:14 Q2:14 Q3:14 Q4:14 Q1:15 Q2:15 Q3:15 Q4:15 Q1:16
Adju
sted
EBI
TDA
($M
M)
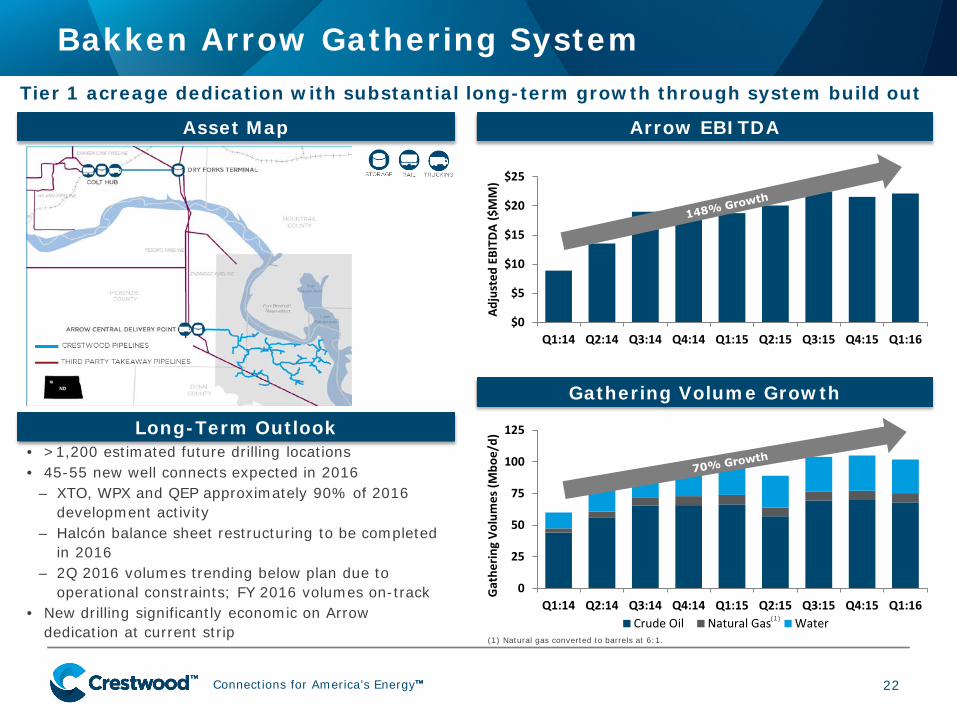
Bakken Arrow Gathering System
22
Tier 1 acreage dedication with substantial long-term growth through system build out
Asset Map
Long-Term Outlook • >1,200 estimated future drilling locations • 45-55 new well connects expected in 2016
– XTO, WPX and QEP approximately 90% of 2016 development activity
– Halcón balance sheet restructuring to be completed in 2016
– 2Q 2016 volumes trending below plan due to operational constraints; FY 2016 volumes on-track
• New drilling significantly economic on Arrow dedication at current strip
(1) Natural gas converted to barrels at 6:1.
(1)
Arrow EBITDA
Gathering Volume Growth
Connections for America’s Energy ™ ™ ™ ™ ™ ™
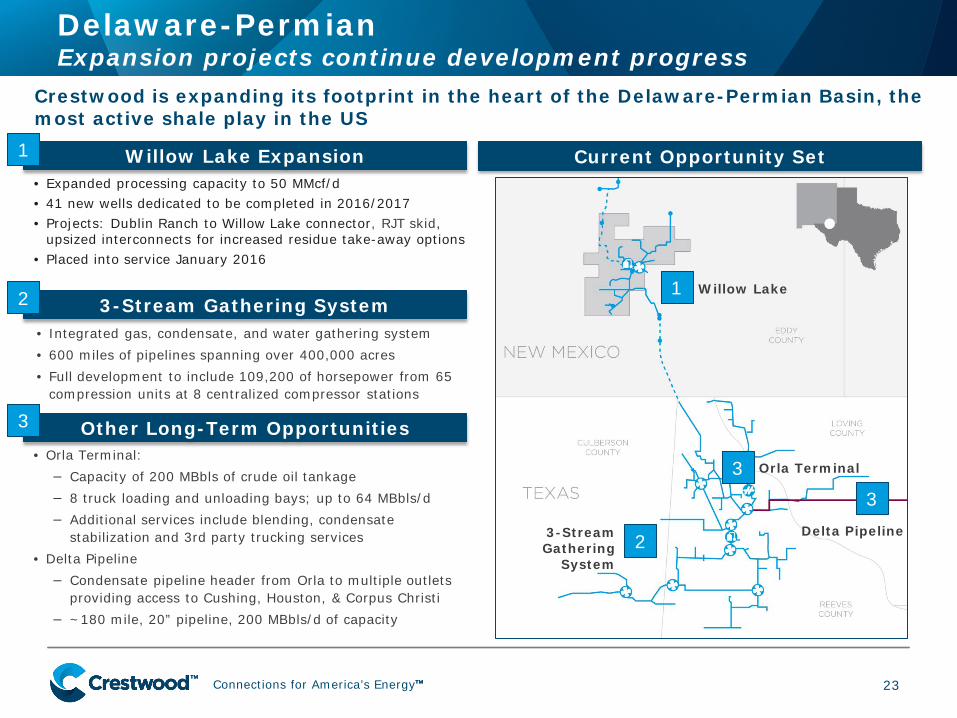
Delaware-Permian Expansion projects continue development progress
23
Crestwood is expanding its footprint in the heart of the Delaware-Permian Basin, the most active shale play in the US
Other Long-Term Opportunities
• Integrated gas, condensate, and water gathering system • 600 miles of pipelines spanning over 400,000 acres • Full development to include 109,200 of horsepower from 65
compression units at 8 centralized compressor stations
3-Stream Gathering System
Current Opportunity Set
• Orla Terminal: − Capacity of 200 MBbls of crude oil tankage − 8 truck loading and unloading bays; up to 64 MBbls/d − Additional services include blending, condensate
stabilization and 3rd party trucking services • Delta Pipeline − Condensate pipeline header from Orla to multiple outlets
providing access to Cushing, Houston, & Corpus Christi − ~180 mile, 20” pipeline, 200 MBbls/d of capacity
2
3
3
2
1
Willow Lake Expansion • Expanded processing capacity to 50 MMcf/d • 41 new wells dedicated to be completed in 2016/2017 • Projects: Dublin Ranch to Willow Lake connector, RJT skid,
upsized interconnects for increased residue take-away options • Placed into service January 2016
1
3
Willow Lake
Delta Pipeline
Orla Terminal
3-Stream Gathering
System

Connections for America’s Energy ™ ™ ™ ™ ™ ™
The Crestwood Investment Opportunity
No Incentive Distribution Rights
24
1
Substantial Expense / Fixed Charge Reduction
2
Diversified / Balanced Portfolio
3
Fixed Fee / Firm Contract Profile
4
Well-Positioned To Deliver Attractive Yield to Investors
Substantial Retained Cash Flow / JV Partners / No Capital Markets Requirements
1
Northeast Expansion Projects with Con Edison
2
3
Assets Levered to Volume Growth with Commodity Price Recovery
5
Attractive Valuation Entry Point
Execution Drives Significant Upside Return Opportunity
6
Top Tier Balance Sheet; 3.8x Pro Forma Leverage
5 Strong 2016E Distribution Coverage of 1.7x
Delaware-Permian Expansion Projects with First Reserve
4
Reversion to Median Alerian Yield Provides Significant Upside for Units
6
Connections for America’s Energy ™ ™ ™ ™ ™ ™
Appendix
25
Connections for America’s Energy ™ ™ ™ ™ ™ ™
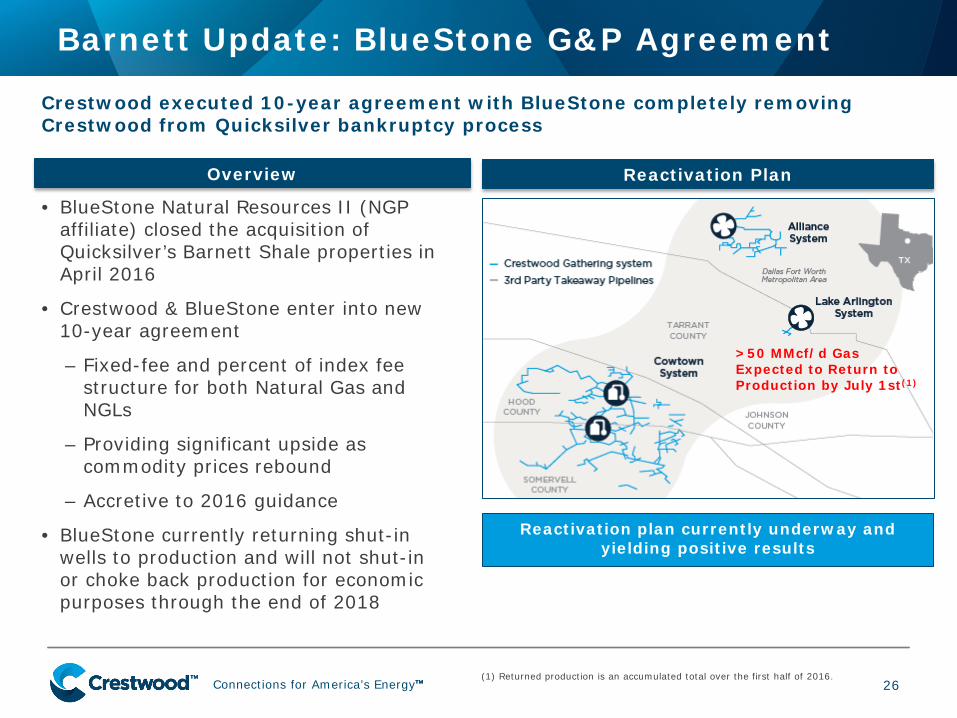
• BlueStone Natural Resources II (NGP affiliate) closed the acquisition of Quicksilver’s Barnett Shale properties in April 2016
• Crestwood & BlueStone enter into new 10-year agreement
– Fixed-fee and percent of index fee structure for both Natural Gas and NGLs
– Providing significant upside as commodity prices rebound
– Accretive to 2016 guidance
• BlueStone currently returning shut-in wells to production and will not shut-in or choke back production for economic purposes through the end of 2018
Barnett Update: BlueStone G&P Agreement
26
Crestwood executed 10-year agreement with BlueStone completely removing Crestwood from Quicksilver bankruptcy process
Overview Reactivation Plan
Reactivation plan currently underway and yielding positive results
>50 MMcf/d Gas Expected to Return to Production by July 1st(1)
(1) Returned production is an accumulated total over the first half of 2016.
Connections for America’s Energy ™ ™ ™ ™ ™ ™
Gathering & Processing Segment
27
Summary EBITDA Contribution
Scalable G&P Systems Located in Premier Shale Plays
$0$10$20$30$40$50$60$70$80
Q1:15 Q2:15 Q3:15 Q4:15 Q1:16
Adju
sted
EBI
TDA
($M
M)
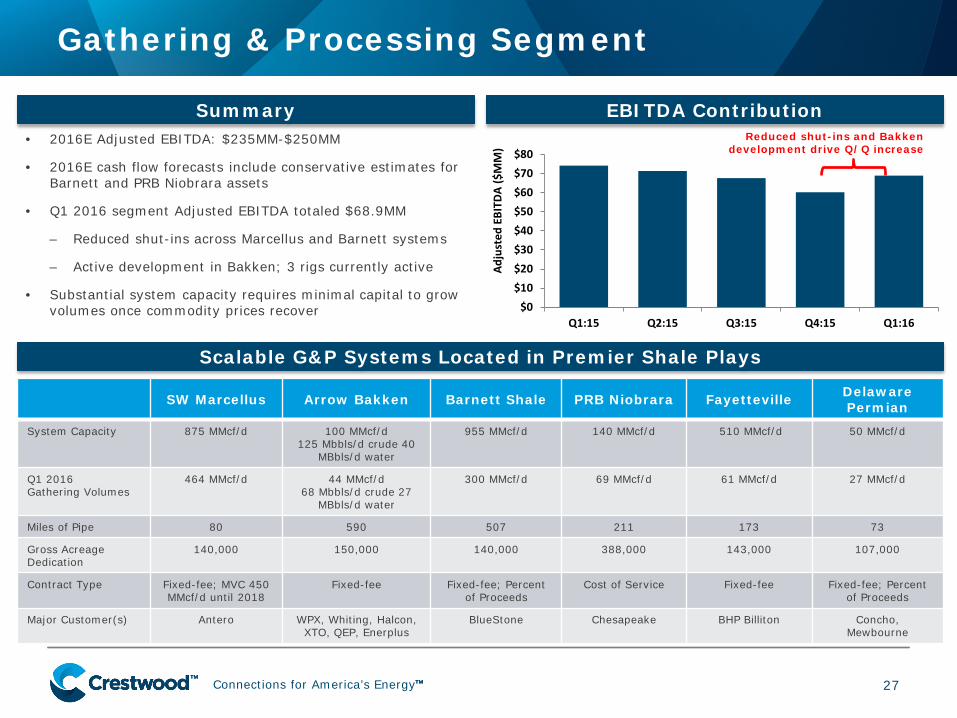
• 2016E Adjusted EBITDA: $235MM-$250MM
• 2016E cash flow forecasts include conservative estimates for Barnett and PRB Niobrara assets
• Q1 2016 segment Adjusted EBITDA totaled $68.9MM
– Reduced shut-ins across Marcellus and Barnett systems
– Active development in Bakken; 3 rigs currently active
• Substantial system capacity requires minimal capital to grow volumes once commodity prices recover
SW Marcellus Arrow Bakken Barnett Shale PRB Niobrara Fayetteville Delaware Permian
System Capacity 875 MMcf/d 100 MMcf/d 125 Mbbls/d crude 40
MBbls/d water
955 MMcf/d 140 MMcf/d 510 MMcf/d 50 MMcf/d
Q1 2016 Gathering Volumes
464 MMcf/d 44 MMcf/d 68 Mbbls/d crude 27
MBbls/d water
300 MMcf/d 69 MMcf/d 61 MMcf/d 27 MMcf/d
Miles of Pipe 80 590 507 211 173 73
Gross Acreage Dedication
140,000 150,000 140,000 388,000 143,000 107,000
Contract Type Fixed-fee; MVC 450 MMcf/d until 2018
Fixed-fee Fixed-fee; Percent of Proceeds
Cost of Service Fixed-fee Fixed-fee; Percent of Proceeds
Major Customer(s) Antero WPX, Whiting, Halcon, XTO, QEP, Enerplus
BlueStone Chesapeake BHP Billiton Concho, Mewbourne
Reduced shut-ins and Bakken development drive Q/Q increase
Connections for America’s Energy ™ ™ ™ ™ ™ ™
$0
$10
$20
$30
$40
$50
$60
Q1:15 Q2:15 Q3:15 Q4:15 Q1:16
Adju
sted
EBI
TDA
($M
M)
Storage & Transportation Segment
28
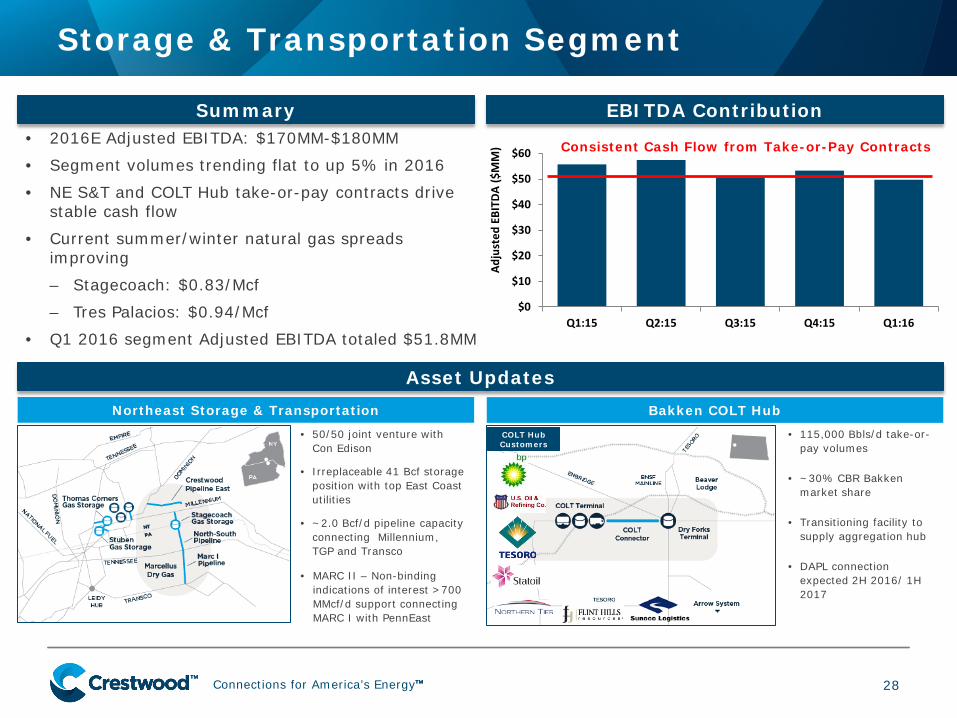
Consistent Cash Flow from Take-or-Pay Contracts
Summary EBITDA Contribution
Asset Updates Northeast Storage & Transportation Bakken COLT Hub
COLT Hub Customers
• 115,000 Bbls/d take-or-pay volumes
• ~30% CBR Bakken market share
• Transitioning facility to supply aggregation hub
• DAPL connection expected 2H 2016/ 1H 2017
• 50/50 joint venture with Con Edison
• Irreplaceable 41 Bcf storage position with top East Coast utilities
• ~2.0 Bcf/d pipeline capacity connecting Millennium, TGP and Transco
• MARC II – Non-binding indications of interest >700 MMcf/d support connecting MARC I with PennEast
• 2016E Adjusted EBITDA: $170MM-$180MM
• Segment volumes trending flat to up 5% in 2016
• NE S&T and COLT Hub take-or-pay contracts drive stable cash flow
• Current summer/winter natural gas spreads improving
– Stagecoach: $0.83/Mcf
– Tres Palacios: $0.94/Mcf
• Q1 2016 segment Adjusted EBITDA totaled $51.8MM
Connections for America’s Energy ™ ™ ™ ™ ™ ™
Marketing, Supply & Logistics Segment
29
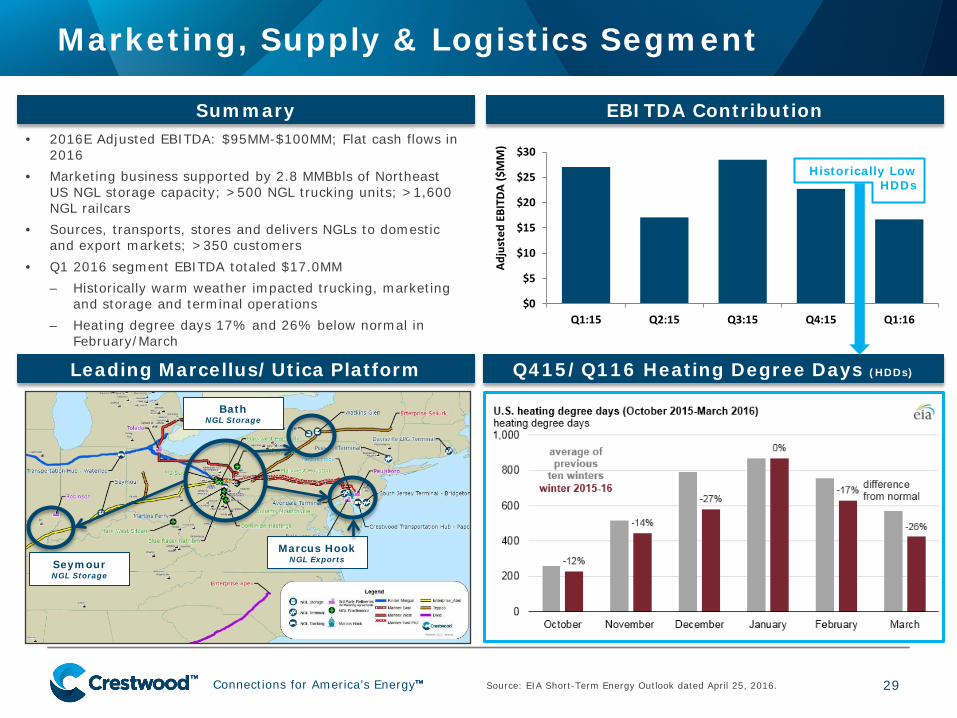
Summary EBITDA Contribution
Leading Marcellus/Utica Platform
$0
$5
$10
$15
$20
$25
$30
Q1:15 Q2:15 Q3:15 Q4:15 Q1:16
Adju
sted
EBI
TDA
($M
M)• 2016E Adjusted EBITDA: $95MM-$100MM; Flat cash flows in
2016 • Marketing business supported by 2.8 MMBbls of Northeast
US NGL storage capacity; >500 NGL trucking units; >1,600 NGL railcars
• Sources, transports, stores and delivers NGLs to domestic and export markets; >350 customers
• Q1 2016 segment EBITDA totaled $17.0MM – Historically warm weather impacted trucking, marketing
and storage and terminal operations – Heating degree days 17% and 26% below normal in
February/March
Marcus Hook NGL Exports
Bath NGL Storage
Seymour NGL Storage
Historically Low HDDs
Q415/Q116 Heating Degree Days (HDDs)
Source: EIA Short-Term Energy Outlook dated April 25, 2016.
Connections for America’s Energy ™ ™ ™ ™ ™ ™
CEQP Non-GAAP Reconciliations
30
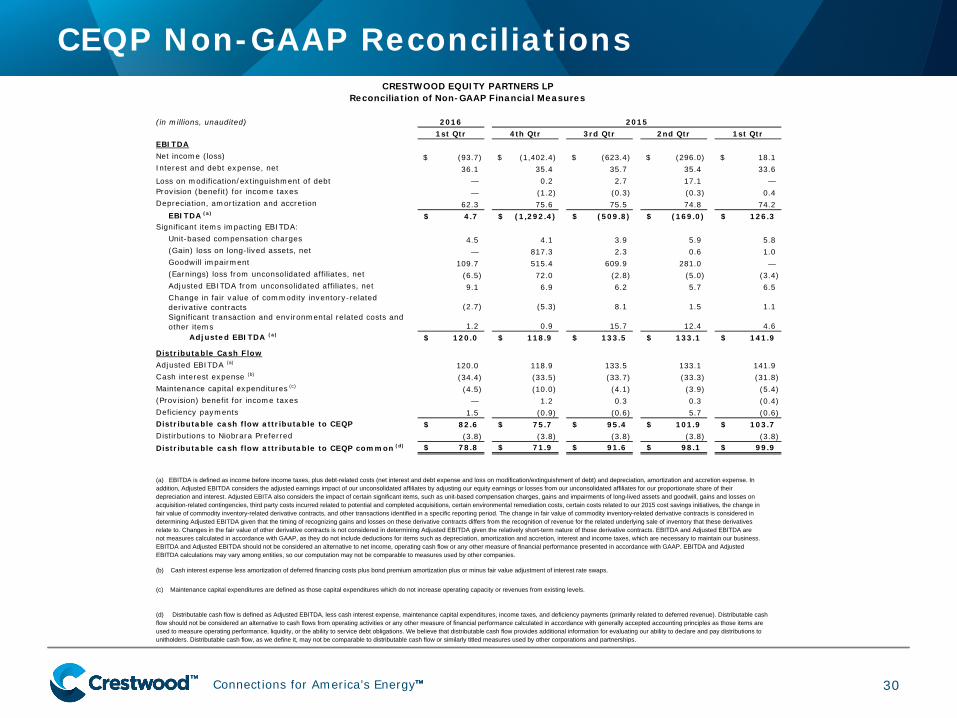
(in millions, unaudited) 2016 1st Qtr 4th Qtr 3rd Qtr 2nd Qtr 1st QtrEBITDANet income (loss) (93.7)$ (1,402.4)$ (623.4)$ (296.0)$ 18.1$ Interest and debt expense, net 36.1 35.4 35.7 35.4 33.6Loss on modification/extinguishment of debt — 0.2 2.7 17.1 —Provision (benefit) for income taxes — (1.2) (0.3) (0.3) 0.4Depreciation, amortization and accretion 62.3 75.6 75.5 74.8 74.2
EBITDA (a) 4.7$ (1,292.4)$ (509.8)$ (169.0)$ 126.3$ Significant items impacting EBITDA:
Unit-based compensation charges 4.5 4.1 3.9 5.9 5.8(Gain) loss on long-lived assets, net — 817.3 2.3 0.6 1.0Goodwill impairment 109.7 515.4 609.9 281.0 —(Earnings) loss from unconsolidated affiliates, net (6.5) 72.0 (2.8) (5.0) (3.4)Adjusted EBITDA from unconsolidated affiliates, net 9.1 6.9 6.2 5.7 6.5Change in fair value of commodity inventory-related derivative contracts (2.7) (5.3) 8.1 1.5 1.1Significant transaction and environmental related costs and other items 1.2 0.9 15.7 12.4 4.6
Adjusted EBITDA (a) 120.0$ 118.9$ 133.5$ 133.1$ 141.9$
Distributable Cash FlowAdjusted EBITDA (a) 120.0 118.9 133.5 133.1 141.9Cash interest expense (b) (34.4) (33.5) (33.7) (33.3) (31.8)Maintenance capital expenditures (c) (4.5) (10.0) (4.1) (3.9) (5.4)(Provision) benefit for income taxes — 1.2 0.3 0.3 (0.4)Deficiency payments 1.5 (0.9) (0.6) 5.7 (0.6)Distributable cash flow attributable to CEQP 82.6$ 75.7$ 95.4$ 101.9$ 103.7$ Distirbutions to Niobrara Preferred (3.8) (3.8) (3.8) (3.8) (3.8) Distributable cash flow attributable to CEQP common (d) 78.8$ 71.9$ 91.6$ 98.1$ 99.9$
(b) Cash interest expense less amortization of deferred financing costs plus bond premium amortization plus or minus fair value adjustment of interest rate swaps.
(c) Maintenance capital expenditures are defined as those capital expenditures which do not increase operating capacity or revenues from existing levels.
(d) Distributable cash flow is defined as Adjusted EBITDA, less cash interest expense, maintenance capital expenditures, income taxes, and deficiency payments (primarily related to deferred revenue). Distributable cash flow should not be considered an alternative to cash flows from operating activities or any other measure of financial performance calculated in accordance with generally accepted accounting principles as those items are used to measure operating performance, liquidity, or the ability to service debt obligations. We believe that distributable cash flow provides additional information for evaluating our ability to declare and pay distributions to unitholders. Distributable cash flow, as we define it, may not be comparable to distributable cash flow or similarly titled measures used by other corporations and partnerships.
2015
CRESTWOOD EQUITY PARTNERS LP Reconciliation of Non-GAAP Financial Measures
(a) EBITDA is defined as income before income taxes, plus debt-related costs (net interest and debt expense and loss on modification/extinguishment of debt) and depreciation, amortization and accretion expense. In addition, Adjusted EBITDA considers the adjusted earnings impact of our unconsolidated affiliates by adjusting our equity earnings or losses from our unconsolidated affiliates for our proportionate share of their depreciation and interest. Adjusted EBITA also considers the impact of certain significant items, such as unit-based compensation charges, gains and impairments of long-lived assets and goodwill, gains and losses on acquisition-related contingencies, third party costs incurred related to potential and completed acquisitions, certain environmental remediation costs, certain costs related to our 2015 cost savings initiatives, the change in fair value of commodity inventory-related derivative contracts, and other transactions identified in a specific reporting period. The change in fair value of commodity inventory-related derivative contracts is considered in determining Adjusted EBITDA given that the timing of recognizing gains and losses on these derivative contracts differs from the recognition of revenue for the related underlying sale of inventory that these derivatives relate to. Changes in the fair value of other derivative contracts is not considered in determining Adjusted EBITDA given the relatively short-term nature of those derivative contracts. EBITDA and Adjusted EBITDA are not measures calculated in accordance with GAAP, as they do not include deductions for items such as depreciation, amortization and accretion, interest and income taxes, which are necessary to maintain our business. EBITDA and Adjusted EBITDA should not be considered an alternative to net income, operating cash flow or any other measure of financial performance presented in accordance with GAAP. EBITDA and Adjusted EBITDA calculations may vary among entities, so our computation may not be comparable to measures used by other companies.
Connections for America’s Energy ™ ™ ™ ™ ™ ™
CEQP Non-GAAP Reconciliations
31
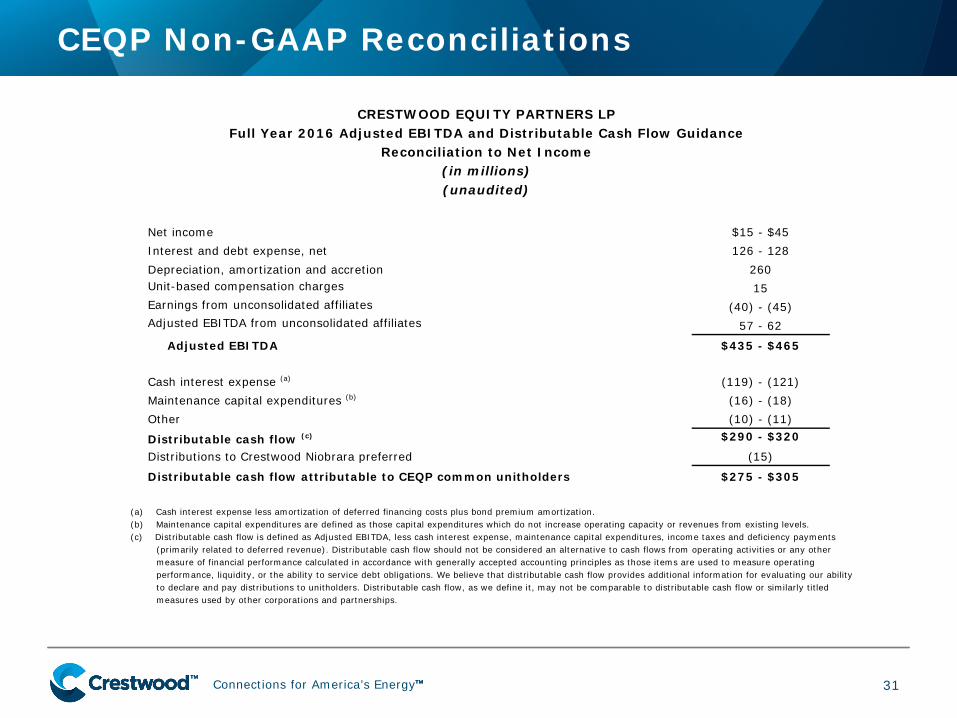
CRESTWOOD EQUITY PARTNERS LP Full Year 2016 Adjusted EBITDA and Distributable Cash Flow Guidance
Reconciliation to Net Income (in millions) (unaudited)
Net income $15 - $45 Interest and debt expense, net 126 - 128 Depreciation, amortization and accretion 260 Unit-based compensation charges
15 Earnings from unconsolidated affiliates
(40) - (45) Adjusted EBITDA from unconsolidated affiliates
57 - 62
Adjusted EBITDA $435 - $465 Cash interest expense (a) (119) - (121) Maintenance capital expenditures (b) (16) - (18) Other (10) - (11)
Distributable cash flow (c) $290 - $320 Distributions to Crestwood Niobrara preferred (15)
Distributable cash flow attributable to CEQP common unitholders $275 - $305
(a) Cash interest expense less amortization of deferred financing costs plus bond premium amortization. (b) Maintenance capital expenditures are defined as those capital expenditures which do not increase operating capacity or revenues from existing levels. (c) Distributable cash flow is defined as Adjusted EBITDA, less cash interest expense, maintenance capital expenditures, income taxes and deficiency payments
(primarily related to deferred revenue). Distributable cash flow should not be considered an alternative to cash flows from operating activities or any other measure of financial performance calculated in accordance with generally accepted accounting principles as those items are used to measure operating performance, liquidity, or the ability to service debt obligations. We believe that distributable cash flow provides additional information for evaluating our ability to declare and pay distributions to unitholders. Distributable cash flow, as we define it, may not be comparable to distributable cash flow or similarly titled measures used by other corporations and partnerships.