mitigation of greenhouse gas emissions by anaerobic digestion of cattle slurry
TRANSCRIPT
Mitigation of greenhouse gas emissions by anaerobic
digestion of cattle slurry
Joachim Clemens a,*, Manfred Trimborn a, Peter Weiland b, Barbara Amon c
aUniversity of Bonn, Institute of Plant Nutrition, Karlrobert-Kreiten-Strasse 13, D-53115 Bonn, Germanyb Institute of Technology and Biosystems Engineering, Federal Agricultural Research Centre (FAL),
Bundesallee 50, D-38116 Braunschweig, GermanycUniversity of Natural Resources and Applied Life Sciences, Department of Sustainable Agricultural Systems,
Division of Agricultural Engineering, Peter Jordan-Strasse 82, A-1190 Vienna, Austria
Available online 7 November 2005
Abstract
Biogas treatment of animal manures is an upcoming technology because it is a way of producing renewable energy (biogas). However,
little is known about effects of this management strategy on greenhouse gas (GHG) emissions during fermentation, storage, and field
application of the substrates compared to untreated slurries. In this study, we compared cattle slurry and cattle slurry with potato starch as
additive during the process of fermentation, during storage and after field application. The addition of potato starch strongly enhanced CH4
production from 4230 l CH4 m�3 to 8625 l CH4 m
�3 in the fermenter at a hydraulic retention time (HRT) of 29 days. Extending the HRT to 56
days had only a small effect on the CH4 production. Methane emissions from stored slurry depended on storage temperature and were highest
from unfermented slurry followed by the slurry/starch mixture. Gas emissions from untreated and fermented slurry during storage were
further analyzed in a pilot-scale experiment with different levels of covering such as straw cover, a wooden lid and no cover. Emissions of
greenhouse gases (CH4, N2O, NH3) were in the range of 14.3–17.1 kg CO2 eq. m�3 during winter (100 day storage period) and 40.5–90.5 kg
CO2 eq. m�3 during summer (140 day storage period). A straw cover reduced NH3 losses, but not overall GHG emissions, whereas a solid
cover reduced CH4 and NH3 emissions. After field application, there were no significant differences between slurry types in GHG emissions
(4.15–8.12 kg CO2 eq. m�3 a�1). GHG emissions from slurry stores were more important than emissions after field application. Co-digestion
of slurry with additives such as starch has a large potential to substitute fossil energy by biogas. On a biogas plant, slurry stores should be
covered gas-tight in order to eliminate GHG emissions and collect CH4 for electricity production.
# 2005 Elsevier B.V. All rights reserved.
Keywords: Biogas; Greenhouse gases; Nitrous oxide; Methane; Ammonia; Slurry; Manure management
www.elsevier.com/locate/agee
Agriculture, Ecosystems and Environment 112 (2006) 171–177
1. Introduction
In biogas plants, organic matter is degraded by anaerobic
digestion to ‘‘biogas’’, a mixture of methane (CH4), carbon
dioxide (CO2), and some trace gases. Biogas is a source of
renewable energy producing electricity in combined heat
and power plants. In agriculture, the digestion of slurry or
liquid manure is the major source of biogas. The co-
digestion of slurry with organic wastes, residues and/or
* Corresponding author. Tel.: +49 228 732150; fax: +49 228 732489.
E-mail address: [email protected] (J. Clemens).
0167-8809/$ – see front matter # 2005 Elsevier B.V. All rights reserved.
doi:10.1016/j.agee.2005.08.016
energy crops is of increasing relevance because it increases
CH4 production and improves the profitability of the process
(Weiland et al., 2004).
The biogas yield depends on the temperature in the
fermenter, on the HRT, and on the specific organic load.
During fermentation, substrate parameters such as organic
dry matter content, ammonia concentration, pH, and
viscosity undergo changes that may affect GHG emissions
during storage and after field application of residues. For
example an increase in pH and NH4+ concentration may
stimulate NH3 emission during storage and after field
application (Kuhn, 1998). On the other hand, CH4 emission

J. Clemens et al. / Agriculture, Ecosystems and Environment 112 (2006) 171–177172
may be reduced because most of the degradable organic
carbon is turned into biogas (Huther, 1999). Studies on N2O
emission during storage were inconsistent, while Sommer
et al. (2000) reported periods with higher N2O emission,
other authors found only negligible N2O emission (Wulf
et al., 2002b). Some studies have observed that the presence
of a surface crust reduced CH4 emissions (Husted, 1994;
Sommer et al., 2000), indicating that CH4 was consumed
within the crust environment by CH4 oxidising bacteria. In
Dutch studies, a solid cover on slurry stores reduced CH4
emissions by up to 50% (Hilhorst et al., 2001). Pilot scale
experiments were conducted to show the effect of different
levels of covering slurry stores on CH4, NH3, and N2O
emissions.
After field application of slurry, GHG emissions are
dominated by N2O and NH3, whereas CH4 is of minor
importance (Wulf et al., 2002b).
In this study, we investigated the influence of all three
major steps of anaerobic digestion, fermentation, storage,
and field application, on GHG and NH3 emissions, and we
compared these results with emissions from untreated
slurries. Other effects of NH3 emissions, such as eutrophica-
tion and acidification (Ellenberg, 1992), are not considered
in this study. Our hypothesis was that biogas production
reduces overall GHG emissions during slurry management.
2. Material and methods
2.1. Fermentation studies
Digestion experiments were carried out with cattle slurry
and a mixture of cattle slurry and potato starch (Table 1) in a
farm-scale digester (600 m3) and a pilot-scale digestor
(8 m3) at the experimental station of the Federal Agricultural
Research Centre (FAL) in Braunschweig/Germany. Usually,
agricultural biogas plants are operated under mesophilic
conditions, and the HRT is 20–35 days (Weiland et al.,
2004). Here, the digesters were operated at 35 8C with a
HRTof 29 or 56 days. The substrate was fed to the digesters
Table 1
Properties of cattle slurry and a mixture of cattle slurry and waste potato starch (OD
retention time (HRT) of 29 and 56 days
Parameter HRT Cattle
slurry
Cattle slurry/
potato starch
Cattle slurry,
29 days
DM (g kg�1) 32.9 43.7 22.9
ODM (g kg�1) 23.5 34.5 14.5
COD (g kg�1) 39.8 58.9 21.7
BOD (g kg�1) 16.5 20.4 4.3
NKj (g kg�1) 2.17 2.72 2.06
NH4–N (g kg�1) 1.19 1.45 1.41
PO4–P (g kg�1) 0.40 0.46 0.28
FOS/TAC 0.83 1.25 0.1
pH 7.4 7.6 7.6
DM: dry matter; ODM: organic dry matter; COD: chemical oxygen demand; BOD
acids/total acid capacity.
12 times per day, while the digested substrate was removed
continuously. Production and CH4 content of the biogas
were measured continuously. All digesters were operated at
constant operational conditions for at least one HRT before
the substrate was collected for field application experiments.
2.2. Storage studies
Two storage experiments were performed. Small scale
experiments were conducted at the FAL in order to quantify
the potential for CH4 formation during storage. For this
purpose, 25 kg of fresh, digested slurry and digested slurry/
starch mixtures were stored in gas-tight glass vessels at four
different temperatures: 4, 11, 20, and 30 8C. The gas
produced was collected in gas-tight bags. Depending on the
gas productivity, the gas volume was measured with
conventional wet gas meters or with special micro gas
meters. All laboratory storage experiments were carried out
in duplicate with only minor differences in the CH4
emission. The gas from fermentation and laboratory storage
studies was analyzed by gas chromatography (Shimadzu GC
14B) using a flame ionization detector (FID) for CH4, a
thermal conductivity cell (WLD) for CO2, and an electron
capture detector for N2O (for details, see Huther, 1999).
Additionally, a pilot-scale study was performed in Gross
Enzersdorf, near the city of Vienna, Austria, at the research
station of the University of Natural Resources and Applied
Life Sciences. Ammonia, CH4, and N2O emissions were
quantified during storage of untreated and digested dairy
cattle slurry in a summer (140 days) and winter (100 days)
experiment. The following treatments were included:
untreated slurry with natural surface crust (untr_crust),
untreated slurry with natural surface crust and wooden cover
(untr_cover), digested slurry without any cover (biogas),
digested slurry with a layer of chopped straw (biogas_straw),
digested slurry with a layer of chopped straw and a wooden
cover (biogas_straw_cover).
The dairy cattle slurry was stored in five pilot-scale slurry
tanks, which were 2.5 m deep and with a diameter of 2.5 m.
Emissions were quantified by placing a large, open dynamic
M-ratio: 70/30) and main properties of the digested substrates at a hydraulic
Cattle slurry,
56 days
Mixture 70/30,
29 days
Mixture 70/30,
56 days
23.1 27.6 22.8
14.3 17.5 14.3
19.7 27.7 33.7
3.4 16.4 8.0
2.28 2.73 2.46
1.51 1.78 1.65
0.37 0.25 0.26
0.2 0.1 0.1
7.8 7.6 7.8
: biological oxygen demand, NKj: Kjeldahl-N, VOA/TAC: volatile organic
J. Clemens et al. / Agriculture, Ecosystems and Environment 112 (2006) 171–177 173
Table 2
Methane formation (l m�3 slurry) during anaerobic digestion at 35 8C with
an average HRT of 29 or 56 days
Slurry Slurry + starch
ODM (g kg�1) 23.5 34.5
HRT (d) 29 56 29 56
Methane yield (l m�3) 4230 4465 8625 10350
ODM: organic dry matter.
chamber over a slurry tank and monitoring the emissions for
several hours at least twice a week. For details on the
measurement technology, see Amon et al. (this issue).
Regression curves were fitted to cumulated emissions.
Cumulated emissions of CH4, NH3, and N2O increased
linearly during the winter trial, and this was also the case for
N2O in the summer trial. Methane and NH3 emissions in the
summer trial showed a quadratic increase, i.e. emission rates
decreased over time (Amon et al., 2004).Regression equations
were testedbypair-wise comparisons of regressionparameters
using the t-test. Level of significance was set to at least 0.05.
2.3. Field application
In the field experiment, the substrates produced by the
FAL, except untreated cattle slurry/potato starch and
digested slurry with a HRT of 56 days (Table 1), were
applied by manual simulation of the trail shoe technique.
Rates of 60 kg NH4–N ha�1 were applied to a pasture on a
poorly drained Stagno-gleyic Luvisol (FAO). C and N
contents of the grassland topsoil (0–0.15 m) were 1.9 and
0.19%, respectively. The plot experiment (four replications
for each treatment, plot size: 9 m2) also included an
unfertilised control and a mineral fertiliser treatment
(Calcium Ammonium Nitrate, CAN). Application of the
substrate on each single plot took about 5 min, and gas flux
measurement started immediately thereafter. The substrates
were applied to all plots within 90 min.
Nitrous oxide and CH4 emissions were measured for 1
year after application using closed chambers with a surface
area of 0.25 m2 and a volume of 96 l. Sampling frequency
was reduced from four measurements per day during the first
week to one measurement per month at the end of the 1-year
period. Gas samples were taken from the chambers with
evacuated headspace vials (20 ml) through a butyl septum.
During the first week, samples were taken 0, 30, 60, and
90 min after placing the chambers airtight onto installation
rings that were permanently inserted 10 cm into the soil. In
the following weeks, the sampling intervals were 0, 45, 90,
and 135 min. Gas analysis was performed using a gas
chromatograph (SRI 8610C) with a backflush system to
eliminate water vapour, an electron capture detector (ECD)
for N2O and a flame ionisation detector (FID) for CH4
measurements (for details, seeWulf et al., 2002b). Ammonia
volatilisation was measured during the first 4 days after
application using the standard comparison method
described by Vandre and Kaupenjohann (1998) andmodified
by Wulf et al. (2002a). This is an open method designed for
plot experiments where NH3 is collected in passive samplers
filled with 0.05 M H2SO4.
Results are presented as arithmetic means of four
replicates. Although emission measurements are often not
normally distributed, this estimator was preferred to
geometric or lognormal means because according to Velthof
and Oenema (1995), it is less biased and more robust than
any other estimator for small numbers of replicates. For
comparison of treatments, ANOVA was used followed by
Tukey-HSD test using SPSS version 10 (2000) software.
In order to compare total GHG emissions, emissions of
each gas were converted to CO2 equivalents using IPCC
conversion factors (IPCC, 1996). In this study, NH3 emissions
were taken into account in the calculation of the GHG
emissions. Ammonia is not itself considered a greenhouse gas
because of its short lifetime in the atmosphere, but its
deposition induces N2O formation elsewhere. It is postulated
that 1% of NH3–N deposited is re-emitted as N2O–N (IPCC/
OECD/IEA, 1997). Residual C in the slurry not released as
CH4 was not considered in the calculation.
3. Results
3.1. Fermentation studies
The addition of potato starch to slurry increased CH4
formation during the fermentation. Extending the HRT from
29 to 56 days had only a minor effect on CH4 yields from
cattle slurry (increase of 235 l CH4 m�3), whereas yields
from the slurry/starch mixture increased significantly by
1725 l CH4 m�3 substrate (Table 2) with the extended HRT.
3.2. Storage
Results from laboratory storage experiments indicated a
strong influence of the storage temperature on CH4
formation. From untreated slurry, CH4 emissions can be
neglected only at the lowest storage temperature of 4 8C.From digested substrates, the amount of CH4 emitted was
generally lower. The digested slurry/starch mixture pro-
duced more CH4 as compared to digested slurry. Mean CH4
emissions from untreated and anaerobically digested slurry
with and without starch are summarized in Table 3,
expressed as CO2 equivalents. No N2O emissions were
detected in the experiments.
The pilot-scale storage experiment included winter and
summer storage. Table 4 gives an overview of net total
emissions measured under cool winter and warm summer
conditions.
A linear increase in cumulated CH4 emissions was
observed in all treatments throughout the winter experiment
(Amon et al., 2004). Methane emissions from digested slurry
were significantly lower than from untreated slurry
(Table 4). No significant difference was observed between
J. Clemens et al. / Agriculture, Ecosystems and Environment 112 (2006) 171–177174
Table 3
GHG emissions (only CH4 observed, emission in kg CO2 eq. m�3) during
storage of untreated and anaerobically digested slurry with and without
starch)
Substrate CM-0 CM-29 CM-56 MIX-29 MIX-56
HRT (d) 0 29 56 29 56
Storage duration (d) 105 75 55 118 140
4 8C 0.1 0 0 0.5 0.3
11 8C 18.0 0.1 0 1.20 0.9
20 8C 31.5 2.9 0.2 13.8 11.2
30 8C 36.0 15.0 2.4 19.5 20.2
HRT: hydraulic retention time, CM: cattle slurry, MIX: mixture of manure
and potato starch.
CH4 emissions from digested slurry with or without a straw
cover on the slurry surface. A wooden cover, however,
significantly reduced CH4 emissions from both untreated
and digested slurry. Cumulated NH3 emissions increased
linearly throughout the storage period. Covering the tank
with a wooden lid decreased NH3 emissions from untreated
slurry. In contrast to CH4, a layer of chopped straw on the
surface of digested slurry significantly reduced NH3
emissions. A wooden cover had no additional mitigation
effect. Cumulated N2O emissions increased steadily during
the 100-day measurement period with no significant
difference between treatments. They ranged from 38.2 to
44.0 g N2O m�3.
Total GHG emissions during winter storage were highest
from untreated, uncovered slurry. A wooden cover con-
siderably reduced emissions of the three gases and, hence,
total GHG emissions. Digested slurry emitted less GHG than
uncovered untreated slurry. The combination of chopped
straw and lid reduced total GHG emissions from digested
slurry (Table 4).
During the 140-day storage under warm summer
conditions, considerably more CH4 was emitted than under
cold winter conditions. Cumulated CH4 emissions followed
a quadratic curve and declined towards the end of the
measurement period (data not shown). Untreated slurry
emitted significantly more CH4 than digested slurry. Similar
to winter conditions, a wooden lid reduced CH4 emissions of
untreated slurry. After digestion, CH4 emissions from
uncovered and straw covered slurry were similar, whereas
they were reduced by an additional wooden lid. In summer,
Table 4
Cumulated CH4, NH3, N2O, and greenhouse gas emissions during a winter (100
Treatment Winter experiment
CH4
(g m�3)
NH3
(g m�3)
N2O
(g m�3)
GHG
(kg CO2 eq
Untreated_crust 164.3 a 72.5 a 44.0 a 17.1
Untreated_cover 142.0 b 52.2 b 38.2 c 14.8
Biogas 111.3 c 62.0 c 40.1 b 14.8
Biogas_straw 114.5 c 49.6 b 39.9 b 14.8
Biogas_straw_cover 81.1 d 48.7 b 40.7 b 14.3
Different letters within columns indicate significant differences at p < 0.05.
uncovered digested slurry showed the highest NH3 emis-
sions. They could be reduced by a layer of chopped straw,
and even further by a layer of chopped straw and a wooden
lid. Cumulated N2O emissions showed a linear increase
throughout the measurement period (Amon et al., 2004).
Covering of untreated slurry with a wooden lid increased
N2O emissions, whereas the combination of chopped straw
and a wooden lid decreased N2O emissions from digested
slurry.
During summer storage, total GHG emissions from
untreated slurry were nearly twice as high as from digested
slurry. A wooden cover reduced GHG emissions for both
substrates. As in winter, a layer of chopped straw alone did
not mitigate GHG emissions from digested slurry.
The overall GHG emissions were three to five times
higher in summer compared to the winter experiment.
During summer, NH3 and N2O emissions increased by a
factor of <4 and <2, respectively. But CH4 emissions were
at least 10 times higher during summer compared to the
winter experiment (Table 4).
3.3. Field application
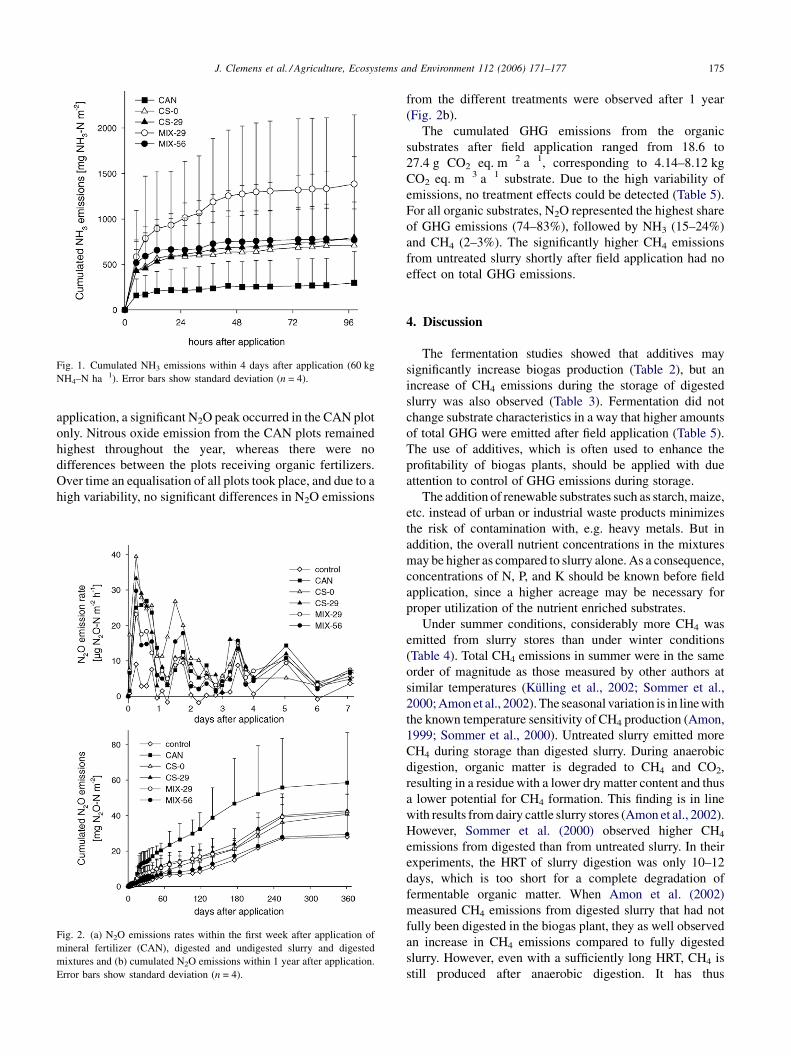
Cumulated NH3 emissions after field application are
shown in Fig. 1. For all substrates emissions were highest
during the first 4 h and reached 73–86% of total emissions
during the first day after application. Only minor emissions
were found after 2 days.
Total NH3 emissions ranged from 0.3 to 1.4 g NH3–N
m�2, representing 5–23% of the NH4–N applied in slurry.
Because of the high variability among replicate plots, no
significant differences between treatments were found.
Substantial CH4 emissions were observed only for a short
time after substrate application (data not shown). Within the
first 4 h after application more than 90% of the total CH4 was
emitted, and after 2 days, CH4 emissions from slurry
treatments did not differ from control plots. Total CH4
emissions from untreated cattle slurry were highest. No
significant differences were observed between untreated and
digested substrates.
During the first day, all fertilised plots showed an increase
in N2O emissions (Fig. 2a), but no significant differences in
cumulated emissions were observed between fertilized and
control plots after a week. At the first rainfall 10 days after
-day) and summer (140-day) storage experiment
Summer experiment
. m�3)
CH4
(g m�3)
NH3
(g m�3)
N2O
(g m�3)
GHG
(kg CO2 eq. m�3)
3591.2 a 110.5 a 48.7 a 90.5
2999.0 b 60.0 b 58.6 b 81.1
1154.2 c 222.5 c 72.4 c 46.7
1191.9 c 125.7 a 75.7 c 48.5
1021.4 d 78.1 d 61.4 b 40.5
J. Clemens et al. / Agriculture, Ecosystems and Environment 112 (2006) 171–177 175
Fig. 1. Cumulated NH3 emissions within 4 days after application (60 kg
NH4–N ha�1). Error bars show standard deviation (n = 4).
application, a significant N2O peak occurred in the CAN plot
only. Nitrous oxide emission from the CAN plots remained
highest throughout the year, whereas there were no
differences between the plots receiving organic fertilizers.
Over time an equalisation of all plots took place, and due to a
high variability, no significant differences in N2O emissions
Fig. 2. (a) N2O emissions rates within the first week after application of
mineral fertilizer (CAN), digested and undigested slurry and digested
mixtures and (b) cumulated N2O emissions within 1 year after application.
Error bars show standard deviation (n = 4).
from the different treatments were observed after 1 year
(Fig. 2b).
The cumulated GHG emissions from the organic
substrates after field application ranged from 18.6 to
27.4 g CO2 eq. m�2 a�1, corresponding to 4.14–8.12 kg
CO2 eq. m�3 a�1 substrate. Due to the high variability of
emissions, no treatment effects could be detected (Table 5).
For all organic substrates, N2O represented the highest share
of GHG emissions (74–83%), followed by NH3 (15–24%)
and CH4 (2–3%). The significantly higher CH4 emissions
from untreated slurry shortly after field application had no
effect on total GHG emissions.
4. Discussion
The fermentation studies showed that additives may
significantly increase biogas production (Table 2), but an
increase of CH4 emissions during the storage of digested
slurry was also observed (Table 3). Fermentation did not
change substrate characteristics in a way that higher amounts
of total GHG were emitted after field application (Table 5).
The use of additives, which is often used to enhance the
profitability of biogas plants, should be applied with due
attention to control of GHG emissions during storage.
The addition of renewable substrates such as starch,maize,
etc. instead of urban or industrial waste products minimizes
the risk of contamination with, e.g. heavy metals. But in
addition, the overall nutrient concentrations in the mixtures
may be higher as compared to slurry alone. As a consequence,
concentrations of N, P, and K should be known before field
application, since a higher acreage may be necessary for
proper utilization of the nutrient enriched substrates.
Under summer conditions, considerably more CH4 was
emitted from slurry stores than under winter conditions
(Table 4). Total CH4 emissions in summer were in the same
order of magnitude as those measured by other authors at
similar temperatures (Kulling et al., 2002; Sommer et al.,
2000;Amon et al., 2002). The seasonal variation is in linewith
the known temperature sensitivity of CH4 production (Amon,
1999; Sommer et al., 2000). Untreated slurry emitted more
CH4 during storage than digested slurry. During anaerobic
digestion, organic matter is degraded to CH4 and CO2,
resulting in a residuewith a lower dry matter content and thus
a lower potential for CH4 formation. This finding is in line
with results fromdairy cattle slurry stores (Amon et al., 2002).
However, Sommer et al. (2000) observed higher CH4
emissions from digested than from untreated slurry. In their
experiments, the HRT of slurry digestion was only 10–12
days, which is too short for a complete degradation of
fermentable organic matter. When Amon et al. (2002)
measured CH4 emissions from digested slurry that had not
fully been digested in the biogas plant, they as well observed
an increase in CH4 emissions compared to fully digested
slurry. However, even with a sufficiently long HRT, CH4 is
still produced after anaerobic digestion. It has thus

J. Clemens et al. / Agriculture, Ecosystems and Environment 112 (2006) 171–177176
Table 5
GHG emissions after field application of digested slurry
N2O emission (1 year)
(mg N2O–N m�2)
NH3 emission (4 days)
(mg NH3–N m�2)
CH4 emission (4 days)
(mg CH4–C m�2)
CO2 equivalents
(g CO2 m�2 a�1)
CO2 equivalents
(kg CO2 m�3 a�1)
Control 28.0 (12.38) 0.8 (0.83) 13.7
CAN 58.6 (28.16) 298 (344) 1.9 (1.37) 30.0
CS-0 40.7 (11.30) 711 (475) 27.1 (6.97) 24.0 4.2
CS-29 42.7 (16.32) 797 (889) 16.1 (3.28) 25.1 5.9
MIX-29 41.6 (10.52) 1385 (761) 15.2 (4.16) 27.4 8.1
MIX-56 29.5 (12.33) 768 (334) 20.6 (2.79) 18.6 5.1
CAN: mineral fertilizer; CS: cattle slurry; MIX: digested cattle slurry and potato starch; numbers: 0, 29, 56: days of treatment in the biogas plant; in brackets:
standard deviation; (n = 4).
recommendable to include all stores of biogas plants in the gas
bearing system for complete collection of CH4 and optimum
environmental and economic benefit.
A wooden cover significantly reduced CH4 emissions
from untreated and digested slurry. A cover may shelter the
natural surface crust from rain and help to keep it dry during
winter, but also help to prevent excessive drying during
summer.Methane oxidation has been suggested to take place
in surface crusts (Sommer et al., 2000), and Petersen (2004)
recently provided direct evidence for the presence and
activity of methanotrophs in this environment.
Addition of a wooden cover reduced NH3 emissions from
untreated slurry compared to emissions with a natural
surface crust alone. This is in line with, e.g. De Bode (1991)
and UN/ECE (2002). In winter, NH3 losses from digested
slurry were similar to those from untreated slurry. In
summer, NH3 emissions from biogas slurry were twice as
high as those from untreated slurry. Whereas winter
emissions were at a low level with all treatments, the warm
weather during summer storage enhanced NH3 emissions
especially from digested slurry. Denmead et al. (1982)
developed a regression equation that estimates NH3 losses
from NH4–N content, temperature, and pH. They showed
that a rise in temperature results in higher NH3 emissions
especially if slurry NH4–N content and pH are high. With a
layer of chopped straw, NH3 emissions were nearly as high
as from uncovered, untreated slurry. A wooden cover
reduced NH3 emissions by 65% compared to uncovered
digested slurry. Hence, mitigation of NH3 emissions is
another reason to cover slurry storages at biogas plants.
No distinct differences in N2O emissions between
summer and winter conditions were observed. This is in
line with Sommer et al. (2000), who did not find an influence
of temperature on the level of N2O emissions. Nitrous oxide
is produced from nitrification of NH4 in aerobic zones and
from subsequent denitrification in anaerobic zones. Petersen
(2004) showed that nitrite and nitrate was present in both the
natural surface crust and the straw layer of the same pilot-
scale stores investigated in the present study. Sommer et al.
(2000) found N2O emissions from slurry stores only during
drying conditions, i.e. when the water balance was negative.
In the present study, digested slurry emitted more N2O than
untreated slurry during summer. This might be due to
differences in NH4–N content or structure of the two
materials influencing the potential for nitrification and
denitrification.
Nitrous oxide emissions will be eliminated by gas-tight
cover because the headspace contains no oxygen, a
prerequisite for N2O formation. Stores with a gas-tight
cover can be built on farms with a biogas plant with the
additional advantage that CH4 formed during storage can be
used for electricity production.
Net total GHG emissions were always lower when a
wooden lid was placed on the slurry tank, while a layer of
chopped straw did not reduce GHG emissions. The
reduction was 13.5% (untr_cover), and 3.4% (biogas_-
straw_cover) during winter storage, and 10.4% (untr_cover),
and 3.4 % (biogas_straw_cover) during summer storage.
The NH3 emissions after field application were relatively
low as compared to other studies (Vandre et al., 1997; Wulf
et al., 2002a). This may be due to the trail hose application
we used in this study. It is a technique that reduces NH3
emissions compared to, e.g. broadcast application because
the slurry has an improved soil surface contact.
The temporal dynamics of CH4 emissions were in line
with other studies by Flessa and Beese (2000) and Sommer
et al. (1996). No further CH4 production occurred within the
slurry band after application. This may be due to dry and
cold conditions during the first week of the experiment when
temperatures fell below 0 8C during night time. Other field
experiments under warmer and wet soil conditions indicated
a CH4 production from surface-applied undigested slurry for
up to 4 days (Wulf et al., 2002b). The higher CH4 emissions
from untreated slurry can be ascribed to the higher CH4
production during storage.
Nitrous oxide emissions ranged from 290 to 407 g N2O–
N ha�1 a�1. This corresponds to 0.5–0.7% of the applied
NH4–N and is in line with other studies (Petersen, 1999;
Wulf et al., 2002b). In contrast to results from a laboratory
study (Clemens and Huschka, 2001), there were no
significant differences between untreated and digested
slurry. The high N2O emissions from CAN were probably
due to the higher mineral N-input because in CAN 50% of
the mineral N is in the form of nitrate. Thus, an application
of 60 kg NH4+–N resulted in an overall input of 120 kg
mineral N ha�1, whereas in the slurry treatments, an

J. Clemens et al. / Agriculture, Ecosystems and Environment 112 (2006) 171–177 177
application of 60 kg NH4+–N results in an additional input of
partly stabilized organic N, and not nitrate.
5. Conclusions
Anaerobic digestion has a high potential to mitigate GHG
emissions from cattle slurry. Co-digestion of slurry with
additives such as waste starch results in a much higher gas
yield, but the HRT must be sufficiently long to exploit the
potential for gas production without increasing GHG
emissions during subsequent storage and field application.
In the present study,GHGemissions fromopen storeswere
more important than emissions after field application. A layer
of chopped strawwas no reliablemeasure to reduceGHG and
NH3 emissions during slurry storage. In biogas plants, stores
should have a gas-tight cover because CH4 can be collected
for electricity production, and no NH3 and N2O can be
emitted. With a gas-tight cover, GHG emissions will then
mainly occur after field application. In this study, GHG
emissions from untreated and digested slurry after field
applicationwere relatively low and not significantly different.
Biogas production is a very efficient way to reduce the
GHG emissions both through production of renewable
energy and through avoidance of uncontrolled GHG
emissions into the atmosphere during manure management.
Acknowledgement
The studies were financially supported by the EU (EVK2-
CT-2000-00096 (MIDAIR).
References
Amon, B., 1999. NH3,- N2O- und CH4-Emissionen aus der Festmistver-
fahrenskette Milchviehanbindehaltung Stall – Lagerung – Ausbringung.
Dissertation, Universitat fur Bodenkultur Wien, Institut fur Land-,
Umwelt- und Energietechnik. In: Verein deutscher Ingenieure, Max-
Eyth-Gesellschaft (Eds.), MEG-Schrift Nr. 331.
Amon, B., Kryvoruchko, V., Amon, T., Beline, F., Petersen S.O., 2004.
Quantative effects of storage conditions on GHG emissions from cattle
slurry, and N2O and CH4 turnover inside natural surface crusts, deliver-
able No. 5.5 within the Workpackage 5 within the MIDAIR project
(http://www.energetik-leipzig.de/Midair/Reports/WP5_2%20Deliv%
205_5.pdf).
Amon, B., Moitzi, G., Schimpl, M., Kryvoruchko, V., Wagner-Alt, C., 2002.
Methane, Nitrous Oxide and Ammonia Emissions fromManagement of
Liquid Manures, Final Report 2002. On behalf of ‘‘Federal Ministry of
Agriculture, Forestry, Environmental and Water Management’’ and
‘‘Federal Ministry of Education, Science and Culture’’.
Clemens, J., Huschka, A., 2001. The effect of biological oxygen demand of
cattle slurry and soil moisture on nitrous oxide emissions. Nutr. Cycl.
Agroecosyst. 59, 193–198.
De Bode, M., 1991. Odour and ammonia emissions from manure storage.
In: Nielsen, V.C., Voorburg, J.H., L’Hermite, P. (Eds.), Odour and
Ammonia Emissions from Livestock Farming. Elsevier Applied
Science, London and New York, pp. 59–66.
Denmead, O., Freney, L., Simpson, J., 1982. Dynamics of ammonia
volatilization during furrow irrigation of maize. Soil Sci. Soc. Am. J.
46, 149–155.
Ellenberg, H., 1992. Okologische Veranderungen in Biozonosen durch
Stickstoffeintrag. In: Kuratorium fur Technik und Bauwesen in der
Landwirtschaft, e.V. (KTBL). Ammoniak in der Umwelt, Munster-
Hiltrup, Munster, pp. 44.1–44.24.
Flessa, H., Beese, F., 2000. Laboratory estimates of trace gas emission
following injection of cattle slurry. J. Environ. Qual. 29, 262–267.
Hilhorst, M.A., Mele, R.W., Willers, H.C., Groenestein, C.M., Moneny,
G.J., 2001. Effective strategies to reduce methane emissions from
livestock. ASAE, Paper no 01-4070, pp. 1–8.
Husted, S., 1994. Seasonal variation in methane emission from stored slurry
and solid manures. J. Environ. Qual. 23, 585–592.
Huther, L., 1999. Entwicklung analytischer Methoden und Untersuchung
von Einflußfaktoren auf Ammoniak-, Methan- und Distickstoffmonox-
idemissionen aus Flussig- und Festmist. Landbauforschung Volkenrode,
Sonderheft 200, Braunschweig.
IPCC (Intergovernmental Panel on Climate Change), 1996. Climate Change
1995. In: Houghton, J.T., Meira Filho, L.G., Callander, B.A., Harris N.,
Kattenberg, A., Maskell, K. (Eds.), The Science of Climate Change,
Cambridge University Press, Cambridge, p. 572.
IPCC/OECD/IEA, 1997. Revised 1996 IPCC guidelines for national green-
house gas inventories, vol. 3. UK Meteorological Office, Bracknell.
Kulling, D.R., Dohme, F., Menzi, H., Sutter, F., Lischer, P., Kreuzer, M.,
2002. Methane emissions of differently fed dairy cows and correspond-
ing methane and nitrogen emissions from their manure during storage.
Environ. Monit. Assess. 79 (2), 129–150.
Kuhn, E., 1998. Kofermentation. Arbeitspapier 249. Kuratorium fur Tech-
nik und Bauwesen in der Landwirtschaft (KTBL), Darmstadt.
Petersen, S.O., 1999. Nitrous oxide emissions from manure and inorganic
fertilizers. J. Environ. Qual. 28, 1610–1618.
Petersen, S.O., 2004. Potential for CH4 oxidation and N2O formation in
slurry storages. In: Weiske, A. (Ed.), Greenhouse Gas Mitigation for
Organic and Conventional Dairy Production, final report to the EU
project EVK2-CT-2000-00096 (MIDAIR).
Sommer, S.G., Petersen, S.O., Sogaard, H.T., 2000. Greenhouse gas emis-
sion from stored livestock slurry. J. Environ. Qual. 29, 744–751.
Sommer, S.G., Sherlock, R.R., Khan, R.Z., 1996. Nitrous oxide and
methane emissions from pig slurry amended soils. Soil Biol. Biochem.
28, 1541–1544.
UN/ECE Executive body for the convention on long-range transboundary
air pollution, Working Group on Strategies, 2002. Control techniques
for preventing and abating emissions of ammonia, Version July 2002.
Vandre, R., Clemens, J., Goldbach, H., Kaupenjohann, M., 1997. Ammonia
and nitrous oxide emissions after land spreading of slurry as influenced
by application techniques and dry matter-reduction: I NH3 emissions. Z.
Pflanzenernahr. Bodenk. 160, 303–307.
Vandre, R., Kaupenjohann, M., 1998. In situ measurement of ammonia
emissions from organic fertilizers in plot experiments. Soil Sci. Soc.
Am. J. 62, 467–473.
Velthof, G.L., Oenema, O., 1995. Nitrous oxide fluxes from grassland in the
Netherlands. I. Statistical analysis of flux chamber measurements. Eur.
J. Soil Sci. 46, 533–540.
Weiland, P., Rieger, Ch., Ehrmann, Th., Helffrich, D., Kissel, R., Melcher,
F., 2004. Biogasmessprogramm – Bundesweite Bewertung von Bioga-
sanlagen aus technologischer Sicht. In: KTBL, Der Landwirt als
Energieerzeuger. Landwirtschaftsverlag Munster-Hiltrup, pp. 70–77.
Wulf, S., Maeting, M., Clemens, J., 2002a. Effect of application technique
on the emission of trace gases (NH3, CH4, N2O) after spreading co-
fermented slurry on arable and grassland. Part I. Ammonia volatilisa-
tion. J. Environ. Qual. 31, 1789–1794.
Wulf, S., Maeting, M., Clemens, J., 2002b. Effect of application technique
on the emission of trace gases (NH3, N2O, CH4) after spreading co-
fermented slurry on arable and grassland. Part II. Greenhouse gas
emissions. J. Environ. Qual. 31, 1795–1801.