mississippi river crossing conceptual feasibility report - final · 2017-10-31 · mississippi...
TRANSCRIPT


Tennessee Department of Transportation Toll Feasibility Study Mississippi River Crossing Conceptual Feasibility Report - FINAL
EXECUTIVE SUMMARY
Across the country, all levels of government are coming to grips with the fiscal challenges created by increased demand for new transportation infrastructure and the need to maintain the existing transportation networks within the constraints of existing funding mechanisms. In Tennessee, the public sector has financed transportation infrastructure through a combination of state and local taxes and fees and, for major projects, Federal funding from the allocation of the national motor fuel taxes. These resources have been combined to fund projects on a "pay-as-you-go" basis, meaning that projects have often been built in phases as funds became available over a period of years.
Currently, the state’s gas tax revenues are virtually flat and the Tennessee Department of Transportation’s (TDOT) budget has been impacted by federal rescissions totaling nearly $238 million since December 2005. These issues coupled with rising construction costs have severely impacted the Department’s ability to initiate any new projects. Tennessee is faced with the reality that critical projects may face years of delay before funding is available. Delaying these projects results in hidden costs associated with inflation and unrealized economic development, especially for projects delayed several years. In addition, delaying projects that reduce emissions or eliminate safety hazards has obvious negative impacts on quality of life issues for Tennessee residents.
In recognition of these factors, TDOT retained the firm of Wilbur Smith Associates (WSA) to begin exploring the potential for the use of tolls by the State to advance the proposed Mississippi River Bridge near Memphis, Tennessee. WSA conducted a Sketch Traffic and Revenue Study for the crossing, which culminated in the preparation of this Conceptual Toll Feasibility Report. The findings of this report should be considered conceptual in nature and are conditioned on the statements contained within this report.
In conducting this study, WSA performed three basic analyses: a sketch level traffic and revenue study; an opinion of project costs; and a conceptual plan of finance, as discussed more fully within this report. WSA also began applying various quantitative and qualitative criteria to the crossing to help formulate conclusions concerning the toll feasibility.
Based on the analysis contained within this Conceptual Toll Feasibility Report, it is WSA’s conclusion, that as studied, each of the five alternatives will require some level of public contributions in addition to the revenues generated from tolls. Should TDOT wish to continue to study these alternatives as toll projects, WSA would recommend the following steps:
• Concentrate future studies on Alternatives 3, 4, and 5. • Evaluate the potential revenue that would be generated if the intermediate interchanges included in
Alternatives 3 and 4 were tolled. • Refine the Memphis MPO Travel Demand Model by disaggregating the traffic zones within West
Memphis, Arkansas.
February 4, 2009

Tennessee Department of Transportation Toll Feasibility Study Mississippi River Crossing Conceptual Feasibility Report - FINAL
• Investigate the potential of establishing some form of loan program, or infrastructure bank, with non-TDOT entities, that would allow for the required public contributions to be funded on a subordinated basis and paid back from uncommitted net toll revenues.
• Conduct additional studies of the approaches to refine the alignments and costs necessary to maximize revenue for each potential alignment.
February 4, 2009
Tennessee Department of Transportation Toll Feasibility Study Mississippi River Crossing Conceptual Feasibility Report - FINAL
Table of Contents
Introduction Project Description Environmental Overview Evaluation Categories
Regional Transportation System Environmental Right-of-Way Construction and Engineering Corridor Socio-Economics Traffic and Revenue Financial Considerations
Conclusions and Next Steps
List of Illustrations
Table 1, Toll Feasibility Checklist Table 2, Construction and Toll Systems Costs Table 3, Proposed Tolling Rates Table 4, Gross and Net Revenue MS River Bridge - Alternative 1 Table 5, Gross and Net Revenue MS River Bridge - Alternative 2 Table 6, Gross and Net Revenue MS River Bridge - Alternative 3 Table 7, Gross and Net Revenue MS River Bridge - Alternative 4 Table 8, Gross and Net Revenue MS River Bridge - Alternative 5 Table 9, MS River Bridge Project Bonding Capacity Table 10, MS River Bridge Project Conceptual Plans of Finance
List of Figures
Figure 1, Project Location Map
Page Number ……………………………………………………………………………...…………1 ……………………………………………………………………………...…………2 ……………………………………………………………………………...…………4 ……………………………………………………………………………...…………6 ……………………………………………………………………………...…………6 ……………………………………………………………………………………...…7 ………………………………………………………………………………………...7 ……………………………………………………………………………………...…8 ……………………………………………………………………………………..….9 …………………………………………………………………………………….…..9 ………………………………………………………………………………….…….17 …………………………………………………………………………….....……… 21
Page Number ……………………………………………………………………………...…………6
……………………………………………………………………………...…………8 ……………………………………………………………………………...…………11
……………………………………………………………………………...………...12
……………………………………………………………………………...………...13
……………………………………………………………………………...………...14
……………………………………………………………………………...………...15
……………………………………………………………………………...………...16 ……………………………………………………………………………...………...18
……………………………………………………………………………...………...19
Page Number ……………………………………………………………………………...…………3
February 4, 2009

Tennessee Department of Transportation Toll Feasibility Study Mississippi River Crossing Conceptual Feasibility Report - FINAL
INTRODUCTION
Determining the feasibility of a toll project is an iterative process. The first step is to screen a project to develop an initial understanding of the potential traffic and revenue characteristics of that project. This step usually requires either a Conceptual Toll Feasibility Analysis and Sketch Traffic and Revenue Study, both of which are considered planning level studies and are designed to assist in furthering the normal planning process required by all transportation projects. Subsequent to a sketch level traffic and revenue study, additional analyses are conducted to consider potential revenues compared to potential project costs to determine whether the subject project is considered conceptually feasible. The conceptual feasibility study normally results in a series of recommendations to the developing agency regarding how, and if, the project should proceed.
At the request of the Tennessee Department of Transportation (TDOT), Wilbur Smith Associates (WSA) has completed a sketch level traffic and revenue study and this conceptual feasibility report for a proposed third crossing of the Mississippi River near Memphis, Tennessee. These studies look at the potential revenue and resulting bonding capacity that could be generated by tolling this proposed third river crossing, and the results of this study will facilitate the planning process by providing information concerning the potential for funding the various alternative crossing locations. Depending upon a number of factors inherent in the transportation planning process, modifications and updates may be needed as competing routes and modes are added to regional plans, project configurations change, and/or land use patterns evolve.
The subject traffic and revenue and toll feasibility study for the Mississippi River Bridge was conducted for a series of five (5) different crossing alternatives as identified in a previous Mississippi River Crossing Feasibility and Location Study conducted for TDOT. Each of the five crossing alternatives was evaluated for its potential toll feasibility and recommendations were made to TDOT regarding which, if any, of the five alternatives should be advanced for a Tier II Toll Feasibility analysis. These studies were conducted in concert with TDOT, the Memphis and West Memphis Metropolitan Planning Organizations (MPO), and a group of area stakeholders as identified by TDOT.
In addition to the traffic and revenue studies, WSA developed an opinion of project costs for each of five identified alternatives. These opinions of project costs were used in analyzing each proposed crossing’s conceptual financial feasibility. Bonding capacity was estimated utilizing a traditional public toll authority financial model. These cost and bonding estimates (contained herein) are conceptual in nature and are provided as inputs into a screening process to help determine the direction that future planning efforts will take for the proposed river crossing.
Traffic and revenue studies, by themselves, do not determine project feasibility, though such studies are significant factors in undertaking such an analysis. Subsequent planning steps are usually taken once a sketch level traffic and revenue study is completed and it has been determined that a project has the potential to move forward. This planning process often incorporates an analysis of the project in the context of a regional or statewide transportation plan, major investment study, preferred alignment, environmental review, preliminary design and engineering, and the development of a preliminary plan of finance.
February 4, 2009 Page 1

Tennessee Department of Transportation Toll Feasibility Study Mississippi River Crossing Conceptual Feasibility Report - FINAL
PROJECT DESCRIPTION
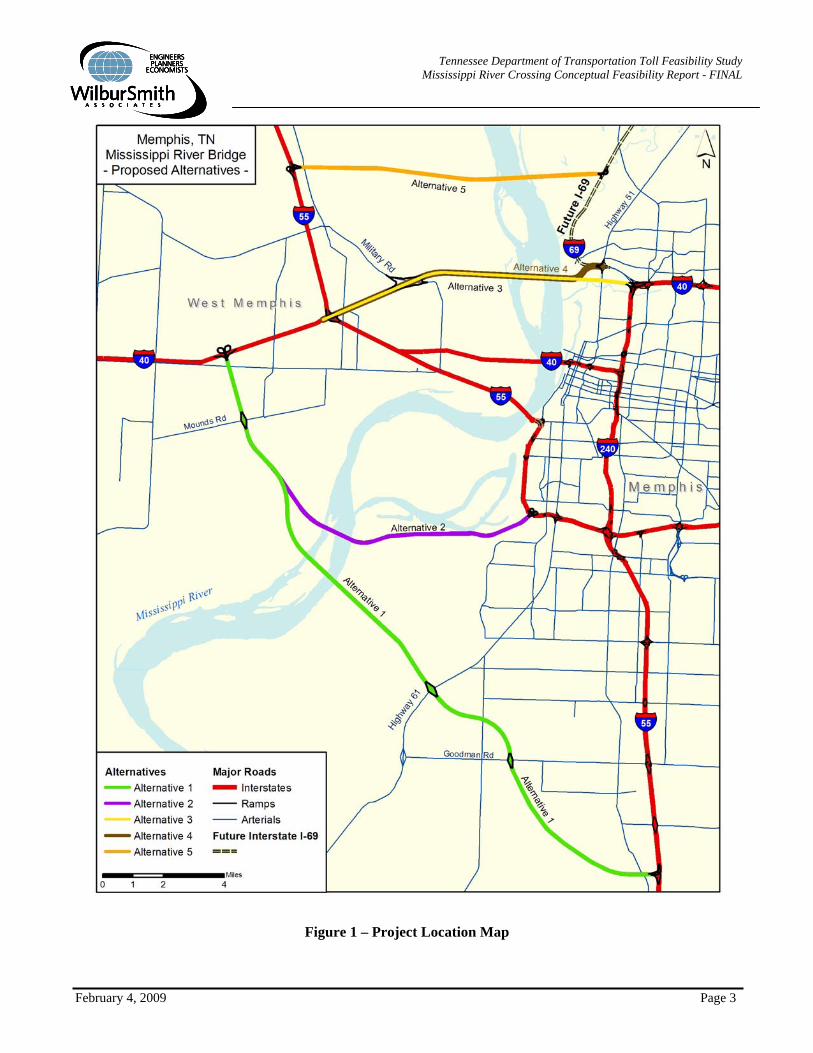
Five alternative river crossings were evaluated for the Mississippi River Bridge. The alternatives run generally in a west-east direction between West Memphis, Arkansas and Memphis, Tennessee. The alternatives are presented in Figure 1 and are based on the results of the 2006 Mississippi River Crossing Feasibility and Location Study. A brief description of each of the five alternatives is presented below:
• Alternative 1 – The western terminus of Alternative 1 is located on Interstate 55 approximately four miles west of the interchange between Interstate 55 and Interstate 40 in West Memphis. Alternative 1 is the most southern alternative with its eastern terminus located on Interstate 55 approximately five miles south of the Tennessee-Mississippi state line. Intermediate full access interchanges are assumed with Mounds Rd, US 61, and Goodman Road. As studied, Alternative 1 is approximately 23.5 miles in length.
• Alternative 2 – The western terminus of Alternative 2 is the same as Alternative 1. The eastern terminus is located near interchange 8 of Interstate 55 southwest of downtown Memphis. Alternative 2 is approximately 13.5 miles in length and includes an intermediate full access interchange with Mounds Rd.
• Alternative 3 – The western terminus of Alternative 3 is located at the interchange between Interstate 55 and Interstate 40 in West Memphis. The alternative proceeds northeast before turning east and terminating at the interchange between Interstate 40 and State Route 300. Alternative 3 has a full access interchange assumed with Mound City Road and is approximately 10 miles in length.
• Alternative 4 – Alternative 4 is quite similar to Alternative 3. The only major difference between Alternatives 4 and 3 is that the eastern terminus of Alternative 4 is located at the interchange between SR 300 and US 51, approximately one mile northwest of the Alternative 3 eastern terminus. Similar to Alternative 3, Alternative 4 is approximately 9.5 miles in length and includes a full access interchange at Mound City Road.
• Alternative 5 – Alternative 5 is the most northern of the five alternatives studied. The western terminus is located along Interstate 55 approximately five miles northwest of its interchange with Interstate 40. The eastern terminus of Alternative 5 is located along US 51 near Firestone Park, north of downtown Memphis. Alternative 5 has no assumed intermediate interchanges and is approximately 10.5 miles in length. Alternative 5 was analyzed based on connectivity to a future Interstate 69. The location of Interstate 69 is included within the Memphis Urban Area Metropolitan Planning Organization (MPO) Long Range Transportation Plan and Travel Demand Model as a future improvement assumed to be in place at the time of a toll road completion.
Figure 1 depicts the proposed alternatives for which WSA was tasked with studying. It is important to note that the specific roadways and intersections needed to connect each proposed bridge location to the regional transportation network were used to facilitate this study. Aside from the work contained in the 2006 Mississippi River Crossing Feasibility and Location Study, WSA is not aware of any other studies concerning these connecting facilities. Prior to determining final alignments, these connectors, as would any new transportation facility, will be subject to the normal environmental and location criteria for a new transportation facility and will be coordinated with the Memphis MPO and appropriate stakeholders in the Memphis area.
February 4, 2009 Page 2
Tennessee Department of Transportation Toll Feasibility Study Mississippi River Crossing Conceptual Feasibility Report - FINAL
Figure 1 – Project Location Map
February 4, 2009 Page 3

Tennessee Department of Transportation Toll Feasibility Study Mississippi River Crossing Conceptual Feasibility Report - FINAL
On September 10, 2008, each of the five Class One railroads (Union Pacific Corporation, Norfolk Southern Corporation, CSX Corporation, Canadian National, and Burlington Northern Santa Fe Railway) which provide service to or through Memphis was contacted concerning their respective level of interest in participating in the proposed third crossing. Two of the five railroads responded. The responses received from the two railroads indicated an interest in a new crossing only to serve as a backup should something happen to the existing rail crossings, but a third crossing was not considered critical to their plans. In this case, payment from the railroads would be based on a pay as you go basis. After discussions with TDOT, it was determined that this approach was an insufficient commitment for a major infrastructure investment. As a result, a rail component of the crossings was not included as part of this study from either a cost or revenue perspective.
For the purpose of this study, it was assumed that the route would open in its entirety to traffic in 2018. This date is based upon estimated timeframes for key development components including approximately 1 year for further tolling and financial analyses, 2 years for environmental document preparation and approval, 2 years for design and construction documents, and the remaining time for construction. These timeframes are in agreement with TDOT planning estimates for project development, but are subject to refinement as the project develops. The roadway was assumed to be a four-lane controlled access facility with grade separated interchanges at various locations. This roadway configuration was considered to be appropriate based on the anticipated Average Annual Daily Traffic that would use the facility. Design speeds were assumed to be 70 miles per hour for rural areas and 55 miles per hour for urban areas.
ENVIRONMENTAL OVERVIEW
Federal legislation mandates that certain aspects of the human and natural environment be examined to determine if a federally funded project will cause adverse impacts. If adverse impacts do occur, then mitigation, including avoidance and minimization, must be set forth within the environmental impact statement. As part of the 2006 Mississippi River Crossing Feasibility and Location Study, an overview of each of the five corridor alternatives was completed to determine the presence of known environmental features that could potentially cause adverse impacts to the proposed corridors.
In addition to the environmental footprinting done in the 2006 Mississippi River Crossing Feasibility and Location Study, a windshield survey was completed as part of this Conceptual Feasibility Study.
This section presents a general overview of the environmental framework of the proposed project area. It outlines key issues that may represent constraints upon project location, including potential Section 106, Section 4(f), ecological elements, and socioeconomic and community impacts.
The information presented is based on readily available public records and archival research. An Environmental Assessment (EA) and/or an Environmental Impact Study (EIS) will be necessary to collect additional primary data and conduct a scoping process to identify and perform a more detailed analysis of issues, impacts, and alternatives. A local area Geographic Information System (GIS) was assembled for the Mississippi River Crossing Feasibility and Location Study using environmental resource data collected from numerous sources, including
February 4, 2009 Page 4

Tennessee Department of Transportation Toll Feasibility Study Mississippi River Crossing Conceptual Feasibility Report - FINAL
agency contacts and federal, state, and local databases. From this, an environmental footprint was developed, which identifies potential issues within and surrounding the project area. Please refer to Exhibit 5-1, Preliminary Environmental Data, in the 2006 Mississippi River Crossing Feasibility and Location Study.
Key environmental features that were considered as part of the 2006 Mississippi River Crossing Feasibility and Location Study that may potentially impact the development of the proposed toll corridor alternatives are listed here.
• Community impacts, environmental justice populations, and other socioeconomic factors • Air Quality • Physiographic Conditions • Farmland • Wetlands • Water Resources • Threatened and Endangered Species • Hazardous Materials • Section 106 and Section 4(f) • Historic Sites • Public Parks • Wildlife/Waterfowl Refuges
Major environmental concerns identified in the study area are as follows: • Shelby County, Tennessee and West Memphis, Arkansas have been found to be in non-attainment for
ozone under the new National Ambient Air Quality Standards (NAAQS) 8-hour requirements. An Environmental Action plan is underway in each area, in cooperation with the US EPA.
• There are areas of prime farmland spotted throughout the study area. • There are several lakes, creeks, and unnamed streams to be given consideration in determining
adverse impacts to water resources. • Most of the study area lies within the Mississippi River floodplain. • The only federally endangered species identified is the Interior Least Tern. The Bald Eagle is listed as
a federally threatened species in all three counties, although it is currently being considered for removal from the list.
• There are potential UST/HAZMAT sites in the study area which should be addressed in future project phases.
• Potential Section 106 and/or Section 4(f) resources that have been identified include: o Four historical sites, including the Interstate 55 bridge; o Eight public parks or areas; and o One wildlife refuge area.
February 4, 2009 Page 5

Tennessee Department of Transportation Toll Feasibility Study Mississippi River Crossing Conceptual Feasibility Report - FINAL
EVALUATION CATEGORIES
WSA has developed a checklist of items that could impact the feasibility of a new toll facility. These items are listed in Table 1 and are organized around seven main categories. Each of these main categories contains multiple subcategories or criteria. To a great extent the items on the checklist are interdependent. It is important to note that the applicability and/or the weight given to a specific factor are dependent upon the characteristics and objectives of the toll project and the sponsoring agency. In the final analysis, toll projects, regardless if developed by a public entity or through a public private partnership, are essentially public assets and are subject to the public policy of the sponsoring entity.
As mentioned above, the applicability and/or weighting of any of the sub-categories contained in Table 1 are dependent upon project-specific factors. This Conceptual Toll Feasibility Report is not intended to provide an extensive analysis of each of these characteristics. The type of analysis needed to determine a project’s final feasibility is more appropriately a part of the planning process for a project and would include defining what issues are relevant to a project and the respective weight of these issues.
As such, the analysis of this conceptual feasibility report will be focused on the major categories rather than trying to determine the applicability of each of the sub items.
Regional Transportation System
Table 1
Regional Transportation System a) Traffic movements to be served b) Existing Alternative Routes c) Future planned networks d) Other planned transportation improvements
Environmental a) Major Investment Study b) Designation of preferred alignment c) Cost implications of mitigation requirements d) Projected timeline for environmental clearance e) Full EIS versus environmental assessment (FONSI)
Right-of-Way a) Number of takes b) Project costs c) Acquisition timetable d) 4F Issues e) Utility Issues
Construction/Engineering a) Uniqueness of engineering/construction requirements b) Required Permits c) Constructability d) Construction schedule e) Project Costs f) Bonding requirements
Corridor Socio-Economic Data a) Land use plans b) Population growth c) Projected non-residential activity d) Income Levels e) Household size
Traffic and Revenue a) Project configuration b) Project interconnectivity c) Value of time calculations d) Time/distance savings e) Corridor share f) Toll regimes g) Typical movements
Financial Considerations a) Project financial structure b) State/Local contribution c) Federal programs d) General Financial Market Conditions
Toll facilities need to fit within the overall regional transportation system, which, in this case, is overseen by the Memphis Urban Area Metropolitan Planning Organization (Memphis MPO).
While there is inclusion of a potential MS River Crossing in the Memphis MPO regional transportation plan, none of the five crossing alternatives studied, nor their connecting routes, are specifically identified and contained within the regional transportation plan. Should TDOT decide to move forward with one of these crossing alternatives, the necessary studies required for incorporation into the Memphis MPO regional transportation system will need to be conducted.
February 4, 2009 Page 6
Tennessee Department of Transportation Toll Feasibility Study Mississippi River Crossing Conceptual Feasibility Report - FINAL
As part of the tolling related studies, WSA reviewed the economic benefit of a third river crossing as identified in the 2006 Mississippi River Crossing Feasibility and Location Study. In the 2006 study, it was estimated that if existing bridges were lost to an earthquake or other catastrophic event, regional economic impacts could be in the range of $4.25 billion annually. Furthermore, completion of a new bridge could result in a $2.2 billion increase in Gross Regional Product and a $1.5 billion increase in personal income over a 20 year span. While this economic benefit and economic impact discussion is important to the consideration of a third crossing, it is not considered relevant to the toll analysis or potential toll feasibility.
Environmental Toll facilities are not exempt from applicable federal and state environmental review requirements. The environmental clearance process has a significant impact on the feasibility of any transportation project, but especially so in the case of a toll facility. In addition to the typical studies needed for the environmental process, toll projects need to study the economic impact of charging tolls on the facility.
TDOT has not yet begun the environmental process for a new Mississippi River crossing and it is anticipated that all identified alternatives could face environmental issues. This study only documents the environmental information gathered as part of the 2006 Mississippi River Crossing Feasibility and Location Study, as well as a windshield survey conducted for each of the proposed alternative routes and bridge locations.
In addition to those environmental issues discussed above, the following environmental challenges were noted as part of this study. Alternative 2, as evaluated, would run through a very tight corridor between a large rail yard and the Valero oil refinery. Then it continues along the northern edge of T.O. Fuller State Park and just south of the Tennessee Valley Authority Allen Fossil Plant and T.E. Maxson Wastewater Treatment Plant. Both Alternatives 3 and 4 run between General DeWitt Spain Airport and Maynard C. Stiles Wastewater Treatment Plant. These are but some of the environmental issues that will need to be addressed as any specific alternative progresses in the toll feasibility process through additional studies. For the purposes of this conceptual feasibility study, an attempt was made to locate each of these alternatives in order to avoid known major environmental sites.
Right-of-Way Right-of-way for transportation projects is typically acquired subject to eminent domain procedures. As such the right-of-way acquisition process has well established federal and state laws and requirements. In rare cases, landowners will donate or “proctor” right-of-way for toll facilities in order to benefit from increased land values resulting from improved access provided by the facility.
It should be recognized that a new Mississippi River crossing is in the early planning phase at this time. Once an alternative or alternatives are selected to proceed further in the development process, design for the project would begin and preliminary plans must be developed and approved. Once preliminary plans are completed, right-of-way plans will be developed and right-of-way acquisition will begin. While there are issues associated with
February 4, 2009 Page 7

Tennessee Department of Transportation Toll Feasibility Study Mississippi River Crossing Conceptual Feasibility Report - FINAL
acquiring right-of-way for this project, particularly in the urbanized areas of Memphis, these issues appear to be typical for a project of this nature.
Construction and Engineering For the purposes of this conceptual feasibility study, WSA provided conceptual level opinions of construction and engineering costs for the project which include both the river crossing and the connector roadways necessary to link the crossing to the regional transportation network. It should be pointed out that constructability issues could arise with any of the alternatives, but particularly for Alternatives 2, 3, and 4. These issues are due to the fact that they are in urbanized environments and, therefore, will encounter much more existing infrastructure than would a project in an undeveloped area. The urbanized nature of these alignments could also result in increased construction cost and in environmental impacts and mitigation as previously discussed. The construction costs for this analysis were developed consistent with the TDOT planning level cost estimation methods which include recognition of increased costs for urban area projects as compared to rural area projects, and this has been reflected in the construction costs presented in Table 2.
WSA has also developed an opinion of costs to construct the toll collection system for the project. The costs included items such as mainline structures and appurtenances, communications equipment, power systems, signage, manual and electronic toll collection systems, vehicle detection and violation triggers, a violation enforcement system, lane and host processing, security access and control, and project delivery costs. Factors not included in the construction costs include utility infrastructure costs, additional warranties or maintenance, and pavement and pavement marking costs. Opening year 2018 system capital costs were calculated by inflating estimated 2008 costs by an assumed inflation factor of 2.5 percent per year. The 2.5 percent reflects an assumption that those costs will rise at a slightly lower rate than the assumed general rate of inflation. After inflation, 2018 toll facility and system capital costs were found to be approximately $8.7 million. This cost does not vary by alternative.
Project construction costs were also inflated Table 2 to 2018, using a year of expenditure Construction and Toll Systems Costs method. An inflation rate of 7.5% is (2018 $ Million ) applied to the project cost for the first three Alternatives years through 2010, and a 3% inflation rate 1 2 3 4 5 is applied to the project cost from 2010 until the year construction is completed. Table 2 Construction $995.8 $781.2 $699.8 $649.1 $647.5 sets forth the estimated project costs by Toll Systems $ 8.7 $ 8.7 $ 8.7 $ 8.7 $ 8.7 alternative, and by each major cost Est. Cost $1,004.5 $798.9 $708.5 $657.8 $656.2 category.
It is important to note that these estimates exclude environmental, right-of-way, and engineering costs. The working assumption is that these developmental costs will need to be incurred prior to toll revenue debt being issued to pay for the project. These developmental costs would not be paid out of the proceeds generated by the toll revenue financing, but instead would be repaid from toll revenues in excess of operations and maintenance,
February 4, 2009 Page 8

Tennessee Department of Transportation Toll Feasibility Study Mississippi River Crossing Conceptual Feasibility Report - FINAL
debt services, and any required reserve requirements. Consequently, for purposes of this study these costs have been excluded from project costs.
Table 2 sets forth the estimated project cost for the project, and each of the associated scenarios. As the project becomes better defined during the normal planning process these project costs will need to be refined. Additional factors that could impact these estimates include mitigation costs, specific subsurface conditions, U.S. and local economic conditions, and materials costs.
Corridor Socio-Economics The economic growth forecast for the study region is particularly important for a start-up toll facility such as this project. The configuration and alignments under study would provide significantly improved access for drivers with origins or destinations in communities such as Memphis and West Memphis, as well as those using it as a through route. As such, assessment of the projected economic activity is particularly important. This data creates the basis to judge the reasonableness of future demand for the toll facility. This future demand is a function of the levels of future congestion on alternative routes and estimates of the public’s willingness and ability to pay future tolls. Generally speaking, the larger the population, the greater the level of congestion on free routes and the greater the time savings offered by a toll facility. Also generally speaking, higher levels of income by populace result in increased values of time, which influence the optimal toll levels.
The socioeconomic forecast incorporated in the Memphis MPO Travel Demand Model was used in this conceptual feasibility analysis. As part of the Sketch Traffic and Revenue Study, a review of both the historical and forecasted growth in population and employment in the Memphis region was completed. Historical trend data was used to check the reasonableness of the forecasts prepared by the Memphis MPO and incorporated in the travel demand model. These trend data were obtained from various sources including U.S. Census Bureau and the Bureau of Labor Statistics. Overall, from a historical trend perspective, the Memphis MPO forecasts of population and employment growth in the region seem reasonable.
Traffic and Revenue Traffic and revenue reports consider known and measurable factors that influence the choices of tens of thousands of daily travel decisions. Sophisticated models are built based on regional travel demand models that reflect socio-economic data, existing and future funded transportation networks, and actual travel time data. This data is used to determine current congestion levels on competing routes. For the purpose of the Sketch Traffic and Revenue Study, the following basic assumptions were made:
• The Mississippi River bridge project would open in its entirety to traffic in 2018 as a tolled facility. • Roadway improvements included in the current TIP and the LRTP were assumed to be implemented,
including any programmed widening of competing routes. • Toll rates and toll plaza locations would be as shown in this report. • Economic growth in the project study area, and associated travel demand would occur as represented
in the MPO travel demand model.
February 4, 2009 Page 9

Tennessee Department of Transportation Toll Feasibility Study Mississippi River Crossing Conceptual Feasibility Report - FINAL
• All tolling configurations would be signed and promoted effectively to encourage maximum usage. • Motor fuel would remain in adequate supply and no national or regional emergency would arise that
would abnormally restrict the use of motor vehicles. • Toll increases will be applied in a manner as described in this report. • The ratio of passenger car to commercial vehicle traffic and the distribution of commercial vehicles by
axle classification will not vary significantly from the assumed distributions in the Memphis MPO model.
• Population, employment, and development activity within the influence area of the project will be generally in accordance with those projections made by the Memphis MPO.
• No intermediate interchanges were assumed to be tolled during this study but will be re-evaluated during a preliminary level traffic and revenue study and feasibility study.
Any significant departure from these basic assumptions could materially affect traffic and revenue potential on the proposed toll facility.
The toll configuration for each of the five alternatives is the same, with one mainline toll plaza collecting a toll from those patrons crossing the Mississippi River. Alternatives 1 through 4 all have intermediate interchanges that are not tolled. Consequently there are some non-tolled movements. Alternative 5 is the only alternative without an intermediate interchange. For the purposes of this study, intermediate interchanges are considered those access control interchanges needed to provide movement from the study facility to the regional transportation network. Connector roads would be considered those facilities which pass under or over the study facility but without direct access.
The proposed toll schedule was designed such that tolls are charged based on the vehicle type. In order to account for proportionately higher pavement wear and tear and maintenance costs associated with trucks as compared to passenger cars, commercial vehicle toll rates were assumed to be much higher than passenger car toll rates. Toll rates were assumed to be indexed to inflation at 3 percent per annum reflecting the historical rate of inflation. Therefore, the resulting revenue estimates and future year tolls are in nominal dollars.
Each toll rate scenario is characterized by the passenger car toll rate. Commercial vehicle toll rates were based on the passenger car toll rates and increased according to three unique categories of commercial vehicles. Two axle six tire commercial vehicles were charged a factor of 1.5 times the passenger car rate. The factors for three and four axle commercial vehicles was 2.25, while five axle commercial vehicles and larger were charged a toll rate of 4.0 times the passenger car rate. The rates for each alternative are presented in Table 3 below.
February 4, 2009 Page 10

Tennessee Department of Transportation Toll Feasibility Study Mississippi River Crossing Conceptual Feasibility Report - FINAL
The projected gross revenue, operating and maintenance expenses, and net revenue for each alternative for the project are presented in Tables 4 through 8. More detailed discussion of the projections is contained within the letter report prepared by WSA and dated October 17, 2008.
Table 3 Proposed Tolling Rates
Passenger Car Rate
2 Axle Six Tire
Commercial
3 and 4 Axle Commercial
5 Axle Commercial
or Larger
Alternative 1 Alternative 2 Alternative 3 Alternative 4 Alternative 5
$2.50 $1.00 $1.50 $1.50 $2.00
$3.75 $1.50 $2.25 $2.25 $3.00
$5.65 $2.25 $3.40 $3.40 $4.50
$10.00 $4.00 $6.00 $6.00 $8.00
February 4, 2009 Page 11

Tennessee Department of Transportation Toll Feasibility Study Mississippi River Crossing Conceptual Feasibility Report - FINAL
Table 4 Gross and Net Revenue
Mississippi River Bridge - Alternative 1
Gross Toll Net Toll Revenue O&M Costs Revenue
Year ($,000) ($,000) ($,000) 2018 $20,400 $2,237 $18,163 2019 $22,729 $2,292 $20,437 2020 $25,070 $2,350 $22,720 2021 $27,386 $2,408 $24,978 2022 $29,715 $2,469 $27,246 2023 $32,044 $2,530 $29,514 2024 $34,411 $2,594 $31,817 2025 $36,701 $2,659 $34,042 2026 $39,030 $2,725 $36,305 2027 $41,358 $2,793 $38,565 2028 $43,751 $2,863 $40,888 2029 $46,016 $2,935 $43,081 2030 $48,344 $3,008 $45,336 2031 $51,250 $2,558 $48,692 2032 $54,410 $2,648 $51,762 2033 $57,377 $2,736 $54,641 2034 $60,596 $2,829 $57,767 2035 $63,914 $2,924 $60,990 2036 $67,514 $3,024 $64,490 2037 $70,838 $3,121 $67,717 2038 $74,433 $3,222 $71,211 2039 $78,114 $3,326 $74,788 2040 $82,096 $3,435 $78,661 2041 $85,701 $3,539 $82,162 2042 $89,597 $3,648 $85,948 2043 $93,668 $3,761 $89,907 2044 $98,194 $3,882 $94,313 2045 $102,376 $3,998 $98,378 2046 $107,030 $4,122 $102,908 2047 $111,894 $4,250 $107,643 2048 $117,300 $4,388 $112,912 2049 $122,296 $4,520 $117,776 2050 $127,854 $4,661 $123,192 2051 $133,665 $4,807 $128,858 2052 $140,124 $4,964 $135,159 2053 $146,092 $5,114 $140,977 2054 $152,731 $5,276 $147,455 2055 $159,674 $5,442 $154,232 2056 $167,388 $5,621 $161,767 2057 $174,517 $5,792 $168,725
February 4, 2009 Page 12

Tennessee Department of Transportation Toll Feasibility Study Mississippi River Crossing Conceptual Feasibility Report - FINAL
Table 5 Gross and Net Revenue
Mississippi River Bridge - Alternative 2
Gross Toll Net Toll Revenue O&M Costs Revenue
Year ($,000) ($,000) ($,000) 2018 $14,115 $2,396 $11,719 2019 $15,072 $2,456 $12,616 2020 $16,034 $2,518 $13,516 2021 $16,985 $2,581 $14,404 2022 $17,942 $2,645 $15,297 2023 $18,898 $2,711 $16,187 2024 $19,871 $2,779 $17,092 2025 $20,812 $2,849 $17,963 2026 $21,768 $2,920 $18,848 2027 $22,725 $2,993 $19,732 2028 $23,708 $3,068 $20,640 2029 $24,638 $3,144 $21,494 2030 $25,595 $3,223 $22,372 2031 $26,921 $3,043 $23,878 2032 $28,378 $3,151 $25,227 2033 $29,734 $3,255 $26,479 2034 $31,223 $3,365 $27,858 2035 $32,768 $3,479 $29,290 2036 $34,466 $3,600 $30,866 2037 $36,033 $3,716 $32,317 2038 $37,755 $3,839 $33,915 2039 $39,536 $3,966 $35,569 2040 $41,493 $4,102 $37,391 2041 $43,283 $4,230 $39,053 2042 $45,250 $4,367 $40,883 2043 $47,307 $4,509 $42,798 2044 $49,593 $4,662 $44,931 2045 $51,705 $4,808 $46,898 2046 $54,055 $4,965 $49,090 2047 $56,511 $5,127 $51,384 2048 $59,242 $5,302 $53,940 2049 $61,766 $5,469 $56,297 2050 $64,573 $5,648 $58,924 2051 $67,508 $5,834 $61,673 2052 $70,770 $6,036 $64,734 2053 $73,784 $6,226 $67,558 2054 $77,137 $6,432 $70,705 2055 $80,643 $6,645 $73,998 2056 $84,539 $6,876 $77,663 2057 $88,141 $7,095 $81,046
February 4, 2009 Page 13

Tennessee Department of Transportation Toll Feasibility Study Mississippi River Crossing Conceptual Feasibility Report - FINAL
Table 6 Gross and Net Revenue
Mississippi River Bridge - Alternative 3
Gross Toll Net Toll Revenue O&M Costs Revenue
Year ($,000) ($,000) ($,000) 2018 $24,902 $2,484 $22,418 2019 $26,827 $2,547 $24,280 2020 $28,762 $2,610 $26,152 2021 $30,676 $2,675 $28,001 2022 $32,601 $2,742 $29,859 2023 $34,525 $2,811 $31,714 2024 $36,481 $2,881 $33,600 2025 $38,374 $2,953 $35,421 2026 $40,299 $3,027 $37,272 2027 $42,224 $3,103 $39,121 2028 $44,201 $3,180 $41,021 2029 $46,073 $3,260 $42,813 2030 $47,997 $3,341 $44,656 2031 $50,632 $3,471 $47,161 2032 $53,515 $3,605 $49,909 2033 $56,206 $3,733 $52,473 2034 $59,146 $3,869 $55,277 2035 $62,190 $4,009 $58,181 2036 $65,515 $4,159 $61,356 2037 $68,587 $4,300 $64,287 2038 $71,939 $4,451 $67,488 2039 $75,394 $4,606 $70,788 2040 $79,165 $4,771 $74,394 2041 $82,606 $4,926 $77,680 2042 $86,360 $5,091 $81,269 2043 $90,285 $5,262 $85,023 2044 $94,646 $5,448 $89,199 2045 $98,678 $5,623 $93,055 2046 $103,163 $5,812 $97,351 2047 $107,851 $6,009 $101,842 2048 $113,062 $6,222 $106,840 2049 $117,879 $6,423 $111,455 2050 $123,236 $6,642 $116,595 2051 $128,837 $6,868 $121,969 2052 $135,062 $7,114 $127,948 2053 $140,814 $7,344 $133,470 2054 $147,215 $7,596 $139,619 2055 $153,905 $7,856 $146,049 2056 $161,341 $8,139 $153,201 2057 $168,213 $8,405 $159,808
February 4, 2009 Page 14

Tennessee Department of Transportation Toll Feasibility Study Mississippi River Crossing Conceptual Feasibility Report - FINAL
Table 7 Gross and Net Revenue
Mississippi River Bridge - Alternative 4
Gross Toll Net Toll Revenue O&M Costs Revenue
Year ($,000) ($,000) ($,000) 2018 $23,475 $2,461 $21,014 2019 $25,798 $2,523 $23,275 2020 $28,135 $2,586 $25,549 2021 $30,446 $2,651 $27,795 2022 $32,770 $2,717 $30,053 2023 $35,093 $2,785 $32,308 2024 $37,455 $2,855 $34,600 2025 $39,741 $2,926 $36,815 2026 $42,065 $2,999 $39,066 2027 $44,389 $3,074 $41,315 2028 $46,776 $3,151 $43,625 2029 $49,036 $3,230 $45,806 2030 $51,360 $3,310 $48,050 2031 $54,554 $3,582 $50,972 2032 $58,029 $3,734 $54,295 2033 $61,307 $3,880 $57,427 2034 $64,862 $4,035 $60,828 2035 $68,533 $4,193 $64,340 2036 $72,514 $4,363 $68,152 2037 $76,208 $4,522 $71,685 2038 $80,202 $4,692 $75,510 2039 $84,294 $4,865 $79,429 2040 $88,719 $5,049 $83,670 2041 $92,744 $5,220 $87,525 2042 $97,089 $5,401 $91,688 2043 $101,502 $5,584 $95,917 2044 $106,405 $5,784 $100,621 2045 $110,937 $5,971 $104,966 2046 $115,979 $6,175 $109,803 2047 $121,251 $6,386 $114,864 2048 $127,108 $6,616 $120,492 2049 $132,523 $6,832 $125,691 2050 $138,547 $7,067 $131,480 2051 $144,842 $7,310 $137,532 2052 $151,840 $7,575 $144,265 2053 $158,308 $7,823 $150,485 2054 $165,503 $8,094 $157,410 2055 $173,025 $8,374 $164,651 2056 $181,386 $8,680 $172,706 2057 $189,111 $8,966 $180,145
February 4, 2009 Page 15

Tennessee Department of Transportation Toll Feasibility Study Mississippi River Crossing Conceptual Feasibility Report - FINAL
Table 8 Gross and Net Revenue
Mississippi River Bridge - Alternative 5
Gross Toll Net Toll Revenue O&M Costs Revenue
Year ($,000) ($,000) ($,000) 2018 $16,849 $2,262 $14,587 2019 $20,697 $2,319 $18,378 2020 $24,565 $2,377 $22,188 2021 $28,391 $2,436 $25,955 2022 $32,239 $2,497 $29,742 2023 $36,086 $2,559 $33,527 2024 $39,996 $2,623 $37,373 2025 $43,780 $2,689 $41,091 2026 $47,628 $2,756 $44,872 2027 $51,475 $2,825 $48,650 2028 $55,427 $2,896 $52,531 2029 $59,169 $2,968 $56,201 2030 $63,017 $3,042 $59,975 2031 $68,213 $3,379 $64,835 2032 $73,810 $3,549 $70,261 2033 $79,183 $3,715 $75,468 2034 $84,912 $3,888 $81,024 2035 $90,770 $4,065 $86,705 2036 $96,990 $4,250 $92,740 2037 $102,746 $4,424 $98,322 2038 $108,798 $4,605 $104,193 2039 $114,838 $4,785 $110,053 2040 $121,160 $4,972 $116,188 2041 $126,726 $5,141 $121,585 2042 $132,486 $5,315 $127,171 2043 $138,507 $5,495 $133,012 2044 $145,198 $5,691 $139,508 2045 $151,384 $5,875 $145,509 2046 $158,264 $6,075 $152,189 2047 $165,457 $6,282 $159,175 2048 $173,450 $6,507 $166,943 2049 $180,839 $6,719 $174,120 2050 $189,058 $6,949 $182,109 2051 $197,650 $7,188 $190,462 2052 $207,200 $7,447 $199,753 2053 $216,026 $7,691 $208,335 2054 $225,844 $7,956 $217,888 2055 $236,109 $8,231 $227,878 2056 $247,515 $8,530 $238,985 2057 $258,058 $8,811 $249,248
February 4, 2009 Page 16

Tennessee Department of Transportation Toll Feasibility Study Mississippi River Crossing Conceptual Feasibility Report - FINAL
During the course of this study discrepancies were identified between the future year traffic allocations produced by the Memphis MPO Travel Demand Model and the WSA toll traffic model. Both models produced the same levels of cross river traffic. However, on a toll free basis the WSA model resulted in greater trips using each of the proposed alternatives, than the comparable alignment included within the Memphis MPO model. While, these discrepancies are due in part to differences in specific alignments and roadway network connections, the largest source of the variance appears to be the different methodologies used to account for those trips to and from West Memphis, Arkansas. This area does not have a travel demand model and is not incorporated in detail into the Memphis MPO Travel Demand Model. WSA and the Memphis MPO are working together to develop a methodology to reconcile these differences. The result of this work will be incorporated into any subsequent studies or toll feasibility analyses. However, based upon preliminary indications WSA does not believe that this new information will materially change its overall findings or recommendations.
Financial Considerations
Preliminary bonding capacity analyses were performed for each of the proposed alternative crossings. The analyses were performed to estimate the amount of project costs that could be paid for with proceeds from bonds supported by toll revenues. This analysis is based on the revenue numbers forecasted in the Sketch Traffic and Revenue Study and presented above in Tables 4 through 8. These analyses utilize a bond sizing model typical of financings for other toll roads within the United States that have been recently issued by public authorities.
Given the instability and uncertainty of the current credit markets it is extremely difficult to estimate indicative interest rates. After talking with several investment bankers who specialize in these types of transactions, the consensus is that by the time debt on this project would be issued in 2013 the markets would have stabilized.
It should be noted that the recent financial market turmoil has resulted in a significant reduction in the number of firms which have the ability to provide bond insurance, one of the financial mechanisms utilized to reduce effective interest rates paid on start-up, or “greenfield”, toll projects such as the proposed new crossing of the Mississippi River. Again after discussion with participants in the capital markets, it was generally felt that by 2013 some form of risk transfer mechanism would be in place allowing for lower effective interest rates.
As a result of these conversations, the bonding capacity analysis contained herein relies upon rates very similar to those utilized in studies prior to the recent financial market turmoil. The actual direction of the credit markets and the availability of credit, and its associated costs, remains a significant unknown. Once the financial markets stabilize, the actual cost of credit could result in a material change in WSA conclusions on the toll feasibility of the proposed crossings. Changes in financial market conditions are based upon factors outside the control of either WSA or TDOT.
Potential bonding capacity was calculated for both a net and a gross revenue pledge. Under a net pledge operations and maintenance are paid prior to debt services. This pledge provides comfort that the facility will be operated and revenues collected.
February 4, 2009 Page 17

Tennessee Department of Transportation Toll Feasibility Study Mississippi River Crossing Conceptual Feasibility Report - FINAL
Under a gross revenue pledge, debt service is paid prior to operations and maintenance being paid. This results in an increase in bonding capacity. For a gross pledge to be financeable, TDOT or some other entity would have to guarantee to pay the operations and maintenance costs should toll revenue be insufficient to pay debt service and operations and maintenance. These costs would be subject to reimbursement from future revenue.
Table 9 sets forth the estimated bonding capacity of the project for each alternative. These estimates are net of financing costs, capitalized interest, and a debt services reserve, typical costs and reserves which are either paid or funded out of proceeds from financings.
Table 9 Mississippi River Bridge Project
Bonding Capacity (Million $)
Alternative 1 Net
Pledge Gross Pledge
Alternative 2 Net
Pledge Gross Pledge
Alternative 3 Net
Pledge Gross Pledge
Alternative 4 Net
Pledge Gross Pledge
Alternative 5 Net
Pledge Gross Pledge
Bonding Capacity Financial Costs and Reserves Net Bonding Capacity
$443.1
$ 100.0
$343.1
$448.1
$103.6
$344.5
$204.0
$27.5
$176.5
$250.9
$ 63.9
$187.0
$458.1
$110.7
$347.4
$465.0
$115.6
$349.41
$483.0
$110.6
$372.4
$483.6
$114.5
$369.0
$559.2
$106.5
$452.7
$566.0
$111.3
$454.7
The bonding capacity analyses were based on the following major assumptions:
• Project bonds are a combination of Current Interest Bonds and Capital Appreciation Bonds with 40 year maturities
• Both series of project bonds are issued at parity (i.e. both have equal claims to revenue) • Project bonds have debt service coverage ratios of 1.75X for both series • Both series have investment grade ratings • All reserve funds are invested at 2% per annum • Each project is open for traffic as indicated in Tables 4 through 8 • Interest is capitalized during the assumed construction period for each project • Financing costs assumed to equal 2.5% of bond size • Debt Service Reserve is funded at closing from proceeds and estimated to equal 10% of total bond size
The bonding capacity analysis is provided for planning purposes only and is not intended to supplant the analysis that will be required by a financial advisor or underwriter as part of the financing process. The analysis is based on prevailing market rates and conditions for similar revenue bond offerings as of the date of this report. Changes in financial market conditions and further refinements by a financial advisor could materially alter the results of the bond sizing model.
A project’s financial feasibility is dependent upon total available funding sources being adequate to pay for project costs. Table 10 sets forth the conceptual plans of finance for the project. These conceptual plans of
February 4, 2009 Page 18

Tennessee Department of Transportation Toll Feasibility Study Mississippi River Crossing Conceptual Feasibility Report - FINAL
finance are based on the estimated project costs shown in Table 2, revenue and operating costs set forth in Tables 4 through 8, and bonding capacities shown in Table 9.
Table 10 Mississippi River Bridge Project
Conceptual Plans of Finance (Million $)
Alternative 1 Alternative 2 Alternative 3 Alternative 4 Alternative 5 Net Gross Net Gross Net Gross Net Gross Net Gross
Pledge Pledge Pledge Pledge Pledge Pledge Pledge Pledge Pledge Pledge Sources
Bonding Capacity $ 443.1 $448.1 $204.0 $250.9 $458.1 $465.0 $483.0 $483.6 $559.2 $566.0 Investment Earnings $ 6.9 $ 7.0 $ 2.5 $ 2.7 $ 9.7 $ 9.8 $ 11.9 $ 11.7 $ 17.6 $ 17.7 Public Contribution $ 654.5 $649.0 $618.0 $609.2 $351.4 $349.2 $273.5 $277.1 $186.0 $183.9
Total Sources $1,104.5 $1,104.1 $824.5 $862.8 $819.2 $824.0 $768.4 $772.4 $762.8 $767.6
Uses Project Costs $1,004.5 $1,004.5 $798.9 $798.9 $708.5 $708.5 $657.8 $657.8 $656.2 $656.2 Financing Costs $ 55.7 $ 58.8 $ 7.1 $ 38.8 $ 64.9 $ 69.0 $ 62.3 $ 66.2 $ 50.6 $ 54.8 Debt Service Reserve $ 44.3 $ 40.8 $ 18.5 $ 25.1 $ 45.8 $ 46.5 $ 48.3 $ 48.4 $ 56.0 $ 56.5
Total Uses $1,104.5 $1,104.1 $824.5 $862.8 $819.2 $824.0 $768.4 $772.5 $762.8 $767.6
Each of the line items shown in the conceptual plans of finance is discussed below:
Bonding Capacity: The amount of debt that can be supported from a given revenue stream
Investment Earnings: Interest and earnings on unused bond proceeds. Bond proceeds are held in trust and drawn down over time to pay for project costs
Public Contribution: Public funding needed to cover difference, if any, between net bonding capacity and project costs
Project Costs: Estimated engineering, construction, and toll system costs of project
a
Financing Costs: Transaction costs of a financing paid to underwriters, bond counsel, rating agencies, etc. This line item includes interest paid to bondholders during the construction of a project
Debt Service Reserve: Reserve account funded out of proceeds of a bond offering to provide funds to cover unforeseen circumstances resulting in operational deficiencies
February 4, 2009 Page 19

Tennessee Department of Transportation Toll Feasibility Study Mississippi River Crossing Conceptual Feasibility Report - FINAL
As shown in Table 10, on a conceptual level all five of the alternatives require public contributions or other additional funding mechanisms in order to cover all project and financing costs. Over the planning horizon of this study, each scenario generates substantial uncommitted revenues after the payment of toll operations and debt service. The uncommitted revenues range from approximately $600 million for Alternative 2 under a net revenue pledge to approximately $1.9 billion for a gross pledge financing for Alternative 5. While there will be other project claims on this uncommitted revenue, most notably the funding of a reserve for capital replacement, these revenues could potentially provide TDOT with funds to repay any subordinated lending from another public source.
February 4, 2009 Page 20

Tennessee Department of Transportation Toll Feasibility Study Mississippi River Crossing Conceptual Feasibility Report - FINAL
CONCLUSIONS AND NEXT STEPS
Based on the analysis contained within this Conceptual Toll Feasibility Report, it is WSA’s conclusion that as studied each of the five alternatives will require varying levels of public contributions or other additional funding mechanisms in addition to the revenues generated from tolls. Should TDOT wish to continue to study these alternatives as toll projects WSA would recommend the following steps:
• Concentrate future studies on Alternatives 3, 4, and 5. • Evaluate the potential revenue that would be generated if the intermediate interchanges included in
Alternatives 3 and 4 were tolled. • Refine the Memphis MPO Travel Demand Model by disaggregating the traffic zones within West
Memphis, Arkansas. • Investigate the potential establishment of some form of loan program, or infrastructure bank, with non-
TDOT entities that would allow for the required public contributions to be funded on a subordinated basis and paid back from uncommitted net toll revenues.
• Conduct additional studies of the approaches to refine the alignments and costs necessary to maximize revenue for each potential alignment.
February 4, 2009 Page 21
