mission: impossible (escape from the lyman limit)
TRANSCRIPT

Mon. Not. R. Astron. Soc. 342, 1215–1221 (2003)
Mission: impossible (escape from the Lyman limit)
A. Fernandez-Soto,1,2�† K. M. Lanzetta3 and H.-W. Chen4,5‡1Osservatorio Astronomico di Brera, Via Bianchi 46, Merate (LC), I-23807, Italy2Observatori Astronomic, Universitat de Valencia, Burjassot (Valeencia), E-46100, Spain3Department of Physics and Astronomy, State University of New York at Stony Brook, Stony Brook, NY 11794-3800, USA4The Observatories of the Carnegie Institution of Washington, 813 Santa Barbara Street, Pasadena, CA 91101, USA5Centre for Space Research, Massachusetts Institute of Technology, Cambridge, MA 02139-4307, USA
Accepted 2003 March 11. Received 2003 February 27; in original form 2002 December 5
ABSTRACTWe investigate the intrinsic opacity of high-redshift galaxies to outgoing ionizing photons us-ing high-quality photometry of a sample of 27 spectroscopically identified galaxies of redshift1.9 < z < 3.5 in the Hubble Deep Field. Our measurement is based on maximum-likelihoodfitting of model galaxy spectral energy distributions – including the effects of intrinsic Lyman-limit absorption and random realizations of intervening Lyman-series and Lyman-limit absorp-tion – to photometry of galaxies from space- and ground-based broad-band images. Our methodprovides several important advantages over the methods used by previous groups, includingmost importantly that two-dimensional sky subtraction of faint-galaxy images is more robustthan one-dimensional sky subtraction of faint-galaxy spectra. We find at the 3σ statistical con-fidence level that on average no more than 4 per cent of the ionizing photons escape galaxiesof redshift 1.9 < z < 3.5. This result is consistent with observations of low- and moderate-redshift galaxies but is in direct contradiction to a recent result based on medium-resolutionspectroscopy of high-redshift (z ≈ 3) galaxies. Dividing our sample into subsamples accordingto luminosity, intrinsic ultraviolet colour and redshift, we find no evidence for selection effectsthat could explain such a discrepancy. Even when all systematic effects are included, the datacould not realistically accommodate any escape fraction value larger than ≈15 per cent.
Key words: galaxies: formation – cosmology: observations – diffuse radiation.
1 I N T RO D U C T I O N
The diffuse ultraviolet (UV) background is one of the key ingredi-ents in the recipe leading to galaxy formation (Miralda-Escude &Ostriker 1990; Giroux & Shapiro 1996). The intensity of the diffuseultraviolet background has been estimated at moderate and highredshifts using the proximity effect on quasi-stellar object (QSO)absorbers (Kulkarni & Fall 1993; Fernandez-Soto et al. 1995; Liske& Williger 2001; Scott et al. 2001), and results obtained so far sug-gest that it is too large to be explained by QSOs alone (Madau &Shull 1996, but see also, e.g., Giallongo et al. 1996). Although sys-tematic errors may make these measurements uncertain (Loeb &Eisenstein 1995; Pascarelle et al. 2001), several suggestions havebeen put forward to explain the observed extra intensity. One of themost popular suggestions calls for the escape of a large fraction ofionizing photons from high-redshift galaxies. If correct, this wouldimply that the interstellar media of high-redshift galaxies must beat least partially transparent to ionizing photons.
�E-mail: [email protected]†Marie Curie Fellow.‡Hubble Fellow.
However, the best measurements available at low and moderateredshifts show that galaxies are (at least nearly) opaque to ionizingphotons. The large column densities of neutral hydrogen that sur-round most galaxies should be enough, depending on how they aredistributed, to very effectively quench any outgoing flux of ionizingphotons. In fact, Leitherer et al. (1995) find, in a sample of fourstarburst galaxies at an average redshift of 〈z〉 ≈ 0.02, that the lim-its to the escape fraction of Lyman-limit photons range from f esc
< 0.0095 to f esc < 0.15 (with an observed flux ratio at 900 and1500 A of F9/15 < 0.10–0.20). Hurwitz, Jelinsky & Dixon (1997)analyse the same data and obtain slightly less stringent limits, rang-ing from f esc < 0.032 to f esc < 0.57. Deharveng et al. (2001) find amore stringent limit, f esc < 0.064, for a starburst galaxy of redshiftz = 0.0448. Bland-Hawthorn and Putman (2001) obtain fesc ≈ 0.05in the Milky Way, and Zurita et al. (2002) show that a significantfraction of ionizing photons may locally escape H II regions in NGC157. At higher redshifts (z ≈ 1), Ferguson (2001) finds similar upperlimits f esc < 0.20 to the escape fraction.
It is much less clear whether galaxies at still higher redshiftsare as opaque to ionizing photons as galaxies at low and moderateredshifts. Accurate measurements become progressively more dif-ficult at higher redshifts, because galaxies are much fainter and the
C© 2003 RAS

1216 A. Fernandez-Soto, K. M. Lanzetta and H.-W. Chen
presence of Lyman α forest absorption introduces further uncertain-ties. The only two measurements available so far are from Steidel,Pettini & Adelberger (2001) and Giallongo et al. (2002). Adoptinga correction factor for intervening Lyman-α absorption determinedfrom a composite QSO spectrum, Steidel et al. reported F9/15 =0.22 ± 0.05 using 29 galaxies at 〈z〉 = 3.40, while Giallongo et al.reported a 1σ upper limit F9/15 � 0.05 using two galaxies at z ∼ 3.The former measurement indicates that galaxies at z ∼ 3 are muchmore transparent to ionizing photons, contributing an equal amountof ionizing flux to the ultraviolet background radiation as the QSOs.The latter measurement indicates otherwise.
In this article, we present a new measurement of f esc using27 galaxies at redshifts 1.9 < z < 3.5 in the Hubble Deep Field(HDF). All of these galaxies have secure spectroscopic redshifts (seeCohen et al. 2000, hereafter C00; Dawson et al. 2001, hereafter D01)and accurate broad-band photometry from Hubble Space Telescope(HST)/WFPC2 observations in the F300W, F450W, F606W andF814W bandpasses. Our measurement is based on deep space-basedimages, which provides two important advantages over the methodsused by previous groups: first, our sky subtraction is more accurate,because two-dimensional sky subtraction in faint-galaxy images ismore robust than one-dimensional sky subtraction in faint-galaxyspectra. Secondly, the wavelength interval below the rest-frame Ly-man limit over which we integrate is larger, because the space-basedbroad-band images are sensitive to observed-frame wavelengths asshort as λ ≈ 2800 A allowing us to integrate over rest-frame wave-length intervals as large as ≈100 A in some cases. Our methodalso improves upon previous work by accounting for the effect ofthe Lyman-α forest absorption by performing a large number ofrandom realizations of a parametrized distribution, to account forvariations of the absorbing clouds across different lines of sight.
Our results show that the escape fraction estimated from the en-semble of 27 galaxies has a (statistical) 3σ upper limit of f esc �0.04. Given that our galaxy sample spans a range of properties inredshift, intrinsic colour and luminosity, we also explore possiblesystematic effects by dividing the galaxies into different subsam-ples. We do not find any evidence to support the idea that bluergalaxies have higher escape fractions of ionizing photons. Instead,we find that more luminous galaxies appear to have shallower ultra-violet spectral slopes and higher escape fractions (at the 2σ level ofsignificance). We also search for other possible systematic effectsthat could be inherent to our method, and find that other effects can-not account, in any realistic way, for a large increase in the escapefraction.
2 DATA
We consider all galaxies in the HDF with known spectroscopic red-shifts in the range 1.9 < z < 3.5. The lower limit is chosen so thatthe rest-frame Lyman limit begins to affect the photometry in theF300W bandpass. The upper limit is chosen so that we can still rea-sonably distinguish absorption due to the Lyman-α forest from theintrinsic Lyman-limit absorption. We previously measured high-quality photometry of these galaxies using HST/WFPC2 throughthe F300W, F450W, F606W and F814W filters (Fernandez-Soto,Lanzetta & Yahil 1999, FLY99 hereafter; Lanzetta et al. in prepa-ration). The sample includes 27 galaxies, as given in Table 1. Thereader is referred to FLY99, C00, D01 and Fernandez-Soto et al.(2001) for more details on individual galaxies.
We determine the absolute AB magnitude of each galaxy usinga fiducial spectral energy distribution determined from a templatefitting technique that we will describe in the next section. We adopt a
Table 1. Properties of the galaxy sample used in the analysis. Ce-lestial coordinates are J2000.
RA-12h Dec-62◦ FLY99 z AB(814)
36:49.83 14:15.0 1016 1.980 23.4036:48.32 14:16.6 1044 2.005 23.4037:00.09 12:25.2 0048 2.050 23.7736:54.73 13:14.8 0670 2.232 24.2936:55.07 13:47.1 0831 2.233 24.5236:50.11 14:01.1 0960 2.237 24.5836:54.62 13:41.3 0806 2.419 25.2736:45.88 14:12.1 1054 2.427 25.2136:43.27 12:38.9 0664 2.442 24.8136:53.19 13:22.7 0742 2.489 24.8336:44.64 12:27.4 0517 2.500 23.7336:41.72 12:38.8 0702 2.591 24.6036:45.35 11:52.7 0175 2.799 23.2436:44.09 13:10.8 0815 2.929 24.0336:47.77 12:55.7 0687 2.931 23.9536:46.93 12:26.1 0444 2.969 25.2436:48.29 11:45.9 0021 2.980 25.0736:53.43 13:29.4 0762 2.991 24.6036:45.36 13:47.0 0964 3.160 25.0936:51.20 13:48.8 0897 3.162 25.2236:53.60 14:10.2 0955 3.181 24.5536:41.23 12:02.9 0390 3.220 24.0336:49.81 12:48.8 0568 3.233 25.1836:52.99 14:08.5 0957 3.367 26.8536:52.75 13:39.1 0825 3.369 25.0736:52.41 13:37.8 0824 3.430 24.7936:39.57 12:30.5 0688 3.475 25.40
cosmological model with vacuum energy density � = 0.65, matterdensity M = 0.35 and Hubble constant H 0 = 65 km s−1 Mpc−1.Absolute AB magnitudes of the galaxies at rest-frame wavelengthsλ = 1500 A range from ≈−21.8 to ≈−25.4. Apart from theseabsolute magnitudes, all other results in this paper are independentof the chosen cosmological model.
3 M E T H O D
Our method is based on maximum-likelihood fitting of modelgalaxy spectral energy distributions, including the effects of intrin-sic Lyman-limit absorption and random realizations of interveningLyman-series and Lyman-limit absorption, to space- and ground-based broad-band images. In practice, our method proceeds in sev-eral steps as follows.
First, we determine a fiducial spectral energy distribution of eachgalaxy by fitting model spectral energy distributions to the broad-band photometric measurements that fall between rest-frame wave-lengths λ = 1250 and 2800 A. The wavelength range is chosen toavoid the spectral discontinuity produced by the Lyman series (rest-frame wavelength λ < 1215 A) and the Balmer break (rest-framewavelengths λ � 3000 A). The fiducial spectral energy distributionsare based on the six spectrophotometric templates (of E, Sbc, Scd,Irr, SB1 and SB2 galaxies) of our previous photometric redshiftmeasurements (Yahata et al. 2000; see also Benıtez 2000) togetherwith a power-law form f ν ∝ λα . (The power-law form is requiredbecause a few of the galaxies are found to be bluer – in the ultravioletrest-frame – than any of the starburst spectrophotometric templates.In each of these cases, α < 0.5.) The spectral energy distributions areselected according to a χ2 analysis similar to the analysis used forour previous photometric redshift measurements (Lanzetta, Yahil &Fernandez-Soto 1996; FLY99).
C© 2003 RAS, MNRAS 342, 1215–1221

Mission: impossible 1217
Next, we modify the fiducial spectral energy distribution of eachgalaxy by adding the effect of intrinsic Lyman-limit absorption,which is characterized by an assumed Lyman-limit optical depth τ g
that is taken to be universal across all galaxies. For a Lyman-limitoptical depth τ g, the output spectrum f (λ, τ g) in terms of the inputspectrum f (λ, 0) at rest-frame wavelength λ is
f (λ, τg) = f (λ, 0) exp[ − τg(λ/λLL)3
](1)
at rest-frame wavelengths λ < λLL, where λLL is the rest-framewavelength of the Lyman limit.
Next, we modify the fiducial spectral energy distribution of eachgalaxy by adding the effect of random realizations of interveningLyman series and Lyman-limit absorption. Here we characterize thedistribution of Lyman-α forest absorption systems by a distributionfunction F(N, b, z), which is defined in such a way that F(N, b, z) dNdb dz is the expected number of absorption systems in the neutralhydrogen column density interval dN around N, Doppler parameterinterval db around b, and redshift interval dz around z. We adopt asthe functional form of the distribution function
F(N , b, z) ∝ (1 + z)γ N−β G∗(b, σb, bmin), (2)
where G∗(b, σb, bmin) is a ‘truncated’ Gaussian distribution of meanb, dispersion σ b and minimum truncation value bmin. We adopt γ =2.5, β = 1.6, b = 23 km s−1, σ b = 8 km s−1 and bmin = 15 km s−1.
We have extensively checked that simulated spectra generated ac-cording to these parameters reproduce to within the observed scatterthe average Lyman-α absorption DA and average Lyman series ab-sorption DB. In Fig. 1 we show the average values of DA and DB,compared with values found in the literature. The agreement is per-fect within the scatter present in the observational data.
The incidence of Lyman-limit systems (those with hydrogenopacity τ > 1) is an important factor in our simulation, as they are
Figure 1. Values of the Lyman decrements DA and DB obtained by av-eraging 1000 spectra generated by our model at each redshift (continuousline). The curves are compared with the values by Webb (unpublished, dot-ted line), which our group uses for photometric redshift estimation, and witha compilation of DA values obtained from the literature (Oke & Korycansky1982; Bechtold et al. 1984; Steidel & Sargent 1987; O’Brien, Wilson& Gondhalekar 1988; Schneider, Schmidt & Gunn 1989; Giallongo &Cristiani 1990; Schneider, Schmidt & Gunn 1991).
Figure 2. Number density of Lyman-limit systems as observed by severalauthors (see labels) and produced by our method. The difference betweenour model and the average of the different observations is always less than0.2 dex in the redshift range of interest and almost zero at z � 2.8.
among the main drivers of the absorption bluewards of the galacticLyman edge. In Fig. 2 we plot the density of Lyman-limit systemsgenerated by our Lyman-α forest model, and compare it with thenumbers measured by different authors (as described in the figure).As can be seen, our model produces slightly fewer Lyman-limit sys-tems at the lowest redshifts than have been observed. Whereas thiseffect could produce a bias favouring lower escape fraction values,we have checked that this effect is not important (see Sections 4.2and 4.3 for details). This slight defect is the result of our decision toadopt a single parametrization to generate all of the Lyman-α for-est – a change in the normalization to improve the aspect of Fig. 2would conflict with the data shown in Fig. 1. Globally, we considerthat our model reproduces within reasonable limits the properties ofthe intergalactic medium.
Next, we measure the simulated spectrum of each galaxy – con-structed from the fiducial spectral energy distribution of each galaxymodified by the effects of intrinsic Lyman-limit absorption with anassumed Lyman-limit optical depth τ g and of random realizationsof intervening Lyman series and Lyman-limit absorption – at short-wavelengths, i.e. over the F300W bandpass, which is sensitive atwavelengths below the rest-frame Lyman limit, and we compareobserved energy fluxes f (i)
obs and uncertainties σ(i)obs and simulated
energy fluxes f (i, j)sim of the ith galaxy in the jth simulation. To ran-
domize the effects of intervening Lyman series and Lyman-limitabsorption, we repeat this procedure a large number of times, andwe form the likelihood as a function of the Lyman-limit opticaldepth τ g as
L(τg) =Ngal∏i=1
1
Nsim
Nsim∑j=1
exp
{−
[f (i)obs− f (i, j)
sim (τg)]2
2σ(i)obs
2
}√
2πσ(i)obs
2
, (3)
where the product extends over the N gal galaxies of the sample andwhere the sum extends over the N sim simulations of the analysis.
C© 2003 RAS, MNRAS 342, 1215–1221
1218 A. Fernandez-Soto, K. M. Lanzetta and H.-W. Chen
We find that N sim = 100 is enough to represent the variation ofintervening Lyman series and Lyman-limit absorption.
4 R E S U LT S A N D D I S C U S S I O N
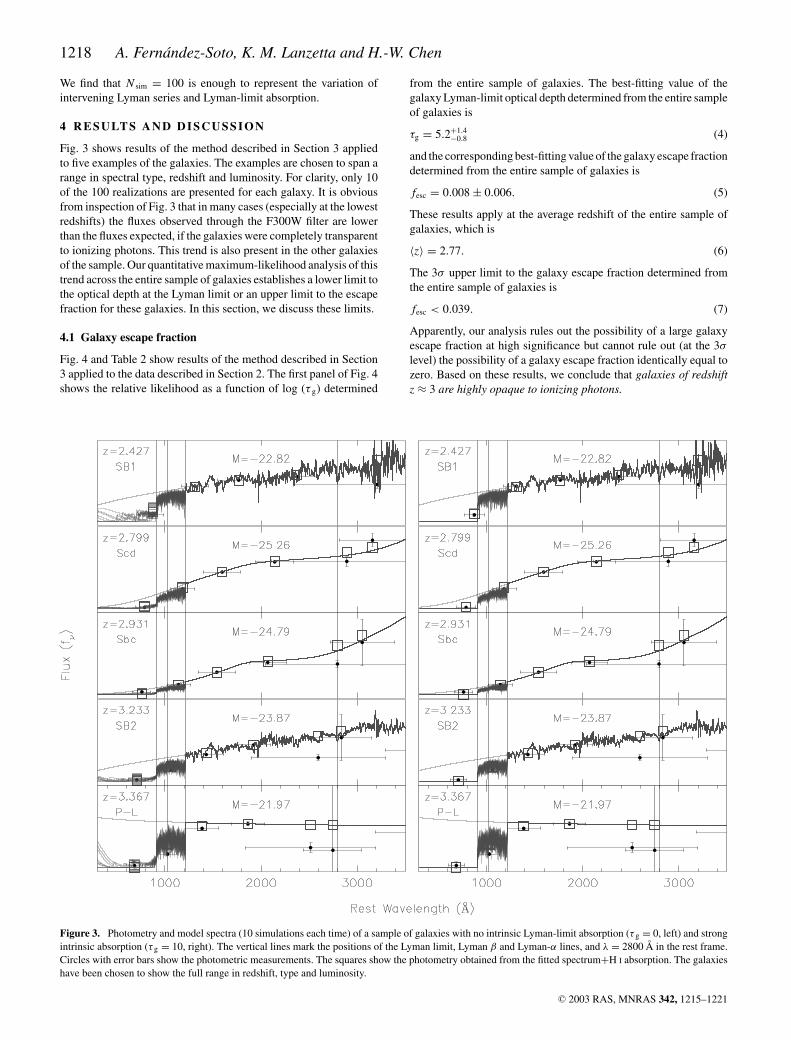
Fig. 3 shows results of the method described in Section 3 appliedto five examples of the galaxies. The examples are chosen to span arange in spectral type, redshift and luminosity. For clarity, only 10of the 100 realizations are presented for each galaxy. It is obviousfrom inspection of Fig. 3 that in many cases (especially at the lowestredshifts) the fluxes observed through the F300W filter are lowerthan the fluxes expected, if the galaxies were completely transparentto ionizing photons. This trend is also present in the other galaxiesof the sample. Our quantitative maximum-likelihood analysis of thistrend across the entire sample of galaxies establishes a lower limit tothe optical depth at the Lyman limit or an upper limit to the escapefraction for these galaxies. In this section, we discuss these limits.
4.1 Galaxy escape fraction
Fig. 4 and Table 2 show results of the method described in Section3 applied to the data described in Section 2. The first panel of Fig. 4shows the relative likelihood as a function of log (τ g) determined
Figure 3. Photometry and model spectra (10 simulations each time) of a sample of galaxies with no intrinsic Lyman-limit absorption (τ g = 0, left) and strongintrinsic absorption (τ g = 10, right). The vertical lines mark the positions of the Lyman limit, Lyman β and Lyman-α lines, and λ = 2800 A in the rest frame.Circles with error bars show the photometric measurements. The squares show the photometry obtained from the fitted spectrum+H I absorption. The galaxieshave been chosen to show the full range in redshift, type and luminosity.
from the entire sample of galaxies. The best-fitting value of thegalaxy Lyman-limit optical depth determined from the entire sampleof galaxies is
τg = 5.2+1.4−0.8 (4)
and the corresponding best-fitting value of the galaxy escape fractiondetermined from the entire sample of galaxies is
fesc = 0.008 ± 0.006. (5)
These results apply at the average redshift of the entire sample ofgalaxies, which is
〈z〉 = 2.77. (6)
The 3σ upper limit to the galaxy escape fraction determined fromthe entire sample of galaxies is
fesc < 0.039. (7)
Apparently, our analysis rules out the possibility of a large galaxyescape fraction at high significance but cannot rule out (at the 3σ
level) the possibility of a galaxy escape fraction identically equal tozero. Based on these results, we conclude that galaxies of redshiftz ≈ 3 are highly opaque to ionizing photons.
C© 2003 RAS, MNRAS 342, 1215–1221

Mission: impossible 1219
Table 2. Measurements of f esc obtained via the maximum-likelihood method described in the text. The different sub-samples used in the analysis are listed, together with the results and statistical confidence intervals associated with eachone.
Sample N2 f esc 1σ interval 2σ interval 3σ interval
All 27 0.008 (0.001–0.013) (0.000–0.023) (0.000–0.039)Redder 15 0.008 (0.004–0.020) (0.000–0.036) (0.000–0.054)Bluer 12 0.000 (0.000–0.003) (0.000–0.018) (0.000–0.047)High luminosity 13 0.026 (0.017–0.050) (0.008–0.072) (0.002–0.093)Low luminosity 14 0.000 (0.000–0.001) (0.000–0.004) (0.000–0.013)Low redshift 13 0.004 (0.000–0.008) (0.000–0.018) (0.000–0.030)High redshift 14 0.169 (0.056–0.389) (0.008–0.857) (0.000–1.000)
2Number of objects included in the sample.
Figure 4. Relative likelihoods of the value of τ g for the complete sample(left-hand panel). The other panels show the results for different subsamples,broken according to (left to right) type, redshift, and luminosity. In all panelsthe horizontal lines correspond to statistical 1, 2 and 3σ confidence intervals.
4.2 Possible selection effects
The results of our analysis are apparently at odds with the results ofSteidel et al. (2001) that galaxies of 〈 z〉 ≈ 3.4 are not highly opaqueto ionizing photons. These authors observed in the average spectrumof 29 galaxies a flux ratio of F9/15 = 0.056. After correcting for theeffects of the Lyman-α forest absorption using a composite QSOspectrum at the same redshift, they found an intrinsic flux ratio ofF9/15 = 0.22 ± 0.05, where the effects of intrinsic galactic absorp-tion and attenuation by dust or gas have not been eliminated. Theauthors also incorporated in this measurement a plausible estimateof the flux discontinuity at the Lyman limit due to absorption instellar atmospheres to derive an escape fraction f esc � 0.10.1
Steidel and collaborators suggested that the high escape fractionfound in their work might result from some selection bias of theirgalaxy sample. The galaxies incorporated in their analysis includeonly 29 out of 875 galaxies for which they obtained spectroscopicobservations with the Keck telescope, selected on the basis of the
1 Steidel and collaborators used a definition of f esc that is different fromthe usual one – they normalized the escape fraction at 900 A to the escapefraction at 1500 A. They reported f esc � 0.50, which is converted here tothe usual definition assuming the escape fraction at 1500 A is ≈0.15–0.20as quoted by the authors.
quality of the observations at blue wavelengths. This selection con-dition quite naturally selects galaxies that are either very blue, veryluminous or both. QSOs are known to be transparent to ionizingphotons at ultraviolet wavelengths (Zheng et al. 1997), so it is notunreasonable to speculate that very blue or very luminous (or both)galaxies might exhibit larger escape fractions than average galaxies.To examine this possibility, we repeated the analysis described inSection 3 for various subsamples of the galaxy sample.
Colour
First, we repeated the analysis for two subsamples of the galaxysample divided according to colour. Results are shown in the secondpanel of Fig. 4 and the second group of entries in Table 2. Here‘bluer’ galaxies are galaxies best described by SB1 or power-lawspectrophotometric templates and ‘redder’ galaxies are galaxies bestdescribed by Scd, Irr and SB2 spectrophotometric templates. Resultsobtained from both subsamples are consistent with each other andwith results obtained from the entire sample of galaxies, althoughthere is a (statistically insignificant) trend for the bluer galaxiesto indicate a smaller galaxy escape fraction than is indicated bythe redder galaxies. This result runs contrary to the idea describedabove.
Luminosity
Next, we repeated the analysis for two subsamples of the galaxysample divided according to luminosity. Results are shown in thethird panel of Fig. 4 and the third group of entries in Table 2.Here ‘low-luminosity’ galaxies are galaxies of absolute magnitudeAB > − 23.75 and ‘high-luminosity’ galaxies are galaxies of abso-lute magnitude AB < −23.75. Results obtained from both subsam-ples are consistent with each other and with results obtained from theentire sample of galaxies, although there is a (statistically insignif-icant) trend for the lower-luminosity galaxies to indicate a smallergalaxy escape fraction than is indicated by the higher-luminositygalaxies.
Redshift
Finally, we repeated the analysis for two subsamples of the galaxysample divided according to redshift. The results are shown in thethird panel of Fig. 4 and the third group of entries in Table 2. Here‘low-redshift’ galaxies are galaxies of redshift 1.95 < z < 2.85 and‘high-redshift’ galaxies are galaxies of redshift 2.85 < z < 3.50.Results obtained from both subsamples are consistent with eachother and with results obtained from the entire sample of galaxies,
C© 2003 RAS, MNRAS 342, 1215–1221
1220 A. Fernandez-Soto, K. M. Lanzetta and H.-W. Chen
although there is a (statistically insignificant) trend for the lower-redshift galaxies to indicate a smaller galaxy escape fraction than isindicated by the higher-redshift galaxies. To some extent, this statis-tically insignificant difference could be due to the already mentionedrelative lack of Lyman-limit systems in our model at low redshift.Given that the results from the high-redshift sample (where ourmodel reproduces exactly the observed number of Lyman-limit sys-tems) are not significantly different from the results obtained usingthe low-redshift sample, we infer that the difference in the modeldoes not induce a large change.
It should be remarked that none of the subsamples analysed isdifferent from the values given by the complete sample at the 3σ
level. Neither are any of the subsamples incompatible with theircomplementary subsamples at the same level. With this in mind,it is nevertheless interesting that the apparent effects of luminosityand ultraviolet blueness on f esc seem to pull in opposite directions,suggesting that the higher escape fraction reported by Steidel andcollaborators is unlikely to be due to selection effects.
4.3 Systematic uncertainties
All the confidence limits reported above refer only to the statisticalproperties of the sample of galaxies we are analysing. It is very likelythat the method we are using to analyse the data may introduce errorsof a systematic nature, which could potentially be of the same orderas the statistical ones. We have performed some checks in orderto estimate which could be contribution from several sources ofuncertainty.
4.3.1 Uncertainties induced by the Lyman-α forest model
As was shown in Section 3 above, our Lyman-α forest model hasbeen checked against the observed properties, and agrees with themwithin observational limits. In order to estimate the uncertainty inf esc that could originate from the uncertainties in the model, we haveperformed new measurements of f esc using forest models that differfrom our ‘standard’ one by applying a 10 per cent increase/decreasein the normalization of the line density. We must remark that this10 per cent change does largely overestimate the possible uncertain-ties in our model – the models with 10 per cent more or fewer linesrepresent poor fits to the observed forest properties.
As expected, an increase in the forest density implies an increasein the measured value of the escape fraction: more of the UV photonscan escape each galaxy while keeping the observed photometricproperties, as their mean free path is reduced by the increased densityof absorbers. Mutatis mutandis, when the forest density is reduced,the value of f esc moves down. The change is small however: at the3σ confidence level, the original limit ( f esc <0.039) becomes f esc <
0.030 ( f esc < 0.046) when the line density is decreased (increased)by 10 per cent.
Another potential problem in our forest model could be the lackof clustering in our simulations, as opposed to what is shown bythe observations. Our measurement is not affected by the small-scale clustering that has been observed in the Lyman-α forest lines(Fernandez-Soto et al. 1996) because we are integrating over muchlarger scales. Of potential importance is the observed clusteringof high-column density absorbers (Sargent, Boksenberg & Steidel1988). It is difficult to quantify its effect, but we expect it shouldbe dilluted by the size of our sample, and estimate that it producesa smaller variance than that induced by the ±10 per cent change inthe number of lines presented above.
4.3.2 Uncertainties induced by the choice of the spectral templates
In the case of some of the galaxies, the photometric data availablecould allow for the assigning of two different fiducial spectral tem-plates with similar goodness-of-fit values. The choice of one of themover the other (which we perform algorithmically via the minimumchi-squared criterion) could produce an extra uncertainty in the mea-surement of f esc. The same effect can be produced if our selectionof templates is not dense enough to cover the possible UV shapesor if the photometric uncertainties are too large.
We have evaluated the uncertainty induced by this effect by per-forming the following exercise: we have forced all spectral templatesto be one step bluer (always along the sequence formed by Ell, Sbc,Scd, Irr, SB2, SB1) than that which is the best-fit choice,2 and re-peated the analysis. This does in fact result in very poor fits for manyof the galaxies, and must thus be considered a very large overes-timate of the possible uncertainties. Under this scenario, with thegalaxies emitting far more ionizing photons than what is indicatedby their actual UV continua, the escape fraction diminishes to verylow values: f esc < 0.016 at the 3σ level.
We have also performed the opposite exercise, forcing all galaxiesto be one step redder than their best-fitting template.3 Under thisassumption the galaxies emit far fewer ionizing photons than whattheir UV continua actually suggests, and this results in an increasein the acceptable escape fraction, which reaches f esc = 0.065, witha 3σ upper limit f esc < 0.156.
As we explained before, these limits must be taken as very largeoverestimates of the possible systematic effects induced by our spec-troscopic templates, as we do not realistically expect to mistake allgalaxies in the same direction. However, even under this extremeassumption, and also incorporating the effects described in Section4.3.1, the upper limit to the measured escape fraction is still farbelow the values measured by Steidel et al. (2001).
5 C O N C L U S I O N S
We have presented a new method to measure the escape fractionof ionizing photons from galaxies at z ≈ 3. Our method providesa cleaner measurement compared with the classical spectroscopictechnique because the problem of the sky subtraction is reducedalmost to insignificance and we can use a wider bandpass.
The value we obtain ( f esc = 0.008, with f esc < 0.039 at a 3σ
confidence level) is in agreement with most previous measurementsof the escape fraction of ionizing photons at high and low redshift,being more stringent than most previous upper limits. It is largelyin contradiction with the value presented by Steidel et al. (2001) forhigh-redshift galaxies.4 We have studied possible selection effectsthat could cause this apparent difference and conclude that, withinthe limits set by the size of our sample, they cannot explain the largediscordance between our results. Neither can the difference be ex-plained by possible systematic effects induced by our method, as wehave also shown. A (very conservative) estimate of the confidencelimits when all systematic effects are included leads to a 3σ upperlimit to the escape fraction that cannot be higher than f esc � 0.15.
If the escape fraction of ionizing photons reported here representsthe general situation at high redshift, then normal galaxies cannot
2 Exception made of those that are already fitted by a SB1 template or apower law.3 Exception made of those galaxies fitted by a power law.4 Steidel et al. (2001) remark that their results ‘should be treated as prelim-inary until high-quality observations of individual galaxies exhibiting clearevidence for Lyman continuum photon leakage become available’.
C© 2003 RAS, MNRAS 342, 1215–1221

Mission: impossible 1221
be responsible for any significant fraction of the high-redshift ion-izing background. On the other hand, if the proximity effect mea-surements of the background flux are confirmed, then the problempersists to find the objects responsible for the ionization state ofthe high-redshift universe. Deep, narrow-band imaging of local andhigh-redshift galaxies at wavelengths slightly above and below theirintrinsic Lyman limits could settle this argument. Such imaging cam-paigns would be less expensive, in terms of observing time, than thespectroscopic observations performed to date.
AC K N OW L E D G M E N T S
This work is based on observations taken with the NASA/ESA Hub-ble Space Telescope, which is operated by AURA under NASA con-tract NAS5-26555. We thank our referee, Emanuele Giallongo, forhis useful comments that have improved the clarity of our paper.AFS gratefully acknowledges support by a Marie Curie Fellowshipof the European Community programme ‘Improving the human re-search potential and the socio-economic knowledge base’ undercontracts number MCFI-1999-00494 and MCFI-2002-00472. HWCacknowledges the hospitality of the Osservatorio di Brera-Meratewhere this work was completed.
R E F E R E N C E S
Bechtold J., Green R.F., Weymann R.J., Schmidt M., Estabrook F.B.,Sherman R.D., Wahlquist H.D., Heckman T.M., 1984, ApJ, 281, 76
Benıtez N., 2000, ApJ, 536, 571Bland-Hawthorn J., Putman M.E., 2001, in Hibbard J.E., Rupen M.P., van
Gorkom J.H., eds, ASP Conf. Ser. 240, Gas and Galaxy Evolution. As-tron. Soc. Pac., San Francisco, p. 369
Cohen J.G., Hogg D.W., Blandford R., Cowie L.L., Hu E.M., Songaila A.,Shopbell P., Richberg K., 2000, ApJ, 538, 29 (C00)
Dawson S., Stern D., Bunker A.J., Spinrad H., Dey A., 2001, AJ, 122, 598(D01)
Deharveng J.-M., Buat V., Le Brun V., Milliard B., Kunth D., Shull J.M.,Gry C., 2001, A&A, 375, 805
Ferguson H.C., 2001, in Cristiani S., Renzini A., Williams R.E., eds,Proc. ESO Symp. on Deep Fields. Springer-Verlag, Heidelberg (astro-ph/0101356)
Fernandez-Soto A., Barcons X., Carballo R., Webb J.K., 1995, MNRAS,277, 235
Fernandez-Soto A., Lanzetta K.M., Barcons X., Carswell R.F., Webb J.K.,Yahil A., 1996, ApJ, 460, L85
Fernandez-Soto A., Lanzetta K.M., Yahil A., 1999, ApJ, 513, 34 (FLY99)Fernandez-Soto A., Lanzetta K.M., Chen H.-W., Pascarelle S.M., Yahata N.,
2001, ApJS, 135, 41Giallongo E., Cristiani S., 1990, MNRAS, 247, 696Giallongo E., Cristiani S., D’Odorico S., Fontana A., Savaglio S., 1996, ApJ,
466, 46Giallongo E., Cristiani S., D’Odorico S., Fontana A., 2002, ApJ, 568, L9Giroux M.L., Shapiro P.R., 1996, ApJS, 102, 191Hurwitz M., Jelinsky P., Dixon W.V.D., 1997, ApJ, 481, L31Kulkarni V.P., Fall S.M., 1993, ApJ, 413, L63Lanzetta K.M., 1991, ApJ, 375, L1Lanzetta K.M., Yahil A., Fernandez-Soto A., 1996, Nat, 381, 759Leitherer C., Ferguson H.C., Heckman T.M., Lowenthal J.D., 1995, ApJ,
454, L19Liske J., Williger G.M., 2001, MNRAS, 328, 653Loeb A., Eisenstein D.J., 1995, ApJ, 448, 17Madau P., Shull J.M., 1996, ApJ, 457, 551Miralda-Escude J., Ostriker J.P., 1990, ApJ, 350, 1O’Brien P.T., Wilson R., Gondhalekar P.M., 1988, MNRAS, 233, 801Oke J.B., Korycansky D.G., 1982, ApJ, 255, 110Pascarelle S.M., Lanzetta K.M., Chen H.-W., Webb J.K., 2001, ApJ, 560,
101Sargent W.L.W., Boksenberg A., Steidel C.C., 1988, ApJS, 68, 539Sargent W.L.W., Steidel C.C., Boksenberg A., 1989, ApJS, 69, 703Schneider D.P., Schmidt M., Gunn J.E., 1989, AJ, 98, 1507Schneider D.P., Schmidt M., Gunn J.E., 1991, AJ, 101, 2004Scott J., Bechtold J., Dobrzycki A., Kulkarni V.P., 2000, ApJS, 130, 67Steidel C.C., Pettini M., Adelberger K.L., 2001, ApJ, 546, 665Steidel C.C., Sargent W.L.W., 1987, ApJ, 313, 171Stengler-Larrea E. et al., 1995, ApJ, 444, 64Storrie-Lombardi L.J., McMahon R.G., Irwin M.J., Hazard C., 1994, ApJ,
427, L13Yahata N., Lanzetta K.M., Chen H.-W., Fernandez-Soto A., Pascarelle S.,
Yahil A., Puetter R.C., 2000, ApJ, 538, 493 (Y00)Zheng W., Kriss G.A., Telfer R.C., Grimes J.P., Davidsen A.F., 1997, ApJ,
475, 469Zurita A., Beckman J.E., Rozas M., Ryder S., 2002, A&A, 386, 801
This paper has been typeset from a TEX/LATEX file prepared by the author.
C© 2003 RAS, MNRAS 342, 1215–1221