minutes of the joint plan teams for the groundfish …...1 minutes of the joint plan teams for the...
TRANSCRIPT
1
Minutes of the Joint Plan Teams for the Groundfish Fisheries of the
Gulf of Alaska and Bering Sea Aleutian Islands
August 30 - September 1, 2011
North Pacific Fishery Management Council
605 W 4th Avenue, Suite 306 Anchorage, AK 99501
BSAI Team GOA Team
Loh-Lee Low AFSC REFM (BSAI chair) Jim Ianelli AFSC REFM (GOA co-chair)
Mike Sigler AFSC (BSAI Vice chair) Diana Stram NPFMC (GOA co-chair)
Kerim Aydin AFSC REFM Sandra Lowe AFSC REFM
Lowell Fritz AFSC NMML Chris Lunsford AFSC ABL
David Carlile* ADF&G Jon Heifetz AFSC ABL
Alan Haynie AFSC REFM Mike Dalton AFSC REFM
Jane DiCosimo NPFMC (Coordinator) Kristen Green ADF&G
Yuk. W. Cheng WDFW Tom Pearson NMFS AKRO Kodiak
Brenda Norcross UAF Nick Sagalkin ADF&G
Mary Furuness NMFS AKRO Juneau Paul Spencer AFSC REFM
Grant Thompson* AFSC REFM Leslie Slater* USFWS
David Barnard ADF&G Nancy Friday AFSC NMML
Leslie Slater* USFWS Yuk. W. Cheng WDFW
Dana Hanselman AFSC ABL Ken Goldman* ADF&G
Bill Clark IPHC Bob Foy* AFSC Kodiak
Sarah Gaichas AFSC REFM
Steven Hare* IPHC
* absent
AGENDA C-2(a) October 2011
2
Introduction: The Joint meeting of the Gulf of Alaska (GOA) and Bering Sea Aleutian Islands (BSAI) Groundfish Plan Teams convened Tuesday, August 30, 2011 at 1:00 pm at the Alaska Fisheries Science Center in Seattle, Washington. Introductions were made. Ten members of the public, 14 agency staff, and 6 observers from the Ministry for Food, Agriculture, Forestry and Fisheries of the Republic of Korea attended.
Agenda: The Joint Plan Teams adopted the agenda with the following revisions: 1) added a report of the NMFS stock assessment prioritization working group, 2) the timing of the presentation of GOA survey results was revised in the GOA Plan Team agenda, and 3) review of the EBS Pacific cod model will be discussed and questions will be forwarded to Grant Thompson through the minutes for a subsequent response due to his absence. Administrative issues: The Teams will coordinate potential changes or modifications to the introductory chapters for the BSAI and GOA SAFE reports for November to make them as consistent as possible. Team members were assigned topics for preparing the minutes from this meeting and reminded of the use of google docs for compiling the Plan Team minutes and proposed revisions to research priorities. Observer Program restructuring: Craig Faunce provided an overview of the Council’s preferred alternative to restructure the North Pacific Groundfish Observer Program (NPGOP) including the current nested sampling design with proposed randomization of observers at the trip and vessel level of sampling. To gain efficiency in deployment of observers, observers would not be deployed onto small catcher vessels (e.g. those under 40’ using fixed gear). Electronic monitoring (EM) has been proposed as an alternate tool for the Agency to employ in lieu of a physical observer to monitor this portion of the fleet. EM data would be used to test the hypothesis that the unobserved fleet represents a portion of the observed fleet (and thus discard rates from observed vessels can be applied to landings of unobserved vessels). It is intended that EM will be functional and ready for implementation for these unobserved vessels at the same time as when the restructured observer program would be implemented. The draft proposed rule will be reviewed by the Observer Advisory Committee at its September meeting and by the Council at its October meeting. This schedule would allow for publication of a proposed rule in January 2012 and final rule by September 2012. Implementation is scheduled for the start of the 2013 calendar year. One provision of the Council’s preferred alternative is the production of an annual observer report. This report would be annually available for Plan Teams to review beginning in September 2012. Craig also noted the creation of an observer restructure analysis group for advising the Fisheries Monitoring and Analysis Division of the AFSC in the design of an efficient observer deployment strategy to support in-season management and the annual stock assessments. Team members requested clarification on how stock assessment projections would fit into effort projections for the next year’s assessment. Craig noted a new hire will be evaluating past fleet effort and future funding interactions to develop a model for anticipated coverage rates, and anticipated available quota being a considered factor. Craig reported that he will forward the Plan Teams’ interest in how restructuring would affect stock assessment needs with the observer restructuring analytical group. Team members noted that the data collected by observers on previously unobserved portions of the fleet (e.g. < 60’ catcher vessels including those targeting Pacific halibut) are very important to current and future stock assessments. How these data will be incorporated into annual assessments will continue to be a topic of discussion by the Teams. While historical estimates are available better estimates will be available soon and this will have a potentially substantial positive effect on species such as those in Tier 6 management. Proposed changes in GOA and BSAI Halibut PSC limits: Jane DiCosimo briefed the Teams on the Council’s schedule to take initial review and select a preliminary preferred alternative on GOA halibut prohibited species catch (PSC) limits at its October meeting in order to implement changes through the 2012 annual harvest specifications. She reported that the Council has noted its intent to consider revising BSAI halibut PSC limits in the future. BSAI halibut PSC limits are established in regulation while GOA limits are set in the annual harvest specifications. Under a separate action the Council may amend the GOA Groundfish FMP to put halibut PSC limits in regulation, similar to the BSAI FMP, in order to remove them from annual harvest specifications. Jane reviewed the Council’s June 2011 action plan for proposed GOA halibut PSC limit changes. The timing of the development of the analysis (released two weeks prior to the Council meeting) did not permit review by the
3
Team (which met weeks earlier than typical and four weeks before the Council meeting). She referenced, but did not present, the findings of an analysis that IPHC staff prepared on the effects of the proposed (0/5/10/15 percent) reductions of trawl and hook-and-line PSC limits. The Team discussion generally noted 1) the GOA Team has not traditionally advised the Council on halibut PSC limits, 2) timing did not allow review of the analysis, and 3) the current schedule does not account for 2011 GOA trawl survey results or harvest specification recommendations from the GOA PT or SSC in the analysis. A member of the public expressed concern that the GOA Plan Team was not being adequately consulted in the Council’s current schedule for action compared to implementation for 2013 which would allow inclusion of new trawl survey data and stock assessment results in the EA. The GOA Team will take up this agenda separately on Friday to discuss what comments may be provided to the Council at this time and a plan for potential further review in November, although similar timing issues may occur. Salmon bycatch actions: Diana Stram provided a brief overview of recent Council actions on salmon bycatch management in the BSAI and GOA pollock fisheries. In the Bering Sea the Council is scheduled to develop revised management measures for non-Chinook (chum) salmon bycatch measures in April 2012. The Council had previously taken action in 2009 to recommend PSC limits by season and sector in the BS pollock fishery for Chinook salmon under Amendment 91. The fishery is in the first year of operation under this new management program. In the GOA, the Council took final action in June to recommend area-specific limits in the WGOA and CGOA for Chinook salmon PSC limits. These limits are intended to be implemented in mid-2012. Other measures to be implemented in conjunction with this action include full retention of salmon in the GOA and observer coverage modifications. A follow up action will be discussed by the Council in December 2012 for more comprehensive Chinook salmon bycatch management measures in the GOA. Pollock survival: Ellen Martinson (AFSC) presented a talk titled “Connecting Ecosystem to Stock Assessment: BASIS Project”. BASIS is a collaborative effort and is a fisheries, oceanography and acoustic survey in the eastern Bering Sea. The strategy is to evaluate the interaction between climate and biological controls on commercially important species. Ellen described information from the survey and other sources (e.g., fish energy density) on pollock early life survival. The primary hypothesis is that the fitness and abundance of age-0 pollock during late summer are predictors for overwintering survival to age-1 and thus year class strength. Recent warm (2001-2005) and cold (2006-2010) years provide contrasting conditions that inform these relationships. For example, large crustacean zooplankton, which are important age-0 pollock prey, were more abundant during cold years and were more important in age-0 pollock diet as well. In cold years, age-0 pollock began winter with higher energy reserves. A comparison of observed pre-winter energy content and year class strength indicates that energy density is a predictor of year class strength. Ron Heintz derived this relationship, which predicts that the 2010 year class strength (at age-1) is 39 billion fish. In a separate analysis by Ellen of temperature as a predictor, the 2010 prediction is 48 billion fish. In turn, these values can be compared to the stock assessment model update expected for November 2011. Finally, age-0 pollock vertical and horizontal distributions are affected by the locations of the cold pool (<2 deg C) and the pycnocline (rapidly changing water density) from year-to-year. Pacific cod: The Teams reviewed the model chosen for the EBS and GOA assessments in November 2010 (called “Model B” at the time) which had the following main features:
1. M fixed at 0.34. 2. Length-specific commercial selectivities for all fisheries, some forced to be asymptotic, estimated for
blocks of years. 3. Age-specific survey selectivity with an annually varying left limb. Survey catchability fixed at the value
obtained in the 2009 assessment, where it resulted in the product of catchability and selectivity at 60-80 cm equal to the desired value of 0.47.
4. Assigning aging bias +0.4 y at all ages. 5. A single growth schedule for all years (previously cohort-specific). 6. Five fishing seasons (previously three). 7. 1 cm length bins (previously 3 cm).
Another candidate (“Model C”) had the same features but made no use of the age data. It matched the survey length modes much better than Model B but was rejected due to an odd feature of the Stock Synthesis software
4
whereby it estimated lengths at age that were off by a year. It also produced impossible estimates of abundance in the GOA. Both models converged weakly, with a CV of 10-20% for the estimate of 2011 biomass in perturbation trials in the neighborhood of the maximum likelihood estimate. Treatment of possible age reading bias in Model B also remained a concern. It was hoped at the time that this problem might be resolved by estimating age reading error distributions within Stock Synthesis, which was expected to be implemented in 2011. A CIE review of the Pacific cod assessment occurred in March 2011, and the Plan Teams held an online meeting in May 2011 to formulate a suite of models for consideration at this meeting, based on earlier concerns about Model B and recommendations from the CIE reviewers. The Teams also referenced SSC recommendations from June 2011. The Teams requested that last year’s preferred model (“Model B”) be carried forward as Model 1. In addition they requested the author (Grant Thompson) try the following new models:
1. Model 2a: same as Model 1 but with selectivity schedules parameterized as cubic splines. (Grant used 5-knot splines to approximate the number of parameters in the double normal.)
2. Model 2b: same as Model 1 but with pre-1982 survey data omitted. This model produced estimates of recruitment and present biomass very similar to Model 1, and it is simpler, so it became the base model for the remaining candidates.
3. Model 3: same as Model 2b but with aging error estimated internally. 4. Model 4: same as Model 2b but without using the age data. 5. Model 5: same as Model 2b but with the blocks of years adopted for estimating selectivities (including
survey selectivity) chosen on the basis of AIC. In fact Model 5 was suggested by a member of the public, and it was requested that it be run as a modification of “the author’s preferred model”, so Grant first developed his preferred model, which turned out to be quite different from Models 1-4. He called it Model A, and it differed from Model 2b in the following major ways. Model 5 inherited these features, except for the temporal treatment of selectivities.
1. All commercial gear types were combined into a single commercial fishery with a single composite selectivity in each of the five seasons. Selectivity in Season 4 was forced to be asymptotic.
2. All length frequency data were used. (In Models 1-3 length frequencies were not used in places where age data were available.)
3. Mean size-at-age data were omitted (unlike Models 1-3). 4. The Richards growth equation was used (rather than the von Bertalanffy). 5. Aging bias and variance were estimated internally, as in Model 3. 6. The standard deviation of log R (sigmaR) was estimated internally. (It was fixed at last year’s value in
Models 1-4.) 7. Survey selectivity was modeled as a function of length rather than age. 8. The base (average) value of survey catchability was estimated iteratively to locate the value where the
average of catchability times selectivity at 60-80 cm was equal to 0.47. 9. Zero-sum annual deviations (devs) of survey catchability from the base value were estimated iteratively to
locate the values where the standardized residuals of the survey abundance predictions were equal to one. (In effect, survey catchability was allowed to vary as much as necessary to fit the data as closely as the sampling variances suggested should be possible.)
10. Six of the double normal selectivity parameters (two each in Season 1, Season 3, and the survey) were modeled as random walks, with sigmadev tuned iteratively to make the input and output standard deviations equal.
11. Age composition variance scalers were estimated iteratively to make the scaled input sample sizes equal to the effective sample sizes.
Model performance and Team discussion Because Grant was unable to attend this meeting Jim Ianelli led the Teams through the models and results. Much of Grant’s paper, and the Teams’ discussion, concerned the convergence behavior of the various models. The convergence tests consisted of locating the maximum likelihood estimates (by slightly perturbing successive converged MLEs) and then refitting the model with an initial parameter vector obtained by adding larger or smaller random deviations (“jitters”) to the MLE vector. The deviations were logit values drawn from a normal distribution with mean zero and standard deviation equal to twice the nominal jitter rate, either 0.1 or 0.01. The random logits
5
were added to the MLE parameter values on the logit scale, which in conjunction with the lower and upper bounds on each parameter determined the random initial values. Performance of a model was measured by: (i) how often the fits with random starting points reached the MLE (match rate), (ii) the root mean squared deviation of the negative log likelihood from the minimum (likelihood variation), and (iii) the CV of the estimate of present biomass. By these measures of robustness, most of the new candidate models were inferior to Model 1. Model 2a showed high likelihood and biomass variability. Model 2b had a higher match rate than Model 1 and a similar biomass CV but higher likelihood variation. Model 3 had a zero match rate and astronomical variability. Models A and 5 seldom even converged at a jitter rate of 0.1, but performed quite well at a jitter rate of 0.01. The exception was Model 4, which was substantially more robust than every other model in every respect. The extent that the variability shown by some models was due to a few extreme values rather than a lot of moderate deviations was raised and should be examined in future presentations of this sort. A number of concerns about the models and the convergence tests were raised during the Teams’ discussion: (i) The jitter tests, at least with a jitter rate of 0.1, are not necessarily meaningful because they can produce wild
and perhaps even impermissible starting values. In particular, it seems possible that the the hugely variable performance of Model 3 in jitter tests is the result of some quirk.
(ii) In Model A (and Model 5), the catchability and selectivity deviations are treated as random effects but they are not properly integrated out. The MLEs are therefore suspect, and the iterative tuning may produce pathological results.
(iii) Allowing survey catchability to vary from year to year, perhaps substantially, achieves a better fit to the data but at the expense of discounting the relative abundance data. Some members felt strongly that this was a mistake. The survey catchability estimates produced by Model A seemed to be missing in the presentation.
(iv) The great variability of survey selectivity estimates from Model A is a clear indication that the model is overfitting the data.
In view of the many new features in Model A and several concerns about it, the Teams do not favor including it (or Model 5) as one of the candidates in November. The Teams requested Models 2b and 4 in November, and requested a brief investigation into the reasons for the wild performance of Model 3. If it turns out that the uneven performance of Model 3 was the result of some quirk in the jitter tests, the Teams requested would like Model 3 included as well. (If a short investigation is unproductive, the Teams recommend dropping Model 3 rather than taking time this year for a long investigation.) There was some discussion of adding other survey series to the cod assessment, specifically the halibut and sablefish longline surveys. The Teams recalled that both surveys had poor coverage of the EBS cod stock, and Grant had found the IPHC survey data to be at odds with other data in the assessment. While the other survey data do not appear promising at present, the Teams recommended that the IPHC continue to collect cod length frequencies on its survey. Sablefish: Dana Hanselman presented a brief update of the status of the sablefish assessment for November 2011. The 2011 longline survey was just completed and CPUE numbers are relatively strong with good evidence of an above average 2008 year class again, as occurred in the 2010 survey. Sperm whale depredation was not heavy in the GOA, but there was substantial killer whale depredation in the Bering Sea. The length frequency histogram from the survey showed a recruitment pulse with a mode at about 500 mm; this information is preliminary but indicates a year class that appears larger than the 2000 or 1997 year classes. For survey index modeling, a global model including all areas at once may be intractable, but a model by area is under consideration. In the future, Central and Eastern Gulf of Alaska may be modeled with the inclusion of sperm whale data and western Gulf of Alaska and Bering Sea/Aleutian Islands may be modeled with killer whale data. A general linear mixed model (GLMM) may best capture the uncertainty for this type of modeling but it will be harder to fit to large data sets. Three regional GLMMs will likely be used initially with simulation tests for the method selected. Movement model update: The movement model incorporates data from 1979-2009 in an AD Model Builder program with time-varying reporting rates. The model updates a previous analysis by Heifetz and Fujioka based
6
on about 10 years of tag data. ADF&G tag data for inside waters (Southern Southeast Inside and Northern Southeast Inside) were added. The model updated the fishing mortality rate with relative population weigh) and stock assessment catchabilities. There are a total of 305,000 tag releases and 27,000 recoveries in 31 years. For time varying reporting rates, the tag recovery rate for the survey is compared to the fishery. Reporting rates generally have increased, but there has been an unexplained decrease in reporting rate in the past few years. In summary, including all 31 years of tag data affected the movement model more than any other changes. Changes in absolute movement rate occurred where most fish now have a higher probability of movement than before; for example, large fish now have a 40% higher probability of moving than in previous models. The previous paradigm was that small fish moved west, and large fish moved east. The probability of small fish moving east has now doubled. These results show that movement directionality is more ambiguous than previously shown. AD Model Builder can examine the uncertainty of the probability of fish moving out of an area through MCMC simulation. In Chatham Strait, sablefish have a precise low probability of moving. In contrast, western Gulf fish have a precise and high probability of moving. There is also the potential in the future for determining age- and sex-specific movement rates for sablefish. Dana also developed a mortality model (not stock assessment based) using time at liberty, similar to following cohorts with catch curve analysis. In this mortality model, the independent Z values (total mortality) estimated from tag data (Z = 0.173 in this model) was similar to the mean stock assessment value Z = 0.185 over the same time period. Directionality of overall movement patterns is more ambiguous than previously thought, with the western GOA seeming to be inhospitable for sablefish (i.e. high annual movement). The sablefish population center seems to be in CGOA, and the one unit stock (Aleutian Islands, Bering Sea to GOA) hypothesis is strongly supported by these movement data. Dana is preparing a publication on these results. Other future research includes: 1) fishery whale depredation estimation, 2) socioeconomic reapportionment effects, 3) whale depredation deterrents, 4) environmental forcing on sablefish recruitment, and 5) satellite pop up tags for spawning locations. Dana plans to continue with the current model for the next assessment cycle. There will be a major update to the model in the next several years; Dana anticipates that the next model update will include or consider 1) movement, 2) whale depredation, 3) new age misclassification, and 4) use of environmental data in projections. Henry Cheng noted that the location of where fishing occurs can result in bias in a movement model. Dana noted that Bering Sea sablefish tend to stay in the Bering Sea. Evidence of larger fish in the Bering Sea may indicate these fish are growing to maturity in this area. Loh-Lee Low noted that the IPHC analyzed different tag types and was moving to a coastwide halibut model at the same time Dana was considering a regional movement model for sablefish. Dana responded that he still plans to retain an all Alaska model, but the inclusion of movement data would provide a better representation of the population dynamics within Alaska. Jon Heifetz mentioned some preliminary genetic analysis that had recently been done which showed some correspondence of allele frequencies within areas when looking at samples from the Bering Sea and Gulf of Alaska. Loh asked if there is much movement of Washington/Oregon sablefish north; Dana said historically there has not been. Jon noted that there is not much movement north in most years, but maybe more occurred in El Nino years (Kimura analysis). The sablefish stock break is at Vancouver Island in BC. Not as much tagging has been done in Washington or Oregon in recent years.
Sablefish Ageing: Bill Clark provided an update on sablefish aging analysis. Known-age fish are required to get good estimates of ageing error; these are not usually available. NOAA has been releasing tagged known age fish (have recovered 172 known-age fish of the 23,000 known-age tagged fish that have been released). Age readers strive for accuracy, but there are sometimes discrepancies. Without known-age fish, it is difficult to estimate the mean, variance, and the form of the distribution. One assumes the modal age is equal to the true age and the distribution of misclassifications is symmetric. Sablefish are not symmetric in ageing errors; younger fish tend to be over-aged and older fish tend to be under-aged. This probably occurs because one cannot underage young fish by that much. One can estimate the distribution of the aging error from the variance of multiple reads, or from known-age fish. The ageing of not known-age sablefish appears reasonable, but the bias becomes worse with the
7
age of fish (> 10 year old fish). Errors in ageing affect estimates of recruitment. Age reading errors tend to follow a geometric distribution rather than a discrete normal distribution.
Jim Ianelli commented that he was surprised that the naive models are considered doing ‘well’ relative to the correct data. Dana responded that this is due to the effect of ageing on stock assessment. If you remove ageing error, recruitment estimates are much less variable. Dana said the standard methods of creating an age classification matrix for sablefish work well, but since we have uniquely known ages, we can test those standard methods. Dana will probably incorporate this known age data into the model in the future. Jim Ianelli commented that at young ages biases may not be observed but as those fish get older, the ageing bias may have more effect. Research priorities: The Teams assigned leads to review and revise the June 2011 research priorities. Later in the meeting the Teams collectively reviewed and approved proposed changes to the Council’s June 2011 research priorities. The recommended revisions are appended to the joint minutes and will be available to the SSC during its next scheduled iteration of research priorities scheduled for June 2012. TSC and groundfish survey workshop: Mark Wilkins presented an update on the Technical Sub-Committee (TSC) of the Canada-US Groundfish Committee. This is a working group of scientists and fishery managers from all Pacific Coast fisheries agencies. The original responsibilities of the TSC were to review changes and effectiveness of existing regulations, exchange information on the status of Pacific coast bottomfish stocks, and to recommend the continuance and further development of research programs. Currently, TSC functions to ensure consistent and high-quality management and science of Pacific Coast Groundfish across all Canadian and US agencies/jurisdictions. The TSC meets annually, recommends courses of action, and sponsors working groups and workshops to improve scientific knowledge. In March, 2011, the TSC sponsored a trawl and setline survey workshop held at AFSC. This workshop was well attended by numerous agencies from the west coast and east coast and represented multiple gear types in addition to trawl gear. The first day consisted of participants providing written and oral summaries of their surveys. These have been compiled and are available through the PSMFC website. The second day consisted of discussions on unique issues and operational problems commonly encountered. Future goals are to put together a website that will showcase what occurred at the workshop. Group consensus was that this effort should be done every five years. TSC reports and the trawl and setline survey workshop results are available through the PSFMC website: http://www.psmfc.org/tsc2/ The Plan Team asked about specifics regarding sampling of rockfish in rocky habitats and inquired how the aast coast surveys compared to the Pacific surveys. Some rockfish work by Rooper and Martin (AFSC) was presented at the workshop but specifics were not discussed. The majority of the east coast surveys are conducted by the NEFSC and details are available in the work shop summaries. Sharks: Cindy Tribuzio presented updates on stock assessments for BSAI and GOA sharks. Some improvements planned for the 2011 GOA assessment includes analysis of spatial and seasonal catch distribution and estimated catch of sleeper sharks from the halibut IFQ fishery. Authors also plan to evaluate a demographic model for sleeper sharks and estimating natural mortality (M). For spiny dogfish the spatial distribution of catch will be evaluated. Cindy proposed to the Teams that the shark assessments be conducted on a biennial cycle. This year would be a full assessment in the GOA and an off-year for the BSAI. The Teams accepted her rationale that there is not new data for assessment every year, and alternating the assessments to coincide with trawl surveys would provide authors more time to devote toward improving assessments. The Teams recommended that Tier 5 and Tier 6 stock assessments \ be conducted for the GOA in 2011 and for the BSAI in 2012. Only executive summaries will be prepared in the off years. The Teams recommended that the AFSC include this recommendation in its “Instructions to Authors.” For the 2013 assessment the authors are planning several substantial projects including analysis of pop up tags from spiny dogfish, particularly time spent inshore versus offshore. Harvest of sharks before 1997 is not compiled by species so work is being done to reconstruct this harvest. The authors are developing a dogfish model (Pella-
8
Tomlinson), but some issues have been discovered during early testing of the model. Reconstructed catch has some problems and methods need to be reviewed again. There is correlation among parameters, and resulting carrying capacity estimates are very different than Rice (2007). Also, the model required a tight prior on r for convergence, and there are a large number of parameters. Cindy requested suggestions to assist modeling efforts. The Teams recommended a biomass model, but Jon Heifetz suggested that size data should be incorporated if possible. Henry Cheng pointed out that this type of model will not allow forecasting. In last year’s assessment the GOA Plan Team used the author’s recommended M, but the SSC adopted a 3 year average biomass and F=M because the author’s estimate had not been peer-reviewed. Jim Ianelli asked why there were two different catch histories. Cindy explained that harvest data prior to 1997 was not compiled by species and they were attempting to reconstruct this harvest using ratio estimators. Jim suggested making the catch history part of the model. Some Team members also mentioned that current catch data may be suspect because of high bycatch and mortality in the halibut fishery which is poorly observed. Stock assessment prioritization: Rick Methot (OST) provided the Teams with an overview and update on the developing process within NMFS to develop methods to rank stocks regionally and nationally for the purpose of allocating potential increased funding to improve stock assessment across the nation. This request was made of NMFS from OMB. NMFS created the Stock Assessment Prioritization Working Group chaired by Rick. Three levels of progress were identified in the Stock Assessment Improvement Project (SAIP 2000). These are
Baseline monitoring for all stocks
Standardized assessments for “core” stocks; subsequently defined as the 230 FSSI stocks
Advanced, ecosystem-linked, “next generation” assessments for key stocks. The Teams recommended a balanced national and regional prioritization. ‘Regional’ for purposes of this initiative is defined at the scale of the Fishery Management Councils. Factors for goal setting and prioritization are fishery importance, ecosystem importance, stock status, stock biology and assessment history. For fishery importance the concept is to rank values of commercial catch and recreational catch within each region and rank together for a combined score. For ecosystem importance, score proposed to be based on either bottom up or top down approach. Stock status based upon a scoring system combining fishing rate and stock abundance scores. Stock biology factors in when setting the target period of assessment updates. For assessment history, the issue is whether to do a first-time assessment, a simple assessment update, or a full time-demanding benchmark assessment. Simple tools are needed to begin to prioritize stocks currently not assessed. For stocks for which information exists there are target assessment levels for prioritization. NMFS intends to provide guidance for each region to assess their needs. The target assessment period should be stock-specific and based both on information available and fishery importance. Feedback and acceptance of the planned approach from regional councils would occur at the upcoming Council Coordination Committee meeting. Results of the national stock prioritization will be used to inform allocation of national funding for stock assessments. Follow up efforts underway to evaluate new research and data needs for supporting the priority assessment. The Teams expressed concern that shifting prioritization nationally for lesser assessed stocks may inadvertently take resources away from stocks of national importance that are already well assessed and this prioritization could be used to decrease current levels of support for North Pacific stocks that are recognized as very well assessed and managed. The Teams and members of the public had several suggestions for consideration in further developing this scoring mechanism. Concerns were raised regarding development of the scores and the utility of those scoring mechanisms, necessity of doing sensitivity analysis on those scores. Rick indicated that more evaluations will be done in conjunction with the development of the scoring system. One suggested approach to this would be quantifying, e.g., EBS pollock, the economic implications of losing one year of survey data. The concern is that the true net national benefit evaluation will be lost in translating this to a single number for prioritizing stocks nationally. The Teams suggested that trying to do a one size fits all scoring truly may be neither feasible nor advisable. The Teams suggested considering groups of fisheries together such as major commercial fisheries
9
separately from more diverse smaller regions with lesser commercial fisheries but more stocks. Questions were posed regarding including some metric for social value, e.g. number of vessels participating, social/cultural importance, etc. There should be some consideration as well on a cost-benefit standpoint factored in as well when identifying the most critical priority stocks. The concern is not only that this ranking will be used to allocate additional funds but may also be employed as a means of informing where to cut funding when necessary. The current scoring system may also serve to advantage less conservatively managed regions where higher fishing rates are occurring and disadvantage more conservatively managed regions such as the North Pacific. This could also incentivize conducting poor assessments due to the nature of the prioritization. Team members also suggested that this issue be discussed at the upcoming national SSC workshop. Rick indicated that it is not scheduled to be reviewed at that meeting. Octopus Natural Mortality Rate: Kerim Aydin presented estimates of Bering Sea octopus consumption by Pacific cod for estimating the natural mortality rate for octopus, which is being proposed as an alternative to current Tier 6 harvest specifications. Octopus bycatch has been relatively low and harvest specifications based on tier 6 methods may be unduly conservative relative to harvest rates based upon natural mortality estimates. The estimates of cod consumption are interpreted as an alternate Tier 6 harvest specification that reflects a conservative estimate of octopus natural mortality. Estimates of octopus consumption by cod in the Bering Sea, which is equated to the product of cod predation mortality on octopus and octopus biomass, were derived as a function of cod ration (based upon a generalized von Bertalanffy equation), cod abundance (based upon survey data), and proportion of octopus in Pacific cod diet. Pacific cod predation mortality was used as a proxy for octopus natural mortality, which is conservative because other major predators of octopus exist (such as pinnipeds). A harmonic mean across the annual consumption estimates was substantially larger than current harvest specifications based on traditional Tier 6 methods. The Plan Teams support this method and requested potential harvest specifications from this method be presented alongside the traditional Tier 6 methods for the November Plan Team meeting, with the addition of consumption estimates for the Aleutian Islands area in order to obtain a BSAI consumption estimate. Grenadier Management: Jon Heifetz and Jane DiCosimo updated the Teams on the status of Council action for including grenadiers in the two groundfish FMPs. In April 2010, the Council requested a discussion paper on the impacts of including grenadiers in either the fishery (which would require ACLs) or the ecosystem component category (along with other management issues), but this task has not been prioritized and FMP amendments have not been scheduled. The Plan Teams request that any discussion paper in the FMP analysis include evaluation of alternative management measures, and staff at Regional Office and ABL have agreed to contribute to a discussion paper in 2012. The Plan Teams continue to recommend that grenadiers be placed in the groundfish FMPs. Halibut fisheries incidental catch estimation: The Teams’ discussion of this topic was linked to additional discussions of Total Catch Accounting and Annual Catch Limits (see below). Cindy Tribuzio presented final methods for the estimation of non-target species catches in the unobserved IFQ halibut fishery. These methods were developed by a Plan Team working group and presented to the Plan Teams in November 2010 and approved by the SSC in February 2011. A database will be available for 2001-2010 by October 1, 2011 for use by stock assessment authors. The Plan Teams thanked this working group for their efforts at filling a critical data gap to comply with ACL requirements until the restructured observer program expands observer coverage to the now unobserved halibut IFQ fishery The method uses both fishery-independent and fishery-dependent data. IPHC fish-ticket data identifies catch by NMFS area while logbook data provides depth bins for stratification. Bycatch rates are derived from the IPHC halibut survey using a systematic sub-sample of the survey catch (with no variance estimate). Survey landings are weighted by IFQ landings apportioned to ADF&G statistical areas; the proportional weighting eliminates stations with zero catch or no survey, but eliminates far fewer stations than previously-proposed methods. The result is an estimate of stratum CPUE and confidence intervals, where a stratum is NMFS management subregions x depth (the EBS is combined into a single management subregion). This method gives numbers rather than weights; weights are derived from species-specific average weights provided by AKRO and FMA.
10
The Teams raised a few caveats; the estimation method does not distinguish between retained and discarded catch, and may be biased by the seasonal difference between survey and fishery timing. It was recommended that, as a check of the method in the future, it be used to estimate halibut catch and compare to the direct measure of halibut catch in groundfish fisheries under the restructured observer program to be implemented in 2013. See the ACL summary for Plan Team recommendations on the use of this database. Total catch accounting: Mary Furuness presented preliminary total commercial catch and survey/research catch for 2010, as an example of the development of an AKFIN database for use by authors in groundfish stock assessments. The Magnuson Act requires accounting for all removals. The Teams discussed how best to incorporate total catch (from all sources including scheduled surveys conducted by all agencies, research permits, experimental fishing permits, the commercial halibut fishery, recreational fishing, etc.) into the stock assessments. In some cases the ABC for a stock is calculated and then adjusted downward in anticipation of additional removals, such is the case with the ABC for the pollock in the W/C/WYK where the GHL established by the State for the pollock fishery in PWS. In most cases these catch estimates are incorporated into the stock assessments, when known, but there is not a consistent application of total removals. NMFS intends to make estimates of total catch for 2010 available to the stock assessment authors by October 1, 2011 for incorporation into the stock assessments for the 2011 SAFE report for the 2012 and 2013 groundfish fisheries. The Teams recommended that the total catch be taken into account in the stock assessment determination of OFL and ABC so that downward adjustments of the TAC are not necessary. The Teams felt that the Council should not make allocative decisions between research removals and commercial catch. See additional discussion under ACLs. NMML report: Lowell Fritz summarized Steller sea lion and northern fur seal population trends in Alaska through 2010. There are significant differences in regional sea lion trends since 2000, with declining populations in the Aleutian Islands west of 178W, increasing populations in the eastern Aleutians, and western and eastern Gulf of Alaska, and stable populations in the central Gulf. Eastern stock sea lions in SE Alaska are continuing to increase and are a candidate for removal from the list of threatened and endangered species. Western stock sea lions appear to be responding to regional factors that do not span their range in Alaska. Northern fur seal pup production was assessed in 2010 on the Pribilof Islands, and continues to decline on St Paul Island (at about 5% per year) and has been relatively stable on St George for the last 6 years. Pup production in 2010 on the Pribilof Islands is now as low as it has been in almost 100 years. By contrast, pup production on Bogoslof Island (a new rookery since the mid-1980s) is increasing rapidly and a preliminary estimate for 2011 is approximately 23,000 pups. Lowell also described habitat modeling being conducted by Kate Call. In September 2004, 40 adult female northern fur seals (with pups onshore) were captured, tagged and tracked on the Pribilof Islands to determine foraging habitat and resulting weight gain. Call used these data as well as physical, oceanographic, and fisheries data to develop habitat a suitability model of the eastern Bering Sea. The modeling indicates the potential for competitive overlap with the pollock fishery. Females that foraged on the shelf and in areas frequented by the pollock fishery were more likely to lose weight during the summer than those that foraged off the shelf or in the inner shelf. Spatial management: A stock structure working group (SSWG) was formed in 2009 to provide guidelines for the evaluation of stock structure and spatial harvest specifications. The SSWG developed a report that contains a “template” of the types of data that may be considered in evaluating stock structure, with some guidelines on interpretation of these data. To assist in the application of this template the Joint Plan Teams requested in the September 2010 meeting: 1) a comprehensive table of area management of all stocks, and; 2) criteria for prioritizing stock structure analyses. Paul Spencer provided tables of BSAI and GOA area harvest specifications, and presented the criteria proposed by the SSWG for prioritizing stocks to analyze, which included region-wide ABC/OFL, high vulnerability scores from PSA analysis, and existing information and/or questions regarding stock structure. Rockfish and elasmobranchs have high vulnerability scores. The Joint Plan Teams also proposed in the September 2010 meeting that high catch levels relative to ABC may also be a criterion, but making this comparison over a large spatial area (i.e., BSAI or GOA) may mask subareas where catch is disproportionate to biomass. The SSWG template incorporates detailed examination of catch data, and was thus not viewed by the SSWG as a criterion for application of the template.
11
Proposed stocks for application of stock structure template: BSAI yellowfin sole, BSAI skates, BSAI northern rockfish GOA Atka mackerel, GOA pollock GOA and BSAI sharks
The SSWG agreed that using fishery and scientific information on a case-by case basis is preferred, and noted that proposing a protocol for this evaluation has been the focus of the SSWG. The goal was to develop a default policy that would be applied in the absence of a detailed analysis. If the stock structure template was applied and it was determined that sub-area ABCs produced little benefit, then this more detailed analysis would take precedence. To date, many (perhaps most) area harvest specifications are implemented without this detailed analysis. Development of a consistent default policy has been the goal of the group. Paul reviewed previous recommendations from the Plan Team and SSC on the utility of a default guideline on spatial partitioning of ABC. The Plan Team recommended “…allocating the Acceptable Biological Catch across subsets of NMFS areas within the BSAI and GOA management area as a precautionary measure to the extent practicable”. The SSC recommended “…proposals for subdivision of ABCs within a stock, along with supporting scientific and fishery information, should be considered on a case by case basis in the annual stock assessment process.” A policy would help avoid inconsistencies between the GOA and BSAI. The Plan Teams support the application of the stock structure template as a consistent policy for evaluating the spatial partitioning ABC/OFL, and agrees with the initial stocks proposed by the SSWG for application of the SSWG. The Plan Team also noted that a systematic evaluation of stock structure will highlight data gaps, and aid in developing research priorities and planning the collection of additional data. The Teams also discussed the possibility that application of the stock structure template may indicate that management subareas smaller than those currently used may be recommended, and discussed the history of BSAI and GOA spatial allocations. The Plan Teams thanked the SSWG for development of the template and example applications to various stocks, and will undertake the task of prioritizing stocks for future applications of the template.
Bering Sea Integrated Ecosystem Research Program and Gulf of Alaska Integrated Ecosystem Research Program
BEST – BSIERP Mike Sigler (AFSC) summarized recent developments in the eastern Bering Sea shelf integrated ecosystem studies. Field studies were completed in 2010, and investigators are currently in analysis and synthesis modes, which are scheduled to be completed in 2012. Core hypotheses addressed production control (bottom up vs top down), competition between consumers, and how location matters (e.g., central place foragers). The Program occurred during cool years that followed a series of warm years, a situation that has occurred at other times over the last 100 years. Ice coverage in the northern Bering Sea remained high regardless of whether it was a warm or cold year, and this presents a barrier to movement of more temperate species (e.g., pollock, cod) to the north (this result was counter to one of their hypotheses at the beginning of the study). Fur seal foraging trajectories and other ecosystem simulations were shown. GOA IERP Olav Ormseth (AFSC) summarized recent developments in the Gulf of Alaska integrated ecosystem studies. The Program is organized by trophic levels, with upper trophic level components organized first and led to development of lower trophic level components. Upper trophic level involves investigations of life histories and population dynamics of 5 focal groundfish (Pacific ocean perch, arrowtooth flounder, sablefish, Pacific cod and walleye pollock), supported by studies and modeling of middle and lower trophic levels and oceanography. Core spatial comparison is between SE Alaska (eastern Gulf of Alaska) and Kenai/Kodiak (western Gulf of Alaska). Fieldwork is scheduled for 2011 and 2013, and the project is scheduled for completion in 2014. Sampling is from shoreline out to edge of continental shelf. Observations from 2011 indicate spring phytoplankton bloom was later than expected and spring samples were ‘pre-bloom’; herring is a dominant forage fish in bays, with Pacific cod, pollock, sand lance, and sandfish regularly encountered (eulachon and capelin less so); upper trophic level surveys (predominately near-surface tows) found juvenile salmon to be abundant and nearly ubiquitous, while the five focal groundfish species were encountered less frequently. Ecosystem and habitat modeling/mapping projects were also initiated.
12
Annual Catch Limits: Grant Thompson’s discussion paper described three issues related to improvements to ACL management in groundfish FMPs. Anne Hollowed provided background information on the first issue, which would expand or otherwise change the role of scientific uncertainty in determining the buffer between ABC and OFL. The implementation of ACLs for groundfish is complicated by the relationships of ACLs across stocks. A project at the University of Washington, funded by NMFS, will update a technical interactions model (developed for the groundfish PEIS) and use it to investigate implementation of decision-theoretic and P* approaches. The second issue, lack of a numeric value for MSST, did not generate much discussion but is expected to proceed with the SSC recommendations. Under the third issue the Teams continued their discussion of the incorporation of new databases for TCA (Total Catch Accounting) and HFICE (Halibut Fishery Incidental Catch Estimates). The availability of the HFICE introduces additional sources of removals to the existing CAS (catch accounting system) estimates (including research, sportfish, etc.). The Teams recommended that AKFIN provide a single source of removals to address potential double counting across the HFICE and CAS databases. Stock assessment authors are encouraged to include a risk analysis of potential overages of harvest specification benchmarks in their assessments to determine how the use of TCA and HFICE in particular may affect the determination of ABCs. The Teams recommended that the AFSC provide the following supplemental “Instructions to Authors” for the 2011 assessment cycle. The Teams recommended that all authors provide the 2001-2010 HFICE and the 2010 CAS total catch estimates as an appendix to each assessment chapter in November 2011. Since these estimates are preliminary and the Teams have not reviewed the complete database or assessed the potential effects on determination of OFL and ABC for each stock, further analysis is needed before the Teams can recommend incorporation of these estimates in their OFL/ABC recommendations. The Teams posed some issues regarding how authors should use the databases in the future: 1) how to use catch estimates with no size/age composition information in the models (similar issues occur in the Pacific halibut stock assessment), 2) how the AKRO could or would incorporate these estimates into in-season management (to avoid overharvesting) and 3) development of a single catch estimation time series incorporating all data components. For November, several components are recommended to be included in a table in an appendix in each assessment chapter: 1) the 2010 total catch removal estimates along with research catch estimates reported in previous assessments. The major sources of removals should be noted along with any large deviations in total catch between previously used research catches and the new estimates. 2) HFICE estimates should be tabulated for the years 2001-2010 (from Cindy Tribuzio). Comparisons should be made to the corresponding CAS estimates from the AKRO.The impacts of including HFICE estimates on the total catch estimates currently used in the assessments should be discussed and the implications of these estimates on the ABC and OFL recommendations should be explored. An agenda item will be scheduled in September 2012 to investigate the implications on ABCs. Depending on the implications and discussions that occur, the HFICE estimates may be used in stock assessments in November 2012 for the 2013 /2014 assessment cycle but the Teams do NOT intend to use the data for determining OFLs and ABCs in November 2011 for the 2012/2013 assessment cycle. Ecosystem chapter: Stephani Zador presented the highlights of the draft Ecosystems Considerations chapter of the SAFE Report for 2012. She reported that she will update the EBS report card in the final draft that will be available in November 2011. The next draft will also include a new Aleutian Islands assessment and report card. The ecosystem status and management indicators include 21 updated contributions and six new contributions. Highlights of 2010 physical parameters were presented. There was a La Nina in 2010-11; the ENSO forecast is for a weak La Nina or normal conditions in 2012 with cool upper water temperatures. The deep to moderate cooling from La Nina and the cold summer water coincided with a negative PDO state. The winter 2011 sea level pressure anomaly was the highest since 1955-56; summer was opposite, i.e., low. There was a shift during the mid-2000s in surface drift conditions from Ocean Station Papa to predominantly southerly flow, resembling drift conditions prior to the 1977 regime shift.
13
Biological measurements include new and updated parameters. In 2010 the phytoplankton biomass and size in the Eastern Bering Sea (EBS) was the highest on the inner shelf and the outer shelf, near the Pribilof Islands, and lowest in the northern EBS. Warm and cold years manifest a differential in biomass and size of phytoplankton in the north vs. south Bering Sea. Jellyfish biomass was highest mid shelf, double the previous estimates. The diversity was lower as it was mostly Chrysaora melanster. The Plan Team noted that plots of jellyfish bycatch were recent and not related to early catches, therefore no basis of comparison for this earlier than 2000. Indicators of fish were updated for fishes. The temperature change index was as predictor of age-1 pollock and age-1 Pacific cod in the EBS. Cool summer followed by warm spring is good for age-1 survival. There was a cool summer in 2010 followed by a normal spring 2011. The EBS slope survey data was used to create a Hills index of Biodiversity. The ADF&G trawl survey around Kodiak mostly captures arrowtooth flounder, flathead sole, other flatfishes. In the ADF&G small mesh trawl surveys low numbers were captured of all forage fishes except eulachon. There was discussion among Plan Team members as to why a pink salmon forecast was generated when we do not do stock assessment for salmon. The answer is that age-0 pink salmon are forage fish for many species. Seabird index for the EBS revealed a declining trend in kittiwake abundance. Time series analysis indicates that prey supply and bottom temperature may influence reproduction but effects may not be seen for 1-2 years. A new approach was used to compare past seabird bycatch in the Alaska groundfish fisheries. In decreasing order of abundance, the following birds were captured: fulmars, shearwaters, gulls and albatrosses. The index will now be updated annually. Two short-tail shearwaters were caught recently; however the extrapolation of this low number to an estimated to 15 was noticed and commented on by the Plan Team. Fish stock sustainability index is a performance measure for sustainability of stocks selected for commercial and recreational fishing, The Plan Teams recognized that they should distinguish between information that is useful and information that is not useful in the chapter. This chapter is comprehensive and not related to specific stock assessments. The Teams concurred that the individual stock assessment authors should highlight important factors in the assessments.
14
ATTACHMENT
Council’s Five-Year Research Priorities: 2011-2015 The Council has identified priorities for research in the next 1 to 5 years as those activities that are the most important for the conservation and management of fisheries in the Gulf of Alaska, Aleutian Islands, eastern Bering Sea, and the Arctic. This listing of priorities has two purposes: 1) to meet the requirements of the revised Magnuson-Stevens Act for the Councils to identify research that is needed in the next 5 years, and 2) to provide guidance on research priorities to the research community and to funding agencies. The research priorities are separated into two categories: Immediate Concerns and Ongoing Needs. Immediate Concerns include research activities that must be addressed to satisfy federal requirements and to address pressing fishery management and ecosystem issues related to fishery management. Within this category the Council’s Scientific and Statistical Committee (SSC) has indicated those Research Priorities for which Research is Underway. These are Research Priorities for which NPRB grants have been awarded or for which it is known to the SSC that one or more other agencies have undertaken the recommended research. These priorities will remain on the list until the recommended research is complete and evaluated in terms of its meeting the Research Priority that had been listed. Ongoing Needs include research to advance the Council's fisheries management goals as defined in the Groundfish PSEIS, other strategic documents of the Council (i.e., FMPs, AI FEP, and EFH, crab, salmon PSC, and other EISs) and NMFS. Ongoing Needs include efforts on which the assessment models depend for their annual updates. For example, without the survey information, the annual process of setting ABCs and OFLs for the managed stocks would be compromised. The Council sees these efforts as needed on an ongoing basis, and constituting the time series on which management is based. It should be recognized that research in these categories is being conducted or may be conducted through Federal, State of Alaska, North Pacific Research Board, and other funding sources.
Five-Year Research Priorities: 2011-2015
Immediate Concerns I. Fisheries
A. Fish and Fisheries Monitoring 1. Non-recovering stocks. A pressing issue is why certain stocks have declined and failed to recover as anticipated (e.g., Pribilof Island blue king crab, Adak red king crab). Research into all life history components, including predation by groundfish on juvenile crab in nearshore areas, is needed to identify population bottlenecks, an aspect that is critically needed to develop and implement rebuilding plans. 2. Improvements are needed for in-season catch accounting by sex and size for crab in non-directed fisheries with high bycatch rates, particularly for blue king crab in the Pacific cod pot fishery in the Pribilof Islands. 3. Develop methods for reliable estimation of total removals (e.g., surveys, poorly observed fisheries) to meet requirements of total removals under ACLs. Improve species identification, by both processors and observers, for priority species within species complexes in catches. Methods that quantify and correct for misidentifications are desired. 4. There is a need to characterize the spatial distribution of male snow crab relative to reproductive output of females in the middle domain of the EBS shelf (partially underway).
B. Stock Assessment 1. Improve handling mortality rate estimates for crab. Improved understanding on the post-release mortality rate of discarded crab from directed and non-directed crab pot fisheries and principal groundfish (trawl, pot, and hook and line) fisheries is required. The magnitude of post-release mortality is an essential parameter in the determination of total annual catch used to evaluate overfishing in stock assessment and projection modeling. For example, assess discard mortality rates of Tanner crab by size, month, sex, and fishery type. (partially underway: Chionocetes RAMP study)
15
2. Refine methods to incorporate uncertainty into harvest strategies for groundfish for ACL estimation. (underway) 3. Develop biomass indices for Tier 6 species, such as sharks, and conduct net efficiency studies for spiny dogfish. 4. Conduct a tagging study of red king crab in the region north of Bristol Bay to assess the movement between this region and the Bristol Bay registration area. 5. Winter surveys of groundfish in all three areas (EBS, GOA and AI) to create seasonal models of fish diet and biomass distribution relative to Steller sea lion critical habitat. 6. Tagging studies of Pacific cod and Atka mackerel to create models of short-term movement of fish relative to critical habitat and to estimate ageing error with known age fish for Pacific cod. 7. Tagging studies of Atka mackerel to estimate local abundance inside and outside critical habitat. (underway in Central Aleutian Islands; needed in Western Aleutian Islands)
C. Fishery Management 1. Develop a research program that will facilitate evaluation of salmon (both chinook and non-chinook) PSC mitigation measures in the BSAI and GOA. This includes updated estimates of the amounts reasonably necessary for subsistence, and access to cost data for the commercial pollock and salmon industries so that impacts on profits (not revenues) can be calculated. 2. Develop improved catch monitoring methods of fishery interactions including direct and alternative options (e.g., electronic logbooks, video monitoring), particularly on smaller groundfish, halibut, and commercially guided recreational fishing vessels, including an assessment of feasibility for small vessels. 3. Improve the resolution of Chinook and chum salmon genetic stock identification methods (e.g., baseline development, marker development), improve precision of salmon run size estimates in western Alaska, and initiate investigations of biotic and abiotic factors influencing natural mortality rate during ocean migration in the GOA and BSAI. 4. Investigate factors that affect angler demand in the guided angler sector of the halibut fishery resulting from regulatory changes or general economic conditions. II. Fisheries Interactions
A. Protected species 1. There is a need for studies of localized interactions between fisheries and protected species. Studies of interactions between Steller sea lions and commercial fisheries are needed in the Central and Western Aleutian Islands, with an emphasis on seasonal prey fields, diet, and movement of sea lions and their prey. These studies should be conducted at appropriate spatial and temporal scales. 2. Foraging ecology studies of SSL in the western and central Aleutians. Specifically, this research would include at-sea tracking of adult females and juveniles, and collecting SSL scat and spew. Supplemental research could include stable isotope analyses, fatty acid analysis, contaminant studies, monitoring of condition and health indices, and additional photogrammetric work. (underway). 3. Studies to assess vital rates (i.e., reproduction and survival) of SSL in the western and central Aleutians. Specifically, this would require longitudinal studies (e.g., branding of pups) to determine rates of age- or size-class specific survival, as well as studies to help evaluate the reproductive performance of adult females and natality, including comparative surveys throughout the western Distinct Population Segments. (underway). 4. Studies investigating advancements in methods to estimate sea lion abundance, such as the use of unmanned aerial vehicles, that would increase the probability of acquiring abundance estimates in remote areas. (underway) 5. Studies to quantify killer whale predation of SSLs, particularly in the western and central Aleutian Islands. 6. Increased frequency of Steller sea lion pup and non-pup surveys to a level sufficient to track population dynamics in the western DPS.
16
III. Habitats
A. Evaluate habitats of particular concern: 1. Assess whether Bering Sea canyons are habitats of particular concern, by assessing the distribution and prevalence of coral and sponge habitat, and comparing marine communities within and above the canyon areas, including mid-level and apex predators (such as short-tailed albatrosses) to neighboring shelf/slope ecosystems (partially underway).
B. Baseline Habitat Assessment 1. Dynamic ecosystem and environmental changes in the northern Bering Sea and Arctic are occurring on a pace not observed in recorded time. In response to the new FMP for the Arctic, assessment of the current baseline conditions is imperative. This effort, while of great scientific importance, should not supplant the regular surveys in the BSAI and GOA, which are of critical importance to science and management.
C. Fishing Effects on Habitat. 1. Research is needed on the effects of habitat modifications on spawning and breeding female red king crab, particularly in nearshore areas of southwest Bristol Bay. Ongoing Needs I. Fisheries
A. Fish and Fishery Monitoring 1. Continuation of State and Federal annual and biennial surveys in the GOA, AI, and EBS, including BASIS surveys and crab pot surveys, is a critical aspect of fishery management off Alaska. It is important to give priority to these surveys, in light of recent proposed federal budgets in which funding may not be sufficient to conduct these surveys. Recent substantial loss of funding for days at sea for NOAA ships jeopardizes these programs. These surveys provide baseline distribution, abundance, and life history data that form the foundation for stock assessments and the development of ecosystem approaches to management. These surveys are considered the highest priority research activity, contributing to assessment of commercial groundfish fisheries off Alaska. 2. Continuation of stock assessments in the BSAI and GOA areas such that the quality of information used to establish harvest specifications is not compromised. Recent development of a prioritization system regarding where assessment funds would be allocated was presented as a tool to allocate future budget increases, but could also be used to determine assessment cutbacks during times of budget cuts. Age-structured stock assessments provide critical information on stock abundance, year class strength, and stock productivity. Consideration of reductions in the frequency and/or level of detail of assessments should be accompanied by detailed analyses on the potential impacts on harvest specifications and stock abundance. 23. Conduct routine subsistence use, fish, crab, and oceanographic surveys of the northern Bering Sea and Arctic Ocean. These surveys will become increasingly important under ongoing warming ocean temperatures because range expansions of harvested fishery resources are anticipated. If range expansions occur, data will be needed to adjust standard survey time series for availability. 3. Continue and expand cooperative research efforts to supplement existing surveys to provide seasonal or species-specific information for use in improved assessment and management. The SSC places a high priority on studies that provide data to assess seasonal diets and movements of fish and shellfish, for use in studies of species interactions in spatially explicit stock assessments. 4. For groundfish in general, and rockfish in particular, continue and expand research on trawlable and untrawlable habitat to improve resource assessment surveys. For example, improved surveys, such as, hydro-acoustic surveys, are needed to better assess pelagic rockfish species that are found in untrawlable habitat or are semi-pelagic species such as northern and dusky rockfish. 5. Studies are needed to evaluate effects of the environment on survey catchability. For crabs, studies are needed on catchability, as it directly bears on estimates of the stock size for setting of catch quotas. Research to refine the estimates of survey catchability, q, used to infer absolute, rather than relative abundance would
17
substantially improve the quality of management advice. Particular emphasis should be placed on Tanner crab because of recent trends in stock status. 6. Continue research on the design and implementation of appropriate survey analysis techniques, to aid the Council in assessing species that exhibit patchy distributions and, thus, may not be adequately represented (either over or under estimated) in the annual or biennial groundfish surveys. 7. There is a need to improve biological data collection (e.g., age, size, maturity, and sex) of some bycatch species (e.g., sharks, skates, octopus, squid, sculpins, and grenadiers) to better quantify potential effects of bycatch on these stocks. 8. Advance research towards developing a quantitative female reproductive index for the surveyed BSAI crab stocks. The current stock-status assessment process for surveyed BSAI crab stocks uses the estimated mature male biomass at the presumed time of mating as the best available proxy for fertilized egg production. Research on mating, fecundity, fertilization rates, and, for snow and Tanner crab, sperm reserves and biennial spawning, is needed to develop annual indices of fertilized egg production that can be incorporated into the stock assessment process and to model the effects of sex ratios, stock distribution, and environmental change on stock productivity. Priority stocks for study are eastern Being Sea snow and Tanner crab and Bristol Bay red king crab. 9. Continue and expand existing efforts to collect maturity scans during fisheries that target spawning fish. 10. Identification and recovery of archived data (e.g., historical agency groundfish and shellfish surveys) should be pursued. Investigate integrating these data into stock and ecosystem assessments. 11. Fishery independent survey of scallops, e.g., Yakutat area and other major GOA fishery locations. 12. Develop a long-term survey capability for forage fish (partially underway).
B. Stock Assessment 1. Acquire basic life history information (specifically, natural mortality, size at maturity, and other basic indicators of stock production/productivity) for sharks, skates, sculpins, octopus, and squid and data-poor stocks of crab, to allow application of Tier 5 or Tier 4 assessment criteria. There are two possibilities that would require dedicated research: (1) directly estimate fishing mortalities through large-scale tagging programs; and (2) develop habitat-based estimates of abundance based on local density estimates in combination with large-scale habitat maps. Little information is available, especially for sculpins, skates, octopuses, squids, grenadiers, and some sharks. (partially underway) 2. Improve estimates of natural mortality (M) for several stocks, including Pacific cod and BSAI crab stocks. 3. Studies are needed to validate and improve age determination methods for Pacific cod, Pacific sleeper sharks, and spiny dogfish. Conventional tagging studies of YOY and/or one-year old Pacific cod would be useful in this regard (partially underway). 4. Evaluate the assessment and management implications of hybridization of snow and Tanner crabs. 5. Quantify the effects of historical climate variability and climate change on recruitment and growth and develop standard environmental scenarios for present and future variability, based on observed patterns. There is also a clear need for information that covers a wider range of seasons than is presently available. 6. There is a need for the development of projection models to evaluate the performance of different management strategies relative to the Council’s goals for ecosystem approaches to management. Projection models are also needed to forecast seasonal and climate related shifts in the spatial distribution and abundance of commercial fish and shellfish. (partially underway) 7. Existing stocks assessments should complete stock structure analysis suggested by the Council stock structure working group. When little data exist to identify stock boundaries, expanded studies are needed in the areas of genetics, reproductive biology, larval distribution, and advection. Expanded tagging efforts are needed to support the development of spatially explicit assessments. High priority species for potential spatially explicit models include: walleye pollock, Pacific cod, sablefish, yellowfin sole, rock sole, arrowtooth flounder, Pacific ocean perch, black spotted rockfish, rougheye rockfish, snow crab, and Atka mackerel. (partially underway) 8. Genetic studies to provide information on sources and sinks for scallop larvae are needed to improve our understanding of the rate of larval exchange between scallop beds. Also needed are age-structured models for scallop assessment.

18
9. Explore alternative methodologies for Tier 5 and 6 stocks such as length-based methods, or biomass dynamics models.
C. Fishery Management 1. Evaluate the effectiveness (e.g., potential for overharvest or unnecessarily limiting other fisheries) of setting ABC and OFL levels for data-poor stocks (Tier 5 and 6 for groundfish and Tiers 4 and 5 for crab, e.g., squid, octopus, shark, sculpins, other flatfish, other rockfish, skates, grenadier, and crab). Research is needed to refine the basis for setting gamma for Tier 4 crab stocks. (partially underway) 2. Conduct retrospective analyses to assess the impact of Chinook salmon bycatch measures on the BSAI pollock fishery. Analyses should include an evaluation of the magnitude and distribution of economic effects of salmon avoidance measures for the Bering Sea pollock fishery. In this case, it is important to understand how pollock harvesters have adapted their behavior to avoid bycatch of Chinook and “other” salmon, under various economic and environmental conditions and incentive mechanisms. 3. Develop forecasting tools that incorporate ecosystem indicators into single or multispecies stock assessments, to conduct management strategy evaluations under differing assumptions regarding climate and market demands. Standardization of “future scenarios” will help to promote comparability of model outputs. 4. Development of an ongoing database of product inventories (and trade volume and prices) for principal shellfish, groundfish, Pacific halibut, and salmon harvested by U.S. fisheries in the North Pacific and eastern Bering Sea. 5. Analyze current determinants of ex vessel, wholesale, international, and retail demand for principal seafood products from the GOA and BSAI. 6. Conduct pre- and post-implementation studies of the benefits and costs, and their distribution, associated with changes in management regimes (e.g., changes in product markets, characteristics of quota share markets, changes in distribution of ownership, changes in crew compensation) as a consequence of the introduction of dedicated access privileges in the halibut/sablefish, AFA pollock, and crab fisheries. “Benefits and costs” include both economic and social dimensions. 7. Conduct prospective analyses of the robustness and resilience of alternative management strategies under varying environmental and ecological conditions. 8. Conduct prospective and retrospective analyses of changes in the spatial and temporal distribution of fishing effort, in response to management actions (e.g., time/area closures, marine reserves, PSC and other bycatch restrictions, co-ops, IFQs). 9. Develop a framework for collection of economic information on commercial, recreational, and charter fishing, as well as fish processing, to meet the requirements of the MSFCMA sections 303(a)(5, 9, 13), 303(b)(6), and 303A. 10. Continue to evaluate the economic effects from crab rationalization programs on coastal communities. This includes understanding economic impacts (both direct and indirect) and how the impacts are distributed among communities and economic sectors. 11. Improve estimation of fishery interactions (including catch) with marine mammals (e.g., state managed gillnet fisheries), seabirds, and non-target groundfish (e.g., sharks, skates), and protected species. 12. Develop bioeconomic models with explicit age- or size-structured population dynamics for BSAI and GOA groundfish fisheries to estimate maximum economic yield and other bioeconomic reference points under uncertainty. 13. Research the benefits and costs of halibut and halibut PSC utilization in different fishing sectors. For halibut and other PSC and bycatch species, conduct research to better identify where regulations restrict the utilization of fish from its most beneficial use and evaluate how changes in existing regulations would affect different sectors and fisheries. II. Fisheries Interactions
A. Protected Species
19
1. Economic, social, and cultural valuation research on protected species (i.e., non-market consumptive use, passive use, non-consumptive use). 2. There is a need for studies of localized fishery-protected species interactions. Studies of interactions between Steller sea lions and fisheries are needed in the Central GOA, with an emphasis on seasonal prey fields, diet, and movement of sea lions and their prey. These studies should be conducted at appropriate spatial and temporal scales 3. Foraging ecology studies of SSL in the Commander Islands. Research techniques would be similar to item #2. 4. Foraging ecology studies of SSL in the Gulf of Alaska. In addition to at-sea tracking of older animals, outside of the Kodiak area the primary information needed from this sub-region is updated information on diet composition of SSL throughout the sub-region. DELETE, redundant with #2 5. Maintain assessment of SSL vital rates in the Russian Far East and Commander Islands. Research techniques would be similar to item #4 and include expansion to autumn and winter periods. 6. Aerial photogrammetric survey studies of rookeries and haul-outs in Russia. This survey methodology would provide abundance estimates for sea lions in Russia directly comparable to estimates for Alaska. 7. More studies are needed to fully evaluate the possible linkages between fishery induced disturbances or local prey depletion for northern fur seal in the Pribilof Islands region. (underway) 8. Further research is needed on gear modifications and fishing practices for reducing bycatch, particularly of PSC species (e.g., salmon). (underway for crab) 9. Conduct studies of whale depredation of catch in long-line fisheries and surveys to improve the quality of long-line abundance estimates. (underway)
III. Habitat
A. Habitat Mapping 1. Improved habitat maps (especially benthic habitats) are required to identify essential fish habitat and distributions of various substrates and habitat types, including habitat-forming biota, infauna, and epifauna. (partially underway) 2. Begin to develop a GIS relational database for habitat, including development of a historical time series of the spatial intensity of interactions between commercial fisheries and habitat, which will be needed to evaluate impacts of changes in EFH on the growth, reproduction, and distribution of fish and shellfish. 3. Assess the extent of the distribution of Primnoa corals and skate egg case concentration sites in the GOA.
B. Function of Habitat 1. Evaluate relationships between, and functional importance of, habitat-forming living substrates to commercially important species, including juveniles. 2. Develop a time series of the impact of fishing on GOA, AI, and EBS habitats that could be used to assess: a) the impact of changes in management on the rate of habitat disturbance, and b) the impact of habitat disturbance on the growth, distribution, and reproductive success of managed species. 3. Evaluate effects of fishing closures on benthic habitats and fish production. There are many closures that have been in effect for various periods of time, for which evaluations have not been conducted. A recent example includes slope HAPCs designated in the western Gulf of Alaska. 4. Research is needed on the role of habitat in fish population dynamics, fish production, and ecosystem processes. Such research will improve the capability to identify and protect critical vital habitats (including essential fish habitat and habitat areas of particular concern); help design effective habitat restoration efforts; improve the design and management of marine protected areas; improve fishery-independent population surveys; and improve stock assessments. IV. Integrated ecosystem assessment A. Ecosystem indicator development and maintenance. 1. Climate and physical indicators
20
a) Develop a multivariate index of the climate forcing of the Bering Sea shelf. Three biologically significant avenues for climate index predictions include advection, setup for primary production, and partitioning of habitat with oceanographic fronts and temperature preferences. b) Develop bottom and water column temperature database for use in EBS, GOA, and AI stock assessments c) Maintain sea ice retreat index for EBS 2. Lower trophic level community production data a) Collect primary production time series. In the absence of these, develop phytoplankton biomass time series for both water column (in progress for EBS) and sediments. b) Collect and maintain zooplankton production and biomass time series in the EBS. Continue development of integrated zooplankton biomass time series in EBS (copepods plus euphausiids). Develop, collect and maintain time series of zooplankton production and biomass for the AI, GOA and Arctic. c) Collect and maintain zooplankton community composition time series in the Bering Sea. Develop, collect and maintain time series of zooplankton community composition for the GOA, AI, Arctic. d) Collect and maintain benthic community composition, production and biomass time series in all regions. 3. Continue to incorporate ecosystem indicators into synthetic ecosystem assessments and stock assessments a) Maintain indicator-based ecosystem assessment for EBS b) Develop indicator-based ecosystem assessments for AI (in progress), GOA, Arctic c) Develop stock-specific ecosystem indicators and incorporate into stock assessments (in progress) 4. Initiate/continue research on ecosystem-based management objectives and indicator thresholds, including ecosystem-level management strategy evaluation, and continue existing management strategy evaluations at the stock level. 5. Continue and expand cooperative research efforts to supplement existing at-sea surveys that provide seasonal, species-specific information on upper trophic levels (seabirds and marine mammals). a) Updated surveys to monitor distribution and abundance of seabirds and marine mammals are needed to assess impacts of fisheries on apex predators b) Improve time series of apex predator biomass and reproductive success for use as ecosystem indicators (in progress). 6. Initiate and expand non-market valuation research of habitat, ecosystem services, and passive use considerations. 7. Develop spatially explicit indicators. For example, spatial distributions of zooplankton, benthos, and forage fish would be critical for predicting the foraging success of central place foragers such as seabirds and pinnipeds in the EBS. Spatially explicit indicators could be used to investigate observed patterns such as the relative success of commercial crabs in Bristol Bay versus further out on the EBS shelf. a) Develop distributional indices for foraging guilds, indicator species, and fisheries (in progress). b) Develop an index of cold-pool species or other habitat species groups. c) Maintain and expand existing research programs for central place foragers (fur seals and seabirds). 8. Develop fishery performance indices. For stocks where the TAC is set well below the ABC and OFL, an assessment of whether the TAC is fully utilized may serve as a better indicator of the performance of the fishery relative to the predicted level of catch. Other measures of net income or revenue might be considered as fishery performance indicators. For example, when stocks are low, the price may increase, this may compensate for longer search time. B. Research on Environmental Influences on Ecosystem Processes 1. Climate variability: monitor and understand how changes in ocean conditions influence managed species.
21
a) Maintain moorings. Development and maintenance of indices of the timing and extent of the spring bloom is a high priority. For this, maintenance of moorings, especially M-2, is essential. (underway) b) Monitor seasonal sea ice extent and thickness: If recent changes in ice cover and temperatures in the Bering Sea persist, these may have profound effects on marine communities. c) Measure and monitor fish composition: Evaluate existing data sets (bottom trawl surveys, acoustic trawl surveys, and BASIS surveys) to quantify changes in relative species composition of commercial and non-commercial species, identify and map assemblages, and monitor changes in the distribution of individual species and assemblages. Additional monitoring may be necessary in the Aleutian Islands, northern Bering Sea, and areas of the Gulf of Alaska. d) Assess the movement of fish to understand the spatial importance of predator-prey interactions in response to environmental variability. 2. Conduct Research on Ocean Acidification a) Collect and maintain time series of ocean pH in the major water masses off Alaska. (partially underway) b) Assess whether changes in pH would affect managed species, upper level predators, and lower trophic levels. (partially underway) 3. Species’ responses to multiple environmental stressors a) Laboratory studies are needed to assess the synergistic effects of OA, oil, and changes in temperature on productivity of marine species. 4. Specific to the Arctic, a working group of scientists from the Arctic Nation scientists met in June 2011 in Anchorage and noted the following information gaps: - baseline information regarding physical, chemical, and biological conditions of the Arctic, - understanding how climate change will impact the oceanography of the Arctic, - how climate change would impact primary productivity and whether any such changes might result in restructuring of the Arctic marine ecosystems, - conditions that would be necessary to establish self-sustaining fish and crab population in the Arctic and surrounding shelf seas. C. Basic research on trophic interactions 1. Collect, analyze, and monitor diet information, from seasons in addition to summer, to assess spatial and temporal changes in predator-prey interactions, including marine mammals and seabirds. The diet information should be collected on the appropriate spatial scales for key predators and prey to determine how food webs may be changing in response to shifts in the range of crab and groundfish. 2. Ecosystem structure studies: Studies are needed on the implications of food web interactions of global warming, ocean acidification, and selective fishing. For instance, studies are needed to evaluate differential exploitation of some components of the ecosystem (e.g., Pacific cod, pollock, and crab) relative to others (e.g., arrowtooth flounder). D. Ecosystem Modeling 1. Maintain the diverse suite of models used to support integrated ecosystem assessment in the EBS, including single species, multispecies, food web, and coupled biophysical end-to-end ecosystem models. Continue to develop a diverse suite of models to support integrated ecosystem assessment in the GOA, AI, and Arctic, maintaining existing models. a) Compare predictions from different models within ecosystem assessments b) Initiate an evaluation of the predictive skill of different assessment tools 2. Food habits collections and ecosystem modeling to quantify interactions between SSL groundfish prey and the food web effects of changes in fishing mortality. 3. Modeling and field studies of ecosystem productivity in different regions (EBS, GOA and AI).
22
Minutes of the
Bering Sea Aleutian Islands Groundfish Plan Team
September 2, 2011 The BSAI Groundfish Plan Team convened on Friday, September 2, at 9:00 am. Plan Team members present are listed under the Joint BSAI/GOA Groundfish Plan Team minutes. Fourteen members of the public and 9 agency personnel also attended. Pollock: Jim Ianelli presented new information on the Bering Sea pollock assessment. In general, this year’s survey information is not available for this meeting because of its early date this year. New data that is expected for the November assessment includes bottom trawl survey data, acoustic vessels-of-opportunity data (on the bottom trawl survey vessels) and 2010 fishery age compositions. Jim examined this season’s fishery catch rate data because of reports that fishing was slow; he found that catch per day had dropped off in early August and then picked up by late August. He also found that catch per day also fell in other years later in the season. Currently the Bogoslof pollock ABC is small (156 t). Jim presented some discussion of alternative bycatch levels that are allowable while still providing conditions conducive to rebuilding the Bogoslof stock. The motivation is that pollock bycatch has the potential to constrain flatfish fisheries in this area. The reference value set by the SSC currently is 2 mmt, but varied until 1996. Jim presented some alternative methods. Alternatives 1 and 2 set the maximum observed biomass (~2.4 mmt) as B0, and differed in how the Bmsy was set. Alternative 3 used a full age-structured assessment. Alternative 4 applied a Tier 5 approach based on the Bogoslof surveys. Alternatives 3 and 4 have been presented in previous assessments. The maximum survey value occurred in 1988 and substantial fishing occurred before this time and peaked during 1987-1989 which weakens the assumption that this value represents B0. The Plan Team supports bringing forward these alternatives in the November assessment but does not have an alternative it favors at this point. Updating the age-structured model received the least support (Alternative 3) because the Plan Team suspects that an update would not provide a substantially different ABC estimate than previously (~25,000 t), yet it was recognized that having an update would fully complete the set of alternatives for the November Plan Team review. Further the decision regarding which catches to include in the age-structured model (e.g., Donut Hole) and stock separation would remain problematic and continue (as before) to add uncertainty to the accuracy of the biomass and ABC estimates. In addition, the Plan Team notes that they may choose to retain the current approach in November. The Plan Team received copies of the spatial workshop but did not receive a presentation at the Plan Team meeting. Aleutian Island Pacific cod: An age-structured stock assessment is done for the eastern Bering Sea (EBS), and the resulting ABC is then extrapolated to the entire BS/AI region on the basis of swept-area estimates of abundance from the EBS and AI trawl surveys. The proportion of the total for the AI in the final year is estimated by fitting a Kalman filter to the time series, but neither the OFL nor ABC is partitioned between regions. In recent years there has been some concern about this procedure because of disproportionate harvest in the AI and a
23
declining trend in the AI trawl survey abundance estimate. The Team has recommended separate ABCs for the EBS and AI in the past. In December 2010 the SSC requested that a standalone AI assessment be done for evaluation in 2011. In February 2011 the SSC expanded that charge, asking the assessment author and Team to develop a plan for how the BS/AI assessments should evolve. In response to the December request Grant Thompson produced a short paper that fitted a Kalman filter to the AI trawl survey abundance estimates directly, and then produced an AI ABC with a Tier 5 calculation. In Grant’s absence, Mike Sigler summarized Grant’s paper on a Tier 5 approach for AI Pacific cod. The Team discussed the relative merits of the Kalman filter approach and Tier 5 approach for setting an ABC for the AI. The Kalman filter approach implicitly assumes that trawl survey catchability is the same in the EBS and AI, which is unlikely. The AI trawl net opens higher and probably has a higher catchability for cod, meaning that the present procedure probably overestimates AI biomass. The Tier 5 approach assumes that AI trawl survey catchability is 1, which is unlikely. It is almost certainly less, meaning that the Tier 5 approach probably underestimates AI biomass. An industry representative suggested that the Team first consider the SSC’s larger question as to how the BS and AI would be assessed and managed in the long term. He also observed that AI catches in 2011 have not been disproportionate even though the estimated proportion of biomass in the AI is lower than in the past. (Estimated biomass is 9%, catches are reportedly 6%). Because of that, it is not urgent to split the ABC for 2012. Anne Hollowed reported that Grant had not had time to address the larger question because he was fully occupied with the EBS assessment. She reported that Teresa A’Mar likely would be taking over the GOA Pacific cod assessment in 2012 and she expected that Grant would be able to produce a plan for the AI assessment next year. The Team looks forward to hearing Grant’s recommendations next year. At this point, in view of the different abundance trends, our preference is for separate age-structured assessments of the EBS and AI. The Team expects that both the Kalman filter and Tier 5 approach be up for discussion in November. Halibut rates in Yellowfin sole fishery: Tom Wilderbuer gave a brief presentation of the bycatch rates of halibut in the yellowfin sole fishery. This was placed on the agenda as a subject of interest. Tom was inspired to look into this subject by the recent Council attention to salmon and halibut bycatch. The information presented came from the groundfish observer database. A plot of the ratio of halibut to yellowfin sole CPUE in the survey and the fishery from 1991 to 2010 indicated a close correspondence between these measures. There was a notable decrease in the ratio for the fishery beginning in 2009. The data suggest that Amendment 80 was effective at reducing halibut bycatch. Jane DiCosimo commended Tom’s initiative and noted that this exercise was timely considering the Council’s interest in reducing halibut bycatch in the groundfish fisheries. Alan Haynie pointed out that care was needed when making comparisons from ratios because they do not indicate the sizes of the catches in any year. Yellowfin sole Tom Wilderbuer presented the application of dendrochronology techniques to improve stock assessment estimates of growth in Bering Sea yellowfin sole. An otolith increment measurement study has shown that otolith growth and somatic growth in yellowfin sole are correlated with annual sea surface and bottom temperature. Length/weight data collected when obtaining otolith samples in NMFS RACE surveys (n=7,000) also indicated that weight at age was variable and seemed to relate to summer bottom water temperature observations with a lag of 2-3 years. The analysis indicates that yellowfin sole somatic growth is positively correlated with May bottom water temperature in the Bering Sea. These results for yellowfin sole were used to explore climate impacts
24
on growth by incorporating temperature-dependent growth into an age-structured stock assessment model and then comparing the results with the base model that uses time-invariant growth. Bill Clark suggested using the estimated population as a covariate to model the annual growth increment due to density dependent effects. BSAI Skates Olav Ormseth presented a discussion on splitting Alaska skates out of the BSAI skate complex. The species composition and abundance differs between the EBS and AI. There is low diversity on the EBS shelf as almost all are Alaska skates, which have a high biomass. Alaska skates are found mainly <200 m. The EBS slope has the highest skate diversity, which is driven by depth. The AI has medium diversity of skates and is not dominated by Alaska skates. A number of management changes have resulted in more precautionary management for BSAI skates. In 1999 the BS survey started identifying skates to species. The Observer Program followed in 2005. The BSAI skate complex was broken out of the other species complexes beginning in 2011 and is managed as one complex. Since 2008, due to the development of an age-structured model for Alaska skates, BSAI Alaska skate is calculated under Tier 3 and all others are calculated under Tier 5. Then the specifications are summed. Tier 3 results in a lower, more conservative OFL than under Tier 5. The age-structured model results in 88% lower ABC and 76% lower OFL. Also two GOA skates species were separated from the skate complex, and all GOA skates were broken out of the GOA other species category, in 2006 after a target fishery occurred the previous year. NMFS puts BSAI Alaska skates on bycatch status at the beginning of the fishing year and they are retained up to the maximum retainable amount (20% of the target species catch). Skate bycatch is substantial, particularly in the Pacific cod longline fishery. There is not a huge fluctuation in catch, and skates have not hit the OFL. There are nine times as many Alaska skates caught as all other skates combined. There is now separate catch accounting for Alaska skates (as well as big and longnose skates, which have been accounted separately since 2005), so that would not be an issue if only Alaska skates were split out. However if each skates species were split out new species codes would be needed for the catch accounting system (CAS), which would require amending federal regulations. While observers are trained to identify skates, getting access to skates for purposes of identification can be problematic, especially in longline fisheries. In addition, shoreside species identification is likely to be inadequate. As a result, there may be some issues regarding CAS data at the skate species level. However, species-level catch accounting is valuable for tracking the catch relative to the biomass of individual species. Small TACs for individual species have the potential to constrain target fisheries. Olav presented the following four management alternatives to consider. He stated his ambivalence about the need to revise skate management. He weakly recommended #3. He pointed out that even if no species of skate are split out, skates are not in danger of overfishing. In 2010 18 mt of Alaska skate were caught; the ABC was 24 mt. Similarly, the catch of Other Skates is well below its ABC. This is not a question of conservation, but of best management practices. (1) Status quo, i.e., do not make any changes. (2) Split into Alaska skates and other skates; leave other skates lumped for catch accounting. (3) Split into Alaska skates and other skates; have species-level catch accounting. (4) Split out each skate species with species-level management. A lengthy discussion ensued among Plan Team members and industry and agency staff. Industry representatives affirmed they would support splitting out skates to species if there was a conservation concern. Instead this action has the potential to constrain target fisheries. Given the right market conditions skates could quickly expand from bycatch to a target fishery if allowed. As species are separated out, more buffer must be put into each TAC so as not to exceed the 2 M mt OY cap. Non-target species are allocated lower TACs of the total OY, and are
25
sometimes underfunded and TAC overages may occur. For catch accounting in the smaller shoreside landings, catch of Alaska skates likely are overestimated, either because the identification is not really known or because there is a market for Alaska skates and not for the other species. The result is that skates will be discarded, which is contrary to conservation concerns. The Team concurred that there is not a strong rationale due to a conservation concern for splitting out Alaska skates at this time and that there are many unanswered questions about the consequences. The ability to identify a species is not sufficient reason to manage the species separately. The Team noted that two GOA skate species were broken out because a fishery was expected to develop on them. The issue of species-level management is complicated by spatial management. Skate species in the BSAI have different distributions, driven in part by depth. Skates in the BSAI have been recommended for review using the Council’s new spatial management template. Should a spatial management split (e.g., AI vs EBS) be necessary, layering it on a species split could create a management problem in the future. There was an argument in favor of consistency in the decisions by the Plan Team. However attempting to maintain consistency does not mean Alaska skates must be split because the Plan Team split out other species. This points to the need for a Plan Team policy; should we only split out species when it is a conservation issue? Mary Furness offered to provide a list of the history of splitting out species for our next meeting, i.e., what species and why they were separated from a complex. In summary the Team acknowledged the trade-off between balancing national standards to achieve OY and not to overfish individual species, along with additional burdens on catch accounting, the regulatory process, and the needs of the industry. The Team requested additional information on the consequences of splitting species from complexes. The BSAI Plan Team encouraged the author to: (1) Examine alternative 3 – split into AK skate and other skates (which has been done via separate tier
management), (2) Calculate a split into BS and AI (corresponding to previous team discussions on spatial management), (3) Examine the effect of layering species splits with spatial splits (but only do this if this is not a large amount of
work).
In addition, the Team supported the development of species-level catch accounting for skates so that catch/biomass can be monitored for individual species. This would enhance skate conservation without adding additional burden on industry. Proposed Specifications: The Team adopted the current OFLs and ABCs for BSAI groundfish as the Team’s recommendations for proposed specifications for both 2012 and 2013, as no new information was received. Team recommendations are attached to these minutes. Final harvest specifications will be based on the stock assessments in the SAFE Report. The Team noted its previous recommendation that stock assessments were optional for Tier 5 and Tier 6 stocks this year, as it is an “off” year for the AI survey. Typically assessments are not prepared for rockfishes and flatfishes in off years, and the Team expanded that to include sharks, skates, sculpins, and squid. Because of the new approach for estimating M for octopus, the Team anticipates a BSAI chapter for octopus in November. Adjournment: The Team adjourned at approximately 3:30 pm.
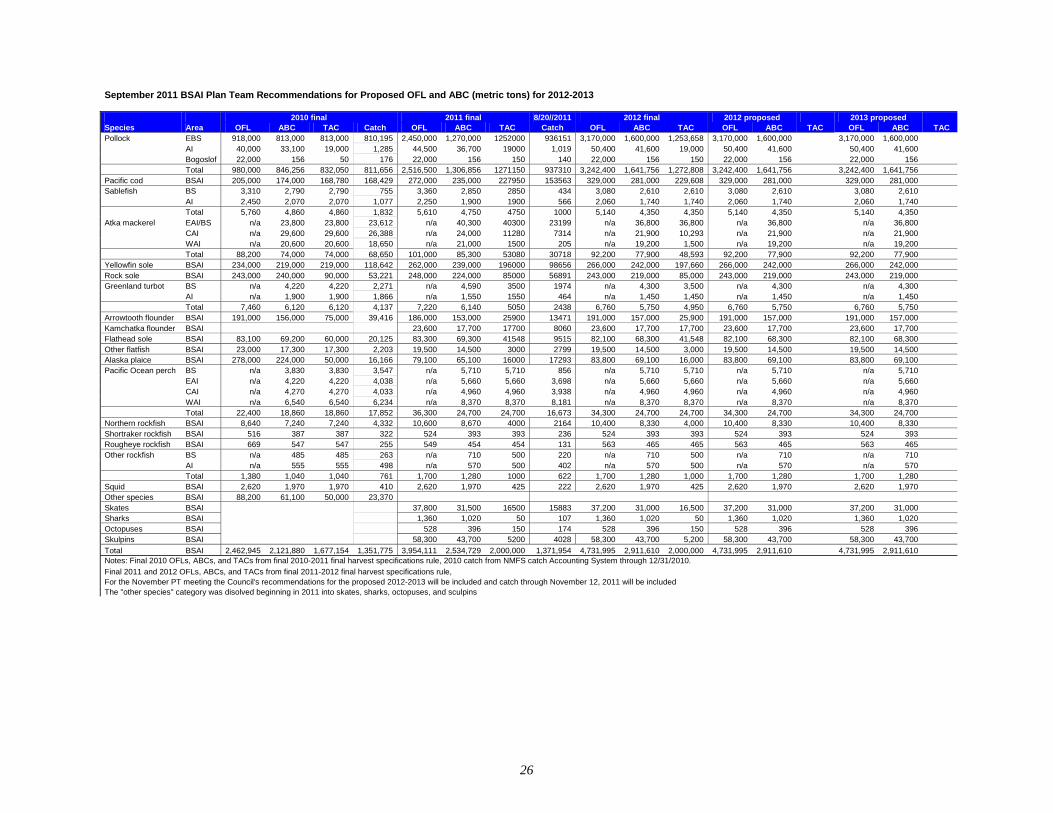
26
September 2011 BSAI Plan Team Recommendations for Proposed OFL and ABC (metric tons) for 2012-2013
2010 final 2011 final 8/20//2011 2012 final 2012 proposed 2013 proposed Species Area OFL ABC TAC Catch OFL ABC TAC Catch OFL ABC TAC OFL ABC TAC OFL ABC TAC Pollock EBS 918,000 813,000 813,000 810,195 2,450,000 1,270,000 1252000 936151 3,170,000 1,600,000 1,253,658 3,170,000 1,600,000 3,170,000 1,600,000 AI 40,000 33,100 19,000 1,285 44,500 36,700 19000 1,019 50,400 41,600 19,000 50,400 41,600 50,400 41,600 Bogoslof 22,000 156 50 176 22,000 156 150 140 22,000 156 150 22,000 156 22,000 156 Total 980,000 846,256 832,050 811,656 2,516,500 1,306,856 1271150 937310 3,242,400 1,641,756 1,272,808 3,242,400 1,641,756 3,242,400 1,641,756 Pacific cod BSAI 205,000 174,000 168,780 168,429 272,000 235,000 227950 153563 329,000 281,000 229,608 329,000 281,000 329,000 281,000 Sablefish BS 3,310 2,790 2,790 755 3,360 2,850 2850 434 3,080 2,610 2,610 3,080 2,610 3,080 2,610 AI 2,450 2,070 2,070 1,077 2,250 1,900 1900 566 2,060 1,740 1,740 2,060 1,740 2,060 1,740 Total 5,760 4,860 4,860 1,832 5,610 4,750 4750 1000 5,140 4,350 4,350 5,140 4,350 5,140 4,350 Atka mackerel EAI/BS n/a 23,800 23,800 23,612 n/a 40,300 40300 23199 n/a 36,800 36,800 n/a 36,800 n/a 36,800 CAI n/a 29,600 29,600 26,388 n/a 24,000 11280 7314 n/a 21,900 10,293 n/a 21,900 n/a 21,900 WAI n/a 20,600 20,600 18,650 n/a 21,000 1500 205 n/a 19,200 1,500 n/a 19,200 n/a 19,200 Total 88,200 74,000 74,000 68,650 101,000 85,300 53080 30718 92,200 77,900 48,593 92,200 77,900 92,200 77,900 Yellowfin sole BSAI 234,000 219,000 219,000 118,642 262,000 239,000 196000 98656 266,000 242,000 197,660 266,000 242,000 266,000 242,000 Rock sole BSAI 243,000 240,000 90,000 53,221 248,000 224,000 85000 56891 243,000 219,000 85,000 243,000 219,000 243,000 219,000Greenland turbot BS n/a 4,220 4,220 2,271 n/a 4,590 3500 1974 n/a 4,300 3,500 n/a 4,300 n/a 4,300 AI n/a 1,900 1,900 1,866 n/a 1,550 1550 464 n/a 1,450 1,450 n/a 1,450 n/a 1,450 Total 7,460 6,120 6,120 4,137 7,220 6,140 5050 2438 6,760 5,750 4,950 6,760 5,750 6,760 5,750 Arrowtooth flounder BSAI 191,000 156,000 75,000 39,416 186,000 153,000 25900 13471 191,000 157,000 25,900 191,000 157,000 191,000 157,000 Kamchatka flounder BSAI 23,600 17,700 17700 8060 23,600 17,700 17,700 23,600 17,700 23,600 17,700 Flathead sole BSAI 83,100 69,200 60,000 20,125 83,300 69,300 41548 9515 82,100 68,300 41,548 82,100 68,300 82,100 68,300 Other flatfish BSAI 23,000 17,300 17,300 2,203 19,500 14,500 3000 2799 19,500 14,500 3,000 19,500 14,500 19,500 14,500Alaska plaice BSAI 278,000 224,000 50,000 16,166 79,100 65,100 16000 17293 83,800 69,100 16,000 83,800 69,100 83,800 69,100 Pacific Ocean perch BS n/a 3,830 3,830 3,547 n/a 5,710 5,710 856 n/a 5,710 5,710 n/a 5,710 n/a 5,710 EAI n/a 4,220 4,220 4,038 n/a 5,660 5,660 3,698 n/a 5,660 5,660 n/a 5,660 n/a 5,660 CAI n/a 4,270 4,270 4,033 n/a 4,960 4,960 3,938 n/a 4,960 4,960 n/a 4,960 n/a 4,960 WAI n/a 6,540 6,540 6,234 n/a 8,370 8,370 8,181 n/a 8,370 8,370 n/a 8,370 n/a 8,370 Total 22,400 18,860 18,860 17,852 36,300 24,700 24,700 16,673 34,300 24,700 24,700 34,300 24,700 34,300 24,700 Northern rockfish BSAI 8,640 7,240 7,240 4,332 10,600 8,670 4000 2164 10,400 8,330 4,000 10,400 8,330 10,400 8,330 Shortraker rockfish BSAI 516 387 387 322 524 393 393 236 524 393 393 524 393 524 393 Rougheye rockfish BSAI 669 547 547 255 549 454 454 131 563 465 465 563 465 563 465 Other rockfish BS n/a 485 485 263 n/a 710 500 220 n/a 710 500 n/a 710 n/a 710 AI n/a 555 555 498 n/a 570 500 402 n/a 570 500 n/a 570 n/a 570 Total 1,380 1,040 1,040 761 1,700 1,280 1000 622 1,700 1,280 1,000 1,700 1,280 1,700 1,280 Squid BSAI 2,620 1,970 1,970 410 2,620 1,970 425 222 2,620 1,970 425 2,620 1,970 2,620 1,970 Other species BSAI 88,200 61,100 50,000 23,370 Skates BSAI 37,800 31,500 16500 15883 37,200 31,000 16,500 37,200 31,000 37,200 31,000 Sharks BSAI 1,360 1,020 50 107 1,360 1,020 50 1,360 1,020 1,360 1,020 Octopuses BSAI 528 396 150 174 528 396 150 528 396 528 396 Skulpins BSAI 58,300 43,700 5200 4028 58,300 43,700 5,200 58,300 43,700 58,300 43,700
Total BSAI 2,462,945 2,121,880 1,677,154 1,351,775 3,954,111 2,534,729 2,000,000 1,371,954 4,731,995 2,911,610 2,000,000 4,731,995 2,911,610 4,731,995 2,911,610 Notes: Final 2010 OFLs, ABCs, and TACs from final 2010-2011 final harvest specifications rule, 2010 catch from NMFS catch Accounting System through 12/31/2010. Final 2011 and 2012 OFLs, ABCs, and TACs from final 2011-2012 final harvest specifications rule, For the November PT meeting the Council's recommendations for the proposed 2012-2013 will be included and catch through November 12, 2011 will be included The "other species" category was disolved beginning in 2011 into skates, sharks, octopuses, and sculpins
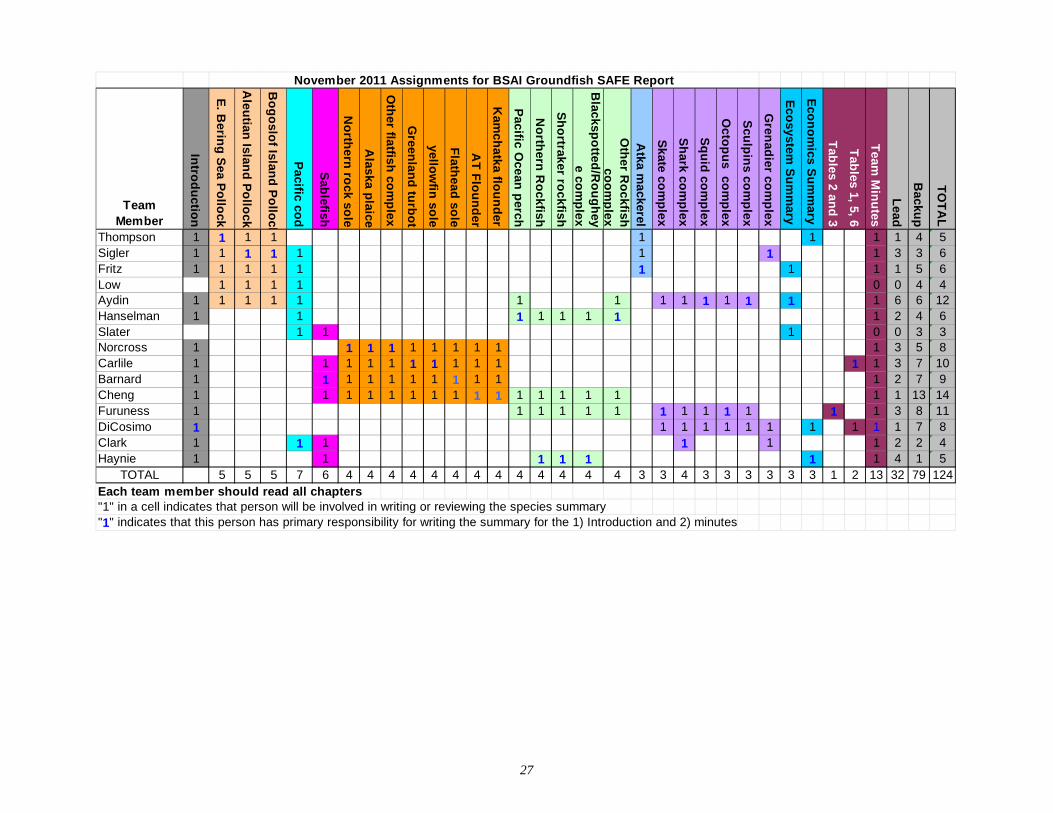
27
Team Member
Intro
du
ction
E. B
ering
Sea
Po
llock
Ale
utian
Island
Po
llock
Bo
go
slof Isla
nd
Po
lloc k
Pa
cific cod
Sab
lefish
No
rthe
rn ro
ck sole
Alas
ka plaice
Oth
er fla
tfish
com
ple
x
Green
lan
d tu
rbo
t
yello
wfin
sole
Flath
ead
sole
AT
Flo
un
der
Kam
ch
atka flo
un
de
r
Pac
ific Oce
an p
erch
No
rthern
Ro
ckfis
h
Sh
ortrak
er roc
kfish
Blac
kspo
tted/R
ou
gh
eye co
mp
lex
Oth
er R
oc
kfish
c
oo
mp
lex
Atka m
ackerel
Sk
ate com
ple
x
Sh
ark co
mp
lex
Sq
uid
com
ple
x
Octo
pu
s com
ple
x
Scu
lpin
s com
ple
x
Gren
adier co
mp
lex
Eco
system
Su
mm
ary
Eco
no
mics
Su
mm
ary
Tab
les 2 a
nd
3
Ta
bles 1, 5
, 6
Team
Min
utes
Lea
d
Ba
ckup
TO
TA
L
Thompson 1 1 1 1 1 1 1 1 4 5Sigler 1 1 1 1 1 1 1 1 3 3 6Fritz 1 1 1 1 1 1 1 1 1 5 6Low 1 1 1 1 0 0 4 4Aydin 1 1 1 1 1 1 1 1 1 1 1 1 1 1 6 6 12Hanselman 1 1 1 1 1 1 1 1 2 4 6Slater 1 1 1 0 0 3 3Norcross 1 1 1 1 1 1 1 1 1 1 3 5 8Carlile 1 1 1 1 1 1 1 1 1 1 1 1 3 7 10Barnard 1 1 1 1 1 1 1 1 1 1 1 2 7 9Cheng 1 1 1 1 1 1 1 1 1 1 1 1 1 1 1 1 1 13 14Furuness 1 1 1 1 1 1 1 1 1 1 1 1 1 3 8 11DiCosimo 1 1 1 1 1 1 1 1 1 1 1 7 8Clark 1 1 1 1 1 1 2 2 4Haynie 1 1 1 1 1 1 1 4 1 5
TOTAL 5 5 5 7 6 4 4 4 4 4 4 4 4 4 4 4 4 4 3 3 4 3 3 3 3 3 3 1 2 13 32 79 124Each team member should read all chapters "1" in a cell indicates that person will be involved in writing or reviewing the species summary"1" indicates that this person has primary responsibility for writing the summary for the 1) Introduction and 2) minutes
November 2011 Assignments for BSAI Groundfish SAFE Report

28
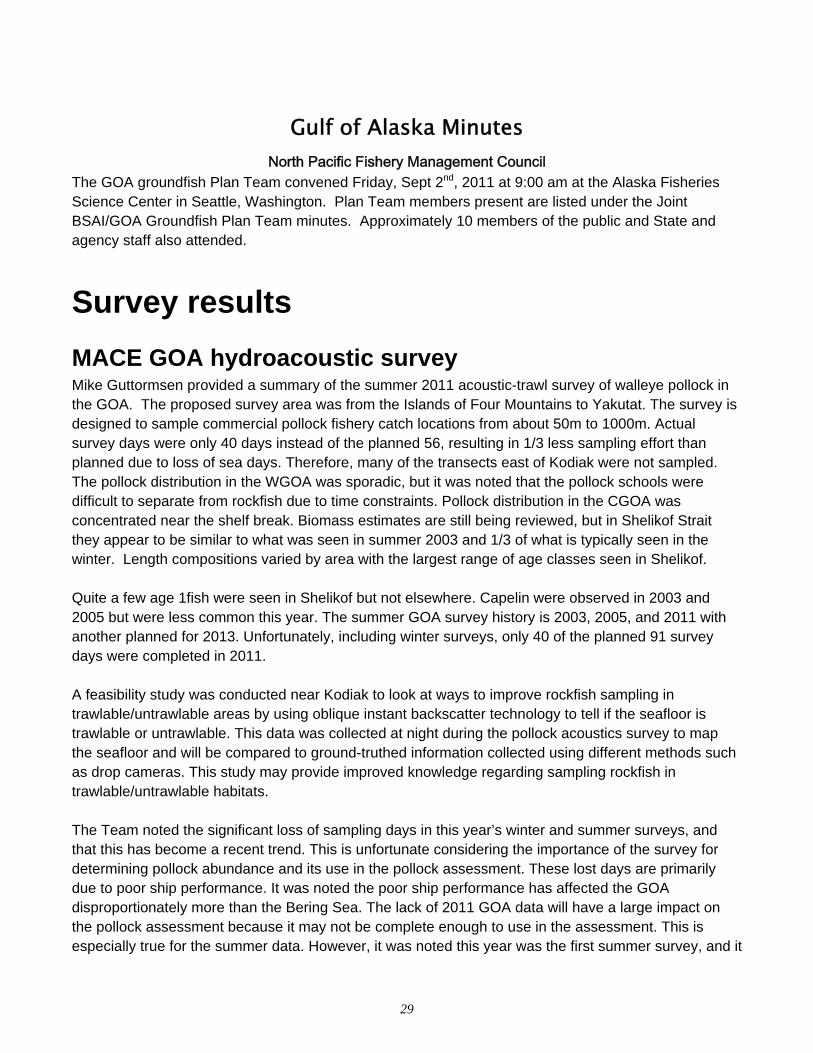
29
Gulf of Alaska Minutes North Pacific Fishery Management Council
The GOA groundfish Plan Team convened Friday, Sept 2nd, 2011 at 9:00 am at the Alaska Fisheries Science Center in Seattle, Washington. Plan Team members present are listed under the Joint BSAI/GOA Groundfish Plan Team minutes. Approximately 10 members of the public and State and agency staff also attended.
Survey results
MACE GOA hydroacoustic survey Mike Guttormsen provided a summary of the summer 2011 acoustic-trawl survey of walleye pollock in the GOA. The proposed survey area was from the Islands of Four Mountains to Yakutat. The survey is designed to sample commercial pollock fishery catch locations from about 50m to 1000m. Actual survey days were only 40 days instead of the planned 56, resulting in 1/3 less sampling effort than planned due to loss of sea days. Therefore, many of the transects east of Kodiak were not sampled. The pollock distribution in the WGOA was sporadic, but it was noted that the pollock schools were difficult to separate from rockfish due to time constraints. Pollock distribution in the CGOA was concentrated near the shelf break. Biomass estimates are still being reviewed, but in Shelikof Strait they appear to be similar to what was seen in summer 2003 and 1/3 of what is typically seen in the winter. Length compositions varied by area with the largest range of age classes seen in Shelikof. Quite a few age 1fish were seen in Shelikof but not elsewhere. Capelin were observed in 2003 and 2005 but were less common this year. The summer GOA survey history is 2003, 2005, and 2011 with another planned for 2013. Unfortunately, including winter surveys, only 40 of the planned 91 survey days were completed in 2011. A feasibility study was conducted near Kodiak to look at ways to improve rockfish sampling in trawlable/untrawlable areas by using oblique instant backscatter technology to tell if the seafloor is trawlable or untrawlable. This data was collected at night during the pollock acoustics survey to map the seafloor and will be compared to ground-truthed information collected using different methods such as drop cameras. This study may provide improved knowledge regarding sampling rockfish in trawlable/untrawlable habitats. The Team noted the significant loss of sampling days in this year’s winter and summer surveys, and that this has become a recent trend. This is unfortunate considering the importance of the survey for determining pollock abundance and its use in the pollock assessment. These lost days are primarily due to poor ship performance. It was noted the poor ship performance has affected the GOA disproportionately more than the Bering Sea. The lack of 2011 GOA data will have a large impact on the pollock assessment because it may not be complete enough to use in the assessment. This is especially true for the summer data. However, it was noted this year was the first summer survey, and it
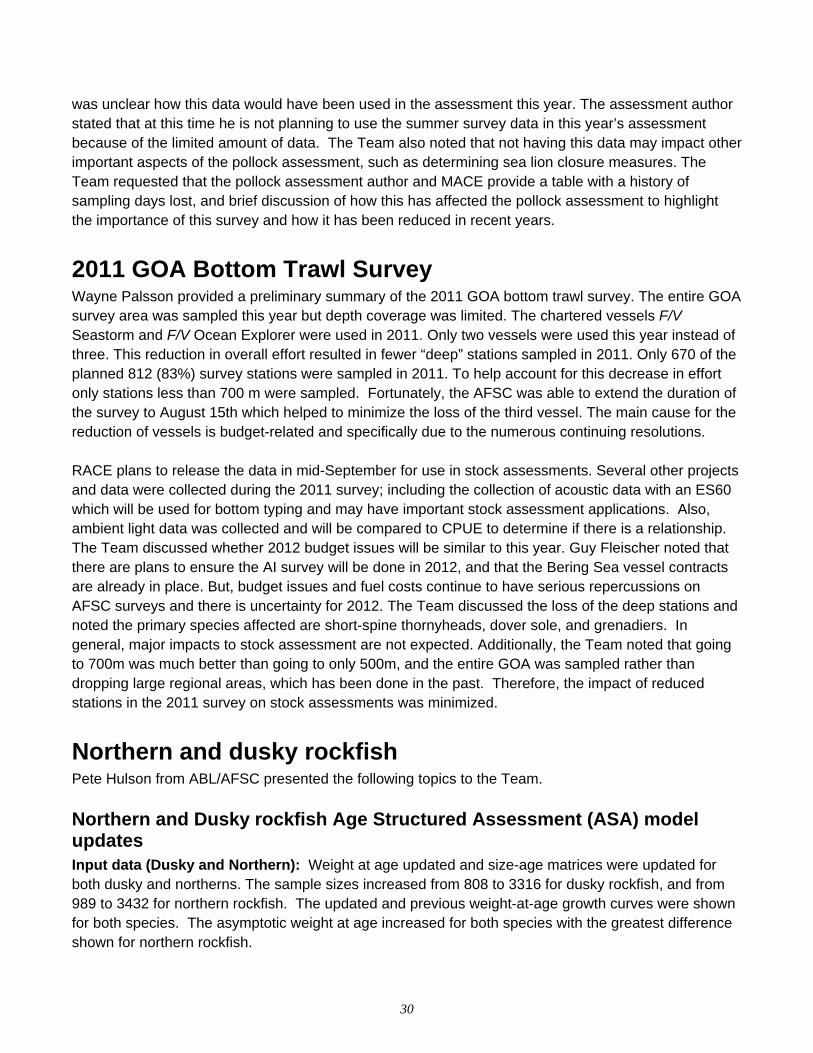
30
was unclear how this data would have been used in the assessment this year. The assessment author stated that at this time he is not planning to use the summer survey data in this year’s assessment because of the limited amount of data. The Team also noted that not having this data may impact other important aspects of the pollock assessment, such as determining sea lion closure measures. The Team requested that the pollock assessment author and MACE provide a table with a history of sampling days lost, and brief discussion of how this has affected the pollock assessment to highlight the importance of this survey and how it has been reduced in recent years.
2011 GOA Bottom Trawl Survey Wayne Palsson provided a preliminary summary of the 2011 GOA bottom trawl survey. The entire GOA survey area was sampled this year but depth coverage was limited. The chartered vessels F/V Seastorm and F/V Ocean Explorer were used in 2011. Only two vessels were used this year instead of three. This reduction in overall effort resulted in fewer “deep” stations sampled in 2011. Only 670 of the planned 812 (83%) survey stations were sampled in 2011. To help account for this decrease in effort only stations less than 700 m were sampled. Fortunately, the AFSC was able to extend the duration of the survey to August 15th which helped to minimize the loss of the third vessel. The main cause for the reduction of vessels is budget-related and specifically due to the numerous continuing resolutions. RACE plans to release the data in mid-September for use in stock assessments. Several other projects and data were collected during the 2011 survey; including the collection of acoustic data with an ES60 which will be used for bottom typing and may have important stock assessment applications. Also, ambient light data was collected and will be compared to CPUE to determine if there is a relationship. The Team discussed whether 2012 budget issues will be similar to this year. Guy Fleischer noted that there are plans to ensure the AI survey will be done in 2012, and that the Bering Sea vessel contracts are already in place. But, budget issues and fuel costs continue to have serious repercussions on AFSC surveys and there is uncertainty for 2012. The Team discussed the loss of the deep stations and noted the primary species affected are short-spine thornyheads, dover sole, and grenadiers. In general, major impacts to stock assessment are not expected. Additionally, the Team noted that going to 700m was much better than going to only 500m, and the entire GOA was sampled rather than dropping large regional areas, which has been done in the past. Therefore, the impact of reduced stations in the 2011 survey on stock assessments was minimized.
Northern and dusky rockfish Pete Hulson from ABL/AFSC presented the following topics to the Team.
Northern and Dusky rockfish Age Structured Assessment (ASA) model updates Input data (Dusky and Northern): Weight at age updated and size-age matrices were updated for both dusky and northerns. The sample sizes increased from 808 to 3316 for dusky rockfish, and from 989 to 3432 for northern rockfish. The updated and previous weight-at-age growth curves were shown for both species. The asymptotic weight at age increased for both species with the greatest difference shown for northern rockfish.
31
Selectivity Functions (Dusky only): The Pacific ocean perch and northern rockfish assessments have logistic selectivity functions. The dusky rockfish assessment estimates selectivity parameters by age. Pete compared the estimation of parameters by age to logistic selectivity. He used the Deviance Information Criterion (DIC) and Akaike Information Critierion (AIC) for comparison. DIC/AIC favored the logistic function. He found that uncertainty in total biomass was reduced with the logistic function (~5% reduction in CV in total biomass in last year of model). Recommendation to use logistic function for both survey and fishery selectivity.
Age composition plus age group analysis (Northern rockfish only) The northern rockfish assessment previously fit up to age 23+ for the plus age group. The plus age group was extended out to 50+. Pete examined model performance with a comparison of objective function values over increasing age plus groups. A minimum was reached at age 31+. He also looked at uncertainty in model predictions associated with extending the age plus group out to 31+. Extending the plus age group out to 31+ resulted in the best fit to data compared to ages 21-50 and reduced the uncertainty in model predictions. Recommendation to extend the plus age group to 31+ for northern rockfish.
Maturity schedule updates (Dusky and Northern) Two issues: 1) incorporation of new maturity information from Chilton et al. (2007, 2009) maturity study to supplement Lunsford et al. (1997) study, and 2) incorporation of uncertainty in maturity parameters into model predictions and management reference points. The 2 studies collected samples close in time (Lunsford: 1996, Chilton: 2000-2001) relative to the time series modeled (dusky 1977-present, and northern 1961-present). Both studies are valid and there is no rationale to use results of one study over the other. Pete developed an intermediate maturity curve with combined data for each species. He compared fits to the intermediate curve and observations for each species. There was a reasonably good fit to both datasets. The largest difference was noted for northern rockfish. Recommendation to use intermediate curve for both species. Pete looked at incorporation of maturity parameter uncertainty for dusky and northern for 2 cases: independent (fit outside of model, current methodology) and dependent (fit inside model with other fitted data). The dependent method allows for uncertainty in maturity parameters to be incorporated in ABC and other management quantities. The maturity parameters are identical with the independent and dependent method. Thus, ABC estimates, etc. are the same. However, the dependent method resulted in a small increase in uncertainty when taking into account maturity parameter uncertainty. Recommendation to fit maturity parameters dependently to account for uncertainty. Paul Spencer asked if each dataset was fit separately and then all data combined were fit to get intermediate curve for each species? Yes. Questions about maturity data and the 2 studies. Issues are sample sizes, and spatial and temporal differences in sample collection. Would like to get more and updated maturity data.
32
The Team supported the use of the intermediate maturity curve for each species and fitting the maturity parameters dependently to account for uncertainty in maturity parameters for both dusky and northern rockfish. Pete provided the following general future recommendations for GOA rockfish:
All rockfish: update weight-at-age and size-age matrices Rougheye/blackspotted: update age bins and incorporate logistic selectivity Conduct a length composition analysis Implementation of length-based models (SS3): James Murphy will be working on this for shortspine
thornyheads
Christina Conrath currently working on rockfish maturity. It was noted that the Observer Program has stopped collecting maturity data and is reluctant to take on maturity projects as they are labor intensive. The Plan Team strongly recommended that maturity collections be taken. These data are important for stock assessments and allow for the estimation of critical stock assessment parameters and management quantities. Maturity information is a research priority for stock assessment. The Plan Team also recommended looking into the issue of whether to incorporate length composition data if age composition data is unavailable, and then replacing with age composition data when it becomes available. Paul Spencer noted that his estimate of 50% maturity for Aleutian Islands northern rockfish is similar to Pete’s result.
Rockfish PSA No presentation occurred on Rockfish PSA.
Stock structure template
Dusky rockfish stock structure template Chris Lunsford presented an analysis of dusky rockfish stock structure based on the template developed by Paul Spencer. Following the template discussion, four aspects of dusky rockfish were addressed 1) harvest and trends, 2) barriers and phenotypic characters, 3) behavior and movement, and 4) genetics. Not much known about dusky rockfish relative to other species of targeted rockfish. Dusky rockfish are patchily distributed and highly aggregated. Fishery catches generally correspond to survey distribution. Little is known about YOY, larvae distribution and juveniles. Eastern GOA growth data compared to other areas showed that EGOA dusky rockfish reach a smaller maximum size, but this may be due to small sample sizes at young? ages. Central and Western GOA dusky rockfish generally have similar growth characteristics. There is no information available on regional differences in maturity. Morphometrics indicate some slight variations among areas. No information available on
33
spawning site fidelity. There are no recapture or natural tagging studies or genetics studies for dusky rockfish. Past studies indicate that localized depletion occurs within a fishing season but local populations seem to recovery relatively quickly. Authors continue to recommend status quo spatial management. The Plan Team suggested a more in depth look at harvest and abundance trends by geographic area and time especially in relationship to the rockfish fish pilot program in the central Gulf. Additionally, a statistical analysis of regional age and growth differences and a genetic study on dusky rockfish would be useful. The Team concurred that the results presented do not indicate that any changes are needed to the spatial management of dusky rockfish at this time.
Revised rockfish categories Chris Lunsford presented a discussion paper outlining a plan for reorganizing the Pelagic Shelf Rockfish (PSR) complex. The proposed plan is to establish a separate chapter for dusky rockfish and combine the remaining PSR species (widow and yellowtail) into an ‘other rockfish’ category. Widow and yellowtail are very different biologically from dusky rockfish and thus combined management of these species in a complex is not scientifically justifiable. Widow and yellowtail comprise a small component of the ABC, are not targeted by industry, thus the economic impact of recombining them into the other rockfish category is not anticipated to have any economic impacts. This change could be done in conjunction with the specifications for 2012/13. A housekeeping amendment would be needed to remove the complex name PSR from the FMP and to modify the name of the ‘other slope rockfish’ category to ‘other rockfish’. These changes would result in a slightly higher quota for the combined other rockfish category. The Team discussed the concern that the other rockfish complex is also biologically dissimilar. While moving dusky rockfish into its own target category is advisable at this time, further examination should be done of the species in the other rockfish category. The Team recommends that this type of PSA for the species in the other rockfish complex be completed for next September. This would include an examination of catch in relation to the ABC and an overview of known biological information such as habitat differences, life-history characteristics, maturity etc. Julie Bonney expressed concern regarding management implications of establishing smaller ‘boxes’ for management should the Team recommend breaking other rockfish species out of the other rockfish complex in the future.
Proposed specs The Team recommends the attached specifications for the proposed specifications for 2012-2013. The Team discussed consideration of a GOA-wide OFL for POP but recommended this be examined after the application of the stock structure template for POP. The preliminary ABC/OFL specifications recommend shifting widow and yellowtail rockfish from the “pelagic shelf rockfish” category into “other slope” (which should be renamed “Other rockfish.” Likewise, the PSR category will now comprise only dusky rockfish and should be renamed.
34
The Team notes that shortraker was (inadvertently?) omitted from the FSSI listings (to Congress). Since this stock is important, the Team noted that it should be included in future reports.
GOA membership The Team greatly appreciates the contributions of Sarah Gaichas and Bob Foy for their years of participation and membership on the GOA Plan Team. They will both be sorely missed. Due to a variety of circumstances the GOA Team is losing 4 Team members for the November 2011 meeting. The Team would like to replace these members as soon as possible, ideally in time for participation at the November meeting, particularly in a survey year. Two of the members are permanently leaving the Team while two others have not participated in recent years. The Team discussed the necessity that new nominees (e.g. University, IPHC, and ADF&G) should be prepared to firmly commit to 2 annual meetings and full participation thru COB Friday of meeting week. The Team recommended that additional membership be solicited from the Observer Program and RACE. Ideally these nominees could be put forward to the SSC in October and thus approved for participation in November. The Team requested that Diana follow up with relevant AFSC staff to solicit these nominations in the next several weeks.
GOA Halibut PSC discussion Due to the timing of the availability of the GOA halibut PSC analysis, the Team was not able to provide any comments to the Council on this issue. The Team would like to review the analysis in November prior to action by the Council and provide comments to the Council per the Council’s request. The Team would also like to see alternatives developed which evaluate biomass-based caps for halibut in a future analysis. The Team recommends that the effects on groundfish fleets of modifying these caps be analyzed. The analysis should also evaluate alternative mechanisms for management flexibility across sectors in managing the caps.
Notes on GOA Pacific cod The Team looks forward to receiving the updated stock synthesis application based on analyses done for the BSAI Pacific cod assessment (and recommended in the Joint Team discussions). Should the SSC consider the newly developed Aleutian Islands Kalman filter approach be appropriate for that region, then the GOA Team agrees with the SSC in that it might be useful for contrast in the GOA region (but only if the computation and work is simple and requires little extra work). This may prove useful simply to compare model results.
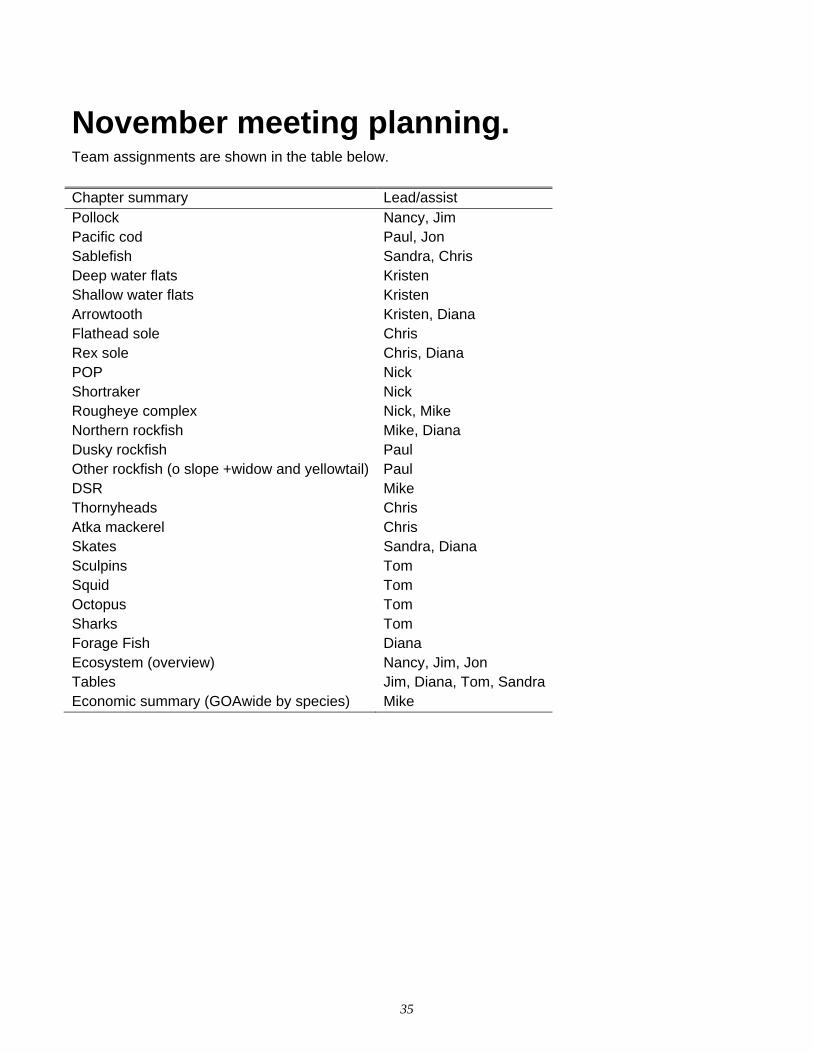
35
November meeting planning. Team assignments are shown in the table below.
Chapter summary Lead/assist Pollock Nancy, Jim Pacific cod Paul, Jon Sablefish Sandra, Chris Deep water flats Kristen Shallow water flats Kristen Arrowtooth Kristen, Diana Flathead sole Chris Rex sole Chris, Diana POP Nick Shortraker Nick Rougheye complex Nick, Mike Northern rockfish Mike, Diana Dusky rockfish Paul Other rockfish (o slope +widow and yellowtail) Paul DSR Mike Thornyheads Chris Atka mackerel Chris Skates Sandra, Diana Sculpins Tom Squid Tom Octopus Tom Sharks Tom Forage Fish Diana Ecosystem (overview) Nancy, Jim, Jon Tables Jim, Diana, Tom, SandraEconomic summary (GOAwide by species) Mike
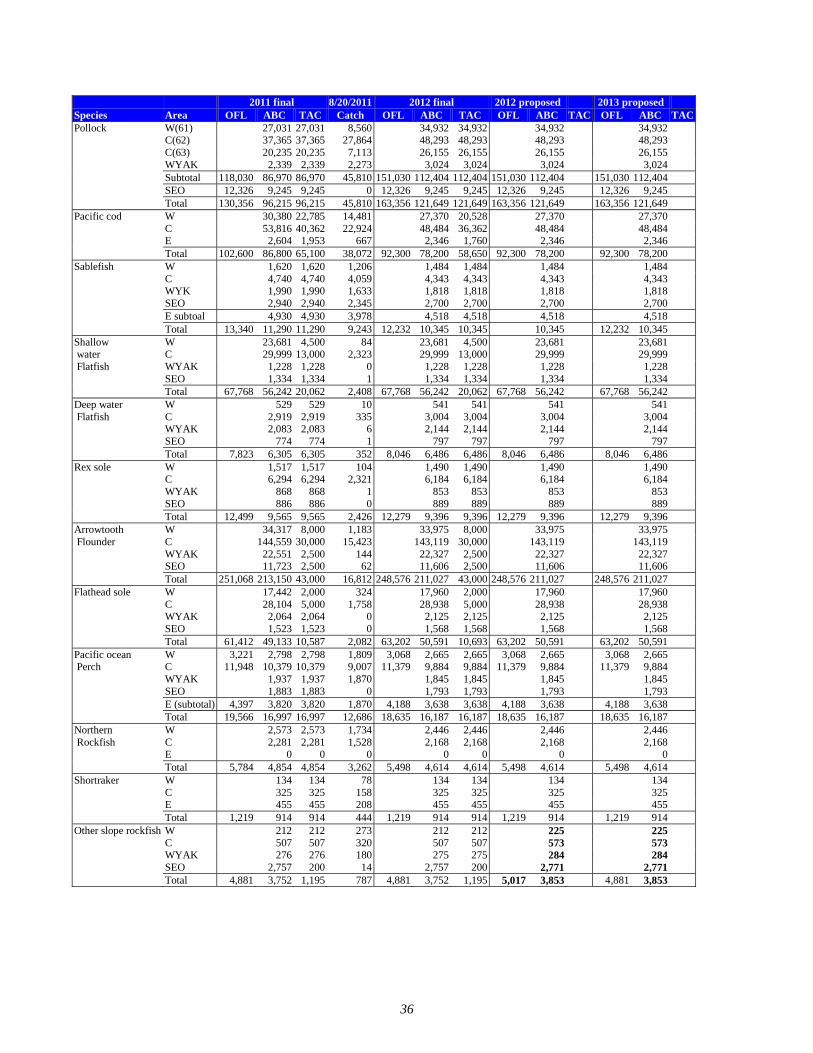
36
2011 final 8/20/2011 2012 final 2012 proposed 2013 proposed Species Area OFL ABC TAC Catch OFL ABC TAC OFL ABC TAC OFL ABC TACPollock W(61) 27,031 27,031 8,560 34,932 34,932 34,932 34,932 C(62) 37,365 37,365 27,864 48,293 48,293 48,293 48,293 C(63) 20,235 20,235 7,113 26,155 26,155 26,155 26,155 WYAK 2,339 2,339 2,273 3,024 3,024 3,024 3,024 Subtotal 118,030 86,970 86,970 45,810 151,030 112,404 112,404 151,030 112,404 151,030 112,404 SEO 12,326 9,245 9,245 0 12,326 9,245 9,245 12,326 9,245 12,326 9,245 Total 130,356 96,215 96,215 45,810 163,356 121,649 121,649 163,356 121,649 163,356 121,649 Pacific cod W 30,380 22,785 14,481 27,370 20,528 27,370 27,370 C 53,816 40,362 22,924 48,484 36,362 48,484 48,484 E 2,604 1,953 667 2,346 1,760 2,346 2,346 Total 102,600 86,800 65,100 38,072 92,300 78,200 58,650 92,300 78,200 92,300 78,200 Sablefish W 1,620 1,620 1,206 1,484 1,484 1,484 1,484 C 4,740 4,740 4,059 4,343 4,343 4,343 4,343 WYK 1,990 1,990 1,633 1,818 1,818 1,818 1,818 SEO 2,940 2,940 2,345 2,700 2,700 2,700 2,700 E subtoal 4,930 4,930 3,978 4,518 4,518 4,518 4,518 Total 13,340 11,290 11,290 9,243 12,232 10,345 10,345 10,345 12,232 10,345Shallow W 23,681 4,500 84 23,681 4,500 23,681 23,681 water C 29,999 13,000 2,323 29,999 13,000 29,999 29,999 Flatfish WYAK 1,228 1,228 0 1,228 1,228 1,228 1,228 SEO 1,334 1,334 1 1,334 1,334 1,334 1,334 Total 67,768 56,242 20,062 2,408 67,768 56,242 20,062 67,768 56,242 67,768 56,242 Deep water W 529 529 10 541 541 541 541 Flatfish C 2,919 2,919 335 3,004 3,004 3,004 3,004 WYAK 2,083 2,083 6 2,144 2,144 2,144 2,144 SEO 774 774 1 797 797 797 797 Total 7,823 6,305 6,305 352 8,046 6,486 6,486 8,046 6,486 8,046 6,486 Rex sole W 1,517 1,517 104 1,490 1,490 1,490 1,490 C 6,294 6,294 2,321 6,184 6,184 6,184 6,184 WYAK 868 868 1 853 853 853 853 SEO 886 886 0 889 889 889 889 Total 12,499 9,565 9,565 2,426 12,279 9,396 9,396 12,279 9,396 12,279 9,396 Arrowtooth W 34,317 8,000 1,183 33,975 8,000 33,975 33,975 Flounder C 144,559 30,000 15,423 143,119 30,000 143,119 143,119 WYAK 22,551 2,500 144 22,327 2,500 22,327 22,327 SEO 11,723 2,500 62 11,606 2,500 11,606 11,606 Total 251,068 213,150 43,000 16,812 248,576 211,027 43,000 248,576 211,027 248,576 211,027 Flathead sole W 17,442 2,000 324 17,960 2,000 17,960 17,960 C 28,104 5,000 1,758 28,938 5,000 28,938 28,938 WYAK 2,064 2,064 0 2,125 2,125 2,125 2,125 SEO 1,523 1,523 0 1,568 1,568 1,568 1,568 Total 61,412 49,133 10,587 2,082 63,202 50,591 10,693 63,202 50,591 63,202 50,591 Pacific ocean W 3,221 2,798 2,798 1,809 3,068 2,665 2,665 3,068 2,665 3,068 2,665 Perch C 11,948 10,379 10,379 9,007 11,379 9,884 9,884 11,379 9,884 11,379 9,884 WYAK 1,937 1,937 1,870 1,845 1,845 1,845 1,845 SEO 1,883 1,883 0 1,793 1,793 1,793 1,793 E (subtotal) 4,397 3,820 3,820 1,870 4,188 3,638 3,638 4,188 3,638 4,188 3,638 Total 19,566 16,997 16,997 12,686 18,635 16,187 16,187 18,635 16,187 18,635 16,187 Northern W 2,573 2,573 1,734 2,446 2,446 2,446 2,446 Rockfish C 2,281 2,281 1,528 2,168 2,168 2,168 2,168 E 0 0 0 0 0 0 0 Total 5,784 4,854 4,854 3,262 5,498 4,614 4,614 5,498 4,614 5,498 4,614 Shortraker W 134 134 78 134 134 134 134 C 325 325 158 325 325 325 325 E 455 455 208 455 455 455 455 Total 1,219 914 914 444 1,219 914 914 1,219 914 1,219 914 Other slope rockfish W 212 212 273 212 212 225 225 C 507 507 320 507 507 573 573 WYAK 276 276 180 275 275 284 284 SEO 2,757 200 14 2,757 200 2,771 2,771 Total 4,881 3,752 1,195 787 4,881 3,752 1,195 5,017 3,853 4,881 3,853
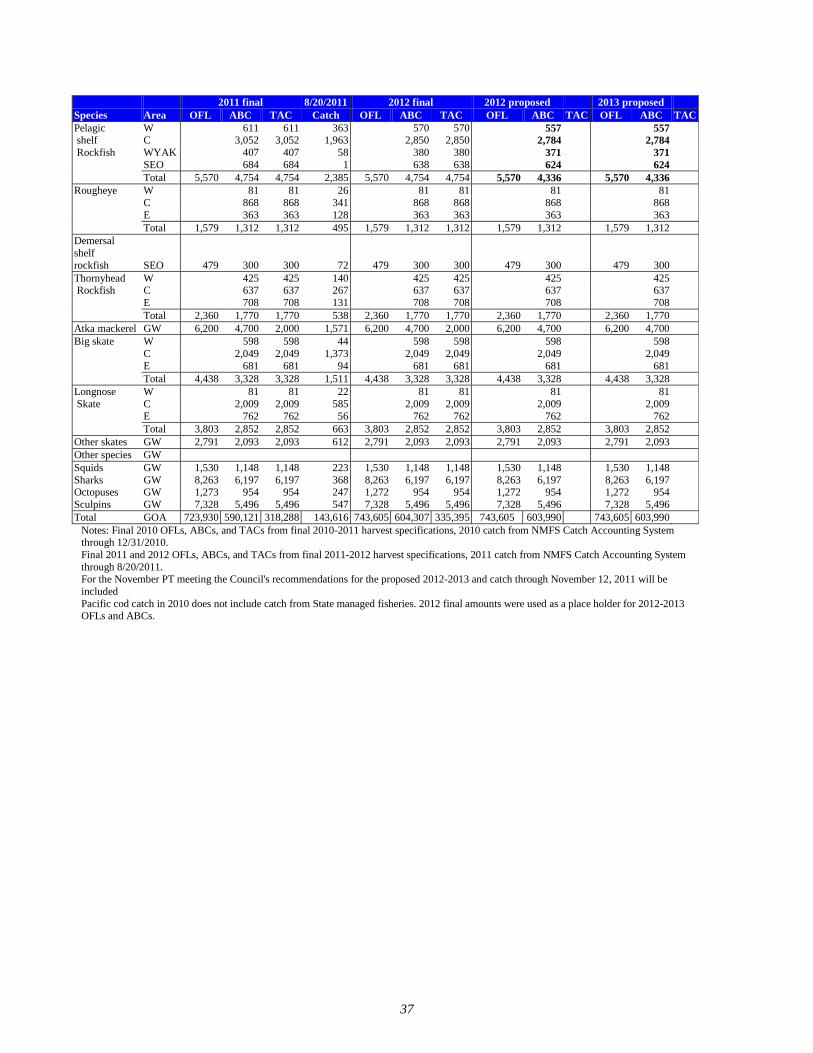
37
2011 final 8/20/2011 2012 final 2012 proposed 2013 proposed Species Area OFL ABC TAC Catch OFL ABC TAC OFL ABC TAC OFL ABC TACPelagic W 611 611 363 570 570 557 557 shelf C 3,052 3,052 1,963 2,850 2,850 2,784 2,784 Rockfish WYAK 407 407 58 380 380 371 371 SEO 684 684 1 638 638 624 624 Total 5,570 4,754 4,754 2,385 5,570 4,754 4,754 5,570 4,336 5,570 4,336 Rougheye W 81 81 26 81 81 81 81 C 868 868 341 868 868 868 868 E 363 363 128 363 363 363 363 Total 1,579 1,312 1,312 495 1,579 1,312 1,312 1,579 1,312 1,579 1,312 Demersal shelf rockfish SEO 479 300 300 72 479 300 300 479 300 479 300 Thornyhead W 425 425 140 425 425 425 425 Rockfish C 637 637 267 637 637 637 637 E 708 708 131 708 708 708 708 Total 2,360 1,770 1,770 538 2,360 1,770 1,770 2,360 1,770 2,360 1,770 Atka mackerel GW 6,200 4,700 2,000 1,571 6,200 4,700 2,000 6,200 4,700 6,200 4,700 Big skate W 598 598 44 598 598 598 598 C 2,049 2,049 1,373 2,049 2,049 2,049 2,049 E 681 681 94 681 681 681 681 Total 4,438 3,328 3,328 1,511 4,438 3,328 3,328 4,438 3,328 4,438 3,328 Longnose W 81 81 22 81 81 81 81 Skate C 2,009 2,009 585 2,009 2,009 2,009 2,009 E 762 762 56 762 762 762 762 Total 3,803 2,852 2,852 663 3,803 2,852 2,852 3,803 2,852 3,803 2,852 Other skates GW 2,791 2,093 2,093 612 2,791 2,093 2,093 2,791 2,093 2,791 2,093 Other species GW Squids GW 1,530 1,148 1,148 223 1,530 1,148 1,148 1,530 1,148 1,530 1,148 Sharks GW 8,263 6,197 6,197 368 8,263 6,197 6,197 8,263 6,197 8,263 6,197 Octopuses GW 1,273 954 954 247 1,272 954 954 1,272 954 1,272 954 Sculpins GW 7,328 5,496 5,496 547 7,328 5,496 5,496 7,328 5,496 7,328 5,496 Total GOA 723,930 590,121 318,288 143,616 743,605 604,307 335,395 743,605 603,990 743,605 603,990
Notes: Final 2010 OFLs, ABCs, and TACs from final 2010-2011 harvest specifications, 2010 catch from NMFS Catch Accounting System through 12/31/2010. Final 2011 and 2012 OFLs, ABCs, and TACs from final 2011-2012 harvest specifications, 2011 catch from NMFS Catch Accounting System through 8/20/2011. For the November PT meeting the Council's recommendations for the proposed 2012-2013 and catch through November 12, 2011 will be included Pacific cod catch in 2010 does not include catch from State managed fisheries. 2012 final amounts were used as a place holder for 2012-2013 OFLs and ABCs.