minutes of the federal open market committee march … · minutes of the federal open market...
TRANSCRIPT
Minutes of the Federal Open Market Committee March 20–21, 2018
A joint meeting of the Federal Open Market Committee and the Board of Governors was held in the offices of the Board of Governors of the Federal Reserve System in Washington, D.C., on Tuesday, March 20, 2018, at 1:00 p.m. and continued on Wednesday, March 21, 2018, at 9:00 a.m.1
PRESENT: Jerome H. Powell, Chairman William C. Dudley, Vice Chairman Thomas I. Barkin Raphael W. Bostic Lael Brainard Loretta J. Mester Randal K. Quarles John C. Williams
James Bullard, Charles L. Evans, Esther L. George,
Eric Rosengren, and Michael Strine,2 Alternate Members of the Federal Open Market Committee
Patrick Harker, Robert S. Kaplan, and Neel Kashkari,
Presidents of the Federal Reserve Banks of Philadelphia, Dallas, and Minneapolis, respectively
James A. Clouse, Secretary Matthew M. Luecke, Deputy Secretary David W. Skidmore, Assistant Secretary Michelle A. Smith, Assistant Secretary Mark E. Van Der Weide, General Counsel Michael Held, Deputy General Counsel Thomas Laubach, Economist David W. Wilcox, Economist David Altig, Kartik B. Athreya, Thomas A. Connors,
Trevor A. Reeve, Ellis W. Tallman, and William Wascher, Associate Economists
Simon Potter, Manager, System Open Market Account Lorie K. Logan, Deputy Manager, System Open
Market Account
1 The Federal Open Market Committee is referenced as the “FOMC” and the “Committee” in these minutes. 2 Attended Tuesday session only.
Ann E. Misback, Secretary, Office of the Secretary, Board of Governors
Matthew J. Eichner,3 Director, Division of Reserve
Bank Operations and Payment Systems, Board of Governors; Michael S. Gibson, Director, Division of Supervision and Regulation, Board of Governors; Andreas Lehnert, Director, Division of Financial Stability, Board of Governors
Rochelle M. Edge, Deputy Director, Division of
Monetary Affairs, Board of Governors; Michael T. Kiley, Deputy Director, Division of Financial Stability, Board of Governors
Antulio N. Bomfim, Special Adviser to the Chairman,
Office of Board Members, Board of Governors Joseph W. Gruber and John M. Roberts,2 Special
Advisers to the Board, Office of Board Members, Board of Governors
Linda Robertson, Assistant to the Board, Office of
Board Members, Board of Governors Shaghil Ahmed, Brian M. Doyle, and Christopher J.
Erceg, Senior Associate Directors, Division of International Finance, Board of Governors; Eric M. Engen and Diana Hancock, Senior Associate Directors, Division of Research and Statistics, Board of Governors
Ellen E. Meade, Stephen A. Meyer, Edward Nelson,
and Robert J. Tetlow, Senior Advisers, Division of Monetary Affairs, Board of Governors
Stacey Tevlin, Associate Director, Division of Research
and Statistics, Board of Governors Glenn Follette and Karen M. Pence,2 Assistant
Directors, Division of Research and Statistics, Board of Governors
3 Attended through the discussion of developments in finan-cial markets and open market operations.
Page 1_____________________________________________________________________________________________
Eric C. Engstrom, Adviser, Division of Monetary Affairs, and Adviser, Division of Research and Statistics, Board of Governors
Penelope A. Beattie,2 Assistant to the Secretary, Office
of the Secretary, Board of Governors Etienne Gagnon, Section Chief, Division of Monetary
Affairs, Board of Governors David H. Small, Project Manager, Division of
Monetary Affairs, Board of Governors Kurt F. Lewis, Principal Economist, Division of
Monetary Affairs, Board of Governors Anna Orlik, Senior Economist, Division of Monetary
Affairs, Board of Governors Valerie Hinojosa, Information Manager, Division of
Monetary Affairs, Board of Governors Meredith Black, First Vice President, Federal Reserve
Bank of Dallas Michael Dotsey, Glenn D. Rudebusch, and Daniel G.
Sullivan, Executive Vice Presidents, Federal Reserve Banks of Philadelphia, San Francisco, and Chicago, respectively
Marc Giannoni, Luke Woodward, and Mark L.J.
Wright, Senior Vice Presidents, Federal Reserve Banks of Dallas, Kansas City, and Minneapolis, respectively
David Andolfatto, Jonathan P. McCarthy, Giovanni
Olivei, and Jonathan L. Willis, Vice Presidents, Federal Reserve Banks of St. Louis, New York, Boston, and Kansas City, respectively
Developments in Financial Markets and Open Mar-ket Operations The deputy manager of the System Open Market Ac-count (SOMA) provided a summary of developments in domestic and global financial markets over the inter-meeting period; she also reported on open market oper-ations and related issues. Financial markets experienced a notable bout of volatility early in the intermeeting pe-riod; volatility was particularly pronounced in equity markets. Market participants pointed to incoming eco-nomic data released in early February—particularly data on average hourly earnings—as raising concerns about
the prospects for higher inflation and higher interest rates. These concerns reportedly contributed to a steep decline in equity prices and an associated rise in measures of volatility. Some reports suggested that the increase in volatility was amplified by the unwinding of trading positions based on various types of volatility trading strategies. Measures of equity market volatility declined over subsequent weeks but remained above lev-els that prevailed earlier in the year, and stock prices fin-ished lower, on net, over the intermeeting period. Inter-est rates rose modestly over the period. Respondents to the Open Market Desk’s surveys of primary dealers and market participants suggested that revisions in investors’ views regarding the fiscal outlook were an important fac-tor boosting yields and contributing to a slightly steeper expected trajectory of the federal funds rate. The deputy manager noted that a rapid and sizable increase in Treas-ury bill issuance over recent weeks had put upward pres-sure on money market yields over the period. Three-month Treasury bill yields moved up significantly and those increases passed through to rates on other short-term instruments such as three-month Eurodollar de-posits and commercial paper. The spread of market rates on overnight repurchase agreements over the of-fering rate at the Federal Reserve’s overnight reverse re-purchase (ON RRP) facility widened, and take-up at the facility fell to quite low levels as a result. Rates on over-night federal funds and Eurodollar transactions edged higher relative to the interest rate on excess reserves. The Desk continued to execute the FOMC’s balance sheet normalization plan initiated in October of last year.
By unanimous vote, the Committee ratified the Open Market Desk’s domestic transactions over the intermeeting period. There were no intervention operations in foreign currencies for the System’s account during the intermeeting period.
Staff Review of the Economic Situation The information reviewed for the March 20–21 meeting indicated that labor market conditions continued to strengthen through February and suggested that real gross domestic product (GDP) was rising at a moderate pace in the first quarter. Consumer price inflation, as measured by the 12-month percentage change in the price index for personal consumption expenditures (PCE), remained below 2 percent in January. Survey-based measures of longer-run inflation expecta-tions were little changed on balance.
Gains in total nonfarm payroll employment were strong over the two months ending in February. The labor force participation rate held steady in January and then stepped up markedly in February, with the participation
Page 2 Federal Open Market Committee_____________________________________________________________________________________________
rates for prime-age (defined as ages 25 to 54) women and men moving up on net. The national unemployment rate remained at 4.1 percent. Similarly, the unemploy-ment rates for African Americans, Asians, and Hispanics were roughly flat, on balance, in recent months. The share of workers employed part time for economic rea-sons edged up but remained close to its pre-recession levels. The rates of private-sector job openings and quits increased slightly, on net, over the two months ending in January, and the four-week moving average of initial claims for unemployment insurance benefits continued to be low in early March. Recent readings showed that increases in labor compensation remained modest. Compensation per hour in the nonfarm business sector advanced 2¾ percent over the four quarters of last year, and average hourly earnings for all employees rose 2½ percent over the 12 months ending in February.
Total industrial production expanded, on net, in January and February, with gains in both manufacturing and mining. Automakers’ schedules indicated that assem-blies of light motor vehicles would likely edge down in coming months. However, broader indicators of manu-facturing production, such as the new orders indexes from national and regional manufacturing surveys, pointed to further solid increases in factory output in the near term.
Consumer expenditures appeared likely to rise at a mod-est pace in the first quarter following a strong gain in the preceding quarter. Real PCE edged down in January, and the components of the nominal retail sales data used by the Bureau of Economic Analysis to construct its es-timate of PCE rose somewhat in February while the pace of light motor vehicle sales declined slightly. However, household spending was probably held back somewhat in February because of a delay in many federal tax re-funds, and the subsequent delivery of those refunds would likely contribute to an increase in consumer spending in March. Moreover, the lower tax withhold-ing resulting from the tax cuts enacted late last year, which was beginning to show through in consumers’ paychecks, would likely provide some impetus to spend-ing in coming months. More broadly, recent readings on key factors that influence consumer spending—in-cluding gains in employment and real disposable per-sonal income, along with households’ elevated net worth—continued to be supportive of solid real PCE growth in the near term. In addition, consumer senti-ment in early March, as measured by the University of Michigan Surveys of Consumers, was at its highest level since 2004.
Real residential investment looked to be slowing in the first quarter after rising briskly in the fourth quarter. Starts of new single-family homes increased in January and February, although building permit issuance moved down somewhat. Starts of multifamily units jumped in January but fell back in February. Sales of both new and existing homes declined in January.
Growth in real private expenditures for business equip-ment and intellectual property appeared to be moderat-ing in the first quarter after increasing at a solid pace in the preceding quarter. Nominal shipments of nonde-fense capital goods excluding aircraft edged down in Jan-uary. However, recent forward-looking indicators of business equipment spending—such as the backlog of unfilled capital goods orders, along with upbeat readings on business sentiment from national and regional sur-veys—pointed to further solid gains in equipment spending in the near term. Firms’ nominal spending for nonresidential structures outside of the drilling and min-ing sector declined in January. In contrast, the number of crude oil and natural gas rigs in operation—an indica-tor of business spending for structures in the drilling and mining sector—continued to move up through mid-March.
Total real government purchases seemed to be flattening out, on balance, in the first quarter after rising solidly in the fourth quarter. Nominal defense spending in Janu-ary and February was consistent with a decline in real federal purchases. In contrast, real purchases by state and local governments looked to be rising, as the pay-rolls of these governments increased in January and Feb-ruary and nominal state and local construction spending advanced somewhat in January.
The change in net exports was a significant drag on real GDP growth in the fourth quarter of 2017, as imports grew rapidly. The nominal U.S. international trade defi-cit widened in January; exports declined, led by lower ex-ports of capital goods and industrial supplies, while im-ports were about flat. The slowing of real import growth following the rapid increase in the fourth quarter sug-gested that the drag on real GDP growth from net ex-ports would lessen in the first quarter.
Total U.S. consumer prices, as measured by the PCE price index, increased 1¾ percent over the 12 months ending in January. Core PCE price inflation, which ex-cludes changes in consumer food and energy prices, was 1½ percent over that same period. The consumer price index (CPI) rose 2¼ percent over the 12 months ending in February, while core CPI inflation was 1¾ percent. Recent readings on survey-based measures of longer-run
Minutes of the Meeting of March 20–21, 2018 Page 3_____________________________________________________________________________________________
inflation expectations—including those from the Michi-gan survey, the Survey of Professional Forecasters, and the Desk’s Survey of Primary Dealers and Survey of Market Participants—were little changed on balance.
Foreign economic activity expanded at a moderate pace in the fourth quarter. Real GDP growth picked up in Mexico but slowed a bit in some advanced foreign econ-omies (AFEs) and in emerging Asia. Recent indicators pointed to solid economic growth abroad in the first quarter of this year. Inflation abroad continued to be boosted by the pass-through to consumer prices of past increases in oil prices. However, excluding food and en-ergy prices, inflation remained subdued in many foreign economies, including the euro area and Japan.
Staff Review of the Financial Situation Financial markets were turbulent over the intermeeting period, and market volatility increased notably. On net, U.S. equity prices declined, corporate bond spreads wid-ened, and nominal Treasury yields rose.
Broad equity price indexes decreased over the intermeet-ing period. Market participants pointed to a larger-than-expected increase in average hourly earnings in the Jan-uary employment report as a factor triggering increased investor concerns about inflation and the associated pace of interest rate increases. Those concerns appeared to induce a substantial decline in equity prices. The de-cline may have been exacerbated by broader concerns about the level of stock market valuations. On Febru-ary 5, the VIX—an index of option-implied volatility for one-month returns on the S&P 500 index—rose to its highest level since 2015, reportedly driven in part by the unwinding of investment strategies designed to profit from low volatility. Subsequently, equity prices recov-ered about half of their decline, and the VIX partially retraced its earlier increase.
Monetary policy communications over the intermeeting period—including the January FOMC statement, the minutes of the January FOMC meeting, and the Chair-man’s semiannual testimony to the Congress—were generally viewed by market participants as signaling a somewhat stronger economic outlook and thus rein-forced expectations for further gradual increases in the target range for the federal funds rate. The probability of the next rate hike occurring at the March FOMC meeting, as implied by quotes on federal funds futures contracts, increased to near certainty. Conditional on a March rate hike, the market-implied probability of an-other increase in the federal funds rate target range at the June FOMC meeting edged up to just above 70 percent. Expectations for the federal funds rate at the end of
2019 and 2020, derived from overnight index swap (OIS) quotes, moved up somewhat since late January.
On net, the nominal Treasury yield curve shifted up and flattened a bit. Monetary policy communications, higher-than-expected domestic price data, and expecta-tions for increases in the supply of Treasury securities following the federal budget agreement in early February contributed to the increase in Treasury yields. Measures of inflation compensation derived from Treasury Inflation-Protected Securities were little changed on net. Option-implied volatility on longer-term rates rose no-tably following the jump in equity market volatility on February 5 but mostly retraced that increase by the end of the intermeeting period. On balance, spreads on investment- and speculative-grade corporate bond yields over comparable-maturity Treasury yields widened but remained near the lower end of their historical ranges.
In short-term funding markets, increased issuance of Treasury bills lifted Treasury bill yields above comparable-maturity OIS rates for the first time in al-most a decade. The rise in bill yields was a factor that pushed up money market rates and widened the spreads of certificates of deposit and term London interbank of-fered rates relative to OIS rates. The upward pressure on money market rates also showed up in slight increases in the effective federal funds rate and the overnight bank funding rate relative to the interest rate on excess re-serves. The rise in market rates on overnight repurchase agreements relative to the offering rate on the Federal Reserve’s ON RRP facility resulted in low levels of take-up at the facility. Reductions in the size of the Federal Reserve’s balance sheet continued as scheduled without a notable effect on markets.
Despite the recent volatility in some financial markets, financing conditions for nonfinancial corporations and households remained accommodative over the inter-meeting period and continued to support further expan-sion of economic activity. Gross issuance of invest-ment- and speculative-grade bonds was slightly lower than usual in January and February, while gross issuance of institutional leveraged loans stayed strong. The pro-vision of bank-intermediated credit to businesses slowed further, likely reflecting weak loan demand rather than tight supply. Small business owners continued to report accommodative credit supply conditions but also weak demand for credit. Credit conditions in municipal bond markets remained accommodative.
In commercial real estate markets, loan growth at banks slowed further in January and February. Financing con-ditions in commercial mortgage-backed securities (CMBS) markets remained accommodative, as issuance
Page 4 Federal Open Market Committee_____________________________________________________________________________________________
was robust (relative to the usual seasonal slowdown) and CMBS spreads continued to be at low levels. Financing conditions in the residential mortgage market remained accommodative for most borrowers, though credit con-ditions stayed tight for borrowers with low credit scores or with hard-to-document incomes. Mortgage rates moved up, on net, over the period, along with the rise in other long-term rates.
Consumer credit grew at a solid pace in January follow-ing a rapid expansion in the fourth quarter. Aggregate credit card balances continued to expand steadily in Jan-uary. Nonetheless, for subprime borrowers, conditions remained tight, with credit limits and balances still low by historical standards. Auto lending continued to grow at a moderate pace in recent months; although under-writing standards in the subprime segment continued to tighten, there were few signs of a significant restriction in credit supply for auto loans.
Since the January FOMC meeting, foreign equity prices moved notably lower, on net, and generally declined more in the AFEs than in the United States. Longer-term yields on sovereign debt in AFEs either decreased moderately or ended the period little changed, in con-trast to the increase in U.S. Treasury yields. Weaker-than-expected economic data weighed on market-based measures of expected policy rate paths and on longer-term yields in Canada and in the euro area. Communi-cations from the Bank of Canada also seemed to con-tribute to the decline in Canadian yields. In the United Kingdom, longer-term yields were little changed, on net, although the market-based path of expected policy rates moved up moderately in response to Bank of England communications. In emerging market economies (EMEs), sovereign yield spreads widened modestly, and flows into EME mutual funds were volatile over the pe-riod.
The broad nominal dollar index appreciated moderately over the period, largely reflecting an outsized deprecia-tion of the Canadian dollar and a massive devaluation of the Venezuelan bolivar. (The Venezuelan government devalued the official Venezuelan exchange rate by more than 99 percent against the dollar, bringing the official rate closer to its black market value.) Lower oil prices, weaker-than-expected economic data, and uncertainty over U.S. trade policy likely contributed to the weakness in the Canadian dollar. In contrast, the Japanese yen ap-preciated against the dollar, in part supported by safe-haven demand. Late in the intermeeting period, the Brit-ish pound was boosted by news of a preliminary agree-ment between U.K. and European Union authorities re-garding the transition period of the Brexit process, but
the pound still ended the intermeeting period modestly weaker against the dollar.
Staff Economic Outlook The staff projection for U.S. economic activity prepared for the March FOMC meeting was somewhat stronger, on balance, than the forecast at the time of the January meeting. The near-term forecast for real GDP growth was revised down a little; the incoming spending data were a bit softer than the staff had expected, and the staff judged that the softness was not associated with re-sidual seasonality in the data. However, the slowing in the pace of spending in the first quarter was expected to be transitory, and the medium-term projection for GDP growth was revised up modestly, largely reflecting the expected boost to GDP from the federal budget agree-ment enacted in February. Real GDP was projected to increase at a faster pace than potential output through 2020. The unemployment rate was projected to decline further over the next few years and to continue to run below the staff’s estimate of its longer-run natural rate over this period.
The projection for inflation over the medium term was revised up a bit, reflecting the slightly tighter resource utilization in the new forecast. The rates of both total and core PCE price inflation were projected to be faster in 2018 than in 2017. The staff projected that inflation would reach the Committee’s 2 percent objective in 2019.
The staff viewed the uncertainty around its projections for real GDP growth, the unemployment rate, and infla-tion as similar to the average of the past 20 years. The staff saw the risks to the forecasts for real GDP growth and the unemployment rate as balanced. On the upside, recent fiscal policy changes could lead to a greater ex-pansion in economic activity over the next few years than the staff projected. On the downside, those fiscal policy changes could yield less impetus to the economy than the staff expected if the economy was already op-erating above its potential level and resource utilization continued to tighten, as the staff projected. Risks to the inflation projection also were seen as balanced. An up-side risk was that inflation could increase more than ex-pected in an economy that was projected to move fur-ther above its potential. Downside risks included the possibilities that longer-term inflation expectations may have edged lower or that the run of low core inflation readings last year could prove to be more persistent than the staff expected.
Minutes of the Meeting of March 20–21, 2018 Page 5_____________________________________________________________________________________________
Participants’ Views on Current Conditions and the Economic Outlook In conjunction with this FOMC meeting, members of the Board of Governors and Federal Reserve Bank pres-idents submitted their projections of the most likely out-comes for real GDP growth, the unemployment rate, and inflation for each year from 2018 through 2020 and over the longer run, based on their individual assess-ments of the appropriate path for the federal funds rate. The longer-run projections represented each partici-pant’s assessment of the rate to which each variable would be expected to converge, over time, under appro-priate monetary policy and in the absence of further shocks to the economy. These projections and policy assessments are described in the Summary of Economic Projections (SEP), which is an addendum to these minutes.
In their discussion of economic conditions and the out-look, meeting participants agreed that information re-ceived since the FOMC met in January indicated that economic activity had been rising at a moderate rate and that the labor market had continued to strengthen. Job gains had been strong in recent months, and the unem-ployment rate had stayed low. On a 12-month basis, both overall inflation and inflation for items other than food and energy continued to run below 2 percent. Market-based measures of inflation compensation had increased in recent months but remained low; survey-based measures of longer-term inflation expectations were little changed, on balance.
Participants noted incoming data suggesting some slow-ing in the rate of growth of household spending and business fixed investment after strong fourth-quarter readings. However, they expected that the first-quarter softness would be transitory, pointing to a variety of fac-tors, including delayed payment of some personal tax re-funds, residual seasonality in the data, and more gener-ally to strong economic fundamentals. Among the fun-damentals that participants cited were high levels of con-sumer and business sentiment, supportive financial con-ditions, improved economic conditions abroad, and re-cent changes in fiscal policy. Participants generally saw the news on spending and the labor market over the past few quarters as being consistent with continued above-trend growth and a further strengthening in labor mar-kets. Participants expected that, with further gradual in-creases in the federal funds rate, economic activity would expand at a solid rate during the remainder of this year and a moderate pace in the medium term, and that labor market conditions would remain strong. Inflation on a 12-month basis was expected to move up in coming
months and to stabilize around the Committee’s 2 per-cent objective over the medium term. Several partici-pants noted that the 12-month PCE price inflation rate would likely shift upward when the March data are re-leased because the effects of the outsized decline in the prices of cell phone service plans in March of last year will drop out of that calculation. Near-term risks to the economic outlook appeared to be roughly balanced, but participants agreed that it would be important to con-tinue to monitor inflation developments closely.
Many participants reported considerable optimism among the business contacts in their Districts, consistent with a firming in business expenditures. Respondents to District surveys in both the manufacturing and service sectors were generally upbeat about the economic out-look. In some Districts, reports from business contacts or evidence from surveys pointed to continuing short-ages of workers in segments of the labor market. Activ-ity in the energy sector continued to expand, with con-tacts suggesting that further increases were likely, pro-vided that sufficient labor resources were forthcoming. In contrast, contacts in the agricultural sector reported that farm income continued to experience downward pressure due to low crop prices.
A number of participants reported concern among their business contacts about the possible ramifications of the recent imposition of tariffs on imported steel and alumi-num. Participants did not see the steel and aluminum tariffs, by themselves, as likely to have a significant effect on the national economic outlook, but a strong majority of participants viewed the prospect of retaliatory trade actions by other countries, as well as other issues and uncertainties associated with trade policies, as downside risks for the U.S. economy. Contacts in the agricultural sector reported feeling particularly vulnerable to retalia-tion.
Tax changes enacted late last year and the recent federal budget agreement, taken together, were expected to pro-vide a significant boost to output over the next few years. However, participants generally regarded the magnitude and timing of the economic effects of the fis-cal policy changes as uncertain, partly because there have been few historical examples of expansionary fiscal pol-icy being implemented when the economy was operating at a high level of resource utilization. A number of par-ticipants also suggested that uncertainty about whether all elements of the tax cuts would be made permanent, or about the implications of higher budget deficits for fiscal sustainability and real interest rates, represented sources of downside risk to the economic outlook. A
Page 6 Federal Open Market Committee_____________________________________________________________________________________________
few participants noted that the changes in tax policy could boost the level of potential output.
Most participants described labor market conditions as strong, noting that payroll gains had remained well above the pace regarded as consistent with absorbing new labor force entrants over time, the unemployment rate had stayed low, job openings had been high, or that initial claims for unemployment insurance benefits had been low. Many participants observed that the labor force participation rate had been higher recently than they had expected, helping to keep the unemployment rate flat over the past few months despite strong payroll gains. The firmness in the overall participation rate—relative to its demographically driven downward trend—and the rising participation rate of prime-age adults were regarded as signs of continued strengthening in labor market conditions. A few participants thought that these favorable developments could continue for a time, whereas others expressed doubts. A few participants warned against inferring too much from comparisons of the current low level of the unemployment rate with his-torical benchmarks, arguing that the much higher levels of education of today’s workforce—and the lower aver-age unemployment rate of more highly educated work-ers than less educated workers—suggested that the U.S. economy might be able to sustain lower unemployment rates than was the case in the 1950s or 1960s.
In some Districts, reports from business contacts or ev-idence from surveys pointed to a pickup in wages, par-ticularly for unskilled or entry-level workers. However, business contacts or national surveys led a few partici-pants to conclude that some businesses facing labor shortages were changing job requirements so that they matched more closely the skills of available workers, in-creasing training, or offering more flexible work arrange-ments, rather than increasing wages in a broad-based fashion. Regarding wage growth at the national level, several participants noted a modest increase, but most still described the pace of wage gains as moderate; a few participants cited this fact as suggesting that there was room for the labor market to strengthen somewhat fur-ther.
In some Districts, surveys or business contacts reported increases in nonwage costs, particularly in the cost of materials, and in a few Districts, contacts reported pass-ing on some of those costs in the form of higher prices. Contacts in a few Districts suggested that widely known, observable cost increases—such as those associated with rising commodity prices—would be more likely to be ac-cepted and passed through to final goods prices than would less observable costs such as wage increases. A
few participants argued that either an absence of pricing power among at least some firms—perhaps stemming from globalization and technological innovations, in-cluding ones that facilitate price comparisons—or the ability of firms to find ways to cut costs of production has been damping inflationary pressures. Many partici-pants stated that recent readings from indicators on in-flation and inflation expectations increased their confi-dence that inflation would rise to the Committee’s 2 per-cent objective in coming months and then stabilize around that level; others suggested that downside risks to inflation were subsiding. In contrast, a few partici-pants cautioned that, despite increases in market-based measures of inflation compensation in recent months and the stabilization of some survey measures of infla-tion expectations, the levels of these indicators remained too low to be consistent with the Committee’s 2 percent inflation objective.
In their discussion of developments in financial markets, some participants observed that financial conditions re-mained accommodative despite the rise in market vola-tility and repricing of assets that had occurred in Febru-ary. Many participants reported that their contacts had taken the previous month’s turbulence in stride, al-though a few participants suggested that financial devel-opments over the intermeeting period highlighted some downside risks associated with still-high valuations for equities or from market volatility more generally. A few participants expressed concern that a lengthy period in which the economy operates beyond potential and fi-nancial conditions remain highly accommodative could, over time, pose risks to financial stability.
In their consideration of monetary policy, participants discussed the implications of recent economic and finan-cial developments for the appropriate path of the federal funds rate. All participants agreed that the outlook for the economy beyond the current quarter had strength-ened in recent months. In addition, all participants ex-pected inflation on a 12-month basis to move up in com-ing months. This expectation partly reflected the arith-metic effect of the soft readings on inflation in early 2017 dropping out of the calculation; it was noted that the increase in the inflation rate arising from this source was widely expected and, by itself, would not justify a change in the projected path for the federal funds rate. Most participants commented that the stronger eco-nomic outlook and the somewhat higher inflation read-ings in recent months had increased the likelihood of progress toward the Committee’s 2 percent inflation ob-jective. A few participants suggested that a modest in-
Minutes of the Meeting of March 20–21, 2018 Page 7_____________________________________________________________________________________________
flation overshoot might help push up longer-term infla-tion expectations and anchor them at a level consistent with the Committee’s 2 percent inflation objective. A number of participants offered their views on the poten-tial benefits and costs associated with an economy oper-ating well above potential for a prolonged period while inflation remained low. On the one hand, the associated tightness in the labor market might help speed the return of inflation to the Committee’s 2 percent goal and in-duce a further increase in labor force participation; on the other hand, an overheated economy could result in significant inflation pressures or lead to financial insta-bility.
Based on their current assessments, almost all partici-pants expressed the view that it would be appropriate for the Committee to raise the target range for the federal funds rate 25 basis points at this meeting. These partic-ipants agreed that, even after such an increase in the tar-get range, the stance of monetary policy would remain accommodative, supporting strong labor market condi-tions and a sustained return to 2 percent inflation. A couple of participants pointed to possible benefits of postponing an increase in the target range for the federal funds rate until a subsequent meeting; these participants suggested that waiting for additional data to provide more evidence of a sustained return of the 12-month in-flation rate to 2 percent might more clearly demonstrate the data dependence of the Committee’s decisions and its resolve to achieve the price-stability component of its dual mandate.
With regard to the medium-term outlook for monetary policy, all participants saw some further firming of the stance of monetary policy as likely to be warranted. Al-most all participants agreed that it remained appropriate to follow a gradual approach to raising the target range for the federal funds rate. Several participants com-mented that this gradual approach was most likely to be conducive to maintaining strong labor market condi-tions and returning inflation to 2 percent on a sustained basis without resulting in conditions that would eventu-ally require an abrupt policy tightening. A number of participants indicated that the stronger outlook for eco-nomic activity, along with their increased confidence that inflation would return to 2 percent over the medium term, implied that the appropriate path for the federal funds rate over the next few years would likely be slightly steeper than they had previously expected. Participants agreed that the longer-run normal federal funds rate was likely lower than in the past, in part because of secular forces that had put downward pressure on real interest rates. Several participants expressed the judgment that
it would likely become appropriate at some point for the Committee to set the federal funds rate above its longer-run normal value for a time. Some participants sug-gested that, at some point, it might become necessary to revise statement language to acknowledge that, in pur-suit of the Committee’s statutory mandate and con-sistent with the median of participants’ policy rate pro-jections in the SEP, monetary policy eventually would likely gradually move from an accommodative stance to being a neutral or restraining factor for economic activ-ity. However, participants expressed a range of views on the amount of policy tightening that would likely be re-quired over the medium term to achieve the Commit-tee’s goals. Participants agreed that the actual path of the federal funds rate would depend on the economic outlook as informed by incoming data.
Committee Policy Action In their discussion of monetary policy for the period ahead, members judged that information received since the Committee met in January indicated that the labor market had continued to strengthen and that economic activity had been rising at a moderate rate. Job gains had been strong in recent months, and the unemployment rate had stayed low. Recent data suggested that growth rates of household spending and business fixed invest-ment had moderated from their strong fourth-quarter readings. On a 12-month basis, both overall inflation and inflation for items other than food and energy had continued to run below 2 percent. Market-based measures of inflation compensation had increased in re-cent months but remained low; survey-based measures of longer-term inflation expectations were little changed, on balance.
All members viewed the recent data and other develop-ments bearing on real economic activity as suggesting that the outlook for the economy beyond the current quarter had strengthened in recent months. In addition, notwithstanding increased market volatility over the in-termeeting period, financial conditions had stayed ac-commodative, and developments since the January meeting had indicated that fiscal policy was likely to pro-vide greater impetus to the economy over the next few years than members had previously thought. Conse-quently, members expected that, with further gradual ad-justments in the stance of monetary policy, economic ac-tivity would expand at a moderate pace in the medium term, and labor market conditions would remain strong. Members generally continued to judge the risks to the economic outlook as remaining roughly balanced.
Most members noted that recent readings on inflation, along with the strengthening of the economic outlook,
Page 8 Federal Open Market Committee_____________________________________________________________________________________________
provided support for the view that inflation on a 12-month basis would likely move up in coming months and stabilize around the Committee’s 2 percent objective over the medium term. Members agreed to continue to monitor inflation developments closely.
After assessing current conditions and the outlook for economic activity, the labor market, and inflation, mem-bers voted to raise the target range for the federal funds rate to 1½ to 1¾ percent. They indicated that the stance of monetary policy remained accommodative, thereby supporting strong labor market conditions and a sus-tained return to 2 percent inflation.
Members agreed that the timing and size of future ad-justments to the target range for the federal funds rate would depend on their assessments of realized and ex-pected economic conditions relative to the Committee’s objectives of maximum employment and 2 percent in-flation. They reiterated that this assessment would take into account a wide range of information, including measures of labor market conditions, indicators of infla-tion pressures and inflation expectations, and readings on financial and international developments. Members also agreed that they would carefully monitor actual and expected developments in inflation in relation to the Committee’s symmetric inflation goal. Members ex-pected that economic conditions would evolve in a man-ner that would warrant further gradual increases in the federal funds rate. They judged that raising the target range gradually would balance the risks to the outlook for inflation and unemployment and was most likely to support continued economic expansion. Members agreed that the strengthening in the economic outlook in recent months increased the likelihood that a gradual upward trajectory of the federal funds rate would be ap-propriate. Members continued to anticipate that the fed-eral funds rate would likely remain, for some time, below levels that were expected to prevail in the longer run. Nonetheless, they again stated that the actual path for the federal funds rate would depend on the economic outlook as informed by incoming data.
At the conclusion of the discussion, the Committee voted to authorize and direct the Federal Reserve Bank of New York, until it was instructed otherwise, to execute transactions in the SOMA in accordance with the following domestic policy directive, to be released at 2:00 p.m.:
“Effective March 22, 2018, the Federal Open Market Committee directs the Desk to under-take open market operations as necessary to maintain the federal funds rate in a target range
of 1½ to 1¾ percent, including overnight re-verse repurchase operations (and reverse repur-chase operations with maturities of more than one day when necessary to accommodate week-end, holiday, or similar trading conventions) at an offering rate of 1.50 percent, in amounts lim-ited only by the value of Treasury securities held outright in the System Open Market Account that are available for such operations and by a per-counterparty limit of $30 billion per day.
The Committee directs the Desk to continue rolling over at auction the amount of principal payments from the Federal Reserve’s holdings of Treasury securities maturing during March that exceeds $12 billion, and to continue rein-vesting in agency mortgage-backed securities the amount of principal payments from the Federal Reserve’s holdings of agency debt and agency mortgage-backed securities received during March that exceeds $8 billion. Effective in April, the Committee directs the Desk to roll over at auction the amount of principal pay-ments from the Federal Reserve’s holdings of Treasury securities maturing during each calen-dar month that exceeds $18 billion, and to rein-vest in agency mortgage-backed securities the amount of principal payments from the Federal Reserve’s holdings of agency debt and agency mortgage-backed securities received during each calendar month that exceeds $12 billion. Small deviations from these amounts for oper-ational reasons are acceptable.
The Committee also directs the Desk to engage in dollar roll and coupon swap transactions as necessary to facilitate settlement of the Federal Reserve’s agency mortgage-backed securities transactions.”
The vote also encompassed approval of the statement below to be released at 2:00 p.m.:
“Information received since the Federal Open Market Committee met in January indicates that the labor market has continued to strengthen and that economic activity has been rising at a moderate rate. Job gains have been strong in recent months, and the unemployment rate has stayed low. Recent data suggest that growth rates of household spending and business fixed investment have moderated from their strong fourth-quarter readings. On a 12-month basis, both overall inflation and inflation for items other than food and energy have continued to
Minutes of the Meeting of March 20–21, 2018 Page 9_____________________________________________________________________________________________

run below 2 percent. Market-based measures of inflation compensation have increased in recent months but remain low; survey-based measures of longer-term inflation expectations are little changed, on balance.
Consistent with its statutory mandate, the Com-mittee seeks to foster maximum employment and price stability. The economic outlook has strengthened in recent months. The Committee expects that, with further gradual adjustments in the stance of monetary policy, economic activity will expand at a moderate pace in the medium term and labor market conditions will remain strong. Inflation on a 12-month basis is ex-pected to move up in coming months and to stabilize around the Committee’s 2 percent ob-jective over the medium term. Near-term risks to the economic outlook appear roughly bal-anced, but the Committee is monitoring infla-tion developments closely.
In view of realized and expected labor market conditions and inflation, the Committee de-cided to raise the target range for the federal funds rate to 1½ to 1¾ percent. The stance of monetary policy remains accommodative, thereby supporting strong labor market condi-tions and a sustained return to 2 percent infla-tion.
In determining the timing and size of future ad-justments to the target range for the federal funds rate, the Committee will assess realized and expected economic conditions relative to its objectives of maximum employment and 2 per-cent inflation. This assessment will take into ac-count a wide range of information, including measures of labor market conditions, indicators of inflation pressures and inflation expectations, and readings on financial and international de-velopments. The Committee will carefully
monitor actual and expected inflation develop-ments relative to its symmetric inflation goal. The Committee expects that economic condi-tions will evolve in a manner that will warrant further gradual increases in the federal funds rate; the federal funds rate is likely to remain, for some time, below levels that are expected to prevail in the longer run. However, the actual path of the federal funds rate will depend on the economic outlook as informed by incoming data.”
Voting for this action: Jerome H. Powell, William C. Dudley, Thomas I. Barkin, Raphael W. Bostic, Lael Brainard, Loretta J. Mester, Randal K. Quarles, and John C. Williams.
Voting against this action: None.
To support the Committee’s decision to raise the target range for the federal funds rate, the Board of Governors voted unanimously to raise the interest rates on required and excess reserve balances ¼ percentage point, to 1¾ percent, effective March 22, 2018. The Board of Governors also voted unanimously to approve a ¼ per-centage point increase in the primary credit rate (dis-count rate) to 2¼ percent, effective March 22, 2018.4
It was agreed that the next meeting of the Committee would be held on Tuesday–Wednesday, May 1–2, 2018. The meeting adjourned at 9:55 a.m. on March 21, 2018.
Notation Vote By notation vote completed on February 20, 2018, the Committee unanimously approved the minutes of the Committee meeting held on January 30–31, 2018.
_____________________________ James A. Clouse
Secretary
4 In taking this action, the Board approved requests submitted by the boards of directors of the Federal Reserve Banks of Boston, New York, Philadelphia, Cleveland, Richmond, At-lanta, St. Louis, Kansas City, Dallas, and San Francisco. This vote also encompassed approval by the Board of Governors of the establishment of a 2¼ percent primary credit rate by the remaining Federal Reserve Banks, effective on the later of March 22, 2018, and the date such Reserve Banks informed
the Secretary of the Board of such a request. (Secretary’s note: Subsequently, the Federal Reserve Banks of Chicago and Min-neapolis were informed by the Secretary of the Board of the Board’s approval of their establishment of a primary credit rate of 2¼ percent, effective March 22, 2018.) The second vote of the Board also encompassed approval of the establish-ment of the interest rates for secondary and seasonal credit under the existing formulas for computing such rates.
Page 10 Federal Open Market Committee_____________________________________________________________________________________________
Summary of Economic Projections
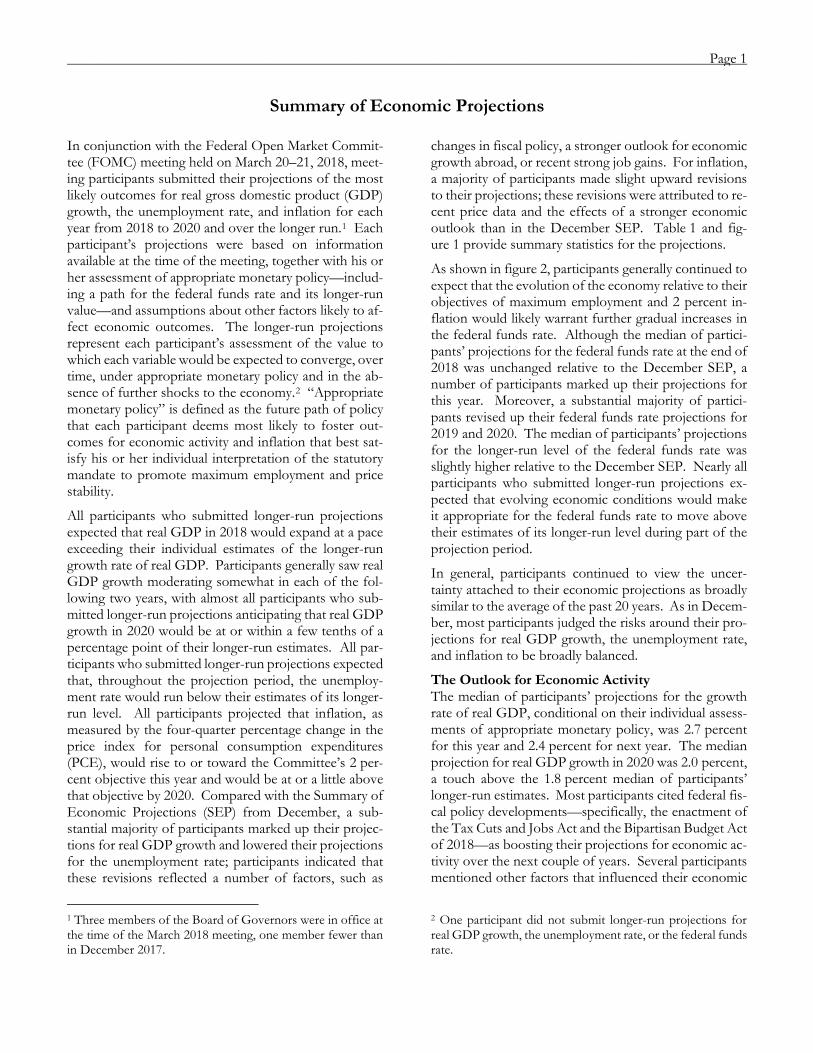
In conjunction with the Federal Open Market Commit-tee (FOMC) meeting held on March 20–21, 2018, meet-ing participants submitted their projections of the most likely outcomes for real gross domestic product (GDP) growth, the unemployment rate, and inflation for each year from 2018 to 2020 and over the longer run.1 Each participant’s projections were based on information available at the time of the meeting, together with his or her assessment of appropriate monetary policy—includ-ing a path for the federal funds rate and its longer-run value—and assumptions about other factors likely to af-fect economic outcomes. The longer-run projections represent each participant’s assessment of the value to which each variable would be expected to converge, over time, under appropriate monetary policy and in the ab-sence of further shocks to the economy.2 “Appropriate monetary policy” is defined as the future path of policy that each participant deems most likely to foster out-comes for economic activity and inflation that best sat-isfy his or her individual interpretation of the statutory mandate to promote maximum employment and price stability.
All participants who submitted longer-run projections expected that real GDP in 2018 would expand at a pace exceeding their individual estimates of the longer-run growth rate of real GDP. Participants generally saw real GDP growth moderating somewhat in each of the fol-lowing two years, with almost all participants who sub-mitted longer-run projections anticipating that real GDP growth in 2020 would be at or within a few tenths of a percentage point of their longer-run estimates. All par-ticipants who submitted longer-run projections expected that, throughout the projection period, the unemploy-ment rate would run below their estimates of its longer-run level. All participants projected that inflation, as measured by the four-quarter percentage change in the price index for personal consumption expenditures (PCE), would rise to or toward the Committee’s 2 per-cent objective this year and would be at or a little above that objective by 2020. Compared with the Summary of Economic Projections (SEP) from December, a sub-stantial majority of participants marked up their projec-tions for real GDP growth and lowered their projections for the unemployment rate; participants indicated that these revisions reflected a number of factors, such as
1 Three members of the Board of Governors were in office at the time of the March 2018 meeting, one member fewer than in December 2017.
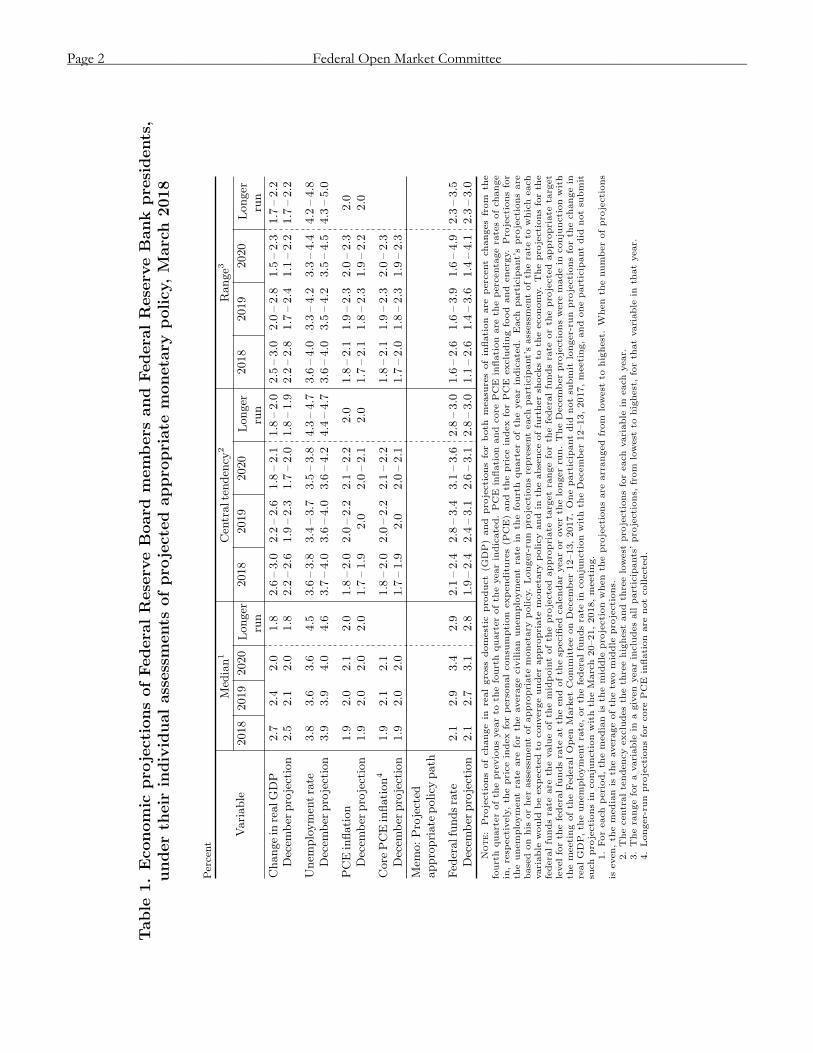
changes in fiscal policy, a stronger outlook for economic growth abroad, or recent strong job gains. For inflation, a majority of participants made slight upward revisions to their projections; these revisions were attributed to re-cent price data and the effects of a stronger economic outlook than in the December SEP. Table 1 and fig-ure 1 provide summary statistics for the projections.
As shown in figure 2, participants generally continued to expect that the evolution of the economy relative to their objectives of maximum employment and 2 percent in-flation would likely warrant further gradual increases in the federal funds rate. Although the median of partici-pants’ projections for the federal funds rate at the end of 2018 was unchanged relative to the December SEP, a number of participants marked up their projections for this year. Moreover, a substantial majority of partici-pants revised up their federal funds rate projections for 2019 and 2020. The median of participants’ projections for the longer-run level of the federal funds rate was slightly higher relative to the December SEP. Nearly all participants who submitted longer-run projections ex-pected that evolving economic conditions would make it appropriate for the federal funds rate to move above their estimates of its longer-run level during part of the projection period.
In general, participants continued to view the uncer-tainty attached to their economic projections as broadly similar to the average of the past 20 years. As in Decem-ber, most participants judged the risks around their pro-jections for real GDP growth, the unemployment rate, and inflation to be broadly balanced.
The Outlook for Economic Activity The median of participants’ projections for the growth rate of real GDP, conditional on their individual assess-ments of appropriate monetary policy, was 2.7 percent for this year and 2.4 percent for next year. The median projection for real GDP growth in 2020 was 2.0 percent, a touch above the 1.8 percent median of participants’ longer-run estimates. Most participants cited federal fis-cal policy developments—specifically, the enactment of the Tax Cuts and Jobs Act and the Bipartisan Budget Act of 2018—as boosting their projections for economic ac-tivity over the next couple of years. Several participants mentioned other factors that influenced their economic
2 One participant did not submit longer-run projections for real GDP growth, the unemployment rate, or the federal funds rate.
Page 1_____________________________________________________________________________________________
Table
1.Economic
projectionsofFederalReserveBoardmembersandFederalReserveBankpresidents,
underth
eir
individualassessments
ofprojectedappropriate
monetarypolicy,M
arch2018
Percent
Variable
Median1
Centraltendency2
Range3
2018
2019
2020
Longer
run
2018
2019
2020
Longer
run
2018
2019
2020
Longer
run
Changein
realGDP
2.7
2.4
2.0
1.8
2.6
–3.0
2.2
–2.6
1.8
–2.1
1.8
–2.0
2.5
–3.0
2.0
–2.8
1.5
–2.3
1.7
–2.2
Decemberprojection
2.5
2.1
2.0
1.8
2.2
–2.6
1.9
–2.3
1.7
–2.0
1.8
–1.9
2.2
–2.8
1.7
–2.4
1.1
–2.2
1.7
–2.2
Unemploymentrate
3.8
3.6
3.6
4.5
3.6
–3.8
3.4
–3.7
3.5
–3.8
4.3
–4.7
3.6
–4.0
3.3
–4.2
3.3
–4.4
4.2
–4.8
Decemberprojection
3.9
3.9
4.0
4.6
3.7
–4.0
3.6
–4.0
3.6
–4.2
4.4
–4.7
3.6
–4.0
3.5
–4.2
3.5
–4.5
4.3
–5.0
PCEinflation
1.9
2.0
2.1
2.0
1.8
–2.0
2.0
–2.2
2.1
–2.2
2.0
1.8
–2.1
1.9
–2.3
2.0
–2.3
2.0
Decemberprojection
1.9
2.0
2.0
2.0
1.7
–1.9
2.0
2.0
–2.1
2.0
1.7
–2.1
1.8
–2.3
1.9
–2.2
2.0
Core
PCEinflation4
1.9
2.1
2.1
1.8
–2.0
2.0
–2.2
2.1
–2.2
1.8
–2.1
1.9
–2.3
2.0
–2.3
Decemberprojection
1.9
2.0
2.0
1.7
–1.9
2.0
2.0
–2.1
1.7
–2.0
1.8
–2.3
1.9
–2.3
Memo:Projected
appropriate
policypath
Federalfundsrate
2.1
2.9
3.4
2.9
2.1
–2.4
2.8
–3.4
3.1
–3.6
2.8
–3.0
1.6
–2.6
1.6
–3.9
1.6
–4.9
2.3
–3.5
Decemberprojection
2.1
2.7
3.1
2.8
1.9
–2.4
2.4
–3.1
2.6
–3.1
2.8
–3.0
1.1
–2.6
1.4
–3.6
1.4
–4.1
2.3
–3.0
Note:
Pro
jectionsofch
angein
realgro
ssdomestic
pro
duct(G
DP)and
pro
jectionsforboth
measu
resofinflation
are
percentch
angesfrom
the
fourth
quarterofth
epreviousyearto
thefourth
quarterofth
eyearindicated.PCE
inflation
and
core
PCE
inflation
are
thepercenta
gera
tesofch
ange
in,resp
ectively,th
epriceindex
forpersonalconsu
mption
expenditures(P
CE)and
thepriceindex
forPCE
excludingfood
and
energ
y.Pro
jectionsfor
theunemploymentra
teare
forth
eavera
gecivilian
unemploymentra
tein
thefourth
quarterofth
eyearindicated.Each
participant’spro
jectionsare
based
on
his
orherassessmentofappro
priate
moneta
rypolicy.Longer-ru
npro
jectionsrepresenteach
participant’sassessmentofth
era
teto
whicheach
variable
would
beexpectedto
converg
eunderappro
priate
moneta
rypolicyandin
theabsenceoffurthersh
ock
sto
theeconomy.Thepro
jectionsforth
efedera
lfundsra
teare
thevalueofth
emidpointofth
epro
jected
appro
priate
targ
etra
ngeforth
efedera
lfundsra
teorth
epro
jected
appro
priate
targ
et
levelforth
efedera
lfundsra
teatth
eendofth
esp
ecifiedcalendaryearoroverth
elongerru
n.TheDecemberpro
jectionswere
madein
conjunctionwith
themeetingofth
eFedera
lOpen
Mark
etCommitteeon
December12–13,2017.Oneparticipantdid
notsu
bmit
longer-ru
npro
jectionsforth
ech
angein
realGDP,th
eunemploymentra
te,orth
efedera
lfundsra
tein
conjunctionwithth
eDecember12–13,2017,meeting,andoneparticipantdid
notsu
bmit
such
pro
jectionsin
conjunction
with
theM
arch
20–21,2018,meeting.
1.Foreach
period,th
emedian
isth
emiddle
pro
jection
when
thepro
jectionsare
arranged
from
lowest
tohighest.W
hen
thenumberofpro
jections
iseven,th
emedian
isth
eavera
geofth
etw
omiddle
pro
jections.
2.Thecentraltendencyexcludesth
eth
reehighest
and
threelowest
pro
jectionsforeach
variable
ineach
year.
3.Thera
ngeforavariable
inagiven
yearincludesall
participants’pro
jections,
from
lowest
tohighest,forth
atvariable
inth
atyear.
4.Longer-ru
npro
jectionsforcore
PCE
inflation
are
notcollected.
Page 2 Federal Open Market Committee_____________________________________________________________________________________________
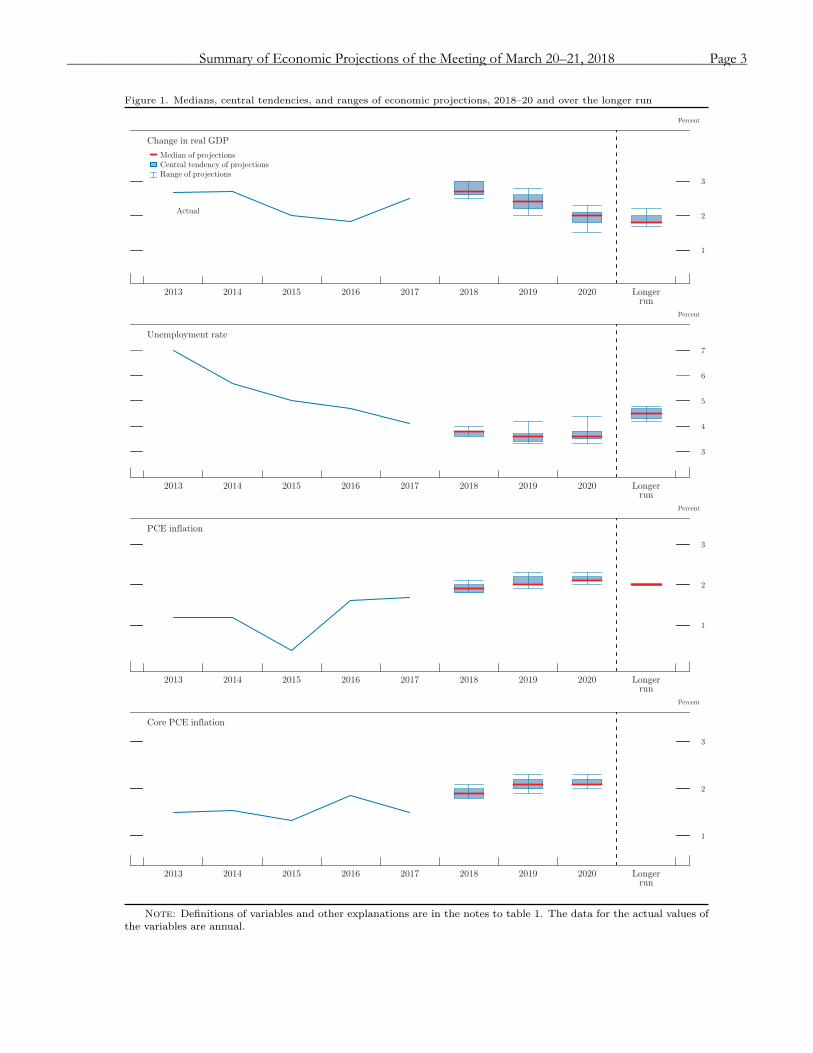
Figure 1. Medians, central tendencies, and ranges of economic projections, 2018–20 and over the longer run
Change in real GDP
Percent
1
2
3
2013 2014 2015 2016 2017 2018 2019 2020 Longerrun
Median of projectionsCentral tendency of projectionsRange of projections
Actual
Unemployment rate
Percent
3
4
5
6
7
2013 2014 2015 2016 2017 2018 2019 2020 Longerrun
PCE inflation
Percent
1
2
3
2013 2014 2015 2016 2017 2018 2019 2020 Longerrun
Core PCE inflation
Percent
1
2
3
2013 2014 2015 2016 2017 2018 2019 2020 Longerrun
Note: Definitions of variables and other explanations are in the notes to table 1. The data for the actual values ofthe variables are annual.
Summary of Economic Projections of the Meeting of March 20–21, 2018 Page 3_____________________________________________________________________________________________
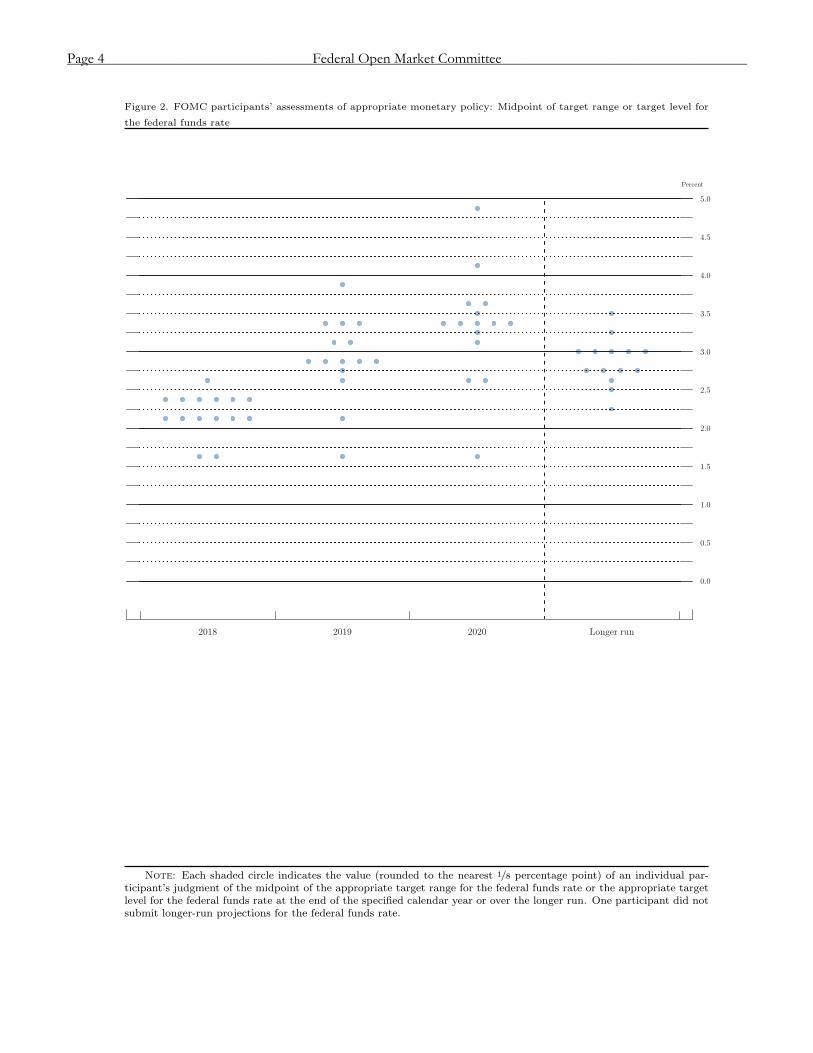
Figure 2. FOMC participants’ assessments of appropriate monetary policy: Midpoint of target range or target level for
the federal funds rate
Percent
0.0
0.5
1.0
1.5
2.0
2.5
3.0
3.5
4.0
4.5
5.0
2018 2019 2020 Longer run
Note: Each shaded circle indicates the value (rounded to the nearest 1/8 percentage point) of an individual par-ticipant’s judgment of the midpoint of the appropriate target range for the federal funds rate or the appropriate targetlevel for the federal funds rate at the end of the specified calendar year or over the longer run. One participant did notsubmit longer-run projections for the federal funds rate.
Page 4 Federal Open Market Committee_____________________________________________________________________________________________
projections, including accommodative monetary policy and financial conditions, strength in the global economic outlook, and continued momentum in the labor market. Compared with the December SEP, the medians of par-ticipants’ projections for real GDP growth this year and next year were up a few tenths of a percentage point.
Consistent with their projections for economic activity, almost all participants expected labor market conditions to strengthen further over the projection period. The medians of projections for the unemployment rate showed that rate stepping down from 4.1 percent in the final quarter of 2017 to 3.8 percent in the final quarter of this year, and then to 3.6 percent in the final quarters of 2019 and 2020. The median of participants’ estimates of the longer-run unemployment rate was 4.5 percent. Compared with the December SEP, almost all partici-pants marked down their unemployment rate projec-tions. Some participants also lowered their estimates of the longer-run level of the unemployment rate, leading to a small decline in the corresponding median projec-tion.
Figures 3.A and 3.B show the distributions of partici-pants’ projections for real GDP growth and the unem-ployment rate from 2018 to 2020 and in the longer run. The distributions of individual projections for real GDP growth this year and next year shifted up noticeably from those in the December SEP; participants’ projections ranged from 2.5 to 3.0 percent in 2018 and from 2.0 to 2.8 percent in 2019. By contrast, the distributions of projected real GDP growth in 2020 and in the longer run shifted up modestly since December. Consistent with participants’ generally more upbeat outlook for real GDP growth, the distributions of individual projections for the unemployment rate were lower than the corre-sponding distributions in December for each year of the projection period.
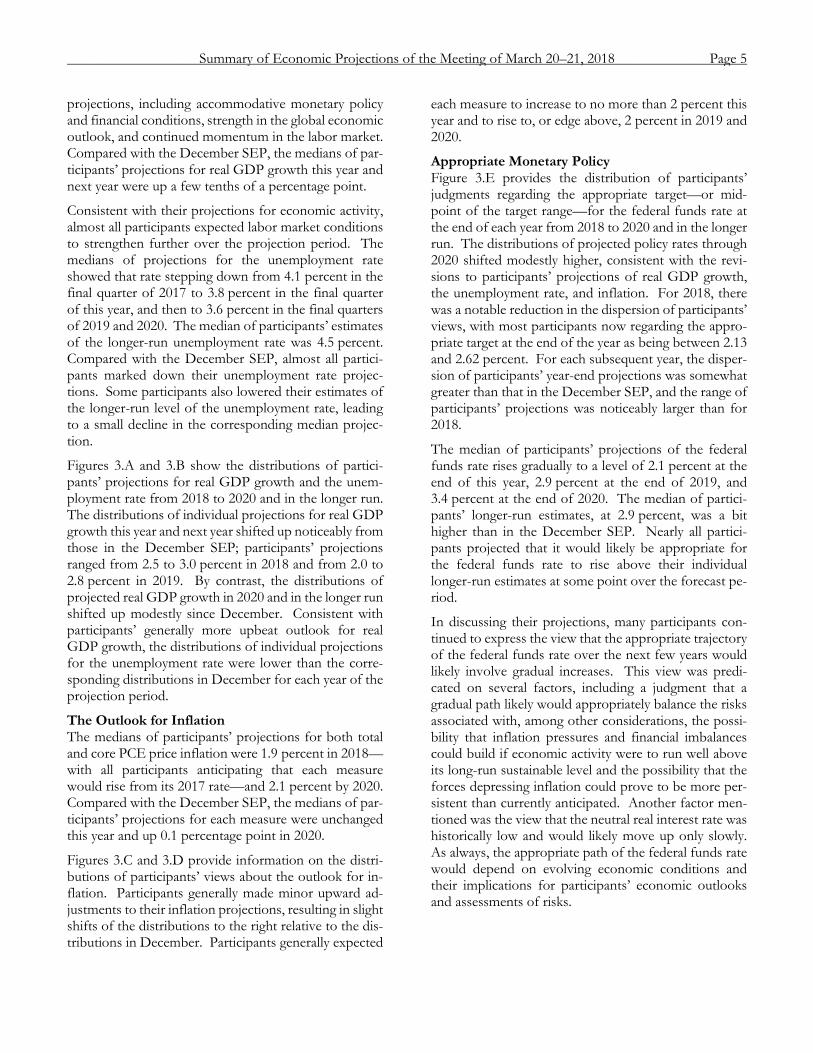
The Outlook for Inflation The medians of participants’ projections for both total and core PCE price inflation were 1.9 percent in 2018—with all participants anticipating that each measure would rise from its 2017 rate—and 2.1 percent by 2020. Compared with the December SEP, the medians of par-ticipants’ projections for each measure were unchanged this year and up 0.1 percentage point in 2020.
Figures 3.C and 3.D provide information on the distri-butions of participants’ views about the outlook for in-flation. Participants generally made minor upward ad-justments to their inflation projections, resulting in slight shifts of the distributions to the right relative to the dis-tributions in December. Participants generally expected
each measure to increase to no more than 2 percent this year and to rise to, or edge above, 2 percent in 2019 and 2020.
Appropriate Monetary Policy Figure 3.E provides the distribution of participants’ judgments regarding the appropriate target—or mid-point of the target range—for the federal funds rate at the end of each year from 2018 to 2020 and in the longer run. The distributions of projected policy rates through 2020 shifted modestly higher, consistent with the revi-sions to participants’ projections of real GDP growth, the unemployment rate, and inflation. For 2018, there was a notable reduction in the dispersion of participants’ views, with most participants now regarding the appro-priate target at the end of the year as being between 2.13 and 2.62 percent. For each subsequent year, the disper-sion of participants’ year-end projections was somewhat greater than that in the December SEP, and the range of participants’ projections was noticeably larger than for 2018.
The median of participants’ projections of the federal funds rate rises gradually to a level of 2.1 percent at the end of this year, 2.9 percent at the end of 2019, and 3.4 percent at the end of 2020. The median of partici-pants’ longer-run estimates, at 2.9 percent, was a bit higher than in the December SEP. Nearly all partici-pants projected that it would likely be appropriate for the federal funds rate to rise above their individual longer-run estimates at some point over the forecast pe-riod.
In discussing their projections, many participants con-tinued to express the view that the appropriate trajectory of the federal funds rate over the next few years would likely involve gradual increases. This view was predi-cated on several factors, including a judgment that a gradual path likely would appropriately balance the risks associated with, among other considerations, the possi-bility that inflation pressures and financial imbalances could build if economic activity were to run well above its long-run sustainable level and the possibility that the forces depressing inflation could prove to be more per-sistent than currently anticipated. Another factor men-tioned was the view that the neutral real interest rate was historically low and would likely move up only slowly. As always, the appropriate path of the federal funds rate would depend on evolving economic conditions and their implications for participants’ economic outlooks and assessments of risks.
Summary of Economic Projections of the Meeting of March 20–21, 2018 Page 5_____________________________________________________________________________________________

Figure 3.A. Distribution of participants’ projections for the change in real GDP, 2018–20 and over the longer run
2018
Number of participants
2
4
6
8
10
12
14
16
18
1.0 1.2 1.4 1.6 1.8 2.0 2.2 2.4 2.6 2.8 3.0 1.1 1.3 1.5 1.7 1.9 2.1 2.3 2.5 2.7 2.9 3.1
Percent range
March projectionsDecember projections
2019
Number of participants
2
4
6
8
10
12
14
16
18
1.0 1.2 1.4 1.6 1.8 2.0 2.2 2.4 2.6 2.8 3.0 1.1 1.3 1.5 1.7 1.9 2.1 2.3 2.5 2.7 2.9 3.1
Percent range
2020
Number of participants
2
4
6
8
10
12
14
16
18
1.0 1.2 1.4 1.6 1.8 2.0 2.2 2.4 2.6 2.8 3.0 1.1 1.3 1.5 1.7 1.9 2.1 2.3 2.5 2.7 2.9 3.1
Percent range
Longer run
Number of participants
2
4
6
8
10
12
14
16
18
1.0 1.2 1.4 1.6 1.8 2.0 2.2 2.4 2.6 2.8 3.0 1.1 1.3 1.5 1.7 1.9 2.1 2.3 2.5 2.7 2.9 3.1
Percent range
Note: Definitions of variables and other explanations are in the notes to table 1.
Page 6 Federal Open Market Committee_____________________________________________________________________________________________

Figure 3.B. Distribution of participants’ projections for the unemployment rate, 2018–20 and over the longer run
2018
Number of participants
2
4
6
8
10
12
14
16
18
3.0 3.2 3.4 3.6 3.8 4.0 4.2 4.4 4.6 4.8 5.0 3.1 3.3 3.5 3.7 3.9 4.1 4.3 4.5 4.7 4.9 5.1
Percent range
March projectionsDecember projections
2019
Number of participants
2
4
6
8
10
12
14
16
18
3.0 3.2 3.4 3.6 3.8 4.0 4.2 4.4 4.6 4.8 5.0 3.1 3.3 3.5 3.7 3.9 4.1 4.3 4.5 4.7 4.9 5.1
Percent range
2020
Number of participants
2
4
6
8
10
12
14
16
18
3.0 3.2 3.4 3.6 3.8 4.0 4.2 4.4 4.6 4.8 5.0 3.1 3.3 3.5 3.7 3.9 4.1 4.3 4.5 4.7 4.9 5.1
Percent range
Longer run
Number of participants
2
4
6
8
10
12
14
16
18
3.0 3.2 3.4 3.6 3.8 4.0 4.2 4.4 4.6 4.8 5.0 3.1 3.3 3.5 3.7 3.9 4.1 4.3 4.5 4.7 4.9 5.1
Percent range
Note: Definitions of variables and other explanations are in the notes to table 1.
Summary of Economic Projections of the Meeting of March 20–21, 2018 Page 7_____________________________________________________________________________________________

Figure 3.C. Distribution of participants’ projections for PCE inflation, 2018–20 and over the longer run
2018
Number of participants
2
4
6
8
10
12
14
16
18
1.7 1.9 2.1 2.3 1.8 2.0 2.2 2.4
Percent range
March projectionsDecember projections
2019
Number of participants
2
4
6
8
10
12
14
16
18
1.7 1.9 2.1 2.3 1.8 2.0 2.2 2.4
Percent range
2020
Number of participants
2
4
6
8
10
12
14
16
18
1.7 1.9 2.1 2.3 1.8 2.0 2.2 2.4
Percent range
Longer run
Number of participants
2
4
6
8
10
12
14
16
18
1.7 1.9 2.1 2.3 1.8 2.0 2.2 2.4
Percent range
Note: Definitions of variables and other explanations are in the notes to table 1.
Page 8 Federal Open Market Committee_____________________________________________________________________________________________
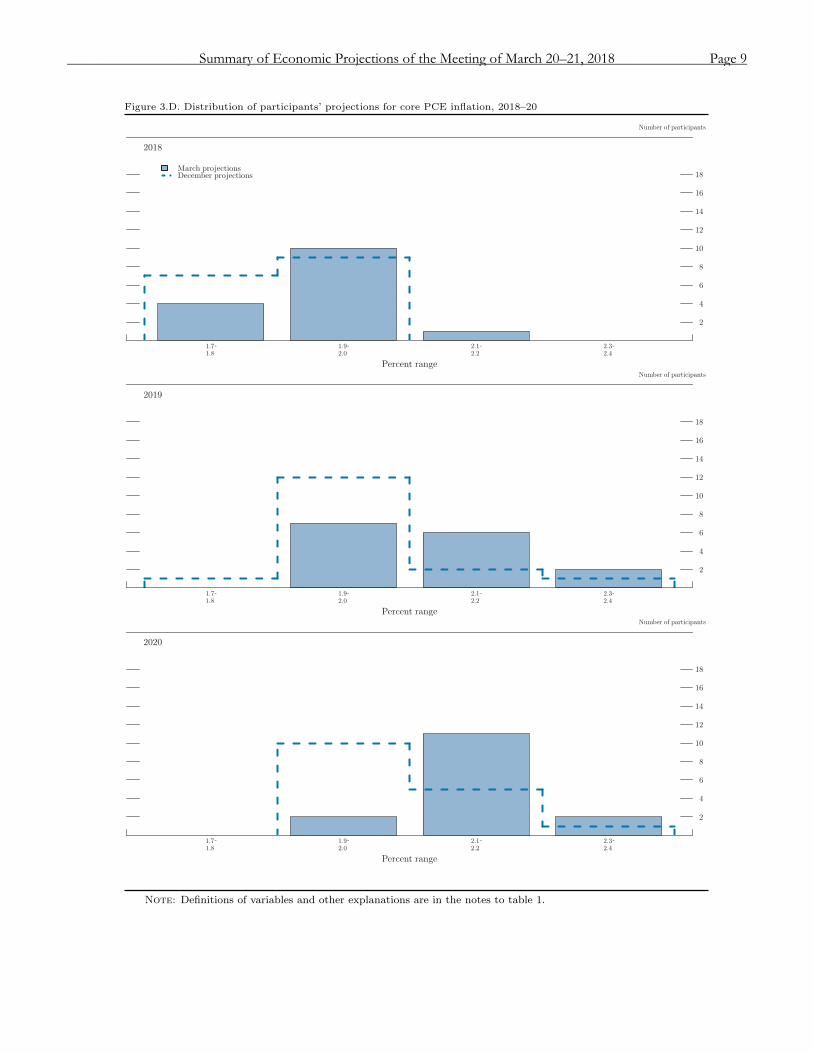
Figure 3.D. Distribution of participants’ projections for core PCE inflation, 2018–20
2018
Number of participants
2
4
6
8
10
12
14
16
18
1.7 1.9 2.1 2.3 1.8 2.0 2.2 2.4
Percent range
March projectionsDecember projections
2019
Number of participants
2
4
6
8
10
12
14
16
18
1.7 1.9 2.1 2.3 1.8 2.0 2.2 2.4
Percent range
2020
Number of participants
2
4
6
8
10
12
14
16
18
1.7 1.9 2.1 2.3 1.8 2.0 2.2 2.4
Percent range
Note: Definitions of variables and other explanations are in the notes to table 1.
Summary of Economic Projections of the Meeting of March 20–21, 2018 Page 9_____________________________________________________________________________________________

Figure 3.E. Distribution of participants’ judgments of the midpoint of the appropriate target range for the federal funds
rate or the appropriate target level for the federal funds rate, 2018–20 and over the longer run
2018
Number of participants
2
4
6
8
10
12
14
16
18
0.88 1.13 1.38 1.63 1.88 2.13 2.38 2.63 2.88 3.13 3.38 3.63 3.88 4.13 4.38 4.63 4.88 1.12 1.37 1.62 1.87 2.12 2.37 2.62 2.87 3.12 3.37 3.62 3.87 4.12 4.37 4.62 4.87 5.12
Percent range
March projectionsDecember projections
2019
Number of participants
2
4
6
8
10
12
14
16
18
0.88 1.13 1.38 1.63 1.88 2.13 2.38 2.63 2.88 3.13 3.38 3.63 3.88 4.13 4.38 4.63 4.88 1.12 1.37 1.62 1.87 2.12 2.37 2.62 2.87 3.12 3.37 3.62 3.87 4.12 4.37 4.62 4.87 5.12
Percent range
2020
Number of participants
2
4
6
8
10
12
14
16
18
0.88 1.13 1.38 1.63 1.88 2.13 2.38 2.63 2.88 3.13 3.38 3.63 3.88 4.13 4.38 4.63 4.88 1.12 1.37 1.62 1.87 2.12 2.37 2.62 2.87 3.12 3.37 3.62 3.87 4.12 4.37 4.62 4.87 5.12
Percent range
Longer run
Number of participants
2
4
6
8
10
12
14
16
18
0.88 1.13 1.38 1.63 1.88 2.13 2.38 2.63 2.88 3.13 3.38 3.63 3.88 4.13 4.38 4.63 4.88 1.12 1.37 1.62 1.87 2.12 2.37 2.62 2.87 3.12 3.37 3.62 3.87 4.12 4.37 4.62 4.87 5.12
Percent range
Note: Definitions of variables and other explanations are in the notes to table 1.
Page 10 Federal Open Market Committee_____________________________________________________________________________________________
Uncertainty and Risks In assessing the path for the federal funds rate that, in their view, is likely to be appropriate, FOMC participants take account of the range of possible economic out-comes, the likelihood of those outcomes, and the poten-tial benefits and costs should they occur. As a reference, table 2 provides measures of forecast uncertainty, based on the forecast errors of various private and government forecasts over the past 20 years, for real GDP growth, the unemployment rate, and total PCE inflation. Those measures are represented graphically in the “fan charts” shown in the top panels of figures 4.A, 4.B, and 4.C. The fan charts display the median SEP projections for the three variables surrounded by symmetric confidence in-tervals derived from the forecast errors reported in ta-ble 2. If the degree of uncertainty attending these pro-jections is similar to the typical magnitude of past fore-cast errors and the risks around the projections are broadly balanced, then future outcomes of these varia-bles would have about a 70 percent probability of being within these confidence intervals. For all three variables, this measure of uncertainty is substantial and generally increases as the forecast horizon lengthens.
Participants’ assessments of the level of uncertainty sur-rounding their individual economic projections are shown in the bottom-left panels of figures 4.A, 4.B, and 4.C. Nearly all participants viewed the degree of uncer-tainty attached to their economic projections about real GDP growth, the unemployment rate, and inflation as broadly similar to the average of the past 20 years, a view that was essentially unchanged from December.3
Because the fan charts are constructed to be symmetric around the median projections, they do not reflect any asymmetries in the balance of risks that participants may see in their economic projections. Participants’ assess-ments of the balance of risks to their economic projec-tions are shown in the bottom-right panels of fig-ures 4.A, 4.B, and 4.C. As in December, most partici-pants judged the risks to their projections of real GDP growth, the unemployment rate, total inflation, and core inflation as broadly balanced—in other words, as broadly consistent with a symmetric fan chart. Partici-pants who saw the risks as skewed typically judged that the balance of risks was tilted toward stronger GDP growth, lower unemployment rates, and higher inflation. Compared with the December SEP, participants’ assess-ments of the balance of risks attending their projections
3 At the end of this summary, the box “Forecast Uncertainty” discusses the sources and interpretation of uncertainty sur-rounding the economic forecasts and explains the approach
Table 2. Average historical projection error ranges Percentage points
Variable 2018 2019 2020 Change in real GDP1 . . . . . . . ±1.5 ±2.0 ±2.0
Unemployment rate1 . . . . . . . ±0.5 ±1.3 ±1.7
Total consumer prices2 . . . . . ±0.9 ±1.0 ±1.1
Short-term interest rates3 . . . . ±0.9 ±2.0 ±2.5 NOTE: Error ranges shown are measured as plus or minus the root
mean squared error of projections for 1998 through 2017 that were re-leased in the spring by various private and government forecasters. As described in the box “Forecast Uncertainty,” under certain assumptions, there is about a 70 percent probability that actual outcomes for real GDP, unemployment, consumer prices, and the federal funds rate will be in ranges implied by the average size of projection errors made in the past. For more information, see David Reifschneider and Peter Tulip (2017), “Gauging the Uncertainty of the Economic Outlook Using His-torical Forecasting Errors: The Federal Reserve’s Approach,” Finance and Economics Discussion Series 2017-020 (Washington: Board of Governors of the Federal Reserve System, February), www.federal reserve.gov/econresdata/feds/2017/files/2017020pap.pdf.
1. Definitions of variables are in the general note to table 1. 2. Measure is the overall consumer price index, the price measure
that has been most widely used in government and private economic forecasts. Projections are percent changes on a fourth quarter to fourth quarter basis.
3. For Federal Reserve staff forecasts, measure is the federal funds rate. For other forecasts, measure is the rate on 3-month Treasury bills. Projection errors are calculated using average levels, in percent, in the fourth quarter.
were little changed overall, with one more participant re-porting that the risks to the unemployment rate were weighted to the downside and two fewer participants re-porting that the risks to either total or core PCE inflation were weighted to the downside.
In discussing the uncertainty and risks surrounding their projections, most participants noted that the magnitude and timing of the economic effects of recent changes in fiscal policy were uncertain or that fiscal policy develop-ments posed upside risks to real economic activity. Most participants also cited trade policy as a source of either uncertainty or downside risk. A few participants noted that a prolonged period of tight labor markets posed risks of higher inflation, could fuel financial imbalances, and might contribute to heightened recession risks.
Participants’ assessments of the appropriate future path of the federal funds rate are also subject to considerable uncertainty. Because the Committee adjusts the federal funds rate in response to actual and prospective devel-opments over time in real GDP growth, the unemploy-ment rate, and inflation, uncertainty surrounding the
used to assess the uncertainty and risks attending the partici-pants’ projections.
Summary of Economic Projections of the Meeting of March 20–21, 2018 Page 11_____________________________________________________________________________________________

Figure 4.A. Uncertainty and risks in projections of GDP growth
Median projection and confidence interval based on historical forecast errors
Change in real GDP
Percent
0
1
2
3
4
2013 2014 2015 2016 2017 2018 2019 2020
Median of projections70% confidence interval
Actual
FOMC participants’ assessments of uncertainty and risks around their economic projections
Uncertainty about GDP growth
Number of participants
2
4
6
8
10
12
14
16
18
Lower Broadly Highersimilar
March projectionsDecember projections
Risks to GDP growth
Number of participants
2
4
6
8
10
12
14
16
18
Weighted to Broadly Weighted todownside balanced upside
March projectionsDecember projections
Note: The blue and red lines in the top panel show actual values and median projected values, respectively, of thepercent change in real gross domestic product (GDP) from the fourth quarter of the previous year to the fourth quarterof the year indicated. The confidence interval around the median projected values is assumed to be symmetric and isbased on root mean squared errors of various private and government forecasts made over the previous 20 years; moreinformation about these data is available in table 2. Because current conditions may differ from those that prevailed,on average, over the previous 20 years, the width and shape of the confidence interval estimated on the basis of thehistorical forecast errors may not reflect FOMC participants’ current assessments of the uncertainty and risks aroundtheir projections; these current assessments are summarized in the lower panels. Generally speaking, participants whojudge the uncertainty about their projections as “broadly similar” to the average levels of the past 20 years would viewthe width of the confidence interval shown in the historical fan chart as largely consistent with their assessments ofthe uncertainty about their projections. Likewise, participants who judge the risks to their projections as “broadlybalanced” would view the confidence interval around their projections as approximately symmetric. For definitions ofuncertainty and risks in economic projections, see the box “Forecast Uncertainty.”
Page 12 Federal Open Market Committee_____________________________________________________________________________________________

Figure 4.B. Uncertainty and risks in projections of the unemployment rate
Median projection and confidence interval based on historical forecast errors
Unemployment rate
Percent
1
2
3
4
5
6
7
8
9
10
2013 2014 2015 2016 2017 2018 2019 2020
Median of projections70% confidence interval
Actual
FOMC participants’ assessments of uncertainty and risks around their economic projections
Uncertainty about the unemployment rate
Number of participants
2
4
6
8
10
12
14
16
18
Lower Broadly Highersimilar
March projectionsDecember projections
Risks to the unemployment rate
Number of participants
2
4
6
8
10
12
14
16
18
Weighted to Broadly Weighted todownside balanced upside
March projectionsDecember projections
Note: The blue and red lines in the top panel show actual values and median projected values, respectively, ofthe average civilian unemployment rate in the fourth quarter of the year indicated. The confidence interval aroundthe median projected values is assumed to be symmetric and is based on root mean squared errors of various privateand government forecasts made over the previous 20 years; more information about these data is available in table 2.Because current conditions may differ from those that prevailed, on average, over the previous 20 years, the widthand shape of the confidence interval estimated on the basis of the historical forecast errors may not reflect FOMCparticipants’ current assessments of the uncertainty and risks around their projections; these current assessments aresummarized in the lower panels. Generally speaking, participants who judge the uncertainty about their projections as“broadly similar” to the average levels of the past 20 years would view the width of the confidence interval shown in thehistorical fan chart as largely consistent with their assessments of the uncertainty about their projections. Likewise,participants who judge the risks to their projections as “broadly balanced” would view the confidence interval aroundtheir projections as approximately symmetric. For definitions of uncertainty and risks in economic projections, see thebox “Forecast Uncertainty.”
Summary of Economic Projections of the Meeting of March 20–21, 2018 Page 13_____________________________________________________________________________________________
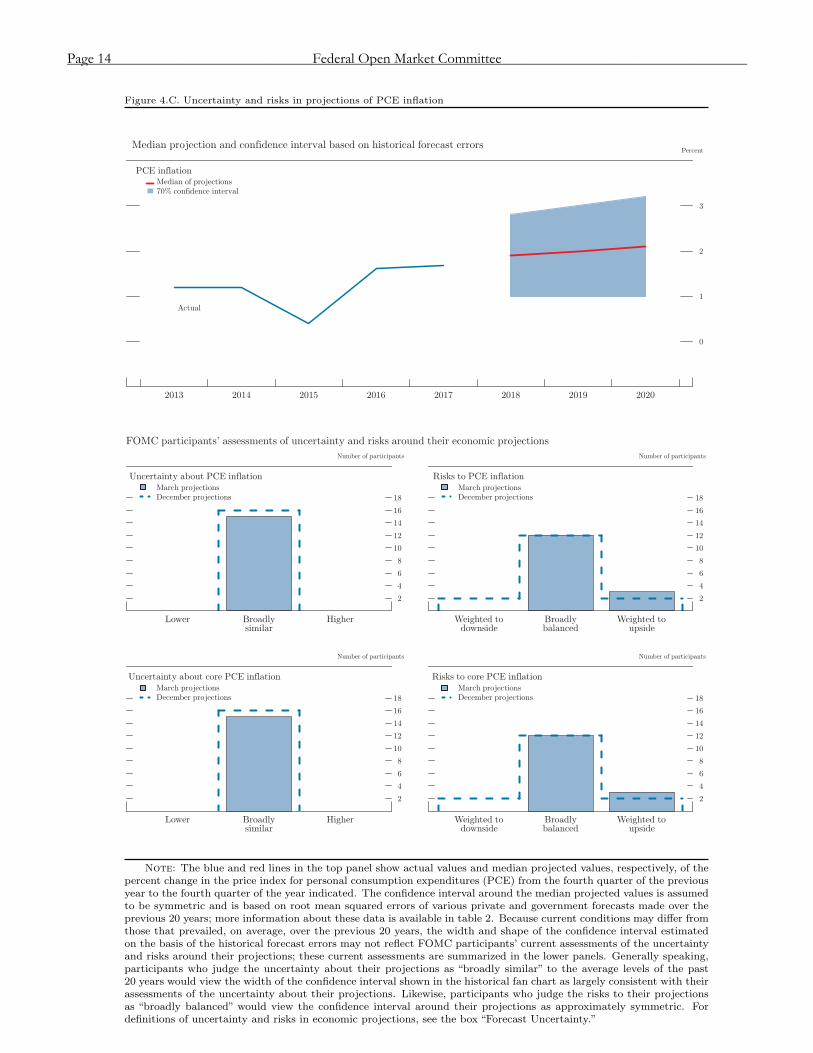
Figure 4.C. Uncertainty and risks in projections of PCE inflation
Median projection and confidence interval based on historical forecast errors
PCE inflation
Percent
0
1
2
3
2013 2014 2015 2016 2017 2018 2019 2020
Median of projections70% confidence interval
Actual
FOMC participants’ assessments of uncertainty and risks around their economic projections
Uncertainty about PCE inflation
Number of participants
2
4
6
8
10
12
14
16
18
Lower Broadly Highersimilar
March projectionsDecember projections
Uncertainty about core PCE inflation
Number of participants
2
4
6
8
10
12
14
16
18
Lower Broadly Highersimilar
March projectionsDecember projections
Risks to PCE inflation
Number of participants
2
4
6
8
10
12
14
16
18
Weighted to Broadly Weighted todownside balanced upside
March projectionsDecember projections
Risks to core PCE inflation
Number of participants
2
4
6
8
10
12
14
16
18
Weighted to Broadly Weighted todownside balanced upside
March projectionsDecember projections
Note: The blue and red lines in the top panel show actual values and median projected values, respectively, of thepercent change in the price index for personal consumption expenditures (PCE) from the fourth quarter of the previousyear to the fourth quarter of the year indicated. The confidence interval around the median projected values is assumedto be symmetric and is based on root mean squared errors of various private and government forecasts made over theprevious 20 years; more information about these data is available in table 2. Because current conditions may differ fromthose that prevailed, on average, over the previous 20 years, the width and shape of the confidence interval estimatedon the basis of the historical forecast errors may not reflect FOMC participants’ current assessments of the uncertaintyand risks around their projections; these current assessments are summarized in the lower panels. Generally speaking,participants who judge the uncertainty about their projections as “broadly similar” to the average levels of the past20 years would view the width of the confidence interval shown in the historical fan chart as largely consistent with theirassessments of the uncertainty about their projections. Likewise, participants who judge the risks to their projectionsas “broadly balanced” would view the confidence interval around their projections as approximately symmetric. Fordefinitions of uncertainty and risks in economic projections, see the box “Forecast Uncertainty.”
Page 14 Federal Open Market Committee_____________________________________________________________________________________________
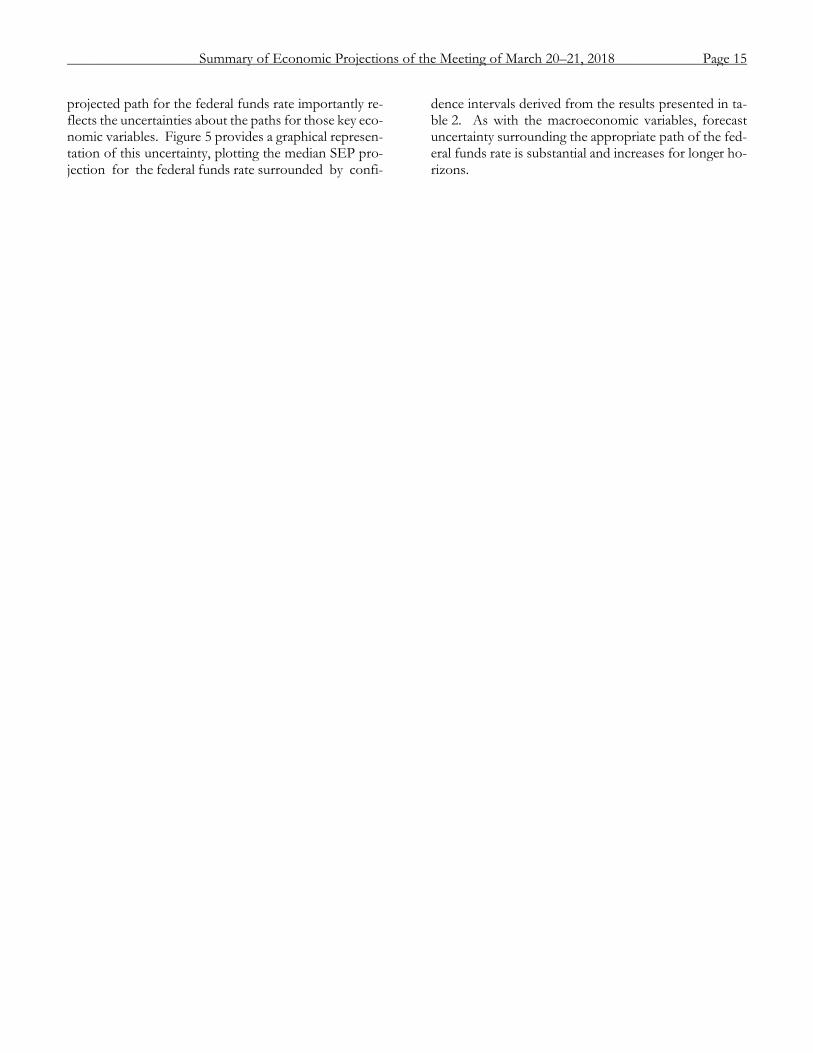
projected path for the federal funds rate importantly re-flects the uncertainties about the paths for those key eco-nomic variables. Figure 5 provides a graphical represen-tation of this uncertainty, plotting the median SEP pro-jection for the federal funds rate surrounded by confi-
dence intervals derived from the results presented in ta-ble 2. As with the macroeconomic variables, forecast uncertainty surrounding the appropriate path of the fed-eral funds rate is substantial and increases for longer ho-rizons.
Summary of Economic Projections of the Meeting of March 20–21, 2018 Page 15_____________________________________________________________________________________________
Figure 5. Uncertainty in projections of the federal funds rate
Median projection and confidence interval based on historical forecast errors
Federal funds rate
Percent
0
1
2
3
4
5
6
2013 2014 2015 2016 2017 2018 2019 2020
Midpoint of target rangeMedian of projections70% confidence interval*
Actual
Note: The blue and red lines are based on actual values and median projected values, respectively, of the Com-mittee’s target for the federal funds rate at the end of the year indicated. The actual values are the midpoint of thetarget range; the median projected values are based on either the midpoint of the target range or the target level.The confidence interval around the median projected values is based on root mean squared errors of various privateand government forecasts made over the previous 20 years. The confidence interval is not strictly consistent with theprojections for the federal funds rate, primarily because these projections are not forecasts of the likeliest outcomes forthe federal funds rate, but rather projections of participants’ individual assessments of appropriate monetary policy.Still, historical forecast errors provide a broad sense of the uncertainty around the future path of the federal funds rategenerated by the uncertainty about the macroeconomic variables as well as additional adjustments to monetary policythat may be appropriate to offset the effects of shocks to the economy.
The confidence interval is assumed to be symmetric except when it is truncated at zero—the bottom of the lowesttarget range for the federal funds rate that has been adopted in the past by the Committee. This truncation wouldnot be intended to indicate the likelihood of the use of negative interest rates to provide additional monetary policyaccommodation if doing so was judged appropriate. In such situations, the Committee could also employ other tools,including forward guidance and large-scale asset purchases, to provide additional accommodation. Because currentconditions may differ from those that prevailed, on average, over the previous 20 years, the width and shape of theconfidence interval estimated on the basis of the historical forecast errors may not reflect FOMC participants’ currentassessments of the uncertainty and risks around their projections.
* The confidence interval is derived from forecasts of the average level of short-term interest rates in the fourthquarter of the year indicated; more information about these data is available in table 2. The shaded area encompassesless than a 70 percent confidence interval if the confidence interval has been truncated at zero.
Page 16 Federal Open Market Committee_____________________________________________________________________________________________
Forecast Uncertainty The economic projections provided by the members of
the Board of Governors and the presidents of the Federal Reserve Banks inform discussions of monetary policy among policymakers and can aid public understanding of the basis for policy actions. Considerable uncertainty attends these projections, however. The economic and statistical models and relationships used to help produce economic forecasts are necessarily imperfect descriptions of the real world, and the future path of the economy can be affected by myriad unforeseen developments and events. Thus, in setting the stance of monetary policy, participants consider not only what appears to be the most likely economic outcome as em-bodied in their projections, but also the range of alternative possibilities, the likelihood of their occurring, and the poten-tial costs to the economy should they occur.
Table 2 summarizes the average historical accuracy of a range of forecasts, including those reported in past Monetary Policy Reports and those prepared by the Federal Reserve Board’s staff in advance of meetings of the Federal Open Market Committee (FOMC). The projection error ranges shown in the table illustrate the considerable uncertainty as-sociated with economic forecasts. For example, suppose a participant projects that real gross domestic product (GDP) and total consumer prices will rise steadily at annual rates of, respectively, 3 percent and 2 percent. If the uncertainty at-tending those projections is similar to that experienced in the past and the risks around the projections are broadly bal-anced, the numbers reported in table 2 would imply a prob-ability of about 70 percent that actual GDP would expand within a range of 1.5 to 4.5 percent in the current year and 1.0 to 5.0 percent in the second and third years. The corre-sponding 70 percent confidence intervals for overall infla-tion would be 1.1 to 2.9 percent in the current year, 1.0 to 3.0 percent in the second year, and 0.9 to 3.1 percent in the third year. Figures 4.A through 4.C illustrate these confi-dence bounds in “fan charts” that are symmetric and cen-tered on the medians of FOMC participants’ projections for GDP growth, the unemployment rate, and inflation. How-ever, in some instances, the risks around the projections may not be symmetric. In particular, the unemployment rate can-not be negative; furthermore, the risks around a particular projection might be tilted to either the upside or the down-side, in which case the corresponding fan chart would be asymmetrically positioned around the median projection.
Because current conditions may differ from those that prevailed, on average, over history, participants provide judgments as to whether the uncertainty attached to their projections of each economic variable is greater than, smaller than, or broadly similar to typical levels of forecast uncer-tainty seen in the past 20 years, as presented in table 2 and reflected in the widths of the confidence intervals shown in the top panels of figures 4.A through 4.C. Participants’ cur-rent assessments of the uncertainty surrounding their projec-
tions are summarized in the bottom-left panels of those fig-ures. Participants also provide judgments as to whether the risks to their projections are weighted to the upside, are weighted to the downside, or are broadly balanced. That is, while the symmetric historical fan charts shown in the top panels of figures 4.A through 4.C imply that the risks to par-ticipants’ projections are balanced, participants may judge that there is a greater risk that a given variable will be above rather than below their projections. These judgments are summa-rized in the lower-right panels of figures 4.A through 4.C.
As with real activity and inflation, the outlook for the future path of the federal funds rate is subject to considerable uncertainty. This uncertainty arises primarily because each participant’s assessment of the appropriate stance of mone-tary policy depends importantly on the evolution of real ac-tivity and inflation over time. If economic conditions evolve in an unexpected manner, then assessments of the appropri-ate setting of the federal funds rate would change from that point forward. The final line in table 2 shows the error ranges for forecasts of short-term interest rates. They suggest that the historical confidence intervals associated with projections of the federal funds rate are quite wide. It should be noted, however, that these confidence intervals are not strictly con-sistent with the projections for the federal funds rate, as these projections are not forecasts of the most likely quarterly out-comes but rather are projections of participants’ individual as-sessments of appropriate monetary policy and are on an end-of-year basis. However, the forecast errors should provide a sense of the uncertainty around the future path of the federal funds rate generated by the uncertainty about the macroeco-nomic variables as well as additional adjustments to monetary policy that would be appropriate to offset the effects of shocks to the economy.
If at some point in the future the confidence interval around the federal funds rate were to extend below zero, it would be truncated at zero for purposes of the fan chart shown in figure 5; zero is the bottom of the lowest target range for the federal funds rate that has been adopted by the Committee in the past. This approach to the construction of the federal funds rate fan chart would be merely a convention; it would not have any implications for possible future policy decisions regarding the use of negative interest rates to pro-vide additional monetary policy accommodation if doing so were appropriate. In such situations, the Committee could also employ other tools, including forward guidance and asset purchases, to provide additional accommodation.
While figures 4.A through 4.C provide information on the uncertainty around the economic projections, figure 1 provides information on the range of views across FOMC participants. A comparison of figure 1 with figures 4.A through 4.C shows that the dispersion of the projections across participants is much smaller than the average forecast errors over the past 20 years.
Summary of Economic Projections of the Meeting of March 20–21, 2018 Page 17_____________________________________________________________________________________________