minnesota school readiness study - minnesota legislature · the minnesota school readiness study:...
TRANSCRIPT

Minnesota School Readiness Study:
Developmental Assessment at Kindergarten Entrance
Fall 2010
This document is made available electronically by the Minnesota Legislative Reference Library as part of an ongoing digital archiving project. http://www.leg.state.mn.us/lrl/lrl.asp

Acknowledgements
Minnesota School Readiness Study: Developmental Assessment at Kindergarten Entrance The Minnesota School Readiness Study: Developmental Assessment at Kindergarten
Entrance Fall 2010 was planned, implemented, and the report prepared by the Minnesota
Department of Education (MDE).
Special thanks to the 108 elementary schools involved in the study, their principals,
kindergarten teachers, support staff and superintendents. The observation and collection
of developmental information by teachers on kindergarten children in the classroom was
essential to the study and is much appreciated.
All analyses in this report were conducted by the Human Capital Research Collaborative
(HCRC), a partnership between the University of Minnesota and the Federal Reserve
Bank of Minneapolis.
For more information, contact Avisia Whiteman at [email protected] or
651-582-8329 or Eileen Nelson at [email protected] or 651-582-8464. Ama nda
Varley, University of Minnesota Graduate School intern, also provided significant
support to t he project.
Date of Report: November 2011
Background
Minnesota School Readiness Study: Developmental
Assessment at Kindergarten Entrance - Fall 2010
Research has shown, and continues to show, that t here is a critical relationship between
early childhood experiences, school success, and positive life-long outcomes. This
research has been a focal point for many states as they strive to reduce the growing
achievement gap between less advantaged students and their same-aged peers in the
educational system.
With no systematic process in place to assess children’s
school readiness, the Min nesota Department of Education
(MDE) in 2002 initiated a series of three yearly studies
focused on obtaining a picture of the school readiness of a
representative sample of Minnesota entering
kindergartners. Also, the series of studies was to evaluate
changes in the percentage of children fully prepared for
school at kindergarten entrance. The studies were well-
received by the public, and during the 2006 Minnesota
state legislative session, funding was appropriated for the
study to be continued on an annual basis.
This report describes findings from the assessment of
school readiness usin g a representative sample of children
entering kindergarten in Minnesota in Fall 2010. The data
provide a picture of the ratings of entering kindergartners across five domains of child
development. The study provides information on school readiness for parents; school
teachers and administrators; early childhood education and care teachers, pr oviders and
administrators; policymakers; and the public.
Definition of School Readiness
For purposes of the study, “school readiness” is defined as the skills, knowledge,
behaviors and accomplishments that children should know and be able to do as they enter
kindergarten in the following areas of child development: physical development; the arts;
personal and social development; language and literacy; and mathematical thinking.
Assessing School Readiness
The study is designed to capture a picture of the readiness of Minnesota children as they
enter kindergarten and track readiness trends over time. To ensure that results are reliable
and can be generalized to the entire population of Minnesota kindergartners, the study
uses a 10 percent sample of schools with entering kindergartners. This sample size
generates data from approximately 6,000 kindergartners annually.

Minnesota School Readiness Study 2010
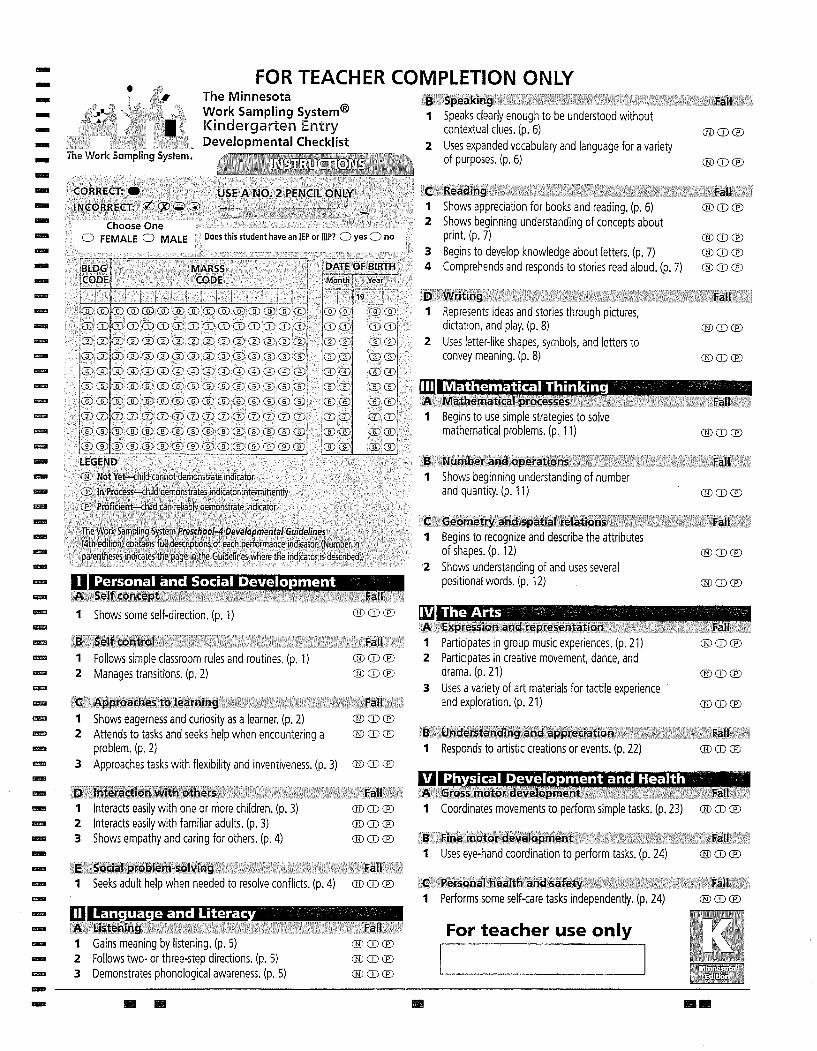
The study uses the Work Sampling System (WSS®), a developmentally appropriate,
standards-based observational assessment that allows children to demonstrate their
knowledge and skills in various ways and across developmental domains.
WSS® is aligned with the state’s early learning standards, Minnesota Early Childhood
Indicators of Progress, and the K-12 Academic Standards. S ee Appendix A.
Each domain and developmental indicator within the WSS® Developmental Checklist
includes expected behaviors for children at that age or grade level. For each indicator,
teachers used the following guidelines to rate the child's performance:
Proficient — indicating that the child can reliably and consistently demonstrate the skill,
knowledge, behavior or accomplishment represented by the performance indicator.
In Process — indicating that the skill, knowledge, behavior or accomplishment
represented by the indicator are intermittent or emergent, and are not demonstrated
reliably or consistently.
Not Yet — indicating that the child cannot perform the indicator (i.e., the performance
indicator represents a skill, knowledge, behavior or accomplishment not yet acquired).
Because children’s rate of development is variable, the study assesses children’s
proficiency within and across the developmental domains.
Rubrics for each rating level were distributed to teachers at the start of the study. The
rubrics, provided by the publisher and revised in 2009, provide additional detail for each
indicator for a Not Yet, In Process or Proficient rating.
Partnership with the Human Capital Research Collaborative
Throughout 2010, MDE worked in
partnership with the Human Capital
Research Collaborative (HCRC) to better
understand the relationship between
kindergarten entry results and future
academic achievement. HCRC is a
partnership of the University of Minnesota
and the Federal Reserve Bank of
Minneapolis. It was important to assess the
predictive validity of Minnesota’s school
readiness indicators and determine the
degree to which the School Readiness Study checklist added additional weight beyond
demographics towards the likelihood of passing Grade 3 MCAs. Work was conducted to
determine which type of measure from the checklist best predicted Grade 3 MCA results.
Findings centered on children who reach 75 percent of the total possible points on the
checklist having a greater likelihood in passing Grade 3 MCAs. W hile national research
2
Minnesota School Readiness Study 2010
over decades has pointed to the relationship between early experiences and academic
success, it is instructive to have a reference standard within the existing checklist.
Based on data from Kindergarten cohorts in 2003, 2004, and 2006 who had available
achievement test scores in third grade or information on remedial education, HCRC
found that the School Readiness Study checklist, including the 75 percent standard,
significantly and consistently predicted third-grade MCA reading and math test scores
and the need for school remedial services (special education or grade retention) above
and beyond the influence of child and family background characteristics. The strength of
prediction was consistent across a range of child and family characteristics (e.g., family
income, gender, and race/ethnicity). For more information on this report, go to:
http://www.humancapitalrc.org/mn_school_readiness_indicators.pdf
2010 Recr uitment
MDE contacted superintendents, principals and teachers beginning mid-winter to build
the sample for the coming fall. A list of all public schools with kindergartners as of
October 1 the previous year was compiled. The list was divided into eight strata which
accounts for proximity to population centers and population density and separated
charter and magnet schools. A representative sample of schools within each strata was
invited to participate via a mailed invitation to the superintendent and principal of each
site. Follow-up calls were made to each site to answer questions. In 2010, 55 percent
(495/900) of all schools were invited to participate. Approximately 24 pe rcent (120/495)
of those invited responded positively to the initial invitation. In late spring, schools are
selected to be released from the cohort when student counts exceed the sample amount.
In 2010, no s chools were released. By November, 12 pe rcent of all elementary schools
(108/900) submitted child-level data.
The following table shows the total kindergarten population compared to the sample
population. The sample seeks to be representative of all public schools including charters
and magnets across federally mandated demographic categories. (See Table 1.)
3
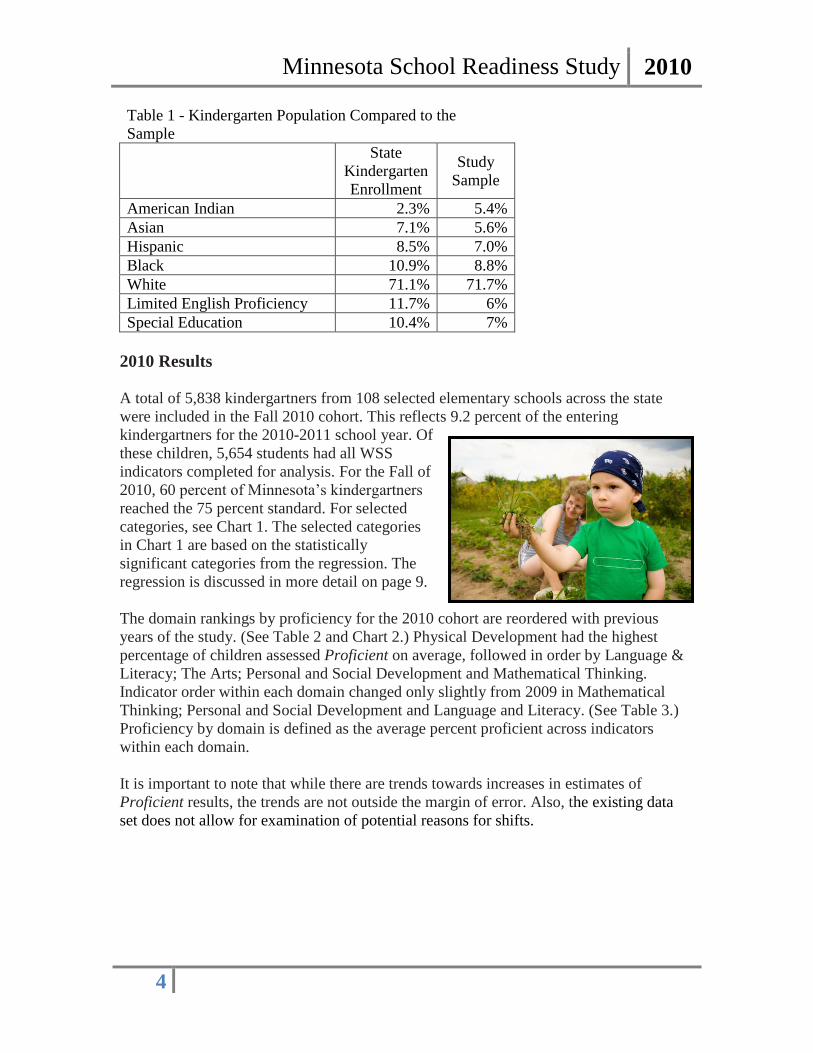
Table 1 - Kindergarten Population Compared to the
Sample
State Study
Kindergarten Sample
Enrollment
American Indian 2.3% 5.4%
Asian 7.1% 5.6%
Hispanic 8.5% 7.0%
Black 10.9% 8.8%
White 71.1% 71.7%
Limited English Proficiency 11.7% 6%
Special Education 10.4% 7%
2010 Res ults
A total of 5,838 kinder gartners from 108 se lected elementary schools across the state
were included in the Fall 2010 cohort. This reflects 9.2 pe rcent of the entering
kindergartners for the 2010-2011 sc hool year. Of
these children, 5,654 students had all WSS
indicators completed for analysis. For the Fall of
2010, 60 percent of Minnesota’s kindergartners
reached the 75 percent standard. For selected
categories, see Chart 1. The selected categories
in Chart 1 are based on the statistically
significant categories from the regression. The
regression is discussed in more detail on page 9.
The domain rankings by proficiency for the 2010 cohort are reordered with previous
years of the study. (See Table 2 and Chart 2.) Physical Development had the highest
percentage of children assessed Proficient on average, followed in order by Language &
Literacy; The Arts; Personal and Social Development and Mathematical Thinking.
Indicator order within each domain changed only slightly from 2009 in Mathematical
Thinking; Personal and Social Development and Language and Literacy. ( See Table 3.)
Proficiency by domain is defined as the average percent proficient across indicators
within each domain.
It is important to note that while there are trends towards increases in estimates of
Proficient results, the trends are not outside the margin of error. Also, the existing data
set does not allow for examination of potential reasons for shifts.
Minnesota School Readiness Study 2010
4
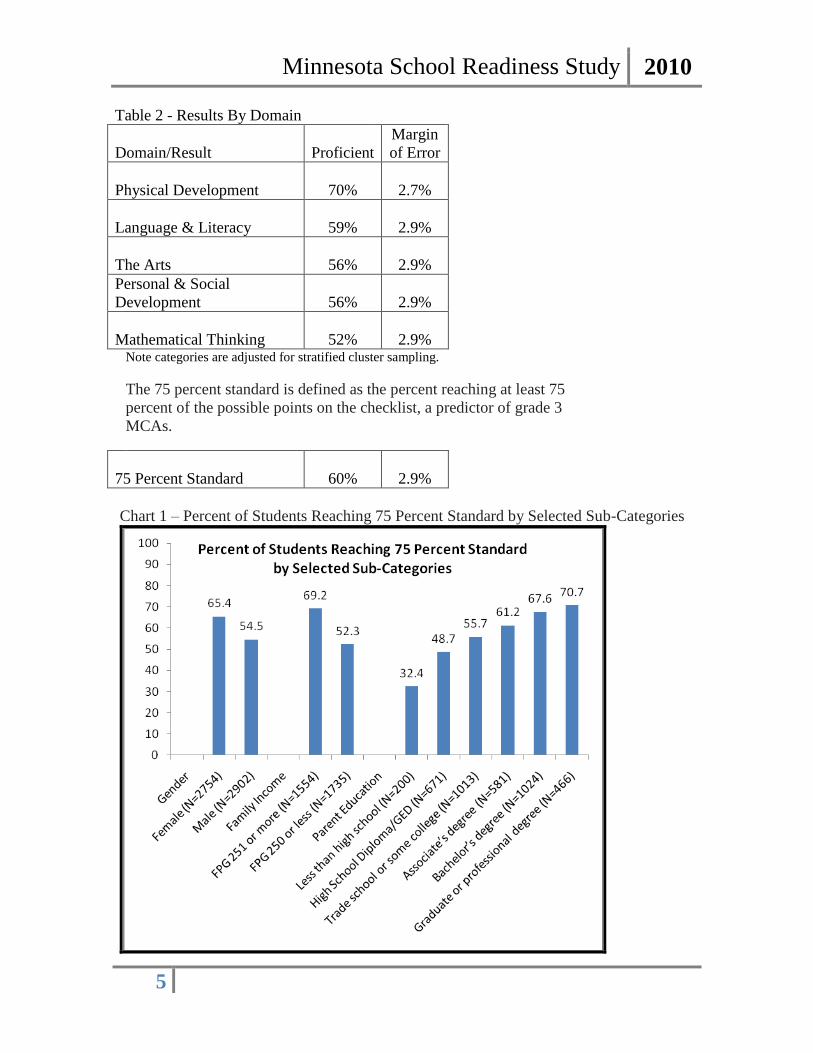
Table 2 - Results By Domain
Margin
Domain/Result Proficient of Error
Physical Development 70% 2.7%
Language & Literacy 59% 2.9%
The Arts 56% 2.9%
Personal & Social
Development 56% 2.9%
Mathematical Thinking 52% 2.9% Note categories are adjusted for stratified cluster sampling.
75 Percent Standard 60% 2.9%
Chart 1 – Percent of Students Reaching 75 Percent Standard by Selected Sub-Cate
Minnesota School Readiness Study 2010
The 75 percent standard is defined as the percent reaching at least 75
percent of the possible points on the checklist, a predictor of grade 3
MCAs.
gories
5
Minnesota School Readiness Study 2010
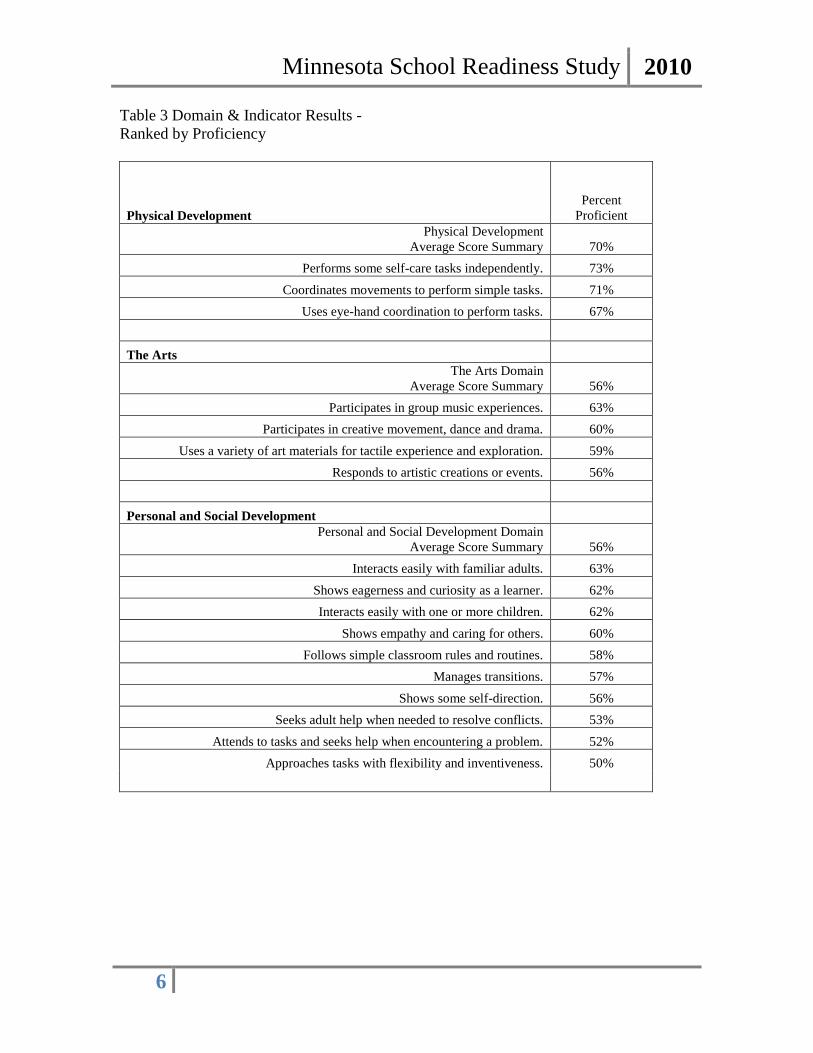
Table 3 Domain & Indicator Results
Ranked by Proficiency
Percent
Physical Development Proficient
Physical Development
Average Score Summary 70%
Performs some self-care tasks independently. 73%
Coordinates movements to perform simple tasks. 71%
Uses eye-hand coordination to perform tasks. 67%
The Arts
The Arts Domain
Average Score Summary 56%
Participates in group music experiences. 63%
Participates in creative movement, dance and drama. 60%
Uses a variety of art materials for tactile experience and exploration. 59%
Responds to artistic creations or events. 56%
Personal and Social Development
Personal and Social Development Domain
Average Score Summary 56%
Interacts easily with familiar adults. 63%
Shows eagerness and curiosity as a learner. 62%
Interacts easily with one or more children. 62%
Shows empathy and caring for others. 60%
Follows simple classroom rules and routines. 58%
Manages transitions. 57%
Shows some self-direction. 56%
Seeks adult help when needed to resolve conflicts. 53%
Attends to tasks and seeks help when encountering a problem. 52%
Approaches tasks with flexibility and inventiveness. 50%
6
Minnesota School Readiness Study 2010
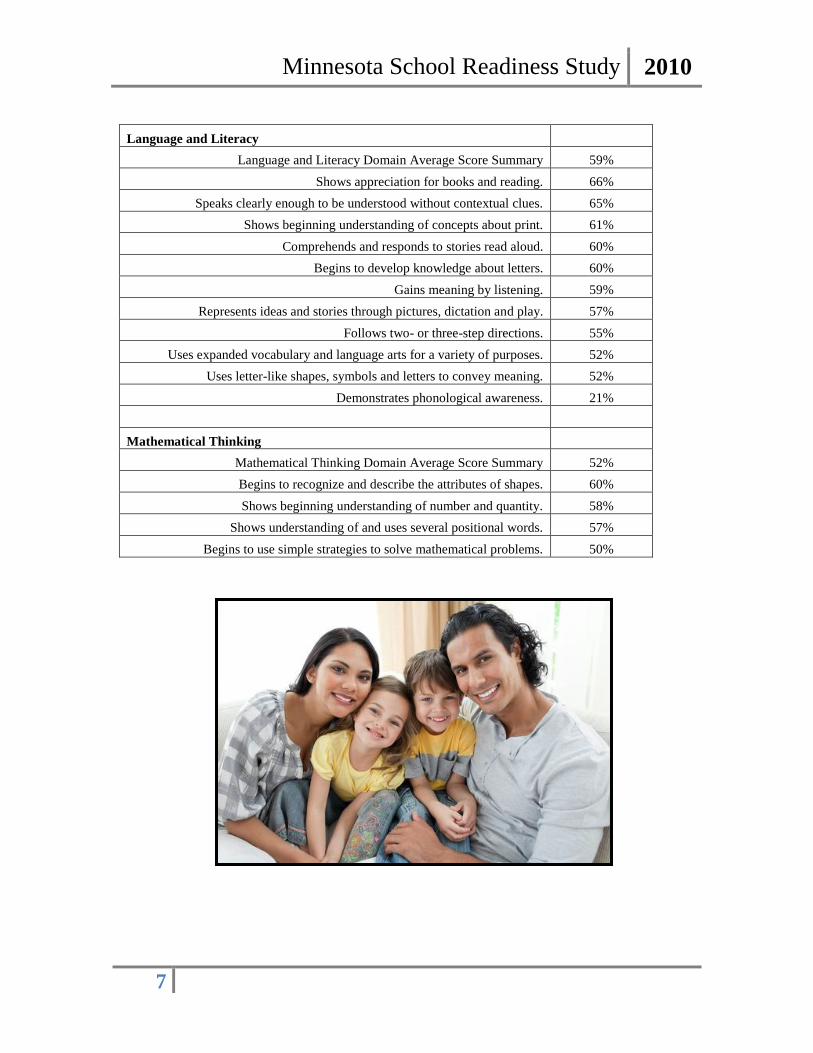
Language and Literacy
Language and Literacy Domain Average Score Summary 59%
Shows appreciation for books and reading. 66%
Speaks clearly enough to be understood without contextual clues. 65%
Shows beginning understanding of concepts about print. 61%
Comprehends and responds to stories read aloud. 60%
Begins to develop knowledge about letters. 60%
Gains meaning by listening. 59%
Represents ideas and stories through pictures, dictation and play. 57%
Follows two- or three-step directions. 55%
Uses expanded vocabulary and language arts for a variety of purposes. 52%
Uses letter-like shapes, symbols and letters to convey meaning. 52%
Demonstrates phonological awareness. 21%
Mathematical Thinking
Mathematical Thinking Domain Average Score Summary 52%
Begins to recognize and describe the attributes of shapes. 60%
Shows beginning understanding of number and quantity. 58%
Shows understanding of and uses several positional words. 57%
Begins to use simple strategies to solve mathematical problems. 50%
7
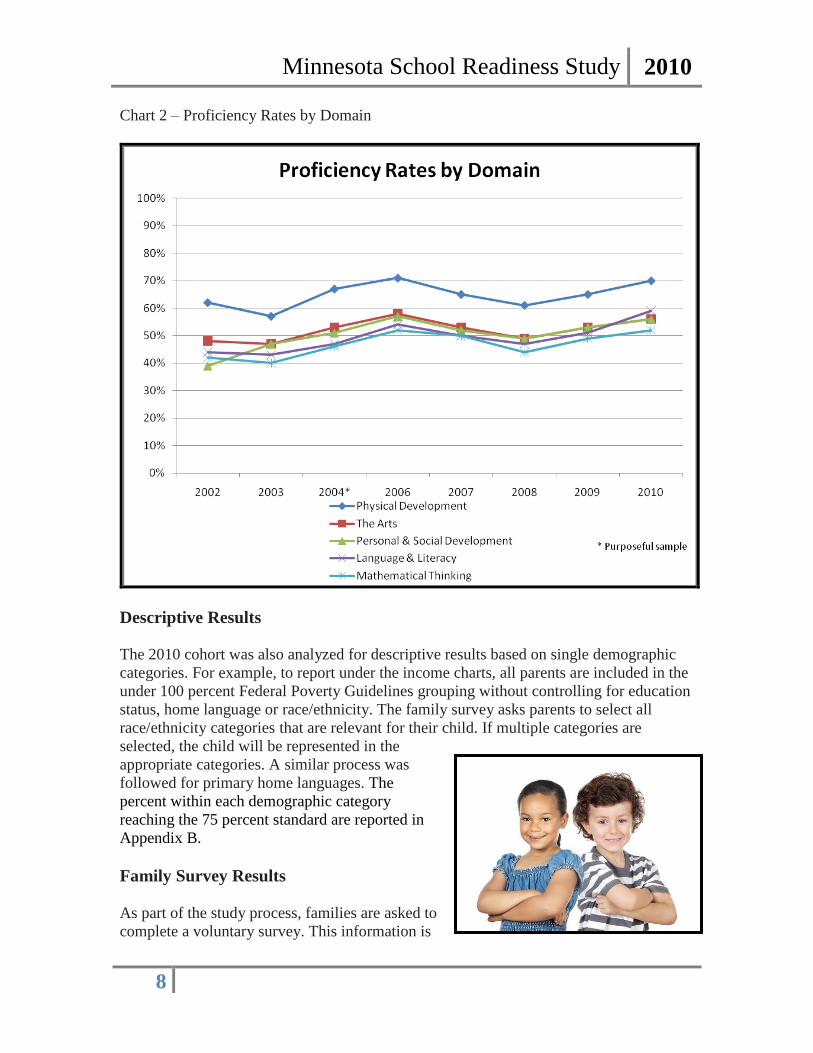
Chart 2 – Proficiency Rates by Domain
Minnesota School Readiness Study 2010
Descriptive Results
The 2010 c ohort was also analyzed for descriptive results based on single demographic
categories. For example, to report under the income charts, all parents are included in the
under 100 percent Federal Poverty Guidelines grouping without controlling for education
status, home language or race/ethnicity. The family survey asks parents to select all
race/ethnicity categories that are relevant for their child. If multiple categories are
selected, the child will be represented in the
appropriate categories. A similar process was
followed for primary home languages. The
percent within each demographic category
reaching the 75 percent standard are reported in
Appendix B.
Family Survey Results
As part of the study process, families are asked to
complete a voluntary survey. This information is
8
Minnesota School Readiness Study 2010
combined with the Work Sampling System® checklist results (see Appendix C). I n total,
4,932 pa rents (84 p ercent) completed the survey. Of this group, 4,695 responses (95
percent) were usable for analysis. (A parent survey may not be usable for analysis
because it was incomplete, the student information strip was incomplete or the survey
lacked coordinating information in Work Sampling Online (WSO).) After matching the
family survey data with Work Sampling Online results, 4,168 re cords remained for
regression analysis. This is 85 pe rcent of all submitted parent surveys and 89 pe rcent of
those available to match.
Logistic Regression Results
The analysis of the data included examining how a particular child or family
characteristic may affect that child’s ratings while controlling for the effects of other
demographic variables with which it may be confounded (e.g., a child from a family with
a lower household income is more likely to have a parent with a lower education level).
The result of reaching the 75 percent proficiency standard across all domains was
analyzed with respect to the demographic characteristics of gender, parent education
level, household income, primary home language and race and ethnicity collected from
parent surveys. (See Table 4 and Appendix D.) For comparison to previous years, see
Appendix E.
All 2010 a nalyses reported involved statistical estimation procedures that reflect the
stratified cluster sampling design used (with school as the primary sampling unit), and
include correction for finite population sampling. Observations within each stratum were
weighted to reflect the statewide proportion of students in the stratum.
Table 4 - Statistically Significant Factors in Reaching the 75 Percent Standard
Household Income
Parent Education Level
Gender Note: predictors significant at p < .05
Household Income
The odds of reaching the 75 percent standard for a student whose household income was
at or above 400 percent of the Federal Poverty Guidelines (FPG) were more than one and
a half times as great as compared to a
student whose household income was less
than 250 pe rcent FPG when holding all
other variables constant. The odds of
reaching the 75 percent standard for a
student whose household income was 250
400 percent FPG are nearly one and half
times as great as compared to a student
whose household income is up to 250
9
percent FPG. This result is statistically
significant.
Parent Education Level
Parent education level was found to be
statistically significant in reaching the 75 percent
standard. Students whose parents have a high
school degree a re twice as likely to reach the 75
percent standard as compared to students whose parents have less than a high school
degree. Students with parents who have a an Associate degree, Bachelor or graduate
degree are approximately one and a half ti mes as likely to reach the 75 percent standard
as compared to students whose parents who have a high school diploma or GED.
Primary Home Language
Primary home language was not found to be statistically significant in reaching the 75
percent standard when holding all other variables constant.
Race and Ethnicity
Parent-report of race and ethnicity was not a statistically significant factor in reaching the
75 percent standard when holding all other variables constant. Minority status as an
overall category was marginally significant.
Gender
Gender continues to be a statistically significant factor. The odds of reaching the 75
percent standard for females were up to one and a third times g reater, as compared to
males.
Principal and Teacher Surveys
As in previous years, the success of the study rested with the willingness of school
principals and kindergarten teachers to participate. Participating school principals and
kindergarten teachers w ere again given surveys to complete regarding their decision to
participate, barriers to participation, and the associated workload and benefits. The
following information is based upon the response of 35 pr incipals (108 possible
responses or 32 p ercent) and 165 kinder garten teachers (288 potential responses or 57
percent).
Principal Perspectives
Principals reported two primary benefits of participating in the study: helping influence
statewide policy (100 percent) and gaining information about where students are at the
beginning of the school year (69 percent). Reported barriers for participation included
Minnesota School Readiness Study 2010
10
adding to existing teacher workloads (63 p ercent). Principals balanced the need of the
project with competing needs by having more experienced teachers mentor newer
teachers, paying teachers for their extra time and shifting staff development resources.
Principals will use the information gained from the study to identify children’s needs
earlier in the year (50 pe rcent). Principals using Work Sampling Online (WSO) reported
that the online training was easy to access. A m ajority of principals (84 pe rcent) reported
receiving the appropriate amount of information prior to and during their participation.
Teacher Perspectives
A vast majority of teachers (86 pe rcent) responded that contributing to a study that will
influence statewide early childhood policy was of benefit to them. The same percent
reported receiving a $200 stipend as a benefit. Others reported the benefit of gaining
information about where students are at the beginning of the school year (68 percent). A
little over one-third of the teachers reported that collecting the parent surveys was a
challenge for them (37 percent). On a follow-up question, 80 pe rcent responded that they
were able to implement the parent survey with great to moderate ease. Thirty-one percent
had no challenges implementing the study. Teachers reported that the study took a
minimal (12 pe rcent) to average (72 pe rcent)
amount of work for a special project.
Teachers report planning to use the
information to identify children’s needs
earlier in the year (46 pe rcent) and helping
them target instruction (47 percent).
Regarding the use of technology, 96 percent
report great to moderate ease in accessing
WSO and the Web-based orientation.
Teachers report receiving adequate levels of information prior to (95 pe rcent) and during
the study (98 p ercent). They also report receiving adequate support from MDE (92
percent) throughout the study period. Currently, 28 percent of teachers use Work
Sampling in their schools, 35 pe rcent report planning to continue using WSO after the
study period. Approximately one-third of all teachers report using locally designed
assessment tools in additional to the Work Sampling System®.
Limitations
Because children develop and grow along a continuum but at varied ra tes, the goal of the
study is to assess children’s proficiency within and across these developmental domains
over time and not establish whether or not children, individually or in small groups, are
ready for school with the use of a “ready” or “not ready” score. Nor is the study’s goal to
provide information on the history or the future of an individual student.
Recent national reports have discussed the complexities in the development of state-level
accountability systems. Taking Stock: Assessing and Improving Early Childhood
Minnesota School Readiness Study 2010
11

Learning and Program Quality (2007) and The National Academy of Science report Early
Childhood Assessment: Why, What and How? (2008) details the necessary steps to use
authentic assessment results, also referred to as instructional assessments, in
accountability initiatives. The National Academy of Science reports that even in upper
grades, e xtreme caution is needed in relying exclusively on child assessment and that for
children birth to five “even more extreme caution is needed.”
Discussion
In line with national research, family household income and parent education was found
to be predictive in reaching the 75 percent standard. Race/Ethnicity as an overall category
was marginally significant but not significant for individual groups and G ender is
predictive in reaching the 75 percent standard.
Recommendations
1. Continue to work toward improving the quality of early childhood education and care
programs in Minnesota by emphasizing the importance of teacher-child interactions and
content-driven, intentional curriculum and instruction. Build on the 10 Essential Elements
of Effective Early Childhood Programs and Governor Dayton’s 7-Point Plan for
Achieving Excellence.
2. Target intervention strategies to children assessed as Not Proficient, especially in the
areas of literacy and mathematics. Implement compensatory strategies as soon as a
child’s need is identified. Work with the Governor’s Early Learning Council to identify
staged implementation strategies to maximize resources.
3. Support more children in their efforts to read well by third grade by focusing state
policies on young children’s language and literacy
development.
4. Strengthen teacher-child interactions to improve
learning by implementing professional development
that includes teacher observation and development.
5. Individualize instruction by using assessment
information to design classroom experiences.
6. Use child progress assessment information when
teachers talk with parents about setting goals for
children.
7. Increase collaborations from early childhood
through Grade 3 at the teacher, director, principal and
superintendent levels. Identify district and state
policy opportunities to promote this work.
12
Minnesota School Readiness Study 2010
8. Consider collecting information on prior early care and education experiences and
incorporating that information into the early childhood longitudinal data system. Results
from the 2010 prior experience data pilot need to be considered when planning for the
future.
Early Learning Council
T he Early Childhood Advisory Council (ECAC), seated from December 2008 to January
2011, looked to the a nnual School Readiness study as one measure of state progress on
early learning. The Council was reauthorized and renamed the Early Learning Council by
Governor Dayton’s Executive Order 11-05. Read the Executive Order on the Governor’s
website. The newly formed Early Learning Council (ELC) may continue to look to the
results of the study to guide school readiness policy.
Minnesota School Readiness Study 2010
13
Minnesota School Readiness Study 2010
For further reading
Campbell, F. A., Ramey, C. T., Pungello, E., Sparling, J., & Miller-Johnson, S. (2002).Early childhood
education: Young adult outcomes from the Abecedarian project. Applied Developmental Science, 6(1), 42
57.
Coley, R. J. (2002). An uneven start: Indicators of inequality in school readiness. Princeton, NJ:
Educational Testing Service.
Dichtelmiller, M. L., Jablon, J. R., Marsden, D. B., & Meisels, S. J. (2001). Preschool-4 developmental
guidelines (4th Ed.). New York: Rebus.
Gershoff, E. (November 2003). Living at the edge research brief no.4: Low income and the development of
America’s kindergartners. New York: National Center for Children in Poverty.
Meisels, S.J. & Atkins-Burnett, S. (2006). Evaluating early childhood assessments: A differential Analysis.
In K. McCartney & D. Phillips (Eds.), The Blackwell handbook of early childhood development (pp. 533
549). Malden, MA: Blackwell Publishing.
Minnesota Department of Education (2003). Minnesota School Readiness Initiative: Developmental
Assessment at Kindergarten Entrance. Roseville: Minnesota Department of Education.
Minnesota Department of Education. (2004). Minnesota School Readiness Year Two Study: Developmental
Assessment at Kindergarten Entrance Fall 2003. Roseville: Minnesota Department of Education.
Minnesota Department of Education. (2005). Minnesota School Readiness Year Three Study:
Developmental Assessment at Kindergarten Entrance Fall 2004. Roseville: Minnesota Department of
Education.
Minnesota Department of Education (2007). Minnesota School Readiness Study: Developmental
Assessment at Kindergarten Entrance Fall 2006. Roseville: Minnesota Department of Education.
Minnesota Department of Education (2008). Minnesota School Readiness Study: Developmental
Assessment at Kindergarten Entrance Fall 2007. Roseville: Minnesota Department of Education.
Minnesota Department of Education and Minnesota Department of Human Services. (2005). Early
childhood indicators of progress: Minnesota’s early learning standards. Roseville: Minnesota Department
of Education.
National Early Childhood Accountability Task Force. (2007) Taking Stock: Assessing and Improving Early
Childhood Learning and Program Quality. Washington DC: The Pew Charitable Trusts.
National Research Council. (2008). Early Childhood Assessment: Why, What, and How. Committee on
Developmental Outcomes and Assessments for Young Children, C.E. Snow and S.B. Van Hemel, Editors.
Board on Children, Youth, and Families, Board on Testing and Assessment, Division of Behavioral and Social Sciences and Education. Washington, DC: The National Academies Press.
National Research Council & Institute of Medicine. (2000). From neurons to neighborhoods:
The science of early childhood development. Washington, DC: National Academy Press.
Reynolds, A., Englund, M., Hayakawa, C., Hendricks, M., Ou, S., Rosenberger, A., Smerillo, N., Warner-
Richter, M. Assessing the Validity of Minnesota School Readiness Indicators: Summary Report. Human
Capital Research Collaborative. January 2011. Retrieved May 2011,
http://www.humancapitalrc.org/mn_school_readiness_indicators.pdf
Minnesota School Readiness Study 2010
Reynolds, A. J., Temple, J. A., Robertson, D. L., & Mann, E. A. (2001). Long-term effects of an early
childhood intervention on educational achievement and juvenile arrest: A 15-year follow-up of low-income
children in public schools. Journal of the American Medical Association, 285(18), 2339-2346.
Schweinhart, L. J., Montie, J., Xiang, Z., Barnett, W. S., Belfield, C. R., & Nores, M. (2005). Lifetime
effects: The high/scope perry preschool study through age 40. Ypsilanti, MI: High/Scope Press.
U.S. Department of Education, U.S. National Center for Education Statistics, Home Literacy Activities and
Signs of Children’s Emerging Literacy, 1993, NCES 2000-026, November 1999; and the Early Childhood
Program Participation Survey, National Household Education Surveys Program, 2005, unpublished data.
http://www.census.gov/compendia/statab/tables/09s0229.xls
U.S. Department of Health and Human Services. (2009). The 2009 HHS Poverty Guidelines. Retrieved
January 8, 2011, from http://aspe.hhs.gov/poverty/09Poverty.shtml.
Wertheimer, R., & Croan, T. (December 2003). Attending kindergarten and already behind: A statistical
portrait of vulnerable young children. Washington, DC: Child Trends.
Zill, N., & West, J. (2000). Entering kindergarten: A portrait of American children when they begin school.
Washington, DC: U.S. Department of Education, National Center for Education Statistics.
A. Sample Work Sampling System® Developmental Checklist (Minnesota P4)
B. Work Sampling System Subgroup Analysis with Sampling Weight (2010)
C. Family Survey (English)
D. Logistic Regression Predicting Proficiency at the 75 Percent Standard
(Weighted)
E. Statistically Significant Factors from Logistic Regression
Minnesota School Readiness Study 2010
Appendices
Minnesota School Readiness Study 2010
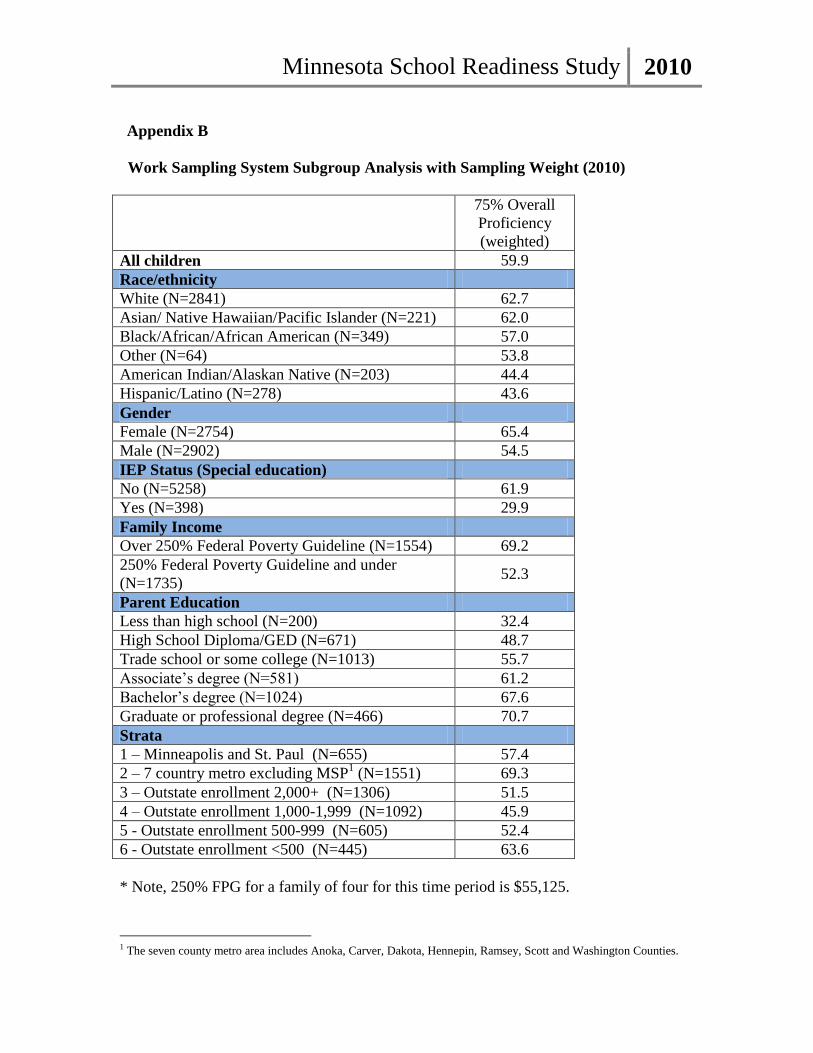
Appendix B
Work Sampling System Subgroup Analysis with Sampling Weight (2010)
75% Overall
Proficiency
(weighted)
All children 59.9
Race/ethnicity
White (N=2841) 62.7
Asian/ Native Hawaiian/Pacific Islander (N=221) 62.0
Black/African/African American (N=349) 57.0
Other (N=64) 53.8
American Indian/Alaskan Native (N=203) 44.4
Hispanic/Latino (N=278) 43.6
Gender
Female (N=2754) 65.4
Male (N=2902) 54.5
IEP Status (Special education)
No (N=5258) 61.9
Yes (N=398) 29.9
Family Income
Over 250% Federal Poverty Guideline (N=1554) 69.2
250% Federal Poverty Guideline and under 52.3
(N=1735)
Parent Education
Less than high school (N=200) 32.4
High School Diploma/GED (N=671) 48.7
Trade school or some college (N=1013) 55.7
Associate’s degree (N=581) 61.2
Bachelor’s degree (N=1024) 67.6
Graduate or professional degree (N=466) 70.7
Strata
1 – Minneapolis and St. Paul (N=655) 57.4
2 – 7 country metro excluding MSP1 (N=1551) 69.3
3 – Outstate enrollment 2,000+ (N=1306) 51.5
4 – Outstate enrollment 1,000-1,999 (N=1092) 45.9
5 - Outstate enrollment 500-999 (N=605) 52.4
6 - Outstate enrollment <500 (N=445) 63.6
* Note, 250% FPG for a family of four for this time period is $55,125.
1 The seven county metro area includes Anoka, Carver, Dakota, Hennepin, Ramsey, Scott and Washington Counties.
Minnesota School Readiness Study 2010
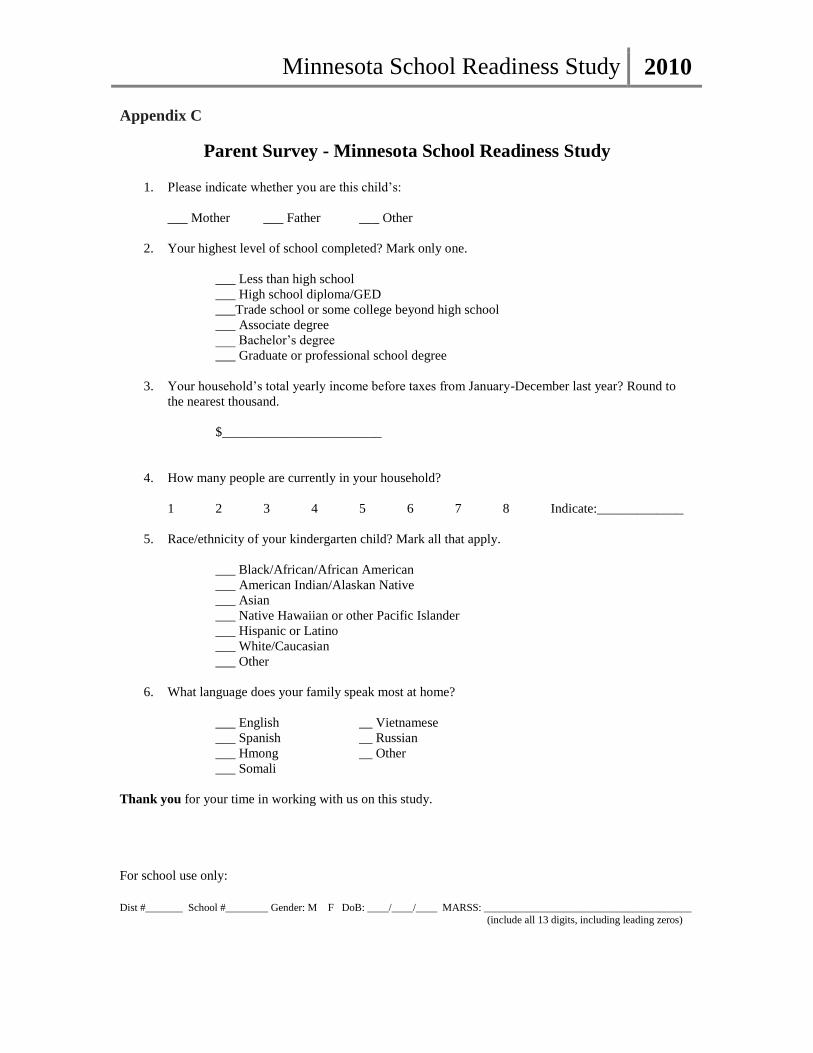
Appendix C
Parent Survey - Minnesota School Readiness Study
1. Please indicate whether you are this child’s:
___ Mother ___ Father ___ Other
2. Your highest level of school completed? Mark only one.
___ Less than high school ___ High school diploma/GED ___Trade school or some college beyond high school ___ Associate degree ___ Bachelor’s degree
___ Graduate or professional school degree
3. Your household’s total yearly income before taxes from January-December last year? Round to
the nearest thousand.
$________________________
4. How many people are currently in your household?
1 2 3 4 5 6 7 8 Indicate:_____________
5. Race/ethnicity of your kindergarten child? Mark all that apply.
___ Black/African/African American ___ American Indian/Alaskan Native ___ Asian ___ Native Hawaiian or other Pacific Islander ___ Hispanic or Latino ___ White/Caucasian ___ Other
6. What language does your family speak most at home?
___ English __ Vietnamese ___ Spanish __ Russian ___ Hmong __ Other ___ Somali
Thank you for your time in working with us on this study.
For school use only:
Dist #_______ School #________ Gender: M F DoB: ____/____/____ MARSS: _______________________________________
(include all 13 digits, including leading zeros)
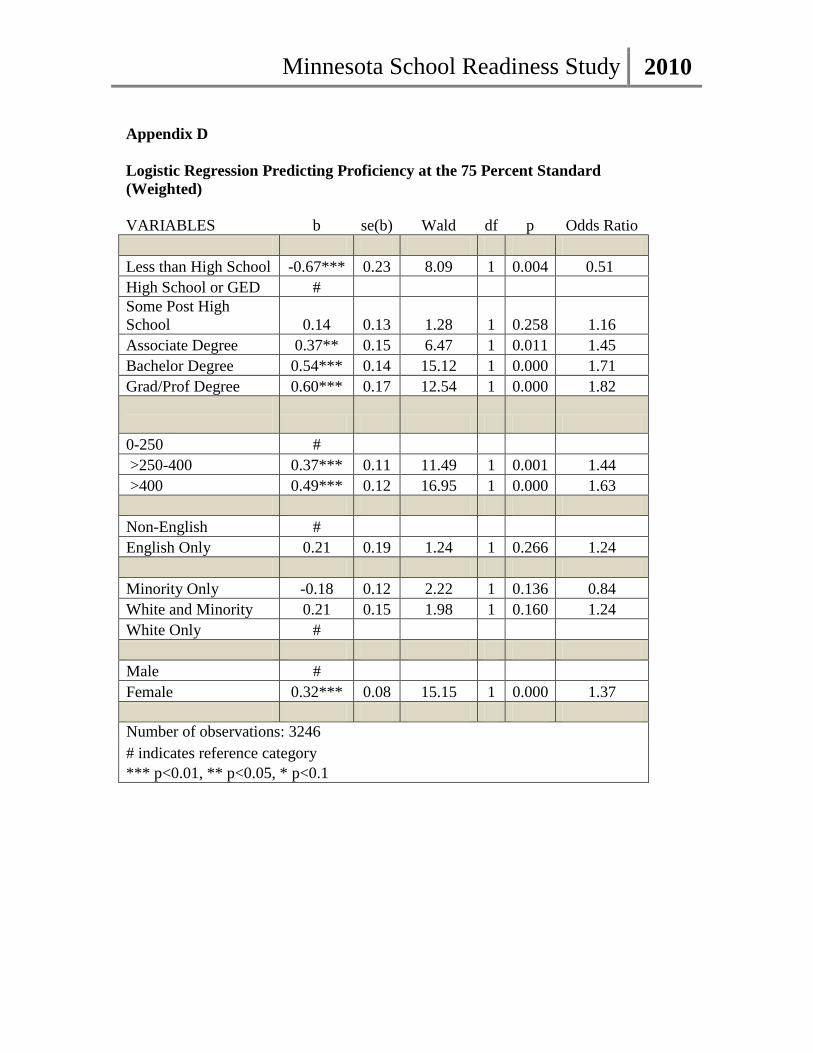
Appendix D
Logistic Regression Predicting Proficiency at the 75 Percent Standard
(Weighted)
VARIABLES b se(b) Wald df p Odds Ratio
Parent Education 38.12*** 5 0.000
Less than High School -0.67*** 0.23 8.09 1 0.004 0.51
High School or GED #
Some Post High
School 0.14 0.13 1.28 1 0.258 1.16
Associate Degree 0.37** 0.15 6.47 1 0.011 1.45
Bachelor Degree 0.54*** 0.14 15.12 1 0.000 1.71
Grad/Prof Degree 0.60*** 0.17 12.54 1 0.000 1.82
Percent of Federal
Poverty Guidelines 20.23*** 2 0.000
0-250 #
>250-400 0.37*** 0.11 11.49 1 0.001 1.44
>400 0.49*** 0.12 16.95 1 0.000 1.63
Home Language 1.24 1 0.266
Non-English #
English Only 0.21 0.19 1.24 1 0.266 1.24
Minority Status 5.07* 2 0.079
Minority Only -0.18 0.12 2.22 1 0.136 0.84
White and Minority 0.21 0.15 1.98 1 0.160 1.24
White Only #
Gender 15.15*** 1 0.000
Male #
Female 0.32*** 0.08 15.15 1 0.000 1.37
Intercept -0.35 0.22 2.52 1 0.113
Number of observations: 3246
# indicates reference category
*** p<0.01, ** p<0.05, * p<0.1
Minnesota School Readiness Study 2010
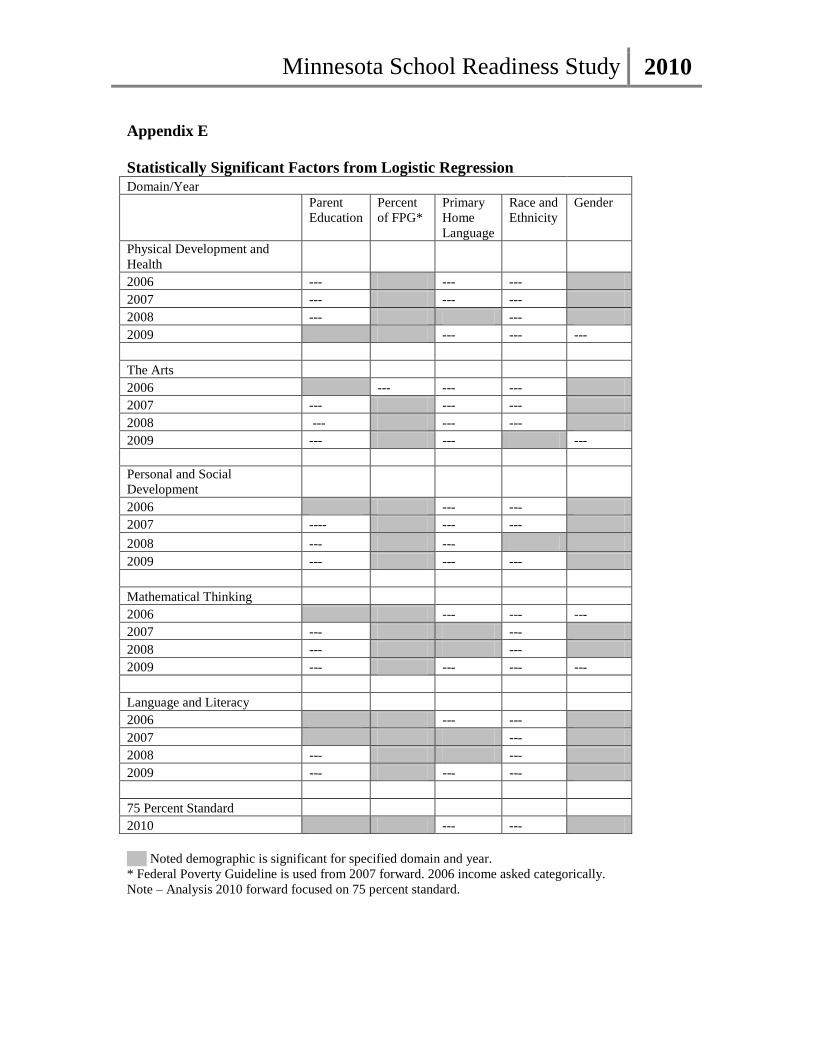
Appendix E
Statistically Significant Factors from Logistic Regression
Domain/Year
Parent Percent Primary Race and Gender
Education of FPG* Home Ethnicity
Language
Physical Development and
Health
2006 -- *** -- -- ***
-- *** -- -- ***
-- *** *** -- ***
*** *** -- -- --
*** -- -- -- ***
-- *** -- -- ***
-- *** -- -- ***
-- *** -- *** --
*** *** -- -- ***
--- *** -- -- ***
-- *** -- *** ***
-- *** -- -- ***
*** *** -- -- --
-- *** *** -- ***
-- *** *** -- ***
-- *** -- -- --
*** *** -- -- ***
*** *** *** -- ***
-- *** *** -- ***
-- *** -- -- ***
2007
2008
2009
The Arts
2006
2007
2008
2009
Personal and Social
Development
2006
2007
2008
2009
Mathematical Thinking
2006
2007
2008
2009
Language and Literacy
2006
2007
2008
2009
75 Percent Standard
2010 *** *** -- -- ***
*** Noted demographic is significant for specified domain and year.
* Federal Poverty Guideline is used from 2007 forward. 2006 income asked categorically.
Note – Analysis 2010 forward focused on 75 percent standard.
Minnesota School Readiness Study 2010