mining direct antagonistic communities in signed social networks
TRANSCRIPT

Information Processing and Management 49 (2013) 773–791
Contents lists available at SciVerse ScienceDirect
Information Processing and Management
journal homepage: www.elsevier .com/ locate/ infoproman
Mining direct antagonistic communities in signed socialnetworks
0306-4573/$ - see front matter � 2013 Elsevier Ltd. All rights reserved.http://dx.doi.org/10.1016/j.ipm.2012.12.009
⇑ Corresponding author.E-mail addresses: [email protected] (D. Lo), [email protected] (D. Surian), [email protected] (P.K. Prasetyo), zkspirit2@g
(K. Zhang), [email protected] (E.-P. Lim).1 The work was done while the author was with School of Information Systems, Singapore Management University.
David Lo a,⇑, Didi Surian b,1, Philips Kokoh Prasetyo a, Kuan Zhang a,b,1, Ee-Peng Lim a
a School of Information Systems, Singapore Management University, 80 Stamford Road, Singapore 178902, Singaporeb School of Information Technologies, University of Sydney, New South Wales 2006, Australia
a r t i c l e i n f o
Article history:Received 20 April 2012Received in revised form 21 December 2012Accepted 31 December 2012Available online 28 February 2013
Keywords:Direct antagonistic communityMining maximal bi-cliquesSigned social network
a b s t r a c t
Social networks provide a wealth of data to study relationship dynamics among people.Most social networks such as Epinions and Facebook allow users to declare trusts or friend-ships with other users. Some of them also allow users to declare distrusts or negative rela-tionships. When both positive and negative links co-exist in a network, some interestingcommunity structures can be studied. In this work, we mine Direct Antagonistic Commu-nities (DACs) within such signed networks. Each DAC consists of two sub-communitieswith positive relationships among members of each sub-community, and negative rela-tionships among members of the other sub-community. Identifying direct antagonisticcommunities is an important step to understand the nature of the formation, dissolution,and evolution of such communities. Knowledge about antagonistic communities allows usto better understand and explain behaviors of users in the communities.
Identifying DACs from a large signed network is however challenging as various combi-nations of user sets, which is very large in number, need to be checked. We propose an effi-cient data mining solution that leverages the properties of DACs, and combines theidentification of strongest connected components and bi-clique mining. We have experi-mented our approach on synthetic, myGamma, and Epinions datasets to showcase the effi-ciency and utility of our proposed approach. We show that we can mine DACs in less than15 min from a signed network of myGamma, which is a mobile social networking site, con-sisting of 600,000 members and 8 million links. An investigation on the behavior of usersparticipating in DACs shows that antagonism significantly affects the way people behaveand interact with one another.
� 2013 Elsevier Ltd. All rights reserved.
1. Introduction
Each of us forms positive and negative relationships with others. With these relationships, communities are formed. Attimes, due to the nature of human interactions, some communities exhibit antagonistic behaviors among their members.Examples of such communities are many including social groups that hold differing opinions on topics such as industrialismvs. conservation, and formal organizations that are direct competitors in a market.
Several researchers have studied the nature of antagonistic communities (Dasgupta, 2009; Dasgupta & Kanbur, 2007; Den-rell, 2005; Giles & Evans, 1986; Labovitz & Hagedorn, 1975; Tolsma, Jochem, Graaf, & Quillian, 2009). It is well known that
mail.com

774 D. Lo et al. / Information Processing and Management 49 (2013) 773–791
individual level antagonism exists in any social networks. However, the existences of well ‘‘organized’’ form of antagonismbetween sub-groups should be detected in an early stage because they are potentially detrimental to the productivity andharmony of the community. Moreover, identification of antagonistic communities in the social networks could potentiallyopen a path to further study the structure of the antagonistic community, the evolution of the antagonistic community, etc.
Antagonistic communities on the other hand are not always bad. In some cases, they are actually welcomed. In massivelymultiple player on-line games, gamers are expected to form groups to fight with gamers that do not belong to the samegroup. Here, a game’s success depends very much on antagonistic behaviors among different gamer groups. The more antag-onistic the groups are, the more fun and challenging the game would be. Also, by expressing common negative relationshipswith members from another group, users belonging to the same group may form stronger bonds among themselves. Thisincreases loyalty within the group and improves the survivability of the group in the long run.
With the advent of Web 2.0, on-line social networking sites and forums have gained much popularity. In these venues,people declare their network of friends. Some venues also allow members to explicitly declare negative relationships withother members. Abundant information on positive and negative relationships which is unavailable to many past studies insociology is now available to be analyzed. We therefore leverage these large scale information to shed light on antagonisticcommunities in Web 2.0 social networks.
In this study, our goal is to discover Direct Antagonistic Communities (DACs) automatically from explicit positive andnegative relationships among people in a social network. We define a direct antagonistic community to be a pair of sub-com-munities with each sub-community having members with positive relationships with one another while having negativerelationships with members of the other sub-community. Investigating mined direct antagonistic communities potentiallyenriches our understanding of antagonistic social interactions. Mined DACs could also be leveraged for various applications,e.g., in the monitoring and prevention of social conflicts, in improving friend recommendation systems, in designing bettermarketing or product survey strategies, etc. Mined antagonistic communities could be used to identify the existence of twosub-communities that are large and are antagonistic with each other. Friend recommendation could be improved by not rec-ommending two potential friends from opposite sides of an antagonistic community. Also, when views are to be solicitedfrom a network of users, the knowledge of antagonistic communities will help to select a fair subset of users so as to obtaina balanced set of views. An extended discussion of potential applications of DACs is provided in Section 6.
Identifying all direct antagonistic communities from a large signed network however is challenging. Many combinationsof two sets of people, which are two sets of nodes in the network, need to be considered and checked for antagonism. In alarge signed network, the number of such combinations is very large. To tackle this challenge, we design a graph miningalgorithm to mine antagonistic communities by leveraging past work on computing strongest connected components andmining maximal bi-cliques.
We experiment with Epinions trust-distrust dataset and friend-foe information from myGamma, a mobile (i.e., mobilephone based) social network. We observe that antagonistic communities exist in both networks. We also find that membersfrom opposing sub-communities in an antagonistic community tend to behave differently (e.g., give poorer ratings, have dif-ferent group affiliations, etc.) compared with members within the same sub-community. This confirms that direct antago-nistic relationships between two sub-communities affect their behavioral patterns. The contributions of this work are asfollows:
1. We propose a new problem of mining antagonistic communities from signed social networks.2
2. We build a novel algorithm by using existing building blocks that have been shown to scale to large datasets henceenabling our approach to scale too.
3. We experiment our approach to extract antagonistic communities from real signed social networks.4. We present more in-depth analysis and explore behaviors between two opposing sub-communities that have negative
relationships with each other.
The structure of this paper is as follows. Section 2 describes related work. Section 3 describes some preliminary defini-tions. Section 4 describes our approach. Experiments are presented in Section 5. Section 6 discusses some interesting pointsand issues. We conclude and describe future work in Section 7.
2. Related work
Community finding is a key problem in social network analysis and it has been extensively studied (Cai, Shao, He, Yan, &Han, 2005; Girvan & Newman, 2002; Katz, 1953; Leicht & Newman, 2008; Newman, 2004; White, Harary, Sobel, & Becker,
2 This article is an extended version of our short paper (six pages) appearing in the 20th ACM Conference on Information and Knowledge Management (CIKM2011) entitled: Mining Direct Antagonistic Communities in Explicit Trust Network (Lo, Surian, Zhang, & Lim, 2011). We extend the conference paper in thefollowing ways: (1) we include additional background materials and related work, (2) we describe our proposed and baseline solutions in more details throughthe inclusion of more detailed descriptions and examples, (3) we present our new experiments on additional case studies on Epinions and myGamma datasetsenriched with additional inferred negative edges (see Section 5), (4) we present the results of a set of new efficacy experiments on the real datasets toinvestigate the differences between users in the same side and those in the opposing sides of antagonistic communities (see Section 5), and (5) we add a newdiscussion section.

D. Lo et al. / Information Processing and Management 49 (2013) 773–791 775
2001;Yang, Cheung, & Liu, 2007). The traditional way of detecting community structure in a network is by performing hier-archical partitioning (Johnson, 1967; Ravasz, Somera, Mongru, Oltvai, & Barabasi, 2002; Scott, 2000). Girvan and Newman(2002) introduced a new algorithm to mine communities from networks based on edge betweenness. Newman (2004) pro-posed a modularity-based algorithm. Different from the above studies that focus on partitioning a network into cohesivecommunities, in this work, our goal is to extract subgraphs within the network which exhibit strong antagonism.
Vuong et al. (2008) investigated content deletion between any two Wiki-pedia users as a form of disputes between them,and developed models to determine the degrees of controversy of users and articles using the dispute information. Differentfrom Vuong et al.’s work, we mine direct antagonistic communities from signed networks.
Social network researchers have conducted a number of studies in signed networks (i.e., networks with both positive andnegative relationships) in order to give more understanding about interactions between people in a community. The socialbalance theory developed for signed networks identifies triads with all positive relationships and triads with only one po-sitive and two negative relationships as the balanced structure constructs (Easley & Kleinberg, 2010). Triads of other formsare known to be unbalanced. Doreian and Mrvar (2009) studied how to partition signed social network. Yang and Liu (2007)mined communities in signed networks using a heuristic clustering approach. In this work, we capture a set of people thatare linked together by positive relationships and they also consistently oppose a common set of ‘‘enemies’’ in online socialnetworks.
There are also several researchers from sociology, economics, and psychology communities, who have studied inter-group antagonism (Dasgupta, 2009; Dasgupta & Kanbur, 2007; Denrell, 2005; Giles & Evans, 1986; Labovitz & Hagedorn,1975; Tolsma et al., 2009). This body of work however has not been widely validated on large online social networks.
We build our algorithm on the top of a pattern mining algorithm (i.e., to mine for maximal bi-cliques). Several algorithmshave been proposed for mining association rules (Agrawal & Srikant, 1994; Wang, Han, & Pei, 2003), frequent sequences(Wang & Han, 2004; Yan, Han, & Afhar, 2003), frequent repetitive sequences (Ding, Lo, Han, & Khoo, 2009; Lo, Khoo, &Liu, 2007), frequent graphs (Yan & Han, 2002), etc.
The enumeration of bi-cliques from graph data has been studied before. Included in this body of work are the work byAlexe et al. (2004), Eppstein (1994), Makino and Uno (2004), Li, Liu, Li, and Wong (2007). The work by Li et al. (2007), tothe best of our knowledge, is the latest in the series. They proposed a mapping between maximal bi-clique mining to fre-quent item-set mining problem. We make use of their translation and extend their technique to mine for Direct AntagonisticCommunities (DACs). A DAC is not a bi-clique, but some constraints within a DAC, in particular negative relationships couldbe mapped to the problem of finding bi-cliques within a dataset. We use the specific nature of DACs to prune additionalnodes. The resultant technique scales well to mine from large real networks at low minimum size thresholds.
The closest to our work is the work by Zhang, Lo, and Lim (2010) which proposed an approach to mine for antagonisticcommunities based on rating data. If two sets of users rate the same set of products differently most of the time, they wouldbe mined as antagonistic communities. Zhang et al. (2010) focused on indirect antagonistic communities in rating networkswhere two sub-communities have conflicting ratings on some commonly rated objects. Different from Zhang et al. (2010)’swork, in this work we mine for antagonistic communities based on explicit signed relationships. We believe explicit signedrelationships are more reliable than common or differing ratings. A user could have a positive relationship with another useralthough they might have a different ‘‘taste’’ on some common items of interest. Similarly, a user could still have a negativerelationship with another user sharing the same ‘‘taste’’ on some common items of interest. Due to the different nature of theproblem, there is a need to develop a new algorithm to mine for direct antagonistic communities from signed networks. Theapproach proposed in (Zhang et al., 2010) takes as input a transaction database where each transaction corresponds to anitem that is rated, and every element in a transaction corresponds to a user and his/her rating for the item. Zhang et al.(2010) employs a similar algorithm as level-wise association pattern mining where apriori property is used to prune searchspace. Antagonistic communities of smaller sizes are generated first; based on these, communities of larger sizes are subse-quently constructed in a level-by-level manner. In this work, we take as input a graph rather than a transaction database. Weperform various pruning based on properties governing positive and negative edges of a direct antagonistic community. Wedesign a graph mining algorithm that leverages past work on extracting strongest connected components and mining max-imal bi-cliques.
3. Preliminaries and problem definition
In this section, we first describe preliminary concepts and definitions on graphs and frequent pattern mining. We thenformalize some new definitions and our problem statement.
3.1. Preliminaries
Some standard definitions of graph, strongly connected sub-graph, strongly connected component, and bi-clique are gi-ven in Definitions 1–4 respectively.
Definition 1 (Graph). A graph is composed of a set of nodes and edges and is denoted as G = (N,E). An edge is a mappingfrom one node to another node.

776 D. Lo et al. / Information Processing and Management 49 (2013) 773–791
Definition 2 (Strongly Connected Sub-graph). A strongly connected sub-graph (SCS) is a sub-graph G0 in a larger graph Gwhere: For each node n0 in G0, there exists a series of edges in G0 connecting n0 to every other node in G0.
Definition 3 (Strongly Connected Component). A strongly connected component (SCC) is a strongly connected sub-graph thatis maximal in size.
An example of a strongly connected component (SCC) is shown in Fig. 1a. Note that the rightmost three nodes (i.e., V2, V4and V5) form a strongly connected sub-graph (SCS) but do not form an SCC.
Definition 4 (Bi-Cliques). A bi-clique is a graph whose nodes could be decomposed of two sets of nodes where:
1. There are no edges among the nodes in each set2. Each node is connected to every node in the other set.
We denote a bi-clique as (L,R), where L and R are the two sets of nodes having the characteristics described above.An example of a bi-clique is shown in Fig. 1b. Next, we describe some preliminary definitions of transaction database,
mapping function, item-set, frequent item-set and closed pattern in Definitions 5–8 respectively. These terms are commonlyused in frequent item-set mining first proposed by Agrawal and Srikant (1994).
Definition 5 (Transaction DB and Mapping Function). A transaction is a set of items from a domain D. A transaction databaseDB consists of a bag of transactions. Let map (S) be a mapping between a set of items S to the set of the identifiers of thetransactions in the DB containing S.
Definition 6 (Item-set Pattern). An item-set pattern is a set of items. Consider a transaction database DB. The support of anitem-set pattern P, is the number of transactions in DB that are super sets of P. The support of P is denoted as sup (P).
Definition 7 (Frequent Item-set). An item-set P is a frequent item-set with respect to a transaction database DB and a min-imum support threshold min_sup if sup(P) > min_sup.
Definition 8 (Closed Pattern). An item-set P is a closed pattern, if P is frequent and there is no P0 where P0 � P andsup(P0) = sup(P).
An example of a transaction database is shown in Table 1. From this table, we could see that the item-set {A,B,C} is sup-ported by two transactions namely T1 and T2. The support of the item-set is 2. Considering a minimum support of 2, theitem-set is frequent. However, since there exists a larger item-set {A,B,C,D} with the same support, the item-set {A,B,C}is not closed. Item-set {A,B,C,D} however is closed.
3.2. Definitions and problem statement
We take as an input a network of users expressing positive and negative relationships among themselves. We refer to thisnetwork as a signed network defined in Definition 9.
(a) (b)Fig. 1. (a) A strongly connected component and (b) a bi-clique.

Table 1A sample transaction DB.
TID Itemset
T1 {A,B,C,D,E}T2 {A,B,C,D,E}T3 {A,C,D}T4 {E,F,K}
D. Lo et al. / Information Processing and Management 49 (2013) 773–791 777
Definition 9 (Signed Network). A signed network is a graph whose nodes represent individuals and edges represent positiveor negative relationships among them. The edges are directed and labeled as either: positive (P) or negative (N). The nodesare labeled with the identifiers of respective individuals. A signed network could then be denoted as G = (N,E,NL,EL) where N,E, NL, and EL correspond to the nodes, the edges, a mapping from nodes to labels, and a mapping from edges to labelsrespectively.
Our goal is to mine a set of antagonistic communities with two sub-communities/groups, where members of eachsub-community express explicit positive relationships among themselves and have negative relationships with membersof the opposing sub-community. We refer to these communities as direct antagonistic communities defined in Definition 10.
Definition 10 (Direct Antagonistic Community). A Direct Antagonistic Community (DAC) is composed of twosub-communities L and R. L and R are both SCSs with respect to the directed positive edges. Furthermore L and R form abi-clique considering bi-directional negative edges. We denote it as [L,R].
An example of such Direct Antagonistic Community (DAC) is shown in Fig. 2. We are interested in DACs obeying aminimum size requirement, i.e., jLjP min_size and jRjP min_size. We refer to such DACs as significant DACs. In Fig. 2, theDAC example is significant if the minimum size threshold is set at 2; it would not be significant if the minimum sizethreshold is set at 3.
Fig. 2. A Direct antagonistic community.
Fig. 3. Example sub-bi-clique.

778 D. Lo et al. / Information Processing and Management 49 (2013) 773–791
We next introduce the concept of redundant DACs, but first we need to describe sub-bi-clique operation. This is defined inDefinition 11. As an example, Fig. 3 shows a sub-bi-clique of the bi-clique shown in Fig. 1b.
Definition 11 (Sub-Bi-Clique). Consider a bi-clique C = (L,R). We define a sub-bi-clique of C, as a bi-clique C0 = (L0,R0) whereeither L0 # L and R0 � R, or L0 � L and R0 # R. A sub-bi-clique of a bi-clique is a bi-clique.
All sub-bi-cliques of a significant DAC are potentially significant DACs. Thus to prevent an explosion on the number ofDACs, we mine only a compact representation of DACs. Given a set of mined DACs, we define redundant ones based on Def-inition 12. Only non-redundant DACs would be mined.
Definition 12 (Redundant DAC). Consider a set of DACs ASET. One DAC a 2 ASET is deemed as redundant iff there existsanother DAC a0 2 ASET, where a is a sub-bi-clique of a0.
Based on the above concepts and definitions, our problem is defined as follows:Problem Definition. Given a signed network and a minimum size threshold min_size, find all non-redundant and significant
DACs.
4. Mining antagonistic communities
In this section, we describe some properties of Direct Antagonistic Communities (DACs) and present our algorithm tomine them.
4.1. Properties
We use three properties in our mining algorithm outlined below. First, Property 1 describes a rule governing a node’smembership to a significant DAC.
Property 1 (Membership). Consider a node n in graph G, if n is not a part of any SCSs of size min_size, n could not be a part of anysignificant DACs.
Proof. From Definition 10, each sub-community in a DAC must be an SCS of size at least min_size. Hence, such a node n couldnot be a part of any DACs. h
Next, Property 2 describes the relationship between a strongly connected sub-graph and a strongly connected componentin a signed network.
Property 2 (SCS and SCC). Every Strongly Connected Sub-graph (SCS) must be a part of a Strongly Connected Component (SCC).
Proof. From Definitions 2 and 3, an SCS could either be an SCC, or there is a super-graph of the SCS which is an SCC. h
We now define a new operation to convert a graph to a transaction database.
Definition 13 (Graph to Transaction DB). The GTD operation converts a graph G to a transaction database DB by creating anew set of transactions t = {n0j(n,n0) 2 G � Edges} for each node n in G and affixing the identifier of n to t. We denote thisoperation applied to a graph G as GTD(G).
Fig. 4 illustrates the GTD operation to derive a transaction database. With this operation, the duality between bi-cliquesand closed patterns is established by Property 3.
Property 3 (Bi-cliques and Patterns: Duality). Consider a graph G and a transaction database GTD(G). The set of all bi-cliquescorresponds to the set {(c,map(c))jc 2 CLS} where CLS is the set of all closed patterns in GTD(G).
Proof. The above property has been proven by Li et al. (2007). h
Fig. 4. Graph to transaction DB operation.

D. Lo et al. / Information Processing and Management 49 (2013) 773–791 779
4.2. Proposed algorithm
A Direct Antagonistic Community (DAC) has two basic requirements based on the positive and negative relationships. Onone hand, each sub-community must form a strongly connected component based on positive relationships. On the otherhand, members of one sub-community must have negative relationships with all members of the other community. To minefor DACs, we perform the following steps:
1. Project input signed network G, to a graph G+ keeping only positive edges in graph G.2. Extract SCCs from G+ of size more than the minimum support size threshold min_size. These are candidate sub-commu-
nities of DACs. Nodes that are not part of at least one SCC with size of at least min_size could not be part of any DAC (seeProperties 1 and 2). We keep the set of nodes N+ = {njn is a node in the identified SCCs}.
3. Project the input signed network G, to a graph G� keeping only nodes in N+ and bi-directional negative edges.4. Mine the set of maximal bi-cliques BCQ from G� leveraging Property 3 and utilizing closed itemset mining algorithm.5. For each bi-clique (L,R) in BCQ containing a set of nodes nL
b and nRb for L and R respectively, project the input signed net-
work G, to graphs GnLb
and GnRb
keeping only nodes in nLb and nR
b respectively and their corresponding positive edges. FindSCCs SCCL and SCCR from the projected networks GnL
band GnR
brespectively whose sizes are at least min_size. We keep the
set of DACs {[l,r]jl 2 SCCL ^ r 2 SCCR}.6. Eliminate redundant DACs. There could still be redundant DACs at the end of step 5. This is the case even after we mine
for maximal bi-cliques at step 4, as the DACs are sub-bi-cliques of these maximal bi-cliques. We iterate through the set ofDACs generated at step 5 and remove redundant ones based on Definition 12.
As a running example, we consider the graph shown in Fig. 5a. The graph contains positive edges (denoted as solid ar-rows) and bi-directional negative edges (denoted as dashed bi-directional arrows).
4.2.1. Pruning by positive edges: steps 1 and 2First, we prune candidate nodes based on positive relationships. Negative edges are removed from the projected graph.
Based on this graph, our goal is to throw away nodes which are not part of any large enough networks whose nodes are con-nected with one another via positive edges. The number of edges a node has follows power law, i.e., most nodes are not con-nected to any other nodes. Hence, a large number of nodes could be removed from consideration.
To realize this goal, we employ Tarjan’s algorithm (Tarjan, 1972), that could compute maximal SCCs by a single depth-firstsearch pass on the network containing only positive edges. Hence, it is scalable as the runtime cost is linear to the size of thenetwork. We extract nodes that are parts of maximal SCCs with sizes Pmin_size.
Example 1. Consider min_size threshold being set to 2. From the example signed network described in Fig. 5a, there are twoSCCs. The first SCC consists of nodes in the set {V1,V2}. The second consists of nodes in the set {V4,V5,V6,V7}. The two SCCsare drawn in Fig. 5a. We only retain nodes in the set {V1,V2,V4,V5,V6,V7} to be considered in the next step as these arenodes that are parts of SCCs.
4.2.2. Pruning by negative edges: steps 3 and 4At these steps, we focus on strong (i.e., bi-directional) negative relationships. We project the input signed network, by
removing positive edges and non bi-directional negative edges. Two sub-communities in a direct antagonistic communitymust form a bi-clique with respect to the bi-directional negative edges.
To realize the goal, we adapt a recent algorithm by Li et al. (2007) that extracts maximal bi-cliques from a graph followingProperty 3. The algorithm would return all maximal bi-cliques from the input network containing only bi-directional neg-ative edges.
Example 2. The projected network consisting of nodes in the set {V1,V2,V4,V5,V6,V7} and bi-directional negative edges isshown in Fig. 6a. This network can be converted to a transaction database shown in Table 2. Mining for closed patterns fromthis transaction database would result in the set of patterns: {{V1,V2},{V4,V5,V6}}. This corresponds to one maximal bi-clique with L = {V1,V2} and R = {V4,V5,V6}.
4.2.3. Formation of DACs: step 5Each maximal bi-clique mined at step 4 is not necessarily a DAC as each of the two sets in the bi-clique does not neces-
sarily form an SCS with respect to positive edges. Thus, a maximal bi-clique could map to 0 or more DACs.Following Definition 11, every sub-bi-clique of a bi-clique is a bi-clique and hence it satisfies the requirement of negative
relationships among members of opposing sub-communities. Hence, we could extract sub-bi-cliques SBQ from each bi-cli-que in which each of the two sets of nodes forms an SCS of size larger than min_size.
To realize this, we process each bi-clique BCQ identified in step 4. For each of the two sets of nodes in BCQ, i.e., BCQ.L andBCQ.R, we find SCSs on a projected network containing nodes in BCQ.L/BCQ.R and positive edges among them. These oper-

(a)
(b)Fig. 5. Running example: (a) signed network and (b) two SCCs.
(a) (b)Fig. 6. Running example: (a) projected network with only negative edges and (b) resultant projected network and a mined DAC (marked by red solidcircles).
780 D. Lo et al. / Information Processing and Management 49 (2013) 773–791

Table 2Running example: transaction DB.
TID Item-set
V1 {V4,V5,V6}V2 {V4,V5,V6}V4 {V1,V2}V5 {V1,V2}V6 {V1,V2}V7 {}
D. Lo et al. / Information Processing and Management 49 (2013) 773–791 781
ations would result in two sets of SCSs. Pairing one SCS from one set with another from the other set, would form a DACwhich could then be included in the final result.
Example 3. Consider the maximal bi-clique with L = {V1,V2} and R = {V4,V5,V6}. Fig. 6b shows a projected network withnodes appearing in the maximal bi-clique and both positive and negative edges. From this projected network, we couldidentify a DAC consisting of two opposing sets of nodes which are {V1,V2} and {V4,V5}. This DAC is marked by the solid redcircles in the figure.
4.2.4. Removal of redundant DACs: step 6Usually, there are no or few redundant DACs left at the end of step 5. The running example is one of such cases. However,
there exist corner cases where redundant DACs are present. This is the case as mined DACs are sub-bi-cliques of the maximalbi-cliques mined at steps 3 and 4. We remove redundant DACs by analysing the list of DACs mined at step 5 and detect forredundancies based on Definition 12. We do this by comparing each DAC with every other larger DAC mined at step 5; eachof these comparisons simply involves checking for subset relations among sub-communities of two DACs which is sufficientto decide whether one is a sub-bi-clique of the other.
A signed network showing the corner case where redundant DACs exist after step 5 is shown in Fig. 7. After steps 1 and 2of the algorithm, the SCCs of this signed network are shown in Fig. 8. The projected network containing only negative edgesshown in Fig. 9 is produced after step 3 of the algorithm. After steps 4 and 5 of the algorithm, the maximal bi-cliques and theDACs found are shown in Fig. 10. We find two maximal bi-cliques as shown in Fig. 10a and b. The DACs corresponding tothese two bi-cliques are indicated by the red solid circles. As the bi-clique in Fig. 10a is a sub-bi-clique of that in Fig. 10b,the DAC in Fig. 10a is redundant and needs to be removed.
4.2.5. PseudocodeOur algorithm’s pseudo-code is shown in Algorithm 1. At line 1, we perform graph projection and extract a network
containing only positive edges from the input signed network. At lines 2–3, we perform SCC computation and extractnodes that participate in an SCC of size at least min_size. At lines 4, we extract a network containing only bi-directionalnegative edges from the input signed network. This network is then converted to a special transaction database, and bi-cliques are identified via a closed item-set mining algorithm (lines 5–6). At lines 7–16, we check each bi-clique if it cor-responds to zero, one, or more direct antagonistic communities of size at least min_size. At lines 10–11, we construct SCCs
Fig. 7. Corner case: input signed network.

Fig. 8. Corner case: two SCCs.
Fig. 9. Corner case: projected network containing only negative edges.
(a) (b)Fig. 10. Corner case: two maximal bi-cliques and their corresponding DACs.
782 D. Lo et al. / Information Processing and Management 49 (2013) 773–791
D. Lo et al. / Information Processing and Management 49 (2013) 773–791 783
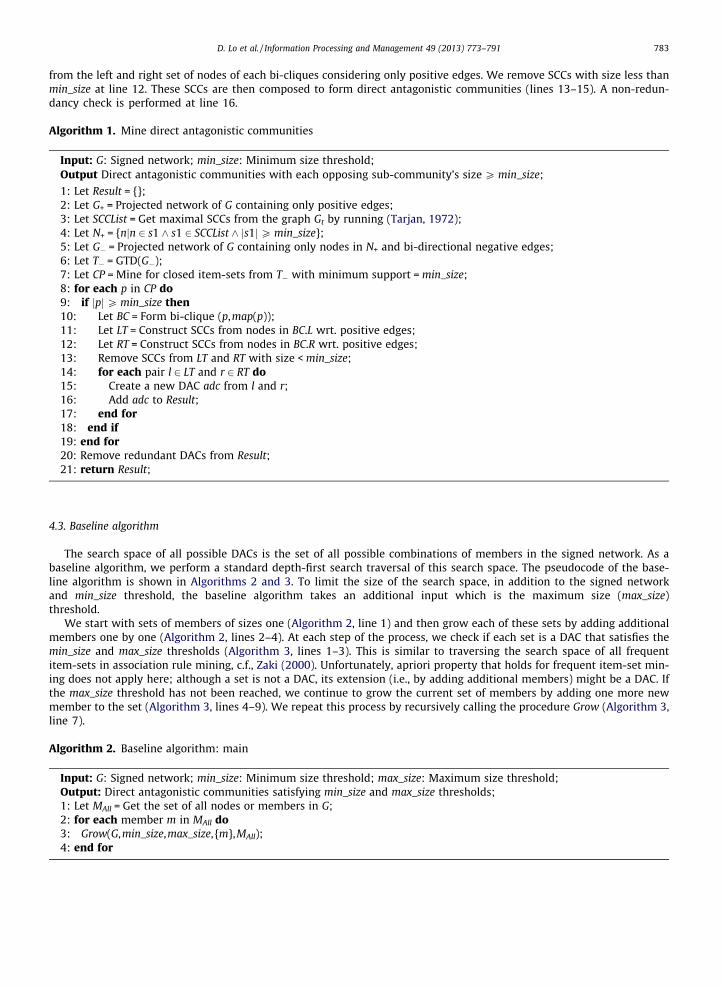
from the left and right set of nodes of each bi-cliques considering only positive edges. We remove SCCs with size less thanmin_size at line 12. These SCCs are then composed to form direct antagonistic communities (lines 13–15). A non-redun-dancy check is performed at line 16.
Algorithm 1. Mine direct antagonistic communities
Input: G: Signed network; min_size: Minimum size threshold;Output Direct antagonistic communities with each opposing sub-community’s size P min_size;
1: Let Result = {};2: Let G+ = Projected network of G containing only positive edges;3: Let SCCList = Get maximal SCCs from the graph Gt by running (Tarjan, 1972);4: Let N+ = {njn 2 s1 ^ s1 2 SCCList ^ js1jP min_size};5: Let G� = Projected network of G containing only nodes in N+ and bi-directional negative edges;6: Let T� = GTD(G�);7: Let CP = Mine for closed item-sets from T� with minimum support = min_size;8: for each p in CP do9: if jpjP min_size then10: Let BC = Form bi-clique (p,map(p));11: Let LT = Construct SCCs from nodes in BC.L wrt. positive edges;12: Let RT = Construct SCCs from nodes in BC.R wrt. positive edges;13: Remove SCCs from LT and RT with size < min_size;14: for each pair l 2 LT and r 2 RT do15: Create a new DAC adc from l and r;16: Add adc to Result;17: end for18: end if19: end for20: Remove redundant DACs from Result;21: return Result;
4.3. Baseline algorithm
The search space of all possible DACs is the set of all possible combinations of members in the signed network. As abaseline algorithm, we perform a standard depth-first search traversal of this search space. The pseudocode of the base-line algorithm is shown in Algorithms 2 and 3. To limit the size of the search space, in addition to the signed networkand min_size threshold, the baseline algorithm takes an additional input which is the maximum size (max_size)threshold.
We start with sets of members of sizes one (Algorithm 2, line 1) and then grow each of these sets by adding additionalmembers one by one (Algorithm 2, lines 2–4). At each step of the process, we check if each set is a DAC that satisfies themin_size and max_size thresholds (Algorithm 3, lines 1–3). This is similar to traversing the search space of all frequentitem-sets in association rule mining, c.f., Zaki (2000). Unfortunately, apriori property that holds for frequent item-set min-ing does not apply here; although a set is not a DAC, its extension (i.e., by adding additional members) might be a DAC. Ifthe max_size threshold has not been reached, we continue to grow the current set of members by adding one more newmember to the set (Algorithm 3, lines 4–9). We repeat this process by recursively calling the procedure Grow (Algorithm 3,line 7).
Algorithm 2. Baseline algorithm: main
Input: G: Signed network; min_size: Minimum size threshold; max_size: Maximum size threshold;Output: Direct antagonistic communities satisfying min_size and max_size thresholds;1: Let MAll = Get the set of all nodes or members in G;2: for each member m in MAll do3: Grow(G,min_size,max_size, {m},MAll);4: end for

784 D. Lo et al. / Information Processing and Management 49 (2013) 773–791
Algorithm 3. Baseline algorithm: grow procedure
Input: G: Signed network; min_size: Minimum size threshold; max_size: Maximum size threshold; ms: A set ofmembers; MAll: All members in G
Output: Direct antagonistic communities containing nodes in ms satisfying min_size and max_size thresholds;1: if jmsj is a DAC d satisfying min_size and max_size then2: Output d3: end if4: if jmsj + 1 still satisfies max_size then5: for each m0 2MAll but R ms then6: Let ms0 = ms
S{m0}
7: Grow(G,min_size,max_size,ms0,MAll);8: end for9: end if
At line 1 of Algorithm 3, we check whether a set of members is a DAC of size no less than the min_size threshold. To do so,the following steps are performed:
1. We run Tarjan algorithm and generate SCCs.2. We check if there are only two SCCs and both of them are of size no less than the min_size threshold.3. We check if every member of an SCC has negative edges with all members of the opposite SCC.
5. Experiments and analysis
To evaluate the scalability and efficacy of our approach, we experiment with both synthetic and real datasets. We buildour own synthetic signed network generator that generates networks of different sizes for scalability test. The efficacy test isperformed on two real datasets, a signed network from Epinions3 and another signed network from myGamma mobile socialnetwork site.4 We use the Epinions data collected by Massa and Avesani (2006). myGamma dataset is provided by our industrypartner BuzzCity. myGamma contains a friendship network where users could declare two kinds of relationships explicitly:friend or foe. The Epinions and myGamma datasets have 131,828 and 629,086 user nodes respectively, and about 841 K and8.1 M edges respectively. myGamma has roughly 4.8 times more nodes and 9.6 times more edges compared with Epinions.As not all users have edges to other users, we remove those without any edge. As shown in Table 3, in the two real datasets,more than 90% of the edges are positive ones.
Since the original myGamma and Epinions datasets lack negative edges, we also enrich the datasets with pseudo negativeedges. Our goal is to add pseudo negative edges in a principled manner that allows us to find more interesting DACs whilenot compromising the integrity of the network. For every pair of nodes, V1 and V2, at every negative edge’s end point, we tryto add negative edges from friends of V1 to V2 and vice versa. We add negative edges based on the idea that a common en-emy of one’s friends is likely to be one’s enemy. Fig. 11 illustrates an example where a pseudo negative edge is added. Wewant to decide whether we should add a pseudo negative edge between X and Y or not. If the percentage of people havingnegative relationships with Y, among those whom X has positive relationships with, exceeds a certain threshold value, then anegative edge is added. In order to determine an appropriate threshold value, given an edge exists between X and Y, from thereal datasets, we calculate the probability of the edge being a negative edge for every percentage of people who have neg-ative relationships with Y, among those whom X has positive relationships with. Fig. 12 shows the probability of adding thenegative edges for 0–100% of people who have negative relationships with Y, among those whom X has positive relationshipswith, for Epinions and myGamma datasets. The graph shows that after the percentage exceeds 25%, the probability of theedge being negative is greater than 90% for Epinions and myGamma datasets. Therefore, we use 25% as the threshold valuewhen adding pseudo negative edges.
Table 3 shows the numbers of nodes and edges for all datasets. The enriched Epinions dataset has more than twice asmany negative edges than that in the original dataset, while the enriched myGamma dataset has more than 200,000 negativeedges than the number of negative edges in the original dataset.5
We run our algorithm on an Intel (R) Core (TM) 2 2.13 GHz PC with 2 GB of RAM running 32-bit Windows XP, Service Pack3. The algorithm is written in Visual C#.Net.
5.1. Scalability experiment using synthetic datasets
We develop a synthetic signed network generator that uses three input parameters, i.e., jNj (i.e., the number of nodes inthe graph), jEj (i.e., the number of edges in the graph), and s (i.e., the proportion of negative edges). By varying the three
3 http://www.epinions.com/.4 http://www.buzzcity.com/f/mygamma.

Fig. 11. Pseudo negative edge enrichment.
Fig. 12. Probability of adding negative edges based on common enemy.
Table 3Real and enriched datasets: statistics.
Network #Nodes #+ve edges #�ve edges #Bi-directional �ve edges
Epinions 131,828 717,667 123,705 2,383(� 85.3%) (� 14.7%) (� 0.28%)
Epinions (enriched) 131,828 717,667 135,109 8,085(� 84.16%) (� 15.84%) (� 0.95%)
myGamma 629,086 7,563,927 540,083 57,074(� 93.34%) (� 6.66%) (� 0.7%)
myGamma (enriched) 629,086 7,563,927 1,794,553 684,309(� 80.82%) (� 19.18%) (� 7.31%)
D. Lo et al. / Information Processing and Management 49 (2013) 773–791 785
parameters, networks of different sizes (i.e., jNj and jEj) and composition of positive and negative edges (i.e., s) can be gen-erated. The synthetic network generation process follows the steps outlined in Algorithm 4.
Algorithm 4. Generate a synthetic signed network
Input: jNj: Number of nodes; jEj: Number of edges; s: Proportion of negative edges;Output: Synthetic Signed Network (N,E);1: Initialize N and E to be empty;2: Create jNj nodes and assign to N unique node labels;3: for each node n in N do
4: Create jEjjNj edges from n to other nodes randomly and assign them to E;
5: Randomly assign s � jEj edges from E as negative edges;6: Assign the remaining (1 � s)jEj edges from E as positive edges;7: end for8: return (N,E);

Table 4Running time for synthetic network.
Dataset Proposed algorithm (s) Baseline algorithm
(a) 0.297 372.930 s(b) 0.937 2985.169 s(c) 127.333 >24 h(d) 360.771 >24 h(e) 812.989 >24 h
Table 5Time and jDACsj: Epinions and myGamma datasets.
min_size Epinions myGamma
Time (s) jDACsj Time (s) jDACsj
1 14.8 1449 844.727 50,4552 9.5 50 82.958 503 7.7 15 78.397 44 6.9 4 76.95 05 6.7 0 81.164 0
786 D. Lo et al. / Information Processing and Management 49 (2013) 773–791
Five synthetic signed networks have been created with these parameters: (a) jNj = 100, jEj = 6000, s = 0.4; (b) jNj = 150,jEj = 13,500, s = 0.4; (c) jNj = 500,000, jEj = 15,000,000, s = 0.1; (d) jNj = 800,000, jEj = 38,400,000, s = 0.1; (e) jNj = 1,000,000,jEj = 6,000,000, s = 0.1. We mine DACs from these synthetic signed networks with min_size set to 2 using our proposed algo-rithm and our baseline algorithm (with maximum DAC size threshold set at 5).6 We show the running time for each syntheticsigned network using our proposed algorithm and our baseline algorithm in Table 4.
From Table 4, we show that our approach is able to efficiently process a large network of 1 million nodes using a lowmin_size threshold within 15 min. We also observe that the running time increases with the network size. This is particularlydue to the computing overhead of mining bi-cliques in the algorithm. We also notice that our proposed approach is morethan 1000 times faster than the baseline approach. The baseline approach is not able to complete within one day for the lar-ger signed networks (i.e., networks (c)–(e)). This result shows the power of our proposed pruning strategies.
5.2. Scalability and efficacy experiments using real datasets
We first describe our scalability experiments and then proceed to discuss our efficacy experiments that aim to distillinformation from mined DACs.
5.2.1. Scalability experimentsThe running times for mining DACs on Epinions and myGamma datasets, including the enriched datasets at various min-
imum size thresholds using our proposed approach are shown in Table 5. Our baseline approach is not able to complete forthese datasets. We show the number of direct antagonistic communities mined along with the time needed to mine them.
Table 5 shows the results on the original Epinions and myGamma datasets. As shown in the table, our algorithm com-pletes extracting all DACs from the original Epinions dataset within 14.8 s. We do not find any large DACs with sub-commu-nity size P5 in the original datasets, as there is no antagonistic community found when the min_size threshold is set to 5. Onthe original myGamma dataset, the running time ranges from 81.164 s (for min_size = 5) to 844.727 s (for min_size = 1). Wenotice that there are more DACs mined from myGamma. However, interestingly proportion-wise, Epinions dataset has DACsof slightly larger sizes. myGamma does not have any DACs of sizes 5 and above.
The result on the enriched datasets can be seen on Table 6. As shown in the table, our algorithm mines more DACs fromthe enriched datasets. We find 1766 DACs from the enriched myGamma dataset with minimum size 2. The number of minedDACs is far larger than that mined from the original myGamma dataset, which is only 50. We also find many DACs with min-imum size 5. The runtimes needed to mine DACs from the enriched datasets are comparable to the runtimes needed to mineDACs from the original datasets, except when we mine with the minimum size threshold set at 1.
5.2.2. Efficacy experimentsOur efficacy experiments on the Epinions and myGamma datasets focus on evaluating the interactions between members
of the mined DACs. As DACs are pairs of opposing sub-communities, we examine interactions among members of the samesub-communities and contrast them with the interactions between members of opposing sub-communities. We expect thefirst type of interactions to be affirmative while the second type to be unfriendly.
6 We use this threshold as the largest size of maximal DACs reported by our approach in dataset (a) is 5.

Table 6Time and jDACsj: enriched Epinions and myGamma datasets.
min_size Epinions (enriched) myGamma (enriched)
Time (s) jDACsj Time (s) jDACsj
1 22.6 2122 60745.6 65,4282 8 285 168.3 17663 7.6 139 129.5 4374 7.3 66 125.9 2045 7.2 22 119.6 118
Fig. 13. Rating scores: opposing vs allied user pairs.
D. Lo et al. / Information Processing and Management 49 (2013) 773–791 787
5.2.2.1. Epinions dataset. For the Epinions dataset, we study if members from one sub-community in a DAC tend to give poorratings to reviews made by the members from the opposing sub-community. The dataset contains a total of 1.2 M reviewsand about 4.5 M ratings. Given a pair of members (ui,uj), ui may rate reviews written by uj with ratings {rij1, . . . ,rijk}. We ana-lyze the DACs mined using a minimum size threshold of 1. In Fig. 13, we show the normalized distribution of ratings ofopposing user pairs and allied user pairs derived from DACs. For each DAC (Us,Ut), we derive the opposing user pairs as {(ui, -uj)jui 2 Us,uj 2 Ut}, and allied user pairs as {(ui,uj)jui,uj 2 Us} [ {(ui,uj)jui,uj 2 Ut}. As shown in the Fig. 13, the ratings of oppos-ing user pairs have significantly smaller values compared to those of allied user pairs. On the original Epinions dataset, theproportion of rating 5 among opposing user pairs (�60%) is smaller than that of allied user pairs (�95%). The proportion ofrating 2 among opposing user pairs (�22%) is higher than that of allied user pairs (�0%). We also show the relative frequencydistribution of ratings made by other user pairs not involved in DACs as the line labeled ‘‘General’’ in Fig. 13. These ‘‘General’’user pairs also have a small proportion of rating 2 compared to that of opposing user pairs. This shows that ratings betweenopposing sub-communities are usually low due to hostile relationships between the sub-communities, while ratings be-tween members of the same sub-communities are typically higher. The result from the enriched Epinions dataset followsthe same trend as that from the original Epinions dataset.
Fig. 14 shows the number of ratings made by users on articles written by other users in the opposing sub-communitiesand within the same sub-communities in the mined DACs. It could be seen from the original and the enriched Epinions data-sets that members of the same sub-communities tend to give more ratings than members of opposing sub-communities.This is an interesting result because the self selection behavior of users influences the number of ratings they give to otherusers. The smaller number of ratings of opposing user pairs suggests that opposing users are less likely to rate each other’sreviews compared with allied users.
5.2.2.2. myGamma dataset. For the myGamma dataset, we also study if the behavior of allied user pairs differs from that ofthe opposing user pairs. We analyze the DACs mined using a minimum size threshold of 2. As rating data is not available, weexamine their group affiliations. myGamma users can form groups and each user can join multiple groups at the same time.Let Gk represents the set of groups which user uk joins. We define the group overlap similarity of a pair of users ui and uj to bethe Jaccard similarity of Gi and Gj:
gsimðui;ujÞ ¼Gi \ Gj
Gi [ Gjð1Þ
Note that gsim is symmetric, i.e., gsim(ui,uj) = gsim(uj,ui).

Fig. 15. Group overlap similarity: opposing vs allied user pairs.
Fig. 14. Number of ratings: opposing vs allied user pairs.
788 D. Lo et al. / Information Processing and Management 49 (2013) 773–791
Fig. 15 shows the distribution of group overlap similarities of opposing user pairs and allied user pairs in the mined DACs.On zero group overlap similarity, the relative number of opposing user pairs in the original and enriched myGamma datasetare greater than that of allied user pairs, while on group overlap similarity greater than zero, the relative number of allieduser pairs in both the original and enriched myGamma datasets are greater than that of opposing user pairs.
We also perform hypothesis testing at 0.01 level of significance and we find that, for the Epinions dataset, the distributionof rating scores, distribution of number of ratings, and for the myGamma dataset, the distribution of group overlaps, among userpairs in opposing sub-communities in a DAC differ significantly from those in the same sub-community.
6. Discussion
In this section, we discuss the applicability of mined DACs, the scalability of our approach, and other interesting pointsand issues.

D. Lo et al. / Information Processing and Management 49 (2013) 773–791 789
6.1. Applications of mined DACs
Employing our technique on a signed network would produce a set of direct antagonistic communities. These communi-ties could be used for various purposes. The following paragraphs highlight three of the many potential applications whichwe leave as future work.
First, DACs could be used to enrich past studies on sociology on antagonistic behaviors of communities. Different frommany sociology studies that investigate datasets of small sizes, we are able to analyze a large amount of data from Web2.0. Mined DACs would be the first step to analyze questions such as: Why a sub-community opposes another? What aresome patterns of antagonistic behaviors? How long do antagonistic behaviors persist? Do people change their antagonisticbehaviors frequently? What are some common precursor events that trigger antagonistic behaviors?
Second, mining and monitoring DACs could have direct application in preventing unwanted escalated tensions amongvarious factions either in a company or in a community. Differences in opinions is generally good however too much of itcould create inefficiency in a company, or even violence, riot, or anarchy in a community.
Third, mining DACs could have potential applications in marketing. Increasing sales in a sub-community could meanreducing sales in the opposing sub-community. One could optimize a marketing strategy based on the DACs and other infor-mation, e.g., the purchasing power of different market segments/sub-communities.
6.2. Time complexity
Let us consider an input network or graph G = (N,E). As described in Section 4, our approach consists of several steps: prun-ing by positive edges, pruning by negative edges, formation of DACs, and removal of redundant DACs. The complexity of ouralgorithm is the sum of its parts. Let us consider the time complexity of each step. During pruning by positive edges, we runTarjan’s algorithm. The complexity of Tarjan’s algorithm is O(jNj + jEj) (Tarjan, 1972). During pruning by negative edges, werun the maximal bi-clique mining algorithm by Li et al. (2007). The complexity of the maximal bi-clique mining algorithmis O(jNj � jEj � jMBj), where jMBj is the number of maximal bi-cliques that are output by the algorithm (Li et al., 2007). Duringthe formation of DACs, we go through each maximal bi-clique and generate zero or more DACs. Typically each maximal bi-clique is small, and only a few DACs are constructed (if any) from it. Thus, let us consider the cost of constructing DACs fromone maximal bi-clique to be a small constant c. Thus the time complexity of forming DACs is O(jMBj � c). During the removalof redundant DACs, we compare each DAC with other mined DACs. The time complexity of this step is thus O(jDACj2), wherejDACj is the number of mined DACs before the non-redundancy removal step is performed. Typically there are only a smallnumber of redundant DACs. Thus the overall time complexity is O((jNj + jEj) + (jNj � jEj � jMBj) + (jMBj � c) + (jDACj2)). Theabove could be simplified to O((jNj � jEj � jMBj) + (jDACj2)). Since, jDACj2 is typically much smaller than jNj � jEj � jMBj, thetime complexity could be further simplified to O(jNj � jEj � jMBj). This is the complexity of the maximal bi-clique mining algo-rithm, which is the most expensive operation, as noted in our experiments.
6.3. Scalability and dealing with large signed networks
Although some parts of our algorithm (bi-clique extraction) could be expensive in the worst case, similar to other patternmining algorithms in typical cases the process runs much faster. We have conducted a scalability experiments on syntheticnetworks containing up to 1 million nodes. We have also shown the scalability of our algorithm on a large real-life networkextracted from myGamma (>600 k nodes, >7 m edges). On these datasets, we show that our algorithm is able to completewithin 15 min. Our future work will investigate the scalability of our approach on yet larger networks with positive and neg-ative edges.
6.4. Ground truth
Unfortunately as with many other studies on community mining ground truth is hard to be obtained. Still we conductefficacy experiments to contrast the interactions of members in the same sub-community with those among members inopposing sub-communities. If the mined DACs are correct, we expect to see significant differences. In Section 5.2.2, we showthat there are statistically significant differences between the rating scores and the number of ratings given between oppos-ing and allied user pairs in Epinions dataset. We also show that opposing user pairs have lower group overlap similaritiesthan allied user pairs in myGamma dataset.
6.5. Relaxing SCC constraint
In this paper, we require each of the two sub-communities in a DAC to be a strongly connected component (with respectto positive edges). It is also possible to relax this further to only require that only X% of the nodes are connected to othernodes in the sub-community or even to change the requirement to check for densely connected sub-communities. We leavethese extensions for future work.

790 D. Lo et al. / Information Processing and Management 49 (2013) 773–791
6.6. Comparisons to other baselines
To the best of our knowledge, this is the first work on mining direct antagonistic communities. Thus, in this work, we donot compare to other techniques as there is no existing comparable technique. The nearest work to ours is that by Zhanget al. (2010) which mine for two opposing groups of people who rate many items differently from rating datasets. In thiswork, we consider signed networks and mine for direct antagonistic communities considering the positive and negativeedges in the networks. The problems are different and require different mining strategies. The two kinds of antagonistic com-munities are not directly comparable.
6.7. Volatility and evolution of antagonistic communities
In this work, we only consider a single snapshot of the signed network. It would be interesting to perform a longitudinalstudy and investigate the nature of antagonistic communities as they evolve over time. Are the communities stable or vol-atile? We plan to investigate this and other related questions in our future work.
7. Conclusion and future work
In this study, we analyze large signed networks to extract direct antagonistic communities (DACs). Within a DAC there aretwo opposing sub-communities. Members within a sub-community form a network of positive edges, while members fromthe opposing community have bi-directional negative relationships.
We propose a new framework to extract DACs efficiently from large networks. Our approach consists of several stepsincluding: pruning of nodes not involved in any sizable network of positive edges, detection of bi-cliques with respect tobi-directional negative edges among two sets of users, formation of DACs from these bi-cliques, and detection of redundantDACs. Experiments have been conducted on both synthetic and real datasets. On the synthetic dataset our approach is able toscale to 1,000,000 nodes and 6,000,000 edges.
Zooming deeper into mined antagonistic communities, we notice that user pairs from opposing sub-communities tend togive lower and fewer ratings than those from the same sub-communities in the Epinions dataset. Members from opposingsub-communities tend to join fewer common groups than members in the same sub-communities in the myGamma dataset.
As future work, we plan to investigate the evolution of DACs as a social network changes over time. Also, we plan to inves-tigate factors leading to the creation of antagonistic communities. Further experiments on effects of antagonistic communi-ties and analysis of other signed social networks would be interesting. It would also be of interest to extend our miningalgorithm to accommodate various possible extensions described in Section 6.
Acknowledgments
We would like to thank Paolo Massa for sharing his Epinions dataset. We also would like to thank myGamma for sharingtheir dataset with us, and National Research Foundation (NRF) (NRF2008IDM-IDM004-036) for funding the work.
References
Agrawal, R. & Srikant, R. (1994). Fast algorithms for mining association rules. In International conference on very large data bases (VLDB).Alexe, G., Alexe, S., Crama, Y., Foldes, S., Hammer, P. L., & Simeone, B. (2004). Consensus algorithms for the generation of all maximal bicliques. Discrete
Applied Mathematics, 145, 11–21.Cai, D., Shao, Z., He, X., Yan, X., & Han, J. (2005). Community mining from multi-relational networks. In European conference on machine learning and principles
and practice of knowledge discovery in databases (ECML/PKDD).Dasgupta, I. (2009). ‘Living’ wage, class conflict and ethnic strife. Journal of Economic Behavior & Organization, 72(2), 750–765.Dasgupta, I., & Kanbur, R. (2007). Community and class antagonism. Journal of Public Economics, 91(9), 1816–1842.Denrell, J. (2005). Why most people disapprove of me: Experience sampling in impression formation. Psychological Review, 112(4), 951–978.Ding, B., Lo, D., Han, J., & Khoo, S. -C. (2009). Efficient mining of closed repetitive gapped subsequences from a sequence database. In IEEE international
conference on data engineering (ICDE).Doreian, P., & Mrvar, A. (2009). Partitioning signed social networks. Social Networks., 31, 1–11.Easley, D., & Kleinberg, J. (2010). Positive and negative relationships. In Networks, crowds, and markets: Reasoning about a highly connected world
(pp. 119–152). Cambridge University Press.Eppstein, D. (1994). Arboricity and bipartite subgraph listing algorithms. Information Processing Letters, 51, 207–211.Giles, M., & Evans, A. (1986). The power approach to intergroup hostility. The Journal of Conflict Resolution, 30(3), 469–486.Girvan, M., & Newman, M. E. J. (2002). Community structure in social and biological networks. Proceedings of the National Academy of Sciences of the United
States of America, 99(12), 7821–7826.Johnson, S. C. (1967). Hierarchical clustering schemes. Psychometrika, 2, 241–254.Katz, L. (1953). A new status index derived from sociometric analysis. Psychometrika, 18(1), 39–43.Labovitz, S., & Hagedorn, R. (1975). A structural–behavioral theory of intergroup antagonism. Social Forces, 53(3), 444–448.Leicht, E. A., & Newman, M. E. J. (2008). Community structure in directed networks. Physics Review Letter, 100(11), 118703.Li, J., Liu, G., Li, H., & Wong, L. (2007). Maximal biclique subgraphs and closed pattern pairs of the adjacency matrix: A one-to-one correspondence and
mining algorithms. IEEE Transactions on Knowledge and Data Engineering (TKDE), 19(12), 1625–1637.Lo, D., Khoo, S. -C., & Liu, C. (2007). Efficient mining of iterative patterns for software specification discovery. ACM SIGKDD conference on knowledge discovery
and data mining (KDD).Lo, D., Surian, D., Zhang, K., & Lim, E. -P. (2011). Mining direct antagonistic communities in explicit trust networks. In ACM conference on information and
knowledge management (CIKM) (pp. 1013–1018).

D. Lo et al. / Information Processing and Management 49 (2013) 773–791 791
Makino, K., & Uno, T. (2004). New algorithms for enumerating all maximal cliques. In 9th Scandinavian workshop on algorithm theory.Massa, P., & Avesani, P. (2006). Trust-aware bootstrapping of recommender systems. In Proc. of ECAI workshop on recommender systems (pp. 29–33).Newman, M. E. J. (2004). Fast algorithm for detecting community structure in networks. Physics Review, E(69).Ravasz, E., Somera, A. L., Mongru, D. A., Oltvai, Z. N., & Barabasi, A.-L. (2002). Hierarchical organization of modularity in metabolic networks. Science,
297(5586), 1551–1555.Scott, J. (2000). Social network analysis: A handbook. Sage Publications.Tarjan, R. (1972). Depth-first search and linear graph algorithms. SIAM Journal on Computing, 1(2), 146–160.Tolsma Jochem Graaf, N. D., & Quillian, L. (2009). Does intergenerational social mobility affect antagonistic attitudes toward ethnic minorities? British
Journal of Sociology, 60(2), 257–277.Vuong, B. -Q., Lim, E. -P., Sun, A., Le, M. -T., Lauw, H., & Chang, K. (2008). On ranking controversies in wikipedia: Models and evaluation. In ACM international
conference on web search and data mining (WSDM).Wang, J., & Han, J. (2004). BIDE: Efficient mining of frequent closed sequences. In IEEE international conference on data engineering (ICDE).Wang, J., Han, J., & Pei, J. (2003). Closet+: Searching for the best strategies for mining frequent closed itemsets. In ACM SIGKDD conference on knowledge
discovery and data mining (KDD).White, D. R., Harary, F., Sobel, M., & Becker, M. (2001). The cohesiveness of blocks in social networks: Node connectivity and conditional density. Sociological
Methodology..Yan, X., & Han, J. (2002). gSpan: Graph-based substructure pattern mining. In IEEE international conference on data mining (ICDM).Yan, X., Han, J., & Afhar, R. (2003). CloSpan: Mining closed sequential patterns in large datasets. In SIAM conference on data mining (SDM).Yang, B., Cheung, W., & Liu, J. (2007). Community mining from signed social networks. IEEE Transactions on Knowledge and Data Engineering (TKDE), 19(10),
1333–1348.Yang, B., & Liu, D.-Y. (2007). A heuristic clustering algorithm for mining communities in signed networks. Journal of Computer Science and Technology, 22,
320–328.Zaki, M. (2000). Scalable algorithms for association mining. IEEE Transactions on Knowledge and Data Engineering (TKDE), 12, 372–390.Zhang, K., Lo, D., & Lim, E. -P. (2010). Mining antagonistic communities from social networks. In Pacific-Asia conference on knowledge discovery and data
mining (PAKDD).