migration and remittances during the global financial...
TRANSCRIPT
Migration and Remittances during the Global Financial Crisis and Beyond
Ibrahim Sirkeci
Jeffrey H. Cohen
Dilip Ratha
Editors
Pub
lic D
iscl
osur
e A
utho
rized
Pub
lic D
iscl
osur
e A
utho
rized
Pub
lic D
iscl
osur
e A
utho
rized
Pub
lic D
iscl
osur
e A
utho
rized


Migration and Remittances during the Global Financial Crisis and Beyond


Migration and Remittances during the Global Financial Crisis and Beyond
Edited by
Ibrahim Sirkeci
Jeffrey H. Cohen
Dilip Ratha
Washington, D.C.

© 2012 International Bank for Reconstruction and Development / International Development
Association or Th e World Bank
1818 H Street NW
Washington DC 20433
Telephone: 202-473-1000
Internet: www.worldbank.org
1 2 3 4 15 14 13 12
Th is volume is a product of the staff of Th e World Bank with external contributions. Th e
fi ndings, interpretations, and conclusions expressed in this volume do not necessarily refl ect the
views of Th e World Bank, its Board of Executive Directors, or the governments they represent.
Th e World Bank does not guarantee the accuracy of the data included in this work.
Th e boundaries, colors, denominations, and other information shown on any map in this work
do not imply any judgment on the part of Th e World Bank concerning the legal status of any
territory or the endorsement or acceptance of such boundaries.
Rights and Permissions
Th e material in this work is subject to copyright. Because Th e World Bank encourages
dissemination of its knowledge, this work may be reproduced, in whole or in part, for
noncommercial purposes as long as full attribution to the work is given.
For permission to reproduce any part of this work for commercial purposes, please
send a request with complete information to the Copyright Clearance Center Inc., 222
Rosewood Drive, Danvers, MA 01923, USA; telephone: 978-750-8400; fax: 978-750-4470;
Internet: www.copyright.com.
All other queries on rights and licenses, including subsidiary rights, should be
addressed to the Offi ce of the Publisher, Th e World Bank, 1818 H Street NW, Washington, DC
20433, USA; fax: 202-522-2422; e-mail: [email protected].
ISBN (paper): 978-0-8213-8826-6
ISBN (electronic): 978-0-8213-8827-3
DOI: 10.1596/978-0-8213-8826-6
Library of Congress Cataloging-in-Publication Data
Migration and remittances during the global fi nancial crisis and beyond / edited by Ibrahim
Sirkeci, Jeff rey H. Cohen and Dilip Ratha.
p. cm.
Includes bibliographical references and index.
ISBN 978-0-8213-8826-6 — ISBN 978-0-8213-8827-3 (electronic)
1. Emigration and immigration—Economic aspects. 2. Global Financial Crisis, 2008-2009.
3. Immigrants—Economic aspects. 4. Emigrant remittances—Cross-cultural studies. I. Sirkeci,
Ibrahim. II. Cohen, Jeff rey H. (Jeff rey Harris) III. Ratha, Dilip.
JV6217.M545 2011
332’.04246090511—dc23
2011032374
Cover image: Diana Ong/Superstock by Getty Images
Cover design: Critical Stages

v
Contents
Foreword ............................................................................................................................xvOtaviano Canuto and Hans Timmer
Acknowledgments ........................................................................................................... xvii
Contributors ......................................................................................................................xix
Abbreviations ................................................................................................................. xxvii
Introduction: Remittance Flows and Practices during the Crisis ...................................... 1Ibrahim Sirkeci, Jeff rey H. Cohen, and Dilip Ratha
PART I
Chapter 1. Theoretical Appraisal: Understanding Remittances ...................................... 15Jeff rey H. Cohen and Ibrahim Sirkeci
Chapter 2. Forecasting Migrant Remittances during the Global Financial Crisis ........... 23Sanket Mohapatra and Dilip Ratha
Chapter 3. Economic Crises and Migration: Learning from the Past and the Present ... 35Tim Green and L. Alan Winters
Chapter 4. Remittance Flow, Working Capital Formation, and Economic Growth ........ 53Gabriela Mundaca
PART II
Chapter 5. The Financial Crisis in the Gulf and Its Impact on South Asian Migration and Remittances .......................................................................... 67
S. Irudaya Rajan and D. Narayana
Chapter 6. Gendered Use of Remittances: The United Arab Emirates–Bangladesh Remittance Corridor ......................................................................................................... 81
Md Mizanur Rahman and Danièle Bélanger
Chapter 7 Trends and Correlates of Remittances to India ............................................. 93Poonam Gupta and Karan Singh
vi l CONTENTS
Chapter 8. Shocks Affecting the Flow and Stability of Workers’ Remittances to India ....................................................................................................... 107
Bhupal Singh
Chapter 9. Migrant Remittances in Nepal: Impact of Global Financial Crisis andPolicy Options ................................................................................................................ 121
Sanket Mohapatra, Dilip Ratha, and Ani Silwal
Chapter 10. Nepal: Migration History and Trends ........................................................ 137Jeevan Raj Sharma
Chapter 11. Resilience of Remittances during the Global Financial Crisis and the Entrenchment of Migration ............................................................................................ 141
Andrea Riester
Chapter 12. Rural-Urban Migration in the Context of Thailand’s Ongoing Uneven Development ................................................................................................................. 149
Gregory S. Gullette
Chapter 13. Migration and Remittances in Bangladesh and Pakistan: Evidence from Two Host Countries ............................................................................... 153
Guntur Sugiyarto, Carlos Vargas-Silva, and Shikha Jha
Chapter 14. Impacts of the Crisis on Migrants and Their Families: A Case Study from Bangladesh ...................................................................................... 171
Guntur Sugiyarto, Selim Raihan, Carlos Vargas-Silva, and Shikha Jha
PART III
Chapter 15. The Impact of the Financial Crisis on Remittance Flows: The Case of El Salvador .................................................................................................. 183
Pablo Acosta, Javier Baez, Rodolfo Beazley, and Edmundo Murrugarra
Chapter 16. Remittance Flows to Mexico and Employment and Total Earnings of Mexican Immigrant Workers in the United States ......................................................... 193
Jesús A. Cervantes González and Alejandro Barajas del Pino
PART IV
Chapter 17. The Impact of the Global Economic Downturn on Remittances from the European Union ............................................................................................... 215
Oscar Gómez Lacalle
Chapter 18. Remittances and Evolving Migration Flows from Central and Eastern Europe to the United Kingdom ......................................................................... 227
Simon Pemberton and Lisa Scullion
Chapter 19. Effects of the Global Crisis on Migration and Remittances in Albania .... 237Ilir Gedeshi and Nicolaas de Zwager
Chapter 20. The Impact of the Global Financial Crisis on Migration to and Remittance Flows from Spain ......................................................................................... 255
Marta Roig and Joaquín Recaño-Valverde
PART V
Chapter 21. Forecasting Turkish Workers’ Remittances from Germany during the Financial Crisis .............................................................................................. 273
Şule Akkoyunlu

CONTENTS l vii
Chapter 22. Remittances in an Environment of Human Insecurity: The Kurdish Case ............................................................................................................ 289
Ibrahim Sirkeci
Chapter 23. Financial Crisis and Remittances from Denmark to Turkey ....................... 295Pinar Yazgan and Ibrahim Sirkeci
Chapter 24. Work and Remittance Patterns of Irregular Immigrants in Turkey ............ 303Oğuzhan Ömer Demir and M. Alper Sozer
PART VI
Chapter 25. Labor Migration, Overseas Remittances, and Local Outcomes in the Contemporary Philippines .............................................................................................. 315
Ty Matejowsky
Chapter 26. The New Zealand–Pacifi c Remittance Corridor: Lowering Remittance Costs ............................................................................................ 319
Don Abel and Kim Hailwood
Chapter 27. Role of Trade Openness, Remittances, Capital Infl ows, and Financial Development in Vanuatu ................................................................................................ 325
Ronald R. Kumar
PART VII
Chapter 28. Remittances to Sub-Saharan Africa in the Wake of a Financial Crisis: Source of Resilience or Vulnerability? ............................................................................. 337
Wim Naudé and Henri Bezuidenhout
Chapter 29. From Shock Absorber to Shock Transmitter: Determinants of Remittances in Sub-Saharan Africa...................................................... 349
Raju Jan Singh
Chapter 30. A Comparative Examination of Women’s Remittance Practices in Two Somali Communities: Johannesburg, South Africa, and Columbus, Ohio ............. 359
Marnie Shaff er
PART VIII
Chapter 31. The Global Crisis and Expatriates’ Remittances to Lebanon .................... 365Nassib Ghobril
Chapter 32. Migrant Transfers in the MENA Region: A Two-Way Street in Which Traffi c Is Changing .......................................................................................................... 377
George Naufal and Carlos Vargas-Silva
Bibliography .................................................................................................................... 387
Index ............................................................................................................................... 421
FiguresI.1 Resilience of Remittances Compared to Other Financial Flows to Developing
Countries .........................................................................................................................................2
3.1 Real GDP per Capita with and without the Current Crisis, 1980–2013 ..........................37
3.2 Population of Ireland during the Nineteenth Century ........................................................38

viii l CONTENTS
3.3 Emigration from the British Isles to the United States and British GDP Growth,
1831–1913 .....................................................................................................................................40
3.4 Emigration of British Citizens from the British Isles to the United States and
British GDP Growth, 1853–1913 .............................................................................................40
3.5 (Lagged) Emigration of British Citizens from the British Isles to the United States
and British GDP Growth, 1853–1913 .....................................................................................41
3.6 Emigration to the United States from Five European Countries and U.S. GDP
Growth, 1870–1913 ....................................................................................................................41
3.7 Emigration Rates to the United States, 1860–1913 ..............................................................42
3.8 GDP Growth, Th en and Now ....................................................................................................46
3.9 Change in Unemployment Rates for Native- and Foreign-Born Workers, Selected
OECD Countries, Th ird Quarter 2008 to Th ird Quarter 2009 .........................................51
6.1 Bangladeshi Labor Migration to the United Arab Emirates, 1976–2010 .........................84
6.2 Infl ows of Remittances from the United Arab Emirates to Bangladesh, 1998–2011 ....84
7.1 Remittances to India ...................................................................................................................94
7.2 Current Account Infl ows, 1991–2009 .....................................................................................95
7.3 Net Remittances versus Net Capital Infl ows, 1991–2009 ...................................................96
8.1 Structure of Workers’ Remittances to India, 1975–2010 ................................................. 108
8.2 Impulse Response of Workers’ Remittances to Various Shocks in Model 1 ................ 115
8.3 Impulse Response of Workers’ Remittances to Various Shocks in Model 2 ................ 116
8.4 Annual Growth Rate in Workers’ Remittance Infl ows to India, 1992–2010 ................ 117
9.1 Primary Destinations of Nepalese Migrants, Excluding India,
1999–2000 to 2009–10 ........................................................................................................... 123
9.2 Growth in Remittances and Other Sources of External Finance Sent to Nepal,
1996–2010 .................................................................................................................................. 125
9.3 Remittances to Nepal during the Crisis, April 2007–October 2010 .............................. 127
9.4 Growth in Mobile Phone Subscriptions in Nepal, 2003–08 ............................................ 131
13.1 Remittances to Bangladesh ..................................................................................................... 156
13.2 Remittances to Pakistan .......................................................................................................... 156
13.3 Remittances from the United Kingdom to Bangladesh .................................................... 159
13.4 Remittances from the United States to Bangladesh .......................................................... 159
13.5 Labor Force Participation Rate of Asians in the United States ....................................... 161
13.6 Unemployment Rate of Asians in the United States ......................................................... 161
13.7 Number of Bangladesh and Pakistan Nationals Currently Residing in the
United Kingdom ....................................................................................................................... 164
13.8 Unemployment Rate of Th ose Born in Pakistan and Bangladesh Currently
Residing in the United Kingdom ........................................................................................... 164
13.9 Unemployment Rate of Nationals of Pakistan and Bangladesh Currently
Residing in the United Kingdom ........................................................................................... 165
13.10 U.S. Dollar and U.K. Pound Exchange Rate with Respect to Bangladeshi Taka .......... 168
13.11 U.S. Dollar and U.K. Pound Exchange Rate with Respect to Pakistani Rupee ............. 168
14.1 Knowledge about the Global Financial Crisis .................................................................... 173
14.2 Expected Period of Impact of Global Financial Crisis According to Households
Reporting Relatively or Very Good Knowledge ................................................................. 173

CONTENTS l ix
14.3 Average Number of Family Members Working Abroad before and during the
FInancial Crisis ......................................................................................................................... 174
14.4 Change in Household Income between 2008 and 2009.................................................... 177
15.1 El Salvador: Main Macroeconomic Indicators ................................................................... 184
15.2 Growth in Remittances to El Salvador in Comparison to Growth in U.S. GDP and
Unemployment ......................................................................................................................... 187
15.3 U.S. Unemployment Rates for Total Population and for Hispanics, 2005–10 ............. 188
15.4 Annual Growth in Remittance Infl ows to El Salvador by Region ................................... 189
16.1 Evolution of Remittance Flows to Mexico, 2000–10 ......................................................... 194
16.2 Remittance Flows to Mexico, 1996–2010 ............................................................................ 194
16.3 Mexican Immigrants in the United States, 2009 ................................................................ 196
16.4 Unemployment Rate of Mexican Immigrants, Native Population, and
Total Population in the United States ................................................................................... 205
16.5 Annual Percentage Variations of Wage and Salary Mexican Immigrant
Workers in the United States, 2008–10 ............................................................................... 209
16.6 Proportion of Part-Time Employed among Wage and Salary Mexican
Immigrant Workers, 2007–10 ................................................................................................ 210
16.7 Number of Wage and Salary Mexican Immigrant Workers in the
United States and Th eir Annual Total Earnings, 2007–10 ............................................... 210
17.1 EU Remittances by Destination, 2004–09 ........................................................................... 217
17.2 Workers’ Remittances by Destination, 2004–09 ................................................................ 218
17.3 Spain: Migrant Active Population and Remittance Outfl ows, 2006–10 ....................... 220
17.4 EU: Total Growth in Employment and Remittance Outfl ows, 2006–10 ...................... 221
17.5 Total Employment and Remittance Outfl ows in the European Union, 2004–12 ........ 222
19.1 Employment Sectors of Albanian Migrants in Host Countries, 2009–10 .................... 240
19.2 GDP Growth and Unemployment Rates in Greece and Italy, 1998–2012 .................... 241
19.3 Impact of Economic Crisis on Albanian Households in Migration in 2009 ................ 241
19.4 Months of Unemployment for Albanian Migrants in Greece and Italy, 2009.............. 243
19.5 Rate of Unemployment of Albanian Migrants in Italy and Greece, by Sector,
2009–10 ...................................................................................................................................... 244
19.6 Unemployment Benefi t–Receiving Migrants in Main Host Countries by Gender,
2009–10 ...................................................................................................................................... 244
19.7 Projected Time to Return Home of Respondents Who Are Considering
Th is Option, 2009–10 .............................................................................................................. 252
20.1 Infl ow of Foreign-Born Persons by Country of Birth, 2004–09 ...................................... 256
20.2 Foreign-Born Population by Country of Birth (Selected Groups Only), 2000–10 ...... 257
20.3 Outfl ows of Remittances per Quarter, Total and per Foreign-Born Person,
2000–10 ...................................................................................................................................... 259
20.4 Outfl ows of Remittances by Country of Destination, 2004–09 ...................................... 260
20.5 Unemployment by Nationality, 2001–10 ............................................................................. 263
21.1 Ratio of Total Turkish Workers’ Remittances to Current Account Infl ows to
Turkey, 1963–2009 ................................................................................................................... 274
21.2 Turkish Workers’ Remittances Total and from Germany, 1963–2009 .......................... 275

x l CONTENTS
21.3 Turkish Workers’ Remittances from Germany and Other Financial Flows to
Turkey, 1963–2009 ................................................................................................................... 276
21.4 Growth Rates of Real per Capita GDP and Unemployment for Germany and
Turkey ......................................................................................................................................... 277
21.5 Turkish and German Real Short-Term Interest Rates, Th eir Diff erences, and
Turkish Workers’ Remittances from Germany, 1963–2009............................................. 278
21.6 Total and Turkish Employment in Germany, 1991–2009 ................................................ 279
21.7 Turkish Employment in Germany by Sector, 1987–2009 ................................................ 279
21.8 Total and Turkish Unemployment in Germany, 1998–2009 ........................................... 279
21.9 Turkish Population in Germany and Turkish Infl ows, Outfl ows, and Net Flows,
1963–2009 .................................................................................................................................. 280
23.1 Turkish-Born Immigrants in Denmark, 1990–2011 ......................................................... 297
23.2 Remittance-Sending Behavior of Danish Turks by Country of Birth, 2010 .................. 298
23.3 Remittance Outfl ows from Denmark, 1992–2009 ............................................................ 300
27.1 Remittance and Capital Flows to Developing Countries, 1990–2009 ........................... 326
29.1 Remittances by Major Region ................................................................................................ 350
29.2 Main Recipients of Remittances, 2008 ................................................................................. 351
29.A1 Construction of the Stock of Expatriate Data ..................................................................... 357
31.1 Impact of Crisis on Remittance Infl ows as Percentage of GDP ...................................... 369
31.2 Main Reasons for Emigration from Lebanon, 1992–2007 ............................................... 370
31.3 Main Sources of Electronic Cash Transfers to Lebanon, 2009 ........................................ 372
32.1 Mean Remittance Flows in the MENA Region, 1970–2008 ............................................ 381
32.2 Annual Growth Rate of Remittances from GCC Countries to Bangladesh,
Pakistan, and the Philippines, January 2009–May 2010 ................................................... 383
Tables3.1 Offi cial Estimates of the Total Number of Foreign Workers in Asian Economies,
1996–2000 ....................................................................................................................................45
5.1 Real GDP Growth Rates in Selected Countries .....................................................................70
5.2 Share of Employment across Economic Activities in GCC Countries, 2007 ..................71
5.3 Projects Aff ected by the Crisis in the GCC ............................................................................72
5.4 Government Expenditure in the GCC Countries, 2006–11 ...............................................73
5.5 Estimated Number of Migrants Returning to Kerala Due to Crisis in 2009 ...................74
5.6 Estimates of Emigrants Returning to South Asia from the Gulf Due to Crisis, 2009 ....74
5.7 Average Cost of Emigration for Diff erent Migration Corridors from Kerala, 2008 .......75
5.8 Channels of Migration by Emigrants, 2007 ............................................................................76
5.9 Estimates of Emigrants Who Lost Job in the Gulf but Did Not Return, 2009 ................76
5.10 Flow of Migrant Workers from South Asia to the Gulf, 2005–09 .....................................77
5.11 Inward Remittances to South Asian Countries, 2000–09 ...................................................79
6.1 “Near Past” and “Near Future” Use of Remittances by Gender: Household and
Migrant Worker Surveys, 2009 .................................................................................................88
7.1 Volatility Measure of Current and Capital Infl ows ..............................................................97
7.2 Volatility Measure of Net Current and Capital Infl ows ......................................................97
7.3 Trend in Remittances ..................................................................................................................98

CONTENTS l xi
7.4 Correlates of Remittances between 1992 and 2010 ........................................................... 100
7.5 Correlates of Remittances between 1992 and 2003 ........................................................... 101
7.6 Correlates of Remittances between 2004 and 2010 ........................................................... 102
8.1 Source Regions of Workers’ Remittances to India ............................................................. 110
8.2 Relative Volatility of Workers’ Remittance Infl ows to India ............................................ 111
8.3 Volatility in the Components of Workers’ Remittances to India .................................... 112
8.4 Johansen Cointegration Test .................................................................................................. 113
8.5 Long-Run Cointegrating Estimates of Workers’ Remittance Infl ows to India
Based on Vector Error Correction Model ........................................................................... 113
8.6 Error Correction: Short-Run Dynamics ............................................................................. 114
8.7 Variance Decomposition of Workers’ Remittances ........................................................... 116
9.1 Remittance Flows to South Asia and to Nepal Grew at a Slower Rate during the
Global Financial Crisis but Did Not Decline ...................................................................... 126
9.2 Cost of Sending $200 to Nepal, June 2009 .......................................................................... 128
13.1 Remittances to Bangladesh and Pakistan ............................................................................ 158
13.2 Correlation of Remittances and U.S. Labor Market Indicators ...................................... 162
13.3 Correlation of Remittances with U.K. Labor Market Indicators .................................... 166
14.1 Distribution of Samples ........................................................................................................... 172
14.2 Receiving Remittances from Migrants ................................................................................ 175
14.3 Average Amount of Remittances Received ......................................................................... 175
14.4 Frequency of Remittances Received before and during the Crisis ................................. 175
14.5 Channels of Remitting before and during the Crisis ........................................................ 176
14.6 Reasons for the Decrease in Income..................................................................................... 177
14.7 Reasons for Income Loss and Ways to Compensate ......................................................... 178
14.8 Migrants Returning Home in 2008 and 2009 .................................................................... 178
14.9 Change in Employment Condition and Responses ........................................................... 179
16.1 Population and Immigrants in the United States, 2008–09 ............................................. 195
16.2 Mexican Workers and Immigrants in the United States, 2009 ....................................... 197
16.3 Average Monthly Earnings of Wage and Salary Mexican Immigrant
Workers in the United States, 2008–09 ............................................................................... 197
16.4 Total Earnings of Wage and Salary Workers and of Mexican Immigrants
in the United States, 2009 ....................................................................................................... 198
16.5 Variation in the Total Earnings of Wage and Salary Workers and of Mexican
Immigrants in the United States, 2009 ................................................................................. 199
16.6 Number and Annual Total Earnings of Wage and Salary Mexican Immigrant
Workers in the United States with Full- or Part-Time Jobs, 2008–09 ........................... 200
16.7 Number and Annual Total Earnings of Wage and Salary Mexican Immigrant
Workers in the United States by Citizenship Status, 2008–09 ........................................ 201
16.8 Total Employed Labor Force and Mexican Immigrant Workers in the
United States by Industry Sector, 2009 ................................................................................ 202
16.9 Unemployment Rates in the United States, 2006–10 ....................................................... 203
16.10 Years of Education of Mexican Immigrants, 2009 ............................................................. 204
16.11 Educational Attainment among Wage and Salary Mexican Immigrant Workers,
2009 ............................................................................................................................................. 205

xii l CONTENTS
16.12 Variation in Number and Annual Earnings of Wage and Salary Mexican
Immigrant Workers by Educational Attainment, 2009..................................................... 206
16.13 Total Earnings of Wage and Salary Mexican Immigrant Workers by Educational
Attainment, 2009 ...................................................................................................................... 207
16.14 Total Employed and Unemployed Labor Force and Mexican Immigrants,
First and Second Semesters, 2009 and 2010 ....................................................................... 209
17.1 Top 10 Remittance-Sending Member States, 2009 ............................................................ 218
17.2 Top 10 Workers’ Remittance-Sending Member States, 2009 .......................................... 219
17.3 Selected Member States’ Employment Forecasts, 2009–12 ........................................... 223
17.4 Main EU Corridors, 2009 ........................................................................................................ 224
19.1 Estimate of Financial Well-Being of Albanian Migrant Households Comparing
2008 and 2009............................................................................................................................ 246
19.2 Comparison of Incomes, Expenses, and Savings of Migrant Households in
Greece in 2008 and 2009 ......................................................................................................... 247
19.3 Savings Levels of Albanian Migrant Households in 2009 ................................................ 247
19.4 Comparison of Estimates of Household Remittance Levels to Albania 2008–09 ....... 249
19.5 Comparison of Migrant Household Remittances in 2008–09 ........................................ 249
19.6 Migrant Household Remittance Amounts Forecasted for 2009–10 .............................. 250
19.7 Planned Strategies for Managing the Eff ects of the Economic Crisis, While in the
Country of Migration............................................................................................................... 251
20.1 Proportion of Women and Children among Migrants Entering Spain by
Country of Origin, 2004–09 ................................................................................................... 261
21.1 Capital Transactions, 2008–10 .............................................................................................. 277
21.2 Summary of Steps ..................................................................................................................... 283
21.3 Forecast Results ........................................................................................................................ 284
21.4 Value of Turkish Workers’ Remittances from Germany .................................................. 284
22.1 Percentage of Households in Turkey Receiving Remittances .......................................... 289
22.2 Sources of Remittances for Households in Turkey ............................................................ 290
22.3 Household Goods Received from Migrants ........................................................................ 291
22.4 Use of Most Remittances in Turkey ...................................................................................... 292
24.1 Characteristics of Irregular Migrants in Turkey ............................................................... 306
24.2 Characteristics of Irregular Migrants in Turkey Who Send Remittances to
Th eir Country of Origin .......................................................................................................... 307
24.3 Work and Remittance Patterns of Irregular Migrants Who Sent Remittances to
Th eir Country of Origin ......................................................................................................... 309
24.4 Reasons for Migration and Remittance-Sending Status ................................................... 310
24.5 Duration of Stay in Turkey and Remittance-Sending Status ........................................... 310
24.6 Employment and Remittance-Sending Status .................................................................... 311
26.1 Cost of Sending $NZ 200/$A 200 from New Zealand/Australia to a Pacifi c Island
Country as Percentage of Total Amount Sent .................................................................... 322
27.1 Vanuatu: Selected Key Indicators .......................................................................................... 327
27.2 Pacifi c Island Countries: Remittances, 1970–2009 ........................................................... 327
27.3 Demographic Profi le of Vanuatu ........................................................................................... 328
27.4 Commercial Financial Institutions in Vanuatu................................................................... 328

CONTENTS l xiii
27.5 Vanuatu: GDP, Remittances, Trade, and Financial Indicators ......................................... 329
27.6 Results of Bound Tests ............................................................................................................ 331
27.7 Dependent Variable: RGDP/Labor (Ly), ARDL (1,1,1,0,1) ............................................... 331
27.8 Dependent Variable: RGDP/Labor (Ly), ARDL (1,0,1,1,0) ............................................... 332
27.9 Dependent Variable: RGDP/Labor (Ly), ARDL(1,1,1,0,0) ................................................ 332
28.1 Summary of Variables and Data Sources ............................................................................. 341
28.2 Remittances, Disasters, and FDI and ODA in the Sample Countries ............................ 343
28.3 Pooled OLS Regression Results (no control variables) ..................................................... 344
28.4 Pooled OLS Regression Results (controls included) ......................................................... 344
28.5 “Diff erence” GMM Dynamic Panel Estimation Results ................................................... 345
29.1 Determinants of Remittances ................................................................................................ 353
31.1 Remittance Infl ows in MENA as Percentage of GDP, 2008–09 ...................................... 368
31.2 Correlation Levels .................................................................................................................... 375
32.1 Top-10 Destinations of Migrants from MENA Countries, 2005 .................................... 379
32.2 Remittance Infl ows and Outfl ows in Selected MENA Countries, 1970–2008 .....................380
32.3 Remittances from GCC to Bangladesh, Pakistan, and the Philippines,
2008 and 2009............................................................................................................................ 382
32.4 Quarterly Remittances Received for 2008, 2009, and 2010.............................................. 385


xv
Foreword
The global financial crisis in 2008–09 served a harsh blow to 215 million
migrants and their families around the world. Migrants faced worsening employment
prospects in destination countries, often coupled with tightening entry regulations
and vicious anti-immigration rhetoric. Meanwhile, migrants’ support to families back
home in the form of remittances was ever more important in the face of the rising
cost of living.
Remittances are the most tangible link between migration and development. At more
than $325 billion per year, remittances sent by migrants to developing countries are
larger than offi cial development assistance as well as private debt and portfolio equity
fl ows. Remittances help families all over the world to pay for food, housing, education,
and health expenses and even invest in small businesses. At the national level, remit-
tances help off set current account defi cits and shore up international reserves.
Th e 49 authors of this volume analyze remittance patterns and practices across the
globe during the recent fi nancial crisis. Some of these studies provide insights into indi-
vidual and household practices, whereas others focus on national and international
fl ows. Evidence shows that remittances fl ows were resilient during this crisis. However,
the cost of money transfers is still very high, and we need to reduce transaction costs to
facilitate remittance fl ows. Studies in this volume also show that remittances are more
than the transfer of money. Gifts, values, skills, and ideas transferred are potentially
crucial for long-term socioeconomic development of developing countries.
Despite the breadth of these studies, readers should be warned of the pitfalls of
migration and remittances data, which are often incomplete. Offi cial fi gures of remit-
tances often underestimate actual fl ows because of the prevalence of informal transfer
channels. Considerably more eff ort is needed to improve the quality of data, reduce
transaction costs, and simplify the process of sending remittances.

xvi l FOREWORD
Th is book is perhaps the fi rst comprehensive study of remittances during the fi nan-
cial crisis and is a timely addition to the literature. It comes at a time when countries
are grappling with the global fi nancial crisis and its aftereff ects. Th e resilience of remit-
tances is good news for developing countries, but leveraging remittances for socio-
economic development remains a key challenge. Th e studies in this book identify and
discuss key patterns observed in remittance practices across the world and possibilities
for the future. We hope this book serves students, researchers, practitioners, and policy
makers around the world as a useful source of reference.
Otaviano Canuto Hans Timmer
Vice President, Poverty Reduction and Director, Development Economics
Economic Management Prospects Group
Th e World Bank Th e World Bank

xvii
Acknowledgments
We would like to acknowledge the support provided by the World Bank. We also
thank Dr. Pinar Yazgan and Dr. Meghan Craig, who assisted in the copyediting and in
the preparation of the bibliography. We are also thankful to our many colleagues who
have contributed to this volume as authors or reviewers. We would like to acknowl-
edge the permission given by Migration Letters to reprint the following papers, which
were fi rst published in a special issue of the journal in October 2010: Mohapatra and
Ratha, “Forecasting Migrant Remittances during the Global Financial Crisis”; Acosta,
Baez, Beazley, and Murrugarra, “Th e Case of El Salvador”; Lacalle, “Th e Impact of the
Global Economic Downturn on Remittances from the European Union”; Singh, “From
Shock Absorber to Shock Transmitter: Sub-Saharan Africa”; and Naufal and Vargas-
Silva, “Migrant Transfers in the MENA Region: A Two-Way Street in Which Traffi c
Is Changing.” We also acknowledge the permission to reprint the paper by Green and
Winters, an earlier version of which was published in Th e World Economy (Vol. 33,
No. 9, pp. 1053–72). We would also like to thank Otaviano Canuto, Sonia Plaza, Hans
Timmer, and Ani Rudra Silwal of the World Bank for encouragement and support at
various stages of the book.
Book design, editing, and production were coordinated by Aziz Gökdemir, Stephen
McGroarty, Stephen Pazdan, and Nora Ridolfi of the World Bank Offi ce of the Pub-
lisher. Nita Congress typeset the book and provided editing, proofreading, and project
management assistance. Bill Pragluski of Critical Stages designed the cover.


xix
Contributors
DON ABEL joined the Reserve Bank of New Zealand in 2004 after a 26-year career
in a large New Zealand–based commercial bank. As Assistant Governor and Head of
Operations, he has a general management function across the Reserve Bank, with par-
ticular responsibility in fi nancial, corporate, commercial, and other internal functions.
He has a liaison role with other central banks in the Pacifi c area. He is a member of the
Bank’s monetary policy and fi nancial stability committees. He has a Ph.D. in geography
from the Victoria University of Wellington.
PABLO ACOSTA works as an Economist in the Social Protection Unit, Latin America
and the Caribbean region, at the World Bank. Before that, he worked as a research
economist in the Andean Development Corporation, at the Ministry of Economy of
Argentina, and as a consultant for the World Bank and the Inter-American Develop-
ment Bank. He holds a Ph.D. in economics from the University of Illinois at Urbana-
Champaign.
ŞULE AKKOYUNLU obtained a B.A. in economics and econometrics from the Uni-
versity of Istanbul, an M.Sc. in economics from the University of London, and a Ph.D.
in economics from Oxford University. She has held teaching and research positions
at the Universities of Oxford, Kent, Bonn, Tel Aviv, California at San Diego, Zurich,
and Neuchatel; and the Swiss Federal Institute of Technology Zurich, OTA, and DIW.
Her research interests include macroeconomics, international economics, economic
history, development economics, econometrics, public economics, political economy,
labor economics, demography, and international migration.
JAVIER BAEZ works as an Economist in the Independent Evaluation Group at the
World Bank. He is also a Research Fellow at the Institute for the Study of Labor and a
Fellow of the Research Network on Population, Reproductive Health, and Economic
Development. He holds a Ph.D. in economics from the Maxwell School of Public Aff airs
at Syracuse University and a master’s in public administration and international devel-
opment from Harvard University.

xx l CONTRIBUTORS
ALEJANDRO BARAJAS DEL PINO is in charge of the Offi ce of Capital Movements
at the Direction for Economic Measurement in Banco de México. He teaches in the Eco-
nomics and Business Faculty of Universidad Anahuac Norte. His undergraduate studies
were at Benemérita Universidad Autónoma de Puebla; his graduate studies were done
at El Colegio de México in México City and at the University of California, Los Angeles.
RODOLFO BEAZLEY is an economist, currently pursuing a master’s degree at the
London School of Economics. Previously, he worked for the Social Protection Unit,
Latin America and the Caribbean region, at the World Bank, and as a researcher for the
Argentine government. He also did consultancies for the International Labour Organi-
zation (ILO) and was a lecturer at the Universidad de Buenos Aires.
DANIÈLE BÉLANGER is Professor of Sociology and Demography at the University
of Western Ontario, London, Canada. She holds the Canada Research Chair in Popula-
tion Gender and Development. She has been conducting research on Asia for 20 years.
Her research interests include gender and migration, marriage migration, labor migra-
tion, and the migration industry. A specialist on Vietnam, she has been involved in
migration-related projects on Bangladesh, Canada, China, India, Japan, the Republic of
Korea, the Philippines, and Taiwan, China.
HENRI BEZUIDENHOUT is Senior Lecturer in International Trade at the North-
West University of South Africa. In 1997, he received a master’s degree in econometrics
from the University of Pretoria and proceeded into development economic consultancy.
In 2007, he earned a Ph.D. in economics from North-West University, after which he
joined the university. Current areas of research include international capital fl ows, for-
eign direct investment risk, investment promotion, and regional integration in Africa.
JEFFREY H. COHEN is Professor of Anthropology at Th e Ohio State University. He
received his Ph.D. from Indiana University. He is coeditor of the Migration Letters jour-
nal and is an offi cer for the Society of Anthropological Sciences. His research focuses
on migration, economic development, and food safety/nutrition. His research has
been supported by the National Science Foundation, National Geographic Society, the
Fulbright program, and the Russell Sage Foundation. His books include Cooperation
and Community: Economy and Society in Oaxaca (1999), Economic Development: An
Anthropological Approach (2002, Alta Mira Press), Th e Culture of Migration in South-
ern Mexico (2004), and Th e Cultures of Migration: Th e Global Nature of Contemporary
Movement (2011, University of Texas Press).
NICOLAAS DE ZWAGER is Founder and Director of the International Agency for
Source Country Information (IASCI), in Vienna. IASCI’s competencies lie in fi eld-
based research/information systems and migration management and development.
Previously, he was the Director for the International Centre for Migration Policy Devel-
opment and served as Chief of Mission for the International Organization for Migration
in Ukraine. He holds a Doctorandus from the University of Amsterdam in the Nether-
lands and a B.A. from the University of Victoria, Canada.
OĞUZHAN ÖMER DEMIR holds M.A. and Ph.D. degrees from Rutgers University.
He is a faculty member at the Turkish National Police Academy, where he also works for
the International Center for Terrorism and Transnational Crime. He is the coeditor of
two books on transnational crime. His academic interests include regular and irregular
migration, transnational crime, and border security.
CONTRIBUTORS l xxi
ILIR GEDESHI is Founder and Director of the Center for Economic and Social Stud-
ies (CESS), an independent think tank specializing in studying economic, social, and
demographic changes, based in Tirana, Albania. CESS has become the main resource
center of Albanian migration issues since its foundation in 1995. Previously, he was the
Director of the Department of Economy at the University of Tirana. He holds a Ph.D. in
economics from the University of Tirana.
NASSIB GHOBRIL is the Chief Economist and Head of the Economic Research and
Analysis Department at the Byblos Bank Group, one of the largest banking and fi nancial
services groups in Lebanon. He is a recipient of the World Lebanese League’s award for
Best Economist in Lebanon and the Diaspora for 2009, and Data Invest and Consult’s
award for Best Sovereign Risk Analyst of 2010. He is a board member of the Lebanese
Transparency Association.
JESÚS A. CERVANTES GONZÁLEZ is Coordinator of Statistical Training and of the
Program for the Application of the General Principles for International Remittances
Services at the Center for Latin American Monetary Studies. Previously, he was Direc-
tor for Economic Measurement at Banco de México. He holds a master of arts degree
and is a Ph.D. candidate at the University of Chicago. He teaches in the Economics and
Business Faculty of Universidad Anahuac Norte.
TIM GREEN is an Economic Advisor at the Department for International Develop-
ment (DFID) in the United Kingdom. After working for the U.K. Financial Services
Authority and as an ODI Fellow in the Ministry of Tourism, Industry, and Commerce
of the government of Guyana, he joined DFID in 2005 and has worked, among other
things, on migration policy in DFID’s Policy Division.
GREGORY S. GULLETTE received his Ph.D. from the University of Georgia in envi-
ronmental anthropology. He has conducted ethnographic fi eldwork in Mexico, New
Zealand, Th ailand, and the United States. He is primarily interested in issues of political
ecology, political economy, development, migration, and transnationalism. His most
recent research in Th ailand centers on the relationships between migration and urban
environmentalism in Bangkok.
POONAM GUPTA is a Professor at ICRIER. She has previously worked at the Inter-
national Monetary Fund and has taught at the Delhi School of Economics. She has
also consulted for the World Bank, the International Monetary Fund, and the Asian
Development Bank. She holds a Ph.D. in economics from the University of Maryland.
Her work has been published in leading academic journals and in collective volumes.
KIM HAILWOOD is the Manager of MoneyPACIFIC, a multiagency project jointly
supported by the Reserve Bank of New Zealand, the New Zealand Ministry of Foreign
Aff airs, and the Ministry of Pacifi c Island Aff airs, in cooperation with the World Bank,
to improve Pacifi c peoples’ fi nancial knowledge and awareness. She completed her
M.A. (1st class honors) in education (fi nancial literacy) in 2007 and is currently working
on a Ph.D. investigating the nature and delivery of fi nancial education in New Zealand.
SHIKHA JHA is a Principal Economist in the Economics and Research Department of
the Asian Development Bank. She holds a Ph.D. in economics from the Indian Statisti-
cal Institute, New Delhi. Her areas of specialization are development economics, public
economics, and agricultural economics. She has published extensively in international
xxii l CONTRIBUTORS
peer-reviewed economics journals and in edited books. Her research and operational
experience covers several countries in South Asia, Southeast Asia, East Asia, and Cen-
tral Asia.
RONALD R. KUMAR is affi liated with the School of Government, Development
and International Aff airs, Faculty of Business and Economics, at the University of the
South Pacifi c, and is a recipient of the Sasakawa Young Leaders Fellowship. His areas
of research include macrolevel studies on factors of economic growth with a particular
focus on developing countries.
OSCAR GÓMEZ LACALLE has worked in the Directorate-General for Economic and
Financial Aff airs of the European Commission since 1998. He is currently a member
of a unit dealing with globalization, trade, and development, including the economic
aspects of migration and fi nancial inclusion. Previously, for the European Commission,
he worked on the Spanish economy. He has a degree in economics from the University
Complutense of Madrid, Spain, and a degree in international and development eco-
nomics from the University of Namur, Belgium.
TY MATEJOWSKY is an Associate Professor with the Department of Anthropology
at the University of Central Florida. He received his Ph.D. in anthropology from Texas
A&M University in 2001. His ongoing research in the Philippines examines numer-
ous issues related to globalization, including fast food, urban development, disaster
responses, and international migration.
SANKET MOHAPATRA is an economist with the Development Prospects Group at
the World Bank. His research interests include international capital fl ows, sovereign
and subsovereign ratings, poverty, inequality and growth, and the development impact
of remittances and migration. He also worked as an economist with the Africa Region
of the International Monetary Fund. He holds a Ph.D. from Columbia University and a
master’s degree from the Delhi School of Economics.
GABRIELA MUNDACA is a faculty member of the Applied Economics Department
at Johns Hopkins University. She has worked in the Economics Department of the Uni-
versity of Oslo, Norway; at the World Bank; and in the Research Department of the
Central Bank of Norway (CBN). She has also advised the policy departments of the
CBN for many years. Her main areas of expertise are fi nancial economics, economet-
rics, and international macroeconomics. She has published articles in refereed interna-
tional journals. She holds a Ph.D. in economics from the State University of New York
at Stony Brook.
EDMUNDO MURRUGARRA is Senior Economist with the Human Development
Department, Latin America and the Caribbean region, World Bank. His areas of interest
are human development in health and education, labor economics, and poverty. He led a
cross-sectoral team involved in streamlining migration issues in analytical and operational
products at the Bank. He has taught at the Pontifi cia Universidad Católica del Perú and the
Central Reserve Bank of Peru, Lima. He is a graduate of the Pontifi cia Universidad Católica
del Perú and holds a Ph.D. from the University of California, Los Angeles.
D. NARAYANA is Professor at the Centre for Development Studies in Kerala, India.
He holds a Ph.D. from the Indian Statistical Institute, Calcutta. He has published exten-
sively in international journals, and was a Fulbright Fellow at Harvard and a Visiting

CONTRIBUTORS l xxiii
Professor at the University of Montreal. His latest book, Safeguarding the Health Sec-
tor in Times of Macroeconomic Instability: Policy Lessons for Low- and Middle-Income
Countries, coedited with Slim Haddad and Enis Bariș, was published by the Africa
World Press (2008).
WIM NAUDÉ is Professor of Development Economics and Entrepreneurship and
Director of Research at the Maastricht School of Management. A graduate of the Uni-
versity of Warwick, United Kingdom, he has been a member of international networks
and advisory bodies including the International Council for Small Business, the Club de
Madrid, and the Households in Confl ict Network. He was a Senior Associate Member
of St. Antony’s College, Oxford, and served on the Faculty of Brown University’s Inter-
national Advanced Research Institutes.
GEORGE NAUFAL is an Assistant Professor of Economics at the American University
of Sharjah and a research fellow at the Institute for the Study of Labor. His primary
research includes migration and its consequences, mainly the impact of remittances on
the remitting countries. His research has focused mostly on the Middle East and North
Africa region, with an emphasis on the Gulf countries.
SIMON PEMBERTON is a Senior Lecturer in Urban Geography and Planning at the
University of Birmingham. His research interests include community planning and liv-
ability, urban resilience and regeneration, the neighborhood impacts of “new” immigra-
tion, and outcomes of state rescaling on urban and rural communities. He has published
widely in all of these areas, including in the Journal of Rural Studies, Urban Studies,
and Regional Studies. He was Director of the Merseyside Social Inclusion Observatory
between 2004 and 2010.
MD MIZANUR RAHMAN is a Research Fellow at the Institute of South Asian Stud-
ies, National University of Singapore. His research interests include gender and migra-
tion, migration and development, remittances, and migrant businesses. He has written
research reports on international migration in Asia for the International Organization
for Migration and the United Nations Development Fund for Women. His work has
appeared in leading migration journals, including International Migration, Population,
Space and Place, Journal of Ethnic and Migration Studies, and Journal of International
Migration and Integration.
SELIM RAIHAN is Associate Professor at the Department of Economics, University
of Dhaka, Bangladesh. He is also the Executive Director, South Asian Network on Eco-
nomic Modelling. His research focuses on international trade and trade policy, poverty
analysis using micro- and macroeconometrics, and applied economics such as linking
trade policies and poverty using computable general equilibrium of single country and
global models. He teaches international trade, economic modeling, quantitative eco-
nomics, econometrics, development economics, and poverty dynamics.
S. IRUDAYA RAJAN is a Chair Professor at the Ministry of Overseas Indian Aff airs
(MOIA), Research Unit on International Migration at the Centre for Development
Studies, Kerala, India. He has extensive research experience in Kerala. He coordinated
fi ve major migration surveys from 1998 to 2009, and has published books and articles
on social, economic, and demographic implications on international migration. He is a
member of the National Migration Policy drafting group appointed by the MOIA. He
edits the annual series India Migration Report published by Routledge.

xxiv l CONTRIBUTORS
DILIP RATHA is the Lead Economist and Manager of the Migration and Remittances
Unit at the World Bank. He is the chair of the advisory group of the Migrating out
of Poverty research consortium and a visiting professor at the University of Sussex.
His expertise includes migration, remittances, and innovative fi nancing. Previously, he
worked at Credit Agricole Indosuez, Singapore; Indian Institute of Management; and
Policy Group, New Delhi. He holds a Ph.D. in economics from the Indian Statistical
Institute, New Delhi.
JOAQUÍN RECAÑOVALVERDE has been a Professor at Universitat Autònoma of
Barcelona since 2003 and a researcher at the Center for Demographic Studies since
1995. From 1989 to 1995, he worked at the Demographic Institute of the Spanish
National Research Council. He has published articles and book chapters on internal
and international migration and on demographic methods of analysis.
ANDREA RIESTER holds a Ph.D. from the Martin Luther University of Halle-Wit-
tenberg and is associated with the Max Planck Institute for Social Anthropology. She
specializes in development, transnationalism, migration, and remittances and works at
the Department for Economic Development and Employment at the German Agency
for International Cooperation (GIZ), based in Eschborn, Germany.
MARTA ROIG is Social Aff airs Offi cer at the Department of Economic and Social
Aff airs of the United Nations. She worked in the Population Division of the United
Nations from 1998 to 2010 and at the United Nations Population Fund from 1996 to
1998. She has authored reports and articles on international and internal migration and
their linkages with development.
LISA SCULLION is a Research Fellow within the Salford Housing and Urban Studies
Unit at the University of Salford, United Kingdom. She has particular research interests
in the needs and experiences of Central and Eastern European migrant workers, female
asylum seekers and refugees, and Gypsy and Traveller communities. She has published
on these issues in journals such as Social Policy and Society and the Community Devel-
opment Journal.
MARNIE SHAFFER worked with Somalis in refugee resettlement before pursuing a
Ph.D. in anthropology at Th e Ohio State University. She is writing her dissertation on
Somali women’s economic lives and gender relations in the Johannesburg community.
She also conducted research in Columbus, Ohio, where she explored the economic
roles of employed Somali women.
JEEVAN RAJ SHARMA is a Senior Researcher at Feinstein International Center and
teaches graduate courses at Friedman School of Nutrition Science and Policy and Fletcher
School of Law and Diplomacy at Tufts University. His current areas of research include
armed confl ict and social transformation, labor mobility and transnationalism, livelihoods
adaptation, international aid policy and practice, research collaboration, and governance
in South Asia. He has a Ph.D. in sociology of South Asia from the University of Edinburgh.
ANI SILWAL has worked at the Washington, D.C., offi ce of the World Bank since April
2008, most recently with the Migration and Remittances Unit. He holds a master’s degree
from the University of Maryland, College Park, and a bachelor’s from Swarthmore Col-
lege. He previously worked as a risk analyst for an energy trading fi rm in Philadelphia.

CONTRIBUTORS l xxv
BHUPAL SINGH is an assistant adviser in the Department of Economic and Policy
Research of the Reserve Bank of India, Mumbai. He has also worked as an economist
in the Bank of England. His research interests include macroeconomics, international
economics, monetary economics, and the fi nancial dimensions of cross-border work-
ers’ remittances. He has been a member of the Luxembourg Group on remittances,
jointly hosted by the IMF and the World Bank with a mandate to improve the recording
of cross-border remittances. He has been the member secretary of the Sub-Group on
Foreign Savings for the Eleventh Five Year Plan (2007–12) set up by the Planning Com-
mission, government of India, in 2006.
KARAN SINGH is an economic specialist with eight years of experience in research
and analytics. For his research on global public bads, he was invited to the Global
Governance School, German Development Institute, Bonn. He has been a lecturer of
applied econometrics for postgraduates at Delhi University, South Campus. He has
authored several research papers in global governance, development economics, mac-
roeconomics, market integration, and applied econometrics. Currently he is a consul-
tant at ICRIER.
RAJU JAN SINGH is the Lead Economist for Central Africa, based in Yaoundé, Cam-
eroon. Prior to joining the World Bank, he held positions at the International Monetary
Fund in Washington, D.C.; at the Swiss Ministry of Finance in Bern; and at Lombard
Odier & Cie (private banking) in Geneva. He was also a consultant for the Swiss Agency
for Development and Cooperation, working with the central banks of Rwanda and Tan-
zania, and taught at the Graduate Institute of International Studies in Geneva. He holds
a Ph.D. from the Graduate Institute of International Studies.
IBRAHIM SIRKECI is Professor of Transnational Studies and Marketing at Regent’s
College, London, U.K. He is also the Director of the Regent’s Centre for Transnational
Studies. Previously, he worked at the University of Bristol. His recent research focuses
on human mobility, confl ict, human insecurity, remittances, segregation, segmentation,
marketing of business schools, and transnational mobile consumers. Most recently,
with Jeff rey Cohen, he coauthored Cultures of Migration (University of Texas Press,
2011). He is the editor of Migration Letters and Transnational Marketing Journal.
MEHMET ALPER SOZER received his Ph.D. from Indiana University of Pennsylva-
nia. He is the author and editor of several books. He is currently working at the Interna-
tional Center for Terrorism and Transnational Crime in Turkey. His research interests
are terrorism, crime prevention, transnational crime, and community policing.
GUNTUR SUGIYARTO is a Senior Economist, Economics and Research Department,
Asian Development Bank. He received his M.Sc. and Ph.D. from the School of Econom-
ics, University of Warwick and Nottingham, United Kingdom. His publications include
books, journal articles, and papers on key development issues, including competitive-
ness, tourism economics and impacts, the labor market, underemployment, the mini-
mum wage, poverty mapping, poverty impact analysis, trade liberalization, optimum
taxation, oil and commodity prices, and migration and remittances.
CARLOS VARGASSILVA is a senior researcher at the University of Oxford, where
he is part of the team establishing the new Migration Observatory. His research inter-
ests include the economic impact of immigration on receiving countries and the link
xxvi l CONTRIBUTORS
between migration and economic development in sending countries, with a special
focus on the role of migrants’ remittances. He has been a consultant for the Asian
Development Bank, the Inter-American Development Bank, the World Bank, and the
United Nations.
L. ALAN WINTERS is a Professor of Economics at the University of Sussex. He is a
Research Fellow at the Centre for Economic Policy Research in London and a Fellow of
the Institute for the Study of Labor in Munich. He previously worked at the Universities
of Cambridge, Bristol, Wales, and Birmingham. He has been editor of the World Bank
Economic Review and associate editor of the Economic Journal, and he serves on several
editorial boards.
PINAR YAZGAN is an Assistant Professor of Sociology at Sakarya University, Turkey.
Her recent research focused on the sense of identity and belonging among migrants
from Turkey in Denmark. She is a research grant recipient from the Scientifi c and Tech-
nological Research Council of Turkey. Between 2007 and 2009, she conducted fi eldwork
in Denmark while serving as a visiting researcher at the Danish National Research Cen-
ter for Social Sciences.

xxvii
Abbreviations
A8 Accession 8 (countries)
ADB Asian Development Bank
AML anti–money laundering
BOP balance of payments
BOPSY Balance of Payments Statistics Yearbook
CAGR compound annual growth rate
CEE Central and Eastern European
CFT countering the fi nancing of terrorism
CIGEM Centre for Migration Information and Management
CPI consumer price index
CSO Central Statistical Offi ce
EEA European Economic Area
EU European Union
FDI foreign direct investment
GCC Gulf Cooperation Council
GDP gross domestic product
GMM generalized method of moments
GNI gross national income
GTZ German Development Cooperation (Deutsche Gesellschaft für
Internationale Zusammenarbeit)
ICRG International Country Risk Guide
ID identifi cation
IEC international education consultancy
IFAD International Fund for Aid and Development
IFS Indian Foreign Service
IMF International Monetary Fund
LCU local currency unit
LIBOR London Interbank Off ered Rate
M2 money and quasi-money

xxviii l ABBREVIATIONS
MENA Middle East and North Africa
MTO money transfer operator
NRI nonresident Indian
ODA offi cial development assistance
ODI overseas direct investment
OFW overseas Filipino worker
OLS ordinary least squares
ONS Offi ce for National Statistics
PATI Programa de Ayuda Temporal al Ingreso
PBS points-based system
PGA Programa General Anti-Crisis
PIC Pacifi c island country
RBI Reserve Bank of India
SSA Sub-Saharan Africa
WDI World Development Indicators
WEO World Economic Outlook
WRS Worker Registration Scheme
All dollar amounts are U.S. dollars unless otherwise indicated.

1
Introduction: Remittance Flows and Practices during the Crisis
IBRAHIM SIRKECI, JEFFREY H. COHEN, AND DILIP RATHA
Immigrants tend to be more negatively aff ected by economic crisis than natives,
particularly when governments apply strict immigration controls. With the onset of
the fi nancial crisis in the latter half of 2008, there were widespread concerns: would
migrants return to sending countries and communities in large numbers, adding fur-
ther economic woes to countries already facing diffi culties? Would remittance fl ows
slow and potentially cease? Th e literature off ers little guidance on these questions. It
is always a challenge to collect data, analyze, interpret, and make recommendations as
the phenomenon under study is still unfolding to reveal new turns and twists. Th e most
recent fi nancial crisis and its repercussions are yet to be completed, and scholars have
only begun processing the event. Th is volume is an eff ort to bring together in one place
fresh thinking and evidence from around the world on the outcomes of mobility in the
context of global fi nancial crisis.
Crises are a part and parcel of the global economic system. In the crisis-aff ected
developed countries, migrants were challenged in their new homes as jobs began to
disappear. Also there was a rapid growth in anti-immigrant sentiment and rhetoric:
where they formerly were often left alone, they now faced discrimination and intimida-
tion and perhaps jail and deportation. In fact, it became easier to scapegoat immigrants
during crises.
Although the latest crisis originated in the United States and around fi nancial sys-
tems in high-income countries, it has had an important and in some places catastrophic
impact on developing nations and migrants. Like political or environmental catastro-
phes, the global fi nancial crisis contributed to an environment of human insecurity,
2 l IBRAHIM SIRKECI, JEFFREY H. COHEN, AND DILIP RATHA
and migration was one strategic response. To avoid the crisis and to survive its impacts,
those who could aff ord to cross borders became international movers; others moved to
domestic destinations; while many simply stayed put and turned to remittances to help
weather the storm. In such situations, remittances are critical to the overall survival of
the sending nation that struggles with ecological disasters disrupting lives, economic
collapse, job market declines, and rising infl ation rates (see, for example, the earthquake
in Haiti in 2010, the Asian crisis of the 1990s, or the crises that plagued Latin America
through the 1980s and 1990s).
Migrant remittances provide a measurable benefi t—a lifeline—for sending commu-
nities, and they contribute directly and indirectly to the income of sending households
(Ratha and Sirkeci 2010: 125). Overall, cash fl ows, increasing expenditures, and (lim-
ited) investments caused by remittances have a substantial impact on the social action
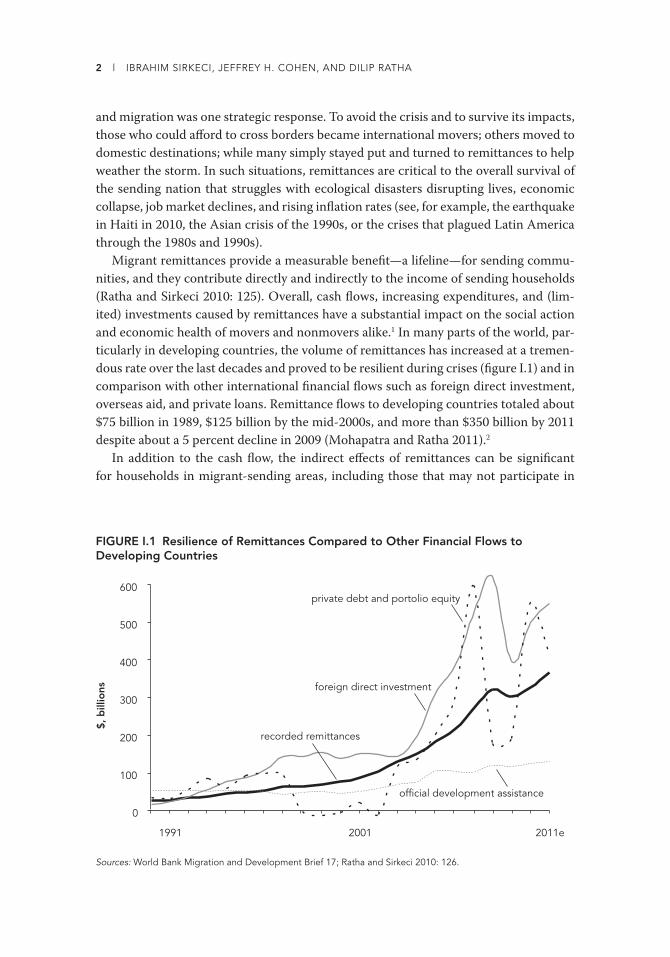
and economic health of movers and nonmovers alike.1 In many parts of the world, par-
ticularly in developing countries, the volume of remittances has increased at a tremen-
dous rate over the last decades and proved to be resilient during crises (fi gure I.1) and in
comparison with other international fi nancial fl ows such as foreign direct investment,
overseas aid, and private loans. Remittance fl ows to developing countries totaled about
$75 billion in 1989, $125 billion by the mid-2000s, and more than $350 billion by 2011
despite about a 5 percent decline in 2009 (Mohapatra and Ratha 2011).2
In addition to the cash fl ow, the indirect eff ects of remittances can be signifi cant
for households in migrant-sending areas, including those that may not participate in
FIGURE I.1 Resilience of Remittances Compared to Other Financial Flows to Developing Countries
private debt and portolio equity
foreign direct investment
recorded remittances
$, b
illio
ns
0
100
200
300
400
500
600
1991 2001
official development assistance
2011e
Sources: World Bank Migration and Development Brief 17; Ratha and Sirkeci 2010: 126.

INTRODUCTION: REMITTANCE FLOWS AND PRACTICES DURING THE CRISIS l 3
international migration. Massey and Taylor (2004: 157) argue that “the vast majority of
research on migrant remittances and savings ignores their indirect eff ects on migrant-
sending economies. As a result, many studies paint a negative picture of remittances
and savings for development.” According to their assessment, the problem lies in the
fact that many studies fail to recognize the eff ects of nonremittance income and the link
between migrants and nonmigrants.
Remittances remain one of the less volatile sources of foreign exchange earnings for
developing countries. Th e literature has indicated for some time that migrant remit-
tances tend to be stable or even countercyclical in response to economic hardship—
be it a fi nancial crisis, natural disaster, or political confl ict—in a remittance-recipient
country (Ratha 2003; World Bank 2006a). Th is time the crisis began in the United States
and Europe, remittance-source countries. Some early literature (for example, Swamy
1981) argued that source country factors are a major determinant of remittance fl ows.
Th e economic crisis in a major migrant destination country was expected to adversely
aff ect migrants’ income and employment opportunities and hence the willingness and
ability of migrants to stay in their host countries and continue to remit funds. To an
extent, this expectation was realized as remittance fl ows registered a decline in 2009
for the fi rst time in recent memory. Nevertheless, it was also remarkable that remit-
tance fl ows to developing countries fell only 5.2 percent in 2009, proving to be signifi -
cantly more resilient than private capital fl ows, which declined precipitously (Ratha and
Sirkeci 2010: 126).
Remittance receipts at the global level signifi cantly exceed the aid from advanced
economies to developing countries. Th e debate over the impact of remittances on social
and economic inequalities is ongoing. Although some observers argue that remittance
patterns are dependent on the motivations that drive migration (these are not economic
in all cases), others argue that remittances reduce poverty.
Seddon, Adhikari, and Gurung (2002) argue that redressing inequalities is beyond
the concern of migrant remittances. An abundance of evidence is provided by a mul-
titude of studies that confi dently argue that remittances are often used for household
maintenance and for purchase of consumer goods. Remittances are particularly impor-
tant for dependent members of households left behind. Orozco (2006), for example,
argues that remittances are means to ensure social protection as well as capital accumu-
lation (see also Cohen and Rodriguez 2005). Eckstein (2010) argues that remittances are
linked to transnational family social capital and are building blocks for the reproduction
of social networks and connections. Evidence is also found that migrant remittances are
used to support local community projects and events (Cohen 2004). A separate litera-
ture focusing on the role of remittances in relation to confl icts and disasters has also
grown in recent years (Fagen and Bump 2006; Justino and Shemyakina 2010; Mohapa-
tra, Joseph, and Ratha forthcoming). Many of these studies focus on natural disasters
such as the earthquake in Pakistan or tsunamis in the Pacifi c; others look at the implica-
tions of confl icts in African countries. In these examples, remittances appear as insur-
ance for households as they cope with the shocks of confl ict (Davies 2007). Fagen and

4 l IBRAHIM SIRKECI, JEFFREY H. COHEN, AND DILIP RATHA
Bump (2006) argue that migrant remittances also help prevent displacement in confl ict
regions while underlining the fact that all forms of migration (including forced migra-
tion) generate remittances.
In many countries, remittances play a central economic role, often accounting for
up to a third of the value of export revenues in countries such as Bangladesh or the
Republic of Yemen. Th is is why we have paid particular attention to South Asian coun-
tries. Remittances are an important source of revenue for many South Asian countries.
Generally speaking, the average gross domestic product (GDP) per capita in the region
stands at about $1,000. Th e migrant population from the region also includes a large
number of highly skilled people with high incomes. For example, more than 10 percent
of physicians trained in the South Asia region have emigrated. Th ese relatively high-
earner emigrants send signifi cant remittances. However speculative the relationship
of movers to remittances can be, the volume of total remittance fl ows to South Asia
increased more than eight times over the last 15 years (elsewhere, this increase was less
than six times). A steady growth in remittances is evident in the cases of Bangladesh and
Pakistan, where remittances grew from about $2 billion each in 1990 to about $10 bil-
lion each in 2009. Remittances to the four South Asian countries (Bangladesh, India,
Maldives, and Pakistan) continued to grow during the fi nancial crisis, while only a slight
drop in remittances to India is reported.
Despite the fi gures one can fi nd in statistical depositories, the estimation of the size
of international migrant remittances is complicated by a simple fact: An unknown but
probably large share of the fl ows is sent through informal channels (including pocket
transfers). Another problem is the diffi culty of assessing the value of in-kind remit-
tances—if we can capture them in our fl ow statistics.
Understanding the Resilience of Remittances
Remittances tend to be relatively resilient to the crisis. Among other explanations, there
are six broader patterns that are key to producing such resilience. First, the more diver-
sifi ed the destinations and the labor markets for migrants, the more resilient the remit-
tances sent by migrants. Th us, countries in South Asia and East Asia that have a large
number of migrants in the United States, Europe, and the Gulf Cooperation Council
(GCC) countries continued to register increases in remittance infl ows despite the crisis;
whereas countries in Latin America and the Caribbean that have most of their migrants
in the United States suff ered a decline (Ratha and Mohapatra 2009).
Second, remittances are sent by the stock (cumulative fl ows) of migrants, not only
by the recent arrivals (in fact, recent arrivals often do not remit as regularly because
they must establish themselves in their new homes). Although it is true that in some
countries new migration fl ows declined by 40–60 percent in 2009 compared with 2008,
the fl ow did not become negative. Th ere is also historical evidence indicating migration
resilience in this regard (see chapter 3). Th us the size of the stock of migrants either was

INTRODUCTION: REMITTANCE FLOWS AND PRACTICES DURING THE CRISIS l 5
maintained or continued to grow (at only a slightly slower rate) in destination countries,
lending persistence to remittance fl ows aff ected in some countries.
Th ird, contrary to expectations, return migration did not take place as expected,
even as the fi nancial crisis reduced employment opportunities in the United States and
Europe. Indeed, many countries (such as Spain) off ered fi nancial incentives to encour-
age return, but migrants stayed. Anecdotal evidence suggests that migrants moved
from the construction sector to retail trade and agriculture, and in some cases stayed
on despite losing their legal status. In fact, many were unwilling to return to their send-
ing communities for fear that future migration would be diffi cult and they would not be
able to come back to their new communities and jobs when the economy recovered. Th e
problem was intensifi ed by the imposition of immigration controls in many destination
countries that aff ected new migration and inadvertently discouraged return.
Fourth, in addition to the persistence of migrant stocks that lent persistence to
remittance fl ows, existing migrants often absorbed income shocks and continued to
send money home. Th ey were able to do so because remittances are typically only one
expense among many. In many instances (especially in the Gulf countries), unskilled
migrant workers reduced consumption and shared accommodations to save money that
was later sent home.
Fifth, if some migrants did return or had the intention to return, they tended to
take their savings back to their country of origin. Such funds would show up as inward
remittances because these are personal transfers from a nonresident to a resident.
Th ese individuals also brought new skills and abilities with them, and in some cases the
experiences were the foundation for local development. Th is behavior is similar to the
“home bias” in the literature on capital fl ows.
Finally, exchange rate movements during the crisis caused unexpected changes in
remittance behavior. As local currencies of many remittance-recipient countries (India,
Mexico, and the Philippines, for example) depreciated sharply against the dollar, they
produced a “sale” eff ect on remittance behavior of migrants in the United States and
other destination countries. Goods, services, and assets back home became signifi -
cantly cheaper and aff ordable to migrants earning foreign currency. As a result, there
was a surge in investment-oriented remittances to many countries in South Asia and
East Asia.
Th e current fi nancial crisis has reduced employment opportunities throughout the
world and in both developed and developing countries. Th us, for the fi rst time since
the 1980s, remittances to developing countries are estimated to have declined in 2009.
Th e remittance fl ows represent a much larger slice of foreign currency infl ow than does
foreign aid to developing countries. For some smaller nations, remittances represent at
least a third of their GDP (for example, Haiti, Lesotho, Moldova, Tajikistan, and Tonga).
In the last two years, remittance fl ows to South Asia (for example, Bangladesh, Pakistan,
and the Philippines) grew while the fl ows were weaker in Latin America (for example,
El Salvador and Mexico) and the Middle East, North Africa, and Europe. An adverse
lagged eff ect is still a possibility.
6 l IBRAHIM SIRKECI, JEFFREY H. COHEN, AND DILIP RATHA
Th e factors aff ecting remittance fl ows include the economic opportunities in the
destination countries, development and growth trends in both sending and destination
countries, infl uence of the crisis on migrants and their well-being, migrants’ attitudes
toward consumption, cultural characteristics, migration experiences, currency fl uctua-
tions, and so on. Macroapproaches are largely interested in variation in national out-
comes (Adams 2003; Glytsos 2002; Taylor and others 1996b), whereas microapproaches
are interested in local eff ects (Binford 2003; Durand and others 1996; Massey and oth-
ers 1994; Reichert 1981; Taylor and others 1996a).
It is argued that microlevel interdisciplinary approaches with a household focus can
off er an alternative view of remittance outcomes (Cohen 2005). In this introduction we
tend to stick with macroapproaches and leave the examples to our contributors. How-
ever, it is important to understand that microprocesses shape the geography and out-
comes of remittances at diff erent levels (individual, household, community, regional,
national, and global). Remittances, like migration, do not occur in a vacuum. Th ey link
migrants and nonmigrants as well as the destination and the origin in many ways that
go beyond dependency or development.
Remittance fl ows are expected to respond to changes in migration practices. Some
relatively recent scholarship argues that transnational migration can facilitate long-
term remittance fl ows (Levitt 2000), whereas other scholars argue that remittances
decline as migration matures (Stark 1978). Our question here is how crises—the recent
fi nancial crisis in particular—infl uence remittance fl ows. Although many studies focus
on the infl uence of remittances on overall accounts, as Massey and others (1998, 2006)
have argued, the direct eff ects of remittances on sending communities are important
(also see Cohen 2010).
Finally, cash-strapped governments in remittance-receiving countries may have fi scal
stimulus packages to ensure the maintenance of remittance fl ows (World Bank 2009f).
While the eff ects of remittances on outcomes can be direct for the sending household,
wider indirect eff ects are seen for the sending communities, regions, and countries.
Th is eff ect is felt through increasing consumption and household spending, but also via
investments—albeit the small portions of remittances that are used for this purpose. It
is equally important to see that remittances stimulate nonremittance income increases
as well as investments. Th e impact of remittances on nonmigrant households via expen-
diture linkages indicates that during crises, sending households become more reliant on
remittances (for Mexican examples, see Massey and Taylor 2004). Th ese indirect eff ects
alleviate or at least mediate the impact of the fi nancial crisis even as that crisis reaches
well beyond the migrant-sending household.
Remittances also proved to be relatively resilient in comparison to private capital
fl ows, and so many remittance-dependent countries became even more dependent on
remittance infl ows for meeting external fi nancing needs. Indeed, many countries (such
as Bangladesh and the Philippines) that obtained new sovereign ratings (with a view to
raising bond fi nancing from international markets) benefi ted from the fact that they
had access to a large and relatively stable fl ow of remittances.

INTRODUCTION: REMITTANCE FLOWS AND PRACTICES DURING THE CRISIS l 7
About This Book
Th is volume presents experiences and patterns of migrant remittances around the
globe. Part I begins with key conceptual and methodological issues. Cohen and Sirkeci
frame the conceptual discussion. Mohapatra and Ratha argue that the fi nancial crisis
has highlighted the need to better forecast remittance fl ows in many developing coun-
tries where they have proved to be a lifeline for poor people and national economies.
Th ey describe a simple methodology for forecasting country-level remittance fl ows that
can be consistently linked to medium-term forecasts of global economic growth. Green
and Winters give a round analysis of migration, crisis, and remittances from the mid-
nineteenth century until today. Th ey particularly highlight the impact of government
policies, which fi rst became a driver of migration practices in the nineteenth century,
and will likely continue to be so, aff ecting migrant infl ows, returns, and impacts on
development. Mundaca demonstrates that economic growth is possible if remittances
are not used for immediate consumption of fi nal goods, but rather invested in the for-
mation of working capital, both physical and human. She illustrates how remittances
can decrease the probability of prematurely liquidating long-term productive invest-
ment.
Part II focuses on Asian experiences covering a vast geography from the Gulf to
Th ailand. Rajan and Narayana point to the lagged eff ects of the crisis in the Gulf coun-
tries. Th ey maintain that expected severe eff ects such as massive wage and salary cuts
and declines in remittances did not occur because of the quick recovery of oil prices
and increased government spending, which moderated adverse impacts. Rahman and
Bélanger draw attention to gender diff erences in remittance-receiving households in
Bangladesh. Th ey fi nd that gender diff erences as well as poverty levels, migration costs,
networks, and expectations moderate the use of remittances. Gupta and Singh docu-
ment trends in remittances to India, which they believe have been quite resilient dur-
ing the global economic downturn. Th ey argue that only a prolonged slowdown, if it
signifi cantly reverses the migration of Indians, will cause a decline in remittance fl ows.
Singh looks at the shocks aff ecting the infl ows and stability of migrant remittances
to India. Using alternative vector error correction models applied to quarterly data,
Singh notes that the residual shocks indicating economic or job market uncertainties
in the host country and associated precautionary savings could lead to signifi cant fl uc-
tuations in remittance infl ows in the short run. Mohapatra, Ratha, and Silwal examine
remittance patterns in Nepal; the country had an estimated volume of about $3.5 billion
remitted in 2010. Supplementing the previous chapter is a brief overview by Sharma
that summarizes the history of migration in Nepal. Th is is followed by a comparison of
three small countries with high out-migration—Mali, Nepal, and Tajikistan—by Riester,
who argues that stability of remittances is a function of a particular migration pattern
citizens of a country have come to adopt.
Gullette relates internal migration in Th ailand to development plans and policies
and their repercussions for labor mobility, which has been considered as a means to

8 l IBRAHIM SIRKECI, JEFFREY H. COHEN, AND DILIP RATHA
mitigate high poverty rates and unstable employment structures within the predomi-
nately agrarian Isaan (northeast) region of the country. Sugiyarto and colleagues pro-
vide two chapters, the second of which is a case study, and the fi rst of which focuses on
remittance fl ows in the key corridors of South Asia: United States–Bangladesh, United
States–Pakistan, United Kingdom–Bangladesh, and United Kingdom–Pakistan. Th ey
suggest that during the crisis, remittances related strongly with better labor market
conditions for Bangladeshi and Pakistani migrants in the United States, with less evi-
dence of migrant labor market conditions in the United Kingdom having an impact
on remittance fl ows to Bangladesh and Pakistan. Th e case study presents results from
a Bangladeshi household survey exploring the impact of the global fi nancial crisis on
migrants and their families at home.
In part III, two chapters contrast the cases of El Salvador and Mexico, countries
that receive substantial volumes of remittances from the United States. Acosta and col-
leagues show how dramatically the fi nancial crisis hit El Salvador, which saw a sharp
decline in remittance fl ows. Th ey argue that the crisis mostly aff ected urban youth who
faced more diffi cult labor market prospects and diminishing opportunities to migrate.
González and del Pino examine the case of Mexico, the world’s third-highest receiver
of remittances. Th ey observe that remittance fl ows from the United States have signifi -
cantly weakened throughout the fi nancial crisis.
Part IV looks at the eff ect of the crisis in the European Union on remittance-receiv-
ing countries. Lacalle discusses the macroeconomic determinants of remittances, argu-
ing that migrants’ income would be the main short-term determinant of European
Union remittances. Pemberton and Scullion examine the migration and remittance
fl ows between Central and Eastern Europe and the United Kingdom. Gedeshi and de
Zwager claim that mass migration is at the core of the political, economic, and social
changes occurring in Albania while pointing out the indirect adverse eff ects of the crisis
for Albania. Roig and Recaño-Valverde present an analysis of Spain, one of the world’s
fastest-growing immigration destinations for the last decade. Th ey note that 6.6 mil-
lion immigrants and about €8.5 billion remitted to their home countries made Spain
the fi fth-largest remittance-sending country in the world in absolute terms, after the
United States, Saudi Arabia, the Russian Federation, and Switzerland.
Four articles in part V focus on Turkish migration and remittances. Akkoyunlu fore-
casts the eff ects of the 2008 fi nancial crisis on Turkish workers’ remittances from Ger-
many based on the medium-term outlook for the German and Turkish economies. Th e
forecasting exercise is based on a previously estimated, tested, and accepted model for
Turkish workers’ remittances from Germany. Th e following chapter by Sirkeci looks at
the diff erences in remittance behavior of ethnic segments in the Turkish international
migration regime with reference to Kurdish migration to Germany. Yazgan and Sirkeci
examine a minor destination for Turkish migrants: Turkish immigrants in Denmark
display strong transnational characteristics connecting small towns and villages in Ana-
tolia to Danish towns. Th ese ties are crucial in maintaining remittance fl ows; qualitative
accounts support the remittances’ resilience argument. Th e fi nal chapter in this part

INTRODUCTION: REMITTANCE FLOWS AND PRACTICES DURING THE CRISIS l 9
describes irregular immigrants in Turkey and their remittance-sending behavior. Demir
and Sozer present results from their recent fi eld research, outlining the remittance pat-
terns of permanent, transit, and semitransit irregular immigrants caught by authorities
in Turkey.
Part VI moves to the Far East. Matejowsky presents an outline of labor migration
from the Philippines, where nationals abroad are an indispensible source of hard foreign
currency that, since the 1970s, has done much to keep the national economy afl oat.
Abel and Hailwood then look at New Zealand and Pacifi c island countries, for which
remittances represent 12 percent of GDP on average. Th ey visit the issue of remittance
fees, which are very high in the Pacifi c region, to determine what works and what does
not regarding the region’s fee policies. Kumar focuses on another Pacifi c island nation,
analyzing data for the period 1981–2008 to estimate the short- and long-run eff ects of
trade openness, remittances with other capital fl ows, and the impact of fi nancial devel-
opment on income in Vanuatu.
Part VII begins with an analysis of remittances as a source of resilience and vulner-
ability in Sub-Saharan Africa. Naudé and Bezuidenhout discuss the concept of exposure
to remittances, noting that level of exposure depends on a country’s social and cultural
milieu. In this regard, they highlight some gender aspects of the issue and argue that,
although females remit a higher proportion of their income than men, they enjoy less
exposure to remittances than men. Singh next revisits the argument that remittances
are shock absorbers and examines the determinants of remittances in Sub-Saharan
Africa. Shaff er’s short case study provides a qualitative comparative account of women’s
remittance practices in two Somali communities in Johannesburg, South Africa, and
Columbus, Ohio.
Part VIII contains two chapters on the Middle East and North Africa. Ghobril argues
that the region’s increasing integration in the global economy and capital markets is
making the downturn’s impact very visible in terms of declining capital infl ows in gen-
eral, and equity and credit fl ows in particular. Naufal and Vargas-Silva note that, despite
the fact that remittances from the GCC countries to Asia slowed during the crisis, there
is no evidence of large decreases. Th ey also argue that evidence for 2010 suggests that
remittances to the region will increase.
Next Steps
As can be seen, this volume includes a wide variety of analyses that range from quanti-
tative modeling to qualitative interpretations, and all contribute to our understanding
of human mobility in relation to the global fi nancial crisis. One thing that became clear
during the recent crisis is that the development community does not have adequate
tools and resources for rapid monitoring of migration and remittance fl ows and their
impacts on sending and receiving countries during times of crisis. A key practical next
step, therefore, is to devise such rapid monitoring tools.

10 l IBRAHIM SIRKECI, JEFFREY H. COHEN, AND DILIP RATHA
Th e crisis likely has not aff ected migrants and their sending households or nations as
badly as once feared. In fact, migrants may have mitigated some of the pain the global
crisis might have caused as they tend to work for less, take fewer benefi ts, and rely
relatively little on the state. Additionally, much of their earnings stayed in their destina-
tion country and often supplemented social security and payroll taxes. And, during the
crisis, remittances sent worldwide continued to provide a steady source of foreign cur-
rency to national economies at a time when foreign aid and foreign direct investment
fl uctuated signifi cantly. Th ese facts lead to the conclusion that removing restrictions on
human mobility may thus contribute to enhancing fi nancial fl ows among nations and to
alleviating some of the adverse eff ects of the global crisis.
On the other hand, at both the household and macrolevels, adverse eff ects are evi-
dent in all countries examined in this book. Th ere are many lessons to be learned, but
more importantly many more questions to be asked.
Following are a list of fi ndings we have generated in an attempt to understand and
explain remittance practices in relation to the global fi nancial crisis. Each of these has
been tested in certain contexts, some at a regional level, some at an individual country
level, and some at a subgroup (e.g., ethnic, religious or regional population) level. While
all surely need further empirical testing, we believe they point out a few important
avenues for future research and analysis:
1. Th e link between remittances and growth is moderated by fi nancial market condi-
tions. Growth should be understood in terms of not only physical investments but
also investments in human capital. Such investments in long-term assets can be
vital in crisis situations.
2. Return migration is not a typical outcome of the crisis, yet where it did occur, it
may facilitate growth and development in less-developed sending countries (such
as Albania) because it can facilitate the fl ow of fi nancial and human capital to home
countries. Generally return was not an issue, and it was moderated by the eco-
nomic conditions in both sending and receiving countries. Vulnerabilities in desti-
nation countries, whether economic (a decline in currency value) or political (as in
Lebanon), can encourage remittance fl ows.
3. Th e more varied the portfolio of destinations and more jobs available to migrants
reduce the adverse eff ects of the crisis.
4. Tightening admission regimes and immigration restrictions will have adverse
eff ects on remittance fl ows in the long run.
5. Overall fi ndings suggest that the crisis did cause some decline in remittances (for
example, in Mexico), but these were not as large as was feared previously. For
instance, despite an evident stagnation of remittances in 2009, remittances from
the Gulf to South Asia did not decline overall.
6. Because remittances are used mainly for household expenses and maintenance, the
crisis is likely to have aff ected consumption adversely.

INTRODUCTION: REMITTANCE FLOWS AND PRACTICES DURING THE CRISIS l 11
7. Noncitizens and irregular migrants are more vulnerable to crises compared with
naturalized and/or regularized immigrants in the United States and the European
Union.
8. Ethnic segments within national populations (such as Kurdish Turks in Germany
or Latin Americans in Spain) display diff erent remittance-sending and spending
patterns than majority ethnic groups.
9. Regional dynamics and country-specifi c characteristics (of economy, migration
histories, and the like) infl uence remittance fl ows and remittance usage patterns,
suggesting that analyzing remittances at the single-country level has advantages.
10. Culture, society, gender, status, and the strengths and weaknesses of movers mean
that remittance fl ow and usage patterns can diff er within populations. For example,
unlike men, women do not use remittances for building houses but instead to sup-
port relatives (see the Somali case) or to repay loans. Th us it appears that women
are more interested in savings, whereas men are more likely to buy land (for exam-
ple, the Bangladesh case).
11. Remittances vary countercyclically and thus can mitigate the eff ects of crisis, but
they are moderated by the size, location, and income levels of the particular dias-
pora.
12. When the sending country economy is unable to create employment, emigration
continues irrespective of a crisis (as in the Th ailand case). However, remittance
patterns are not solely determined by macroeconomic factors. Remittance-sending
patterns are complex and not always dependent on global economic changes.
13. Cost of remittances is a key driver in the volume of registered remittance fl ows in
Australia and New Zealand.
Th e studies presented in this volume also recommend policy changes aimed at
making remitting an easier and inexpensive practice, while enabling and encouraging
individuals and households to invest in long-term assets. Our recommendation is that
nations develop policies that facilitate more fl uid, less restrictive mobility for humans
and the resources (remittances) they generate. Th e availability of microfi nance and
small loan facilities is one such mechanism to meet this objective. At both the national
and supranational levels, policies and programs could be developed facilitating the use
of remittances for long-term investments—including in human capital—promoting
entrepreneurship, and creating small loan schemes that can contribute to the alleviation
of short-term liquidity needs. Such changes, tailored to both host and recipient country
needs, can strengthen remittances’ contribution to development.
Th ere are also some practical, relatively straightforward steps that can be taken. For
example, eliminating the complexity of transactions and reducing transaction costs
would help increase registered remittances. Many small nations, including several
of those discussed in this volume, will benefi t from systems and policies that enable

12 l IBRAHIM SIRKECI, JEFFREY H. COHEN, AND DILIP RATHA
cheaper and faster remittance transfers. Similarly, improvements in fi nancial literacy
and in simplifying transfer facilities as well as expanding their availability (such as ease
in opening bank accounts in host countries) will facilitate regular fl ows.
Notes
1. For the concepts of movers and nonmovers, see Cohen and Sirkeci (2011).
2. Remittance fl ows to developing countries quadrupled between 2002 and 2008 as a result of
(1) increased scrutiny of fl ows since the terrorist attacks of September 2001, (2) reduction in
remittance costs and expanding networks in the remittance industry, (3) the depreciation of
the dollar (which raises the value of remittances denominated in other currencies), and (4)
growth in migrant numbers and incomes (Ratha 2003).

PART I


15
Chapter 1
Theoretical Appraisal: Understanding Remittances
JEFFREY H. COHEN AND IBRAHIM SIRKECI
The economic role of remittances in the lives of immigrant workers, their send-
ing communities, and the developing nations they hail from is well documented (World
Bank 2006a). Th e Council of Europe estimated that $72 billion fl owed from workers to
their homes in developing countries in 2002. Th is total was well in excess of the total
offi cial aid directed to developing nations that year (COE 2006: 7). Th rough the end of
the decade and even during the global fi nancial crisis of 2008 and 2009 remittance rates
remained consistently strong and did not drop as did other forms of aid (see fi gure I.1
in the introduction). Similarly, the Organisation for Economic Co-operation and Devel-
opment found that at least $126 billion followed the networks that immigrant workers
maintained with their sending households and communities in 2005 (OECD 2005). Th e
formal, legal transfers noted by these studies represent large and largely stable amounts
of money (Maimbo and Ratha 2005; Ratha, Mohapatra, and Xu 2008; World Bank
2006a), yet they do not include informal, unoffi cial, and illegal transfers (Christiansen
2008; Lozano Ascencio 1998; Mohan 2002; Shehu 2004). Furthermore, although these
are large amounts of money, the studies of remittances often do not acknowledge the
anticyclical nature of remittances practices, the role remittances continue to play for
movers and their families, and the measurable benefi ts that go directly and indirectly to
developing nations’ economies and coff ers even in moments of economic crisis (Lianos
and Cavounidis 2010). Remittances can cushion the impact of fi nancial crisis and sup-
port communities that might otherwise share in the misery of the moment.
Remittances follow their own unique paths and are often critical when sending
households struggle to survive and developing nations struggle to create opportunities,

16 l JEFFREY H. COHEN AND IBRAHIM SIRKECI
improve infrastructure, and grow jobs for young populations. Th is is particularly true
in periods of fi nancial crisis as foreign aid declines, national labor markets collapse, and
infl ation rates rise. When economic crises face migrants who have relocated to new
destination countries, remittance practices often remain central and critical. Finally,
we must understand remittances as raw numbers, but we must also recognize that this
perspective does little to illuminate the practices of individuals who are working to keep
their families together and economically healthy. To understand remittance outcomes
we divide our discussion into three sections. First, we defi ne remittances. Second, we
explore the value (economic and cultural) of remittance practices for movers and non-
movers, nations and families. Finally, in our third section, we explore the impacts of the
crisis on remittance outcomes.
Remittances, Migration, and Economics
Remittances are generally defi ned as economic transfers that follow unidirectional paths
from an immigrant worker to his or her sending country and households (Maimbo and
Ratha 2005). Th e amount of money returned by immigrant workers is large and often
far more valuable to most countries than direct aid; yet remittances are about more than
the formal unidirectional fl ow of money (Carling 2008). Social scientists understand
that formal remittances are important to sending countries. Remittances can infl uence
the balance of trade and support national investments (Adams 1991; de Haas 2005;
Skeldon 2008), and remittances also drive investments and sometimes development
(Massey and others 1998/2006; Taylor and others 1996a).
Remittance practices and outcomes are also rooted in the migration process itself
and refl ect the needs of movers and their sending households. Although remittance
practices refl ect the needs of movers and their sending households, they often do not
refl ect national economic policies. In fact, it is best to think of migration and remittance
practices as the outcomes of the failures of national economic policy to address public
needs. As such, it should not be a surprise that often remittances do not follow national
economic trends. In fact, remittance practices are often anticyclical and an important
response to economic crises (Buch and Kuckulenz 2010). In other words, while econo-
mies slow and labor markets contract, remittance rates tend to remain steady or decline
more slowly. Furthermore, as labor markets collapse in destination countries (as has
happened in the United States and Europe), migrants tend to refocus their eff orts and
fi nd work in new sectors of the economy, and even though incomes may decline, remit-
tance rates will often remain healthy. Migrants, in fact, take great care to preserve remit-
tance rates, moving together and limiting expenses to save funds that can be sent home.
Remittances are proof of the connections migrants share with their sending house-
holds and communities (Guarnizo 2003) and evidence of the importance they hold for
movers and nonmovers, who may have few local opportunities to earn money (Mazzu-
cato and others 2008; Yang and Martínez 2006). Remittances are strategic as is migra-
tion itself. Migration moves people to labor markets rather than bringing labor markets

1. THEORETICAL APPRAISAL: UNDERSTANDING REMITTANCES l 17
to new locales, and remittances funnel earnings home. In this sense remittances are
an economic hedge, a way to support a household, cover expenses, and perhaps invest
even as there is economic decline at the national level. Finally, although the majority of
research is focused on remittances as they fl ow from immigrant worker to their sending
households, evidence is growing for a return fl ow (though often not monetary) from
sending households to settled immigrants (Gamburd 2008; Rose and Shaw 2008).
Remittance outcomes are defi ned by migration practices as we noted above. But the
habitus, or “the socially and culturally conditioned set of durable dispositions or pro-
pensities for certain kinds of social actions” of the sender, his or her household, com-
munity, and nation, also defi nes outcomes (Vertovec 2009: 66; see also Bourdieu 1977)
as do the economic and political realities of the movers’ world (and these include not
only the sending nation, but the destination nation as well). In other words, remittance
outcomes are rooted in migration decisions. Migration decisions and outcomes are in
large part, as we noted in the introduction, a reaction to violence, whether that vio-
lence is physical, economic, political, or otherwise. Migration is also infl uenced by the
strengths and weaknesses that defi ne the mover’s life; the advantages and disadvantages
that defi ne him or her and his or her household and community; and fi nally the pulls,
pushes, opportunities, and costs that create global economic patterns in sending coun-
tries and countries of destination (see Åkesson 2009; Eversole 2005; Lubkemann 2005;
Parreñas 2005; Schmalzbauer 2008; Stodolska and Santos 2006).
A migrant’s status infl uences his or her remittance practices. It is important to
remember that a majority of movers globally are traveling in the open, often with
papers, along well-planned routes and with well-organized plans. Th is does not mean
that migrants are free of harassment; rather, even in the best of situations, migrants
face choices that can undermine outcomes. We noted that a migrant’s status infl uences
remittance outcomes. So too does the way a migrant is described by his or her destina-
tion country. Migrants are recruited to jobs, some to highly skilled positions. Th e highly
skilled migrant is likely to be welcomed into his or her destination country (Cornelius,
Espenshade, and Salehyan 2001), earn well, receive benefi ts, and potentially support
higher remittances. Th e unskilled migrant may fi nd that he or she must sneak across a
border, move about without documentation or with questionable documentation, and
take lower-wage work with potentially far less to send home.
Deciding on an internal or international destination will infl uence remittance prac-
tices (Trager 2005). Th e internal mover in a small developing nation can usually fi nd a
cohort of individuals from his or her sending region or community. Language is usually
not a major problem, and diff erences that divide nations are not present (although see
China for a very diff erent situation). In these internal settings remittances are likely
much lower, yet they are not invisible and can be critical to the strategic organization of
a household’s labor. Nevertheless, it is important to remember that although the inter-
national migrant likely faces legal barriers, the internal mover does not; for some mov-
ers the sojourn to an internal destination can be destabilizing and lead to far smaller
remittances.

18 l JEFFREY H. COHEN AND IBRAHIM SIRKECI
For many migrants (whether moving internally or internationally and whether they
have papers or not) remittances regardless of their size are a sign of their successful
moves. Th is is true for migrants who are bound for destinations where they can fi nd
work that will support those who cannot or will not migrate (Moran-Taylor 2008)
and for migrants who leave families searching for opportunities but with little hope
of enhancing their household (Lubkemann 2005; Newell 2005; Trager 2005). Remit-
tances are not the same for everyone. Limits on earning may be beyond the control
of the mover, but diff erent statuses, destinations, and the like also all infl uence remit-
tance outcomes. Key factors are the fees involved in transfers as well as who charges
the fees (state, private company, bank) and whether money fl ows through formal or
informal means. Furthermore, some sending households are never satisfi ed with the
eff orts made by their mobile members, just as some migrant workers cannot or will
not remit (Ramirez, Skrbis, and Emmison 2007; Sanchez 2007; Tatla 2002). Of course, a
household’s response to remittances is largely outside the realm of this discussion, but
it is important to remember that factors beyond those noted above and that range from
the personal to the psychological can and often do aff ect remittance outcomes.
Remittance practices are not always predictable—and they shift over time (Massey
and others 1998/2006). Early movers have expenses to cover in their moves that can
reduce remittance rates. Long-term and settled migrants (the migrant stock in a desti-
nation country) have diff erent expenses. Early movers tend to remit to cover immediate
expenses as remittances fl ow to sending households. New movers, younger movers, and
movers with young children who cannot contribute to their family’s fi nancial well-being
also tend to see their remittances channeled to immediate and daily expenses (Stark
1992; Trager 1984).
Older migrants, and immigrants who are settled in their destination communities
and hold reasonably steady jobs, often earn more money and earn that money more
consistently. As their time in a new destination increases and their work matures, their
remittances can become both more regular and larger. Th e money they return, in part
because it may increase over time refl ecting higher wages, can be used to cover the
costs of daily life and the purchase of consumer goods and potential investments for
development (Cohen and Rodriguez 2005; Newell 2005). Th e migrant stock also does
not spend as much money as do new immigrants. Settled migrants typically are not
paying off the costs of their moves, have stocked their homes, and are situated to save
rather than spend extra income. Although leisure costs may rise, funds are likely still
available to remit.
Migrants with older children and migrants from larger families also have opportuni-
ties to use their remittances not only to purchase consumer and luxury goods but also
to begin to make investments and purchases that can translate into investments (Adams
2006; Brown and Connell 1994; Conway 2007; Lopez and Seligson 1991; Ratha 2007;
Remple and Lobdell 1978; Stahl and Arnold 1986; van Doorn 2004).
Th e experiences of repeat and long-term sojourns tend to translate into better wages
and greater success and generate more consistent remittances. Th is pattern of success

1. THEORETICAL APPRAISAL: UNDERSTANDING REMITTANCES l 19
also attracts new migrants to join the pool of movers as the entire migration process
becomes self-reinforcing (Massey 1990). In a similar fashion, remittance practices can
be self-reinforcing. New movers tend to follow and emulate the migrant stock in an
area, and like settled migrants, new movers remit.
Finally, a household’s overall economic health will infl uence outcomes. Th ere is a
diff erence in the outcomes for remittances when a household is large, growing, and
wealthy (at least by local standards). Larger households do not by defi nition do better
than smaller households; however, where the household includes more working-age
adults, the diversity of workers can enhance outcomes. Wealthier households also tend
to have opportunities that poor households lack. Th is can include the opportunity to
migrate to an international destination where strong wages can be found. Th e migrants
from wealthier households may also hold better educations that will allow them to
access better jobs. Again, the most successful of households are able to build on the
diversity of work possibilities (migration, local wage labor, farm work, and the like) to
create opportunities to save money and invest in new ways (Sørensen, van Hear, and
Engberg-Pedersen 2002); yet the majority of remittances are directed toward the chal-
lenges of daily life (Suro and others 2002).
Th e timing of remittances also has an eff ect on amounts returned by immigrant
workers. It is often diffi cult for newly settled immigrant workers to remit, and many
movers are forced to spend the fi rst portions of their sojourns covering the costs of
movement and expenses of establishing new homes. Settled migrants earn over the long
term and, in contrast to popular images of their lives, images that focus on the disrup-
tive nature of their arrival and existence, typically follow a fairly stable lifestyle that is
rooted in a long-term home, regular job, and shared community of like-minded people.
Th ese are the migrants we are most concerned with, and these are the migrants who
remit the greatest percentage of funds to their sending households and communities.
A migrant’s job at his or her point of destination can also infl uence remittance prac-
tices. Incomes and wages vary from job to job and situation to situation, and in response
to age, gender, and legal status (Cohen, Rodriguez, and Fox 2008; Miera 2008; Ryan
and others 2009; Semyonov and Gorodzeisky 2005; Shauman and Noonan 2007; Wong
2006). We also know that diversity in the labor market enhances opportunities and
allows migrants to remit through economic slowdowns and fi nancial crises. Migrants
know this as well; they use their moves to escape violence and settle strategically, com-
bining work, changing jobs when necessary, and balancing immediate needs against
long-term goals.
Although the migrant stock of a country is dependable and remits over the long
term, remittances can decline over time. In fact, many observers feared that remittance
decline or decay might be exacerbated by the global fi nancial crisis and the loss of labor
opportunities in the West. We can expect that remittances from migrants will tend
to grow over the short term and for an average of about fi ve years, increasing as the
migrant worker’s income rises, lifestyle stabilizes, and experiences and knowledge of his
or her new setting expands. Remittances can also decline (often described as remittance

20 l JEFFREY H. COHEN AND IBRAHIM SIRKECI
decay) over time. Decline or decay can happen in at least two ways (Gammage 2006;
Lowell and de la Garza 2002). First, although remittances are central to the support
and improvement of a sending household’s overall economic health, as local incomes
increase, remittances tend to decline following a fairly standard rate (Hunte 2004). Sec-
ond, remittances also decline as migrants’ stays in destination countries increase and as
families are established or reunited (Orozco 2002). Nevertheless, remittances generally
prove resilient, and in many situations remittance rates remain largely unchanged over
time as new migrants replace old, as migrant stock reinvests in sending households and
communities, and as second- and third-generation children of migrants continue the
practices of their parents and grandparents. Altruism on the part of the mover, sup-
port of a community’s traditions, and family pressures can mediate some decline. More
importantly, the opportunities to invest and save in the sending community, what is
sometimes described as saving for return, keep remittances fl owing (Brown 1998).
Th e variation in remittance practices over time and in relation to the sojourner’s
situation makes it diffi cult to defi ne the impact that remittances have on sending house-
holds, communities, and sending countries (Brettell 2007). Many developing countries
now celebrate their migrants and the money they return to their sending households.
In several countries (including El Salvador, for example) remittances are one of the top
sources of available investment capital (Landolt 2001), but we fi nd more than invest-
ment taking place. In El Salvador, not only do remittances spur the creation of small
businesses and investments, they also encourage changes in the way nationals think
about their place in the state, the meaning of violence, what is economic well-being,
and access to resources and opportunities. Remittances provide nonmovers with the
opportunity to demand higher wages and reject the status quo, to push for political
and economic reforms, and to organize (Landolt 2001). A similar pattern persists in
Tonga, where migrant remittances tend to follow informal paths and are often invested
by households in the informal economy and in goods that can be sold at area fl ea mar-
kets (Brown and Connell 1994). Th e fl ea markets and the informal channels that most
remittances follow help migrants and their sending households avoid the excessive fees
charged on remittances but also support organizing and protesting of the status quo. In
a more recent paper, Brown (1997) notes that remittances to the Pacifi c region lead to
increased human capital as nonmigrants use the returns made by immigrant workers to
support families and generate investments.
We should not assume that all remittances work to improve the situation and medi-
ate violence for sending households. Vertovec (2009) notes that remittances can dis-
place local incomes and increase inequalities, drive consumptive spending, and infl ate
prices, among other things. Researchers go so far as to describe the resulting situation
as a “syndrome” that leaves nonmigrants dependent on remittances and caught in a net
of consumerism with few opportunities to escape as traditions are rejected for life in
increasingly capitalized market systems (Binford 2003; Reichert 1981).
It is easy to focus on larger remittances and their obvious importance for movers and
nonmovers, communities, and nations, yet many migrants cannot aff ord to return large

1. THEORETICAL APPRAISAL: UNDERSTANDING REMITTANCES l 21
sums to their homes. Some of these migrants are internal movers who earn relatively
little as part of national workforces in countries with low wages and restricted job mar-
kets. In a weak labor market where low wages are paid, the migrant may remit, but only
at a rate far lower than compatriots who cross international lines and fi nd higher wages
in foreign countries.
Other migrants may cross national lines yet fi nd low wages as they move from one
developing nation to another developing nation, as is often the case in South-South
migration and clear in the outcomes of Sub-Saharan African migration (Cliggett 2005).
Gender also complicates remittance rates. Migrant women often fi nd service jobs that
pay less than what their male comigrants can earn (particularly if they work as nannies
or maids), and they often juggle a job against maintaining a home for other migrants,
thus robbing them of time for additional work (Al-Sharmani 2006; Brumer 2008; Cur-
ran and others 2005; Gilbertson 1995; Livingston 2006; Moran-Taylor 2008; Pantoja
2005). Remittances for these movers may amount to little more than a few dollars sent
every now and again or perhaps a gift of clothing or a toy, yet the remittances are criti-
cal to survival and connections (Cliggett 2005). Finally, even as we focus on the impor-
tant role remittances play in the economic life of sending communities, it is critical to
remember that mobility is not always due to economic need but may refl ect other kinds
of violence, insecurities, and needs.
Th e value of remittances has increased dramatically even as dollars for direct aid and
other forms of support (including national support) has declined (Buch and Kuckulenz
2010). Nevertheless, limits exist to the power of remittances. First, evidence is at hand
that even as remittance rates increase, the totals do not replace the decline in state
investment. Th is is especially evident around economic crisis, including the global fi nan-
cial crisis of 2008–09. Remittances did not replace other forms of investment; rather,
they were critical as one of the only sources of capital available to developing nations
and their people as they coped with the outcomes of the economic collapse in the West.
Second, although remittance rates increase, the increase grows as able citizens engage in
migration. Th is “brain drain” risks alienating young, working-age individuals from their
sending nation even as their remittances grow all the more important to the continued
economic survival of their sending households and communities (Tanner 2005). In a
fi nancial crisis, confl icting pressure mounts on migrants. Th ey are expected to remit
and support their sending households, yet the very act of migrating can rob a household
and nation of its best and best trained members. Yet the fl ow of remittances is perhaps
more critical during crises then at any other time for developing nations threatened
with their own fi nancial collapse. Th ird, concern has been expressed about remittance
decay, which (as we noted above) may lead to the long-term decline of investment capi-
tal over time (Singh 2010). Th e global crisis seems to encourage, not discourage, invest-
ment and remittances, and this is one area of hope as we continue to explore the data on
the impacts of the most recent fi nancial crisis on developing nations.
A second area of interest lies in the value of nonmonetary remittances. Nonmon-
etary remittances can include gifts in kind, education, investments outside of the
22 l JEFFREY H. COHEN AND IBRAHIM SIRKECI
economic realm, and the like (King, Dalipaj, and Mai 2006). Th ese remittances can be
critical to the survival and health of sending communities and countries and include the
growth of “fi xed” capital improvements to communities (ranging from investment in
infrastructure to investment in building projects) to “fl exible” investments that accrue
around goods and services that are portable and transferable between populations or
that are a foundation for future growth. Lest we be too positive, such remittances can
also become a problem, as receiving communities incur new expenses to maintain and
build on the fi xed and fl exible investments that migrants make.
Remittances and the Crisis
Many observers anticipate that remittance rates decline in times of crises, and in fact,
during the recent global fi nancial crisis of 2008–09, some evidence suggested that
remittances fl owed from sending households to migrants struggling in their destination
communities. Nevertheless, the reality is that although remittances may decline, they
remain critical and quite stable for the survival of sending households and communi-
ties. Th is was clear in disaster-ridden situations, including Haiti in 2010, as in other less
fraught examples where remittance rates declined but did not disappear (Orozco 2002).
In these situations, households that received remittances often changed their behavior,
directing smaller overall remittances to necessities and forgoing luxury purchases but
still relying on the money returned to make ends meet. Again, we must be clear: Remit-
tances have proven resilient. Th ey have declined at a far slower pace than foreign direct
investment, private debt, or portfolio equity fl ows and are recovering rapidly in 2010.
Conclusions
Remittances follow set rules, but not simple rules. Remittance outcomes can be coun-
terintuitive and even a bit unexpected. Remittances are not simply indicators of national
labor patterns and economic outcomes. To most citizens of sending countries remit-
tances are the most important resource available in the struggle to survive. Yet, at the
same time, their very presence often means that nation-states ignore some responsibili-
ties. It is to the contradictory nature of remittance practices that we devote this volume.
We hope this collection captures not only the dynamic nature of remittance practices,
but also the dynamic and sometimes unanticipated outcome of remittances used by
sending households and communities.

23
Chapter 2
Forecasting Migrant Remittances during the Global Financial Crisis
SANKET MOHAPATRA AND DILIP RATHA
The global financial crisis that started in August 2008 with the collapse of
Lehman Brothers led to concerns among policy makers that it would result in precipi-
tous declines in external resource fl ows to developing countries, which could adversely
aff ect the sustained economic growth and reduction in poverty seen during the previ-
ous decade (World Bank 2009b).1 Given the size and increasing importance of migrant
remittances for developing countries, which had reached more than $330 billion in
2008 (see the next section), similar concerns were expressed that a decline in remit-
tances would aff ect the poorest countries and households that were heavily dependent
on remittances. Policy makers needed forward-looking analysis of the impact of the
global economic crisis on remittance fl ows to developing countries.
Migrant remittances have usually been countercyclical with respect to downturns
and crises in origin countries (see discussion below). However, unlike past emerging
market crises that had started in emerging markets, such as Mexico in 1994–95 or East
Asia in 1997–98, the current crisis started in the rich countries and spread to develop-
ing countries (Ratha and others 2008). Although numerous studies have documented
the importance of both host and home country factors in determining remittance fl ows
(see below), it was not clear a priori how remittances would behave in response to a
deep economic downturn in the host countries. To our knowledge, no previous mod-
els had been developed for forecasting remittances, a necessary tool for analyzing the
impact of the global fi nancial crisis on remittance fl ows.
Th is chapter describes a fi rst attempt to develop a methodology to forecast remittances.
It exploits an existing bilateral remittance matrix for more than 200 economies developed

24 l SANKET MOHAPATRA AND DILIP RATHA
by Ratha and Shaw (2007) to generate country-level forecasts. Th e framework allows the
forecasts of remittances to be consistently linked to the forecasts of global economic growth.
Th e next section provides a brief discussion about the rising importance of remit-
tances for developing countries and the need for forecasting remittances. We then dis-
cuss the available evidence on the determinants of remittance fl ows and the extent to
which these explanatory variables can be used for forecasting future remittances, fol-
lowed by a description of the World Bank’s methodology for forecasting remittances.
Th e chapter then discusses the results of the forecasts, outlines some of the caveats that
need to be considered when using this methodology, and concludes with recommenda-
tions for improving the quality of forecasts.
The Rising Importance of Migrant Remittances for Developing Countries and the Need for Forecasting Remittances
Recorded migrant remittances to developing countries are estimated to have reached
$316 billion in 2009. Th ese constitute 2 percent of gross domestic product (GDP) for
developing countries and nearly 6 percent of GDP for the group of low-income coun-
tries; in several countries, these fl ows are more than a quarter of GDP (Ratha, Mohapa-
tra, and Silwal 2010a). In many countries these fl ows exceed foreign direct investment,
portfolio equity, and debt fl ows and in some countries offi cial aid. Remittances have
been remarkably stable compared with other types of fl ows, contribute to stabilizing
the current account position, and reduce the volatility of capital fl ows and output vola-
tility of recipient countries (Bugamelli and Paterno 2009; Chami, Hakura, and Montiel
2009; Gupta, Pattillo, and Wagh 2009; Ratha 2005, 2007; World Bank 2006a). Th eir size
and stable and countercyclical nature have implications for improving debt sustainabil-
ity and creditworthiness of developing countries and these countries’ access to inter-
national capital markets (Avendano, Gaillard, and Parra 2009, Ratha 2007; Ratha, De,
and Mohapatra 2010). Remittance receipts are associated with reduction in poverty,
increased household resources devoted to investment, improved health and education
outcomes, and higher levels of entrepreneurship (see, for example, Adams and Page
2005; Amuedo-Dorantes and Pozo 2010; Fajnzylber and Lopez 2007; Hildebrandt and
McKenzie 2005; Valero-Gil 2009). Remittances can also improve recipient households’
access to formal fi nancial services (Giuliano and Ruiz-Arranz 2009; Gupta, Pattillo, and
Wagh 2009). Th e growing importance of remittances for developing countries implies
that a need exists to evaluate the sustainability of remittances (whether remittance
fl ows would continue at their current or higher levels) in the short and medium terms.
Determinants of Remittances
Remittance fl ows are broadly aff ected by three factors: the migrant stocks in diff erent des-
tination countries, incomes of migrants in the diff erent migrant-destination countries,
2. FORECASTING MIGRANT REMITTANCES DURING THE GLOBAL FINANCIAL CRISIS l 25
and to some extent incomes in the migrant-sending country. Th e size of emigrant stocks
is arguably the most important determinant of remittances (Freund and Spatafora 2008;
Lueth and Ruiz-Arranz 2007; Ratha and Shaw 2007; Singh, Haacker, and Lee 2009).
Th e income level of the migrant and the needs of the family at home play an equally
important role in infl uencing both the level and changes in remittances. Several studies
have documented that remittances respond positively to an increase in the host country’s
GDP (Frankel 2009; Glytsos 1997; Ruiz and Vargas-Silva 2010; Vargas-Silva and Huang
2006) and in a negative or countercyclical manner during economic downturns, fi nancial
crises, and natural disasters in the migrant-sending country (Clarke and Wallsten 2004;
Frankel 2009; Mohapatra and others 2009; Ratha 2010b; World Bank 2006a; Yang 2008b;
Yang and Choi 2007). Lueth and Ruiz-Arranz (2008), however, report that bilateral remit-
tances respond positively to increases in both host and home countries’ GDP. Some other
studies have found that remittances are strongly countercyclical in poorer countries such
as Bangladesh and India, but procyclical in middle-income countries such as Jordan and
Morocco (Sayan 2006; World Bank 2006a). In terms of the relative importance of home
and host country factors, several studies have found that the host country’s economic
conditions appear to be more important compared with home country factors (Barajas
and others 2010; Glytsos 1997; Swamy 1981; Vargas-Silva and Huang 2006).
Other factors such as remittance costs and migrants’ vintage also play a role in
infl uencing remittance fl ows. In a survey of Tongan migrants in New Zealand, Gibson,
McKenzie, and Rohorua (2006) fi nd that remittances sent would rise by 0.22 percent
if costs fell by 1 percent. Other studies have found that remittances are infl uenced by
interest rate diff erentials, exchange rate premia (the diff erence between the offi cial and
black market exchange rates), and the duration of migration (El-Sakka and McNabb
1999; Glytsos 1997). Freund and Spatafora (2008) report that recorded remittances
depend negatively on transfer costs and the parallel market premium because migrants
may prefer to send money through informal channels when transfer costs are high or
when the offi cial exchange rate is unattractive. Some authors argue that the skill com-
position of migrants matters for remittances, but the evidence of this phenomenon is
mixed. Whereas Adams (2009), Faini (2007), and Niimi and Ozden (2006) using cross-
country data fi nd that countries that have a larger proportion of high-skilled migrants
receive less remittances—perhaps because these migrants are also more likely to settle
in the host countries and reunite with their families—studies based on microlevel sur-
vey data fi nd the opposite result. Bollard and colleagues (2009) using survey data in 11
OECD destination countries fi nd a positive relationship between education levels of
migrants and the amounts remitted. Clemens (2009) fi nds that Nigerian migrant doc-
tors in the United States sent more than $5,000 a year in remittances.
A Simple Model for Forecasting Remittances
Although remittances are infl uenced by all the above factors, their use in a forecasting
exercise is constrained by the lack of reliable forecasts of the future evolution of these

26 l SANKET MOHAPATRA AND DILIP RATHA
explanatory variables. Th e data on remittance costs are not easy to model, although
we know that remittance costs are falling and causing remittance fl ows to increase.
Th e migrants’ vintage, or the number of years lived in the destination country, is also a
plausible determinant of remittance fl ows to the origin countries (Glytsos 1997; Merkle
and Zimmermann 1992). New migrants may send more remittances as a percentage
of their income because they have better ties back home. However, anecdotal evi-
dence exists that new migrants often have fi nancial obligations (such as repaying loans
incurred while migrating) and therefore are unlikely to send remittances immediately
after arrival in the host country.2 Modeling the evolution of variables such as interest
rate diff erentials and offi cial and parallel market exchange rates over the medium term
is fraught with similar diffi culties.
Th e model-based remittances therefore rely primarily on the latest available infor-
mation on bilateral migrant stocks (Ratha and Shaw 2007; World Bank 2011b) and the
World Bank and International Monetary Fund’s (IMF’s) medium-term projections of
nominal incomes in the host countries and in the home country.3 Changes in exchange
rates are captured to some extent because projections of nominal GDP factor in plau-
sible assumptions about the evolution of nominal exchange rates.
Th e forecasts for remittance fl ows are based on stocks of migrants in diff erent des-
tination countries, incomes in the host country that can infl uence remittances sent by
these migrants, and to some extent incomes in the origin country. Th erefore, remit-
tances received by country i from country j can be expressed as
Rij
= ƒ(Mij
, yi , y
j), (2.1)
where Mij
is the stock of migrants from country i in country j, yj is the nominal per
capita income of the migrant-destination country, and yi is the per capita income of the
remittance-receiving country. Th e bilateral remittance estimates are calculated using
the methodology described in Ratha and Shaw (2007) based on migrant stocks in dif-
ferent destination countries, incomes of migrants in the diff erent destination countries,
and incomes in the source country (see annex). We assume that migrant stocks will
remain unchanged, which is not an unreasonable assumption in the short term. We
prepare the forecasts for remittance fl ows by examining the eff ects of income changes
in destination countries worldwide.
Remittance intensities (Iij
) were calculated as the ratio of remittance outfl ow from
country j to migrant-origin country i (Rij
) to the nominal GDP of remittance-source
country j (Yj):
Iij = Rij /Yj = Rij / Rj( )× Rj /Yj( ) = rij I j , (2.2)
where Ij is the share of remittance outfl ows R
j to the GDP Y
j of country j. Here r
ij , the
share of country j’s remittance outfl ows received by country i, was calculated using the
bilateral remittance matrix of Ratha and Shaw (2007).
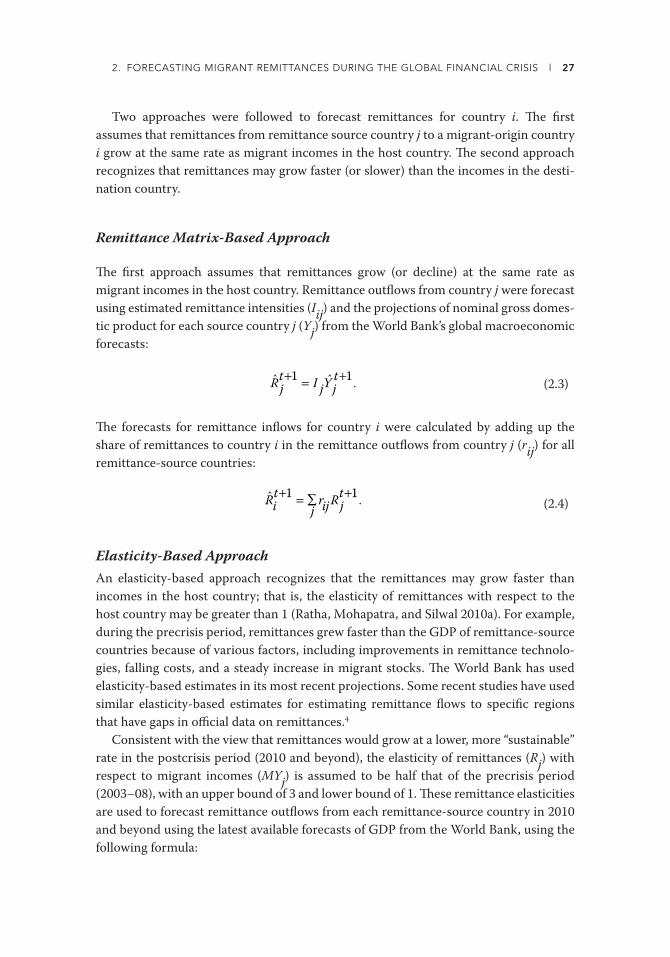
2. FORECASTING MIGRANT REMITTANCES DURING THE GLOBAL FINANCIAL CRISIS l 27
Two approaches were followed to forecast remittances for country i. Th e fi rst
assumes that remittances from remittance source country j to a migrant-origin country
i grow at the same rate as migrant incomes in the host country. Th e second approach
recognizes that remittances may grow faster (or slower) than the incomes in the desti-
nation country.
Remittance Matrix-Based Approach
Th e fi rst approach assumes that remittances grow (or decline) at the same rate as
migrant incomes in the host country. Remittance outfl ows from country j were forecast
using estimated remittance intensities (Iij
) and the projections of nominal gross domes-
tic product for each source country j (Yj) from the World Bank’s global macroeconomic
forecasts:
R jt+1 = I jY j
t+1. (2.3)
Th e forecasts for remittance infl ows for country i were calculated by adding up the
share of remittances to country i in the remittance outfl ows from country j (rij
) for all
remittance-source countries:
Rit+1 = rijRj
t+1j∑ . (2.4)
Elasticity-Based Approach
An elasticity-based approach recognizes that the remittances may grow faster than
incomes in the host country; that is, the elasticity of remittances with respect to the
host country may be greater than 1 (Ratha, Mohapatra, and Silwal 2010a). For example,
during the precrisis period, remittances grew faster than the GDP of remittance-source
countries because of various factors, including improvements in remittance technolo-
gies, falling costs, and a steady increase in migrant stocks. Th e World Bank has used
elasticity-based estimates in its most recent projections. Some recent studies have used
similar elasticity-based estimates for estimating remittance fl ows to specifi c regions
that have gaps in offi cial data on remittances.4
Consistent with the view that remittances would grow at a lower, more “sustainable”
rate in the postcrisis period (2010 and beyond), the elasticity of remittances (Rj) with
respect to migrant incomes (MYj) is assumed to be half that of the precrisis period
(2003–08), with an upper bound of 3 and lower bound of 1. Th ese remittance elasticities
are used to forecast remittance outfl ows from each remittance-source country in 2010
and beyond using the latest available forecasts of GDP from the World Bank, using the
following formula:

28 l SANKET MOHAPATRA AND DILIP RATHA
R jt+1 = Rj
t 1+η j (I j )log MYjt+1 /MYj
t( )( ) . (2.5)
Th e forecasts for remittance infl ows for country i were calculated by adding up the
share of remittances to country i in the remittance outfl ows from country j (rij
) for all
remittance-source countries:
Rit+1 = rijRj
t+1j∑ . (2.6)
In later versions, the bilateral migration matrix developed by Ratha and Shaw (2007)
was updated with immigrant stock data from various sources to provide the most com-
prehensive estimates of bilateral immigrant stocks worldwide in 2010 (World Bank
2011b).
Discussion of Results
Th e model has performed well during the global fi nancial crisis. Despite initial con-
cerns of a sharp decline, the actual decline in remittances in 2009 has been similar
to our forecasts. Th e model predicted correctly that remittance fl ows to developing
countries would decline only modestly, unlike foreign direct investment and portfo-
lio debt and equity fl ows. Th e initial forecasting exercise prepared in November 2008
(Ratha, Mohapatra, and Xu 2008) predicted that remittance fl ows to developing coun-
tries would fall by 1 percent in 2009 in the base-case scenario and no more than 6 per-
cent in a low-case scenario (where the last year’s fl ow of migrants was forced to return).
Remittance fl ows were forecast to decline in fi ve of the six developing regions (other
than the East Asia and Pacifi c region) in the base-case scenario. As the fi nancial crisis
deepened and the World Bank and the International Monetary Fund revised downward
their growth forecasts, the model-generated forecasts of remittances were also revised
downward, to a 5–8 percent decline in March 2009 and a 7–10 percent decline in July
2009 (Ratha and Mohapatra 2009; Ratha, Mohapatra, and Silwal 2009a).
Th e actual outcome in 2009 was a 6 percent decline in remittance fl ows to devel-
oping countries (Ratha, Mohapatra, and Silwal 2009a). In terms of regional distribu-
tion, remittance fl ows declined in fi ve of the six developing regions, but the extent of
declines in some regions were larger and in others smaller than initially predicted—East
Asia and Pacifi c, the Middle East and North Africa, and South Asia and Sub-Saharan
Africa did better, but Europe and Central Asia and Latin America and the Caribbean
performed worse. However, as initially predicted, remittances remained more resilient
compared against other types of private resource fl ows to developing countries.
Several limitations can be identifi ed in the forecasting methodology outlined above.
First, the model does not explicitly feature return migration, a key risk factor. We do
2. FORECASTING MIGRANT REMITTANCES DURING THE GLOBAL FINANCIAL CRISIS l 29
not have data on return migration for most migrant-destination countries. To account
for the additional vulnerabilities that migrants might face during a downturn, we devel-
oped a low-case scenario where we assumed that the stock of migrants in high-income
countries would decline by the last two years of migrant infl ows. (Annual infl ows were
about 2 percent of migrant stocks for the United States, 4 percent for Europe, and 5 per-
cent for the Gulf Cooperation Council countries; see Ratha, Mohapatra, and Xu 2008).
Such a scenario could also be a result of some return migration and a disproportionately
larger impact of the crisis on migrants’ employment and incomes. Th e actual returns
during the crisis have turned out to be smaller (Ratha, Mohapatra, and Silwal 2009a).
Th is suggests a need for high-frequency data on new migration fl ows and return.
Second, the model does not fully capture eff ects of movement of exchange rates.
Exchange rate movements such as between the euro and the U.S. dollar, and the dollar
and relevant local currency, can aff ect the value of remittances in dollar terms, as well
as the consumption versus investment motive for sending remittances. Even though
remittance fl ows from the Russian Federation to Central Asian countries such as Arme-
nia, the Kyrgyz Republic, and Tajikistan declined by between 15 and 34 percent in dol-
lar terms in the fi rst half of 2009, the decline in terms of the Russian ruble was much
smaller because the ruble lost a quarter of its value against the dollar (Ratha, Mohapa-
tra, and Silwal 2009a). Similarly, the depreciation of the Indian rupee and the Philippine
peso produced a “sale eff ect” on housing, bank deposits, stocks, and other assets back
home, which made these assets cheaper in foreign currency terms and increased remit-
tances sent for investment motives.
Th ird, immigration controls and quotas imposed during a crisis are a political deci-
sion and therefore diffi cult to capture in a mathematical model. Th e forecasting exercise
described above attempts to address this risk by developing a low-case scenario that
assumes there might be no new fl ows or that existing migrants might need to return.
Fourth, the model does not capture the response of remittance fl ows to falling costs.
Remittance costs have fallen rapidly during the last decade (Ratha 2005; World Bank
2010c). As discussed in a previous section, the elasticity of remittance fl ows to remit-
tance costs can be high (Gibson, McKenzie, and Rohorua 2006; World Bank 2006a).
Structural equations that estimate remittances as a function of remittance costs are
needed, but it would be diffi cult to undertake this estimation until the quality of data on
fl ows and costs improve.
Fifth, the model does not capture shifts in remittance fl ows between formal and
informal channels. In the precrisis period, remittance fl ows shifted from informal to
formal channels in response to falling remittance costs and intensifi cation of monitor-
ing of informal channels after September 11, 2001. Th ere appears to be a reversal of this
trend after the crisis as a weak job market and tightening of immigration controls have
resulted in many documented migrants staying on without proper documents and who
are probably relying on informal channels.
In conclusion, the fi nancial crisis has highlighted the need for forecasts of remittance
fl ows in many developing countries where these fl ows have proved to be a lifeline to
30 l SANKET MOHAPATRA AND DILIP RATHA
the poor and the policy makers. Yet much remains to be done to improve the forecast
methodology, data on bilateral fl ows, and high-frequency monitoring of migration and
remittance fl ows.
Notes
1. Th e World Bank’s Global Development Finance 2009 report estimated that net private capi-
tal infl ows to developing countries fell to $707 billion in 2008 (from a peak of $1.2 trillion in
2007) and were expected to fall further by 50 percent by the end of 2009 (World Bank 2009b).
2. In some of the simulations, we try to capture the vintage eff ect by examining a low-case
scenario where recent migrant infl ows of the last one or two years are forced to go back as
the economic crisis deepens in the major destination countries, an unlikely but high-impact
scenario.
3. Th e World Bank’s projections up until April 2010 have used the bilateral migration matrix
of Ratha and Shaw (2007). Th is is an updated version of the bilateral migration matrix devel-
oped by Parsons and colleagues (2007).
4. In the absence of timely and reliable offi cial data on remittances for most Sub-Saharan Afri-
can countries, Barajas and colleagues (2010) use the elasticity of remittances to income com-
puted by Singh, Haacker, and Lee (2009) and the IMF’s GDP estimates to estimate the extent
of decline in remittance fl ows to Sub-Saharan Africa in 2009.
5. Th is section draws on Ratha and Shaw (2007).

2. FORECASTING MIGRANT REMITTANCES DURING THE GLOBAL FINANCIAL CRISIS l 31
Annex: Estimating Bilateral Remittances
Credible national data on bilateral remittances are not available.5 Even when such data
are reported, they may not be accurate, because funds channeled through international
banks may be attributed to a country other than the actual source country. For exam-
ple, funds fl owing from the Gulf region through international banks may be attributed
to New York or London (Ratha 2005). Market players and researchers, therefore, have
attempted to derive bilateral remittance fl ows indirectly using bilateral migrant stock
data and estimates and assumptions about the remittance behavior of migrants. Har-
rison, Britton, and Swanson (2004), for example, assume that each migrant sends a fi xed
average amount.
We have calculated bilateral remittances by allocating remittances received by each
developing country among the countries of destination of its migrant nationals. We use
three diff erent allocation rules: (1) weights based on migrant stocks abroad; (2) weights
based on migrant incomes, proxied by migrant stocks multiplied by per capita income
in the destination countries; and (3) weights that take into account migrants’ incomes
abroad as well as source-country incomes. Each of the three methods is discussed in
more detail below.
Using the Share of Migrants in Diff erent Destination Countries as Weights
Th e fi rst method of estimating bilateral remittances assumes that remittances Ri
received by country i are proportional to migrant stocks in the diff erent destination
countries. Hence, the weight attached to destination country j is
wij =Mij
Mijj∑
, (2A.1)
where Mij
is the number of migrants from country i in destination country j. Bilateral
remittances received by country i from destination country j are therefore wij
Ri.
A shortcoming of this method is that it assumes that each migrant sends the same
amount of remittances regardless of where he or she lives and no matter what the
migrant’s income in the host country. Th e large variance of incomes across migrant-
receiving countries (and even across countries within each income group) limits the
usefulness of this method. Th is method yields an upper bound estimate of South-South
remittances, however, because it attributes the same amount of remittances to a devel-
oping country as to a high-income country.
32 l SANKET MOHAPATRA AND DILIP RATHA
Using Both Migrants Abroad and Income Level in the Host Country
Th e second method of estimating bilateral remittances uses migrant stocks in diff er-
ent destination countries and host-country incomes to construct weights. Th e weight
attached to destination country j is
wij =MijYj
MijYjj∑
, (2A.2)
where Mij
is the number of migrants from country i in destination country j and Yj is the
average per capita gross national income (GNI) of migrant-receiving country j. Bilateral
remittances received by country i from destination country j are therefore wij
Ri.
Although this method is superior to the fi rst one, because it takes into account both
migrant stocks and the average income of the country where the migrant resides, it
assumes that each migrant sends a fi xed share of his or her income, regardless of the
level of that income or the needs of the family back home. Th is method yields a lower-
bound for South-South remittances.
Using Weights Based on Migrant Stocks, Per Capita Income in the
Destination Countries, and Per Capita Income in the Source Countries
Th e third method tries to correct for the shortcomings of the fi rst two methods. Th e
average remittance sent by a migrant in destination country j (rij
) is modeled as a func-
tion of the per capita income of the migrant-sending country and the host country:
rij = f (Yi ,Yj ) =
Yi if Yj < Yi
Yi + (Yj − Yi )β if Yj ≥ Yi
⎧⎨⎪
⎩⎪
, (2A.3)
where Yj is the average per capita GNI of migrant-receiving country j,
_Y
i is the per capita
GNI of the migrant’s home country, and β is a parameter between 0 and 1. Th e amount
sent by an average migrant is assumed to be at least as much as the per capita income
of the home country, even when the individual migrates to a lower-income country.
Th e rationale is that the migration occurs in the expectation of earning a higher level
of income for the dependent household than what the migrant would earn in his or her
home country. Ideally, the migrants’ income should be taken from household survey
data, but in the absence of such data, we use per capita GNI in the host country as a
proxy for the migrant’s income abroad and per capita GNI in the sending country as a
proxy for the dependent household’s income (assuming that the migrant’s remittances
compensate for at least the counterfactual loss of income due to migration).

2. FORECASTING MIGRANT REMITTANCES DURING THE GLOBAL FINANCIAL CRISIS l 33
Th e level of remittances is assumed to increase with the level of host country income,
but at a decreasing rate: ƒβ>0 and ƒβ<0. Th e total amount of remittances received by
country i is therefore
Ri = rijMijj∑ . (2A.4)
Th e parameter β in equation (2A.3) is estimated for each country such that the total
of remittances received is equal to Ri in equation (2A.4). Th e parameter β is found to be
remarkably stable across developing countries (0.74 for Bangladesh and China, 0.78 for
India, 0.77 for the Philippines, and 0.67 for Vietnam). To estimate bilateral remittances
for all countries, we use the average β (equal to 0.75) for the top 20 remittance-receiving
countries. Equation (2A.3) is then used to create weights so that individual remittances
from equations (2A.3) and (2A.4) add up to the total remittances received.
A comparison of these estimates for South-South and North-South remittances
calculated using the three diff erent methods is provided in the main text. It is usually
impossible to verify the accuracy of these bilateral estimates because most countries
in the South as well as in the North do not report sources or destinations of remit-
tance fl ows. A handful of countries (such as Bangladesh and the Philippines) do report
sources of remittance infl ows, but in these data more fl ows are likely to be attributed
to the United States and Europe, where international banks have headquarters (Ratha
2005). Remittances from South countries may also be underestimated because of
restrictions on outward remittance fl ows and irregular status of migrants (as an exam-
ple, Bangladesh does not report any remittance infl ows from India even though it has a
large migrant population in India).


35
Chapter 3
Economic Crises and Migration: Learning from the Past and the Present
TIM GREEN AND L. ALAN WINTERS
This chapter deals with crises and migration and, in particular, with the recent
economic and fi nancial crisis and migration:
• How will it aff ect migration
• Perhaps more important, how should it aff ect migration, for migration is nothing if
not deeply aff ected by the policy decisions of government
• In the long run, perhaps even more important, how will the crisis help us to under-
stand the most complex and deeply felt of all aspects of globalization—the decision
to move to a diff erent country.
At fi rst glance one might think that most migration was due to crises of one sort or
another and thus that crises were the key issue for us to study. In one sense we can make
that true by defi ning “crises” appropriately, but once one starts reading and thinking
through the subject more carefully, that no longer seems true. Surely, crises aff ect the
timing of migration and occasionally mark an identifi able watershed between regimes,
but in the end the evidence suggests that migration is a long-run phenomenon respond-
ing to long-run determinants. Another thing we did not know at the time was that Tim
Th is chapter is the basis of the Keynote Address given by Winters at the World Bank’s Second “Migration and Development”
Conference, September 10–11, 2009, in Washington, DC. We are grateful to participants for comments on the fi rst draft. It
was originally published in Th e World Economy 33(9): 1053–72. It is reprinted with permission. Th e analysis and the views
expressed in this chapter are those of the authors and do not necessarily refl ect those of the Department for International
Development.
36 l TIM GREEN AND L. ALAN WINTERS
Hatton and Jeff Williamson were about to publish a well-put-together little note on
the subject on VoxEU.org (Hatton and Williamson 2009), which goes over much of the
same ground, and the good sense and wisdom of which we heartily commend.
Th e chapter comprises four substantive sections. Th e fi rst off ers the briefest of
descriptions of the current economic crisis. It is followed by a discussion of migration
and crises in the nineteenth century. Th is is an attractive period to study because it not
only saw massive fl ows of people, but these were largely unencumbered by government
policies, and so they off er us a reasonable chance of inferring the real economic and
social incentives to migration. In fact, one might better say that the nineteenth century
illustrates migration and economic cycles rather than migration and economic crises,
for the sort of fl uctuations we just experienced were fairly common then and were more
or less accepted as a law of nature.
Th e third section looks briefl y at twentieth-century experience. By that time policy
had become more active, and so it is more diffi cult to back the determinants out from
observation, but nonetheless the patterns of crises and migration off er some insight—
even if only confi rming what had previously been seen. Th e fi nal substantive section
advances hypotheses about what we might expect to see in the twenty-fi rst century and
asks whether the preliminary evidence is lending them any credence.
The Economic Crisis, 2008–09
Th ere are many accounts of the fi nancial crisis of 2007–08 and the resulting economic
crisis of 2008 to—who knows when.1 We shall not rehearse them here save to argue that
by modern standards we are witnessing a major shock. Not only are incomes and output
sharply lower than expected, but we are experiencing a fairly much unexpected decline
in global economic intercourse. Th us it may seem particularly pertinent to ask whether
the currently poor relation of globalization—migration—will be heavily aff ected.
Almost uniquely in postwar history, 2009 has seen a decline in the volume and value
of international trade. Trade volumes contracted by 0.6 and 2.2 percent in 1981 and 1982
(World Trade Organization, Statistics Database, http://stat.wto.org/StatisticalProgram/
WSDBStatProgramHome.aspx?Language=E), whereas for 2009, the International
Monetary Fund (IMF) is reporting a year-on-year decline of 11 percent, which represents
a drop of about 16 percent relative to what was predicted for 2009 even as late as mid-
2008. In value terms, 1982 and 1983 saw declines of 6.3 and 2.0 percent, respectively,
compared with a decline over the 12-month period to October 2009 of nearly $3 trillion
or 23 percent. (November 2009 is the latest month for which data are available.) Likewise
international capital fl ows have collapsed, with the Institute for International Finance
estimating net private fl ows to developing and emerging markets of about $435 billion in
2009 compared with nearly $1 trillion in 2007 and $667 billion in 2008.
In terms of real gross domestic product (GDP), the IMF’s World Economic Outlook of
April 2010 estimates world growth of −0.6 percent for 2009, more than 4 percent below

3. ECONOMIC CRISES AND MIGRATION: LEARNING FROM THE PAST AND THE PRESENT l 37
the growth rates expected for that year a year earlier. Th e losses relative to expected
levels were more than 7 percent in Eastern and Central Europe, where the fi nancial col-
lapse had direct eff ects, and about 1.5 percent in developing countries in Asia, which
were dynamic and robust going into the crisis. Allowing a few years for economies to
return to previous growth rates, we can expect real GDP (and hence real GDP per head)
to be about 8 or 9 percent below the levels we had expected going forward from 2011.
Figure 3.1 illustrates.
FIGURE 3.1 Real GDP per Capita with and without the Current Crisis, 1980–2013
with the crisis
without the crisis
rea
l GD
P p
er c
apit
a, b
ase
year
= 1
980
1.0
1.2
1.4
1.6
1.8
2.0
1980 1985 1990 1995 2000 2005 20101.0
1.4
1.8
2.2
2.6
1980 1985 1990 1995 2000 2005 2010
rea
l GD
P p
er c
apit
a, b
ase
year
= 1
980
a. Advanced countries b. Emerging and developing economies
Source: IMF, World Economic Outlook, April 2009, http://www.imf.org/external/pubs/ft/weo/2011/01/weodata/download.aspx.
The Nineteenth Century
Perhaps the best-known example of crisis-led migration among Anglo-Saxon scholars
is the Irish Famine of the 1840s. Data are not very reliable for this period, but O’Rourke
(1995) has patched together the story. From 1800 the Irish population was increasing
steadily. In 1845 half of the potato crop failed, in 1846 nearly the entire crop did, little
was planted in 1847, and in 1848 the crop failed again. It is diffi cult to translate this into
changes in GDP of the sort we are used to, but the potato was the staple food of agricul-
tural workers in an agricultural land, so it must have been very large. Moreover, poverty
was very extreme in Ireland at the time, so the losses were almost certainly critical for
many people.
O’Rourke reports excess mortality of about 1 million over the famine, averted births
of around 400,000, and emigration of about 1 million. Th e numbers do not quite add up,
but fi gure 3.2 shows the fantastic reversal of population trends in the late 1840s. Hatton
and Williamson (2005: 47) report from various sources that Irish emigration accounted

38 l TIM GREEN AND L. ALAN WINTERS
for 71 percent of total European emigration and 50 percent of immigration over 1846–
51, and that between the mid-1840s and early 1850s nearly 1.5 million people left. Obvi-
ously these departures are not all due to the famine (many would have left anyway), but
it is reasonable to conclude that a good part is.
FIGURE 3.2 Population of Ireland during the Nineteenth Century
3
4
5
6
7
8
9
1791 1811 1831 1851 1871 1891
mill
ions
Source: O’Rourke 1995.
One of the most widely accepted ideas in migration work is the importance of net-
works—“friends and families”—in reducing migration costs. Th us, the Irish famine
increased net emigration and emigrant stocks over some counterfactual; the positive
feedback loop will lead to greater fl ows for, probably, many decades.2 Hatton and Wil-
liamson have several times estimated the size of “family and friends eff ects” and found
them large and positive in all cases. In their book (2005) they suggest that, generally, for
every 1,000 emigrants abroad, 20 more per year are pulled abroad, and that for Ireland
the eff ect was twice that (41 per year). Th us, if the famine caused 1 million to leave and
establish themselves abroad, the future outfl ow would be 41,000 higher each year, push-
ing the rate up from 7 per thousand per year pre-famine to 13 post-famine (O’Rourke
1995). On this reading the famine explains perhaps half of Irish emigration from 1850
to, say, 1910—a huge amount.
Th e Irish famine was a classic economic crisis—exactly the sort of shock that real
business cyclists dream about. It was also massive. Other “economic crises” are typically
smaller and/or noneconomic in magnitude. “Noneconomic” is a diffi cult term to get
to grips with—see, for example, Winters (1989) on so-called noneconomic arguments
for agricultural protections—but loosely speaking, we include confl ict, such as in the
Democratic Republic of Congo or Rwanda, political repression, including the pogroms,
the Iron Curtain, or Idi Amin in Uganda, and natural disasters, such as the Dust Bowl
3. ECONOMIC CRISES AND MIGRATION: LEARNING FROM THE PAST AND THE PRESENT l 39
or the island-volcano Montserrat. Th ese surely matter and can have strong eff ects on
population movements, but we save them for another occasion. In economic crises the
important events are the ups and downs of the business cycle. Th e nineteenth century
saw relatively large fl uctuations in output and income in most countries and very large
short-term fl uctuations in migration. A natural question is whether they were related,
and they off er a good opportunity to study the eff ects of crises on migration because the
period was largely free of policy impediments to mobility. Policy is clearly an important
dimension of the response to crises, and we will come to it, but it is useful to keep it
separate.
Asking about crises and migration is a bit like the pull versus push debate in migra-
tion empirics; see, for example, Th omas (1954). Quite obviously, both matter, but if cri-
ses were generally infl uential, we would expect to see some sign of it in the GDP growth
and gross emigration data. Figures 3.3 and 3.4 plot emigration from the British Isles
(including Ireland), based on passenger records.3 Figure 3.3, which refers to the United
States, includes non-U.K. citizens, probably in increasing numbers through the century,
but for fi gure 3.4, which looks at total emigration, it is possible to break out citizens after
1853, which we also do. Th e GDP data come from Maddison (2003) and the emigration
data from Ferenczi and Wilcox (1929). We focus on North America so that we can also
relate the fl ows to the U.S. business cycle below. Both series have been standardized for
ease of presentation. Th e correlation between emigration and growth are small, and a
regression of emigration on time and growth fi nds the latter quite insignifi cant.
One might argue that an interest in crises mandates a focus mainly on periods of
contraction or very weak growth, but this, too, yields little signs of connection. Fig-
ure 3.5 shows that the years of least growth show only a slight tendency toward higher
migration, even allowing for lags.
We have conducted a similar review of the nineteenth-century data for France, Ger-
many, the Netherlands, and Sweden and have similarly found no plausible evidence that
downturns in home countries systematically induce higher emigration.
Th e alternative role for crises is on the “pull” side, with income dynamics in the
recipient country infl uencing migrant infl ows. Figure 3.6 explores this for fl ows from
our fi ve example countries to the United States plotted along with the U.S. growth rate
of GDP since 1871 (the start of Maddison’s GDP series). Th ere are clearly signs of a
positive relationship here, with the depressions of 1874–77, 1883–86, 1893–94, and
1907–08 all refl ecting declines in emigration to the United States and similar sharp
increases in the corresponding upturns.
Even clearer is Hatton and Williamson’s (2005) fi gure reporting detrended (total)
emigration rates per thousand for six European source countries—reproduced with
modifi cations in fi gure 3.7. Th e striking thing is the similarity of the patterns, which
suggests that all may be at least partly caused by a common factor. Sketching in the
depressions in the United States (which was the dominant, but far from the only, destina-
tion) suggests that, indeed, host country fortunes are a pretty strong determinant of vol-
untary migration. Th e shaded areas correspond to periods of U.S. economic downturn.
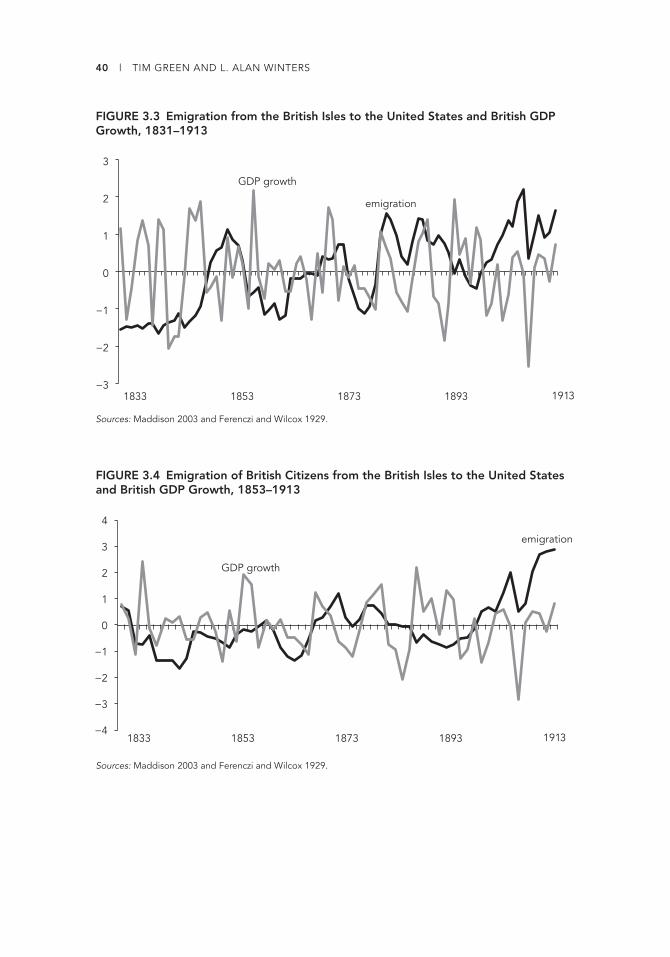
40 l TIM GREEN AND L. ALAN WINTERS
FIGURE 3.3 Emigration from the British Isles to the United States and British GDP Growth, 1831–1913
−3
−2
−1
0
1
2
3
1833 1853 1873 1893 1913
emigration
GDP growth
Sources: Maddison 2003 and Ferenczi and Wilcox 1929.
FIGURE 3.4 Emigration of British Citizens from the British Isles to the United States and British GDP Growth, 1853–1913
1833 1853 1873 1893 1913
emigration
GDP growth
−4
−3
−2
−1
0
1
2
3
4
Sources: Maddison 2003 and Ferenczi and Wilcox 1929.
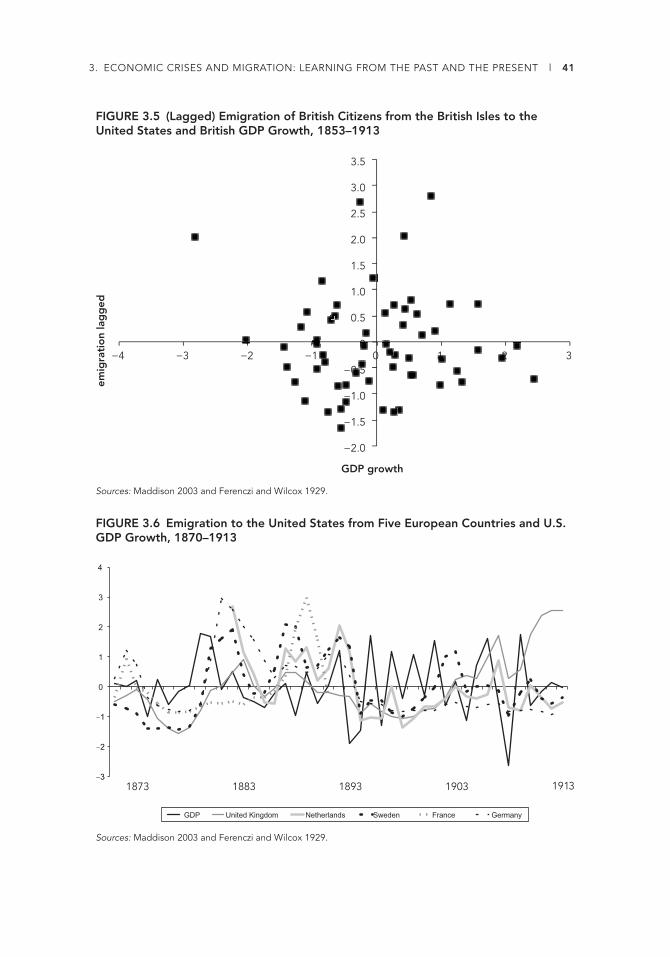
3. ECONOMIC CRISES AND MIGRATION: LEARNING FROM THE PAST AND THE PRESENT l 41
FIGURE 3.5 (Lagged) Emigration of British Citizens from the British Isles to the United States and British GDP Growth, 1853–1913
−2.0
−1.5
−1.0
−0.5
0
0.5
1.0
1.5
2.0
2.5
3.0
3.5
−4 −3 −2 −1 0 1 2 3
emig
rati
on
lag
ged
GDP growth
55555522222
000000011111
0 50.50 50.0.
Sources: Maddison 2003 and Ferenczi and Wilcox 1929.
FIGURE 3.6 Emigration to the United States from Five European Countries and U.S. GDP Growth, 1870–1913
−3
−2
−1
0
1
2
3
4
GDP United Kingdom Netherlands Sweden France Germany
1873 1883 1893 1903 1913
Sources: Maddison 2003 and Ferenczi and Wilcox 1929.
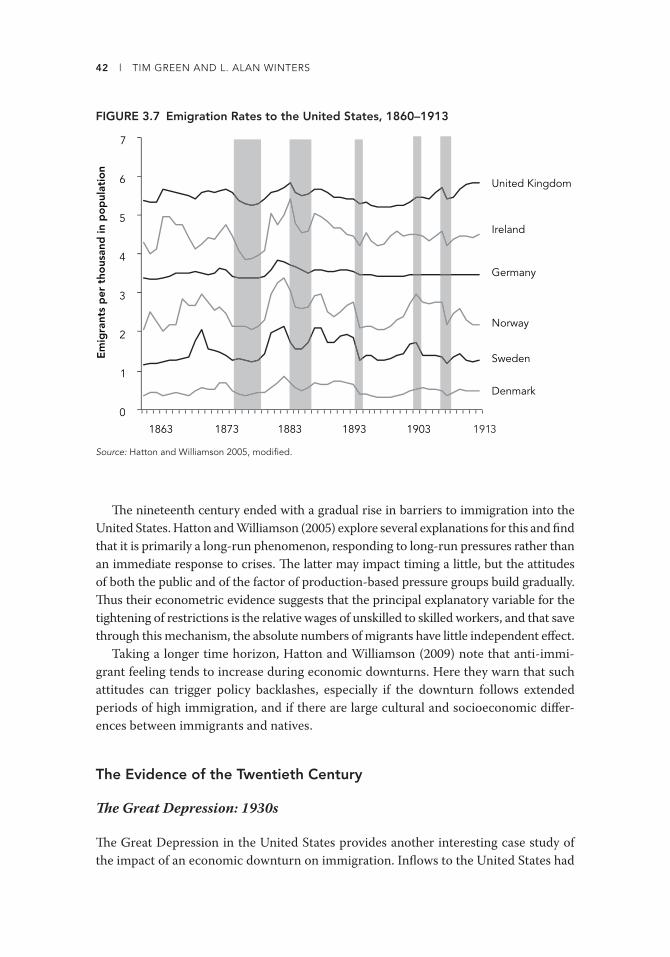
42 l TIM GREEN AND L. ALAN WINTERS
FIGURE 3.7 Emigration Rates to the United States, 1860–1913
1913
0
1
2
3
4
5
6
7
1863 1873 1883 1893 1903
Em
igra
nts
per
tho
usan
d in
po
pul
atio
n
Denmark
Sweden
Norway
Germany
Ireland
United Kingdom
Source: Hatton and Williamson 2005, modifi ed.
Th e nineteenth century ended with a gradual rise in barriers to immigration into the
United States. Hatton and Williamson (2005) explore several explanations for this and fi nd
that it is primarily a long-run phenomenon, responding to long-run pressures rather than
an immediate response to crises. Th e latter may impact timing a little, but the attitudes
of both the public and of the factor of production-based pressure groups build gradually.
Th us their econometric evidence suggests that the principal explanatory variable for the
tightening of restrictions is the relative wages of unskilled to skilled workers, and that save
through this mechanism, the absolute numbers of migrants have little independent eff ect.
Taking a longer time horizon, Hatton and Williamson (2009) note that anti-immi-
grant feeling tends to increase during economic downturns. Here they warn that such
attitudes can trigger policy backlashes, especially if the downturn follows extended
periods of high immigration, and if there are large cultural and socioeconomic diff er-
ences between immigrants and natives.
The Evidence of the Twentieth Century
Th e Great Depression: 1930s
Th e Great Depression in the United States provides another interesting case study of
the impact of an economic downturn on immigration. Infl ows to the United States had

3. ECONOMIC CRISES AND MIGRATION: LEARNING FROM THE PAST AND THE PRESENT l 43
fallen signifi cantly in the years before the Depression because of a series of restric-
tive immigration laws, including national quotas and outright prohibitions on immi-
gration from some Asian countries. Th is caused immigration to fall from an annual
average of 800,000 between 1900 and 1914 to about 400,000 per year between 1919
and 1929 (OECD 2009b). Immigration from countries such as Canada and Mexico that
were unconstrained by such barriers remained high, however, rising from 13 percent
of total infl ows in 1921 to 45 percent of the total in 1925–28. Despite these preex-
isting constraints, the Depression severely curtailed immigration. Between 1923 and
1929 an average of 93 percent of national immigration quotas were fi lled (with many
countries regularly fi lling their quotas). By 1933 this had fallen to 5 percent. Outfl ows
also increased, with signifi cant returns to Mexico—so much so that net migration was
negative between 1932 and 1935 (OECD 2009b).
Th e 1970s to 1990s
Th e sharp increases in oil prices in 1973, and the economic slowdown that this trig-
gered in many of the destination countries of the developed world, also had a signifi cant
impact on migration. Some countries saw large falls in infl ows; total immigration to
West Germany fell from 869,000 in 1973 to 423,000 in 1977. Immigration to Switzer-
land fell from 90,000 to 61,000 over the same period (Salt, Dobson, and Latham 2009).
Infl ows did not decline evenly across origin countries, however, with migration from
more developed origin countries slowing more than migration from the less developed
origin countries. Declines in immigration were due at least in part to tighter immigra-
tion policies (OECD 2009b). Recruitment from Turkey to Germany fell from 118,000
in 1973 to 6,000 in 1974, and labor immigration was suspended by Belgium and France
in 1974.
Outfl ows from Europe rose slightly over this period, but then fell back again. In West
Germany they rose from 527,000 in 1973 to 600,000 in 1975, but back down to 452,000
in 1977. Outfl ows from Sweden for the same years were 32,000, 21,000, and 15,000,
respectively (Salt, Dobson, and Latham 2009), despite large increases in unemployment
among non-European migrants in many European countries, as the recession hit the
construction and manufacturing sectors that employed large numbers of migrant labor-
ers. Again, returns were more likely among migrants from higher income countries.
In general, therefore, infl ows often fell sharply over the period, but typically
remained positive. Th is, combined with limited increases in returns, meant that
stocks of migrants in Western Europe did not fall signifi cantly. Indeed, by 1980, stocks
were higher in many countries (including France and Germany) than they had been
in 1973. Although aggregate numbers recovered, however, the recession did trigger
signifi cant structural changes in migratory fl ows. Th e guestworker programs were
eff ectively ended through a combination of falling labor demand, negative public
opinion, and resulting policy change. Many migrants settled rather than return home,
however, and migration for family reunifi cation increased as families settled in many

44 l TIM GREEN AND L. ALAN WINTERS
European countries. In the Gulf countries meanwhile, economic growth triggered the
rise in migration to the region from South Asia that continues to this day: Immi-
gration boomed after the early 1970s, with the foreign population in Saudi Arabia
increasing fi vefold between 1974 and 1990 (Lucas 2005) as infl ows from South Asia
grew.
Analysis of migration to the United Kingdom during the recessions of 1974–77,
1980–84, and 1991–93 shows a similar pattern of aggregate fl ows. Infl ows slowed tem-
porarily, but there is no evidence of a signifi cant increase in outfl ows (Salt, Dobson,
and Latham 2009). Work by the OECD (2000) found a close correlation between net
immigration and economic cycles since the 1960s for a number of OECD countries.
Th ere were only a few cases, however, when net migration actually became negative
during a downturn. Th e OECD also found that not only does the relationship vary by
country, but also that in some countries it has weakened with time. Th ey attribute this
to tightened labor immigration regimes—family and humanitarian fl ows are much less
sensitive to the business cycle than labor migrants.
Th e Asian Crisis of 1997–2008
In most cases the 1997 Asian crisis had a relatively modest impact on regional migra-
tion. As table 3.1 shows, although the number of migrants dipped in some countries, in
others it increased throughout the crisis. Th is was despite attempts by numerous coun-
tries to tighten their migration regimes to protect the jobs of domestic workers. In some
cases, such as the rice and fi sheries sectors in Malaysia and Th ailand, employers lobbied
against these restrictions because of their reliance on migrant labor and the reluctance
of natives to do some of the tasks that they performed (Skeldon 2004).
One exception to the muted response was Malaysia. Table 3.1 shows a large increase
and then a decrease in its number of migrants. Th is probably refl ected a boom in 1997
followed by strong eff orts to curb numbers, all superimposed on a rising trend of
reported migration due to policy eff orts to improve data collection.
Hypotheses for the Twenty-fi rst Century
Based on this history and our understanding of the drivers of migration, we can con-
struct a number of hypotheses about what we might expect to see in the current global
downturn.
1. Infl ows of migrants tend to fall when destination countries go through recessions.
Although the expected income diff erentials that drive most economic migration
are clearly aff ected by conditions in both origin and destination countries, histori-
cal evidence suggests that destination country conditions are more infl uential dur-
ing downturns.

3. ECONOMIC CRISES AND MIGRATION: LEARNING FROM THE PAST AND THE PRESENT l 45
2. Returns may increase somewhat, but these increases tend to be signifi cantly smaller
than changes in infl ows.
3. Although migration trends are largely driven by long-term determinants, crises
could perhaps have longer-term eff ects if they trigger changes in government poli-
cies, structural economic change, or short-run migrations that become long term
because of network eff ects.
4. Some of the commentaries on the impact of the current crisis suggest that migrants
are likely to be aff ected more severely by the recession than native workers, given
the kind of work they do, and the risk of discrimination.
5. Economic crises can trigger tighter immigration policies in destination countries,
although this is more likely if public pressure for such changes had previously built up.
We need to ask whether past experience is enough to go on. By and large, we would
say yes. For example, fi gure 3.8 plots the fl uctuations in GDP growth among likely
migration source countries now (1980–2013) alongside those of Britain for the nine-
teenth century. Average growth is higher, but the current shock is pretty similar to sev-
eral nineteenth-century ones.
Th e hypotheses focus on destination countries, and a brief consideration of the rela-
tive sizes of incomes across rich and poor countries shows why. An implication of the
growth patterns shown in fi gure 3.1 is that the income diff erential between rich and
TABLE 3.1 Offi cial Estimates of the Total Number of Foreign Workers in Asian Economies, 1996–2000
Economy 1996 1997 1998 1999 2000
Chinaa 80,000 82,000 83,000 85,000 —
Hong Kong SAR, Chinab 164,300 171,000 180,600 193,700 216,790
Indonesiaa 24,868 24,359 21,207 14,863 16,836
Japanc 610,000 630,000 660,000 670,000 710,000
Korea, Rep.c 210,494 245,399 157,689 217,384 285,506
Malaysiac 745,239 1,471,645 1,127,652 818,677 799,685
Philippinesa 4,333 6,055 5,335 5,956 —
Singapore — — — 530,000 612,233
Taiwan, China — 245,697 255,606 278,000 326,515
Thailandc 1,033,863 1,125,780 1,103,546 1,089,656 1,102,612
Source: Skeldon 2004. Original data from “Country Papers Presented at the Workshop on International Migration and Labour Market in Asia,” Tokyo, OECD and Japan Institute of Labour, February 4–5, 2002, as submitted by the respective country governments.
Note: — = not available.
a. Estimate of foreign experts only, primarily professionals, the highly skilled, and teachers.
b. Indicates an estimate of foreign domestic workers only, not highly skilled workers.
c. Includes estimate of undocumented workers.

46 l TIM GREEN AND L. ALAN WINTERS
poor countries—the driver of migration in the simplest of economic models—will be
lower over the next fi ve years than the last fi ve. As noted above, advanced and develop-
ing economies will suff er approximately the same decline in their incomes relative to
expected, so the ratio of their GDPs per head is roughly unchanged. But the same pro-
portionate decline (about 9–10 percent) also applies to the absolute diff erence between
them, and it is generally held that migration responds more strongly to the absolute
than to the relative diff erence. (After all, the costs of migration are absolute: transporta-
tion, the psychological costs from being away from home, the costs of re-equipping and
learning how to live in a new society, and so on.)
If we apply the real GDP growth rates projected above to the absolute diff erences in
gross national income per head between advanced and developing countries measured
in purchasing power parity terms for 2000, the diff erence peaks in 2007 at about $29,400
and falls to about $27,200 in 2010 before gradually increasing again. Th e “loss” of dif-
ferential over the crisis is suffi ciently small relative to the absolute gain from migrating
that it seems unlikely to make much diff erence to the incentives to migrate per se.
On the other hand, Martin (2009a) has suggested various reasons why the eff ects of
this recession may be diff erent from that of previous recessions. Th is recession has hit
much of the world (at least high- and middle-income countries) broadly simultaneously,
unlike, say, the Asian Crisis. Th ere is an increased understanding of the value of remit-
tances, so origin countries may make stronger eff orts to ensure that emigrant popula-
tions stay abroad, and the fl ows of remittances continue. Migration to some countries
such as the United States is increasingly based on family reunifi cation, which we might
expect to be less sensitive to short-term economic downturns.
FIGURE 3.8 GDP Growth, Then and NowG
DP
gro
wth
(%)
1985 1995 2005 2015
GD
P g
row
th (%
)
−6
−4
−2
0
2
4
6
8
−6
−4
−2
0
2
4
6
8
a. United Kingdom, 1831–1913
b. Emerging and developingeconomies, 1980–2013
1833 1853 1873 1893 1913
Sources: Maddison 2003 and IMF World Economic Outlook Database.

3. ECONOMIC CRISES AND MIGRATION: LEARNING FROM THE PAST AND THE PRESENT l 47
Even without these reservations, the degree of confi rmation or refutation that we
should expect from this exercise is limited. Although the hypotheses are necessar-
ily general, impacts tend to be highly country specifi c given the range of factors that
can aff ect fl ows. Th us a good deal of heterogeneity must be expected. Th e severity of
the recession is also likely to be important in determining the magnitude and possibly
nature of the impacts, and this is not yet entirely clear. Moreover, the data on migra-
tion are poor and slow to emerge. With all these caveats in mind, let us proceed to the
evidence about the twenty-fi rst century economic crisis, some of which now is starting
to appear.
Infl ows of Migrants
We would expect there to be a lag between an economic slowdown and falling immi-
gration, not least because of the delays involved in processing immigration applica-
tions. Th e U.S. Employment-Based Permanent Migration program, for example, has
lags of four to eight years (OECD 2009b). Also, countries with quota systems may not
see declines in infl ows at all if those quotas (such as the H1-B program in the United
States) were previously oversubscribed.
Despite this, however, there is evidence that infl ows to at least some of the main
destination countries are already beginning to slow. Data from the American Com-
munity Survey show that net immigration to the United States has slowed, from an
annual average of about 1 million between 2000 and 2006 to about 500,000 between
2006 and 2007. Mexican data (from INEGI) support this. International emigration
from Mexico fell from 1 million between February 2006 and February 2007 to just over
800,000 for the same period one year later, and from 369,000 in the second quarter of
2006 to 144,000 in the second quarter of 2009 (MPI 2010). Th e United Kingdom has
also seen signifi cant falls in inward migration. Registrations to the Workers Registra-
tion Scheme (by migrants to the United Kingdom from the “Accession 8” countries of
Eastern Europe) fell by 54 percent between the fi rst quarter of 2008 and the same period
a year later, from 46,000 to 21,300, although registrations appear to have stabilized since
then. Ireland saw a 57 percent decline in immigration from these “A8” states over the
same period (IPPR 2009a). In Spain new entries to their employer-nominated immigra-
tion system fell from more than 200,000 in 2007 to 137,000 in 2008. Applications for
temporary skilled migration to Australia were 11 percent lower in February 2009 than
in the same period the year before.
Although it is possible that some of this slowdown is due to tighter immigration poli-
cies, at least some of it is not, such as the A8 migration to the United Kingdom, which
is essentially unconstrained by offi cial barriers. Similarly, applications for H-1B visas for
the United States have slowed. In 2007 and 2008 all of the 65,000 quota for such visas
had been oversubscribed within days of applications being accepted at the start of April.
In 2009 only 45,000 applications had been received by August.

48 l TIM GREEN AND L. ALAN WINTERS
Th ere is some evidence that irregular migration fl ows may also have slowed. Inter-
ceptions along the United States–Mexico border fell from more than 1 million in 2006
to 860,000 in 2007 and 700,000 in 2008 (OECD 2009b). Th ese fi gures should clearly
be treated with caution, however. Illegal border crossing is only one form of irregular
migration, and varying levels of interdiction will be aff ected by a range of factors besides
changing fl ows.
In the United States meanwhile, remittances sent home by Mexicans during the fi rst
half of 2009 fell by 11 percent compared with the same period the year before. Again,
this could easily be because of declining remittances per migrant rather than declining
migrant numbers, so it does not off er much independent evidence.
Equally, outfl ows from some countries do not seem to have been signifi cantly
aff ected by the downturn. Again this may be linked to the sectors in which migrants
are working. Th e number of Indonesian care workers working abroad rose slightly in
the fi rst quarter of 2009. Government statistics from the Philippines show no slowing
in labor exports by spring 2009, and the Overseas Employment Administration reports
that in 2008, 200,000 Filipino workers were recruited to the Gulf, only 4.9 percent less
than in 2006 (IPPR 2009b). Questions have been raised about the data here, however,
with reports that Filipino labor agencies have been reporting a 30 percent drop in labor
exports (BMZ 2009).
Returns
Evidence on returns is more diffi cult to come by than evidence on infl ows, as govern-
ments tend to be less concerned with counting people on their way out of the country
than they are with counting those on their way in. What information we do have seems
to support the idea that there have not been large returns from most destination coun-
tries. Th ere seems to be little evidence of large-scale return migration from the United
States to Latin America. Suggested explanations for this include the poor employment
situation in origin countries and the increasing diffi culty of reentering the United States
once migrants have left (Ratha and Mohapatra 2009). Even when destination govern-
ments have tried positively to encourage return, this has not always been successful.
In late 2008 the government of Spain introduced a program off ering signifi cant cash
inducements if unemployed immigrants agreed to return home and not come back
to Spain for three years. Th e Spanish government off ered 80,000 places through this
scheme, but by August 2009 only 6,600 immigrants had applied.
Exceptions may be found to this general rule of limited returns. Th ere is anecdotal
evidence of signifi cant returns from Russia to some Central Asian countries such as
Tajikistan and Uzbekistan, though reliable data for this do not seem to be available, and
there have been widespread reports of returns of Poles from the United Kingdom (IPPR
2009b). Suggested explanations for this apparent exception have included the falling
value of the pound against the zloty, the low cost of transport, the relative strength of
the Polish economy, and the lack of barriers preventing Poles from returning to the
3. ECONOMIC CRISES AND MIGRATION: LEARNING FROM THE PAST AND THE PRESENT l 49
United Kingdom in the future if they wished. Again, though, no hard data are at hand
on these returns, so it is diffi cult to be sure.
Having said this, an expectation appears to exist among numerous origin country
governments that there either are, or will be, signifi cant numbers of returnees. Various
governments have instituted schemes to assist those who may return home. Uzbekistan
has set up “crisis centers” to help returnees or those who have fallen victim to traffi ck-
ers, and Nepal has established a welfare fund to provide returnees with compensation
if their contracts were prematurely terminated and retraining programs for returnees
(BMZ 2009). In October 2008 Malaysia’s Human Resources Ministry announced that
it was prepared to provide repatriation assistance for all Malaysian workers in Singa-
pore who lost their jobs there (MPI 2008), and the Keralan government in India has
announced a scheme for providing low-cost loans to migrants returning from the Gulf.
Th e Philippine government has introduced a range of measures to assist returnees,
including help in fi nding new jobs. Between December 2008 and April 2009 this scheme
helped 6,500 returning migrants.
Long-Term Structural Eff ects
It is diffi cult to draw conclusions at this point about possible long-term changes. Th ere
have been reports of large-scale movements of internal migrants in China (and other
Southeast Asian countries such as Indonesia) because of declining employment in
export-oriented industries, but data are limited, and this could simply be a temporary
eff ect. Until more time has elapsed for changes to have occurred and data to emerge, it
is diffi cult to say anything more, except to note that if changes to immigration policies
of destination countries triggered by the crisis become permanent, then this could be a
potential source of long-term change.
Impacts on Migrants Relative to Native Workers
Th ere has been considerable concern among those writing about the likely impact of the
downturn on migration that migrants are likely to be hit harder by the recession than
native workers. Immigrants (especially irregular migrants) often have less secure job
contracts, they are more likely to be temporary or part time, they are overrepresented in
less-skilled occupations, and immigrant-owned businesses are more likely to go bank-
rupt. (Gibb 2009; IOM 2009; OECD 2009a, b). Th ey may also face discrimination. A
study from Sweden (Arai and Vilhelmsson 2004) found that after controlling for other
factors such as education, non-European immigrants faced unemployment risk twice as
high as that faced by natives during the economic crisis of the early 1990s.
Evidence that migrants have been more negatively aff ected by the recession than
natives is beginning to emerge. Th ere have been anecdotal reports of migrants being
moved from permanent contracts to ad hoc piece work in Th ailand (IPPR 2009b), and

50 l TIM GREEN AND L. ALAN WINTERS
there have been big increases in numbers of part-time workers in the United States,
especially in the retail, food, and construction sectors, which account for 30 percent
of immigrant employment (OECD 2009b). As noted above, there are also countries
such as Norway and Spain where unemployment has gone up signifi cantly faster among
migrants (or at least some groups of migrants) than the population as a whole.
At least some of these diff erences may simply be due to migrants being concentrated
in hard-hit sectors such as construction; this seems to be the case in the Norwegian
and Spanish examples mentioned above. Analysis by the OECD suggests that this is not
always the case, however (OECD 2009b). Th ey fi nd that, after allowing for the diff er-
ent sectoral distribution of migrants and natives in the United States, if migrants had
become unemployed at the same rate as natives, then migrant employment would have
fallen by 1.7 percent in the year to November 2008, whereas in fact it fell by 3.6 percent.
Although there may be other reasons for this besides discrimination (such as experi-
ence and language skills), this suggests that, for the United States at least, diff erences
cannot be fully explained by sectoral distribution. Another study from the United States
(Orrenius and Zavodny 2009) suggests that lower education levels among migrants may
also be partly responsible for immigrants in the United States being more sensitive to
the current downturn than natives.
Evidence from OECD unemployment rates points in the same direction. Figure 3.9
reports the changes in the rate of unemployment between the third quarter of 2008
(before any crisis eff ects occurred) and the third quarter of 2009 (the latest available) for
native- and foreign-born workers. With one minor exception (Norway) all the points lie
above the 45 degree line, indicating that the increase for foreign workers exceeds that
for native workers. In three cases the diff erence is very large: Spain (4 percentage points
diff erence, with increases of 5.8 and 9.8 percentage points, respectively, in native- and
foreign-born unemployment), Greece (diff erence is 2.8, 1.8 versus 4.6 points), and Ire-
land (diff erence is 2.6, 5.5 versus 8.1 points).
Tightened Immigration Policies
Given the depth of the downturn, the rising levels of migration to the OECD countries
over the last 30 years, and the preexisting balance of public opinion in favor of tighter
restrictions on immigration (Hatton and Williamson 2009), we would expected many
destination countries to tighten immigration policies.
Th ere is indeed considerable evidence to suggest that this is happening in some coun-
tries. Russia announced in December 2008 that it would reduce work permits for 2009
by half from 4 million to 2 million (Ratha, Mohapatra, and Silwal 2009b). Th e United
Kingdom has tightened its Points-Based System, increasing skill and wage thresholds.
In September 2009 it increased the period for which jobs must be advertised nation-
ally before being opened to non–European Union residents, it raised the minimum
salary for a job to be classed as skilled by 17.5 percent, and it required employees to

3. ECONOMIC CRISES AND MIGRATION: LEARNING FROM THE PAST AND THE PRESENT l 51
have longer tenure in multinational companies before they could be transferred into
the United Kingdom as key workers. Th e U.S. fi scal stimulus package makes it more dif-
fi cult for benefi ciary fi rms to hire high-skilled foreign workers, although this may make
little practical diff erence given how oversubscribed quotas for such visas are. Austra-
lia cut its skilled permanent migrants quota for 2009 by 14 percent against the target
initially announced. Italy announced that it will cut its quota for nonseasonal workers
from 150,000 in 2008 to zero for 2009 and has made it illegal to provide housing to ille-
gal immigrants. Spain cut its quota for nonseasonal contingente workers from 15,000 in
2008 to 900 in 2009 (OECD 2009a).
Policies have not only been tightened in developed countries. Malaysia has canceled
work visas for 55,000 Bangladeshi workers and told employers to lay off foreigners before
native workers; the Malaysian government has been discussing ways to reduce the num-
ber of migrant workers for some time (Martin 2009a). In February 2009 the Republic
of Korea announced that it would stop admitting migrants through its Employment
Permit System. Th ailand, which has an estimated 2 million migrant workers (mostly
in construction, agriculture, and fi sheries), announced in January 2009 that it would
not reregister migrants in 2009, in the hope that they would leave when their permits
expired. In Kazakhstan, the authorities imposed a moratorium on the admission of less-
skilled workers from April 2009 (IOM 2009).
FIGURE 3.9 Change in Unemployment Rates for Native- and Foreign-Born Workers, Selected OECD Countries, Third Quarter 2008 to Third Quarter 2009
0.0
2.0
4.0
6.0
8.0
10.0
0.0 2.0 4.0 6.0 8.0 10.0
Fore
ign
bo
rn %
cha
nge
Natives % change
Source: OECD 2010.

52 l TIM GREEN AND L. ALAN WINTERS
Although these examples are worrying, they are not universal. Other destination
countries such as Canada and some European countries have broadly maintained their
immigration stances, despite some tightening at the margins. Indeed, in January 2009
Japan announced programs to off er retraining and Japanese lessons to unemployed
Nikkeijin (descendants of Japanese who emigrated to Latin America a century ago, who
have since migrated to Japan).
Summary
Broadly speaking, the emerging evidence is in line with what we would expect given
the experience of past crises. We see evidence of some slowing of infl ows to the major
destination countries. Little evidence is at hand of signifi cant returns, except possibly in
a few specifi c cases. Th ere are numerous examples of countries announcing tightened
immigration regimes, although this is not true in all cases, and it remains to be seen
what the real impact will be. In addition the evidence seems to suggest that migrants are
being aff ected more adversely than equivalent natives.
One theme that runs through much of this study is the impact of government immi-
gration policies. Th is was much less of a factor in the nineteenth century but does
appear to have aff ected the impact of twentieth-century crises on migration and may
do so again this time around. Th eir structure and operation can aff ect how much and
how quickly infl ows respond to changing circumstances, and how likely migrants are to
leave. Changes in such policies therefore also aff ect fl ows in the short term, and poten-
tially in the longer term if changes become permanent. How governments act over the
coming months can therefore be expected to have a signifi cant impact on how this
recession aff ects migration and its associated impact on development.
Notes
1. Th e various papers and World Economic Outlooks produced by the IMF off er a good overview.
2. O’Rourke argues that in the late 1840s emigration was partly built on previous emigration
fl ows, although most scholars appear to agree that the very poorest did not manage a high
rate of emigration during the crisis, which suggests that the friends and family eff ect had not
overcome all the frictions by then.
3. We could have continued the fi gure to 1913, often taken as the natural break point for nine-
teenth-century study, but it would have been dominated by a huge upward shift in trend
from 1901 onward.

53
Chapter 4
Remittance Flow, Working Capital Formation, and Economic Growth
GABRIELA MUNDACA
According to ratha and colleagues (2010a), offi cial recorded remittance fl ows
to developing countries reached $307 billion in 2009, down 5.5 percent from $325 bil-
lion in 2008. Th ey estimate, however, that remittance fl ows to developing countries
have increased 6 percent in 2010, and they predict that the years 2011 and 2012 will
see an increase in those fl ows by 6.2 and 8.1 percent, respectively. On this basis, it may
seem that remittances have not been seriously aff ected by the global crisis of 2007–08.
Th is is certainly encouraging. However, in addition to the level of remittance fl ows, it
is crucial to analyze how long-run investment decisions made by remittance recipients
are aff ected by their uncertainty about future remittances. Th is is important because it
is well known that developing countries face limited access to credit markets, and pro-
spective small entrepreneurs are more likely to depend not only on current remittances
but also on expected future remittances.
In this chapter, I present a theoretical model that aims to explain how uncertainty
about future fl ows of remittances can aff ect investment decisions and consequently
economic growth in the recipient’s country. I attempt to show the interlinkages between
remittances, economic growth, and the role that fi nancial intermediaries play in the
allocation of resources across generations and across time. I thus consider both inter-
temporal and cross-sectional risk allocation among recipients of remittances. I also
examine how uncertainty about future remittances can create fi nancial distress, espe-
cially when recipients of remittances need to withdraw prematurely their initially saved
remittances to cope with unexpected adverse income shocks. Th is could become even
more crucial if the fi nancial sector cannot provide greater access to credit markets to

54 l GABRIELA MUNDACA
long-term investors and entrepreneurs to alleviate them from temporary shocks to
their future fl ows of remittances. Such a state of aff airs will necessarily aff ect long-term
capital accumulation and economic growth.
Th is study extends earlier work (Mundaca 2009) that presents a theoretical model
to show how remittances and fi nancial intermediaries can contribute to the growth
process. Financial intermediaries (such as banks) eff ectively channel remittances that
are saved by their recipients into sectors in the economy that are potentially productive.
Th e analysis here focuses on how intermediaries can promote capital investment when
remittances are invested in productive long-run technologies, as well as how uncer-
tainty about future remittances can erode potential productive investment and then
economic growth, and even jeopardize the stability of the fi nancial sector in the coun-
try of recipients of remittances. I believe this approach is novel because such problems
have never been studied within a context of a theoretical model.
From the literature on fi nancial intermediation we know that one main role of fi nan-
cial intermediaries is to provide liquidity insurance to depositors (Diamond and Dyb-
vig 1983) and to transform deposits by making them available for lending to agents
with investment needs. In our setup, deposits will come from both labor income and
remittances. Th is (1) allows risk-averse savers to hold bank deposits rather than liq-
uid and unproductive assets and (2) eliminates (or reduces) certain agents’ need for
self-fi nancing of investments. Without intermediation, each individual must self-insure
against unpredictable liquidity needs, and for this reason he or she will invest (most
likely excessively) in liquid and unproductive assets. Also, when agents self-fi nance
their investment projects, they will always face the risk of having to prematurely liq-
uidate their projects if an adverse liquidity shock occurs, to fulfi ll their liquidity needs.
Th e larger the number of self-fi nanced projects, the more detrimental such premature
liquidation would be to the economy. Th is problem can be avoided with intermediaries.
With intermediation, banks set aside a proportion of the deposits as reserves to meet
possible early withdrawals of deposits and use the rest of the available resources for
investment in productive capital. Th is model contains, however, another and less favor-
able equilibrium in which bank runs can occur because depositors are uncertain not
only about the ability of the intermediary to provide the necessary liquidity in a timely
manner but also about the future fl ow of remittances. Expectations of bad economic
fundamentals in the country of residence of the migrant that make him or her unable
to send remittances can precipitate a bank run because of liquidity constraints that are
not alleviated by remittances. I investigate how such fi nancial crises and distress might
cause a fall in economic growth.
Th e theoretical model proposed here indicates that the poorer the country receiv-
ing remittances, and the larger the credit constraints that the recipient of remittances
faces during his or her life cycle, the more important remittances become for generating
productive working capital and economic growth in this country. Importantly, I also
establish the conditions under which excess remittances relative to working capital of
the remittance recipient can also result in a resource curse in the receiving country. An
4. REMITTANCES FLOW, WORKING CAPITAL FORMATION, AND ECONOMIC GROWTH l 55
important lesson to be stressed is that remittances will spur growth if and only if remit-
tances are invested in productive assets.
Review of the Related Literature
Many theoretical papers emphasize the importance of fi nancial intermediation in an
economy and as a determinant of its growth rate (Bencivenga and Smith 1991; Ben-
civenga, Smith, and Starr 1995; Cameron 1967; Goldsmith 1969; Greenwood and Jova-
novic 1989; Hicks 1969; McKinnon 1973; Shaw 1973).
A large array of studies, both theoretical and empirical, have considered eff ects of remit-
tances on the economy. A large part of the theoretical work has focused on the motives for
remittances in conjunction with migration. Remittances are now well recognized as part
of an informal familiar arrangement that goes well beyond altruism, driven by a variety
of motives that may even vary across individuals, with benefi ts in the realms of mutual
insurance, consumption smoothing, and alleviation of liquidity constraints (Andreoni
1989; Cox, Eser, and Jimenez 1998; Rapoport and Docquier 2000; Feinerman and Seiler
2002; Foster and Rosenzweig 2001; Funkhouser 1995; Lucas and Stark 1985; Stark 1991b).
At the macrolevel, the short-run eff ects of remittances have been analyzed mainly
within the framework of trade-theoretical models by considering a small open econ-
omy that produces traded and nontraded goods (examples are given in Djajić 1986 and
McCormick and Wahba 2000). Th ese studies fi nd that remittances increase the welfare
of the remaining residents and not only those receiving the remittances, because all
the remaining residents will have new trading opportunities and higher buying power,
especially if there is a cost-of-living diff erence between the country that receives remit-
tances and the country that hosts the migrants sending remittances.
Despite the diff erent considerations and the number of studies generated, consensus
is still lacking about the general or typical eff ect of remittances. Moreover, few theoreti-
cal studies analyze how economic downturns in the country of the migrants that send
remittances aff ect economic growth and even cause fi nancial distress in the country of
individuals receiving remittances. We fi nd this very important, especially if the country
is poor and individuals face credit constraints.
How Can Remittances Contribute to Capital Formation and Economic Growth?
Remittances can promote capital investment and raise rates of growth in the presence
of fi nancial intermediaries. Th e analysis here draws heavily on the contributions of the
“endogenous growth” literature of Aghion and others (2005); Bencivenga and Smith
(1991); Bencivenga, Smith, and Starr (1995); Lucas (1988); Prescott and Boyd (1987);
and Romer (1986) and on the intermediation literature of Diamond and Dybvig (1983)
and Mundaca (2009).

56 l GABRIELA MUNDACA
Assume that agents have resources derived from labor income and remittances that
can potentially be deposited in the banking system. We have in this economy interme-
diaries (banks) that accept these deposits and transform them into lending resources
for many agents with investment needs and hold liquid reserves against predictable
withdrawal demand (that is, the law of large numbers operates to make withdrawal
demand fairly predictable). Here, as in Diamond and Dybvig (1983), banks are expected
to be ready to provide the demanded liquidity, unless expectations shift or economic
fundamentals change drastically.
A three-period-lived overlapping-generations model is considered where all agents
(including banks) have access to a “liquid” investment that is not directly productive and
an “illiquid” investment that yields physical productive capital. Production takes place
with the use of working capital owned by the old generation and labor provided by the
young generation.
We make the following assumptions:
• Th e economy consists of a sequence of three-period-lived, overlapping generations.
Each generation contains a continuum of agents.
• Time is indexed by t = 0, 1, 2, …
• At t = 0 there is an initial old generation, endowed with an initial per fi rm working
capital of k0
, and an initial “middle-aged” generation, which is endowed with per
fi rm consumption-good units at t = 1. At each t, there is an equal number of young
and old agents.
• All young generations are identical. Each young agent is endowed with a single unit of
labor supplied inelastically. Th ere are no labor endowments at ages 2 and 3.
• Two goods are found in the economy: a single consumption good and a working capital
good. Th e consumption good is produced using labor and working capital. Th is work-
ing capital comprehends both physical and human capital, and it is owned by the sub-
set of old agents who become entrepreneurs. Th ere are no rental markets for capital.
• When agents are young they receive a certain amount of remittances, remt, that
need to be invested in their totality in the long-term productive assets. When indi-
viduals are middle aged and they decide to become entrepreneurs, they will receive
additional remittances, remt+1
. Th ese additional remittances can be deposited in
the bank to obtain after one year a rate of return equal to r>1, but only if individu-
als invest in their own human capital at certain costs. In view of these possibilities,
middle-aged individuals who have decided to be entrepreneurs could either invest
in human capital or use these remittances to alleviate liquidity needs that they might
have before or after they decide to be entrepreneurs.1 By acquiring additional human
capital, entrepreneurs will be able to increase their working capital. Th e costs of
investing in human capital need to be paid only when individuals become entrepre-
neurs (they become old). Th e return of investing in human capital is assumed to be

4. REMITTANCES FLOW, WORKING CAPITAL FORMATION, AND ECONOMIC GROWTH l 57
ρ>1. Consequently, entrepreneurs will fi nd it worthwhile to acquire human capital if
1<r≤ ρ. Such a condition means only that the bank should provide the entrepreneurs
with enough resources to pay back their investment costs in human capital by the
time they are entrepreneurs. If the remittances are used to alleviate liquidity needs
instead of investing in human capital, then ρ = r = 1.
• Allocating one unit of the consumption good in the “liquid investment” at t gives one
unit of the consumption good at t+1 (this technology can be thought of as a storage
technology). On the other side, allocating one unit of the consumption good in the
“illiquid and long-run investment” (this technology can be thought of as a capital
investment) at t gives a return of R units of the physical capital good at t+2. If this
physical capital investment is liquidated at t+1, its “scrap value” is zero units of the
consumption good.
• Because remittances are allocated only in the “illiquid” investment, if young agents
decide to withdraw their deposits prematurely when facing liquidity needs at t+1,
they can withdraw only the labor income initially saved and its corresponding returns.
Th e purpose of such conditionality is to avoid moral hazard problems. In such a case
they will neither own capital nor become entrepreneurs at age 3 (when they are old).
As in Mundaca (2009), if remittances are allowed to be invested in the liquid asset to
meet early withdrawals, their eff ect on growth will be much more limited.
• kt denotes the working capital held by an individual entrepreneur at t and
_kt the
“average” working capital per entrepreneur at t. An entrepreneur who employs Lt
units of labor at t produces the consumption good according to the following pro-
duction function:
yt = ktdkt
qLt1-q , (4.1)
where θ (0,1) and δ = 1−θ, where δ is just notational diff erence to emphasize the
external eff ect of _kt. We assume that capital depreciates completely in one period.
• Defi ning ci as age i consumption, the utility function of all young agents will be
u(c1 ,c2 ,c3 ;φ) = −(c2 +ϕc3 )
− γ
γ, (4.2)
where γ > −1 and φ is an individual-specifi c random variable that is realized at the
beginning of age 2 and determines a saver’s liquidity needs according to the following
probability distribution:
ϕ =0 with probability 1− π1 with probability π⎧⎨⎩
(4.3)

58 l GABRIELA MUNDACA
Equations (4.2) and (4.3) indicate that young agents will save all their young period
incomes (wages and remittances) because they do not care to consume when they are
young, at age 1. Only a fraction π of the individuals will care about age-3 consump-
tion (φ = 1) and will become entrepreneurs also at age 3. Th is is possible because by
not withdrawing prematurely they will be able to receive, at age 3, the returns on
their investment capital funded by both their labor incomes and remittances.
Entrepreneurs’ Decisions
Assuming the production function (1) and taking as given the real wage rate, the demand
for labor that maximizes the representative entrepreneur’s profi ts will be
Lt = kt
(1− θ)ktδ
wt
⎡⎣⎢
⎤⎦⎥
1/θ
. (4.4)
If we note that the condition for labor market equilibrium is one in which Lt = 1/π,
after averaging equation (4.4) over fi rms and equating the result to 1/π, we fi nd that the
equilibrium real wage at t is
wt = kt (1− θ)πθ . (4.5)
Given that the marginal value of the working capital is θ _ktk θ−1L 1−θ, the level of profi ts
Φ per entrepreneur will be
Φt = θktδkt
θLt1−θ . (4.6)
By using equations (4.4), (4.5), and (4.6), we can fi nd the reduced form for profi ts per
entrepreneur at t:
Φt = θψkt , (4.7)
Th e Financial Intermediaries’ Decisions
Intermediaries receive deposits from young savers, and although all remittances
received at t = 0 are invested in the illiquid asset, for each unit of deposit coming from
labor income, banks invest a proportion st [0,1] units of it in the liquid investment and
a proportion nt [0,1] units of it in the illiquid investment (capital investment). Th us,
each saved unit of labor income is allocated as follows:
st + n
t = 1. (4.8)

4. REMITTANCES FLOW, WORKING CAPITAL FORMATION, AND ECONOMIC GROWTH l 59
If individuals withdraw their deposits made from labor income at t+1, they receive
r1t
units of the consumption good for each unit deposited in the intermediary at t.
Withdrawing the deposits made from labor income and remittances after two periods
will return r2t
units of the capital good for each unit deposited again at t. Th e following
constraints should then be satisfi ed:
(1−π)r1t
wt = s
t w
t , (4.9)
π r2t
(wt + rem
t) = R(n
tw
t + rem
t). (4.10)
Constraint (4.9) says that the amount of resources that the intermediary invests in
the liquid assets, stw
t , should be enough to satisfy the total demand for liquidity from
middle-aged individuals. Th us, middle-aged individuals can withdraw their savings
made at their young age to satisfy liquidity needs. Such demand for liquidity should be
equal to the pledged returns on the saved labor income (1−π) r1t
wt, and it is measured
in terms of units of consumption goods. Constraint (4.10) indicates that the returns that
the bank will obtain at t+2 from its investment in the illiquid asset that are equal to
R(ntw
t + rem
t) should be enough to satisfy the entrepreneurs’ returns on their deposits
made at t that were pledged by the bank. Th e latter returns equal πr2t
(wt
+ remt) and
are measured in terms of capital goods.
Th e problem of the representative intermediary is to maximize the expected util-
ity of the representative young depositor at time t, while anticipating that these young
depositors will save their labor income, wt , plus remittances, rem
t , and that the latter
will be allocated only in the illiquid investment. Th e additional remittances received
by middle-aged prospective entrepreneurs are also expected to be deposited. I do not
model here the senders of the remittances, but I simply assume that they will get back
from the banks their remittances plus returns in the event that the corresponding
receiver of such remittances at home does not become an entrepreneur.
Taking into account the law of large numbers, the representative bank will maximize
the following expected utility of the representative depositor, evaluated at t:
EU = −1− π
γ⎛⎝⎜
⎞⎠⎟ r1twt[ ]− γ − π
γ⎛⎝⎜
⎞⎠⎟ θψ(r2 t {wt + remt } + r {remt+1 })[ ]− γ . (4.11)
Th is expression follows from the fact that at t, all young agents deposit their labor
income and remittances, remt. At t+1, a fraction 1−π of these agents are expected to
experience liquidity needs and withdraw their deposits prematurely, in which case they
will not consume at age 3 so that φ = 0. Th at would imply that each of these early
consumers will not be able to make additional deposits because they will not be quali-
fi ed to receive remittances at t+1, remt+1
(at age 2). A fraction π are not expected to
withdraw early, implying that they will consume when they become age 3 so that φ = 1.
Each of these late consumers will receive r2t
units of the physical capital good for every

60 l GABRIELA MUNDACA
unit deposited when they were young (age 1), which allows them to become entre-
preneurs at age 3 and realize profi ts equal to θψkt+2
, where kt+2
= r2t
(wt + rem
t) +
r(remt+1
). Th ere, r > 1 is again the return to the additional deposits made out of remit-
tances received in the middle age. As mentioned, these remittances received at t+1 can
be used to alleviate immediate liquidity needs that individuals may have, in which case
r = 1. Notice, then, that remittances received in the interim can be very useful because
they will allow entrepreneurs to continue with their long-term projects even when there
are unexpected liquidity needs.
Th e bank maximizes equation (4.11) with respect to nt at t while taking into account
the constraints (3.8), (3 9), and (3.10), and that r ≤ ρ; that is:
Max{EU } = Max −1− π
γ⎛⎝⎜
⎞⎠⎟
wt (1− nt )1− π
⎛⎝
⎞⎠
− γ⎧⎨⎩
−π
γ⎛⎝⎜
⎞⎠⎟ θψ
Rπ
⎛⎝
⎞⎠(ntwt + remt )+ ρremt+1{ }⎛
⎝⎞⎠
− γ ⎫⎬⎭.
(4.12)
Th e solution to equation (4.12) is
nt =wt −
(1− π)π
Γ1Γ 2γremt − (1− π)Γ1Γ 2ρremt+1
wt 1+(1− π)
πΓ1Γ 2
γ( ) , (4.13)
where
Γ1 ≡1θψ
⎛⎝⎜
⎞⎠⎟
γ /1+γ
(4.14)
and
Γ 2 =1R
⎛⎝
⎞⎠
1
1+γ
.
(4.15)
Taking into account equation (4.5), we rewrite equation (4.13) to defi ne what the
optimal level of long-run and illiquid investment that should be made by the bank
should be:
nt =kt (1− θ)π
θ −(1− π)
πΓ1Γ 2
γremt − (1− π)Γ1Γ 2ρremt+1
kt (1− θ)πθ 1+
(1− π)π
Γ1Γ 2γ( ) . (4.16)

4. REMITTANCES FLOW, WORKING CAPITAL FORMATION, AND ECONOMIC GROWTH l 61
Equation (4.16) indicates that larger amount remittances, received at both the young
and middle ages (at t and t+1), should not necessarily lead to more investment in the
long-run and illiquid assets, unless the economy is able to accumulate relatively more
of the “average” working capital per entrepreneur. Note also that if the probability of
becoming entrepreneurs is signifi cantly low—for example, (1−π) tends to zero—banks’
decisions to invest in long-run assets will become independent of the level of remit-
tances. Th is is reasonable because if fewer individuals become entrepreneurs, banks
are not able to count on the remittances to make long-run investments because such
remittances will be sent back to the migrant senders of remittances. On the other hand,
an increase in R (Г2
is a function of R) would give more incentives to the banks to invest
in the illiquid assets. Finally, investment in the risky assets will be larger the larger the
remittances received are at t and t+1.
It is now necessary and suitable to establish the conditions that give agents the incen-
tives to consume at age 3 or at t+2 (φ = 1) and become entrepreneurs:
wt (1t − nt )1− π
≤ θψRπ
⎛⎝
⎞⎠(ntwt + remt )+ ρremt+1
⎡⎣⎢
⎤⎦⎥
(4.17)
Agents who withdraw at t+1 will consume wt(1−n
t)/(1−π), while agents who become
entrepreneurs will consume θψ{[R/π][(ntw
t + rem
t)] + ρrem
t+1}. Th us, agents will have
more incentives to become entrepreneurs if they receive more remittances not only at
their young age (at age 1) that allow them to make long-run investment, but also in their
middle age (age 2) that permit them to invest in human capital or alleviate unexpected
liquidity needs. If such needs are not satisfi ed, the probabilities of experiencing a dis-
tress or crisis might increase because banks may have diffi culties to liquidate at the very
short run the long-run and illiquid assets.
Note that it is crucial that the return on the illiquid investment, R, is suffi ciently
large to avoid a bank run or fi nancial crisis. If intermediaries invest optimally in the
risky or illiquid asset (high nt), and the returns to such investment are high (high R),
the possibilities for fi nancial crisis will decrease. Th is result is a standard result in the
literature of fi nancial crisis (Allen and Gale 1998; Diamond and Dybvig 1983). Th e
contribution here is the role that remittances may play in the stability of the fi nancial
sector in two diff erent ways. First, remittances may avoid bank runs as remittances
may alleviate entrepreneurs’ unexpected liquidity needs. Second, intermediaries
should never increase their investments in long-run and risky assets only in response
to increases in remittances to avoid the formation of bubbles. A larger investment
in these assets should respond to not only increases in present and future expected
remittances but also how the economy absorbs remittances and translates them into
productive working capital.
In summary, equation (4.16) indicates that the allocation of savings into illiquid
assets should increase with the amount of remittances received when individuals are
young if the average working capital per entrepreneur increases proportionally more

62 l GABRIELA MUNDACA
than remittances. Otherwise the economy might experience formation of asset bubbles
and excessive consumption of fi nal goods.
Equilibrium Conditions
In equilibrium,
kt+2 = kt+2 =Rπ
⎛⎝
⎞⎠(ntwt + remt )+ ρremt+1
⎡⎣⎢
⎤⎦⎥. (4.18)
Equation (4.18) indicates that working capital at t+2 depends on the returns (R) on the
long-run investments made using wages (wt) and remittances received at time t (rem
t),
the returns on the remittances received at time t+1 (remt+1
), whether they are invested
in human capital (ρ > 1) or simply to alleviate liquidity needs (ρ = 1), and the probability
that individuals will become late consumers. Th is should be so because capital forma-
tion takes two periods.
Inserting equations (4.5) and (4.16) into equation (4.18) and dividing it b _kt yields
kt+2
kt
=R(1− θ)πθ
π 1+(1− π)
πΓ1Γ 2
γ( ) +(1− π)Γ1Γ 2
γ (R − 1)+ R
π 1+(1− π)
πΓ1Γ 2
γ( ) ×remt
kt
+Γ1Γ 2ρ(1− π)
Γ 2γ −1
π− 1⎛
⎝⎜⎞⎠⎟+ ρ
1+(1− π)
πΓ1Γ 2
γ( ) ×remt+1
kt
(4.19)
or
kt+2
kt
= α + β1
remt
kt
⎡⎣⎢
⎤⎦⎥+ β2
remt+1
kt
⎡⎣⎢
⎤⎦⎥, (3.20)
where
α =R(1− θ)πθ
π 1+(1− π)
πΓ1Γ 2
γ( ) ,
β1 =(1− π)Γ1Γ 2
γ (R − 1)+ R
π 1+(1− π)
πΓ1Γ 2
γ( ) ,

4. REMITTANCES FLOW, WORKING CAPITAL FORMATION, AND ECONOMIC GROWTH l 63
and
β2 =Γ1Γ 2ρ(1− π)
Γ 2γ −1
π− 1⎛
⎝⎜⎞⎠⎟+ ρ
1+(1− π)
πΓ1Γ 2
γ( ) .
Now, under our assumed production function, output per fi rm at time t at equilib-
rium equals to _kt
δkt
θψ or _ktψ. Because the number of fi rms is constant over time, equa-
tion (4.20) also gives the equilibrium rate of growth of output. We obtain the following
results. First, equilibrium growth converges to α as _kt ∞, as long as rem
t and rem
t+2 do not increase equally much. Moreover, α increases if the return on the long-run
investment, R, increases, in which case one should expect a greater fraction of savings to
be invested in the accumulation of productive physical capital, and fi nally a higher level
of average working capital and higher growth. Second, for a suffi ciently low level of _kt,
this economy will experience growth if remittances, both remt and rem
t+2, are relative
larger than the average “per entrepreneur” capital stock, _kt. In other words, the poorer
the economy (such as very low _kt), the larger will be the eff ect of remittances on growth.
Conclusions
Th e purpose of this study has been to determine the mechanism under which remit-
tances can spur growth. It demonstrates that economic growth is possible if remittances
are not used for immediate consumption of fi nal goods, but rather invested in the for-
mation of working capital, both physical capital and human capital. It also shows how
important fi nancial markets are in generating economic growth.
An overlapping generation model in which young agents derive resources from labor
income was considered. Th ese young agents also receive a certain amount of remit-
tances, but they are required to invest them in their totality in long-term productive
assets in order to experience economic growth. Th e results then indicate that if remit-
tances are not invested in these long-term assets, they will not generate growth because
they will go directly to consumption of fi nal goods. In our setup, all agents are equal ex
ante, and when they are young they can deposit their labor income and remittances in
the banking system. Financial intermediaries will then play a crucial role to stimulate
economic growth by accepting these deposits and transform them to make them avail-
able for lending to a large number of agents with investment needs, and they will hold
liquid reserves only from wages against predictable withdrawal demand.
When individuals are in their middle age and they decide to become entrepreneurs
(and not early consumers), they will receive additional remittances that they can use
to invest in human capital, which will add to the formation of working capital. Such an
opportunity will allow entrepreneurs (who reach their old age) to obtain higher profi ts

64 l GABRIELA MUNDACA
and consequently higher consumption. Alternatively, such remittances can be used to
alleviate liquidity needs of only those who become entrepreneurs.
Th e second important result is that agents will have more incentives to become
entrepreneurs if they receive more remittances both at their young age (at age 1) that
allow them to make long-run investments as well as at their middle age (age 2) that
permit them to invest in human capital and/or alleviate unexpected liquidity needs. If
such needs are not satisfi ed, the probabilities of experiencing a distress or crisis might
increase because banks may need to liquidate certain assets to satisfy these liquidity
needs. Th en it is shown that remittances can decrease the probability of having to liq-
uidate prematurely long-term productive investments or even bank runs in the country
of the recipient of remittances during a state of the world in which individuals have
unexpected liquidity needs. Th erefore not just the return on the illiquid investment
alone matters to avoid a bank run or fi nancial crisis, as stated in the standard literature.
I illustrate here the role that remittances may play in the stability of the fi nancial sector
in the recipient country.
Th e fi nal result I can infer is that the intermediaries’ decisions to invest in the long
run with illiquid and risky assets should respond to not only increases in present and
future expected remittances but also how the economy absorbs remittances and trans-
lates them into productive working capital capacity. Th is can be used as a guideline by
the fi nancial sector for why they should balance their investment in the long run and
illiquid assets with the capacity of the economy to grow in real terms. Th is is essential
to avoid fi nancial distress and the creation of bubbles.
Note
1. remt+1
can then be placed in a savings fund for education, which renders _rt.

PART II


67
Chapter 5
The Financial Crisis in the Gulf andIts Impact on South Asian Migration and Remittances
S. IRUDAYA RAJAN AND D. NARAYANA
The effect of the crisis has been slow to manifest in the six Gulf Cooperation
Council (GCC) countries (Bahrain, Kuwait, Oman, Qatar, Saudi Arabia, and the
United Arab Emirates). Th eir basic strengths—a public-funded banking sector and
huge trade surplus due to exports of oil, the price of which saw an unprecedented
increase in a span of six months in 2008—shielded the GCC economies from adverse
impacts during the initial days of the crisis. Th is, coupled with signifi cant inward
foreign direct investments to all GCC countries except Kuwait, also had a benefi cial
impact (ESCWA 2009).
Th e GCC economies, however, have begun to feel the impact of the global crisis since
the last quarter of 2008. Th e most signifi cant indicator was the slowdown in the gross
domestic product (GDP) growth rate in 2008 and the negative growth rate in 2009 in
some of these economies. In the fi nancial sector, the stock markets in all GCC countries
recorded a decline, owing to the withdrawal of foreign institutional investors. A num-
ber of private-funded domestic and international projects in the Gulf region reportedly
were canceled or abandoned, leading to a large number of layoff s or retrenchment of
the workforce. Countries such as Saudi Arabia with only 25 percent foreign workers in
its workforce compared with much higher shares in the other GCC economies might
Th is study is funded by the Asian Development Bank, Ministry of Overseas Indian Aff airs, government of India, and the
Department of Non-Resident Keralite Aff airs, government of Kerala.

68 l S. IRUDAYA RAJAN AND D. NARAYANA
be much less aff ected than others (Zachariah and Rajan 2009). Th e slowdown in the
growth rates of GCC economies has particular signifi cance for the South Asian expatri-
ates who are the main migrant labor in the GCC countries. Th is would, it was expected,
aff ect the fl ow of migration and cause unexpected large-scale return emigration and
falling remittances (Kapiszewski 2006).
In this context, we attempt to tackle the following questions: How has the crisis
aff ected the demand for South Asian migrant workers in the Gulf countries? What strat-
egies did the emigrants adopt to cope with the situation at their place of work (countries
of destination) and what is the likely impact of the crisis on the home country in terms
of decline in remittances, if any? Did countries in South Asia see large-scale return emi-
gration? Did they fi nd a decline in the outfl ow of emigrant labor to Gulf countries and
inward remittances from them?
Data and Methods
Following an assessment of the trends in expatriate workers and employment struc-
ture in the GCC countries based on published data, mapping the trends and pat-
terns of international migration, preferred countries of destination, and trends in
remittances over a long period is attempted in this chapter. In addition to the macro-
assessment of the situation, the study is based on two surveys: (a) return emigrants
in the countries of origin who lost their jobs in the countries of destination due to the
fi nancial crisis and (b) return migrants who came back as per the terms of contract
migration.
Return Migrant Survey
Th is survey was conducted in 2009, among emigrants who lost their jobs and were
forced to return home because of the fi nancial crisis in the Gulf.1 It was also aimed
at examining their coping mechanisms after their return to their home country. Th e
survey included 50 return emigrants in each of four countries constituting South
Asia: Bangladesh, Nepal, Pakistan, and Sri Lanka. In India, the survey was canvassed
among 250 return emigrants in fi ve states, selecting 50 each in Andhra Pradesh, Ker-
ala, Maharashtra, Punjab, and Tamil Nadu. Th us the total number of return emigrants
surveyed was 450. However, we confess that it was diffi cult to locate emigrants who
lost their jobs in the countries of destination and returned to the countries of origin.
Th e return emigrant survey collected information on household details, the profi le
of return emigrants, household economic assets, employment, remittances and their
utilization, household expenditure patterns, reasons for return, and adaptation and
coping mechanisms.

5. THE FINANCIAL CRISIS IN THE GULF AND ITS IMPACT ON SOUTH ASIA l 69
Second Return Migrant Survey, 2009
Return migration from the Gulf is an expected outcome of contract migration. Migrants
from South Asia go on contract work to the destination countries, and once the contract
ends, they, in the normal course of events, return to the countries of their origin. As of
now, we have no estimate of return emigration numbers from the Gulf to South Asia.
However, the Centre for Development Studies has completed four large-scale migra-
tion surveys (1998, 2003, 2007, and 2008) over the last decade. One of the research
objectives of this project is to assess the fl ow of forced return emigration, that is, return
emigrants before the expiration of their work contract from the Gulf region to South
Asia. To assess both regular return migrants and the crisis-instigated return emigrants
from the Gulf, we revisited emigrant households from the 15,000 contacted for the 2008
Kerala migration survey. We estimated the extent of crisis-instigated return emigrants
to Kerala after the revisits. In a later section we apply the same methodology and project
the fi gures to estimate the number of return emigrants from the Gulf to South Asia. In
addition, the return migration resurvey of 2009 also estimated the number of emigrants
who lost their jobs in the Gulf but had chosen to remain there without returning to their
countries of origin. Th is is new information (“lost job but have not returned”), which
will also be generated for South Asia.
Financial Crisis and Growth in the Gulf
Th e global crisis originating in the United States, and spreading to Europe and Japan,
has aff ected the Middle East through a large fall in the price of oil, reversal of capi-
tal infl ows, depression of property and equity markets, and losses in sovereign wealth
funds.2 Th e eff ect of the crisis varied across the countries depending on country char-
acteristics, such as a high share of oil exports in total exports, large numbers of reex-
ports, and a sizeable share of services in GDP, especially transportation, trade, hotels,
and restaurants. In the region as a whole, growth declined from 5.1 percent in 2008 to
2.4 percent in 2009. Among the oil-producing countries, the sharpest slowdown was
in the United Arab Emirates, where the exit of external funds contributed to a large
contraction in liquidity, a sizeable fall in property and equity prices, and substantial
pressure on the banking system. At the other end of the spectrum is Qatar, which grew
by about 9 percent in 2009 (table 5.1).
Interestingly, the comparison for the countries shown in table 5.1 of the growth fore-
cast for 2009 and the realized growth shows important patterns. For the developed
countries, the contraction forecast and realized hardly shows much of a diff erence,
but the recovery is expected to be quicker. For the South Asian countries as a whole
the realized growth is much better than the forecasts, and the recovery is also rapid.
Th e GCC countries show a mixed pattern: Both Kuwait and the United Arab Emirates
witnessed contractions greater than the forecasts, whereas the other countries except

70 l S. IRUDAYA RAJAN AND D. NARAYANA
TABLE 5.1 Real GDP Growth Rates in Selected Countries
annual percentage change
Country 2001 2002 2003 2004 2005 2006 2007 2008 2009 2010 2011
Country of destination
Bahrain 4.62 5.19 7.25 5.64 7.85 6.65 8.07 (8.38)
6.12 (6.31)
2.64 (3.11)
3.47 (3.96)
3.94 (4.50)
Kuwait 0.22 3.01 17.33 10.24 10.62 5.14 2.51 (4.46)
6.33 (5.53)
−1.14 (−4.82)
2.39 (2.33)
4.34 (4.44)
Oman 7.51 2.57 2.01 5.33 6.02 6.79 6.38 (6.81)
6.18 (12.84)
3.02 (3.59)
3.80 (4.72)
6.00 (4.68)
Qatar 6.32 3.20 6.32 17.72 9.24 15.03 15.35 (26.76)
16.40 (25.42)
17.99 (8.65)
16.37 (15.96)
8.90 (18.58)
Saudi Arabia
0.55 0.13 7.66 5.27 5.55 3.03 3.52 (2.02)
4.63 (4.23)
−0.91 (0.60)
2.90 (3.42)
4.40 (4.51)
United Arab Emirates
1.70 2.65 11.89 9.69 8.19 9.39 6.34 (6.06)
7.41 (5.14)
−0.60 (−2.47)
1.55 (2.43)
3.29 (3.18)
Country of origin
Bangla-desh
4.83 4.85 5.78 6.11 6.30 6.53 6.32 (6.31)
5.59 (5.96)
5.00 (5.64)
5.38 (5.78)
6.01 (6.26)
India 3.89 4.56 6.85 7.90 9.21 9.82 9.30 (9.89)
7.29 (6.40)
4.52 (5.68)
5.61 (9.67)
6.89 (8.37)
Nepal 5.63 0.12 3.95 4.68 3.12 3.72 3.19 (3.41)
4.70 (6.10)
3.60 (4.86)
3.25 (2.98)
4.81 (4.01)
Pakistan 1.98 3.22 4.85 7.37 7.67 6.18 6.02 (5.64)
5.95 (1.64)
2.50 (3.37)
3.50 (4.79)
4.50 (2.75)
Sri Lanka −1.55 3.96 5.94 5.45 6.24 7.67 6.80 (6.80)
5.95 (5.95)
2.20 (3.54)
3.59 (7.00)
4.98 (7.00)
More developed countries
Japan 0.18 0.26 1.41 2.74 1.93 2.04 2.39 (2.36)
−0.64 (−1.20)
−6.19 (−5.22)
0.52 (2.82)
2.17 (1.50)
United Kingdom
2.46 2.10 2.82 2.76 2.06 2.84 3.02 (2.69)
0.71 (−0.07)
−4.09 (−4.89)
−0.40 (1.70)
2.12 (2.02)
United States
0.75 1.60 2.51 3.64 2.94 2.78 2.03 (1.95)
1.11 (0.00)
−2.75 (−2.63)
−0.05 (2.64)
3.53 (2.31)
Sources: International Monetary Fund, World Economic Outlook (WEO) Database, April 2009c; International Monetary Fund, World Economic Outlook Database, October 2010.
Note: Figures in parentheses are from WEO 2010. Data for 2009–11 and 2010–11 are forecasts in the WEO 2009 and WEO 2010, respectively.
Qatar reported growth rates higher than the forecasts. Th e growth recovery in 2010 and
2011 is on the expected lines (table 5.1).

5. THE FINANCIAL CRISIS IN THE GULF AND ITS IMPACT ON SOUTH ASIA l 71
Employment Structure in the GCC Countries
In the GCC countries, over 50 percent of the workforce is employed in manufacturing,
trade, and construction. Kuwait and Saudi Arabia are the exceptions, where the share of
public administration and defense is rather high (table 5.2). Th e share of construction
in total employment increased rapidly during 2001–08 in some of the GCC countries.
For instance, in the United Arab Emirates the share of construction-sector employment
increased by 5 percent during the period. In Saudi Arabia, the increase in employment
in the construction sector during the period was on the order of 300,000.
Construction is one of the major sectors attracting expatriate labor, and so it is
important to analyze the eff ect of the crisis on that sector. Project fi nance and utilities
TABLE 5.2 Share of Employment across Economic Activities in GCC Countries, 2007
percent
Activity Bahrain Oman Kuwait QatarSaudi Arabia
United Arab
Emirates
Agriculture, hunting, and forestry 0.47 9.09 2.60 1.92 4.69 5.00
Fishing 0.01 0.44 0.08 0.43 a a
Mining and quarrying 0.49 1.96 1.90 5.27 1.32 1.30
Manufacturing 17.54 10.77 4.43 8.69 7.28 13.00
Electricity, gas, and water supply 0.13 0.33 0.01 0.66 0.96 1.20
Construction 29.86 34.68 14.23 37.14 10.22 20.60
Wholesale, retail trade, and car repairs 24.62 16.18 14.03 12.28 16.10 20.00
Hotels and restaurants 6.55 5.97 2.89 1.96 3.20 4.20
Transport, storage, and communication 4.20 1.30 3.85 4.33 4.42 6.20
Financial intermediaries 3.46 0.29 1.21 1.09 1.08 1.40
Real estate and renting services 7.54 1.77 5.59 3.43 3.22 3.30
Public administration and defense 0.01 — 14.75 6.35 18.03 10.80
Education 1.24 0.76 5.23 3.16 11.96 b
Health and social work 0.24 1.91 2.40 2.55 4.33 b
Community and personal services 2.11 1.08 4.18 1.54 2.26 4.50
Domestic services 0.06 9.96 21.86 8.79 10.79 8.40
Extraterritorial organizations and bodies 0.21 2.59 0.11 0.21 0.13 —
Not classifi ed by economic activity 0.30 0.90 0.66 0.18 0.01 0.01
Total 100.00 100.00 100.00 100.00 100.00 100.00
Sources: ILO 2008, Ministry of National Economy Oman. For Saudi Arabia and the United Arab Emirates the fi gures are taken from the country reports.
Note: For Bahrain and the United Arab Emirates fi gures show the paid employment by economic activity. For Oman fi gures show expatriate workers in the private sector. Kuwait fi gures are for 2005. — = not available.
a. Fishing is included in agriculture, hunting, and forestry.
b. Education and health are included in public administration and defense.

72 l S. IRUDAYA RAJAN AND D. NARAYANA
have taken a severe beating along with fi nancial institutions in the current crisis. A sur-
vey of projects (worth at least $10 million) in mid-2009 reported 10–30 percent cancel-
lations or orders put on hold in the GCC countries (table 5.3). Dubai, which has about
60 percent of all construction projects in the GCC, has taken the largest hit, which in
turn has aff ected the GCC as a whole. Interestingly, the crisis has aff ected all subsec-
tors—from commercial projects to residential properties.
TABLE 5.3 Projects Affected by the Crisis in the GCC
Number of projects under construction
Number of projects canceled/
on hold
Total project value
($, billions)a
% of projects canceled
Bahrain 148 54 36 27
Kuwait 90 18 114 17
Oman 95 8 38 8
Qatar 124 7 42 —
Saudi Arabia 442 106 387 19
United Arab Emirates 1,372 566 900 29
Source: Proleads, http://www.projectsandleads.com.
Note: — = not available.
a. All projects including those canceled/on hold.
Although new project starts have declined in the United Arab Emirates, high-level
activity is continuing in ongoing projects that would be “the envy of many” elsewhere
in the world. Evidence indicates increased construction activity in Abu Dhabi, Ajman,
and Sharjah. Th us, although new starts have declined and those about to be started have
been put on hold, much activity is continuing in ongoing projects.
Gulf Crisis and South Asian Labor: The Links
Th e link between economic growth and labor fl ow is through the growth in manufac-
turing, trade, and construction. Construction, in particular, attracts large numbers of
expatriate laborers from South Asia. Any of the factors adversely aff ecting construc-
tion would aff ect the labor. Th e quick rebound of oil prices by mid-2009 and the not
too unfavorable current account and budget balances have made the governments of
the GCC countries bolder and induced them to continue major infrastructure invest-
ments. Th e increase in government expenditures (as a percentage of GDP) was close
to 10 points in most of the countries (table 5.4), except Bahrain and Qatar. Fiscal
policy has played a crucial role in cushioning the impact of the global crisis in the
GCC countries.

5. THE FINANCIAL CRISIS IN THE GULF AND ITS IMPACT ON SOUTH ASIA l 73
Th e interventions in the banking sectors have also been decisive. A further boost has
been the, albeit lower but healthy, GDP growth in the whole of South Asia in 2009 and
the forecast of higher growth rates in 2010. South Asia and China have emerged as the
major trading partners of GCC economies, and the trade outlook does not look very
dispiriting.
However, the continuing adverse factors have been the depressed real estate and
equity prices in the GCC countries, in particular in Dubai. Th e recovery will remain
fragile as long as private investment does not stimulate growth. Foreign direct invest-
ment, which had played a major role in the rapid growth of the precrisis days, fell dras-
tically in 2009 in almost all GCC countries, except Oman, Qatar, and Saudi Arabia.
Th e fall in the United Arab Emirates is from $13.7 billion in 2008 to $4 billion in 2009
(UNCTAD 2010). It is unlikely that the situation will improve until the Dubai World
crisis is resolved.3
Impact of the Crisis on South Asian Migrant Workers
Th is section is devoted to an assessment of the impact of the crisis: on the South Asian
migrant workers in terms of return emigration, fl ows of labor emigration from Asia to
the Gulf, and inward remittances to South Asia. Th e assessment is based on the sum-
mary results of the emigrant household surveys and a survey of return emigrants car-
ried out to understand the coping mechanisms of individuals and families in times of
crisis.
Return Migration to South Asia from the Gulf, 2009
All agencies working on migration and remittances in the South Asian countries and
the Gulf region predicted an exodus of return emigrants from the Gulf to their countries
of origin following the crisis. Th e Centre for Development Studies, Kerala, which has
TABLE 5.4 Government Expenditure in the GCC Countries, 2006–11
percentage of GDP
Country 2006 2007 2008 2009 2010 2011
Bahrain 28.48 28.70 28.00 31.42 30.83 29.53
Kuwait 31.83 29.94 40.15 47.36 43.22 44.28
Oman 34.44 35.33 29.42 38.73 37.38 37.02
Qatar 26.42 25.37 24.52 26.66 23.22 22.47
Saudi Arabia 31.96 34.36 30.81 44.54 42.80 40.75
United Arab Emirates 18.39 18.98 21.22 32.11 28.34 23.07
Source: World Economic Outlook Database, October 2010.

74 l S. IRUDAYA RAJAN AND D. NARAYANA
undertaken four large-scale migration surveys in Kerala over the last 10 years to estimate
the number of emigrants, return emigrants, and remittances, revisited the households
of the 2008 survey in 2009 to arrive at reliable estimates of return emigrants.4 All those
in the original sample who had returned were asked to cite the reasons for returning
to Kerala. Th e questionnaire provided 10 possible reasons for return, among which the
following three could be attributed to the recession: job loss and return due to fi nancial
crisis, expiration of contract (renewal of contract did not take place as expected because
of the recession), and compulsory expatriation. Th e estimates of return migrants due to
the crisis are provided in table 5.5.
TABLE 5.5 Estimated Number of Migrants Returning to Kerala Due to Crisis in 2009
Migrants SamplePopulation of
Kerala
Total emigrants in 2008 based on 2008 Kerala Migration Survey 3,953 2,193,412
Return emigrants among emigrants of 2008 in Return Migration Survey in 2009
304 168,681
Return emigrants to Kerala due to fi nancial crisis and recession 110 61,036
Source: Zachariah and Rajan 2009.
If we deduce that out of the total of 2.19 million emigrants from Kerala, about 61,036
migrants returned because of the fi nancial crisis, then what could be the number of
return emigrants from the Gulf to South Asia? According to the database available from
various sources (both formal and informal), we arrived at a fi gure of 9.5 million South
Asian emigrants in the Gulf, and the projected return emigrants from the Gulf region to
South Asia at about 263,660.5 Estimates of return emigrants for each country or region
are provided in table 5.6.
TABLE 5.6 Estimates of Emigrants Returning to South Asia from the Gulf Due to Crisis, 2009
Country or region Number of emigrants Emigrants returning due to crisis
Bangladesh 900,000 25,044
India 5,050,000 140,526
Kerala 2,193,412 61,036
Nepal 250,000 6,957
Pakistan 2,300,000 64,002
South Asia 9,475,000 263,660
Sri Lanka 975,000 27,131
Source: Estimated by the authors.
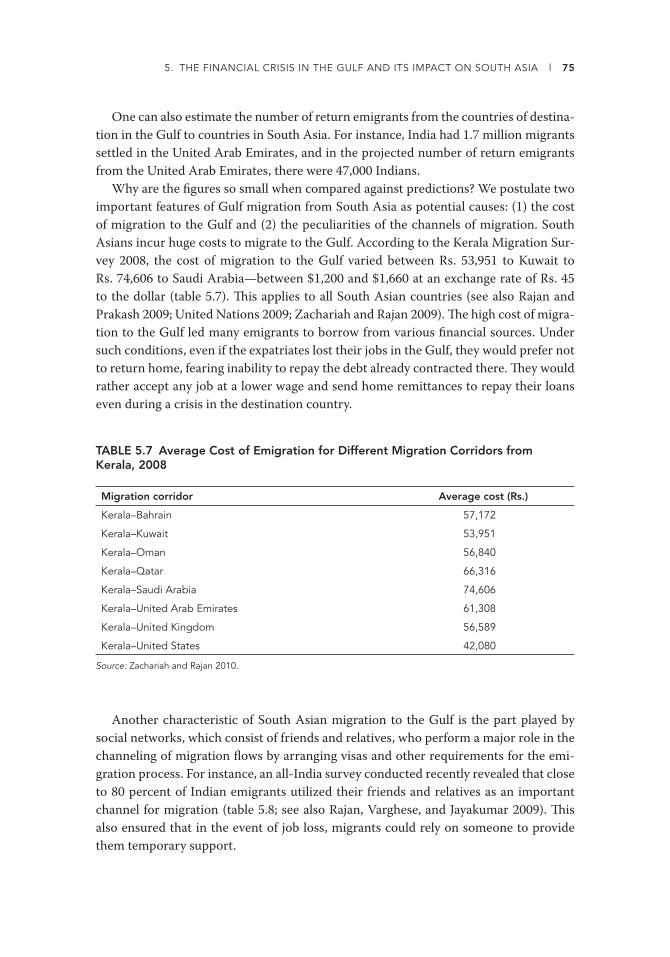
5. THE FINANCIAL CRISIS IN THE GULF AND ITS IMPACT ON SOUTH ASIA l 75
One can also estimate the number of return emigrants from the countries of destina-
tion in the Gulf to countries in South Asia. For instance, India had 1.7 million migrants
settled in the United Arab Emirates, and in the projected number of return emigrants
from the United Arab Emirates, there were 47,000 Indians.
Why are the fi gures so small when compared against predictions? We postulate two
important features of Gulf migration from South Asia as potential causes: (1) the cost
of migration to the Gulf and (2) the peculiarities of the channels of migration. South
Asians incur huge costs to migrate to the Gulf. According to the Kerala Migration Sur-
vey 2008, the cost of migration to the Gulf varied between Rs. 53,951 to Kuwait to
Rs. 74,606 to Saudi Arabia—between $1,200 and $1,660 at an exchange rate of Rs. 45
to the dollar (table 5.7). Th is applies to all South Asian countries (see also Rajan and
Prakash 2009; United Nations 2009; Zachariah and Rajan 2009). Th e high cost of migra-
tion to the Gulf led many emigrants to borrow from various fi nancial sources. Under
such conditions, even if the expatriates lost their jobs in the Gulf, they would prefer not
to return home, fearing inability to repay the debt already contracted there. Th ey would
rather accept any job at a lower wage and send home remittances to repay their loans
even during a crisis in the destination country.
TABLE 5.7 Average Cost of Emigration for Different Migration Corridors from Kerala, 2008
Migration corridor Average cost (Rs.)
Kerala–Bahrain 57,172
Kerala–Kuwait 53,951
Kerala–Oman 56,840
Kerala–Qatar 66,316
Kerala–Saudi Arabia 74,606
Kerala–United Arab Emirates 61,308
Kerala–United Kingdom 56,589
Kerala–United States 42,080
Source: Zachariah and Rajan 2010.
Another characteristic of South Asian migration to the Gulf is the part played by
social networks, which consist of friends and relatives, who perform a major role in the
channeling of migration fl ows by arranging visas and other requirements for the emi-
gration process. For instance, an all-India survey conducted recently revealed that close
to 80 percent of Indian emigrants utilized their friends and relatives as an important
channel for migration (table 5.8; see also Rajan, Varghese, and Jayakumar 2009). Th is
also ensured that in the event of job loss, migrants could rely on someone to provide
them temporary support.

76 l S. IRUDAYA RAJAN AND D. NARAYANA
TABLE 5.8 Channels of Migration by Emigrants, 2007
Channel
Number Percent
Male Female Total Male Female Total
Friends and relatives 330 185 515 74.2 88.5 78.7
Government agency 3 0 3 0.7 0.0 0.5
Foreign employer 41 7 48 9.2 3.4 7.3
Private recruitment agencies 71 17 88 16.0 8.1 13.5
Total 445 209 654 100.0 100.0 100.0
Source: Rajan, Varghese, and Jayakumar 2009.
Migrants Who Lost Jobs in the Gulf and Have Not Returned to the Country
of Origin
One category of migrants is those who “lost jobs in the Gulf and have not returned to
the country of origin” and who remain unemployed in the destination country and con-
tinue to look for jobs in sectors less aff ected or unaff ected by the crisis, at lower wages
and poorer working conditions. Th e Return Emigrant Survey 2009 conducted in Kerala
off ered a unique opportunity to estimate the number of those who lost their jobs in
the Gulf countries because of the crisis: According to their estimates, of the 2.2 million
emigrants from Kerala, about 39,396 persons lost their jobs between 2008 and 2009 but
did not return to their country of origin (Zachariah and Rajan 2009). Using the same
methodology we estimate the number of South Asian migrants who lost their jobs in
the Gulf to be 170,181 (table 5.9).
TABLE 5.9 Estimates of Emigrants Who Lost Job in the Gulf but Did Not Return, 2009
Country or region Stock of emigrantsNumber who lost job but
did not return
Bangladesh 900,000 16,165
India 5,050,000 90,703
Kerala 2,193,412 39,396
Nepal 250,000 4,490
Pakistan 2,300,000 41,310
South Asia 9,475,000 170,181
Sri Lanka 975,000 17,512
Source: Estimated by the authors.

5. THE FINANCIAL CRISIS IN THE GULF AND ITS IMPACT ON SOUTH ASIA l 77
Outfl ow of Workers from South Asia to Gulf, 2009
No offi cial data showed the extent of outfl ow from South Asia to the Gulf, and so we
estimated the possible trends using the data available from South Asian and GCC coun-
tries. All the countries in South Asia, except Sri Lanka, have reported some decline in
the fl ow of workers to the Gulf. Th e projected decline for India is the largest—about
280,000—followed by Pakistan with just 12,000 (table 5.10).
In regard to the destination, the decline was large for the United Arab Emirates, which
has been more severely aff ected by the crisis than the other countries in the Gulf, but this
was more than compensated by the increase in the number who left for Saudi Arabia. Th is
pattern holds for India, Nepal, Pakistan, and Sri Lanka. Th us, the crisis has changed the
migration and demographic dynamics of South Asian workers in the Gulf region.
TABLE 5.10 Flow of Migrant Workers from South Asia to the Gulf, 2005–09
Year Bangladesh India Nepal Pakistan Sri Lanka
2005 207,089 454,628 88,230 127,810 192,004
2006 307,620 618,286 128,306 172,837 170,049
2007 483,757 770,510 182,870 278,631 188,365
2008 643,424 818,315 169,510 419,842 215,793
2009 — 538,090 152,272 407,077 226,299
Source: This table is based on the country papers prepared by the respective country team at the countries of origin for this project.
Note: — = not available.
Inward Remittances to South Asia in 2009
Th e money that migrants send home is important not only to their families, but also to
their country’s balance of payments. In many developing countries, remittances rep-
resent a signifi cant proportion of GDP as well as foreign exchange receipts. In a 2009
World Bank publication (World Bank 2009a), among the South Asian countries, India
was ranked number one in terms of the volume of remittances, with $52 billion in 2008
(4.2 percent of GDP). Bangladesh was ranked eighth, and Pakistan ranked 11th in terms
of remittances. On the other hand, Nepal is listed as one of the top 10 countries with the
highest share of remittances to GDP at 22 percent. When the crisis hit in 2008, Ratha,
Mohapatra, and Xu (2008) stated, “Th e outlook for remittances for the rest of 2008
and 2009–10 remains as uncertain as the outlook for global growth, oil and non-oil
commodity prices, and currency exchange rates.” After several years of strong growth,
remittance fl ows to developing countries began to slow signifi cantly in the third quarter
of 2008 in response to a deepening global fi nancial crisis.

78 l S. IRUDAYA RAJAN AND D. NARAYANA
In late 2008, responding to a request from the government of Kerala, the Centre for
Development Studies prepared a report: “Global Financial Crisis and Kerala Economy:
Impact and Mitigation Measures” (Centre for Development Studies 2008). Th e report
predicted that remittances to Kerala were expected to increase from Rs. 30.122 in 2007
to Rs. 42.917 in 2008. Both the World Bank and the Centre reports predicted that the
infl ows of remittances to South Asia and Kerala were likely to continue, when the gen-
eral expectation was that it would drastically fall.
Our estimates based on a simple average of remittances for the available months
from the country reports prepared by the teams suggest that all countries of South
Asia are resilient to the crisis in terms of remittances (table 5.11). Our estimates put
TABLE 5.11 Inward Remittances to South Asian Countries, 2000–09
Year Bangladesh India Nepal Pakistan Sri Lanka
Millions $
2000 1,968 12,890 111 1,075 1,166
2001 2,105 14,273 147 1,461 1,185
2002 2,858 15,736 678 3,554 1,309
2003 3,192 20,999 771 3,964 1,438
2004 3,584 18,750 823 3,945 1,590
2005 4,314 22,125 1,212 4,280 1,991
2006 5,428 28,334 1,453 5,121 2,185
2007 6,562 37,217 1,734 5,998 2,527
2008 8,995 51,581 2,727 7,039 2,947
2009a 10,431 47,000 3,010 8,619 2,892
2009b 10,525 53,227 2,812 8,856 3,308
Percentage change
2000–01 6.96 10.73 32.43 35.91 1.63
2001–02 35.77 10.25 361.22 143.26 10.46
2002–03 11.69 33.45 13.72 11.54 9.85
2003–04 12.28 −10.71 6.74 −0.48 10.57
2004–05 20.37 18.00 47.27 8.49 25.22
2005–06 25.82 28.06 19.88 19.65 9.74
2006–07 20.89 31.35 19.34 17.13 15.65
2007–08 37.08 38.60 57.27 17.36 16.62
2008–09a 15.96 −8.88 10.38 22.45 −1.87
2008–09b 17.01 3.19 3.12 25.81 12.25
Source: World Bank and the country reports prepared by the research team for this project from fi ve countries of South Asia.
a. World Bank estimates.
b. Authors’ estimates.

5. THE FINANCIAL CRISIS IN THE GULF AND ITS IMPACT ON SOUTH ASIA l 79
the growth in remittances to India at 3 percent, from $52 billion in 2008 to $53 bil-
lion in 2009. Th e World Bank report “Migration and Remittances Trends 2009” (Ratha,
Mohapatra, and Silwal 2009a) confi rmed our estimates and stated that the outcomes
were better than expected but that signifi cant risks lie ahead.
Why did remittances not decline in South Asia? From our study, the following six
observations can be made: (1) the debts contracted to meet the high expenses incurred
during their migration kept emigrants from returning to their countries of origin
despite the layoff s; (2) the predictions of a large exodus of return emigrants from the
Gulf did not come true; (3) although the outfl ow declined in the fi rst half of 2009, it has
still not signifi cantly aff ected the number of South Asian migrants in the Gulf; (4) the
value of the dollar has appreciated vis-à-vis South Asian currencies—for instance, the
current exchange rate of the Indian rupee to the dollar is the same as in 2001–02; (5)
the continuous rise in oil prices has generated more income in the Gulf; and (6) “reverse
migration” has been seen of the crisis-instigated return emigrants back to the Gulf.
Conclusions
Th e unraveling of the impact of the crisis on output and employment in the United
States generated an anticipation of large-scale retrenchment of expatriate laborers in
the Gulf region. Th e anticipated misery and the need for rehabilitation led governments
in South Asia to think about plans for the returning migrants. We fi nd that the dimen-
sions of the impact were not as large as was feared earlier. Out of approximately 9.5 mil-
lion South Asian emigrants in the Gulf, the number who returned due to the crisis was
about 264,000 (just about 2.78 percent), and the number who lost jobs but were con-
tinuing to stay in the Gulf was about 170,000 (1.80 percent). Overall, less than 5 percent
of the South Asian emigrants had lost jobs owing to the crisis, but such an impact had
not adversely aff ected the yearly fl ow of out-migrants from South Asia. Compared with
the outfl ow of about 2.2 million workers in 2008, the number in 2009 is expected to be
close to 2.0 million, which is higher than the corresponding fi gure in 2007.
In regard to remittances (in dollars), the annual percentage increase since 2004–05
has been over 20 percent for the South Asian countries, except for Sri Lanka. Th e mag-
nitude of the increase has taken a hit across South Asia, except Pakistan, from which
the outfl ow of migrants had been increasing by about 50 percent every year since 2005.
Remittances, however, have not fallen following the crisis; either they have remained
stagnant or have shown a mild rise, depending on the estimates. As most of the South
Asian currencies have depreciated against the dollar (to which the GCC currencies are
pegged) since late 2007, remittances in terms of domestic currencies would have shown
an increase. A survey of migrant households in South Asia confi rmed these estimates,
because 94 percent of the households reported regular remittances during the crisis
period like those they had made in previous years, and no signifi cant change in the use
of remittances was reported by these households.

80 l S. IRUDAYA RAJAN AND D. NARAYANA
Overall, less than 5 percent of the stock of South Asian migrants in the Gulf had lost
jobs and either have returned there or were struggling to continue in the Gulf. Th e fl ow
of workers from South Asia to the Gulf had also not been aff ected to any signifi cant
extent, but changes were seen in the origin (in favor of Pakistan) and the destination (in
favor of Saudi Arabia) of the fl ow. Th e volume of remittances into South Asia had also
not fallen to any signifi cant extent.
In sum, the crisis of 2008-09 is a blip on the radar of labor migration to the GCC
countries from South Asia. A few thousand workers lost jobs and had to return home,
but the number migrating to the Gulf has hardly fallen. With the quick recovery in 2010,
the fl ow of labor is going to increase, and remittances will follow.
Notes
1. See http://cds.edu/download_fi les/wp436.pdf.
2. Th is section is based on the six country reports prepared by the research teams at the Centre
for Development Studies. Most of the members of the research team have already visited the
Gulf and interviewed stake holders.
3. Dubai World, a holding company owned by the government of Dubai that manages about
90 entities, asked to delay for six months payment on $26 billion of debt, which shook the
confi dence of investors holding the government’s debt.
4. Th e Return Emigrant Survey 2009 was conducted at the Centre for Development Studies
and was sponsored by the Department of Non-Resident Keralite Aff airs, government of Ker-
ala (for more details on the survey report, see Zachariah and Rajan 2009). Th e fi eld work was
carried out from June 16 to September 7, 2009.
5. Th ese could be underestimates because the composition of migrants from Kerala would have
a lower proportion of unskilled workers.

81
Chapter 6
Gendered Use of Remittances:The United Arab Emirates–Bangladesh Remittance Corridor
MD MIZANUR RAHMAN AND DANIÈLE BÉLANGER
The oil crisis of caused a shift of migration destinations from Europe to the
Gulf countries, and eventually the Gulf countries became large recipients of foreign
workers, ending the era of guest worker immigration to Europe (Ambrosetti 2009). Th e
Asian fi nancial crisis that started in Th ailand in 1997 and spread quickly to other South-
east and East Asian countries aff ected the labor markets severely, leading to a halt on
new hiring of migrant workers and the deportation of existing migrant workers from
almost all aff ected countries in the region. By the end of 1998, it was estimated that
933,000 migrant workers were expelled or laid off in the migrant-receiving countries of
East and Southeast Asia (Rahman 1999: 4).
Temporary labor migration forms a large component of intraregional labor migration
in Asia. Th e primary motivation for such migration is often economic. In this type of
labor migration, migrants are not allowed to settle in destination countries for the long
term; thus families live under “transnationally split” conditions, with the nonmigrating
family members “left behind” (Piper 2005; Yeoh, Graham, and Boyle 2002). Men have
always moved beyond national borders for work; now women are choosing to do the
same. More and more women migrate independently to realize their own aspirations
Th e authors wish to thank the International Organization for Migration (IOM)–Dhaka, Bangladesh, for fi nancing this study
in the United Arab Emirates. Special thanks go to Rabab Fatima, Regional Representative, IOM-Dhaka; Samiha Huda and
Disha Sonata Faruque, also of IOM-Dhaka, provided support and were a joy to work with.

82 l MD MIZANUR RAHMAN AND DANIÈLE BÉLANGER
and support their families—a phenomenon known as the feminization of labor migra-
tion in Asia. Th e feminization of labor migration is particularly pronounced in Indone-
sia, the Philippines, and Sri Lanka. However, other Asian countries, such as Bangladesh,
Cambodia, Myanmar, Nepal, and Vietnam, have also seen female migration on the rise.
An increasing number of women from these countries are now migrating for temporary
employment in the intra-Asian labor market.
Th ese migrant workers send remittances to their families left behind, often with
instructions on how and where the funds should be used. Th e use of remittances cuts
across gender lines. Despite the feminization of labor migration in Asia, little research
has been done to date on the gendered use of remittances. As a result, we are not aware
of how men and women diff er in their use of remittances under conditions of tempo-
rary migration. Th e existing literature also makes little reference to remittance use by
female and male migrant workers who leave for the same host country and share a geo-
graphical and social origin. Th is is particularly important because a general analysis of
remittance use without reference to the context of sending remittances may mislead us,
because motivations and the implications of remittances from migrants in labor-hiring
countries in Asia are supposed to diff er from those in the West, where migration is pre-
dominantly for permanent settlement. Th is study attempts to contribute to this under-
studied area by highlighting remittance use behavior of Bangladeshi male and female
migrant workers in the United Arab Emirates and their households in Bangladesh.
Studies of remittance use are mostly concerned with whether remittances are used
for productive investment or for consumption (for a review see Garcia and Paiewonsky
2006; Morrison, Schiff , and Sjöblom 2007; Papademetriou and Martin 1991). Th e exist-
ing literature often reports that migrant remittances are spent mainly on housing, edu-
cation, health care, special meals and celebrations, clothes, and electronic devices and
other imported consumption goods, whereas investment in productive enterprises is
rare (for a review see Hammar and others 1997; Sørensen, van Hear, and Engberg-Ped-
ersen 2002). As a result, the dominant view is that the money remitted by migrants is
mainly spent on consumption and nonproductive investments leading to “a passive and
dangerous dependency on remittances” (De Haas 2005). However, evidence is increas-
ing that this pessimistic perspective is founded on a rather poor empirical and analytical
basis (De Haas 2005; Hugo 2003).
In a broad sense, remittances are used for “physical capital” and “human capital”
(Salomone 2006: 14). Uses of physical capital generate market value, such as incomes
and profi ts (such as from bank deposits, housing, or loans). Uses of human capital are
those that contribute to intangible capital formation, such as family maintenance, edu-
cation, health, and quality of life. Using this broader classifi cation of remittance use
resolves some of the limitations inherent in the economic approach to investment. Th e
debate over productive (physical capital) and nonproductive (human capital) use of
remittances does not capture the gendered dimensions of remittances. As Mahler and
Pessar (2006: 27) claim, gender “seeps subtly into a seemingly neutral notion of ‘pro-
ductive’ versus ‘unproductive’ uses of remittances.” In the literature some researchers

6. GENDERED USE OF REMITTANCES l 83
have reported that women are less likely than men to invest in risky assets (Sunden and
Surette 1998) and that women tend to channel remittances into better health, educa-
tion, and nutrition for their family, thereby supporting the development of stronger,
more productive communities (Piper 2005; Sørensen 2005a).
Although a substantial literature is found on traditional female labor source coun-
tries in Asia (for example, Indonesia, the Philippines, and Sri Lanka), little research is
available on emerging female-labor-source countries such as Bangladesh. Th e Bangla-
deshi case is, therefore, expected to add new insights to the fi eld. Th e next section pro-
vides an overview of the Bangladeshi labor migration context. Th e subsequent sections
elaborate on data sources and fi ndings on remittance use. Th e fi nal section concludes
with fi ndings on policy and future directions for gender and remittance research.
The Bangladeshi Migration Context
Since the 1970s, one of the largest labor markets for Maghreb (Algeria, Libya, Morocco,
and Tunisia), Mashreq (Egypt, Jordan, Lebanon, Syria, West Bank and Gaza, and Yemen),
and Asian (South Asia and Southeast Asia) migrant workers has been that of the Gulf
States (Esim and Smith 2004; Humphrey 1991; IOM 2004; Khalaf and Alkobaisi 1999).
Th e six states of the Gulf Cooperation Council (GCC), Bahrain, Kuwait, Oman, Qatar,
Saudi Arabia, and the United Arab Emirates, host approximately 10 million foreign
workers (Manseau 2005: 25). Foreigners constitute a majority of the labor force in all
the GCC countries, with the average for 2004 close to 70 percent (Kapiszewski 2006: 4).
Th e GCC states are also the major destination for female migrant workers. Accord-
ing to one estimate, in the late 1990s about 840,000 women migrants were employed,
primarily as domestic workers (Shah 2004: 183). Intraregional migration in Asia takes
place under specifi c migration policies designed to ensure that the low-skilled migrant
worker returns to their home country, such as not allowing the family to accompany or
visit the worker, tying the worker to a single employer, not allowing the worker to marry
a citizen of the country where they are working, and enforcing other restrictions on
their rights and movements (Hugo 2003).
Along with other South Asian migrants, Bangladeshi migrant workers have joined
the Gulf labor markets since the late 1970s. According to one source, about 5 million
Bangladeshi migrants were employed in the GCC states between 1976 and 2008.1 Th e
number of migrants leaving Bangladesh averaged 250,000 a year between 2001 and
2005, rose to almost 400,000 in 2006, and doubled to 832,600 in 2007. Th e United Arab
Emirates is a destination country of signifi cance in terms of the numbers of Bangladeshi
migrants and resultant remittance infl ows to Bangladesh (fi gure 6.1). Th e annual fl ow
of Bangladeshi migrants to the United Arab Emirates has been on the rise, from roughly
55,000 in 1997 to 420,000 in 2008.2 Th e amount of annual remittances from the United
Arab Emirates has concomitantly increased steadily since 1991. According to the Cen-
tral Bank of Bangladesh, Bangladeshi migrants remitted $6,382 million from the United
Arab Emirates between 1991 and 2008 (fi gure 6.2).3

84 l MD MIZANUR RAHMAN AND DANIÈLE BÉLANGER
A signifi cant number of female workers from Bangladesh have also emigrated over-
seas for work. Th e data on female migration from Bangladesh are scarce, and the offi cial
estimates often belie the reality, mainly because of the undocumented nature of migra-
tion. Only 17,784 women migrated offi cially between 1991 and 2003, less than 1 percent
of the total labor migration during that period (Ullah and Panday 2007). In 1997 the gov-
ernment banned the expatriation of all unskilled and semiskilled female labor, following
increasing reports of exploitation and abuse of Bangladeshi women overseas. Civil soci-
ety organizations were against this government move and put pressure on the govern-
ment to repeal the ban. Facing increasing protests from civil society organizations, the
government fi nally repealed the ban on female migration in 2003. Th e government now
FIGURE 6.1 Bangladeshi Labor Migration to the United Arab Emirates, 1976–2010th
ous
and
s
0
50
100
150
200
250
300
350
400
450
1976 1980 1984 1988 1992 1996 2000 2004 2008
Source: Compiled from data provided in Government Site in Bangladesh, http://probashi.gov.bd accessed in March 2010.
FIGURE 6.2 Infl ows of Remittances from the United Arab Emirates to Bangladesh, 1998–2011
0200400600800
1,0001,2001,4001,6001,8002,000
1998–99
1999–2000
2000–01
2001–02
2002–03
2003–04
2004–05
2005–06
2006–07
2007–08
2008–09
2009–10
2010–11
$, m
illio
ns
Source: Compiled from data provided in http://www.bmet.org.bd/report.html and http://www.bangladesh-bank.org/econdata/wagermidtl.php.

6. GENDERED USE OF REMITTANCES l 85
stipulates numerous mandatory protections for female labor, including training courses
to educate women about cultural and working conditions abroad and requiring recruit-
ing agencies to compensate female workers in the event of exploitation or lost wages. To
go abroad legally as a domestic worker, Bangladeshi women must be at least 25 years of
age, submit a “no objection certifi cate” from their legal guardians (usually a husband),
and undergo at least 21 days of training. Despite the introduction of these new measures,
the withdrawal of the ban has opened the door for authorized or documented female
migration, and more and more women are now migrating overseas for work.
According to recent Bureau of Manpower, Employment and Training statistics,
124,273 female migrants went abroad for work from 1991 to 2009; of this total, 35,630
(29 percent) went to the United Arab Emirates.4 In 2009, 22,224 female migrants went
overseas for work, with 6,095 of them (27 percent) migrating to the United Arab Emir-
ates. Although Bangladeshi female migrants are spread over 21 countries worldwide,
their representation is negligible compared with female migrants from other countries
in Asia. Th is is not surprising: Women living in patriarchal societies display lower rates
of emigration than their male counterparts, whereas more egalitarian societies have
higher rates of female than male migration (Massey and others 1998/2006; Oishi 2005).
For example, Massey and his colleagues show that women from patriarchal societies
such as Costa Rica and Mexico demonstrate lower rates of emigration, but matrifocal
countries such as the Dominican Republic and Nicaragua show higher rates of emigra-
tion (Massey and others 1998/2006).
Data Sources
Th is study is based on two-way surveys: surveys of Bangladeshi male and female
migrants and their households in the United Arab Emirates and Bangladesh. Between
June and August 2009, 50 female migrant workers and 100 male migrant workers were
interviewed face-to-face in the United Arab Emirates. Th e questionnaire included both
structured and unstructured questions. Field work in Bangladesh involved interview-
ing 50 United Arab Emirates male migrant households and 50 United Arab Emirates
female migrant households. Th e households were selected on the basis of the following
criteria: (1) Th ey must have a male migrant working in the United Arab Emirates for the
male household survey and a female migrant working in the United Arab Emirates for
the female migrant household survey, (2) their migrant members must have been work-
ing in the United Arab Emirates for at least one year, and (3) their migrant members
must have made remittances to their families during this period. Recipients of remit-
tances were interviewed in the household survey. Both surveyed migrant workers and
households hail from rural Bangladesh; therefore, the fi ndings represent predominantly
a rural Bangladesh scenario. Placing the remittance process within the household con-
text enables a deeper understanding of the eff ects of remittances.
In general, household surveys include questions on the amounts and uses of remit-
tances. Th e data are usually reported in the form of quantitative tables detailing the

86 l MD MIZANUR RAHMAN AND DANIÈLE BÉLANGER
amounts allocated for diff erent activities. Researchers who collect such data are often
confronted with discrepancies between the actual amount of remittances and the
amount reported to the interviewers. Naturally, households may be uncomfortable
reporting the amounts and uses of remittances to outsiders. Reporting infl ated or inac-
curate amounts is common because most households do not maintain daily fi nancial
records. Given the sensitivity of questions and the potential for biased responses, we
have employed an alternative way of collecting information on remittance use. We are
primarily interested in pinpointing preferential expenditures so that trends can be cap-
tured and used as a baseline, and so we have identifi ed areas of remittance use, especially
where expenditures are recurrent and even when the amount is negligible, such as for
everyday necessities. We asked respondents to list up to fi ve major areas of remittance
use in the “near past” and “near future.”5 Th is alternative method of collecting informa-
tion on the use of remittances is expected to generate more accurate information on the
use of remittances under conditions of temporary migration (Rahman 2009), because
migrants are working on a contract basis, and duration of stay, earnings, savings, and
remittances are often fi xed in most cases.
Linking Migrants and Their Families
Most female and male migrants surveyed were in their 20s and 30s with about 50 per-
cent between 25 and 30 years of age. All female migrants were less than 40 years old,
and a small percentage of male migrants were over 40. In general, more married females
tended to migrate relative to their male counterparts. Among the surveyed migrants,
68 percent of females were married compared with 51 percent of males. Given the cul-
tural behavior patterns in Bangladeshi society, this fi nding is not surprising, because
female members of the family usually enjoy freedom of physical mobility after mar-
riage. Bangladesh is a predominantly Muslim country; population by religion in Ban-
gladesh, according to the 2001 census, is Islam, 89.58 percent; Hinduism, 9.34 percent;
and Christianity, 0.31 percent.6 Th e sample also refl ected the national-level data: 96 per-
cent of female and male migrants were Muslims, 4 percent of females were Hindus and
Christians, and 3 percent of males were Hindus. On average, the size of female migrant
households was 4.97 persons and that of male migrant households was 4.95; the average
household size at the national level is 4.8.7
Most migrants had some formal education, but male migrants tended to possess
higher qualifi cations than female migrants. Male migrants had also worked in the United
Arab Emirates for a longer period relative to their female counterparts. Among surveyed
migrants, 59 percent of male migrants and 10 percent of female migrants had been
working in the United Arab Emirates for four years or more. Ninety percent of female
migrants were working as cleaning staff at educational institutions in the sample. Th is,
however, does not mean that most female migrants working in the United Arab Emirates
are cleaners. It was diffi cult to gain access to domestic workers, and so this study mainly
surveyed cleaners. Male migrants worked as construction workers, cleaners, agricultural

6. GENDERED USE OF REMITTANCES l 87
workers, salesmen, tailors, and drivers and in a wide variety of other occupations (offi ce
maintenance, electricians, rental-car washers, painters, carpenters, and others). About
half of male migrants interviewed were employed as construction workers and sales-
men. Seventy-six percent of female migrants and 52 percent of male migrants were not
involved in any income-generating activity in Bangladesh before migration.
Th e expenses for migration vary along gender lines. Potential female migrants
spend a comparatively lesser amount of cash for migration than their male counter-
parts. Th e average cost of migration was Tk 106,220 ($1,531) for a female migrant and
Tk 141,300 ($2,037) for a male migrant. Lower migration costs are advantageous for
female migrants: Th ey have relatively less debt to repay and therefore more money to
send home. Th is gender-diff erentiated pattern of the fi nancial cost of migration has
been cited by some respondents as a factor in the family’s decision to send a woman
rather than a man to work in the United Arab Emirates. Th e fi nancial costs of migration
for Bangladeshi female and male migrants are higher than those for Sri Lankan female
and male migrants. A female domestic worker typically spends $500–$700, and a male
migrant spends up to $1,000 to meet the fi nancial cost of Gulf migration in Sri Lanka
(Shaw 2007: 162). Th e Bangladeshi female recruitment procedure is diff erent from that
of other countries in the region such as Indonesia, the Philippines, and Sri Lanka. In
these countries, female migrants do not need to pay any fee up front; the recruiting fees
are usually deducted from their salary once they start work in the destination country.
In the case of Bangladesh, female migrants are usually required to pay in full before
their departure. Because this amount is beyond the reach of low-income families, they
obtain the cash from diff erent sources available to them (Rahman 2009).
In the household survey, the largest group of remittance recipients was the fathers
of both female and male migrant workers. Married female and male migrants also pre-
ferred sending remittances to fathers than to spouses. Although 42 percent of female
migrants and 58 percent of male migrants were married, only 22 percent and 24 percent
of their spouses, respectively, were recipients. Female migrants tended to remit to their
sisters, and male migrants tended to remit to their brothers. It is interesting that more
male migrants than females chose to remit to their mothers. In short, 78 percent and
22 percent of female migrants remitted to male and female members, respectively, and
56 percent and 44 percent of male migrants remitted to male and female members of the
family, respectively. A migrant worker survey in the United Arab Emirates revealed sim-
ilar trends. Th e largest group receiving remittances was fathers of migrants. Although
68 percent of female migrants were married, only 28 percent of remittance recipients
were their husbands. Similarly, 51 percent of male migrants were married, but only
26 percent of the recipients were their wives.
As in the household survey, the migrant worker survey also revealed that more female
migrants than male migrants tended to remit to their male family members; 78 per-
cent and 22 percent of the females remitted to male and female members, respectively,
whereas 57 percent and 43 percent of the males chose to remit to male and female family
members, respectively. Overall trends of receiving remittances are the following: (1) Th e

88 l MD MIZANUR RAHMAN AND DANIÈLE BÉLANGER
father as the head of the traditional family tended to enjoy special privileges in receiving
remittances, (2) both married female and male migrants tended to prefer remitting to
their parents rather than in-laws or even spouses, (3) female migrants preferred remit-
ting to sisters rather than brothers and fathers to mothers, whereas male migrants pre-
ferred remitting to their brothers rather than sisters and fathers to mothers, and (4) more
female migrants than male migrants tended to remit to male family members.
Use of Remittances: The Migrant Perspective
Both the migrant worker and the migrant household surveys required respondents to
list up to fi ve areas in which they had used remittances thus far and up to fi ve areas
in which they were planning to use remittances in the “near future.”8 Table 6.1 pres-
ents fi ndings from the migrant worker survey in the United Arab Emirates. From the
male migrant workers’ perspective, the four areas of previous remittance use, ranked
in importance, were family maintenance, land purchase, education, and loan repay-
ment, whereas, from the female migrant workers’ perspective, the four areas were fam-
ily maintenance, land purchase, loan repayment, and education. Two major diff erences
are noteworthy in this area: (1) Female migrants did not use remittances for housing,
whereas a substantial proportion of male migrants did, and (2) almost half of the female
migrants spent remittances on loan repayment, but only a small proportion of male
migrants used remittances for this purpose.
TABLE 6.1 “Near Past” and “Near Future” Use of Remittances by Gender: Household and Migrant Worker Surveys, 2009
percent
Area of use
Migrant worker survey,United Arab Emiratesa
Migrant household survey, Bangladeshb
Near past use Near future use Near past use Near future use
Female Male Female Male Female Male Female Male
Family maintenance 66 92 0 0 92 90 92 86
Education 24 25 46 11 72 56 74 46
Savings 0 14 66 0 22 10 24 18
Loan repayment 44 16 0 0 48 78 46 70
Medical 0 0 0 0 24 0 36 18
Business 0 0 76 87 0 8 0 0
Housing 0 14 72 30 0 0 0 0
Land purchase 44 50 0 37 0 0 0 0
Source: Authors’ data.
a. Survey conducted in 2009; n = 150: 50 female, 100 male.
b. Survey conducted in 2009; n = 100: 50 female, 50 male.

6. GENDERED USE OF REMITTANCES l 89
Th ese trends can be explained by gendered expectations that prevail in Bangladeshi
society. Male migrants are more likely to use remittances for homebuilding because
Bangladesh is predominantly a patrilineal society, where a woman goes to live in her
husband’s house after marriage, and not vice versa. As a result, the responsibility for
homebuilding falls on the shoulders of male family members. On the other hand, male
migrants are less likely to spend remittances on loan repayment because working visas
for many male migrants are arranged through their contacts in the United Arab Emir-
ates, and the recruiting fees are paid later while working there. Th ese male migrants were
able to use their “migration-specifi c social capital” in the migration process, whereas
female migrants were deprived of this opportunity. From the family perspective, male
migrants are considered permanent members of the family, and investment in them, for
example, by providing migration expenses, is justifi ed. Sending female migrants abroad
is not seen as a future investment for the family, so minimal family resources are avail-
able for female migration. Female migration-friendly arrangements found in Indonesia,
the Philippines, and Sri Lanka, where female migrants do not have to make up-front
payments for recruitment-related services, have yet to develop in Bangladesh. Women
migrating from these countries are able to migrate under a “salary deduction program”
through which they can repay the recruitment fees from their monthly wages overseas
(Ananta and Arifi n 2004; Gamburd 2002).
With regard to remittance use in the “near future,” most migrants intended to shift
from immediate consumption to long-time capital formation. A majority of migrants
elected “business” as the future planned use of remittances (87 percent of males and
76 percent of females). For other categories, three gender-diff erentiated patterns are
salient: (1) Female migrants were more likely to plan on investing in savings than male
migrants, (2) male migrants were more likely to plan on investing in a land purchase
than women, and (3) more female migrants planned on future investments in hous-
ing than men. Th e diff erences in future intentions to save are striking (no men versus
66 percent of women). In such a patriarchal family context, a woman’s earnings are
considered the property of male family members, and women may have limited control
over the use of remittances they generate. Saving can be a strategy to protect their earn-
ings until their return to Bangladesh. Married women saved for planned investments
in their children’s future marriages and education. Some unmarried women planned
to save to secure a dowry for a future marriage. For those who are married, variations
in past and future use also indicate diff erent gendered expectations: Men have more
immediate pressure to invest in housing, whereas women postpone these plans. Both
men and women invest in land purchases without delay, but only men identify the
acquisition of land as a future objective.
Use of Remittances: The Household Perspective
In the household survey, the same questions of “near past” and “near future” use of
remittances were given to both male and female migrant households (table 6.1). Savings,

90 l MD MIZANUR RAHMAN AND DANIÈLE BÉLANGER
education, and medical treatment were the major areas of “near past” use for female
migrant households, whereas business and loan repayment were the major areas of
“near past” use for male migrant households. Medical treatment was exclusive to female
migrant households, whereas business was exclusive to male migrant households. Both
male and female migrant households depended on remittances for family maintenance.
More female migrant households than male migrant households tended to save remit-
tances. A similar savings trend was also found in the migrant worker survey. For female
migrant households, major areas of “future use” of remittances were savings, medical
treatment, education, and family maintenance, whereas, for male migrant households,
the only major “future use” of remittances was loan repayment. Th ese male migrants in
the household survey hailed from areas or villages where migration to the United Arab
Emirates was not developed enough to reduce the cost of migration. In other words,
they had little or no access to migration-specifi c social capital, as found in the migrant
worker survey in the United Arab Emirates, or family resources to meet the migration
expenses, resulting in greater debt. It is important to note that the cost of migration was
higher for male migrants than female migrants.
A striking fi nding in the household survey is that remittances played a crucial role in
family maintenance for both female and male migrant workers: On average, 90 percent
of migrant households depended on remittances for family maintenance. Given that
such a large percentage of migrant households depended on remittances for sustenance,
we inquired about the amount of land owned to understand the economic viability of
the family, because most migrants came from rural areas where land is considered the
main source of family income. Approximately 70 percent of female migrant households
and 60 percent of male migrant households reported that they did not possess suffi cient
land for subsistence living. Th ese results suggest that female migrant households had
less land for subsistence, so they had a higher number of female migrants as economic
providers.
From the fi ndings on remittance use from both the migrant and household perspec-
tives, it is evident that migrants had dual motivations: investment in physical and human
capital. When families invested mainly in physical capital, remittances were used for
homebuilding, land purchase, and businesses, whereas, when families invested mainly
in human capital, they spent remittances mostly on education, medical treatment, and
family maintenance. Because a good portion of remittances is used for recurrent fam-
ily expenses, some scholars may argue that migrant remittances lead to consumption.
Migrant remittances were used for family maintenance because migrants were, regard-
less of gender, the principal economic providers for the families left behind. On average,
75 percent of the female migrants and 53 percent of the male migrants in both surveys
played the role of principal economic providers for their families in Bangladesh, refl ect-
ing the dominant status of migration as a survival strategy for Bangladeshi families.
Remittances also make a substantial contribution toward savings, especially for
women. In academic and policy circles it is widely assumed that the migrants themselves
are all latent entrepreneurs and the appropriate agents for undertaking investment from

6. GENDERED USE OF REMITTANCES l 91
the remittances (Brown and Ahlburg 1999; Connell and Brown 1995). However, Saith
(1989) reported a high failure rate of governments’ self-employment programs in labor-
exporting countries in Asia aimed at converting migrants into small entrepreneurs,
and Saith questioned the wisdom of adopting policies to convert migrant savers into
migrant investors. Th is study fi nds that the majority of recipients were “savers” and a few
were “saver investors.” Again, patterns of investment varied along gender lines: Female
migrant household recipients of remittances are less likely to invest in material capital,
mostly in the absence of their female remitters overseas. However, structural barriers
also exist for women investing in business and productive investment in Bangladeshi
rural society. In general, a sense of fear and uncertainty among all migrant workers and
their families is seen in relation to investing in business ventures, and this is largely
attributable to the lack of diff erent markets, such as insurance markets, credit markets,
and future markets.
Conclusion
Th is study has argued that an examination of the gendered use of remittances is needed
to understand the dynamics of remittance use and development outcomes. Th is study
introduces an alternative way of reporting by documenting priorities and timelines in
remittance use. Th e study has reported several gendered-diff erentiated uses in the “near
past” use of remittances. First, female migrants did not use remittances for homebuild-
ing, whereas a substantial percentage of male migrants did. Second, male migrants did
not spend remittances on loan repayment, whereas almost half of female migrants used
remittances for this purpose. Th ird, and fi nally, female households spent more on edu-
cation and medical expenses than did male migrant households. In the “near future” use
of remittances, two gender-diff erentiated patterns are prominent: (1) Female migrants
showed more interest in saving remittances than male migrants and (2) land purchase
remained mainly a male domain. We fi nd an indication that remittance use is shifting
from immediate consumption to long-term capital formation because, in temporary
migration, migrants require a few years to recoup the expenses incurred in the migra-
tion process, which entails that the positive eff ects of remittances take longer to be
realized. Findings show, however, that these patterns are highly gendered and shaped by
gender and power relations in the country of origin. Male and female domains of labor
and expenditures that exist before migration largely explain remittance use patterns
during migration and on return.
Th e most frequent use of remittance was family maintenance. Migrant remittances
were used for family maintenance because migrants were the principal economic pro-
viders for the families left behind. Interestingly, more females than males were principal
economic providers for their families, although more males than females were active
in the labor market before migration. In this study we found that a greater number
of migrants and their households reported saving their remittance earnings. We con-
clude that it would make better sense for policy to be geared more toward encouraging

92 l MD MIZANUR RAHMAN AND DANIÈLE BÉLANGER
migrant workers and their families to become more active in domestic capital markets
as “investors.” Th e “income security” of migrant households and “development priori-
ties” of government should, wherever possible, be kept separate. Research on the gen-
dered use of remittances under conditions of temporary migration is still in its infancy.
For migrants originating from patriarchal societies, gendered patterns of remittance
control and use need to be further investigated to thoroughly assess the impact of remit-
tances on development. Th is study off ers insights into gender dimensions of remittance
use, but more empirically based research is needed in the fi eld.
Th e case of Asia shows that patterns in sending remittances are complex and not
completely dependent on global economic changes (Skeldon 2010). First, labor mar-
kets in receiving countries largely infl uence whether economic downturns aff ect remit-
tances. Th e case of the Philippines has shown that the high demand in the domestic and
heath care sectors was maintained in 2008 and 2009, despite massive layoff s in other
work sectors (Riester 2009). Likewise, migrants from South Asia working in the Gulf
region experienced limited consequences of the economic crisis because oil-producing
countries maintained their growth (Skeldon 2010). In this context, migrant workers did
not return in large numbers, and recruitment fi gures were maintained, and so remit-
tances continued to fl ow. During economic downturns, migrants also use contingency
plans. Because of their families’ daily dependence on remittances, migrants resort to
various strategies to avoid interrupting the fl ow of remittances, such as sending savings
and fi nding employment in the shadow economy (Ullah 2010). All the above processes
are gendered, and a comprehensive gendered analysis of the impact of the 2008 eco-
nomic crisis on migrants and remittance fl ows remains to be done.
Notes
1. Bureau of Manpower, Employment and Training, Bangladesh: Th is agency is responsible for
record keeping and granting permission to overseas job seekers at the fi nal stage of migration.
2. http://www.bmet.org.bd/BMET/viewStatReport.action?reportnumber=3.
3. http://www.bangladesh-bank.org/econdata/wagermidtl.php.
4. http://www.bmet.org.bd/BMET/viewStatReport.action?reportnumber=3.
5. In major labor-receiving countries in the Gulf countries, migrant workers are usually issued
work permits for two to three years with an option for renewal subject to the availability of
the job. In the sample, migrants who were working in the United Arab Emirates for at least
one year were interviewed.
6. http://www.bbs.gov.bd/dataindex/census/bang_atg.pdf.
7. http://www.bbs.gov.bd/dataindex/stat_bangladesh.pdf.
8. Because migrant workers were usually issued work permits for two to three years and our
respondents were working in the United Arab Emirates for more than one year but less than
three years, we refer to “near past” as the fi rst one or two years of a contract and “near future”
as the remainder of the contract, which may be one or two years depending on the timing of
the interview and the length of the contract.

93
Chapter 7
Trends and Correlates of Remittances to India
POONAM GUPTA AND KARAN SINGH
Reliance on remittances in developing countries is great. Even in a relatively
large economy such as India’s, remittances, along with the exports of services, have
been instrumental in turning around the current account and in the accumulation of
reserves. Th e current global economic slowdown had raised the concern that remit-
tances to developing countries would slow. Despite the projected decline, remittances
continue to be the most stable type of international fl ows, as private capital fl ows and
even the export earnings from goods and services have declined more rapidly.
Did all countries experience a decline in remittances in 2009–10, or did some of them
beat the odds and see no decline? Th is chapter examines the remittance fl ows to India
and analyzes their correlates. Remittances to India exhibit strong growth over time
averaging about 10 percent a year in constant U.S. dollars since 1991. Remittances in
real dollars declined by 7 percent in 2009 but keeping with the global trend rebounded
quickly to register a 9 percent growth rate in 2010.
Among the correlates of remittances, the movement of remittances around the
trend is limited, and until the early 2000s none of the factors considered in our analyses
seemed to have infl uenced remittance behavior. Th is pattern has changed somewhat
since about 2004, and remittances have responded to movements in the domestic and
international interest rates and to price movements in the Indian stock market. In par-
ticular, an increase in domestic interest rates, a decline in international interest rates,
and an increase in the Indian stock market index are all associated with an increase
in remittances. Th is refl ects the fact that in recent years remittances are partly driven
by an investment motive that is commensurate with the increasing prosperity of the

94 l POONAM GUPTA AND KARAN SINGH
country, the easing of restrictions on the current and capital account, and the liberaliza-
tion of the fi nancial sector.
Th e trend in the growth rate of remittances is not aff ected by factors such as eco-
nomic growth in the source and destination countries, interest rate movements, or even
potential risk factors such as political uncertainty. As shown elsewhere, growth is likely
correlated with the stock of migrants.
In the short run, remittances are susceptible to a domestic or global slowdown if
India’s attractiveness as an investment destination is reduced—and this is likely to be
the case when the interest rates in advanced countries harden, interest rates in India
decline, or there is a decline in the Indian stock market. At the same time, however,
having weathered the recent developments in the global economic conditions, remit-
tances to India are likely to continue to grow. Th e only possible case in which the remit-
tances are likely to slow is when global conditions make the pool of migrants from India
smaller, but this is unlikely to happen in the near term.
Magnitude, Trends, and Volatility
Th e sources of data on remittances to India used here are the Reserve Bank of India’s
(RBI) online interactive database, Database on Indian Economy.1 Th e rest of the data are
obtained from the Indian Foreign Service, World Economic Outlook, or other sources,
as indicated in annex table A.
Remittances to India were quite small up until 1990, and since then remittances have
grown rapidly (fi gure 7.1). In absolute terms, India is the largest recipient of remittances
FIGURE 7.1 Remittances to India
$, b
illio
ns
0
10
20
30
40
50
60
1975 1980 1985 1990 1995 2000 2005 2010e
Sources: RBI; World Bank 2011b for 2010.
Note: Data for 2010 are estimated.

7. TRENDS AND CORRELATES OF REMITTANCES TO INDIA l 95
globally. Th e reasons for the low level of remittances in 1975–89 could very well be
that a large part of the remittances during this period were sent to India via unoffi cial
and informal channels (hawala) because of the heavy restrictions that the central bank
imposed on transactions involving foreign currency and fi xed exchange rates. Th us the
dollar always exchanged at a premium in the unoffi cial or parallel markets. Another
reason why remitters bypassed offi cial channels was that gold attracted high import
duties, and, in response, its local price was much higher than the international price.
Th us remitters would carry gold with them and sell it for rupees (often to relatives and
acquaintances) while traveling to India. Offi cial channels were also cumbersome, and it
took longer to remit money though them.
All of this changed with the liberalization in 1991, when the currency was devalued
by about 30 percent within a year, the current account transactions were liberalized,
the fi nancial sector was liberalized and computerized, and the import duty on gold was
gradually brought down and eventually abolished on small amounts of gold that the
individuals were allowed to carry with them. All of these developments made the unof-
fi cial routes of remitting money broadly redundant, and the remittances as recorded in
the RBI database picked up signifi cantly. Th e buoyancy in remittances since the early
1990s thus probably refl ects the fact that the remittances were diverted from unoffi cial
to offi cial channels.
Th e continued growth of remittances since 1991 cannot be attributed to the diver-
sion of remittances from unoffi cial channels alone. Th e pace of growth since then is
consistent with the increasing integration of India with the rest of the world and with
the advanced economies in particular as well as the greater movement of people and
goods and services (fi gure 7.2).
FIGURE 7.2 Current Account Infl ows, 1991–2009
$, b
illio
ns
0
50
100
150
200
250
1991 1993 1995 1997 1999 2001 2003 2005 2007 2009
merchandise
services
remittances
Source: RBI.

96 l POONAM GUPTA AND KARAN SINGH
Remittances are increasing in tandem with the infl ows on account of the gross export
earnings from the export of merchandise and services, although they remain smaller in
magnitude. However, when compared (fi gure 7.3) with the net export earnings from
merchandise and services exports (that is, exports minus imports), remittances are seen
to have contributed a larger amount to the Indian current account balance. Also remit-
tances add more to the Indian balance-of-payments receipts than net portfolio fl ows
(nearly twice as much in 2009) or nonresident Indian (NRI) deposits (several times
more).
FIGURE 7.3 Net Remittances versus Net Capital Infl ows, 1991–2009
$, b
illio
ns
−20
−10
0
10
20
30
40
50
60
1991 1993 1995 1997 1999 2001 2003 2005 2007 2009
remittances
portfolioforeign
investment
nonresident deposits
Source: RBI.
An important feature of remittances is that they have proven to be one of the most
stable forms of external fl ows to India, on current as well as on capital accounts. Jadhav
(2003) and Gupta (2006) show that the remittances are more stable than NRI deposits
or portfolio fl ows. Remittances are, in fact, seen to be as stable as the export earnings
from goods and services. In tables 7.1 and 7.2, we compare the standard volatility mea-
sures of remittances and those of various other fl ows on current and capital accounts.
When we look at the volatility of gross fl ows (table 7.1), we fi nd that remittance infl ows
are as stable as services and goods exports and more stable than the gross infl ows
on account of foreign direct investment, portfolio investment, and NRI deposits. In
table 7.2 we compare standard volatility of net infl ows in current and capital accounts.
More remarkably, net remittances are signifi cantly more stable than the net infl ows on
account of net export earnings from goods and services, portfolio investment, foreign
direct investments, or NRI deposits.
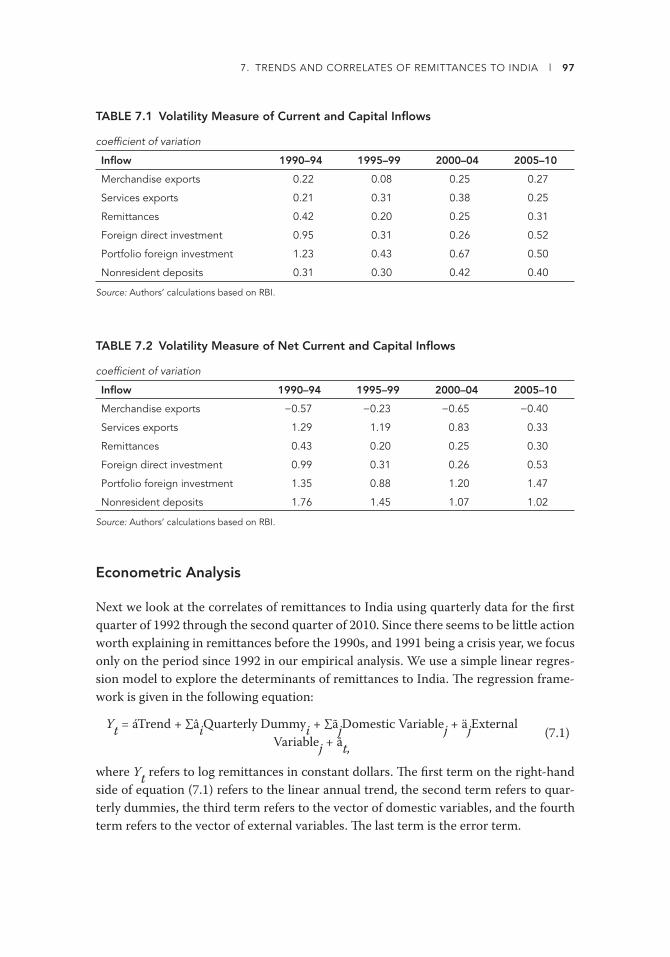
7. TRENDS AND CORRELATES OF REMITTANCES TO INDIA l 97
TABLE 7.1 Volatility Measure of Current and Capital Infl ows
coeffi cient of variation
Infl ow 1990–94 1995–99 2000–04 2005–10
Merchandise exports 0.22 0.08 0.25 0.27
Services exports 0.21 0.31 0.38 0.25
Remittances 0.42 0.20 0.25 0.31
Foreign direct investment 0.95 0.31 0.26 0.52
Portfolio foreign investment 1.23 0.43 0.67 0.50
Nonresident deposits 0.31 0.30 0.42 0.40
Source: Authors’ calculations based on RBI.
TABLE 7.2 Volatility Measure of Net Current and Capital Infl ows
coeffi cient of variation
Infl ow 1990–94 1995–99 2000–04 2005–10
Merchandise exports −0.57 −0.23 −0.65 −0.40
Services exports 1.29 1.19 0.83 0.33
Remittances 0.43 0.20 0.25 0.30
Foreign direct investment 0.99 0.31 0.26 0.53
Portfolio foreign investment 1.35 0.88 1.20 1.47
Nonresident deposits 1.76 1.45 1.07 1.02
Source: Authors’ calculations based on RBI.
Econometric Analysis
Next we look at the correlates of remittances to India using quarterly data for the fi rst
quarter of 1992 through the second quarter of 2010. Since there seems to be little action
worth explaining in remittances before the 1990s, and 1991 being a crisis year, we focus
only on the period since 1992 in our empirical analysis. We use a simple linear regres-
sion model to explore the determinants of remittances to India. Th e regression frame-
work is given in the following equation:
Yt = áTrend + ∑â
iQuarterly Dummy
i + ∑ã
jDomestic Variable
j + ä
jExternal
Variablej + å
t,(7.1)
where Yt refers to log remittances in constant dollars. Th e fi rst term on the right-hand
side of equation (7.1) refers to the linear annual trend, the second term refers to quar-
terly dummies, the third term refers to the vector of domestic variables, and the fourth
term refers to the vector of external variables. Th e last term is the error term.

98 l POONAM GUPTA AND KARAN SINGH
Dickey-Fuller tests indicate that the remittances are trend stationary. We are using
quarterly data, so we include quarterly dummies in the regression to deseasonalize the
data. Durbin-Watson tests, and the alternative Durbin-Watson tests, show that there is
serial correlation of order 1 in the regressions; thus we report our estimates correcting
the standard errors for serial correlation and possible heterogeneity using the Newey-
West estimates.
Table 7.3 estimates the trend growth rate of remittances and the seasonal patterns. In
column I, we include an annual trend, which shows the average pace of growth of remit-
tances in constant dollars to be about 11 percent a year. In column II, we allow the trend
to be diff erent from 2004 and fi nd that the pace of growth of remittances has accelerated
by 3 percentage points from 2004 (which is marginally signifi cant). In columns III–V
we include a quarterly trend and quarterly dummies to detect seasonality. We fi nd the
estimate of trends to be similar to the annual one; we also fi nd that there is indeed
acceleration in remittances since 2004 and that there is no seasonality in the remittance
fl ows, as shown by the insignifi cant coeffi cients of quarterly dummies.
Next, drawing on the existing literature on the regressions, we include a comprehen-
sive set of domestic and external variables as the potential determinants of remittances
(Gordon and Gupta 2004; Gupta 2006, 2010). Th e demand for remittances is likely to be
infl uenced by the economic conditions in the recipient countries, and thus we include
gross domestic product (GDP) growth as a measure of the economic strength.2 Th e
TABLE 7.3 Trend in Remittances
dependent variable: log remittances in constant dollars
Variable I II III IV V
Annual trend from 1992 0.108*** [24.15]
0.098*** [12.64]
Annual trend from 2004 0.031[1.62]
Quarterly trend from 1992 0.024*** [12.95]
0.027*** [23.73]
0.024*** [12.86]
Quarterly trend from 2004 0.009*[1.79]
0.009*[1.72]
Dummy for Quarter 1 0.07[0.96]
0.06[0.92]
Dummy for Quarter 2 0.09[1.28]
0.09[1.24]
Dummy for Quarter 3 0.06[0.79]
0.05[0.73]
Observations 75 75 75 75 75
R2 0.89 0.89 0.89 0.89 0.89
Source: Authors’ calculations.
Note: Standard errors are given in brackets. *, **, *** indicate that the coeffi cients are signifi cant at the 10, 5, and 1 percent levels, respectively.
7. TRENDS AND CORRELATES OF REMITTANCES TO INDIA l 99
remittances would, of course, also be determined by the economic conditions in the
source countries.
We account for these forces by including the GDP growth of the United States, the
Gulf Cooperation Council (GCC) countries, or the countries in the Middle East—the
largest destinations of migrants from India.3 We also include oil prices as an indicator
of the fi nancial health of the GCC countries, from where a substantial proportion of
remittances to India originate.
Like any other fi nancial fl ows, remittances may be driven by an investment motive
and thus may be aff ected by the factors that determine the relative earnings of these
investments in the native country and in the host country, such as the interest rates
and expected stock market returns. Th us we include the domestic and external interest
rates, stock market index, and exchange rate movements as the potential determinants
of remittances. Economic or political uncertainties may aff ect the decision to send
remittances, especially if remittances are meant for investment. To account for these
factors we include proxies for domestic uncertainties, including the political uncer-
tainty. Finally, to look at the responsiveness of remittances to specifi c events, we include
the dummies for events such as the Asian crisis.
To see which variables might be more susceptible to multicollinearity, we calculate
the correlation coeffi cients between diff erent variables (for this we fi rst regressed each
variable on a trend and quarterly dummies and take the residual, and we then calculate
the correlation coeffi cients for these residuals). Th e correlation coeffi cients are reported
in annex table C. Two things are evident from the correlations. First, even though some
of the variables are correlated signifi cantly with each other but the correlations are
quantitatively not very large, there seems to be independent variation in each variable.
Second, some of the variables are somewhat more highly correlated with each other.
Th ese include oil prices, the stock market index in the United States, the Indian stock
market index, and the exchange rate.
Another thing that we need to be careful about is the endogeneity. Are the variables
that we include as potential determinants likely to be aff ected by the remittances? For
a large economy like India’s where remittances are small compared with the size of the
economy, it does not seem to be the case, and the remittances are not likely to aff ect
GDP growth, interest rates, stock market variables, political uncertainty, or even the
exchange rate.
Using a specifi cation with a linear trend and quarterly dummies, we include all the
potential determinants of remittances. Th e trend and quarterly dummies in the regres-
sions detrend and deseasonalize the dependent and all the independent variables. We
start with the kitchen sink specifi cation, including all the potential correlates in the
regressions, but as documented elsewhere none of these variables turn out to be sig-
nifi cant (Gupta 2010). Th us we fi nd that the price of oil has an insignifi cant coeffi cient,
which is consistent with the World Bank fi ndings (Ratha and Mohapatra 2009), in which
the oil prices do not correlate with remittance outfl ows from Saudi Arabia since 1980.
Instead of oil prices we include the growth rate of GCC countries or the average growth
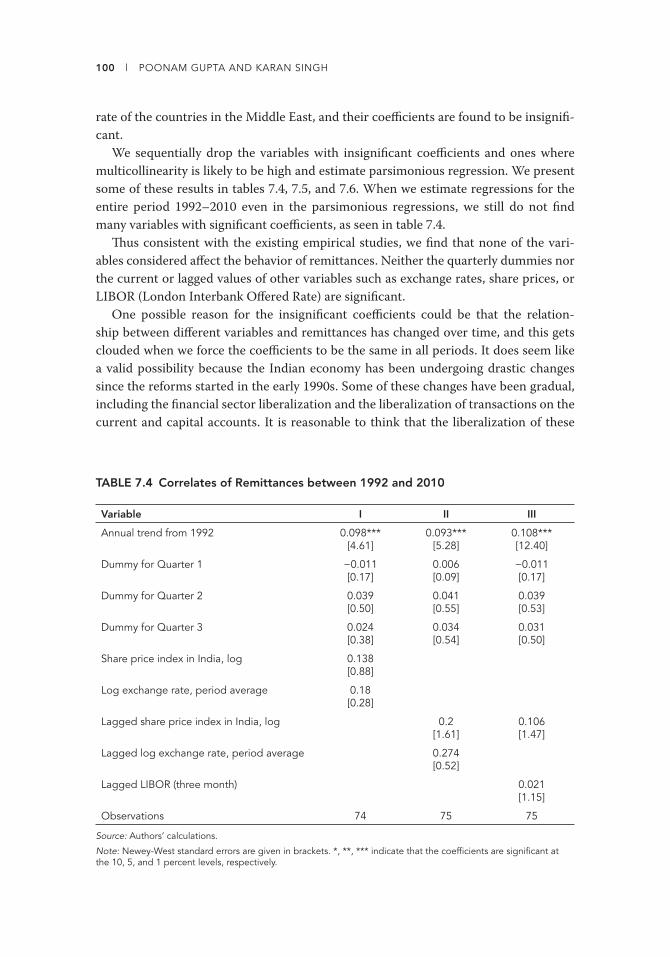
100 l POONAM GUPTA AND KARAN SINGH
rate of the countries in the Middle East, and their coeffi cients are found to be insignifi -
cant.
We sequentially drop the variables with insignifi cant coeffi cients and ones where
multicollinearity is likely to be high and estimate parsimonious regression. We present
some of these results in tables 7.4, 7.5, and 7.6. When we estimate regressions for the
entire period 1992–2010 even in the parsimonious regressions, we still do not fi nd
many variables with signifi cant coeffi cients, as seen in table 7.4.
Th us consistent with the existing empirical studies, we fi nd that none of the vari-
ables considered aff ect the behavior of remittances. Neither the quarterly dummies nor
the current or lagged values of other variables such as exchange rates, share prices, or
LIBOR (London Interbank Off ered Rate) are signifi cant.
One possible reason for the insignifi cant coeffi cients could be that the relation-
ship between diff erent variables and remittances has changed over time, and this gets
clouded when we force the coeffi cients to be the same in all periods. It does seem like
a valid possibility because the Indian economy has been undergoing drastic changes
since the reforms started in the early 1990s. Some of these changes have been gradual,
including the fi nancial sector liberalization and the liberalization of transactions on the
current and capital accounts. It is reasonable to think that the liberalization of these
TABLE 7.4 Correlates of Remittances between 1992 and 2010
Variable I II III
Annual trend from 1992 0.098***[4.61]
0.093***[5.28]
0.108***[12.40]
Dummy for Quarter 1 −0.011[0.17]
0.006[0.09]
−0.011[0.17]
Dummy for Quarter 2 0.039[0.50]
0.041[0.55]
0.039[0.53]
Dummy for Quarter 3 0.024[0.38]
0.034[0.54]
0.031[0.50]
Share price index in India, log 0.138[0.88]
Log exchange rate, period average 0.18[0.28]
Lagged share price index in India, log 0.2[1.61]
0.106[1.47]
Lagged log exchange rate, period average 0.274[0.52]
Lagged LIBOR (three month) 0.021[1.15]
Observations 74 75 75
Source: Authors’ calculations.
Note: Newey-West standard errors are given in brackets. *, **, *** indicate that the coeffi cients are signifi cant at the 10, 5, and 1 percent levels, respectively.

7. TRENDS AND CORRELATES OF REMITTANCES TO INDIA l 101
sectors took hold by the early 2000s. Th e liberalization of the fi nancial sector has also
resulted in the interest rates being determined more by the liquidity conditions in the
market rather than being set by the central bank or the public sector banks, and by the
remittances reaching India faster and more cheaply.
It seems reasonable to expect that the remittances respond faster to changing mac-
roeconomic conditions in recent years and are able to benefi t from the investment
opportunities that the country off ers. To allow for the eff ect of variables on remittances
to diff er over time, we estimate the regressions separately for 1992–2003 and 2004–10.4
Results are given in tables 7.5 and 7.6, respectively.
None of the variables we considered had a signifi cant coeffi cient when we included
1992–2003 in the regressions, some of which are shown in table 7.5. Specifi cally, GDP
growth rates in India or the United States, the stock market index in India, or LIBOR
did not aff ect remittances in 1992–2003 but were signifi cant in the post-2004 period.
Regression results (table 7.6) show that the way remittances respond to certain mac-
rovariables has changed over time. In particular, remittances have responded signifi -
cantly diff erently to changes in LIBOR and the Indian stock market index in more
recent years.
Results show that a 10 percent increase in the Indian stock market index was asso-
ciated with a 5–8 percent increase in remittances. A decrease in LIBOR by 100 basis
points increased remittances by 5–8 percent above their trend. One interpretation of
TABLE 7.5 Correlates of Remittances between 1992 and 2003
Variable I II III
Annual trend from 1992 0.117***[7.62]
0.116***[7.39]
0.116***[7.31]
Dummy for Quarter 1 −0.017[0.21]
−0.015[0.18]
−0.006[0.07]
Dummy for Quarter 2 0.026[0.26]
0.031[0.32]
0.03[0.31]
Dummy for Quarter 3 −0.001[0.01]
0.001[0.01]
0.001[0.01]
Lagged share price index in India, log 0.13[0.63]
0.085[0.37]
0.085[0.35]
Lagged LIBOR (three month) 0.045*[1.75]
0.041[1.58]
0.042*[1.74]
Real GDP growth, United States 0.02[0.64]
0.017[0.52]
Real GDP growth, India 0.017[0.65]
Observations 48 48 48
Source: Authors’ calculations.
Note: Newey-West standard errors are given in brackets. *, **, *** indicate that the coeffi cients are signifi cant at the 10, 5, and 1 percent levels, respectively.

102 l POONAM GUPTA AND KARAN SINGH
these results is that in recent years remittances are being directed to India more for
investment purposes than before.
We assess the vulnerabilities of remittances to certain events, such as political uncer-
tainty, possibility of armed confl ict, possible loss in confi dence in the Asian economies
during the Asian crisis, and so on by including dummies for these events in the regres-
sions. When we include these dummies, we do not fi nd the coeffi cients of these vari-
ables to be signifi cant. Th us remittances do not seem to be aff ected by these events and
uncertainties.
Gupta (2006) shows that factors that infl uence the trend in remittance practice are
correlated with the stock of migrants abroad. We do not include this variable here
because of the lack of data for the last few years, but as far as the current slowdown is
concerned, unless it reduces the stock of migrants abroad, remittances are likely to grow
at the same brisk pace as they have in the last two decades. Besides the factors cited by
Ratha and Mohapatra (2009), two other factors that probably work in India’s favor are
(1) it is a large economy and an economy that is proving to be an attractive investment
destination for external capital as well as for remittances and (2) migrants from India
consist primarily of skilled workers and perhaps work in cyclically insulated services
(such as information technology, health, and education) rather than in cyclically volatile
sectors such as construction.5
TABLE 7.6 Correlates of Remittances between 2004 and 2010
Variable II III IV
Annual trend from 2004 0.073**[2.15]
0.003[0.12]
0.011[0.28]
Dummy for Quarter 1 0.023[0.24]
0.089[1.07]
0.083[0.96]
Dummy for Quarter 2 0.069[0.73]
0.125[1.72]
0.123[1.65]
Dummy for Quarter 3 0.085[0.91]
0.12[1.34]
0.119[1.30]
Lagged share price index in India, log 0.547***[3.21]
0.820***[7.02]
0.783***[4.09]
Lagged LIBOR (three month) −0.057**[2.49]
−0.084***[4.90]
−0.073*[1.79]
Real GDP growth, United States −0.04**[−2.32]
−0.035[1.22]
Real GDP growth, India −0.019[0.33]
Observations 27 26 26
Source: Authors’ calculations.
Note: Newey-West standard errors are given in brackets. *, **, *** indicate that the coeffi cients are signifi cant at the 10, 5, and 1 percent levels, respectively.
7. TRENDS AND CORRELATES OF REMITTANCES TO INDIA l 103
Conclusion
We have analyzed the trends in remittances to India and assessed the impact of the
current global slowdown on the fl ow of remittances there. Accordingly, remittances to
India are found to have increased at a robust rate of 10 percent a year since 1992. Th e
movement of remittances is limited around the trend and has not traditionally been
aff ected by domestic or external macroeconomic variables. Th is pattern has changed
somewhat since the early 2000s, and remittances have responded to movements of
domestic and international interest rates and to price movements in the Indian stock
market. Looking ahead, recent developments in the global economic conditions are not
likely to slow the fl ow of remittances to India even if the current global weaknesses
persist or deteriorate further.
One possible case in which the remittances are likely to slow is if the global con-
ditions make the pool of migrants from India smaller, which is unlikely to happen in
the near term. Th e risk factors in the short run include an increase in interest rates in
advanced countries, a softening of interest rates in India, and a slowdown in the Indian
stock market (resulting in fewer investment opportunities in India).
Notes
1. http://dbie.rbi.org.in/InfoViewApp/listing/main.do?appKind=InfoView&service=%2FInfoVi
ewApp%2Fcommon%2FappService.do.
2. Although a priori the eff ect of growth in the source country on remittances is ambiguous, a
high growth rate is likely to increase the remittances, and a low growth rate may lower the
remittances; on the other hand, if particularly bad economic conditions force migrants to
return to their home countries, then there might be a spurt in remittances as migrants repa-
triate their accumulated savings.
3. As indicated in the World Bank data on bilateral stock of migrants, the Bilateral Migration
Matrix (World Bank 2011b).
4. Th e choice of 2004 is admittedly arbitrary. Similar results are obtained if we allow for a shift
in the relationship starting in other years around 2004.
5. Th e reasons for the resilience of remittances to India are consistent with Ratha, Mohapatra,
and Silwal (2010a): Remittances are sent by the stock of migrants, which is unlikely to be
aff ected in the near term; since these are a small part of the income, remitters even if hit
by the global slowdown will be able to send these; the duration of migration has increased
as the uncertainties regarding being able to return have increased; returnees are remitting
their accumulated savings back home; and the stimulus packages are likely to boost demand
in infrastructure and construction, sectors in which the migrants are extensively employed.

104 l POONAM GUPTA AND KARAN SINGH
Annex
A: Data Sources and Defi nitions
Variable name Defi nition/construction of variable Source
Remittances in constant dollars
Private transfers on current account in dollars, CPI for United States for real values
RBI website
LIBOR 3-month LIBOR in dollars IFS
Lending rate Lending rates minus infl ation rate based on CPI for India
IFS
Asian crisis Dummy takes a value of 1 for the quarters in which crisis occurred in Asia (1997 Q3–4 through 1998 Q1–2); constructed using exchange rate data
IFS
Oil prices Oil prices in constant dollars IFS
Stock price index, India Index in constant Indian rupees: nominal index defl ated by CPI for India
IMF, IFS
Stock price index, United States Index in constant dollars IMF, IFS
Exchange rate Exchange rate with respect to dollar IMF, IFS
Political uncertainty Dummy = 1 in the quarters during which the central government resigned midterm
Gordon and Gupta (2004), updated
GDP growth rate Calculated using annual data Central Statistical Offi ce and IFS, IMF
U.S. growth rate IMF, IFS
Source: Authors.
Note: CPI = consumer price index; IFS = Indian Foreign Service; IMF = International Monetary Fund; RBI = Reserve Bank of India.
B: Construction of Dummies to Include Nonlinearities
We construct dummies for the periods when diff erent variables assume extreme values.
Th us we defi ne a dummy that takes a value equal to 1 when the Indian growth rate is
less than 3 percent and 0 otherwise, and another dummy that takes a value of 1 when
the Indian growth rate exceeds 7 percent and 0 otherwise. Similarly we defi ne dummies
for the quarters when the U.S. growth rate is high or very low. Th us we defi ne a dummy
that takes a value of 1 when the U.S. growth rate exceeds 4 percent and 0 otherwise, and
another dummy with a value of 1 when the U.S. growth rate is below 1 percent and 0
otherwise.

7. TRENDS AND CORRELATES OF REMITTANCES TO INDIA l 105
We also defi ne dummies for large appreciations and large depreciations in the rupee-
dollar exchange rate. Th e dummy for the large appreciation takes a value of 1 when in a
quarter the exchange rate appreciates by at least 2 percent and 0 otherwise; the dummy
for large depreciation takes a value of 1 when the depreciation exceeds 2.5 percent and
0 otherwise.
As in Gupta (2006) we defi ne a dummy for a year of bad agricultural production.
Th is dummy takes a value of 1 when the agricultural production growth is negative and
0 otherwise.
We also include dummies for large increases or decreases in oil prices. Th us a dummy
for large increases in oil prices takes a value of 1 when the oil price increase exceeds
10 percent and 0 otherwise, and another dummy takes a value of 1 when the oil prices
decrease by at least 10 percent and 0 otherwise.
C: Correlation Coeffi cients between Explanatory Variables
Variable
GDP growth India
GDP growth United States
U.S. share price index
Indian share price index
Gas price index
Exchange rate
Lending rate India
GDP growthUnited States
0.26(0.03)
1
U.S. shareprice index
−0.10(0.42)
0.60(0.00)
1
Indian shareprice index
0.37(0.00)
−0.03(0.82)
−0.45(0.00)
1
Gas priceindex
0.25(0.03)
0.03(0.78)
−0.36(0.00)
0.68(0.00)
1
Exchangerate
−0.34(0.00)
0.12(0.30)
0.65(0.00)
−0.85(0.00)
−0.74(0.00)
1
Lending rateIndia
−0.08(0.48)
0.04(0.71)
0.27(0.02)
−0.17(0.14)
0.26(0.02)
0.16(0.17)
1
LIBOR 0.11(0.34)
0.10(0.38)
0.43(0.00)
0.12(0.33)
−0.31(0.01)
0.22(0.06)
−0.19(0.10)
Note: Each entry in each cell refers to the correlation coeffi cient, and the entry below in parentheses is the p value with which the hypothesis that the correlation is equal to zero can be rejected. The correlation has been calculated by fi rst regressing each variable on a trend and quarterly dummies and taking the residuals.


107
Chapter 8
Shocks Affecting the Flow and Stability of Workers’ Remittances to India
BHUPAL SINGH
Workers’ remittances are generally known to be countercyclical and in the
Indian context they have provided stability to the current account balance of the bal-
ance of payments (BOP).1 Compared with other forms of cross-border fl ows, migrant
remittances are less likely to be procyclical, which makes them a relatively stable
source of external fi nance. Th is nature of remittances was evident during 1998–2001,
a period characterized by a decline in private capital fl ows to developing countries in
the wake of the Asian fi nancial crisis. Given the stability and resilience of workers’
remittances, many developing countries are taking measures to further attract such
infl ows.
Th e surge in migrant workers’ remittances during the 1980s, responding to the
oil boom in the Middle East and during the 1990s to the new wave of the informa-
tion technology revolution, has placed India among the highest remittance-receiving
countries and provided considerable resilience and sustainability to India’s BOP. Poli-
cies to improve banking access and the technology of money transfers have also helped
increase the fl ow of remittances and promoted their transfer through formal channels
(B. Singh 2010). Numerous regulatory measures have also been undertaken in India to
facilitate institutional development for wider access to remittance services, enhancing
competition by entry of private money transfer agencies in the market and easing of
documentary requirements for small-value remittance transactions. Regulatory mea-
sures also aim to bring transparency in the operations of entities dealing with the remit-
tance transfer business. In fact, competition and transparency are critical to bringing
down the costs at the recipients’ end.

108 l BHUPAL SINGH
Th is chapter begins with an assessment of the structural shifts in remittance infl ows
from abroad. Th en the stability of workers’ remittances is examined. Th ird, shocks
aff ecting workers’ remittances are studied using an error correction model. Finally, con-
clusions and policy implications are presented.
Structural Shifts in Remittance Infl ows
Two clear structural shifts in remittance fl ows in India can be identifi ed: (1) in the early
1980s following the oil price boom in the Gulf countries and the export of unskilled and
semiskilled labor from India and (2) in the mid-1990s, coinciding with the new wave of
migration of skilled labor in technology-related sectors. Second, the microstructure of
the remittance mechanism shows that in the current decade the share of remittances
repatriated through the route of the “local withdrawals” from nonresident Indian (NRI)
deposits has risen vis-à-vis the remittances transferred for “family maintenance” (fi g-
ure 8.1). In the case of the former, the infl ows to NRI rupee deposits are subsequently
domestically withdrawn by the NRIs or their dependents for local expenditures. Th us,
whereas in the “fi rst leg” of infl ow, funds remitted form part of NRI deposits, in the
“second leg” the funds are withdrawn locally and become unilateral transfers.2
FIGURE 8.1 Structure of Workers’ Remittances to India, 1975–2010
05,000
15,000
25,000
35,000
45,000
55,000
1975–76 1981–82 1987–88 1993–94 1999–2000 2005–06
$, m
illio
ns
Personal gifts and donations tocharitable/religious institutions
Local withdrawal fromNRI deposits
Inward remittances forfamily maintenance
Sources: Invisibles in India’s Balance of Payments, Reserve Bank of India Monthly Bulletin, various issues.
Th is structural change in the channels of remittance transfer seems to suggest that
a larger share of remittances could be aff ected by the motives of domestic investment
rather than consumption by the dependent households. Th ird, unlike capital fl ows,
remittances have emerged as a relatively stable source of fi nancing because these are
found to be relatively less sensitive to interest rate changes and have a strong “home

8. SHOCKS AFFECTING THE FLOW AND STABILITY OF REMITTANCES TO INDIA l 109
bias.” Fourth, gold brought home by returning Indians, which used to be an important
conduit of remittances by the workers, particularly from the Gulf countries, lost its rel-
evance since the liberalization of gold import policy in the mid-1990s. Th e government
permitted imports of gold by certain nominated agencies for sale to jewelry manufac-
turers, exporters, NRIs, holders of special import licenses, and domestic users. Nomi-
nated agencies and banks were permitted to import gold under diff erent arrangements
such as suppliers and buyers credit basis, consignment basis, and outright purchases.
Fifth, since the mid-1990s, the source regions of remittances have increasingly shifted
from the traditional remitters, the Gulf countries, to the host of the new wave of migra-
tion in information technology, the United States.
Historical trends in workers’ remittances to India suggest that remittance infl ows
attained signifi cance in India’s BOP in response to the oil boom in the Middle East.
Th e infl ows have also been aided by policy measures to foster the use of formal chan-
nels for remitting funds with key measures such as the market-determined exchange
rate, current account convertibility, liberalization of capital account, speedier process-
ing of remittance transfers through bank branches, and eff orts to expand the outreach
of remittance services to remote locations. As these factors had considerably reduced
incentives for hawala transfers, offi cially recorded infl ows rose. Th e incentives by the
banking system to attract remittances from overseas Indians in the form of deposits
include numerous deposit schemes. In the 1970s, the two oil shocks shifted substan-
tial resources toward oil-exporting countries, which provided investment and employ-
ment opportunities in the oil-rich countries. Th e Reserve Bank devised specifi c deposit
schemes to tap the savings of NRIs employed in these countries. Special schemes for
NRIs were initiated in February 1970 with the introduction of the Non-Resident Exter-
nal Rupee Account. Th is was followed by foreign currency–denominated schemes.
Since the 1990s, the policy with respect to the nonresident deposit schemes has been
to retain the attractiveness of these schemes to maintain capital fl ows from abroad, while
at the same time reducing the eff ective cost of borrowing in terms of interest outgo and
cost to macroeconomic management. In line with these objectives, although the inter-
est rates on these deposits have been gradually deregulated, the reserve requirements
and, in the recent period, interest rate ceilings have been fi ne-tuned in relation to capital
fl ow cycles. Th e cumulative impact of these factors is refl ected in a structural break in
the infl ows of workers’ remittances to India that occurred after 1990–91, broadly mir-
roring the new wave of migration to technology-related sectors in developed countries.3
Th e economic boom following the oil price shocks of the 1970s and the 1980s cre-
ated sustained demand for labor in the oil-rich regions of West Asia and North Africa,
particularly in the petroleum and construction sectors. Th erefore, the major outfl ow of
emigrant workers from India in the last few decades shifted in favor of the Gulf coun-
tries. Indian migrant labor in the Gulf countries is estimated to number above 3 million
with 70 percent as semiskilled and unskilled workers and 20–30 percent as profession-
als. Most migrants to the Middle East countries are temporary workers who return
to India after the expiration of their contractual employment. Th e changing pattern of
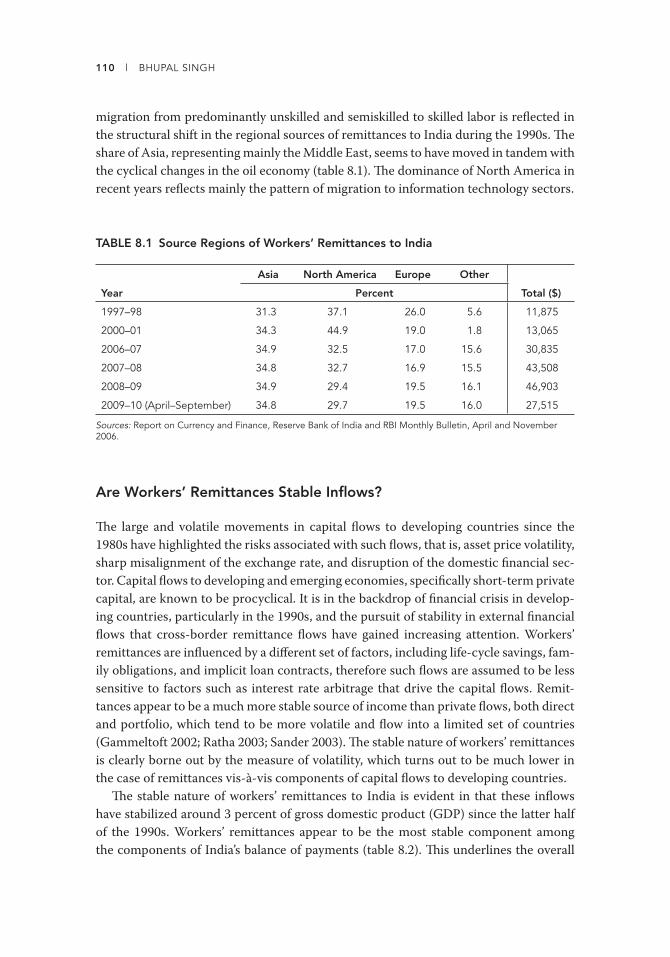
110 l BHUPAL SINGH
migration from predominantly unskilled and semiskilled to skilled labor is refl ected in
the structural shift in the regional sources of remittances to India during the 1990s. Th e
share of Asia, representing mainly the Middle East, seems to have moved in tandem with
the cyclical changes in the oil economy (table 8.1). Th e dominance of North America in
recent years refl ects mainly the pattern of migration to information technology sectors.
TABLE 8.1 Source Regions of Workers’ Remittances to India
Year
Asia North America Europe Other
Total ($)Percent
1997–98 31.3 37.1 26.0 5.6 11,875
2000–01 34.3 44.9 19.0 1.8 13,065
2006–07 34.9 32.5 17.0 15.6 30,835
2007–08 34.8 32.7 16.9 15.5 43,508
2008–09 34.9 29.4 19.5 16.1 46,903
2009–10 (April–September) 34.8 29.7 19.5 16.0 27,515
Sources: Report on Currency and Finance, Reserve Bank of India and RBI Monthly Bulletin, April and November 2006.
Are Workers’ Remittances Stable Infl ows?
Th e large and volatile movements in capital fl ows to developing countries since the
1980s have highlighted the risks associated with such fl ows, that is, asset price volatility,
sharp misalignment of the exchange rate, and disruption of the domestic fi nancial sec-
tor. Capital fl ows to developing and emerging economies, specifi cally short-term private
capital, are known to be procyclical. It is in the backdrop of fi nancial crisis in develop-
ing countries, particularly in the 1990s, and the pursuit of stability in external fi nancial
fl ows that cross-border remittance fl ows have gained increasing attention. Workers’
remittances are infl uenced by a diff erent set of factors, including life-cycle savings, fam-
ily obligations, and implicit loan contracts, therefore such fl ows are assumed to be less
sensitive to factors such as interest rate arbitrage that drive the capital fl ows. Remit-
tances appear to be a much more stable source of income than private fl ows, both direct
and portfolio, which tend to be more volatile and fl ow into a limited set of countries
(Gammeltoft 2002; Ratha 2003; Sander 2003). Th e stable nature of workers’ remittances
is clearly borne out by the measure of volatility, which turns out to be much lower in
the case of remittances vis-à-vis components of capital fl ows to developing countries.
Th e stable nature of workers’ remittances to India is evident in that these infl ows
have stabilized around 3 percent of gross domestic product (GDP) since the latter half
of the 1990s. Workers’ remittances appear to be the most stable component among
the components of India’s balance of payments (table 8.2). Th is underlines the overall

8. SHOCKS AFFECTING THE FLOW AND STABILITY OF REMITTANCES TO INDIA l 111
signifi cance of remittances as a source of stable fi nancing for developing countries. Sec-
ond, unlike the capital infl ows, there does not seem to be procyclicality in remittance
infl ows to India.
It is sometimes believed that the relative stability of workers’ remittances may be typ-
ically infl uenced by the predominance of local withdrawal in NRI deposits—an indirect
channel of remitting funds by migrant workers, which could be infl uenced by invest-
ment motives. Numerous developing economies mobilize a part of their resources
through special deposit schemes designed for nonresidents. Such schemes have been
successful in countries with a large expatriate population such as Egypt, Greece, Israel,
Lebanon, Pakistan, Spain, Sri Lanka, Th ailand, Turkey, and some Eastern European
countries. Most of these countries have instituted deposit schemes denominated in
foreign currency as well as local currency. Th ese deposit schemes are also designed to
attract remittances from overseas workers. As the NRI deposits have been an important
route for remittance repatriation to India, the infl ows under such deposits are perceived
as signaling the pace of future remittances. Th e empirical evidence, however, is contrary
to the perception that a higher share of local withdrawal may have led to higher volatil-
ity in remittance infl ows to India because of the perceived belief that local withdrawals
may be infl uenced by interest rate movements (table 8.3). Th e available body of litera-
ture on the role of the interest rate and exchange rate diff erential in causing movement
in workers’ remittance infl ows also seems to be inconclusive.4
TABLE 8.2 Relative Volatility of Workers’ Remittance Infl ows to India
coeffi cient of variation (%)
Item 1970s 1980s 1990s 2000s
Current account
Merchandise exports 46.8 24.9 27.9 53.2
Merchandise imports 54.1 17.3 32.9 62.9
Services exports 66.6 14.5 48.5 62.5
Services imports 59.3 28.2 44.6 52.7
Workers’ remittances 97.6 7.3 49.3 49.5
Capital account
Foreign investment 112.6 30.8 69.8 84.7
FDI — — 79.6 88.7
Portfolio — — 87.4 144.3
External aid 126.3 32.0 48.5 347.2
Overseas commercial borrowings 78.9 61.4 87.9 145.4
Nonresident Indian deposits 120.3 73.4 67.7 67.1
Source: Author’s calculations.
Note: FDI = foreign direct investment.

112 l BHUPAL SINGH
TABLE 8.3 Volatility in the Components of Workers’ Remittances to India
coeffi cient of variation (%)
PeriodTotal workers’ remittances
Inward remittances for family maintenance
Local withdrawals from NRI deposits
1970s–80s 34.2 56.9 44.7
1990s 49.3 101.9 41.6
2000s 49.5 52.8 49.1
Source: Author’s calculations.
Identifying Shocks to Workers’ Remittances
Th e behavior of remittance infl ows to India can be captured by various factors, such as
activity in the host country, wage diff erentials, the exchange rate, numbers of migrants,
and the like. As far as the sources of remittance infl ows are concerned, a signifi cant
share of remittances to India continues to be contributed by infl ows from the oil-
exporting countries of the Middle East. Th e behavior of remittances to India is likely
to be infl uenced by growth patterns in these countries, best represented in the form
of oil prices. Another important source region of remittance infl ows to India that has
emerged in recent years is the United States. Oil prices of oil-exporting countries are
taken as the indicator of economic activity because remittances have predominantly
originated from the Middle East. Th e exchange rate elasticity is found to be signifi cant,
which implies that depreciation in the exchange rate enhances the domestic currency
value of the funds remitted to the recipient in the home country. Some empirical studies
suggest that remittance infl ows are a relatively stable source of external fi nance because
these are less sensitive to interest rates (Gupta 2005; Jadhav 2003; Nayyar 1989). Th e
estimates suggest that interest rate diff erentials may not be signifi cant in determining
remittances, which strengthens the argument that remittances are a stable source of
developmental fi nance.
Based on the literature on the behavior of remittance fl ows, the key determinants of
workers’ remittances to India can be identifi ed as economic activity in the host country
and exchange rate and interest rate diff erentials.5 We make an attempt with alternative
determinants in capturing the behavior of remittance infl ows for the period beginning
with the fi rst quarter of 1988 through the third quarter of 2008, taking into account the
shadow measures of economic activity in the host country (index of Dubai oil price),
real U.S. GDP, exchange rate (rupee-dollar exchange rate), and interest rate diff erential
(diff erential between the yield on 91-day government of India treasury bills and the
six-month London Interbank Off ered Rate [LIBOR] interest rate). Th e data are sourced
from the Handbook of Statistics on Indian Economy and the Monograph on India’s
Balance of Payments, Reserve Bank of India. We use a vector error correction model
because the Johansen cointegration test suggests a single cointegrating vector between
the variables considered (table 8.4).6

8. SHOCKS AFFECTING THE FLOW AND STABILITY OF REMITTANCES TO INDIA l 113
Th e period from the 1970s to the mid-1990s was dominated by remittance infl ows
from the Middle East. No single indicator of real activity is available for the Middle
East countries, and so we use a proxy, the index of oil prices for the Middle East coun-
tries. Th e benchmark estimates of the long-run determinants of workers’ remittances
(Model 1) reveal that the oil price (log Poil), capturing the income eff ect, seems to be
a key factor infl uencing remittance infl ows to India (table 8.5). Alternative estimates
suggest that a 1 percent increase in oil prices leads to a 0.8–1.1 percent increase in
TABLE 8.4 Johansen Cointegration Test
Null hypothesis Alternate hypothesis Trace statistics
Critical value (0.05)
Model 1
Unrestricted cointegration rank test (trace)
r = 0 r = 1 51.20 47.86
r ≤ 1 r = 2 19.38 29.80
Unrestricted cointegration rank test (maximum eigen value)
r = 0 r = 1 31.83 27.58
r ≤ 1 r = 2 13.85 21.13
Model 2
Unrestricted cointegration rank test (trace)
r = 0 r = 1 56.80 47.86
r ≤ 1 r = 2 20.34 29.80
Unrestricted cointegration rank test (maximum eigen value)
r = 0 r = 1 36.46 27.58
r ≤ 1 r = 2 12.64 21.13
Source: Author’s calculations.
TABLE 8.5 Long-Run Cointegrating Estimates of Workers’ Remittance Infl ows to India Based on Vector Error Correction Model
Variable Model 1 Model 2
log Poilt−1 1.08 (8.02) 0.76 (5.37)
log ERINR/USDt− 0.97 (2.76) —
RTB91D-LIBOR6Mt−1 0.15 (4.19) 0.11 (7.13)
log YUSt−1 — 2.50 (5.50)
Constant 0.08 18.37
R2 0.46 0.46
Source: Author’s calculations.
Note: Dependent variable: workers’ remittances to India (log RMT). Figures in parentheses are t-statistics.

114 l BHUPAL SINGH
remittance infl ows to India. Th e responsiveness of remittances to the fi nancial vari-
ables, that is, exchange rate (log ERINR/USD) and interest rate diff erentials (RTB91D-LIBOR6M),
is also found to be signifi cant.7 Th is implies that a depreciation of the rupee against the
dollar enhances the domestic currency value of funds received by the benefi ciaries in
India and hence provides arbitrage for higher infl ows.
Th e signifi cant response of remittances to the interest rate diff erential—a measure of
arbitrage—could be attributed to the fact that a large part of remittance infl ows is in the
form of local withdrawals from NRI deposits. It has been argued that the overall behav-
ior of workers’ remittances may be infl uenced by interest rate diff erentials in the Indian
case because the funds locally withdrawn from NRI deposits may be more infl uenced
by interest rate movements (Jadhav and Singh 2006).
Recognizing the United States as an emerging source of remittance infl ows to India
in recent years, we estimate Model 2 considering both the economic activity in the Mid-
dle East (log Poil) and the United States (log YUS). It can be observed that the response of
remittances to the level of activity in the United States seems to be higher than that of
the Middle East countries, refl ecting the altering dynamics of the remittance infl ows to
India. Although a unit change in oil prices leads to a 0.8 percent change in remittance
infl ows to India, the impact of a unit change in the real income in the United States
leads to a 2.5 percent increase in remittance infl ows to India. Th e relatively high impact
of a change in the real incomes in the United States on remittance infl ows to India
could be attributed to a high level of per capita income of the Indian migrants working
in information technology–related areas and fi nancial services and investment motives
of the migrants.
Given the above long-run cointegration relation, the short-run response of the vari-
ables to the error correction term, that is, the deviation of remittance infl ows from long-
run trajectory, is presented in table 8.6. Th e coeffi cient of the error correction term in
the error correction equation of log RMT suggests that there is an adjustment to devia-
tion from the long-run path of remittances in about two and a half to four quarters. Th is
also underlines relative stability in workers’ remittances to India.
TABLE 8.6 Error Correction: Short-Run Dynamics
Variable Model 1 Model 2
Δ(log RMT) −0.25 (−4.38) −0.44 (−4.94)
Δ(log YUS) — 0.0 (0.96)
Δ(log Poil) 0.05 (1.20) −0.03 (−0.39)
Δ(rdiff) 0.62 (1.90) 0.65 (1.30)
Δ(log EXR) 0.01 (0.59) —
R2 0.48 0.46
Source: Author’s calculations.
Note: Figures in parentheses are t-statistics. — = not included in the model.
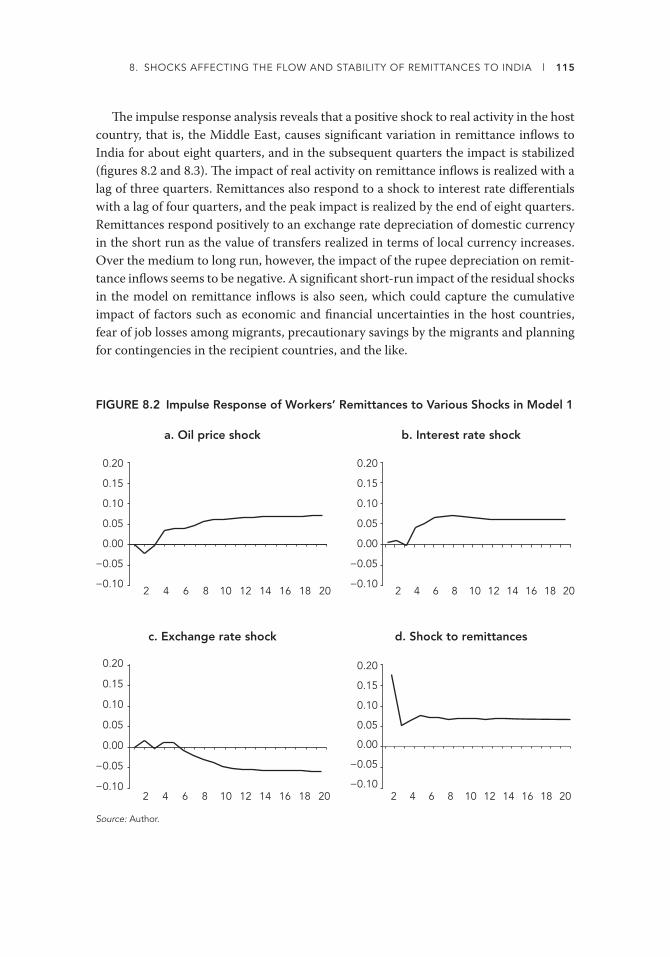
8. SHOCKS AFFECTING THE FLOW AND STABILITY OF REMITTANCES TO INDIA l 115
Th e impulse response analysis reveals that a positive shock to real activity in the host
country, that is, the Middle East, causes signifi cant variation in remittance infl ows to
India for about eight quarters, and in the subsequent quarters the impact is stabilized
(fi gures 8.2 and 8.3). Th e impact of real activity on remittance infl ows is realized with a
lag of three quarters. Remittances also respond to a shock to interest rate diff erentials
with a lag of four quarters, and the peak impact is realized by the end of eight quarters.
Remittances respond positively to an exchange rate depreciation of domestic currency
in the short run as the value of transfers realized in terms of local currency increases.
Over the medium to long run, however, the impact of the rupee depreciation on remit-
tance infl ows seems to be negative. A signifi cant short-run impact of the residual shocks
in the model on remittance infl ows is also seen, which could capture the cumulative
impact of factors such as economic and fi nancial uncertainties in the host countries,
fear of job losses among migrants, precautionary savings by the migrants and planning
for contingencies in the recipient countries, and the like.
FIGURE 8.2 Impulse Response of Workers’ Remittances to Various Shocks in Model 1
a. Oil price shock b. Interest rate shock
−0.10
−0.05
0.00
0.05
0.10
0.15
0.20
2 4 6 8 10 12 14 16 18 20−0.10
−0.05
0.00
0.05
0.10
0.15
0.20
2 4 6 8 10 12 14 16 18 20
−0.10
−0.05
0.00
0.05
0.10
0.15
0.20
2 4 6 8 10 12 14 16 18 20−0.10
−0.05
0.00
0.05
0.10
0.15
0.20
2 4 6 8 10 12 14 16 18 20
c. Exchange rate shock d. Shock to remittances
Source: Author.

116 l BHUPAL SINGH
FIGURE 8.3 Impulse Response of Workers’ Remittances to Various Shocks in Model 2
a. Oil price shock b. Interest rate shock
−0.05
0.00
0.05
0.10
0.15
0.20
2 4 6 8 10 12 14 16 18 20−0.05
0.00
0.05
0.10
0.15
0.20
2 4 6 8 10 12 14 16 18 20
−0.05
0.00
0.05
0.10
0.15
0.20
2 4 6 8 10 12 14 16 18 20−0.05
0.00
0.05
0.10
0.15
0.20
2 4 6 8 10 12 14 16 18 20
c. Shock to U.S. GDP d. Shock to remittances
Source: Author.
Estimates from Model 1 show that shocks to remittances explain the largest share of
the fl uctuations in remittance infl ows to India in the short run; their impact, however,
fi zzles out over the long run (table 8.7). Shocks to real activity in the Middle East emerge
as an important driver of fl uctuations in remittance infl ows to India in the medium
to long run. Interest rate diff erentials between the remittance-sending and -receiving
countries also signifi cantly aff ect the remittance infl ows in the medium to long run.
Th e variance decomposition analysis based on Model 2 reiterates the results of
impulse responses that shocks to remittances explain mainly short-run behavior of
remittances. Th e medium to long-run behavior is, however, explained by the level of
real activity in the host countries. Model 2 captures the impact of real activity in another
important source region of remittances, the United States. Th e aggregate impact of real
activity in both the Middle East and the United States emerges as the most dominant
factor explaining remittance infl ows to India. Interest rate diff erentials also explain a
signifi cant part of fl uctuations in remittance infl ows to India. Th is could be attributed
to the investment motive of migrants sending remittances.
Figure 8.4 reveals that although remittance infl ows from overseas migrants to India
has witnessed some cyclical slowdown since the third quarter of 2008 because of
subdued economic activity in the United States and the Gulf countries, a signifi cant
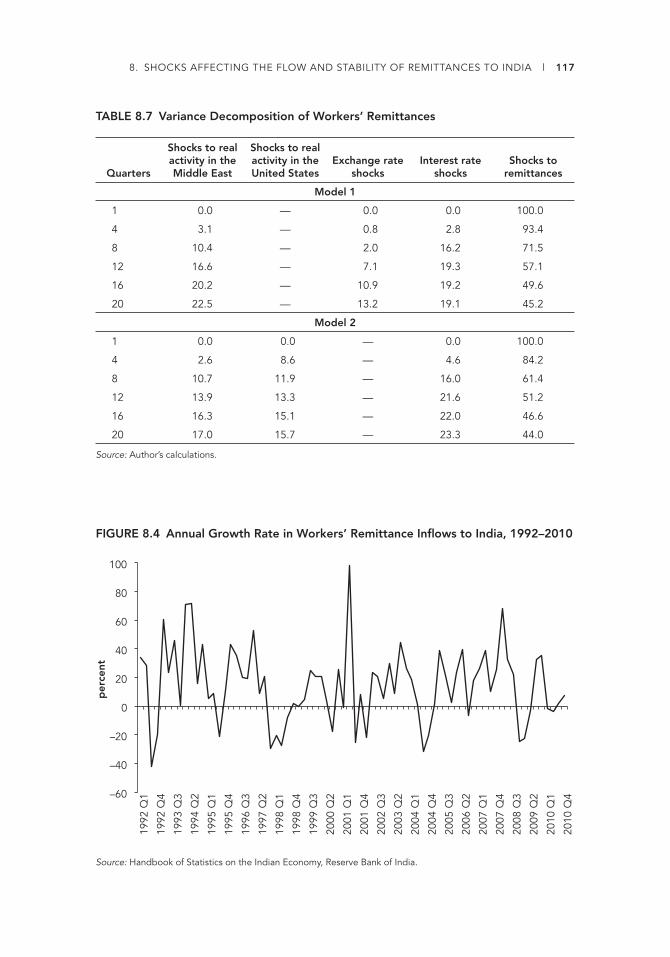
8. SHOCKS AFFECTING THE FLOW AND STABILITY OF REMITTANCES TO INDIA l 117
TABLE 8.7 Variance Decomposition of Workers’ Remittances
Quarters
Shocks to real activity in the Middle East
Shocks to real activity in the United States
Exchange rate shocks
Interest rate shocks
Shocks to remittances
Model 1
1 0.0 — 0.0 0.0 100.0
4 3.1 — 0.8 2.8 93.4
8 10.4 — 2.0 16.2 71.5
12 16.6 — 7.1 19.3 57.1
16 20.2 — 10.9 19.2 49.6
20 22.5 — 13.2 19.1 45.2
Model 2
1 0.0 0.0 — 0.0 100.0
4 2.6 8.6 — 4.6 84.2
8 10.7 11.9 — 16.0 61.4
12 13.9 13.3 — 21.6 51.2
16 16.3 15.1 — 22.0 46.6
20 17.0 15.7 — 23.3 44.0
Source: Author’s calculations.
FIGURE 8.4 Annual Growth Rate in Workers’ Remittance Infl ows to India, 1992–2010
per
cent
–60
–40
–20
0
20
40
60
80
100
1992
Q1
1992
Q4
1993
Q3
1994
Q2
1995
Q1
1995
Q4
1996
Q3
1997
Q2
1998
Q1
1998
Q4
1999
Q3
2000
Q2
2001
Q1
2001
Q4
2002
Q3
2003
Q2
2004
Q1
2004
Q4
2005
Q3
2006
Q2
2007
Q1
2007
Q4
2008
Q3
2009
Q2
2010
Q1
2010
Q4
Source: Handbook of Statistics on the Indian Economy, Reserve Bank of India.

118 l BHUPAL SINGH
deceleration in remittance infl ows was witnessed in the fourth quarter of 2008, which
continued until the second quarter of 2009. First, oil prices declined from their peak lev-
els, which signifi cantly aff ected activity in the Middle East region, a signifi cant source
of remittances to India. Second, the sharp decline in real activity in the United States
along with associated uncertainties seems to have also adversely aff ected remittance
infl ows to India. Th e model estimates suggest a signifi cant impact of real activity shock
on remittances, and so it is expected that economic shocks in the host countries could
have signifi cantly aff ected remittance infl ows to India. Th e momentum in remittances,
however, was maintained in the subsequent period, though with some stagnation in
2010. Jha and colleagues (2010) suggest that although remittance infl ows to developing
countries in Asia have slowed in response to the global fi nancial crisis, they have not
experienced a sharp drop. Th ey further argue that we are unlikely to see the growth in
remittances experienced during the last two decades given that an important share of
that growth was due to better recording of remittances and an increased use of wire
transfers on the part of migrants.
Empirical evidence suggests that the predominant portion of the cross-border remit-
tances received by Indian households are utilized for family maintenance (61 percent),
that is, to meet the requirements of migrant families for food, education, health, and the
like (Reserve Bank of India 2010). On average, about 20 percent of the funds received
are deposited in bank accounts, and about 4 percent of the funds received are invested
in land, property, and equity shares. It might be possible that a slowdown in remittance
infl ows to India may have aff ected the consumption of households to the extent they are
dependent on remittances for sustenance. As more than half of remittances received are
for family maintenance, the possibility exists of a consumption eff ect.
Conclusion
A structural shift in remittance infl ows from migrant Indians occurred in the early
1980s following the oil price boom in the Gulf countries and migration of unskilled and
semiskilled labor from India. Th is was followed by another structural shift in the mid-
1990s, coinciding with the new wave of migration of skilled labor in the information
technology–related sectors. Empirical estimates suggest inherent stability in remittance
infl ows to India in the medium to long run, and they emerge as the least volatile compo-
nent of India’s BOP and a stable source of external fi nance.
Shocks to real activity in the Middle East emerge as an important driver of fl uc-
tuations in remittance infl ows to India in the medium to long run. Interest rate dif-
ferentials between the remittance-sending and -receiving countries also signifi cantly
aff ect the remittance infl ows in the medium to long run, which could be attributed to
the investment motive of migrants sending remittances. Results from alternative mod-
els also reveal that shocks to remittances, indicating uncertainties in the host country
and precautionary savings, could explain mainly the short-run behavior of remittances,

8. SHOCKS AFFECTING THE FLOW AND STABILITY OF REMITTANCES TO INDIA l 119
whereas the medium- to long-run dynamics is explained by the level of real activity in
the host countries of the Middle East and the United States. Th e real activity in both
the Middle East and the United States together emerges as the most dominant factor
explaining remittance infl ows to India. A signifi cant part of the remittance infl ows to
India are utilized for family maintenance, and so the adverse shocks to remittances dur-
ing the recent global fi nancial crisis may have aff ected at-home consumption adversely.
Besides the fundamental factors, transfer cost is also an important factor determin-
ing infl ow of remittances through formal channels. Providers of remittance services
in the formal sector typically charge a fee of 10–15 percent of the principal amount
to handle the small value transfers typically made by migrants (World Bank 2006a).
High fees place a fi nancial burden on the senders and the recipients. Th e elements of
remittance costs typically include an exchange rate, transfer fee, and charges imposed
on domestic delivery. A weak competitive environment in the remittance market, lack
of access to technology-supporting payment and settlement systems, and burdensome
regulatory and compliance requirements all tend to keep fees high. Reducing transac-
tion costs may enhance incentives to remit and signifi cantly increase formal remittance
infl ows. Cost reduction, however, to a large extent depends on the regulations for small-
value transfers and remittance services available in the host country rather than those
of the home country because a predominant portion of the cost is determined by the
remitting bank or fi nancial entity.
Notes
1. Remittances generally rise when the recipient economy suff ers a downturn in activity or
macroeconomic shocks due to fi nancial crisis, natural disaster, or political confl ict. By com-
pensating for foreign exchange losses due to these shocks, remittances may smooth con-
sumption and thus play a part in maintaining the economic stability of recipient countries.
2. Because the funds remitted by NRIs through the above-mentioned channels are analytically
not very diff erent from worker’s remittances, such remittances have been categorized with
worker’s remittances.
3. Th e statistical results on structural breaks in remittance fl ows to India for the sample period
1980–81 to 2010–11 indicate the year of regime change as 1991 with log-likelihood ratio =
67.17.
4. Swamy (1981) found that interest rate diff erentials between the host and the home countries
and exchange rates were not signifi cant variables in aff ecting remittance fl ows. Straubhaar
(1986) also provides empirical support for such observations. Russell (1986), however, argues
that these may not be the threshold level of diff erence that the interest rate and exchange rate
diff erentials have to attain so as to aff ect remittance fl ows. In the Indian case, Nayyar (1989)
argued that repatriated deposits grew at a faster rate in response to interest rate diff erentials
resulting from declining interest rates in international capital markets. Another study in the
Indian case concerning NRI deposit fl ows concludes that the fl ow of NRI deposits responds
positively to the diff erence between interest rates for these deposits and LIBOR (Gordon
and Gupta 2004).

120 l BHUPAL SINGH
5. Workers’ remittances are recognized to be determined by the migrants’ educational level,
income, and motivation to transfer the accumulated capital for investment in the home
country (Brown 1997). Th e empirical literature does not seem to be unanimous on the deter-
minants of workers’ remittances. Th e time series data on demographic characteristics of
migrants are not available in the Indian context.
6. Th e robustness of the estimates is calibrated through diagnostic tests such as the Lagrange
Multiplier test for serial correlation among the residuals and the Normality test, which indi-
cate that the residuals do not have serial correlation and are multivariate normal.
7. In the Indian context, some empirical studies suggest that remittance infl ows are less sensi-
tive to interest rates (Gupta 2005; Jadhav 2003).

121
Chapter 9
Migrant Remittances in Nepal:Impact of Global Financial Crisis andPolicy Options
SANKET MOHAPATRA, DILIP RATHA, AND ANI SILWAL
Migration and remittances in nepal have grown in size and importance in recent
decades. Given its small size, relative lack of diversifi cation, and rising pressures on
domestic labor markets, migration will continue to be a crucial part of Nepal’s develop-
ment strategy. It is therefore important to understand how these fl ows can be managed
better and which policies can improve their development impact. Bringing remittances
into formal banking channels and mobilizing remittances for savings and investment
remain some of the key challenges for Nepal.
Between 2 and 5 million Nepalese, out of a population of 30 million, are believed
to be living abroad, with a large number in India. Nepal has seen a boom in migration
since the mid-1990s, primarily to Gulf Cooperation Council (GCC) countries and East
Asia. Offi cial data on new deployments show that new migration to destinations out-
side India fell briefl y during the fi nancial crisis before recovering quickly.
Remittances sent by these migrants are the most important source of external fi nance
for Nepal’s economy. Offi cially recorded remittances are estimated to have reached
$3.5 billion in 2010. Remittances are larger than other sources of foreign exchange such
as exports, offi cial development assistance, and tourism revenues. Th ese fl ows are an
Th is chapter—a product of the joint Migration and Remittances Unit of the Development Prospects Group, Development
Economics Vice Presidency, and Poverty Reduction and Economic Management Network—was prepared as a background
paper for the World Bank’s country team for Nepal. We gratefully acknowledge extensive discussions with Hisanobu Shishido.
122 l SANKET MOHAPATRA, DILIP RATHA, AND ANI SILWAL
important source of income for many households and have been associated with a sig-
nifi cant reduction in poverty. Remittances have also helped fi nance Nepal trade defi cit
over the last decade. With the onset of the fi nancial crisis, remittances to Nepal deceler-
ated in 2009 to 9.5 percent from a staggering growth of 57.3 percent in 2008, but grew
by 17.7 percent in 2010 (Mohapatra and Ratha 2010).
Nepal’s remittance market appears relatively effi cient in the delivery of remittances,
with many international and local money transfer operators (MTOs), banks, and other
institutions providing remittance services, even in remote regions of Nepal. Although
a majority of people do not have accounts with commercial banks, banks typically act
as distributors of remittances for MTOs, and very few Nepalese banks actively promote
fi nancial products such as savings and deposit accounts, home loans, and health and
life insurance to remittance senders or recipients. Th e lack of valid documentation of
migrants in the host countries and consequent lack of access to bank accounts and lack
of bank branches near benefi ciaries are some of the impediments to the use of formal
remittance channels.
Th is chapter provides an overview of migration and remittance trends in Nepal and
suggests policy options to reduce costs, increase competition, and foster use of formal
remittance channels. Many of these lessons are drawn from experiences of other migrant
origin and destination countries. Th e chapter is organized as follows. Th e next section
outlines recent trends in migration and remittances and the impact of the fi nancial
crisis on these fl ows. Th e third section provides an overview of the remittance market
in Nepal. Th e fourth section suggests policy options for improving remittance markets.
Th e fi fth section discusses leveraging remittances for improving capital market access
through remittance securitization and diaspora bonds. Th e sixth section discusses mea-
sures to improve migration policies and institutions. Th e fi nal section concludes.
Migration and Remittances in Nepal and the Impact of the Financial Crisis
Migration has historically been important to the Nepalese economy. Most migrants
traditionally went to India in search of employment. Th is has changed in recent years,
with migrants going to GCC and East Asian countries. Th e number of migrants has
also increased dramatically. Th is change in the number and destination of migrants has
made remittances to Nepal more linked to the global economy.
Migration Trends
Migration is an important feature of the Nepalese economy. Between 2 and 5 million
Nepalese, out of a population of 30 million, are currently believed to be living abroad.
Th is is much higher than offi cial fi gures. A large share of this migration is to neighboring
India with whom Nepal shares an open border; these migrants are largely unrecorded

9. MIGRANT REMITTANCES IN NEPAL l 123
in offi cial statistics. Nepal’s 2001 population census estimated that more than 760,000
Nepalese (10 percent of men and 1.2 percent of women) were living abroad in 2000.
More than 1 million Nepalese were working abroad in countries other than India in
2004 (World Bank 2006c). Unoffi cial estimates of the number of Nepalese migrants
range from 400,000 in Malaysia, 300,000 in Qatar, and 60,000–70,000 in the Republic of
Korea to 1–4 million in India.1 Some 125,000–275,000 Nepalese migrants are estimated
to be working in the United Arab Emirates, of which half are in construction, hospital-
ity, tourism, and security. Although the majority of Nepalese migrants are in India, no
offi cial data exist on migration to or remittances from India. A signifi cant number of
undocumented Nepalese migrants are found in some countries, with Japan estimated
to have 20,000–30,000 such migrants.
Nepal has seen a boom in migration since the mid-1990s. Offi cially recorded new
migration fl ows to countries outside South Asia increased dramatically during the last
decade, from 36,000 in 1999–2000 to 294,000 in 2009–10 (fi gure 9.1).2 Almost all new
work-related migration is to GCC countries and East Asia.3 Th e six GCC countries
together accounted for more than three-quarters of new migration from Nepal in fi scal
year 2008–09. Of the GCC countries, Qatar was the largest destination with 35 percent
of all new deployments, followed by Saudi Arabia (22 percent), and the United Arab
Emirates (14 percent). Th e other major destination was Malaysia, which accounted for
16 percent of new deployments in fi scal year 2008–09. Malaysia was the largest des-
tination of Nepalese migrants, with a share of 40–50 percent of overall deployments
between 2001–02 and 2005–06, but its share has fallen substantially as new migra-
tion to GCC countries picked up.4 However, this trend reversed in 2010 after Malaysia
increased its hiring of more Nepalese workers.5
FIGURE 9.1 Primary Destinations of Nepalese Migrants, Excluding India, 1999–2000 to 2009–10
tho
usa
nds
of
mig
rant
s
0
50
100
150
200
250
300
1999–2000 2001–02 2003–04 2005–06 2007–08 2009–10
fiscal year
Other
Malaysia
Saudi Arabia
Qatar
United Arab Emirates
Source: Department of Foreign Employment, Government of Nepal.

124 l SANKET MOHAPATRA, DILIP RATHA, AND ANI SILWAL
Household surveys conducted in 1995–96 and 2003–04 also suggest that the desti-
nations of migrants have changed signifi cantly during this period. India’s share in over-
all migration has declined, with the share of international migrants going to countries
other than India increasing from 7 percent in 1995–96 to 31 percent in 2003–04 (World
Bank 2006c). Th e share of offi cially recorded female emigrants was only 3 percent in
fi scal year 2009–10. Many female migrants migrate unoffi cially through India. Th ey
were not allowed to legally migrate for work until 2007. Since most female migrants are
undocumented in the Middle East and elsewhere, the capacity of Nepalese embassies
to help them is limited.
Offi cial data on new deployments show that new migration to destinations other
than India fell since mid-2008 with the onset of the fi nancial crisis. New migrant
deployments peaked in August 2008 and fell signifi cantly in subsequent months, likely
because of a decline in demand for labor in the destination countries. Th e deployment
of migrants from Nepal declined from 25,000 in August 2008 to 11,000 in April 2009.
Deployments fell by 12 percent in fi scal year 2008–09.6 Th is was a sharp slowdown in
new migration compared with a 22 percent increase between fi scal years 2006–07 and
2007–08. Th e number of deployments to Malaysia started falling before the onset of
the current crisis, but the decline accelerated since August 2008. Malaysia’s share of all
fl ows decreased from 20 percent in August 2008 to 7 percent in April 2009 as Malaysia
restricted entry of new immigrants.7 However, this trend reversed in fi scal year 2009–
10, which saw an increase of 34 percent in the number of workers leaving for overseas
destinations, primarily because of a surge in migrants to Malaysia, increasing to 114,000
from 35,000 in the previous fi scal year.8
Migration fl ows to GCC countries have also slowed since the onset of the fi nancial
crisis, with new deployments falling from nearly 19,000 in August 2008 to less than
10,000 in April 2009. Although new migration fl ows declined, they are still positive.
Existing migrants, who usually work overtime, have been forced to work fewer hours
because of the crisis, which is reducing their incomes and their ability to send remit-
tances home.9 Furthermore, no offi cial data on return migration from the Gulf are avail-
able. Anecdotal reports suggest that some Nepalese migrants in the Gulf are staying on
illegally even after losing their jobs, and working without legal status. Th e number of
returns appears to be small so far.
Th e destinations of migration will likely change over time. Th e destinations that could
increase in importance are GCC countries and India because these countries are likely
to need new workers. GCC countries have abundant fi nancial resources to continue
the construction, tourism projects (hotels, resorts, and restaurants), and investments
in infrastructure. For example, Abu Dhabi, one of the seven United Arab Emirates, is
building Khalifa City, which will need 150,000 new workers from abroad. Qatar’s recent
winning bid to host the 2022 World Cup will also mean a surge in construction activity,
improving employment opportunities for migrant workers in the country. India will
remain an important destination, especially for seasonal migration. In the long term,
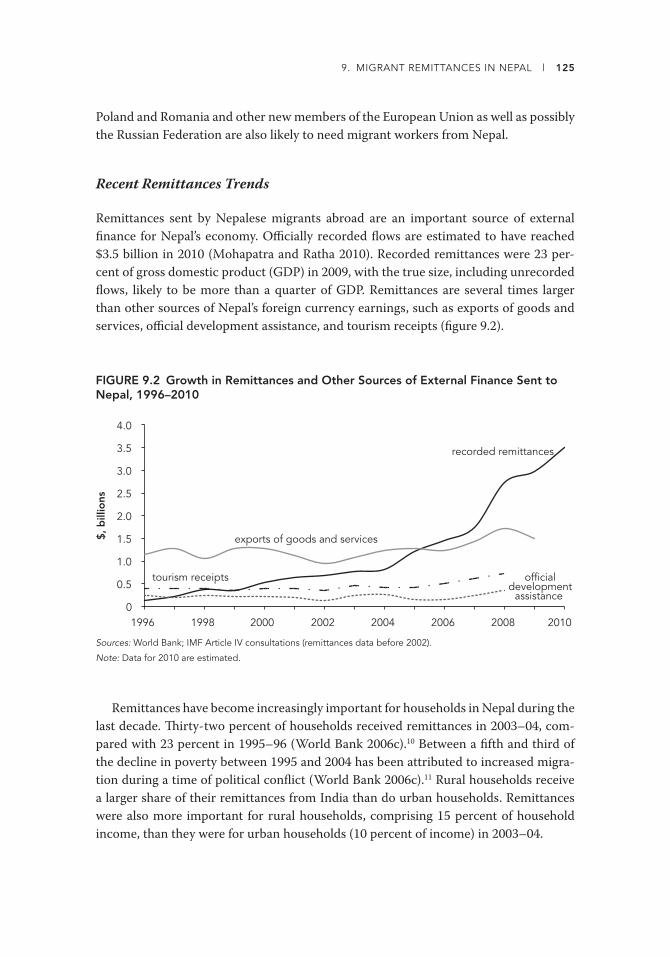
9. MIGRANT REMITTANCES IN NEPAL l 125
Poland and Romania and other new members of the European Union as well as possibly
the Russian Federation are also likely to need migrant workers from Nepal.
Recent Remittances Trends
Remittances sent by Nepalese migrants abroad are an important source of external
fi nance for Nepal’s economy. Offi cially recorded fl ows are estimated to have reached
$3.5 billion in 2010 (Mohapatra and Ratha 2010). Recorded remittances were 23 per-
cent of gross domestic product (GDP) in 2009, with the true size, including unrecorded
fl ows, likely to be more than a quarter of GDP. Remittances are several times larger
than other sources of Nepal’s foreign currency earnings, such as exports of goods and
services, offi cial development assistance, and tourism receipts (fi gure 9.2).
FIGURE 9.2 Growth in Remittances and Other Sources of External Finance Sent to Nepal, 1996–2010
$, b
illio
ns
recorded remittances
0
0.5
1.0
1.5
2.0
2.5
3.0
3.5
4.0
1996 1998 2000 2002 2004 2006 2008 2010
tourism receipts officialdevelopment
assistance
exports of goods and services
Sources: World Bank; IMF Article IV consultations (remittances data before 2002).
Note: Data for 2010 are estimated.
Remittances have become increasingly important for households in Nepal during the
last decade. Th irty-two percent of households received remittances in 2003–04, com-
pared with 23 percent in 1995–96 (World Bank 2006c).10 Between a fi fth and third of
the decline in poverty between 1995 and 2004 has been attributed to increased migra-
tion during a time of political confl ict (World Bank 2006c).11 Rural households receive
a larger share of their remittances from India than do urban households. Remittances
were also more important for rural households, comprising 15 percent of household
income, than they were for urban households (10 percent of income) in 2003–04.

126 l SANKET MOHAPATRA, DILIP RATHA, AND ANI SILWAL
Th e share of remittances sent to Nepal from India relative to other countries decreased
from about 60 percent in 1995–96 to about 30 percent in 2003–04. Remittances from
Qatar, Saudi Arabia, and the United Arab Emirates increased tenfold to 35 percent of
foreign remittances during the same period. Remittance fl ows from GCC countries
are important for countries in South Asia, accounting for a fi fth of total infl ows to the
region in 2008.12 Although oil prices are uncorrelated with remittance outfl ows, the oil-
wealth fueled economic boom in the Gulf resulted in an increase in demand for migrant
labor in the Gulf countries. Anecdotal reports suggest that remittances to Nepal from
the Gulf, Japan, and Korea are substantially higher than those from India. Th e average
remittance sent from India is about Rs. 10,000 per person per year, whereas those from
the Gulf are about Rs. 90,000–100,000 and from Japan and Korea about Rs. 300,000.13
With the onset of the fi nancial crisis, remittance fl ows to developing countries began
to slow signifi cantly in the third quarter of 2008 in response to a deepening global fi nan-
cial crisis.14 Remittance fl ows to developing countries fell by 5 percent in 2009 (Mohapa-
tra and Ratha 2010). Th e fi nancial crisis has led to a signifi cant decline in construction,
hospitality, and other sectors in GCC countries where many South Asian migrants are
employed.15 Growth has also slowed in other destinations of Nepalese migrants such as
India, Korea, and Malaysia. As a result, the growth of remittances to Nepal decelerated
signifi cantly in 2009, although fl ows recovered quickly and grew by 18 percent in 2010
(table 9.1 and fi gure 9.3).
TABLE 9.1 Remittance Flows to South Asia and to Nepal Grew at a Slower Rate during the Global Financial Crisis but Did Not Decline
Country 2007 2008 2009 2010a 2007 2008 2009 2010a
Billions of dollars Growth rate (%)
Developing countries 278.0 325.0 307.0 325.0 23 17 −5 6
South Asia 54.0 72.0 75.0 83.0 27 32 5 10
Nepal 1.7 2.7 3.0 3.5 19 57 9 18
Source: Mohapatra and Ratha 2010.
a. Estimate.
Nepal’s central bank reports that its data collection methodology does not allow it to
identify the source country of remittance infl ows (Irving, Mohapatra, and Ratha 2010).
Th e central bank estimates informal remittance fl ows based on the number of work-
ers who went abroad, workers’ average monthly income, and average duration of stay
(Irving, Mohapatra, and Ratha 2010). To improve data collection the central bank could
require banks and MTOs to provide details on the sources of remittances and collect
remittances data from banks as well as MTOs and Internet money transfers. Because
remittance fl ows through informal channels, especially for India, are a signifi cant share
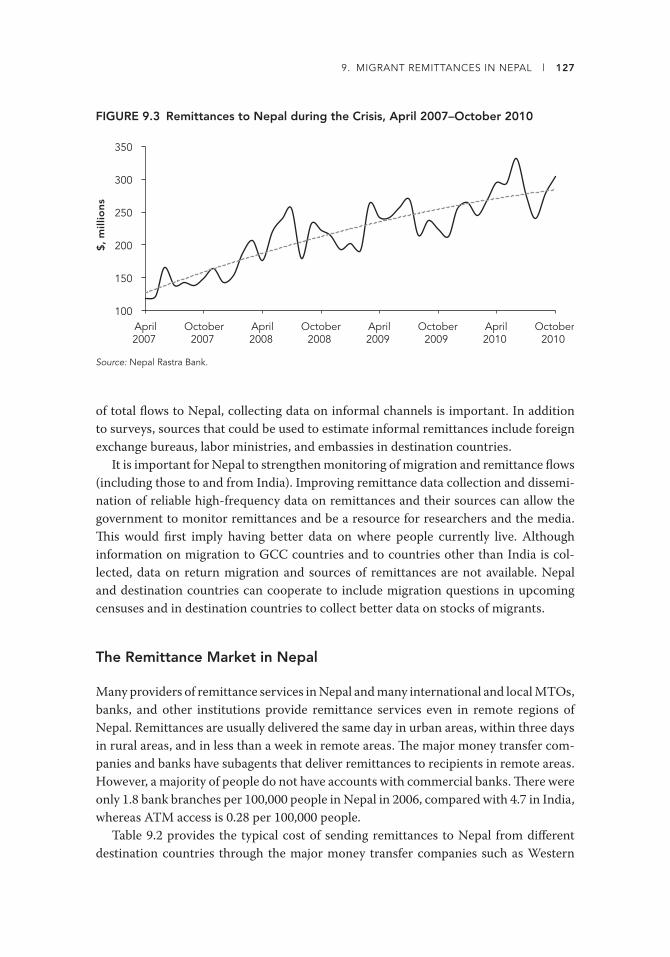
9. MIGRANT REMITTANCES IN NEPAL l 127
of total fl ows to Nepal, collecting data on informal channels is important. In addition
to surveys, sources that could be used to estimate informal remittances include foreign
exchange bureaus, labor ministries, and embassies in destination countries.
It is important for Nepal to strengthen monitoring of migration and remittance fl ows
(including those to and from India). Improving remittance data collection and dissemi-
nation of reliable high-frequency data on remittances and their sources can allow the
government to monitor remittances and be a resource for researchers and the media.
Th is would fi rst imply having better data on where people currently live. Although
information on migration to GCC countries and to countries other than India is col-
lected, data on return migration and sources of remittances are not available. Nepal
and destination countries can cooperate to include migration questions in upcoming
censuses and in destination countries to collect better data on stocks of migrants.
The Remittance Market in Nepal
Many providers of remittance services in Nepal and many international and local MTOs,
banks, and other institutions provide remittance services even in remote regions of
Nepal. Remittances are usually delivered the same day in urban areas, within three days
in rural areas, and in less than a week in remote areas. Th e major money transfer com-
panies and banks have subagents that deliver remittances to recipients in remote areas.
However, a majority of people do not have accounts with commercial banks. Th ere were
only 1.8 bank branches per 100,000 people in Nepal in 2006, compared with 4.7 in India,
whereas ATM access is 0.28 per 100,000 people.
Table 9.2 provides the typical cost of sending remittances to Nepal from diff erent
destination countries through the major money transfer companies such as Western
FIGURE 9.3 Remittances to Nepal during the Crisis, April 2007–October 2010$
, m
illio
ns
100
150
200
250
300
350
April2007
October2007
April2008
October2008
April2009
October2009
April2010
October2010
Source: Nepal Rastra Bank.

128 l SANKET MOHAPATRA, DILIP RATHA, AND ANI SILWAL
Union, MoneyGram, UAE Exchange, Prabhu, and several online remittance providers.
Th ese were obtained from the MTO websites and from “mystery shopping” by call-
ing the agents of these MTOs located in the destination countries. Th ese suggest that
remittance fees, especially for sending remittances from the Middle East and Malaysia,
are in the range of 2–5 percent of the amount, which is signifi cantly lower than the
global average of about 9–10 percent.16 Th e cost for sending money from Korea is sub-
stantially higher.
Online remittance providers such as Muncha.com and Th amel.com provide dedi-
cated money transfer service for Nepalese and are operated by Nepalese diaspora entre-
preneurs. Th ese allow direct deposit into recipients’ bank accounts and physical deliv-
ery of a bank draft to recipients. Th amel even allows migrants to send goods and off ers
mortgages and vehicle and education loans for nonresident Nepalese residing in the
United States in partnership with Kumari Bank. Another provider, International Money
Express, off ers direct deposits to bank accounts in Nepal, with the money transferred
immediately to the partner IME Financial Institution Limited, although it takes longer
to reach other banks.
Nepal’s remittance market appears relatively effi cient in the delivery of remittances,
but several issues are found. No legal requirement exists for money transfer companies
to operate in partnership with commercial banks to receive inward remittances. How-
ever, many Nepalese banks work in de facto or de jure partnerships with major interna-
tional money transfer companies. Banks typically act as distributors of remittances for
MTOs. Very few Nepalese banks actively promote fi nancial products such as savings
and deposit accounts, home loans, and health and life insurance to remittance senders
or recipients. Th is may refl ect relatively low banking penetration, prevailing high levels
TABLE 9.2 Cost of Sending $200 to Nepal, June 2009
$, billions
Transfer service Qatar
United Arab
EmiratesSaudi Arabia Malaysia
Korea, Rep.
United States
United Kingdom
Western Union 4.1 6.8 4.8 4.0 22.0 10.0 8.2
MoneyGram .. 5.5 5.3 5.0 15.0 10.0 16.5
UAE Exchange 5.0 5.5 .. .. .. .. 8.2
Prabhu Money Transfer
.. .. .. 2.8 .. .. ..
Muncha Money Transfer
.. .. .. .. .. 7.0 9.9
Thamel Money Transfera
10.0 10.0 10.0 10.0 10.0 10.0 10.0
Sources: “Mystery shopping” by World Bank staff; www.money.muncha.com; www.thamelremit.com.
Note: Fees do not include exchange rate commission. Remittance fees were converted to dollars using the respective exchange rates on June 24, 2009. .. = negligible.
a. Requires international Visa or MasterCard.
9. MIGRANT REMITTANCES IN NEPAL l 129
of infl ation, and the uncertain macroeconomic environment, which might make Nep-
alese banks unwilling to extend credit to retail borrowers in general, including to non-
resident Nepalese. Microfi nance institutions cannot send or receive remittances but are
allowed only to distribute remittances, acting as subagents of the fi rms authorized to
receive inward remittances. No mobile phone operator in Nepal is authorized to send
or receive remittances.
Th e lack of valid documentation for many Nepalese migrants in the host countries
in Europe, North America, and the Gulf and the consequent lack of access to bank
accounts and lack of bank branches near benefi ciaries are some of the impediments to
the use of formal banking channels for remittances. However, several MTOs already
operate in the destination countries and facilitate remittance transfers from Nepalese
migrants. For example, Prabhu Money Transfer has been allowed to accept deposits in
Malaysia and to operate in several locations in India.
As discussed earlier, a large number of Nepalese migrants live in India. In 2008 the
Reserve Bank of India and the Nepal Rastra Bank collaborated to launch a cross-border
Indo-Nepal remittance service that allows money transfers from any Indian bank to any
Nepalese bank and some designated MTOs. However, the take-up of this service has
been limited. It requires identifi cation documents and proof of residence, which many
Nepalese migrants may not have. Indian banks have very little incentive to off er this
service, partly because of a lack of awareness and partly because of the relatively low fee
structure mandated by the Reserve Bank of India.17
Reducing Remittance Costs and Improving Access to Remittance Services
Th is section discusses policy options to reduce costs, increase competition, and foster
use of formal channels in Nepal, drawing on regional and global experiences. Th ese
include improving remittance data collection and awareness of remittance channels,
reducing remittance costs, enhancing links between remittances and fi nancial access
(by encouraging participation of rural banks, microfi nance institutions, and post
offi ces), fostering use of new mobile money transfer technologies, improving retail pay-
ment systems, balancing anti–money laundering and countering the fi nancing of ter-
rorism concerns with increasing access to money transfers, and leveraging Nepal’s large
remittance infl ows for improving its access to international capital markets.
Allowing more Nepalese banks and MTOs to operate in destination countries would
facilitate remittance fl ows through formal channels. Providing identifi cation (ID) cards to
migrants could facilitate remittance transfers through formal banking channels (World
Bank 2006a).18 Th ese cards would not substitute national passports but would primarily
be used by migrants to access fi nancial and other services in both Nepal and destination
countries. If Nepal wants to introduce ID cards for migrants, it needs to negotiate with
governments of major migrant destination countries to accept these cards. Establishing

130 l SANKET MOHAPATRA, DILIP RATHA, AND ANI SILWAL
appropriate infrastructure in embassies abroad to use the new identifi cation documents
will also be necessary to build timely data on migrants in destination countries.
Improving national and regional retail payment systems for remittance transmission
will reduce transfer costs for businesses and retail customers while fostering new tech-
nologies. Improving retail payment systems for facilitating domestic and cross-border
remittances requires accelerated eff orts to create a national automated clearing and
settlement system for real-time fund transfers. Such a system would reduce the time it
takes for transferring domestic and international remittances and allow linking banks
with point-of-sale devices in retail locations to enable use of debit cards, smart cards,
and mobile devices.
Money transfer can act as an entry point for providing remittance senders and recip-
ients without bank accounts in rural areas other fi nancial products and services, such
as deposits, savings, and credit facilities. Nepal may need to amend existing regulations
to allow these institutions to more fully participate in providing remittance services,
instead of simply distributing remittances for money transfer companies. Microfi nance
institutions may need legal permission to receive foreign exchange. Th ey may also need
access to national clearance and settlement systems.
Post offi ces typically have very strong networks in both urban and rural areas, with
signifi cant potential to reach poor populations. To increase involvement of post offi ces
in remittance services, Nepal needs to extend domestic money order facilities to inter-
national remittances by linking up with post offi ces, banks, and MTOs in destina-
tion countries. Allowing post offi ces in rural areas to off er basic checking and savings
accounts to remittance recipients and others would promote savings out of remittances
received by households. Eliminating exclusive partnerships and encouraging post
offi ces to partner with more money transfer companies or even banks may result in rev-
enue losses in the short term, but these will likely be off set by larger volumes, benefi ting
the postal networks, migrants, and remittance recipients. Encouraging participation of
rural banks and microfi nance institutions in providing remittance services will help to
improve fi nancial access.
New technologies such as mobile companies and smart cards can also provide fast,
convenient, and cheap remittance services within Nepal and help expand fi nancial
access. Post offi ces, microfi nance institutions, and rural banks in Nepal can play an
important role in providing cheap and convenient remittance services. Th ere could be
eff orts within Nepal to encourage banks and fi nance companies to link remittances to
consumer loans, housing loans, and small business investments. Mobile and card-based
remittances are new technologies that have grown rapidly in recent years.
Although use of mobile phones is at a nascent stage in cross-border transfers, mobile
phone and telecom service providers are active in transmitting remittances domesti-
cally in countries such as Kenya, the Philippines, and South Africa. Access to mobile
phones is a recent phenomenon in Nepal, with the fi rst mobile phones distributed in
1999 when 5,000 lines were issued (Nepal Telecom 2009). By 2008, 15 out of every 100
Nepalese had a mobile phone (fi gure 9.4).19

9. MIGRANT REMITTANCES IN NEPAL l 131
FIGURE 9.4 Growth in Mobile Phone Subscriptions in Nepal, 2003–08
num
ber
mill
ions
number of subscriptions(left scale)
number of subscriptions per 100 people(right scale)
0
4
8
12
16
0
1
2
3
4
5
2003 2004 2005 2006 2007 2008
Source: WDI 2009.
Introducing card-based money transfers may be challenging in Nepal given the avail-
ability of ATMs outside major cities. To introduce mobile remittances and card-based
money transfers, Nepal may need to introduce new telecom and fi nancial services regu-
lations to allow mobile phone operators to provide money transfer services and vice
versa. Using mobile and card-based technology for international remittances would
require cooperation with destination country banks and governments.
A national price database for available methods to send money and their cost can
help remittance senders choose the appropriate channel and improve transparency
and competition.20 If a national price database were established in Nepal, it should be
updated frequently (daily or weekly) to capture the latest players, prices, and channels.
A website can be used to disseminate the price database. Fliers could be distributed to
migrants at the airport before departure, during predeparture orientation, or at embas-
sies in destination countries. Th is would be a way to reach migrants who do not have
easy access to the Internet.
Regulations need to be proportionate with regard to the risk of money launder-
ing and fi nancial crimes, so as not to stifl e entry and competition in the remittance
marketplace. Many countries have imposed burdensome reporting and compliance
requirements for banks and money transfer fi rms to address concerns of anti–money
laundering and countering the fi nancing of terrorism. Balance must be sought between
these legitimate concerns and the need to provide incentives for formal transfer. To
strike this balance, Nepal needs to recognize remittance transfers as a stand-alone
service separate from banking, so that more players can enter the remittances market.
Eliminating exclusive partnerships can benefi t both migrants and recipients of remit-
tances.

132 l SANKET MOHAPATRA, DILIP RATHA, AND ANI SILWAL
Capital Market Access Leveraging on Remittances: Securitization and Diaspora Bonds
Nepal’s large and stable remittance infl ows can be used for raising fi nancing from inter-
national capital markets at lower cost and at longer maturities for fi nancing infrastruc-
ture and other development projects. Banks in Brazil, Egypt, El Salvador, Guatemala,
Kazakhstan, Mexico, and Turkey have been able to raise more than $15 billion since
2000 by securitization of future remittance fl ows (Ketkar and Ratha 2009). Th e remit-
tance securitization structure mitigates several elements of sovereign risk and makes
the remittance-backed bonds attractive to foreign investors but does not aff ect remit-
tance fl ows to the ultimate benefi ciaries.
Diaspora bonds can be an attractive instrument for governments and the pri-
vate sector to access the wealth of the diaspora. India and Israel have raised nearly
$40 billion by issuing diaspora bonds, often in times of crisis when external sources
of fi nance dry up (Ketkar and Ratha 2009; Ratha 2010a). Nepal recently fl oated a fi ve-
year local currency “Foreign Employment Bond” in June 2010 targeted at its diaspora
in Malaysia, Qatar, Saudi Arabia, and the United Arab Emirates. Th e initial objective
was to raise Rs. 7 billion (about $100 million) for infrastructure development. How-
ever, the amount fl oated in the market in mid-2010 was Rs. 1 billion (about $15 mil-
lion), and the funds that were fi nally raised were reportedly much lower. Th is was
in part because of limited marketing eff orts, a short two-week window of sale, lack
of targeting to relatively wealthier members of the diaspora in Europe and North
America, and a lower local currency interest rate (9.75 percent) compared with what
was being off ered by Nepalese commercial banks. Th e initial launch will provide use-
ful lessons for both Nepal and other developing countries considering issuance of
diaspora bonds.
For Nepal to improve its access to capital markets through remittances, it needs to
take several measures. Nepal currently does not have a sovereign rating from any of
the three major rating agencies: Standard and Poor’s, Moody’s, and Fitch. Obtaining a
sovereign rating, and ensuring that its large and stable remittance infl ows are refl ected
in the sovereign rating, will help to provide a benchmark for both the government and
subsovereign entities. Donors and international institutions could provide technical
assistance in obtaining credit ratings and in setting up remittance securitization struc-
tures and issuing diaspora bonds.21 Encouraging the fl ow of remittances through formal
banking channels better allows the use of these innovative fi nancing mechanisms for
Nepal’s development.
Improving Migration Policies and Institutions
Many Nepalese migrant workers face lack of transparency in employment contracts
regarding wages, delayed payment of wages, and at times, abuse from employers in des-
tination countries. Bilateral agreements between Nepal and destination countries could
9. MIGRANT REMITTANCES IN NEPAL l 133
help in regulating the recruitment process and protecting rights of migrant workers.
Embassies can play a bigger role by having labor attachés in embassies who can verify
off er letters and employment contracts, monitor employment conditions through site
visits, and monitor recruitment agencies in destination countries.
Countries such as the Philippines have successfully implemented predeparture
seminars to disseminate information on travel regulations, immigration procedures,
settlement concerns, employment and social security concerns, and rights and obliga-
tions of Filipino emigrants (Lueth and Ruiz-Arranz 2007; Mohapatra and Ozden 2009).
Often implemented in partnership with the private sector, these programs provide skills
related to work at the destination and fi nancial literacy, tools to respond to mistreat-
ment, exploitation, and abuse, and education of workers on remittance channels. Nepal
could also utilize predeparture training to migrants to provide information on avail-
able remittance channels. Fliers with the latest available options and prices for sending
remittances from the destination country can be distributed during these workshops
(see the previous section on a remittance price database). Embassies can collaborate
with banks to off er seminars on deposit, savings, and credit products at the location of
migrants in major destinations.
A migrant welfare fund can improve services to migrants and help in reintegration
of returnees by self-employment opportunities and loans for small businesses as well
as provide training facilities for skills and languages in demand. Th e Philippines has
successfully implemented a wide range of institutions to protect the rights of their emi-
grants and made eff orts to reintegrate returning migrants. Bangladesh, India, Pakistan,
the Philippines, Sri Lanka, and Th ailand have also introduced similar funds. Nepal
could also greatly benefi t from a welfare fund that provides services for overseas work-
ers, helps reintegrate returning migrants, and provides training on sought-after skills in
current and potential destination countries.
India will remain a key destination, especially for seasonal migration, due to geo-
graphic proximity. India has also been relatively less aff ected by the current crisis
and will remain a driver of regional growth. Although Nepalese migrants are allowed
to travel and work in India, they continue to face diffi culties in sending remittances
through formal channels. Improving opportunities for safe and legal migration and
facilitating remittance fl ows both internationally and within the region can increase
their contribution to Nepal’s development.
Nepal should continue to explore new labor markets in GCC countries, East Asia,
and Europe. Th is would require implementing training programs in languages and
skills to match the changing needs of the global labor market. In the long term, Poland,
Romania, Russia, and new members of the European Union are likely to need migrant
workers. GCC countries have abundant fi nancial resources to continue investing in
infrastructure investments. Nepal could help to equip prospective migrants with skills
to match demands of the global labor market. Improving training facilities for sectors
such as hospitality, health care, and information technology could allow migrants to
move up the skills ladder.

134 l SANKET MOHAPATRA, DILIP RATHA, AND ANI SILWAL
Conclusion
Remittances are the most important source of external fi nance for Nepal’s economy.
Offi cially recorded fl ows are estimated to have reached $3.5 billion in 2010. Although
new migration fl ows and remittances to Nepal decelerated in 2009 during the global
fi nancial crisis, these fl ows quickly recovered in 2010. Remittances are larger than other
sources of foreign exchange such as exports and tourism revenues. Th is chapter has out-
lined recent trends in migration and remittances in Nepal and discussed policy options
to make remittance services cheaper and more convenient, and to leverage remittances
for improving fi nancial access of migrants, their benefi ciaries, and fi nancial intermedi-
aries. Some of these measures include increasing information available to migrants on
available remittance channels, fi nancial literacy for prospective migrants, working with
microfi nance institutions and post offi ces for remittance transactions, increasing trust
in the banking system, and improvements in broader payment systems. We have also
discussed measures to improve migration policies and institutions.
Th e remittance market in Nepal is relatively effi cient, but market ineffi ciencies in des-
tination countries ought to be addressed. Major money transfer operators and banks are
able to deliver remittances reliably and eff ectively in Nepal. However, negotiations with
authorities in destination countries can improve access to remittance services. Making it
easier for migrants to open bank accounts in destination countries will facilitate remit-
tance fl ows. Increased awareness and better training of prospective Nepalese migrants in
languages and skills needed to meet the changing needs of the labor markets in destina-
tion countries would also help to improve the development impact of migration.
Notes
1. Based on interviews with money transfer companies, banks, recruitment agencies, embas-
sies, and government offi cials.
2. Th e Nepalese fi scal year runs from July 15 to July 14.
3. Nepal Department of Foreign Employment.
4. Malaysia accepted about 75,000 new migrants in fi scal years 2005–06 and 2006–07 and
50,000 new migrants in fi scal year 2007–08.
5. “Malaysia Says ‘Yes’ to Nepali Housemaids,” Himalayan Times, January 1, 2011. According to
the article, some 400,000 Nepalese are currently working in Malaysia, of which 175,000 are
in the manufacturing sector.
6. Th e fi gures for fi scal year 2008–09 are from Nepal’s Department of Foreign Employment.
Media sources have reported employment numbers that are generally consistent with what
is presented in this chapter. Th e Kathmandu Post, however, reported on May 18, 2009, that
the number of Nepalese migrant workers leaving for foreign destinations during the fi rst 10
months of the current fi scal year decreased by 21 percent to 147,545 compared with 185,817
in the same period of the previous year (see http://www.kantipuronline.com). Th e article
also reported that some 37,000 people left using their personal contacts in the 10 months
up to April 2009.

9. MIGRANT REMITTANCES IN NEPAL l 135
7. “Suspension of New Work Permits Hits Nepal’s Economy,” Xinhua, January 25, 2009 (http://
news.xinhuanet.com/english/2009-01/25/content_10716897.htm). In March 2009 Malaysia
canceled the work visas of 55,000 Bangladeshi workers but since expressed its intention to
restore the visas after the end of the economic crisis (http://www.bdnews24.com/details.
php?cid=2&id=88433&hb=3).
8. “Nepal’s Labor Export Up 34 Percent,” Republica, November 20, 2010 (http://www.myrepub-
lica.com/portal/index.php?action=news_details&news_id=25394).
9. Based on interviews with money transfer companies, banks, recruitment agencies, embas-
sies, and government offi cials.
10. During this period, the average remittances that households received increased from
Rs. 3,500 to nearly Rs. 6,000 in 1995 rupees. See table 4.5 of World Bank (2006c). Data are
from nationally representative Nepal Living Standard Surveys I and II; 3,373 households
were sampled in 1995–96 and 5,072 households in 2004–05.
11. Poverty reduction and development benefi ts of remittances in the form of improvements in
human capital accumulation and health outcomes have been observed in other countries in
South Asia. De and Ratha (2007) fi nd that children of Sri Lankan migrant-sending house-
holds had higher birth weight and the households spent more on private tuition, a possible
contributor to better education outcomes. According to Mansuri (2007), in rural Pakistan,
school enrollment rates increased by 54 percent for girls in migrant-sending households.
Rupee remittances from India help the Nepalese government fi nance Nepal’s bilateral trade
defi cit vis-à-vis India and maintain the exchange rate anchor.
12. Th ese are signifi cantly more for Bangladesh and Pakistan, accounting for 63 and 52 percent,
respectively, of the remittance infl ows in 2007.
13. Interviews with money transfer companies and recruitment agencies. Th e average offi cial
exchange rates for 2009 and 2010 were Rs. 77.5 and Rs. 72.4 per dollar, respectively.
14. Overall remittances to developing countries are estimated to have reached $328 billion in
2008, up 15 percent from the level in 2007.
15. Crude oil prices declined from over $120/barrel in August 2008 to less than $40/barrel in
December 2008. Th ey have since risen to nearly $70/barrel in June 2009.
16. See the World Bank’s Remittance Prices Worldwide (remittanceprices.worldbank.org).
17. http://rbidocs.rbi.org.in/rdocs/notifi cation/PDFs/CINRS.pdf.
18. Mexican migrants, for example, can obtain matricula consular from Mexican consulates
in the United States, which can be used to open bank accounts and to apply for a driving
license. Th e Tunisian carte consulaire can be used for special customs clearance, reduced
airfares, and foreign currency bank accounts in Tunisia. India also issues a Person of Indian
Origin card, which allows cardholders access to various facilities in India.
19. WDI (2009).
20. Th e World Bank’s Remittance Price Database (http://remittanceprices.worldbank.org) is
another example of a price database. It has data on 134 remittance corridors in the world
and is updated every six months.
21. Th e United Nations Development Program has helped several African countries obtain sov-
ereign ratings in partnership with Standard and Poor’s. Th e International Finance Corpora-
tion (part of the World Bank Group) helped Fedecredito, a credit cooperative in El Salvador,
to raise $30 million of debt fi nancing by securitizing its future remittance fl ows. Th ese funds
will be used to expand credit to microentrepreneurs and low-income people in El Salvador.

137
Chapter 10
Nepal: Migration History and Trends
JEEVAN RAJ SHARMA
Migrants in search of work are not a new phenomenon in Nepal. Historical and
ethnographic evidence suggests that migration has historically been a signifi cant fea-
ture of household livelihoods amid fragile socioeconomic and environmental contexts
(Hitchcock 1961; MacFarlane 1976; Pfaff -Czarnecka 1995; Whelpton 2005). Th e fi rst
wave of migration began in the eighteenth and nineteenth centuries when state policies
and agrarian changes forced peasants in the hills to move off their land and seek their
livelihoods elsewhere, both within Nepal and across the border into India (Regmi 1978).
Th e opportunities for work in the bordering states of India in sectors such as tea planta-
tion, coal mining, and construction attracted a larger number of Nepalese as laborers.
Labor migration of young men started with recruitment to serve in the army of the
Sikh ruler Ranjit Singh and then in the British army in India (Seddon, Adhikari, and
Gurung 2002). Although the Nepalese state resisted the recruitment of Nepalese by the
British until 1885 out of concern that returning army servicemen would bring revolu-
tionary ideas into the country, the policy changed in 1886 to allow the recruitment of
Nepalese into the British Indian Army—a practice that continues to this day. Substan-
tial temporary work migration has been seen from the hills to the plains and across
the border into India to make up for the low income of the hill regions and to cover
the needs of local rural communities throughout the year. Migrants in search of work
in India have become a part of the life experience of a large number of Nepalese and
account for just under half of Nepal’s migrants. Pushed by diffi cult economic conditions
at home, Nepalese have long relied on the comparatively large economy of their imme-
diate neighbor in the south, where they migrate in search of various work opportunities.
Th e fl ow of Nepalese migrants has been facilitated and sustained by social networks
among the migrants and their households (Th ieme 2006).

138 l JEEVAN RAJ SHARMA
Th e unique open border between the two counties, formalized by the treaty of 1950,
allows citizens of both countries to cross the border without having to produce offi cial
documents, and the treaty off ers equal treatment of both citizens.
Over the years the proportion of migration of Nepal workers to India has decreased
from 80 percent in 2001 to 41 percent in 2009, mainly because of the emergence of
other migrant destinations following the second wave of work migration from Nepal.
Th e second wave of migration started in the mid-1980s, accelerated in the 1990s, and
dramatically increased in the mid-2000s, when Nepalese continued to migrate to work
in India and began to migrate to new destinations, mainly the Gulf States and Malaysia.
Th e opening of new markets for Nepalese laborers in these destinations and the decen-
tralization of passport issuance policy in Nepal contributed to this new wave of migra-
tion, which has become an extremely important part of the Nepalese economy and cul-
ture. Excluding India, the latest offi cial data show that Malaysia (32.04 percent), Qatar
(28.71 percent), Saudi Arabia (19.81 percent), and the United Arab Emirates (12.68 per-
cent) are popular destinations in the Gulf States (Government of Nepal 2010). About
5–7 percent are estimated to have migrated to Australia, European nations, Japan, the
Republic of Korea, the United Kingdom, the United States, and other countries with
globally strong economies; these are the desired destinations of Nepalese migrants
seeking to earn foreign currency overseas.
Both men and women have been migrating from Nepal for 200 years, although the
nature and pattern of migration have changed. In the past, women’s migration was
largely limited to short-distance mobility and/or was mostly accompanied by family
members. Since the 1990s, Nepalese women have begun to migrate on their own to
various international destinations albeit now without gender discrimination, risks, and
control on their mobility.
Th ese migrations have created new transnational links, connecting very distant
countries, cultures, and economies. Th is is a signifi cant period in the history of work
migration because it has led to large-scale migration and remittance fl ow, making pol-
icy makers recognize for the fi rst time the remittance-dependent economy of Nepal.
Th is period also marks the age of rising expectations among young Nepalese to migrate
and participate in a world of modernity, consumption of commodities, and global inter-
connectedness (Sharma 2008). Th is is also the period when increasing numbers of Nep-
alese began to use labor recruitment agencies to facilitate their migration out of Nepal,
especially beyond the traditional destinations in India.
Th e establishment and the expansion of migrant recruitment agencies also signifi -
cantly contributed to the rapid increase in migration to the Gulf States and Malaysia.
Th e number of recruitment agencies increased from 103 in 1998 to 630 in 2009. Th is
period also saw a sharp increase in migration of men and women in search of further
educational opportunities along with the growth of international education consul-
tancies (IECs). About 1,000 IECs are operating in Nepal, which provide assistance to
potential students who want to study and work abroad. Ideas about and practices of
migration for education dominate the aspiration of the young middle class in major
10. NEPAL: MIGRATION HISTORY AND TRENDS l 139
cities and towns in Nepal and involve a signifi cant economic investment and capital
fl ight.
With the increase in migration, a wide range of Nepalese migrant associations began
to form in countries of destination. In 2004 the worldwide nonresident Nepalese orga-
nization was established, with chapters in diff erent countries, to bring together in a
single body all Nepalese organizations, whether cultural, religious, social, or political.
Th e establishment of Nepalese diaspora organizations of diff erent natures and in dif-
ferent countries has led to the increased engagement of diaspora Nepalese in Nepal’s
political and economic development.
Migrant remittances have played a key role in sustaining the rural economy and
people’s livelihoods during the decade-long Maoist confl ict. Th e offi cial contribution
of remittances to Nepal’s gross domestic product (GDP) in 2009 was $2.7 billion or
22 percent of GDP. However, with large amounts also being sent outside the offi cial
banking system and including remittances from India, the actual contribution of remit-
tances could be as high as 30 percent of Nepal’s GDP (World Bank 2009e). Remittances
from Nepalese abroad grew by 20 percent a year between 1995–96 and 2003–04, rising
from less than 3 percent of GDP in 1995–96 to about 12 percent by the end of 2003–04
(World Bank 2006c).
Th e Gulf States have become one of the key destinations since the mid-1990s and
certainly one of the most dynamic phenomena (Graner and Gurung 2003). Th e trend
over the last two decades shows that about one-third of Nepalese migrants seek travel
abroad to the Gulf States to work as contract workers. Unpublished records available at
the Department of Labor show that offi cial fi gures for the early 1990s was only 2,000,
which increased to 6,500 in 1997–98 and 20,000 by 1999–2000. In 1997 about 40,000
migrant workers from Nepal went to the Gulf States (Seddon, Adhikari, and Gurung
2002). Offi cial statistics suggest that this number increased to 1,045,655 by 2009–10.
Th e global recession did have an impact on migration fl ow from Nepal: Migrant
worker outfl ows have decreased by 13 percent. Th e offi cial statistics show that 217,164
individuals left the country for employment in 2008–09 compared with 249,051 in
2007–08.
Overall, the pervasiveness of migration both within and outside of Nepal challenges
the notion that Nepal is a traditional and agrarian society. Households have trans-
formed into multilocale households with the out-migration of a large number of men
and an increasing number of women to various global destinations. Remittance fl ows
have further boosted the incorporation of Nepal into the global economy, as confi rmed
by the opening of Western Union outlets even in the remotest areas as soon as road
and/or telecommunication networks reach these. As migrant remittances, associated
commodifi cation, and market expansion become the defi ning features of the economy,
it is the poorer households that are unable to send migrants that will face increased risk
of marginalization.


141
Chapter 11
Resilience of Remittances during the Global Financial Crisis and the Entrenchment of Migration
ANDREA RIESTER
In psychology and since the 1970s, the term resilience has been applied to peo-
ple who in situations of great stress, trauma, or adversity still retain their emotional
stability and sanity. Children who face extremely diffi cult socioeconomic circum-
stances, or who suff er from abuse and violence, and who still grow up to be responsi-
ble, healthy adults display considerable resilience (Welter-Enderlin and Hildenbrand
2006; Werner, Bierman, and French 1971). Th e term social resilience has been applied
to communities’ ability to cope with rapid socioeconomic change or external shocks
in development studies (Adger 2000; Adger and others 2002). In this chapter the term
resilience is applied to individual migrants who also suff er from various impairments
to their development and still are able to overcome them: fi rst, they are negatively
aff ected by the working conditions and salaries for migrants in countries of destina-
tion because both generally tend to be unsatisfactory (D’Souza 2010). Second, when
sending money to their families back home, migrants have to pay exorbitant fees in
the not-so-transparent market for international money transfers, which reduces the
amount of remittances actually arriving in the families’ households in countries of
origin (Beck and Martínez Pería 2009). Th ird, the global economic and fi nancial crisis
has drastically reduced the number of formal jobs worldwide, and with this it has
also reduced opportunities for migrants to earn their livelihood abroad (IOM 2009).
Despite all these diffi culties, migrants keep working, and remittances keep fl owing
back to their countries of origin.
142 l ANDREA RIESTER
I compare three countries where large parts of the population depend on migrants’
contributions to household incomes and ask how the global economic and fi nancial cri-
sis aff ects the situation. I compare countries in three diff erent regions of the world: Mali
in Sub-Saharan Africa, Nepal in South Asia, and Tajikistan in Central Asia. Although
Tajikistan largely depends on migration to Russia, migrants from Mali and Nepal are
mostly involved in South-South migration and to a lesser degree in South-North migra-
tion. Th e comparison shows that despite large diff erences between these cases one gen-
eral tendency becomes evident: Some factors have contributed to the relative stability
of remittances during the crisis, particularly because of the resilience of migrants and
because migration has become entrenched.
Data and Methods
Empirical evidence for my argument is drawn from a series of country studies on the
nexus between the global economic and fi nancial crisis, return migration, and remit-
tances carried out in early 2009 by the German Development Cooperation on behalf
of the German Federal Ministry for Economic Cooperation and Development (GTZ
2010). Overall, this research series covered eight diff erent countries, which were
selected according to the following criteria: importance of migration from these coun-
tries (either South-North or South-South), economic dependency on remittances, and
being partner countries of German development cooperation. Th e goal of the diff er-
ent case studies, carried out by local consultants with various scientifi c backgrounds
(social sciences, political sciences, economics), was to provide fi rst-hand information
on the immediate impact of the global and fi nancial crisis while it was still in full swing.
Research methods included the analysis of current research and qualitative interviews
with representatives of institutions dealing with migration and remittances, as well as
with returnees and families of migrants still working abroad. Th e data collected varied
considerably (as was to be expected from this practice-led approach), but they pre-
sented us nevertheless with solid interdisciplinary insights into the eff ects of the crisis
on countries of origin.
Overview of the Three Case Studies
Migration plays a major role in all three countries: approximately 1.2 million Mali-
ans, 1.6 million Nepalese, and 800,000 Tajiks are working abroad.1 Th is means that
6–11 percent of the entire population of these countries has emigrated (Mali, 9 percent;
Nepal, 5.9 percent; Tajikistan, 11 percent). Th e socioeconomic and gender profi le of
migration varies greatly between these countries. Tajik migration is made up mostly of
young men working in the construction sector in the Russian Federation and to a small
degree also in Kazakhstan (Olimova 2010). Only 6 percent of Tajik migrants are women,
who mostly work in the services industry or in petty trade. Apart from approximately

11. RESILIENCE OF REMITTANCES DURING THE GLOBAL FINANCIAL CRISIS l 143
250,000 Nepalese who, for historical reasons, are employed in the Indian public sector
(mainly the army and police), it is generally poorer Nepalese migrants (men and women
equally) who move to neighboring India (Kollmair and others 2006; Seddon 2005). Th ey
are not registered anywhere because they have no visa requirements; their employment
is mostly irregular on plantations, in manufacturing, in construction, or in services.
Th ose Nepalese migrants who can aff ord to migrate via regular channels usually go to
Malaysia (39 percent), Qatar (27 percent), Saudi Arabia (19 percent), or the United Arab
Emirates (10 percent). Of those Nepalese migrants going to the Gulf States, most work
as semi- or unskilled workers in construction; only 5 percent of them are women, who
usually work as domestic helpers.
Of all Malian migrants, 80 percent remain in the West African region, with Côte
d’Ivoire being the major destination country (Barajas and others 2010: 18). In the coastal
areas, Malians usually work in plantations and the service industry. Malian women
are particularly active in regional transnational trade (Sieveking and Fauser 2009). In
Europe, France is the main destination country because of colonial ties and linguistics,
but only 2.7 percent of Malian migrants live there. In recent years, Spain has become
the second most important European destination country because of labor shortages in
its agricultural sector.
Th e fact that migration has become an important livelihood strategy in all three
countries is refl ected in the enormous amounts of remittances sent annually by citizens
abroad. According to World Bank fi gures from November 2009, $0.3 billion was sent to
Mali, $2.7 billion to Nepal, and $2.5 billion to Tajikistan in 2008. Th is is the equivalent
of 3.9 percent of gross domestic product for Mali, 21.6 percent for Nepal, and 49.6 per-
cent for Tajikistan. Th e fi gure for Mali seems low in comparison and suggests the coun-
try is not dependent on remittances. However, compared with other African countries
this fi gure is relatively high (Barajas and others 2009), and it does not include informal
remittances. Th ese are likely to be high, given that the Malian fi nancial sector is weak
and banking infrastructure in rural areas largely nonexistent. Additionally, most migra-
tion from Mali takes place within the region, proximity being a factor fostering informal
transfers as well. It then becomes very likely that Mali is as dependent on remittances
as the other two examples.
Crisis and Remittances
Worldwide remittances reached $328 billion in 2008 (Ratha, Mohapatra, and Silwal
2009a) which is nearly three times as high as worldwide offi cial development assistance of
$120 billion. Remittances to Asia have more than doubled since 2002. Th ey play an impor-
tant role in poverty reduction (Adams and Page 2005), but because of migration patterns,
remittances primarily contribute to households and families that are already better off and
can aff ord the expenses of migration (Riester 2010a). Via consumption of local goods or
investment in education, health, and businesses, possibly resulting in job creation, larger
parts of society will benefi t from the infl ow of remittances (World Bank 2006a).

144 l ANDREA RIESTER
Remittances are generally reduced by job losses by migrants abroad and the devalu-
ation of currencies in countries of destination (such as the Russian Federation or the
United States); on the other hand, incidental evidence suggests that the demand for
cheap migrant labor and, subsequently, migrants’ employment has remained high.
Additionally, the crisis gave an incentive to remit more: Studies have shown that remit-
tances are countercyclical; in times of crisis, family members generally appeal to their
relatives abroad, who are then likely to remit more than before, even if that means cut-
ting down on their own (sending members’) expenditures (Orozco 2009). Currency
devaluations in countries of origin can also increase the value of remittances, which
provides a good opportunity to invest. Th erefore, global remittances generally remain
stable in comparison with other fi nancial fl ows such as foreign direct investment or
portfolio fl ows.
Th e pattern of remittance fl ows roughly follows that of migration. Th erefore, the
extent of return movement determines the decline in remittances. Central Asian
republics experienced a sharp decline in remittance fl ows from the Russian Federation:
remittances to Tajikistan shrank by approximately 30 percent in the fi rst two quarters
of 2009, relative to the same period in 2008. Whereas in 2007 the average monthly
amount remitted by migrants was as high as $256, in 2009 it had decreased to $181
(both expressed in 2007 dollars) (Danzer and Ivaschenko 2010).
In contrast between January and March 2009, remittances to Nepal even rose by
28 percent relative to the same period in the previous year. Th is astonishing rise can be
linked to migrants’ preparation to return home and transferring savings home before
their return or to the signifi cant appreciation of the dollar between 2008 and 2009,
which led to a larger transfer of savings to Nepal and investment in real estate in Kath-
mandu by Nepalese abroad. One should also bear in mind that the collection of remit-
tance data has improved considerably since the World Bank brought their importance
to public attention (Ratha 2003).
For Mali, data on remittances are not satisfactory. Barajas and colleagues (2009) show
the discrepancy between the offi cial International Monetary Fund fi gure of $0.2 billion
remittances in 2006 and International Fund for Aid and Development (IFAD) estimates
of $0.7 billion for the same year.
IFAD estimates were derived from home and host country sources and allegedly
include informal transfers. Th e latter are the rule for African countries, and so it is fair
to assume that the IFAD estimate might be more realistic.2 According to chief executive
offi cers of money transfer operators in Bamako, interviewed during the course of the
GTZ country study, formal remittances from Europe decreased in the fi rst half of 2009
between 25 and 60 percent.
Anecdotal evidence indicates that informal remittances from migrants in the West
African region have remained relatively stable. Th us, overall remittances to Mali might
not have decreased as drastically in 2009, which is in line with fi ndings that attribute
a shock-absorbing role to remittances in Sub-Saharan Africa (R. J. Singh 2010). If
Mali’s growth and thus poverty reduction was in danger of being aff ected by the global

11. RESILIENCE OF REMITTANCES DURING THE GLOBAL FINANCIAL CRISIS l 145
fi nancial and economic crisis, it was because it has a high share of foreign-owned banks
(Massa and te Velde 2008).
Crisis and Return
Th e global fi nancial and economic crisis has resulted in job losses, particularly in indus-
trialized countries, and was therefore expected to cause massive return migration to
developing countries. However, the analysis of the real extent of return migration in the
wake of the crisis is diffi cult to assess. First, this is because much migration is taking
place in an undocumented manner, that is, without a work permit, visa, or other travel
documents, or is becoming irregular over time, such as through visa overstaying (Schiff
2004). Second, return is generally not registered; migrants are usually free to go home
whenever they want and without telling the administration in the country of destina-
tion (the return migrant generally has no incentive to register in their country of origin).
Most important, however, it is hard to distinguish between seasonal and permanent
return.
In general, international labor migrants do not come from the poorest part of the
population (DRC 2009). Migration initially engenders high costs: You need time, money,
and information to obtain a visa, travel tickets, accommodation abroad, and so on (and
therefore it is not usually feasible for the very poor). Several studies have also shown
wealth diff erentials between migrants moving between countries within their region
and those who move intercontinentally: Wealthier people can aff ord to move farther
away. Th erefore, as a rule of thumb, the poorer the persons and their families are, the
shorter is their migration distance. Th us, when discussing the eff ects of the crisis on
international migrants and their families, we are generally not talking about the poor-
est part of the population. However, the economic potential of migrants to accumulate
human and fi nancial capital abroad to invest back home makes them important actors
in poverty reduction.
Return migration due to the crisis is particularly high where migrants work in
recession-sensitive industries, for example, construction, fi nancial services, or tourism,
and where migrants depend on one or few countries of destination (Martin 2009b). In
this case, if immigration and recruitment policies of the respective main destination
countries have tightened, migrants face layoff s or will not be able to renew their work
permits like they used to.
Although return migration on a large scale seems the logical consequence of the
crisis, the situation in countries of origin is by no means clear cut. Although anecdotal
evidence of mass return is reported by the media and has infl uenced our perception,
the information we gathered in our study on the eff ects of the crisis presents a more
nuanced picture.
We did fi nd signs of increased return migration to Tajikistan. Because most Tajik
migrants were working in the construction sector in the Russian Federation and
146 l ANDREA RIESTER
Kazakhstan, they were hardest hit by job losses stemming from the crisis (Danzer and
Ivaschenko 2010). In the wake of the crisis, these two destination countries halved their
immigration quotas by the end of 2008. Against this, convincing anecdotal reports from
both countries claim that migrant workers from Tajikistan can still fi nd work, because
they are often willing to work for less money than the locals, and they also work with-
out documents (ICG 2010). It is estimated that 65 percent of all Central Asian migrants
working in the Russian Federation have no legal status and that in Kazakhstan the pro-
portion might even be higher (UNDP 2008). One study shows that the stock of Tajik
migrants abroad has risen from 2007 to 2009 (Danzer and Ivaschenko 2010). Th us, the
result of the cut quotas is not necessarily a decrease in overall migration, but a decrease
in regular migration, increasing the problems of documentation as described above.
Th is in turn results in decreasing social protection of migrants who, if without offi cial
documents, have no access to health services or insurance and cannot claim their work-
ers’ rights.
In Nepal, the situation seems mixed: Data on return are particularly hard to obtain,
and offi cial data do not adequately represent the full extent of crisis-induced return.
According to the Association of Nepal Foreign Employment Agencies, between June
2008 and March 2009 only 3,000 Nepalese migrant workers returned, mainly from
Dubai, Macao, Malaysia, and Qatar. Th is number includes only regular migrants who
were eligible to and did claim social benefi ts. Returning migrants are ineligible for social
benefi ts if they stayed abroad for more than a year, so many of them have been excluded
from public support (as will be elaborated on in the following). Foreign recruitment
from Nepal clearly dwindled in 2008–09: Th e number of new placements abroad shrank
by 30 percent. Malaysia for example, the second most important destination country
for Nepalese migrants after India, has frozen the issuance of work permits to migrant
workers in the manufacturing and services sectors and has introduced “nationals fi rst”
employment policies (Punzalan 2009; Sharma and Gurung 2009). However, anecdotal
evidence strongly suggests that Nepalese migrants from Malaysia and the Gulf States
have not returned in large numbers. Th ey prefer to stay on and work irregularly, because
they fear they might not be able to return once they leave.
As mentioned above, the vast majority of Malian migrants move within the African
continent and have therefore not been directly aff ected by the current fi nancial and
economic crisis. Looking at those who moved to Europe, one fi nds a serious lack of reli-
able data on their migration and return. Our study tried to get a glimpse of migration
trends by looking at the work of the newly installed Centre for Migration Information
and Management (CIGEM) in Bamako. One important insight was that the number
of Malians who should have been allowed to move to Spain under a circular migration
agreement between the two countries was cut from 800 to 45 according to CIGEM.
Additionally, the number of deported Malians has witnessed a sharp increase too, from
794 in 2007 to 1,834 in 2008. Th is in turn has exponentially increased the number of
those seeking advice from CIGEM since the beginning of the crisis toward the end
of 2008. However, the GTZ country study has also revealed an impressive solidarity

11. RESILIENCE OF REMITTANCES DURING THE GLOBAL FINANCIAL CRISIS l 147
among migrants abroad who support each other in the case of job loss in order to avoid
having to return home.
Conclusion
What does this comparison of the situation of remittances and return migration in
Mali, Nepal, and Tajikistan in the wake of the global fi nancial and economic crisis tell
us? First, stability of remittances is not guaranteed but is usually a function of a par-
ticular migration pattern that the citizens of a country have come to adopt. Fears of
mass return and sharp decline in remittances have generally not materialized during
the global fi nancial crisis. However, the higher a country’s dependency on migration
of its citizens to few industrialized countries and within those to sectors susceptible to
crisis, the more likely that the famous stability of remittances comes at a high price. In
this sense, it is probably adequate to speak of migrants’ resilience: Despite worsening
labor conditions and rising irregularity, they still hold on to their livelihood strategy of
searching for jobs abroad and working in increasingly diffi cult conditions. Entrench-
ment of migration despite or rather due to the crisis and subsequent policy restriction
in countries of destination is the result.
Notes
1. If not specifi ed, statistical data in this text are derived from GTZ (2010). Where necessary,
these data have been amended by additional information from other studies.
2. See www.ifad.org/remittances/maps/index.htm.


149
Chapter 12
Rural-Urban Migration in the Context of Thailand’s Ongoing Uneven Development
GREGORY S. GULLETTE
In thailand’s first national Economic Development Plan established a cen-
tralized urbanization and development policy that targeted growth within Bangkok and
its metropolitan regions. Bangkok had long provided ideological and material founda-
tions from which inequality and uneven national development stemmed (Dixon 1999).
As a result of the new development plan Bangkok emerged as the sprawling central hub
for fi nance, industry, and politics throughout the Th ai kingdom (Askew 2002; Doner
2009; Krongkaew and Kakwani 2003). Th ese factors in large part created the economic
determinants underlying rural to urban migration. Particularly prominent has been the
extensive use of labor mobility as a means to mitigate high poverty rates and unstable
employment structures within the predominately agrarian Isaan, or northeast, region of
Th ailand (Guest 1998; Kakwani and Krongkaew 2000; Skeldon 1997; Tacoli, McGrana-
han, and Satterthwaite 2008).
During the fi nancial boom of 1986–96 economic and social divisions widened
between urban and rural locations, increasing migration to Bangkok (Chalamwong
1998; Kim 1998). However, following the 1997 Asian fi nancial crisis, the Th ai govern-
ment reconsidered decentralizing the nation’s economic policy (see the passage of the
Decentralization Plan and Process Act of 1999). In eff ect, the Th ai government acknowl-
edged the vulnerability of older economic models within new contexts of neoliberalism
and globalization, as well as the need to provide wider employment options for those
living in provinces outside the Bangkok Metropolitan Region. Despite such government
eff orts, internal migration rates from the northeast into Bangkok and its semiurban
locations continued relatively unchanged.

150 l GREGORY S. GULLETTE
Although the 1997 Asian crisis caused an initial outfl ow of laborers from the central
region to provinces in the south, north, and northeast (NSO 2000), the rate of rural-
urban migration has increased into Bangkok and its environs in the following years.
Similarly, the economic crisis experienced in Th ailand over the past several years has
resulted in a partial loss of migrants in Bangkok. Many have returned to their home
provinces outside the central region as work opportunities in the city have diminished.
Remaining migrants often discuss pressures received from family in their origin com-
munities to either continue sending money or if possible increase remittances. In the
case of both the 1997 East Asian fi nancial crisis and the current global economic down-
turn, declining poverty rates have halted or been reversed in sections of the Isaan region.
In these historical contexts, researchers, politicians, and scholars continue to argue
that rural-urban migration is driven by poverty and is a functional strategizing feature
of households attempting to mitigate fi nancial instability (Bhaopichitr and others 2008;
see also Hogue 2005; Jacque 1999; Phongpaichit and Baker 2008). Further, such studies
advocate that in high-migration situations and within unstable economic structures,
migrant remittances may further local development in the origin community. Remit-
tances might improve standards of living, create higher employment, and increase eco-
nomic growth. In total, these eff ects will over time decrease widening rural and urban
divisions. However, in the Th ai context, local structural variables in labor availability
also produce situations where short-term migration does not positively aff ect relative
household wealth. Research on Th ailand’s National Migration Survey fi nds that lower-
income households will most often send long-term migrants to Bangkok, yet received
remittances are insuffi cient to remove these households from poverty (see, for example,
Ford, Jampaklay, and Chamratrithirong 2009; Richter and others 1997). In fact, much
of the Th ai migration literature, as well as this author’s research, shows ambivalent rela-
tionships between internal Th ai migration and positive outcomes. Th erefore, although
researchers and government offi cials may argue that remittances have a positive eff ect
on regions and communities aff ected by various economic crises, collected data illus-
trate more complex relationships between migration and development. Yet migration
continues insofar that most Th ais consider it a normalized feature of life in the king-
dom, one that is fi rmly situated in the collective conscious and through this process is
transformed into background noise.
Since 2009 I have examined the ways in which “normalized” internal migration is
aff ected by Th ailand’s pronounced uneven development, the government’s decentral-
ization plans, and ongoing political and economic crises that are partially aggravated
by regional divisions (see the 2006 political crisis that began with the military-led coup
d’état of former prime minister Th aksin Shinawatra, whose political support is tradition-
ally located in northern and northeastern Th ailand). Isaan migrants that compose the
sample within my research (n = 42) came from various backgrounds and experienced
wide variations in income, job type, family socioeconomic standing, and remittance
usage. I interviewed investment bankers, housekeepers, construction workers, taxi
drivers, street vendors, public relations offi cers, and others. Motives for migration into

12. MIGRATION IN CONTEXT OF THAILAND’S ONGOING UNEVEN DEVELOPMENT l 151
Bangkok coalesced around certain identifi able themes: greater employment options,
higher pay, education access, modern or thansamay lifestyles, and intimate social net-
works. Within these varied reasons for migration, I more specifi cally address the way
remittance management might vary based on class, identity, gender, and community
infrastructure. I will avoid a prolonged discussion of whether remittances will increase
development in the community of origin. Similar to other fi ndings on the intersections
between migrant remunerations and market proximity or availability, my research illus-
trates that if a community is relatively isolated from provincial or urban markets, then
land investment is more common. On the other hand, substantial industry surrounding
the household tends to produce greater remittance investment in family businesses.
Th ese and similar patterns have obvious implications for government agencies attempt-
ing to capitalize on the fl ow of remittances into rural locations with an end objective of
increasing regional development in the northeast.
Yet, over the course of seven months of ethnographic research in Bangkok among
primarily Isaan migrants, my traditional interests in remittances and migration were
complicated by emerging patterns of rootedness and identity construction among
“rural” migrants in urban locations, which I believe profoundly aff ect remittance man-
agement. Th ailand off ers unique opportunities to examine the important social dimen-
sions of remittances within unstable, uneven national economic development, particu-
larly as development policies are further complicated by economic downturns.
One of the dominant ideological formations in migration and development studies
is the spatial separation of rural and urban activities (for example, Rigg 1998; Vickers
2004; Williams 1973). Th is duality maintains its durability not from a pure refl ection
of reality, but from its imaginative power and how it is invoked to separate—in power,
class, status, and identity—the people from urban (khon muang) and rural (khon ban
nok) locations. Researchers have established in various fi elds that through migration,
rural and urban link into singular social formations. Th e performance of labor mobility
(Korinek, Entwisle, and Jampaklay 2005), the at times convergence of cultural tastes and
consumptive behaviors between those in the city and those in the countryside (Rigg and
others 2008), and the fact that meanings and ideas generated in the city “are informed
and shaped by images and processes that are not unique to [the] metropolis alone”
(Askew 2002: 5) indicate an increasingly complex relationship between rural-urban
locations.
Despite the dissolution of strict rural-urban boundaries through migration, the men-
tal separation of rural and urban citizens remains an active cognitive map for many in
my research. Within Bangkok’s cosmopolitan cultural landscapes, lower-skilled and/or
Isaan migrants at various employment levels are at times marked as unsophisticated
or other, and occasionally even the derogatory aye laos. In these instances, the uneven
development that has historically positioned Bangkok as the kingdom’s central city is
invoked to draw attention to two key points. First, provinces in the northeast exist dis-
tantly outside Bangkok’s political, cultural, and economic dominance (despite regional
connections created through migration). Second, residents in theses provinces are by

152 l GREGORY S. GULLETTE
association imagined as distantly related, where they transgress culturally established
psychological, social, and geographic boundaries upon entering Bangkok seeking work.
As such, although structural requirements for migrant labor in Bangkok’s economy
clearly exist (for example, see Kaur 2010 on Bangkok’s decreasing population growth
rate and the requirement for migrant labor to drive industrial expansion), migrants are
at times regarded as the root of serious social problems. Th e actions and presence of
Isaan migrants in the city, for example, are occasionally analogous to the social and
economic problems traced to Burmese migrants in anti-immigrant rhetoric. Most
recently, the ongoing political crises arising from the 2006 coup d’état has seen further
marginalization of migrant communities from the northeast, where some are identi-
fi ed as kwai daeng, or red buff alos, indicating their illogical and gullible support for
former Prime Minister Th aksin. Th erefore, the challenges some Isaan migrants experi-
ence are classed, ethnicized, and regionalized in nature. Furthermore, challenges faced
by migrants are very much patterned by Th ailand’s uneven national development and
shaped by ongoing economic and political crises that position groups and regions of
people against others.
Th e ethnographic data indicate that the social, political, and economic divisions
within the kingdom produce regular sources of discomfort and (dis)identifi cation for
some migrating to Bangkok. Isaan migrants are often aware of the social lines drawn
between themselves and some Bangkok residents. In such situations, migrants express
an anxious longing to return home and often maintain concrete connections with the
origin community. Many participate in community-driven donations for the local Bud-
dhist wat (see, for example, the phaa paa, which arguably aligns with “functionalist”
traditions on the positive impact of migrant remittances within the origin community),
and most will frequently return to visit family and friends. Th ese divisions in turn infl u-
ence the length and duration of the migration experience, which also infl uence the form
of remittance usage and management. In contrast, some migrants, often with higher
education and formal training, will embrace Bangkok, referencing it as their home and
over time reducing the salient connections with origin communities. Th ese patterns of
migration illustrate that identity and social connections—created within new locations
or maintained with origin communities—are variables that deserve greater attention
when examining the role of remittances in developing rural or agrarian sections of a
country. Th e class, status, and perceived identity of the migrant have a profound eff ect
on whether or when return migration will occur and, importantly, in what shape and to
what degree migrant remittances will fl ow back to origin communities and funnel into
productive investment strategies.

153
Chapter 13
Migration and Remittances in Bangladesh and Pakistan: Evidence from Two Host Countries
GUNTUR SUGIYARTO, CARLOS VARGAS-SILVA, AND SHIKHA JHA
Remittance flows have been the object of much speculation in recent years. Th e
worldwide nature of the global fi nancial crisis implied that even sturdier capital fl ows
such as remittances might succumb to deteriorating global conditions. Predictions on
the level of the decline diff ered by country and region, but at one point worldwide remit-
tance fl ows were expected to decrease by as much as 8 percent (Ratha et al. 2009a). Yet
migrant remittances have once again proven to be strong and resilient, and the decline
in remittances, although important, was short lived. In this context, it is necessary to
analyze the impact of the reduction in global output as a result of the global crisis on
migration and remittances to learn lessons for the future.
Several studies have taken on the task of reviewing the dynamics of migration and
remittances during the crisis (Barajas et al. 2010; Calì and Dell’Erba 2009; Martin 2009a;
Naufal and Vargas-Silva 2010; Ruiz and Vargas-Silva 2010, 2011, to mention just a few).
Nonetheless, there is a need for additional comparative analysis of the eff ect of the crisis
on migration and remittances. Th e impact of the crisis on these fl ows may vary vastly
across regions, because of diff erences in fi nancial systems, migration patterns, and the
stage of economic development. Th erefore, it is useful to compare the eff ect of the crisis
Th is chapter is based on the results of the Asian Development Bank’s project Research and Development Technical Assis-
tance (RDTA) 7436: Global Crisis, Remittance and Poverty in Asia. Th e views expressed in the chapter are those of the
authors and do not necessarily refl ect the views or policies of ADB.

154 l GUNTUR SUGIYARTO, CARLOS VARGAS-SILVA, AND SHIKHA JHA
on remittances in specifi c corridors. Comparisons across corridors during the crisis
and its aftermath will eventually enable the establishment of broad generalizations and
facilitate the design of clearer and better policy recommendations and prepare for the
future.
Th is chapter concentrates on two countries in South Asia that are among the top
remittance recipients in the world and that report monthly remittance data: Bangla-
desh and Pakistan. First, we review the data reported by these countries’ central banks
to analyze the current status of remittances, focusing on fl ows from two host coun-
tries: the United Kingdom and the United States. Th ese are two of the key destination
countries for Bangladeshi and Pakistani migrants. In the second section, in addition to
exploring the changes in the volume of money fl owing in these corridors, we look at the
overall change in the importance (that is, relative to the rest of the world) of these cor-
ridors during the crisis. In the next two sections, we explore the relationship between
remittances to Bangladesh and Pakistan and the economic conditions of migrants from
these countries in the United States and United Kingdom during the fi nancial crisis.
Th e emphasis is on labor market indicators (unemployment rates, labor force participa-
tion rates, and the like). In the fi fth section, we look at other possible factors that could
aff ect remittances such as exchange rate changes between the currencies of the four
countries.
Changes in Remittance Flows during Times of Crisis
Th e Diff erence between the Current Crisis and Previous Crises
It is important to understand the history of the global crisis, also known as the “Great
Recession.” Although scholars have not come to a consensus about the reasons for
the fi nancial decline, there is agreement that one of the major drivers of the crisis
was a liquidity problem in the U.S. banking system that resulted in the collapse of
important banking institutions. One of the leading forces in the crisis was a weak
housing market that resulted in thousands of foreclosures around the world and in
long-lasting vacancies for new homes. In fact, the bursting of the housing bubble in
the United States has been attributed a large share of the blame for the crisis. Eventu-
ally the crisis led to a reduction in global credit availability and international trade
(IMF 2009b).
International trade was not the only international fl ow aff ected by the crisis. Many
host countries imposed new restrictions on admissions of international migrants, and
in other cases unemployed migrants decided to return home. Th e obvious consequence
of the grim picture about international migration was an increasing anxiety about the
future of workers’ remittances. Th ere was a special cause for concern in countries in
Asian developing countries, which have received large fl ows of remittances from their
international migrant workers during the last few decades.

13. MIGRATION AND REMITTANCES IN BANGLADESH AND PAKISTAN l 155
Another reason for the increasing anxiety about the future of international migra-
tion and remittances was the nature of this crisis as compared with previous eco-
nomic downturns. For example, in 1973, oil prices increased dramatically because
of the Organization of the Petroleum Exporting Countries embargo and the confl ict
between Israel and several Arab countries. Th e consequence of the sharp increase in
oil prices was a major economic crisis in oil-importing countries. As a response to
the crisis, many European countries terminated their guest-worker programs. None-
theless, many migrants decided not to return home and used some of the rights that
they had acquired over the years to bring their families to the host country (Martin
2001). Hence, instead of a decrease in migration, there was a change in the type
of migration from labor-oriented to family reunion migration. Moreover, although
an economic downturn was seen in oil-importing countries, economic expansion
occurred in oil-exporting countries. Many of these countries started to recruit for-
eign workers (often from Asian countries), and that caused a change in the direction
of labor migrant fl ows (Martin 2009a). A massive infl ow of migrants to the Middle
East took place. Yet the recent crisis was diff erent because there was a global reduc-
tion in output aff ecting most migrant host countries, including the United Kingdom
and the United States.
Th e Asian fi nancial crisis was also unique. During the 1990s Asia attracted a large
portion of global capital infl ows, leading to a bubble in asset prices. After the burst of
the bubble in about 1997, a serious economic contraction aff ected countries such as
Indonesia, the Republic of Korea, and Th ailand. Nonetheless, the economic downturn
was temporary, and no major implications were seen for the long-term trajectory of
international migration. Moreover, the impact was mostly regional, quite the opposite
of the recent global crisis, which was a worldwide phenomenon.
Th e Status of Remittances to Bangladesh and Pakistan
Figures 13.1 and 13.2 show the level and growth rate of monthly remittance fl ows to
Bangladesh and Pakistan, respectively, for the period January 2007 to September 2010.
As shown in fi gure 13.1, for Bangladesh a signifi cant decline in the growth rate (year-
to-year) of these transfers started about mid-2008. Th e growth rate remained positive
for 2009 and increased toward the end of that year. Since mid-2010 a slight decrease in
remittances to Bangladesh has occurred.
In the case of Pakistan (fi gure 13.2), there was a marked downturn in the growth rate
during October 2008, so some evidence of the eff ect of the crisis may be seen, but this
downturn was short lived. However, more worrisome is the current drop in the growth
rate of remittances that has been occurring since October 2009, one year after the peak
of the crisis. Th is tendency is somewhat similar to that of Bangladesh. For both coun-
tries, fl ows seem to be slowing or decreasing since October 2009.

156 l GUNTUR SUGIYARTO, CARLOS VARGAS-SILVA, AND SHIKHA JHA
FIGURE 13.1 Remittances to Bangladesh
−100102030405060
0
200
400
600
800
1,000
1,200Ja
n. 2
007
Mar
. 200
7
May
200
7
July
200
7
Sep
. 200
7
Nov
. 200
7
Jan.
200
8
Mar
. 200
8
May
200
8
July
200
8
Sep
. 200
8
Nov
. 200
8
Jan.
200
9
Mar
. 200
9
May
200
9
July
200
9
Sep
. 200
9
Nov
. 200
9
Jan.
201
0
Mar
. 201
0
May
201
0
July
201
0
Sep
. 201
0
per
cent
age
$, m
illio
ns
period
remittances growth rate
Source: Central Bank of Bangladesh.
Note: The growth rates are taken with respect to the same month of the previous year.
FIGURE 13.2 Remittances to Pakistan
−40
−20
0
20
40
60
80
200
400
600
800
1,000
per
cent
age
Jan.
200
7
Mar
. 200
7
May
200
7
July
200
7
Sep
. 200
7
Nov
. 200
7
Jan.
200
8
Mar
. 200
8
May
200
8
July
200
8
Sep
. 200
8
Nov
. 200
8
Jan.
200
9
Mar
. 200
9
May
200
9
July
200
9
Sep
. 200
9
Nov
. 200
9
Jan.
201
0
Mar
. 201
0
May
201
0
July
201
0
Sep
. 201
0
period
remittances growth rate
$, m
illio
ns
0
Source: Central Bank of Pakistan.
Note: The growth rates are taken with respect to the same month of the previous year.
Global Financial Crisis, Migration Policy, and Remittances from the United States and United Kingdom to Bangladesh and Pakistan
Changes to Migration Policy
Emigrants from Bangladesh and Pakistan typically migrate to a broad array of coun-
tries. Nonetheless, there are some consistently popular destinations among emigrants

13. MIGRATION AND REMITTANCES IN BANGLADESH AND PAKISTAN l 157
from these countries including India (the favorite destination), Saudi Arabia, the United
Kingdom, and the United States. Given the availability of data regarding labor mar-
ket conditions for migrants of these countries or from the region (that is, Asia) in the
United Kingdom and the United States, these two destination countries are the focus
of the current study.
Th e crisis had a serious impact on migration to the United States. Th ere was a 23 per-
cent decrease in intracompany transfers in 2009 compared with 2007, and the number
of low-skilled seasonal workers decreased by half over the same comparison period
(Migration Information Source 2010). Th e recession and criticism of the U.S. H-1B
visa program also prevented U.S. employers from obtaining an increase in the program
cap.1 Instead, in January 2010 the U.S. Department of Homeland Security announced a
stricter enforcement of H-1B worker rules. In August 2010, the United States also raised
H-1B visa fees by $2,000 for employers (with 50 or more employees) who have at least
half of their workforce under H-1B visas (Migration News 2010).
In the United Kingdom, the government announced a cap on the number of eco-
nomic migrants from outside the European Economic Area (EEA) that come under the
country’s points-based system (PBS).2 Th e cap cuts the number of economic migrants
from outside the EEA by about 20 percent compared with the number in 2009 and
closed, almost entirely, the highly skilled migrant category (tier 1 of the PBS). With the
changes, now almost all migrants from outside the EEA coming to the United King-
dom for work purposes must have a job off er and a sponsor. Th e U.K. government has
announced that further cuts in the number of migrants coming to the United Kingdom
(such as students) should be expected in the near future (Home Offi ce 2010b).
Remittances from the United States and United Kingdom to Bangladesh
and Pakistan
Table 13.1 provides some insights on remittances from the United Kingdom and the
United States to Bangladesh and Pakistan. Th e fi rst four columns provide information
on the amount of remittances received by the countries from the United Kingdom and
the United States during each year and the share of the total amount received (from all
over the world) represented by these fl ows. For instance, the fi rst number in column 1
(5,484.1) is the total volume of remittances received by Bangladesh from all over the
world during 2006. Th e number in the next row (826.2) is the volume of remittances
received by Bangladesh from the United States during 2006. Th e number in the third
row (15.1) is the share of total remittances to Bangladesh for which the United States
accounts (that is, (826.2/5,484.1)×100). Columns 5, 6, and 7 compare the years 2010 and
2009 for the period January to September.
In the case of Bangladesh, it seems that the United Kingdom and the United States
accounted for about 21–30 percent of the remitted fl ows. For Pakistan it seems that
both countries account for about 29–35 percent of the remitted fl ows. Hence, in both

158 l GUNTUR SUGIYARTO, CARLOS VARGAS-SILVA, AND SHIKHA JHA
cases these two countries (the United Kingdom and the United States) account for an
important share of the remitted fl ows.
In the case of Pakistan the total volume of remittances from around the world has
increased, but the share represented by the United Kingdom and the United States has
decreased. Th is decrease has been driven by a reduction in the share of remittances
accounted for by the United States. In the case of Bangladesh, the total volume of remit-
tances increased in comparison with the previous year, but the amount sent from each
of these two host countries and the share that they account for have decreased. Th e
decrease seems to be larger (in percentage terms) for fl ows from the United Kingdom.
In order to explore this last point further (the decrease in fl ows from the United
Kingdom and the United States to Bangladesh), fi gures 13.3 and 13.4 display remit-
tances from the United Kingdom and the United States to Bangladesh by month. Notice
how in the case of the United Kingdom there is a declining trend in the series since
October 2009 (similar to that of the overall fl ows). In addition, the series is volatile, and
the growth rate becomes negative at several points (including the latest observation)
but typically becomes positive again.
TABLE 13.1 Remittances to Bangladesh and Pakistan
Source2006
(1)2007
(2)2008
(3)2009(4)
2010(5)
2009(6)
Growth (%)(7)
Bangladesh
Total $, mil. 5,484.1 6,557.8 8,979.0 10,717.7 8,113.1 7,892.6 2.8
United States
$, mil. 826.2 1,086.8 1,582.5 1,514.7 1,130.4 1,167.7 −3.2
Share 15.1 16.6 17.6 14.1 13.9 14.8 −5.8
United Kingdom
$, mil. 802.9 905.4 823.3 858.9 585.8 623.8 −6.1
Share 14.6 13.8 9.2 8.0 7.2 7.9 −8.6
Combined Share 29.7 30.4 26.8 22.1 21.2 22.7 −6.8
Pakistan
Total $, mil. 5,109.5 5,989.5 7,023.3 8,700.6 7,022.0 6,502.1 8.0
United States
$, mil. 1,315.7 1,674.6 1,791.3 1,770.8 1,344.7 1,331.1 1.0
Share 25.8 28.0 25.5 20.4 19.1 20.5 −6.5
United Kingdom
$, mil. 455.6 438.6 471.5 848.6 690.5 600.9 14.9
Share 8.9 7.3 6.7 9.8 9.8 9.2 6.4
Combined Share 34.7 35.3 32.2 30.1 29.0 29.7 −2.5
Source: Authors’ calculations.
Note: The preliminary comparison in columns 5, 6, and 7 includes data from January to September. Data come from respective countries’ central banks. The “share” row is the share of total remittances received from all over the world for which that country’s (the United Kingdom or the United States) accounts, and the “combined” row is the sum of the shares for the United Kingdom and the United States.

13. MIGRATION AND REMITTANCES IN BANGLADESH AND PAKISTAN l 159
Th is diff ers markedly from the case of the United States (fi gure 13.4), where the
growth rate is positive at fi rst and then steadily becomes negative. Hence, in the case
of the United Kingdom the volatility of the series may account for some of the recent
decrease in remittances, whereas in the case of the United States a steady decrease is
seen in the growth rate of these fl ows.
FIGURE 13.3 Remittances from the United Kingdom to Bangladesh
per
cent
age
period
remittances growth rate
$, m
illio
ns
Jan.
200
7
Mar
. 200
7
May
200
7
July
200
7
Sep
. 200
7
Nov
. 200
7
Jan.
200
8
Mar
. 200
8
May
200
8
July
200
8
Sep
. 200
8
Nov
. 200
8
Jan.
200
9
Mar
. 200
9
May
200
9
July
200
9
Sep
. 200
9
Nov
. 200
9
Jan.
201
0
Mar
. 201
0
May
201
0
July
201
0
Sep
. 201
0
−60 −40 −20
0 20 40 60 80 100
0
20
40
60
80
100
120
Source: Central Bank of Bangladesh.
Note: The growth rates are taken with respect to the same month of the previous year.
FIGURE 13.4 Remittances from the United States to Bangladesh
per
cent
age
period
remittances growth rate
$, m
illio
ns
Jan.
200
7
Mar
. 200
7
May
200
7
July
200
7
Sep
. 200
7
Nov
. 200
7
Jan.
200
8
Mar
. 200
8
May
200
8
July
200
8
Sep
. 200
8
Nov
. 200
8
Jan.
200
9
Mar
. 200
9
May
200
9
July
200
9
Sep
. 200
9
Nov
. 200
9
Jan.
201
0
Mar
. 201
0
May
201
0
July
201
0
Sep
. 201
0 −40 −20
0 20 40 60 80 100
0 20 40 60 80
100 120 140 160 180
Source: Central Bank of Bangladesh.
Note: The growth rates are taken with respect to the same month of the previous year.

160 l GUNTUR SUGIYARTO, CARLOS VARGAS-SILVA, AND SHIKHA JHA
An implication of fi gures 13.3 and 13.4, together with table 13.1, is that even if aggre-
gate remittances to these countries (Bangladesh and Pakistan) did not decrease signifi -
cantly, the sources of these money transfers may have shifted.
Given the short time period that has elapsed since the global crisis surfaced, it is dif-
fi cult to conduct a meaningful exercise that can robustly pinpoint the determinants of
changing remittance fl ows during this period. Yet the economic situation of migrants
from Bangladesh and Pakistan in these countries (the United Kingdom and the United
States) during the crisis is likely to have a strong bearing on their remittance fl ows. Th is
relationship is explored in the next two sections.
Remittances and the Economic Condition of Migrants in the United States
Th e discussion of the United States concentrates on estimates of labor market indica-
tors of individuals of Asian ethnic origin in the country. All the labor market indicators
of Asians in the United States come from the U.S. Bureau of Labor Statistics and are
estimates from the U.S. Current Population Survey. It is important to emphasize that
the Bangladeshi and Pakistani community in the United States account for a minority
of a diverse Asian population (especially when compared with Chinese, Filipinos, Indi-
ans, Japanese, Koreans, and Vietnamese, among others). However, there are no a priori
reasons to expect the dynamics of labor market characteristics for these groups to diff er
systematically from the overall Asian population in the United States.
Figure 13.5 reports on the labor force participation rate of individuals of Asian ethnic
origin in the United States. As is clear from the fi gure, a marked downtrend has been
seen for the labor force participation rate of this group. In fact, since the peak of the
crisis in October 2008, the year-to-year growth rate has been negative. In April 2008
the labor force participation rate for this group was 67.7 percent, but for April 2010 it
was 65.5 percent.
Th is fact becomes more worrisome looking at fi gure 13.6, which reports unemploy-
ment rates for Asians in the United States. Th ere was a steady increase in the unemploy-
ment rate for this group starting in October 2008, although the growth rate seems to
have decreased in mid-2010. In general, there is a smaller proportion of the U.S. Asian
population in the labor force and a higher proportion of those who are active members
of the labor force who are unemployed. Th e unemployment rate of Asians in the United
States during the crisis (and before) has been consistently lower than that of the general
U.S. population; however, the increase in the unemployment rate during the crisis for
Asian workers was higher than that of the overall U.S. population.
To link these indicators related to the labor market conditions of Asians in the
United States to remittance transfers, table 13.2 shows correlation coeffi cients between
the growth rate of remittances and the growth rate of several U.S. labor market vari-
ables for the Asian population. Th ese variables are the total population, total labor force
participants, labor force participation rate, total employed, employment ratio, total

13. MIGRATION AND REMITTANCES IN BANGLADESH AND PAKISTAN l 161
unemployed, unemployment rate, and total out-of-the-labor-force individuals. Th e cor-
relations are estimated using the current values of the variables and using up to two
leads of the remittance series. Th e data are by monthly frequency, and the period of
estimation is January 2007 to September 2010.
FIGURE 13.5 Labor Force Participation Rate of Asians in the United States
per
cent
age
period
labor force participation rate growth rate
Jan.
200
7
Mar
. 200
7
May
200
7
July
200
7
Sep
. 200
7
Nov
. 200
7
Jan.
200
8
Mar
. 200
8
May
200
8
July
200
8
Sep
. 200
8
Nov
. 200
8
Jan.
200
9
Mar
. 200
9
May
200
9
July
200
9
Sep
. 200
9
Nov
. 200
9
Jan.
201
0
Mar
. 201
0
May
201
0
July
201
0
Sep
. 201
0 −4
−3
−2
−1
0
1
2
3
4
61.0
62.0
63.0
64.0
65.0
66.0
67.0
68.0
69.0
par
tici
pat
ion
rate
(%)
Source: U.S. Bureau of Labor Statistics.
Note: The growth rates are taken with respect to the same month of the previous year.
FIGURE 13.6 Unemployment Rate of Asians in the United States
per
cent
age
period
unemployment rate growth rate
Jan.
200
7
Mar
. 200
7
May
200
7
July
200
7
Sep
. 200
7
Nov
. 200
7
Jan.
200
8
Mar
. 200
8
May
200
8
July
200
8
Sep
. 200
8
Nov
. 200
8
Jan.
200
9
Mar
. 200
9
May
200
9
July
200
9
Sep
. 200
9
Nov
. 200
9
Jan.
201
0
Mar
. 201
0
May
201
0
July
201
0
Sep
. 201
0
unem
plo
ymen
t ra
te (%
)
−40 −20
0 20 40 60 80 100 120 140
0.0 1.0 2.0 3.0 4.0 5.0 6.0 7.0 8.0 9.0
Source: U.S. Bureau of Labor Statistics.
Note: The growth rates are taken with respect to the same month of the previous year.

162 l GUNTUR SUGIYARTO, CARLOS VARGAS-SILVA, AND SHIKHA JHA
Remittances received from around the world are used in the two countries, as well
as remittances from just the United States. For example, the fi rst row for “Bangladesh
all” reports the correlation coeffi cients of remittances received from all over the world
and the U.S. labor market indicators, the next row reports similar estimates but with the
remittances series shifted forward one period, and the third row reports the coeffi cients
with the remittances series shifted forward two periods. Rows 2 and 3 are meant to
capture any lagged eff ects of changes in labor-market indicators refl ecting changes in
remittances. Th e “Bangladesh United States only” estimates present the same analysis
but using only remittances from the United States to Bangladesh.
TABLE 13.2 Correlation of Remittances and U.S. Labor Market Indicators
Country/lead remittances
Correlation of growth rate of remittances with growth rate of
P LFP LFR E ER U UR NLF
Bangladesh all
Remittances t −0.24 0.16 0.49* 0.10 0.31* 0.05 0.03 −0.58*
Remittances t +1 −0.13 0.24 0.52* 0.17 0.33* 0.09 0.06 −0.55*
Remittances t +2 0.00 0.43* 0.67* 0.34* 0.47* −0.01 −0.05 −0.64*
Bangladesh United States only
Remittances t 0.17 0.55* 0.66* 0.58* 0.72* −0.36* −0.39* −0.52*
Remittances t +1 0.31* 0.65* 0.68* 0.65* 0.72* −0.34* −0.38* −0.48*
Remittances t +2 0.43* 0.72* 0.68* 0.75* 0.79* −0.52* −0.56* −0.42*
Pakistan all
Remittances t −0.09 −0.08 −0.04 −0.16 −0.17 0.31* 0.30* −0.02
Remittances t +1 −0.02 −0.09 −0.11 −0.15 −0.21 0.32* 0.32* 0.10
Remittances t +2 0.00 0.10 0.15 0.05 0.07 0.10 0.09 −0.14
Pakistan United States only
Remittances t 0.59* 0.62* 0.31* 0.59* 0.44* −0.33* −0.37* −0.02
Remittances t +1 0.66* 0.62* 0.28 0.59* 0.40* −0.31* −0.34* 0.06
Remittances t +2 0.63* 0.71* 0.43* 0.66* 0.52* −0.36* −0.39* −0.10
Source: Authors’ calculations.
Note: An asterisk indicates that the correlation coeffi cient is different from zero at the 5 percent level. The category “Bangladesh (Pakistan) United States only” includes remittances just from the United States to Bangladesh (Pakistan). Monthly data from January 2007 to September 2010 were used in the estimation. Data on remittances come from respective countries’ central banks. E = employed; ER = employment ratio; LFP = labor force participation; LFR = labor force participation rate; NLF = not in labor force; P = population; U = unemployed; UR = unemployment rate.
Th e estimates in table 13.2 follow the a priori expectations for the case of Bangladesh
and to a lesser degree Pakistan, namely, that improved labor-market indicators are asso-
ciated with higher growth in remittances. In the case of Bangladesh, evidence is avail-
able of a positive correlation between remittances and Asian labor force participation in
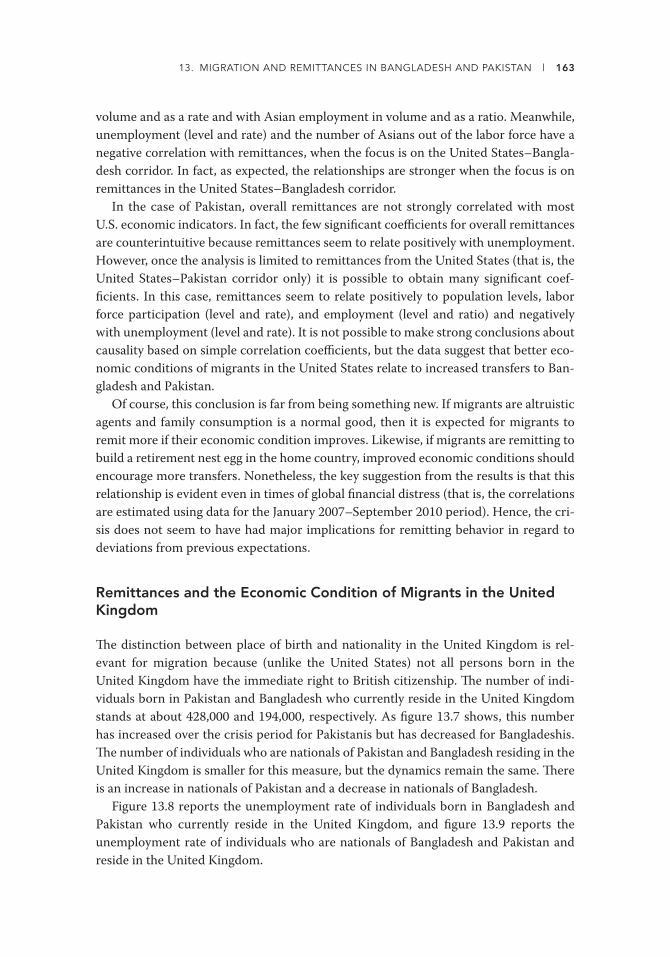
13. MIGRATION AND REMITTANCES IN BANGLADESH AND PAKISTAN l 163
volume and as a rate and with Asian employment in volume and as a ratio. Meanwhile,
unemployment (level and rate) and the number of Asians out of the labor force have a
negative correlation with remittances, when the focus is on the United States–Bangla-
desh corridor. In fact, as expected, the relationships are stronger when the focus is on
remittances in the United States–Bangladesh corridor.
In the case of Pakistan, overall remittances are not strongly correlated with most
U.S. economic indicators. In fact, the few signifi cant coeffi cients for overall remittances
are counterintuitive because remittances seem to relate positively with unemployment.
However, once the analysis is limited to remittances from the United States (that is, the
United States–Pakistan corridor only) it is possible to obtain many signifi cant coef-
fi cients. In this case, remittances seem to relate positively to population levels, labor
force participation (level and rate), and employment (level and ratio) and negatively
with unemployment (level and rate). It is not possible to make strong conclusions about
causality based on simple correlation coeffi cients, but the data suggest that better eco-
nomic conditions of migrants in the United States relate to increased transfers to Ban-
gladesh and Pakistan.
Of course, this conclusion is far from being something new. If migrants are altruistic
agents and family consumption is a normal good, then it is expected for migrants to
remit more if their economic condition improves. Likewise, if migrants are remitting to
build a retirement nest egg in the home country, improved economic conditions should
encourage more transfers. Nonetheless, the key suggestion from the results is that this
relationship is evident even in times of global fi nancial distress (that is, the correlations
are estimated using data for the January 2007–September 2010 period). Hence, the cri-
sis does not seem to have had major implications for remitting behavior in regard to
deviations from previous expectations.
Remittances and the Economic Condition of Migrants in the United Kingdom
Th e distinction between place of birth and nationality in the United Kingdom is rel-
evant for migration because (unlike the United States) not all persons born in the
United Kingdom have the immediate right to British citizenship. Th e number of indi-
viduals born in Pakistan and Bangladesh who currently reside in the United Kingdom
stands at about 428,000 and 194,000, respectively. As fi gure 13.7 shows, this number
has increased over the crisis period for Pakistanis but has decreased for Bangladeshis.
Th e number of individuals who are nationals of Pakistan and Bangladesh residing in the
United Kingdom is smaller for this measure, but the dynamics remain the same. Th ere
is an increase in nationals of Pakistan and a decrease in nationals of Bangladesh.
Figure 13.8 reports the unemployment rate of individuals born in Bangladesh and
Pakistan who currently reside in the United Kingdom, and fi gure 13.9 reports the
unemployment rate of individuals who are nationals of Bangladesh and Pakistan and
reside in the United Kingdom.
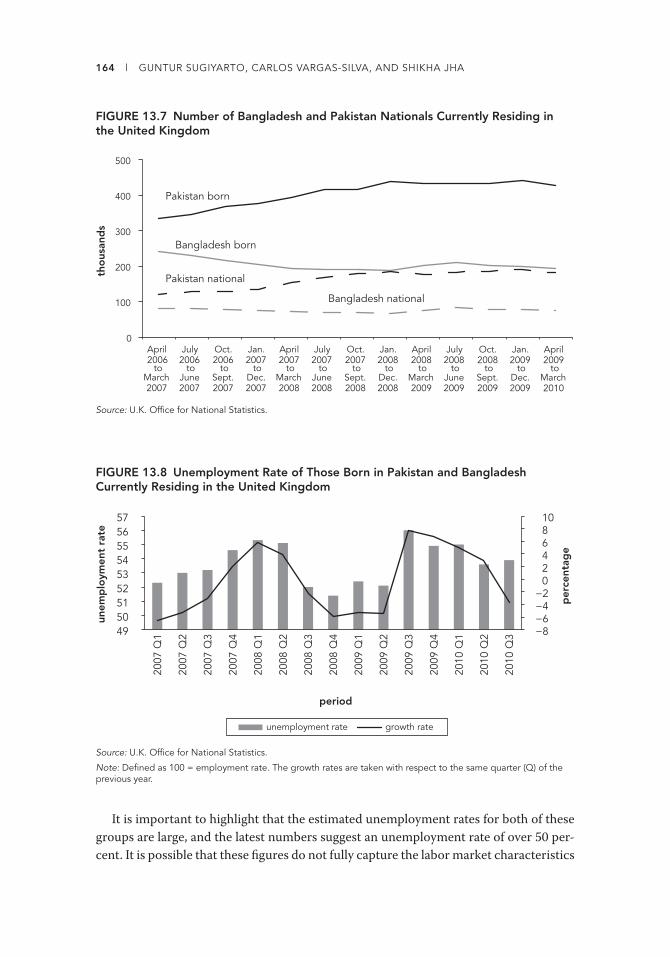
164 l GUNTUR SUGIYARTO, CARLOS VARGAS-SILVA, AND SHIKHA JHA
It is important to highlight that the estimated unemployment rates for both of these
groups are large, and the latest numbers suggest an unemployment rate of over 50 per-
cent. It is possible that these fi gures do not fully capture the labor market characteristics
FIGURE 13.7 Number of Bangladesh and Pakistan Nationals Currently Residing in the United Kingdom
0
100
200
300
400
500
April2006
to March 2007
July 2006
to June 2007
Oct. 2006
to Sept. 2007
Jan. 2007
to Dec. 2007
April 2007
to March 2008
July 2007
to June 2008
Oct. 2007
to Sept. 2008
Jan. 2008
to Dec. 2008
April 2008
to March 2009
July 2008
to June 2009
Oct. 2008
to Sept. 2009
Jan. 2009
to Dec. 2009
April 2009
to March 2010
tho
usan
ds
Bangladesh born
Pakistan born
Bangladesh national
Pakistan national
Source: U.K. Offi ce for National Statistics.
FIGURE 13.8 Unemployment Rate of Those Born in Pakistan and Bangladesh Currently Residing in the United Kingdom
per
cent
age
period
unemployment rate growth rate
unem
plo
ymen
t ra
te
−8 −6 −4 −2
0 2 4 6 8 10
49 50 51 52 53 54 55 56 57
2007
Q1
2007
Q2
2007
Q3
2007
Q4
2008
Q1
2008
Q2
2008
Q3
2008
Q4
2009
Q1
2009
Q2
2009
Q3
2009
Q4
2010
Q1
2010
Q2
2010
Q3
Source: U.K. Offi ce for National Statistics.
Note: Defi ned as 100 = employment rate. The growth rates are taken with respect to the same quarter (Q) of the previous year.
13. MIGRATION AND REMITTANCES IN BANGLADESH AND PAKISTAN l 165
of these groups given that these groups may have a tendency to fi nd jobs in the informal
sector. Nonetheless, the numbers are just too high and point to serious labor market
problems for Bangladeshi and Pakistani migrants in the United Kingdom. Furthermore,
previous research has shown that gender diff erences are important and that Pakistani
and Bangladeshi women in the United Kingdom generally have lower rates of economic
activity and higher rates of unemployment compared with other minority ethnic groups
and white women (Dale 2008). In terms of the dynamics, it seems that in both cases
no increase in the unemployment rate occurred during the crisis. Th ere was actually a
decrease in unemployment that started in early 2008 and lasted until mid-2009.
Table 13.3 gives the correlation coeffi cients of remittances to Bangladesh and Paki-
stan, with two measures of labor market conditions of migrants from these countries
who reside in the United Kingdom. Th e fi rst measure is the total employment (level) for
individuals born in Bangladesh and Pakistan and for individuals who are nationals of
these countries. Th e second measure is the unemployment rate presented with a similar
division. Th e data for the U.K. labor market indicators come from the U.K. Offi ce for
National Statistics and are estimates from the U.K. Labour Force Survey. Th e data are
by quarterly frequency, and the period of estimation is the fi rst quarter of 2007 to the
third quarter of 2010.
It is important to note that given that the data are by quarterly frequency, the correla-
tion coeffi cients are estimated with a limited number of observations. In fact, there is
signifi cance for only a few coeffi cients. For example, evidence shows a negative correla-
tion between the unemployment rate of those born in these countries and remittances
to Bangladesh if two leads of the U.K. corridor remittance series are used.
FIGURE 13.9 Unemployment Rate of Nationals of Pakistan and Bangladesh Currently Residing in the United Kingdom
per
cent
age
period
unemployment rate growth rate
unem
plo
ymen
t ra
te
2007
Q1
2007
Q2
2007
Q3
2007
Q4
2008
Q1
2008
Q2
2008
Q3
2008
Q4
2009
Q1
2009
Q2
2009
Q3
2009
Q4
2010
Q1
2010
Q2
2010
Q3 −15
−10
−5
0
5
10
15
46 48 50 52 54 56 58 60 62
Source: U.K. Offi ce for National Statistics.
Note: Defi ned as 100 = employment rate. The growth rates are taken with respect to the same quarter (Q) of the previous year.
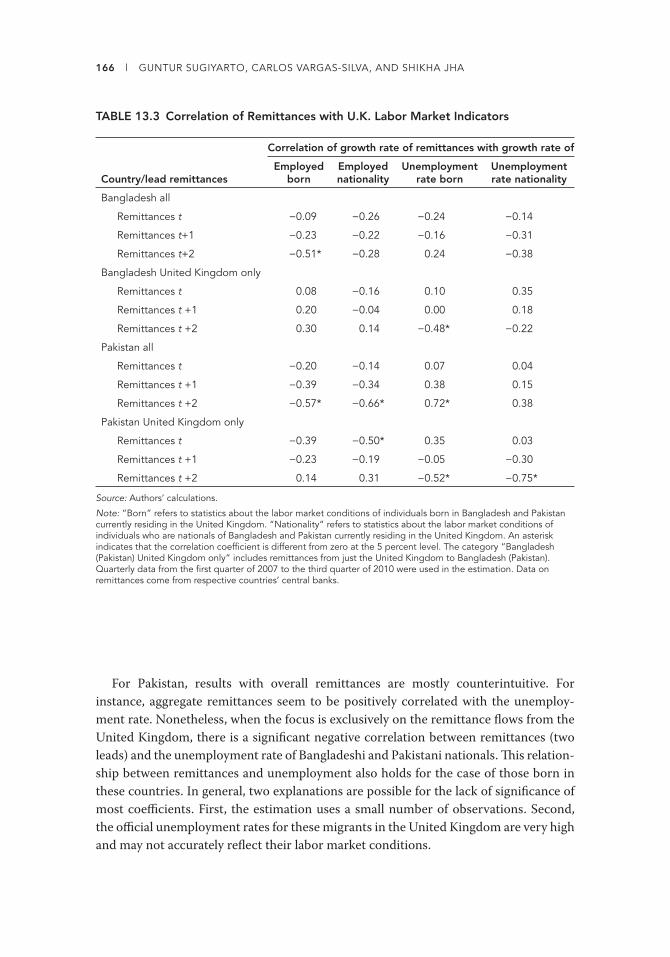
166 l GUNTUR SUGIYARTO, CARLOS VARGAS-SILVA, AND SHIKHA JHA
For Pakistan, results with overall remittances are mostly counterintuitive. For
instance, aggregate remittances seem to be positively correlated with the unemploy-
ment rate. Nonetheless, when the focus is exclusively on the remittance fl ows from the
United Kingdom, there is a signifi cant negative correlation between remittances (two
leads) and the unemployment rate of Bangladeshi and Pakistani nationals. Th is relation-
ship between remittances and unemployment also holds for the case of those born in
these countries. In general, two explanations are possible for the lack of signifi cance of
most coeffi cients. First, the estimation uses a small number of observations. Second,
the offi cial unemployment rates for these migrants in the United Kingdom are very high
and may not accurately refl ect their labor market conditions.
TABLE 13.3 Correlation of Remittances with U.K. Labor Market Indicators
Country/lead remittances
Correlation of growth rate of remittances with growth rate of
Employed born
Employed nationality
Unemployment rate born
Unemployment rate nationality
Bangladesh all
Remittances t −0.09 −0.26 −0.24 −0.14
Remittances t+1 −0.23 −0.22 −0.16 −0.31
Remittances t+2 −0.51* −0.28 0.24 −0.38
Bangladesh United Kingdom only
Remittances t 0.08 −0.16 0.10 0.35
Remittances t +1 0.20 −0.04 0.00 0.18
Remittances t +2 0.30 0.14 −0.48* −0.22
Pakistan all
Remittances t −0.20 −0.14 0.07 0.04
Remittances t +1 −0.39 −0.34 0.38 0.15
Remittances t +2 −0.57* −0.66* 0.72* 0.38
Pakistan United Kingdom only
Remittances t −0.39 −0.50* 0.35 0.03
Remittances t +1 −0.23 −0.19 −0.05 −0.30
Remittances t +2 0.14 0.31 −0.52* −0.75*
Source: Authors’ calculations.
Note: “Born” refers to statistics about the labor market conditions of individuals born in Bangladesh and Pakistan currently residing in the United Kingdom. “Nationality” refers to statistics about the labor market conditions of individuals who are nationals of Bangladesh and Pakistan currently residing in the United Kingdom. An asterisk indicates that the correlation coeffi cient is different from zero at the 5 percent level. The category “Bangladesh (Pakistan) United Kingdom only” includes remittances from just the United Kingdom to Bangladesh (Pakistan). Quarterly data from the fi rst quarter of 2007 to the third quarter of 2010 were used in the estimation. Data on remittances come from respective countries’ central banks.
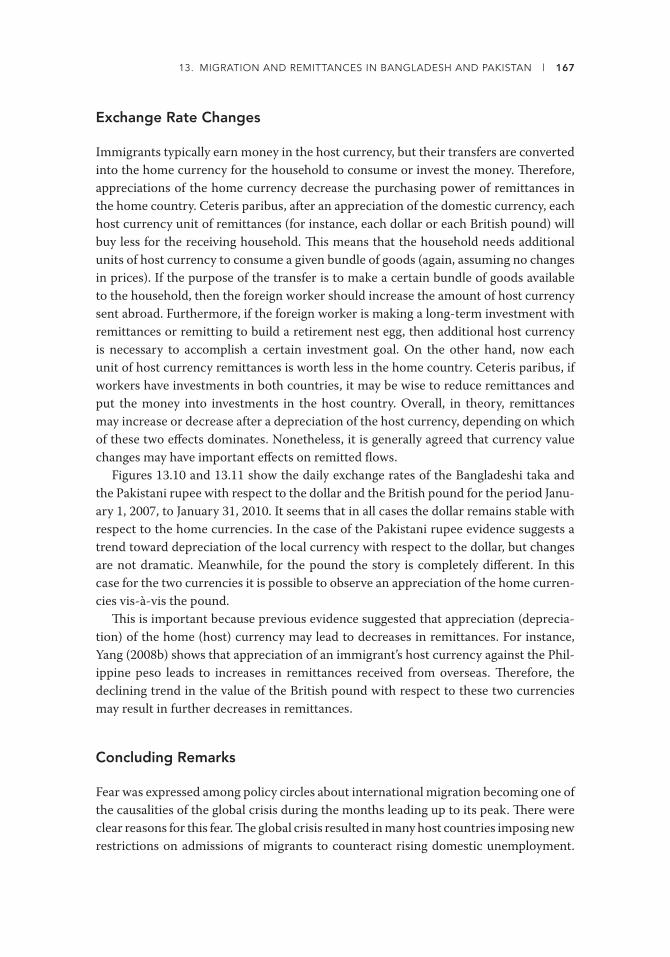
13. MIGRATION AND REMITTANCES IN BANGLADESH AND PAKISTAN l 167
Exchange Rate Changes
Immigrants typically earn money in the host currency, but their transfers are converted
into the home currency for the household to consume or invest the money. Th erefore,
appreciations of the home currency decrease the purchasing power of remittances in
the home country. Ceteris paribus, after an appreciation of the domestic currency, each
host currency unit of remittances (for instance, each dollar or each British pound) will
buy less for the receiving household. Th is means that the household needs additional
units of host currency to consume a given bundle of goods (again, assuming no changes
in prices). If the purpose of the transfer is to make a certain bundle of goods available
to the household, then the foreign worker should increase the amount of host currency
sent abroad. Furthermore, if the foreign worker is making a long-term investment with
remittances or remitting to build a retirement nest egg, then additional host currency
is necessary to accomplish a certain investment goal. On the other hand, now each
unit of host currency remittances is worth less in the home country. Ceteris paribus, if
workers have investments in both countries, it may be wise to reduce remittances and
put the money into investments in the host country. Overall, in theory, remittances
may increase or decrease after a depreciation of the host currency, depending on which
of these two eff ects dominates. Nonetheless, it is generally agreed that currency value
changes may have important eff ects on remitted fl ows.
Figures 13.10 and 13.11 show the daily exchange rates of the Bangladeshi taka and
the Pakistani rupee with respect to the dollar and the British pound for the period Janu-
ary 1, 2007, to January 31, 2010. It seems that in all cases the dollar remains stable with
respect to the home currencies. In the case of the Pakistani rupee evidence suggests a
trend toward depreciation of the local currency with respect to the dollar, but changes
are not dramatic. Meanwhile, for the pound the story is completely diff erent. In this
case for the two currencies it is possible to observe an appreciation of the home curren-
cies vis-à-vis the pound.
Th is is important because previous evidence suggested that appreciation (deprecia-
tion) of the home (host) currency may lead to decreases in remittances. For instance,
Yang (2008b) shows that appreciation of an immigrant’s host currency against the Phil-
ippine peso leads to increases in remittances received from overseas. Th erefore, the
declining trend in the value of the British pound with respect to these two currencies
may result in further decreases in remittances.
Concluding Remarks
Fear was expressed among policy circles about international migration becoming one of
the causalities of the global crisis during the months leading up to its peak. Th ere were
clear reasons for this fear. Th e global crisis resulted in many host countries imposing new
restrictions on admissions of migrants to counteract rising domestic unemployment.
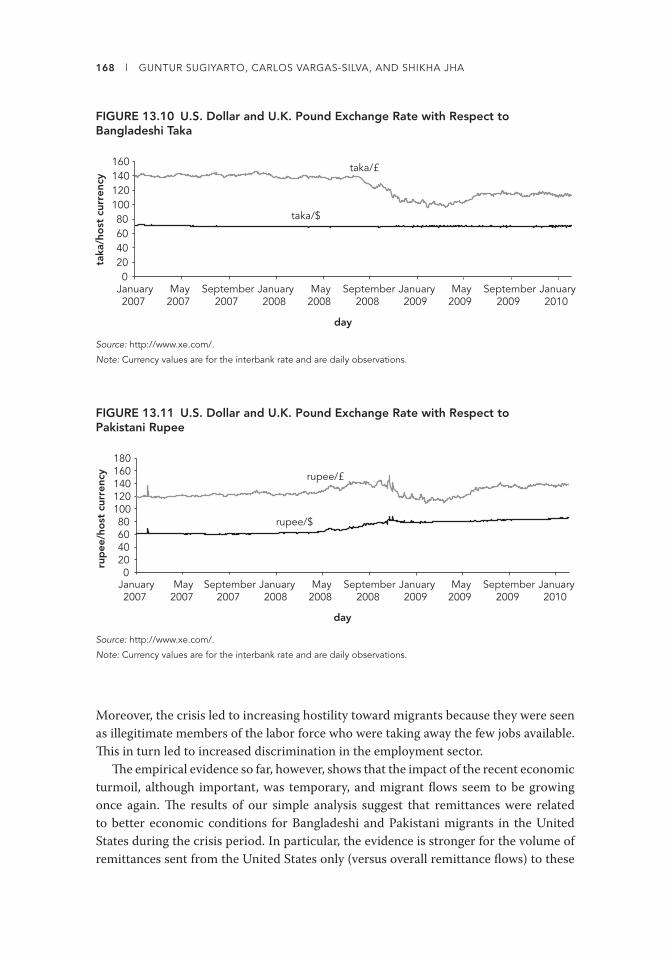
168 l GUNTUR SUGIYARTO, CARLOS VARGAS-SILVA, AND SHIKHA JHA
Moreover, the crisis led to increasing hostility toward migrants because they were seen
as illegitimate members of the labor force who were taking away the few jobs available.
Th is in turn led to increased discrimination in the employment sector.
Th e empirical evidence so far, however, shows that the impact of the recent economic
turmoil, although important, was temporary, and migrant fl ows seem to be growing
once again. Th e results of our simple analysis suggest that remittances were related
to better economic conditions for Bangladeshi and Pakistani migrants in the United
States during the crisis period. In particular, the evidence is stronger for the volume of
remittances sent from the United States only (versus overall remittance fl ows) to these
FIGURE 13.10 U.S. Dollar and U.K. Pound Exchange Rate with Respect to Bangladeshi Taka
0 20 40 60 80
100 120 140 160
taka
/ho
st c
urre
ncy
taka/$
taka/£
day
January2007
May2007
September2007
January2008
May2008
September2008
January2009
May2009
September2009
January2010
Source: http://www.xe.com/.
Note: Currency values are for the interbank rate and are daily observations.
FIGURE 13.11 U.S. Dollar and U.K. Pound Exchange Rate with Respect to Pakistani Rupee
rup
ee/h
ost
cur
renc
y
rupee/$
rupee/£
20 40 60 80
100 120 140 160 180
day
0 January2007
May2007
September2007
January2008
May2008
September2008
January2009
May2009
September2009
January2010
Source: http://www.xe.com/.
Note: Currency values are for the interbank rate and are daily observations.

13. MIGRATION AND REMITTANCES IN BANGLADESH AND PAKISTAN l 169
countries. Less evidence is at hand of migrant economic conditions in the United King-
dom having an impact on the remitted fl ows to Pakistan and Bangladesh, most likely
because of the smaller number of observations available.
In addition, for the case of Bangladesh it seems that the country is receiving fewer
remittances from the United Kingdom and the United States, but that increases from
other countries more than compensate for the decrease. Finally, it seems that although
there have not been dramatic changes in the value of the dollar with respect to the two
home currencies (although there was some appreciation with respect to the Pakistani
rupee), these currencies have gained ground when compared with the British pound.
If this trend continues, it may lead to further decreases in remittances from the United
Kingdom to these countries.
In regards to migration, both the United Kingdom and United States have become
more restrictive in recent years. In the United States, the Department of Homeland
Security announced stricter enforcement of the rules of the H-1B visa program, and the
U.S. Congress raised the H-1B visa fee for employers with more than 50 percent H-1B
visa holder employees. In the United Kingdom, the Home Offi ce announced a cap on
the number of non-EEA economic migrants coming under the country’s point-based
system and announced further cuts in migration. Th ese measures may have long-term
implications for migration from Bangladesh and Pakistan to these countries.
In general, the evidence suggests that the behavior of remittance fl ows during the
crisis was similar to the commonly held expectations about these fl ows. Further explo-
ration of the impact of the global economic downturn on remittance fl ows in other
countries and diff erent contexts is necessary to facilitate cross-country comparisons
and ultimately establish the likely long-term consequences of the crisis for remittances.
Notes
1. Th e U.S. H-1B visa program allows the employment of foreign workers in specialty occupa-
tions. Th ere is a cap of 65,000 workers who may be issued a visa, although the cap has been
raised on several occasions. Foreign workers in universities and nonprofi t research institu-
tions are excluded from the cap.
2. Th e PBS is a system for managing migration for those wishing to enter the United Kingdom
for work or study from outside the EEA and Switzerland. Tier 1 allows for the entry of highly
skilled individuals without a job off er. Tier 2 allows for the entry of skilled workers with a job
off er. Tier 3 allows for the entry of low-skilled workers but has been permanently closed. Tier
4 is for students, and tier 5 is for temporary workers.


171
Chapter 14
Impacts of the Crisis on Migrants and Their Families: A Case Study from Bangladesh
GUNTUR SUGIYARTO, SELIM RAIHAN, CARLOS VARGAS-SILVA, AND SHIKHA JHA
This case study summarizes the results from a household survey in Bangladesh
that explores the impact of the global fi nancial crisis on migrants and their families.
Bangladesh is one of the top-10 remittance-receiving countries in the world and one
of the major labor-exporting countries in Asia (Irving, Mohapatra, and Ratha 2010;
Mohapatra and Ozden 2009; Rahman 2009; Ullah and Panday 2007). Other similar
countries included in the survey were Indonesia and the Philippines. Th e survey is part
of an eff ort to examine the impact of the global crisis on migration and remittance in
Asia and is conducted at diff erent levels, that is, international, country, sectoral, and
migrant household levels.
Th e survey explored the impact of the global crisis on out-migration and remittances
received, migrants’ and households’ coping mechanisms, and the general knowledge of
households about the global crisis. Th e overall results suggest that although it is possi-
ble to observe a signifi cant impact of the global fi nancial crisis on migration and remit-
tances at the macrolevel in Bangladesh, the impact of the crisis diff ers across diff erent
geographical locations and refl ects the economic and social background of the migrants
and their countries of destination.
Th is chapter is based on the results of the Asian Development Bank’s project Research and Development Technical Assis-
tance (RDTA) 7436: Global Crisis, Remittance and Poverty in Asia. Th e views expressed in the chapter are those of the
authors and do not necessarily refl ect the views or policies of ADB.

172 l GUNTUR SUGIYARTO, SELIM RAIHAN, CARLOS VARGAS-SILVA, AND SHIKHA JHA
The Survey
Th e sample consists of 217 randomly chosen migrant households (defi ned as a house-
hold that had at least one member working abroad during the August 2007 to Sep-
tember 2008 period) from three subdistricts (upazillas) of three diff erent districts. Th e
selection of districts was made to obtain samples from divergent backgrounds, and
the selection of the migrant households was independent of the status of the migrant
(that is, regular or irregular) in the country of destination. Th e selection of the three
upazillas facilitates drawing information from migrants located in several destination
countries. Table 14.1 provides the distribution of the sample by geographical location.
Th e migrants from Manikganj and Gazipur districts generally go to the Middle East,
whereas migrants from Hobiganj district travel to the United Kingdom. Th eir choice
of countries is a refl ection of the migrants’ education and skills as well as the existing
migration network. Given the sample size and distribution, it is clear that the survey
is not intended to provide results representative of the whole population in Bangla-
desh but to provide a quick diagnostic of the impact of the crisis on migrants and their
households in the country.
TABLE 14.1 Distribution of Samples
District Upazilla Village Number of households
Manikganj Singair Khan Baniara and Hindu Baniara 75
Gazipur Joydevpur Bhanua and Pajulia 77
Hobiganj Hobiganj Sadar Pailgram, Richi, and Nabiganj 65
Total 217
Source: Authors’ calculations.
Key Results
Th e questions in the survey collect crucial pre- and postcrisis information on selected
variables such as the dynamics of migrations and remittances and the migrants’ and
migrant households’ coping mechanism. Th ese variables are linked with the main char-
acteristics of the migrants and their families. Th e period before the fi nancial crisis cor-
responds to the period from August 2007 to September 2008, and the period of the
fi nancial crisis corresponds to the period from October 2008 to September 2009. It is
common to consider October 2008 as the peak of the fi nancial crisis. Lehman Brothers
had just fi led for bankruptcy in September 2008, representing the largest bankruptcy in
U.S. history. At global levels, the fi nancial crisis extended until late 2009 and beyond in
some countries. Hence, the period that we denote “during” the fi nancial crisis may not
yet represent the total eff ect of the crisis.
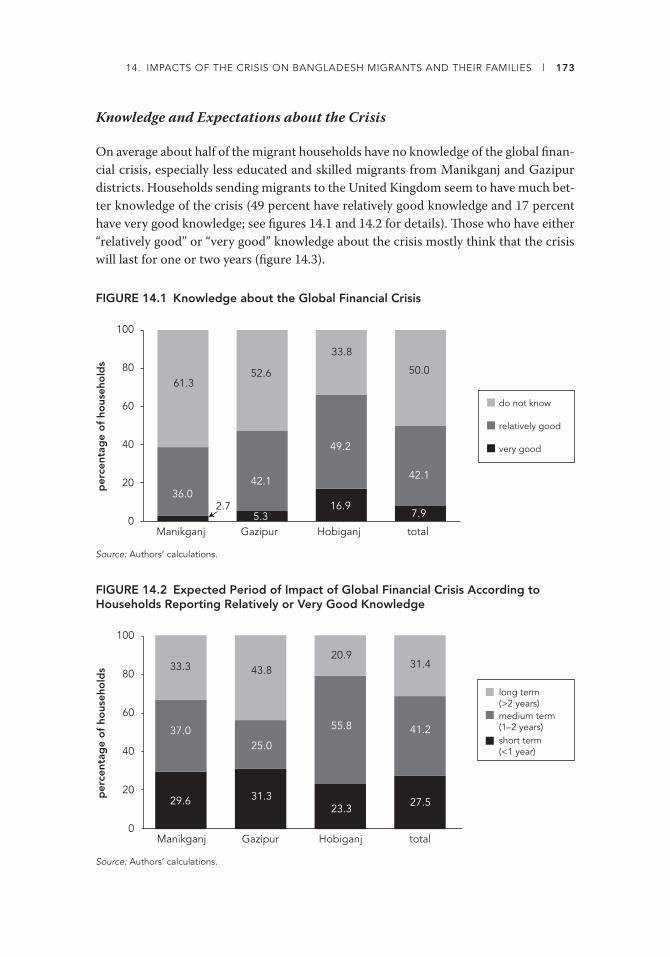
14. IMPACTS OF THE CRISIS ON BANGLADESH MIGRANTS AND THEIR FAMILIES l 173
Knowledge and Expectations about the Crisis
On average about half of the migrant households have no knowledge of the global fi nan-
cial crisis, especially less educated and skilled migrants from Manikganj and Gazipur
districts. Households sending migrants to the United Kingdom seem to have much bet-
ter knowledge of the crisis (49 percent have relatively good knowledge and 17 percent
have very good knowledge; see fi gures 14.1 and 14.2 for details). Th ose who have either
“relatively good” or “very good” knowledge about the crisis mostly think that the crisis
will last for one or two years (fi gure 14.3).
FIGURE 14.1 Knowledge about the Global Financial Crisis
per
cent
age
of
hous
eho
lds
2.75.3
16.97.9
36.042.1
49.2
42.1
61.352.6
33.8
50.0
0
20
40
60
80
100
Manikganj Gazipur Hobiganj total
do not know
relatively good
very good
Source: Authors’ calculations.
FIGURE 14.2 Expected Period of Impact of Global Financial Crisis According to Households Reporting Relatively or Very Good Knowledge
29.6 31.3 23.3
27.5
37.0 25.0
55.8 41.2
33.3 43.8 20.9
31.4
long term(>2 years) medium term(1–2 years) short term(<1 year)
per
cent
age
of
hous
eho
lds
0
20
40
60
80
100
Manikganj Gazipur Hobiganj total
Source: Authors’ calculations.

174 l GUNTUR SUGIYARTO, SELIM RAIHAN, CARLOS VARGAS-SILVA, AND SHIKHA JHA
Impacts on Out-Migration
Th e impact on out-migration can clearly be seen in the number of family members
working abroad, which declined during the crisis. For the total sample, the decline is
nearly 7 percent (from an average of 1.23–1.15 family members abroad). Households
in Manikganj appear to experience the largest drop, followed by Gazipur. On the other
hand, there was almost no change in Hobiganj. Th erefore, the impact of the crisis
decline in out-migration was not universal across districts in Bangladesh, which relates
directly to the migrants’ education and skills (fi gure 14.3).
Impact on Remittances
Th e impact on remittances is evident from the 6.4 percentage point drop in the number
of households receiving remittances (table 14.2). Th e drop is greater in Manikganj (close
to 12 percentage points), whereas Gazipur appears to be the least aff ected (a 1.5 per-
centage point drop).
In terms of remittance income, migrant households, on average, experienced an
18.8 percent fall in remittance income during the crisis period (table 14.3). In Hobiganj
households suff ered a 58 percent fall in remittance income. Gazipur was the exception,
where the volume of remittances increased by 13 percent.
A majority of households that received remittances on a frequent basis (such as
monthly) before the crisis were also receiving transfers at the same frequency during
the crisis. Yet many of those that had been receiving remittances less frequently (for
example, four times per year) received these fl ows with even less frequency during the
FIGURE 14.3 Average Number of Family Members Working Abroad before and during the FInancial Crisis
aver
age
num
ber
Manikganj Gazipur Hobiganj total
before crisis during crisis
1.19 1.06 1.36 1.26 1.12 1.11 1.23 1.15
0
0.4
0.8
1.2
1.6
Source: Authors’ calculations.

14. IMPACTS OF THE CRISIS ON BANGLADESH MIGRANTS AND THEIR FAMILIES l 175
crisis. About 87 percent of the households receiving remittances on a monthly basis
before the crisis also received remittances on a monthly basis after the crisis (table 14.4).
Th e fi gure for those receiving remittances every other month is 77 percent, four times
a year almost 60 percent, and twice a year 67 percent. All of them received remittances
less frequently during or after the crisis.
TABLE 14.4 Frequency of Remittances Received before and during the Crisis
percentage of households
Remittances before the crisis
Remittances during the crisis
MonthlyEvery other
monthFour times
a yearTwice a
yearOnce a
year Other
Monthly 86.96 4.35 0.00 0.00 4.35 4.35
Every other month 0.00 77.42 8.06 6.45 0.00 8.06
Four times a year 0.00 2.47 59.26 25.93 6.17 6.17
Twice a year 0.00 0.00 6.67 66.67 13.33 13.33
Once a year 0.00 0.00 0.00 50.00 33.33 16.67
Other 14.29 14.29 0.00 0.00 0.00 71.43
Source: Authors’ calculations.
Th e crisis seems to have increased the use of formal channels such as bank and
money transfer institutions and reduced the use of informal channels such as hundi
TABLE 14.2 Receiving Remittances from Migrants
Receiving remittances
Manikganj Gazipur Hobiganj Total
Before During Before During Before During Before During
Percentage of households 98.6 86.5 94.6 93.2 93.8 89.2 95.8 89. 7
Percentage change −12.1 −1.4 −4.6 −6.1
Source: Authors’ calculations.
TABLE 14.3 Average Amount of Remittances Received
Remittances received
Manikganj Gazipur Hobiganj Total
Before During Before During Before During Before During
Average (taka) 137,608 132,403 138,806 157,286 201,593 84,466 156,444 127,077
Percentage change −3.78 13.31 −58.10 −18.77
Source: Authors’ calculations.

176 l GUNTUR SUGIYARTO, SELIM RAIHAN, CARLOS VARGAS-SILVA, AND SHIKHA JHA
(a formal traditional form of money transfer). Th is change could be because migrants
have become more knowledgeable about the existing formal channel services, and/or
those who used to send remittances through informal channels could not do it again
for various reasons, including being laid off , having no money, and the like. Table 14.5
also suggests that households receiving remittances from banks before the crisis tend
to continue receiving remittances from banks (76.8 percent). On the other hand, about
20 percent of households who used to receive remittances through hundi before the
crisis now receive remittances through banks. Th is is a good development, which has
resulted from both supply and demand sides in the transfer market, and it is clear that
the change from informal to formal channels seems to be independent of the amount
of remittances.
TABLE 14.5 Channels of Remitting before and during the Crisis
percentage of households
Channel before the crisis
Channel during the crisis
Bank MTO Friends/coworkers Hundi Other
Bank 76.82 19.21 0.66 2.65 0.66
MTO 10.00 90.00 0.00 0.00 0.00
Friends/coworkers 0.00 0.00 100.00 0.00 0.00
Hundi 20.00 20.00 0.00 60.00 0.00
Other 37.50 50.00 0.00 0.00 12.50
Source: Authors’ calculations.
Note: MTO = money transfer operator.
Coping Mechanisms of the Migrant Households
Almost 50 percent of the migrant households experienced a decline in income during
the period under consideration. Th e negative impact is most prominent in Hobiganj,
where 64 percent of the migrant households’ income fell. Th e situation is diff erent in
Gazipur, where 73.7 percent of the migrant households actually experienced a rise in
income (fi gure 14.4). Th is dynamic is something that cannot be observed at the mac-
rolevel.
On average, more than half of the households (51.88 percent) that experienced a
drop in income during the crisis period reported that it was due to a reduction in remit-
tance income (table 14.6). Th e share is greater in Gazipur, about 62 percent, where a
complicated picture emerges, as the remittance income increased on average, but for
those households that experienced a decrease in income during the crisis, a reduction
in remittances was the main source of the decrease.
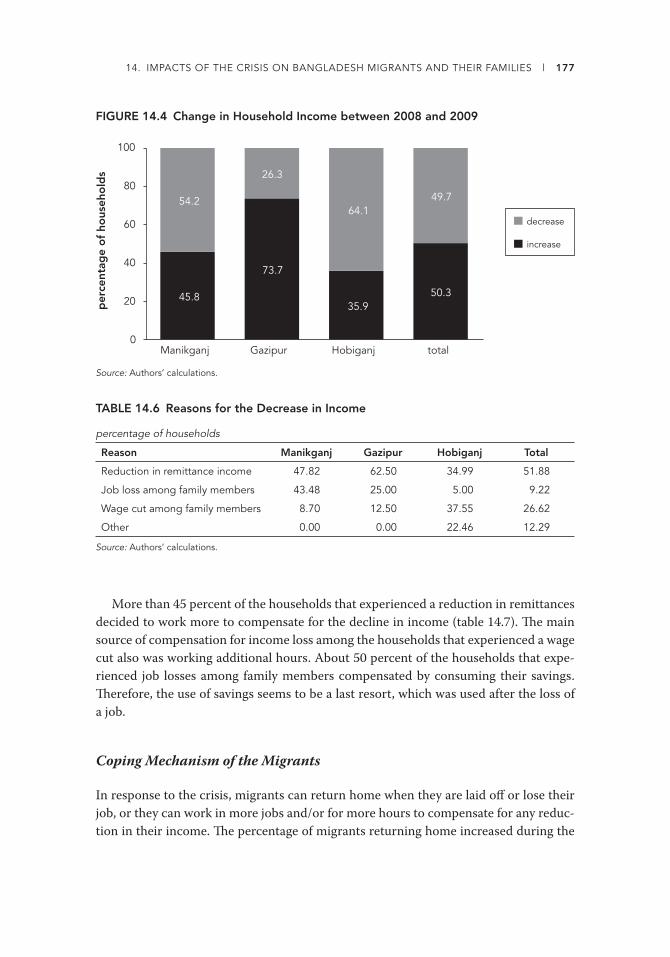
14. IMPACTS OF THE CRISIS ON BANGLADESH MIGRANTS AND THEIR FAMILIES l 177
TABLE 14.6 Reasons for the Decrease in Income
percentage of households
Reason Manikganj Gazipur Hobiganj Total
Reduction in remittance income 47.82 62.50 34.99 51.88
Job loss among family members 43.48 25.00 5.00 9.22
Wage cut among family members 8.70 12.50 37.55 26.62
Other 0.00 0.00 22.46 12.29
Source: Authors’ calculations.
More than 45 percent of the households that experienced a reduction in remittances
decided to work more to compensate for the decline in income (table 14.7). Th e main
source of compensation for income loss among the households that experienced a wage
cut also was working additional hours. About 50 percent of the households that expe-
rienced job losses among family members compensated by consuming their savings.
Th erefore, the use of savings seems to be a last resort, which was used after the loss of
a job.
Coping Mechanism of the Migrants
In response to the crisis, migrants can return home when they are laid off or lose their
job, or they can work in more jobs and/or for more hours to compensate for any reduc-
tion in their income. Th e percentage of migrants returning home increased during the
FIGURE 14.4 Change in Household Income between 2008 and 2009p
erce
ntag
e o
f ho
useh
old
s
0
20
40
60
80
100
Manikganj Gazipur Hobiganj total
decrease
increase
45.8
73.7
35.950.3
54.2
26.3
64.149.7
Source: Authors’ calculations.
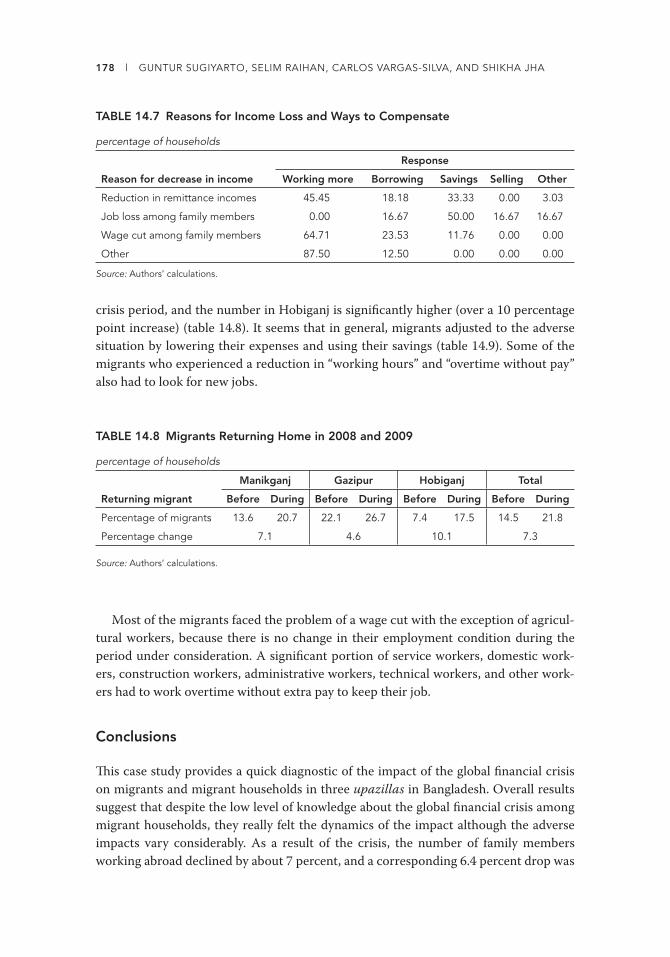
178 l GUNTUR SUGIYARTO, SELIM RAIHAN, CARLOS VARGAS-SILVA, AND SHIKHA JHA
crisis period, and the number in Hobiganj is signifi cantly higher (over a 10 percentage
point increase) (table 14.8). It seems that in general, migrants adjusted to the adverse
situation by lowering their expenses and using their savings (table 14.9). Some of the
migrants who experienced a reduction in “working hours” and “overtime without pay”
also had to look for new jobs.
TABLE 14.8 Migrants Returning Home in 2008 and 2009
percentage of households
Returning migrant
Manikganj Gazipur Hobiganj Total
Before During Before During Before During Before During
Percentage of migrants 13.6 20.7 22.1 26.7 7.4 17.5 14.5 21.8
Percentage change 7.1 4.6 10.1 7.3
Source: Authors’ calculations.
Most of the migrants faced the problem of a wage cut with the exception of agricul-
tural workers, because there is no change in their employment condition during the
period under consideration. A signifi cant portion of service workers, domestic work-
ers, construction workers, administrative workers, technical workers, and other work-
ers had to work overtime without extra pay to keep their job.
Conclusions
Th is case study provides a quick diagnostic of the impact of the global fi nancial crisis
on migrants and migrant households in three upazillas in Bangladesh. Overall results
suggest that despite the low level of knowledge about the global fi nancial crisis among
migrant households, they really felt the dynamics of the impact although the adverse
impacts vary considerably. As a result of the crisis, the number of family members
working abroad declined by about 7 percent, and a corresponding 6.4 percent drop was
TABLE 14.7 Reasons for Income Loss and Ways to Compensate
percentage of households
Reason for decrease in income
Response
Working more Borrowing Savings Selling Other
Reduction in remittance incomes 45.45 18.18 33.33 0.00 3.03
Job loss among family members 0.00 16.67 50.00 16.67 16.67
Wage cut among family members 64.71 23.53 11.76 0.00 0.00
Other 87.50 12.50 0.00 0.00 0.00
Source: Authors’ calculations.

14. IMPACTS OF THE CRISIS ON BANGLADESH MIGRANTS AND THEIR FAMILIES l 179
seen in the number of households receiving remittances and a 19 percent decline in
remittance income. Th ere are, however, marked diff erences across upazillas in regard
to the impact of the crisis. Th erefore, although at the macrolevel one may come up with
a certain conclusion about the impact of the crisis on migration and remittances in a
country such as Bangladesh, very important diff erences are still found across regions
and local levels that can be strongly linked with the background of migrants, such as
their education and skill levels.
Given the strong variation of the impact of the crisis, it seems that a “one size fi ts
all” policy approach fails to address the dynamic impacts on migrants and their fam-
ily. Policies to address the issue should carefully consider the nature of migration and
remittance practices, as well as the factors driving mobility. Th e policy should also con-
sider the migrants’ background carefully. Th ere is a need to protect migrants and their
families as they cope with the crisis and emerge as stronger individuals. Th is means
pushing for programs that support training and improving the adverse conditions that
have fueled the push factors of migration. An optimal forward-looking migration policy
should promote a “win-win-win” solution that benefi ts the host country, the sending
country, and the migrant workers and their families.
TABLE 14.9 Change in Employment Condition and Responses
percentage of households
Change in employment condition
Response to change
Lowering expenses
New job Savings
Borrowing from
family
Borrowing from
friends OtherNo
change
Wage cut 0.00 0.00 0.00 0.00 0.00 0.00 100.00
Benefi t reduction 25.00 0.00 25.00 0.00 0.00 0.00 50.00
Working hour reduction 18.92 3.60 25.23 1.80 1.80 5.41 43.24
Overtime without pay 4.35 21.74 43.48 8.70 0.00 0.00 21.74
Other 10.00 15.00 55.00 5.00 0.00 0.00 15.00
No change 9.35 0.00 3.74 1.87 0.00 4.67 80.37
Source: Authors’ calculations.


PART III


183
Chapter 15
The Impact of the Financial Crisis on Remittance Flows: The Case of El Salvador
PABLO ACOSTA, JAVIER BAEZ, RODOLFO BEAZLEY, AND EDMUNDO MURRUGARRA
The international financial crisis hit El Salvador severely. After almost two
decades of economic growth, gross domestic product (GDP) fell by 3.5 percent in 2009
driven by a decline in the manufacturing sector (output that accounts for 23 percent of
the Salvadoran GDP). Exports also fell by 16.5 percent during 2009 and by 22.9 percent
in the maquila sector (39 percent of the Salvadoran exports), a highly labor-intensive
activity. About 46 percent of the Salvadoran exports go to the United States.
Th e unemployment rate for 2009 increased by 25 percent, from 5.8 percent in 2008
to 7.3 percent in 2009, the highest of the decade. Rural unemployment is still higher
than urban unemployment even as the international crisis hit harder those employed
in urban areas, where the unemployment rate grew 29 percent (compared with 17 per-
cent in rural regions). Unemployment also rose considerably among young people, by
2.6 percentage points, from 10.7 percent in 2008 to 13.3 percent in 2009. Most of the
reduction in employment was registered in the formal sector of the economy. About
22,000 private sector formal jobs (proxied by the number of contributors to the social
security system) were lost in 2009 (about 3.4 percent of the total formal employment),
8,000 of them in the manufacturing sector (a 5.2 percent decline in the number of for-
mal manufacturing jobs), which in 2009 accounted for 27 percent of the jobs in the
country. Th e pace of formal job destruction reached its worst level in August 2009,
when more than 10,000 formal jobs were lost. Some workers moved to the informal
sector, which grew by 1.9 percent between 2008 and 2009.
Salvadorans were not only aff ected by the employment crisis and lower domestic
incomes. Th e fall in international migrant remittances aff ected the budget of numerous

184 l PABLO ACOSTA, JAVIER BAEZ, RODOLFO BEAZLEY, AND EDMUNDO MURRUGARRA
households that rely on them as the main source of income or as insurance in a context
of lower domestic income sources (Halliday 2006; Yang and Choi 2007). A signifi cant
proportion of Salvadorans are living abroad, mainly in the United States, where the
international fi nancial crisis started in September 2008. Migration has created both
a strong dependence on remittances for families left behind and a high exposure to
external shocks. Offi cial migrant remittances, which reached $3.5 billion in 2009, fell
by 8.5 percent in 2009, the fi rst decline in 20 years. Monthly data show that until March
2010 remittances were still lower than the year before in absolute terms, and that the
recovery thereafter has been milder than expected (fi gures 15.1a and 15.1b). As a con-
sequence, accumulated remittance fl ows from January to July 2010 were still lower in
absolute terms than in the same period in 2008. Th e crisis in the U.S. economy also
FIGURE 15.1 El Salvador: Main Macroeconomic Indicators
annu
al c
hang
e (%
)
−15
−10
−5
0
5
10
15
Jan.
200
8Fe
b. 2
008
Mar
. 200
8A
pr.
200
8M
ay 2
008
June
200
8Ju
ly 2
008
Aug
. 200
8Se
p. 2
008
Oct
. 200
8N
ov. 2
008
Dec
. 200
8Ja
n. 2
009
Feb
. 200
9M
ar. 2
009
Ap
r. 2
009
May
200
9Ju
ne 2
009
July
200
9A
ug. 2
009
Sep
. 200
9O
ct. 2
009
Nov
. 200
9D
ec. 2
009
Jan.
201
0Fe
b. 2
010
Mar
. 201
0A
pr.
201
0M
ay 2
010
June
201
0Ju
ly 2
010
Aug
. 201
0Se
p. 2
010
a. Remittances, 2008–10
−12−10−8−6−4−2
0246
Jan.
200
8
Feb
. 200
8
Mar
. 200
8
Ap
r. 2
008
May
200
8
June
200
8
July
200
8
Aug
. 200
8
Sep
. 200
8
Oct
. 200
8
Nov
. 200
8
Dec
. 200
8
Jan.
200
9
Feb
. 200
9
Mar
. 200
9
Ap
r. 2
009
May
200
9
June
200
9
July
200
9
Aug
. 200
9
Sep
. 200
9
Oct
. 200
9
Nov
. 200
9
Dec
. 200
9
b. Formal employment, 2008–09
all sectors
manufacturing
annu
al c
hang
e (%
)
Sources: Central Bank of El Salvador, U.S. Bureau of Economic Analysis, and U.S. Bureau of Labor Statistics.

15. THE IMPACT OF THE FINANCIAL CRISIS ON REMITTANCE FLOWS: EL SALVADOR l 185
reduced the prospects of economic opportunities for future migrants in El Salvador,
particularly young people, building additional pressure on local labor markets.
Th e 2009 fi nancial crisis is not the fi rst external shock to uncover the high vulner-
ability of El Salvador to external forces. In 2007–08, during the international food and
fuel crisis, the rise in these commodities prices wiped out almost all the gains in terms
of poverty reduction achieved by 2007, bringing the country back to the poverty levels
observed in 2001. Th e poverty head count rate increased from 35.5 percent in 2007 to
42.3 in 2008, reaching the highest ratio since 2002, and showing that the Salvadoran
economy is fragile and highly vulnerable to external shocks. Once again, the 2009 inter-
national fi nancial crisis has made it clear that El Salvador is quite vulnerable to the evo-
lution of the U.S. economy, not only in terms of exports but also through the migrant
remittances channel.
Th is chapter focuses on the transmission channel of remittances from the United
States in a context of crisis in the development prospects of El Salvador, including its
ultimate impact on poverty and welfare.
Migration and Remittances in El Salvador
Starting in the 1970s, armed confl icts displaced a large proportion of the Salvadoran
population. Approximately 15 percent of the population emigrated between 1979 and
1989 (Funkhouser 1997). Estimates suggest that in 2005 about 1.13 million Salvadorans
were living abroad, representing 16 percent of the total Salvadoran population (Ratha
and Shaw 2007). Of these migrants, approximately 914,000 Salvadorans (81 percent of
migrants) went to the United States.
In 2009 about 16 percent of Salvadoran households had one or more members liv-
ing abroad, a fi gure that has been almost stable for the last decade. Despite this stable
migration trend, a change in the segment of population that migrates has taken place.
In the late 1990s migration was rather equally distributed across area of residence and
gender, but since 2000 the majority of migrants are males from urban areas, refl ecting
the economic slowdown during 2001 (World Bank 2009g). In 2009, of the households
with at least one member who had out-migrated, 60 percent were urban, and 40 percent
were living in rural areas. During the last 10 years, about 68 percent of the Salvadorans
leaving the country were less than 30 years old at the time of migration. Despite an
increase in the fraction of low-income households with external migrants in the last
years, households at the top of the income distribution are still more than twice as likely
to have migrants as the ones at the bottom.
Young people are more likely to migrate because they face lower costs in moving and
have higher lifetime returns. About 60 percent of Salvadorans who migrated between
1998 and 2007 were aged 18–30 in the year of migration. Th is proportion of young
migrants is much higher than for other developing countries, where just half of the
migrants are between 12 and 30 years old. Nearly 63 percent of them are male, and

186 l PABLO ACOSTA, JAVIER BAEZ, RODOLFO BEAZLEY, AND EDMUNDO MURRUGARRA
75 percent have parents living in El Salvador. About 94 percent of the migrant youth
are working in the destination country (as opposed to studying), and 79 percent of the
young working migrants send remittances back home at least once a year.
Indeed, Salvadoran migration has led to a strong dependence on remittances. In 2009
total fi nancial infl ow of remittances was close to $3.5 billion. In relative terms, they
represented around 16.4 percent of GDP. El Salvador ranked 11th among the top world
remittance recipients as measured by the ratio of total remittances to GDP in 2007.
About 21.3 percent of the households reported having received money from abroad
in 2009 (World Bank 2009c). Rural households and mid-low and middle-income seg-
ments of the population are more dependent on remittances. Measured by their share
in the total income, the dependency on remittances for people in mid-low and middle
quintiles is nearly 45 percent larger compared with the dependency found at the bottom
(12.8 percent) and top (8.8 percent) of the income distribution (World Bank 2009c).
Remittances represent a signifi cant share of total domestic budget. Before the crisis,
remittances amounted to 11.4 percent of the total household income (data for 2007).
Th is share is much larger when looking only at recipient households: 42 percent of their
total incomes. Nevertheless, remarkable diff erences can be seen in the weight of remit-
tances by area. Indeed, the share of remittances in total incomes is 15.4 percent in rural
areas and 9.2 percent in urban areas.
The Effects of the Financial Crisis on Remittances and Migration Prospects
In the case of El Salvador, remittance transfers are sent typically by nationals who reside
in the United States. Consequently, the fl ow of transfers is highly dependent on U.S.
economic business cycles. During the 2000s, data indicate that remittances are procy-
clical, with comovements in fl uctuations between real U.S. GDP growth and the real
growth in the fl ow of remittances sent to El Salvador (fi gure 15.2a).
Between 2000 and 2010, the conditional correlation between remittances and U.S.
GDP was 0.926, after accounting for time trends and quarterly eff ects. Th at is, on aver-
age a decline of 1 percent in the U.S. quarterly real GDP growth rate is associated with
a reduction of almost similar magnitude in the quarterly real growth rate of remittances
being sent to El Salvador. A similar conclusion can also be derived from the correlation
between total unemployment in the United States and remittances sent to El Salvador,
which moves in opposite directions (fi gure 15.2b). An increase of unemployment in the
United States by 1 percent would reduce the growth rate of remittances by more than
6 percent.
Th e evolution of these key U.S. macroeconomic indicators explains the fall in remit-
tances to El Salvador during 2009. GDP in the United States declined by 3.5 percent in
2009, and the unemployment rate in December 2009 in the United States was 10 percent,
up from 7.4 percent a year before. Moreover, the U.S. unemployment rate for Hispanics
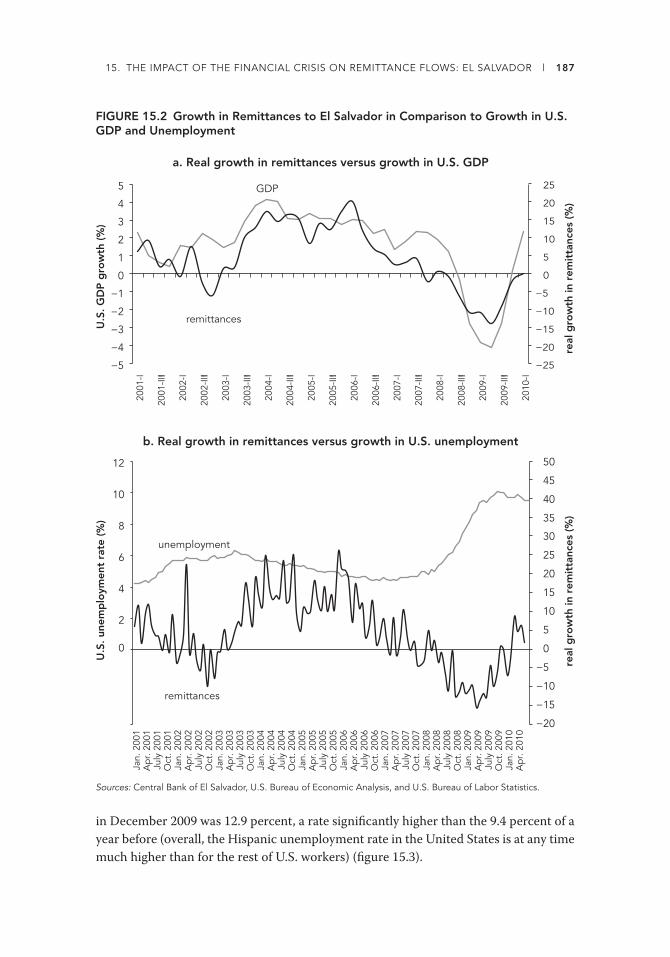
15. THE IMPACT OF THE FINANCIAL CRISIS ON REMITTANCE FLOWS: EL SALVADOR l 187
in December 2009 was 12.9 percent, a rate signifi cantly higher than the 9.4 percent of a
year before (overall, the Hispanic unemployment rate in the United States is at any time
much higher than for the rest of U.S. workers) (fi gure 15.3).
FIGURE 15.2 Growth in Remittances to El Salvador in Comparison to Growth in U.S. GDP and Unemployment
U.S
. GD
P g
row
th (%
)
a. Real growth in remittances versus growth in U.S. GDP
b. Real growth in remittances versus growth in U.S. unemployment
−5
−4
−3
−2
−1
0
1
2
3
4
5
remittances
−20
−15
−10
−5
0
5
10
15
20
25
2001
-I !20
01-II
I
2002
-I !20
02-II
I
2003
-I !20
03-II
I
2004
-I !20
04-II
I
2005
-I !20
05-II
I
2006
-I !20
06-II
I
2007
-I !20
07-II
I
2008
-I !20
08-II
I
2009
-I !20
09-II
I
2010
-I
GDP
U.S
. une
mp
loym
ent
rate
(%)
0
2
4
6
8
10
12
Jan.
200
1A
pr.
200
1Ju
ly 2
001
Oct
. 200
1Ja
n. 2
002
Ap
r. 2
002
July
200
2O
ct. 2
002
Jan.
200
3A
pr.
200
3Ju
ly 2
003
Oct
. 200
3Ja
n. 2
004
Ap
r. 2
004
July
200
4O
ct. 2
004
Jan.
200
5A
pr.
200
5Ju
ly 2
005
Oct
. 200
5Ja
n. 2
006
Ap
r. 2
006
July
200
6O
ct. 2
006
Jan.
200
7A
pr.
200
7Ju
ly 2
007
Oct
. 200
7Ja
n. 2
008
Ap
r. 2
008
July
200
8O
ct. 2
008
Jan.
200
9A
pr.
200
9Ju
ly 2
009
Oct
. 200
9Ja
n. 2
010
Ap
r. 2
010
−20
−15
−10
−5
0
5
10
15
20
25
30
real
gro
wth
in r
emit
tanc
es (%
)
remittances
unemployment
real
gro
wth
in r
emit
tanc
es (%
)
−25
35
40
45
50
Sources: Central Bank of El Salvador, U.S. Bureau of Economic Analysis, and U.S. Bureau of Labor Statistics.

188 l PABLO ACOSTA, JAVIER BAEZ, RODOLFO BEAZLEY, AND EDMUNDO MURRUGARRA
In parallel, recorded remittances to El Salvador fell 8.5 percent in 2009 (in nominal
terms), the most dramatic decline in the last two decades. Moreover, according to house-
hold survey data (which may also include remittances fl owing through informal chan-
nels), the drop was even more drastic: around 11.9 percent. According to the elasticities
estimated before, this fall in remittances is more in line with the predicted evolution of
U.S. unemployment, and higher than the one predicted by the evolution of U.S. GDP.
Although rural households tend to rely more on remittances, the decline in remit-
tance fl ows was sharper in urban areas (fi gure 15.4). In 2009 remittance infl ows
decreased by 12.6 percent in urban households and 11.7 percent in rural households.
Th e metropolitan area of San Salvador was among the most aff ected regions, with a
decline of about 15 percent. Th e Oriental area (where most of the migrants come from
and predominantly rural) was for some reason better off ; remittances decreased there
by 7.6 percent.
Using 2009 household survey data, we estimate that a 10 percent average decline in
remittances in El Salvador in 2009 (the average between the actual declines in macro-
economic and microeconomic fi gures of 8.5 and 11.9 percent, respectively) would have
increased national poverty by 1.6 percentage points, from a counterfactual 41.7 per-
cent to the real value of 43.3 percent in 2009. Th e poverty-increasing eff ect of lower
remittances would have been stronger in rural regions, given the higher dependency on
remittances as a source of income. In urban regions, poverty would increase from 37
(counterfactual) to 38.2 percent (actual) under an average 10 percent decline in remit-
tances for 2009, and in rural regions the change would be from 49.6 to 52 percent.
Unfortunately, a counterfactual scenario is very hard to construct in the absence of
information on migrant characteristics to estimate the amount that would have been
FIGURE 15.3 U.S. Unemployment Rates for Total Population and for Hispanics, 2005–10
U.S
. une
mp
loym
ent
rate
(%)
0
2
4
6
8
10
12
14
Jan.
200
5M
ar. 2
005
May
200
5Ju
ly 2
005
Sep
. 200
5N
ov. 2
005
Jan.
200
6M
ar. 2
006
May
200
6Ju
ly 2
006
Sep
. 200
6N
ov. 2
006
Jan.
200
7M
ar. 2
007
May
200
7Ju
ly 2
007
Sep
. 200
7N
ov. 2
007
Jan.
200
8M
ar. 2
008
May
200
8Ju
ly 2
008
Sep
. 200
8N
ov. 2
008
Jan.
200
9M
ar. 2
009
May
200
9Ju
ly 2
009
Sep
. 200
9N
ov. 2
009
Jan.
201
0M
ar. 2
010
May
201
0Ju
ly 2
010
total
Hispanic
Source: U.S. Bureau of Labor Statistics.

15. THE IMPACT OF THE FINANCIAL CRISIS ON REMITTANCE FLOWS: EL SALVADOR l 189
remitted if the crisis had not taken place (Acosta and others 2008). A much simpler
(though imperfect) exercise is to subtract a determined fraction of remittances from the
total income of households and recalculate the poverty head count.1
An eff ect associated with the 2009 fi nancial crisis is that, unlike previous crises,
migration prospects are now low, exerting higher pressure on local labor markets
to absorb those entering the labor force. In the past, young people have sought out-
migration as an economic strategy in times of increased youth unemployment (World
Bank 2009g). Local conditions at their destination that had worsened may also hamper
migration prospects because migrants may not be able to aff ord to cover the migration
costs of family members who stay behind. Evidence among Salvadorans in California
FIGURE 15.4 Annual Growth in Remittance Infl ows to El Salvador by Region
a. Rural and urban regions
b. Occidental, central, Oriental, and metropolitan regions
−15
−10
−5
0
5
10
15
2008 2009
annu
al g
row
th (%
)
rural
urban
−20
−15
−10
−5
0
5
10
15
20
Occidental
central1
central2
Oriental
metroSan
Salvador
2008 2009
annu
al g
row
th (%
)
Source: DGEC 2009.
190 l PABLO ACOSTA, JAVIER BAEZ, RODOLFO BEAZLEY, AND EDMUNDO MURRUGARRA
shows that 80 percent of recent migrants received help from relatives and friends in the
United States to cover trip expenses (Menjivar 2000).
However, the concurrent crisis in the United States may reduce incentives for young
people considering migration as an economic opportunity (Mandelman and Zlate
2010). For instance, recent data from the U.S. Department of Homeland Security on
Salvadoran immigration rates show that the number of nonimmigrant entries into the
United States in 2009 (including visits and legal migration) reached the lowest level in
the decade and declined by 14 percent with respect to 2008. Th ere is a clear decline
in illegal immigration: Whereas in 2005 and 2006 more than 40,000 Salvadorans were
apprehended at the Mexican border, these fi gures were less than half for the period
2007–09, with a decline of 6 percent in 2009. Th e reduction in out-migration fl ows has
increased the local labor supply and placed increasing pressure on improving youth
employability. Moreover, some migrants in the United States are returning to the
country: Although the total number of return migrants is not available yet, data from
deportations (forced return migration) from the United States doubled in 2007–09 with
respect to 2000–06 to reach more than 20,000 returns and a 2 percent increase in 2009.
As a consequence, we envisage additional diffi culties for Salvadoran labor markets to
absorb larger cohorts of young people looking for domestic employment opportunities.
Discussion and Policy Options
Th e 2009 international fi nancial crisis triggered a serious economic downturn in El Sal-
vador, not to mention signifi cant setbacks in social gains. For a recovery to occur, and
to protect the incomes of the most vulnerable population, a set of eff ective policies
are being put in place. However, shielding the incomes of Salvadorans from declines
in remittances from abroad has traditionally been out of the scope of policy makers
in El Salvador. Given the increasing importance of remittances among Salvadoran
households, public interventions in the medium run should be designed to mitigate the
impact of remittance declines. Furthermore, because forecasts of U.S. GDP and unem-
ployment growth for 2011 are modest at best, remittances are likely to continue along
the lower boundary.
Policies should aim to facilitate remittance transfers, as well as to guarantee their
safety and transparency. Th is is a complex issue, but it is also a key element of migration
policies. For instance, a well-developed fi nancial sector or entity (public or private) that
articulates the infl ows of remittances can enhance both the security and the velocity of
the process. It might also lower the cost. Evidence from El Salvador already shows that a
$1 reduction in fees can lead migrants to send up to $25 more in remittances per month
(Aycinena, Martinez, and Yang 2009). Also, savings instruments that allow a greater
degree of control of the use of the funds at home by the remitting migrant can also cre-
ate incentives to send more money back home (as shown in Ashraf and others 2009, for
the case of El Salvador).
15. THE IMPACT OF THE FINANCIAL CRISIS ON REMITTANCE FLOWS: EL SALVADOR l 191
El Salvador can also tap innovative sources of fi nancing such as securitization of
remittances. Some initiatives to induce remittances to contribute to the granting
of loans to microentrepreneurs and low-income El Salvadorans are already in place
(for instance, by Fedecredito, the largest federation of credit associations and work-
ers’ banks in El Salvador, with the support of the International Finance Corporation).
Several authors have discussed how remittances can contribute to entrepreneurship
in migrant origin countries by relaxing credit constraints to businesses (Woodruff and
Zenteno 2007; Yang 2008b).
Besides reducing the complexity of the transactions, policies should also take into
account that remittances are highly exposed to external shocks. All the U.S. economic
slowdowns will reduce the remittances received by El Salvador, and this is out of Central
American governments’ reach. However, policies exist that can reduce the impact of
the collapse and boost transactions; for instance, programs that subsidize remittance
transfers (such as matching funds) can mitigate reductions.
Finally, the policies that regulate the infl ows of remittances should be coordinated
with other social policies. For example, remittance policies can benefi t the same popu-
lation that social policies aim to help, while reducing the costs on increasing the subsi-
dies to the transfers. Because of the importance that the remittances have in Salvadoran
households’ economy, a progressive regulation can complement the eff orts of the social
policy.
Still, during the crisis, the government of El Salvador did not have appropriate fi scal
space and policy instruments to address the problem of the urban population. First, the
fall in output and remittances has also negatively aff ected the amount of fi scal revenues
collected by the government of El Salvador. Government revenues fell by 13 percent
in 2009 with respect to the year before, and as a consequence the fi scal defi cit reached
5.4 percent of GDP in 2009, compared with 3.1 percent in 2008. To strengthen public
fi nances, in March 2010 the government reached a standby arrangement with the Inter-
national Monetary Fund of about $790 million to help the country mitigate the adverse
eff ects of the global crisis. One of the key priorities of this agreement is to increase
the reach and effi ciency of social programs through the government’s general anticrisis
program (Programa General Anti-Crisis [PGA]), which will allow for almost 1 percent
of GDP (or around $200 million annually) in social spending in 2010–11.
Th e PGA includes an expansion of the conditional cash transfer program (Comuni-
dades Solidarias), the creation of a temporary employment program, and the launch
of a special public investment program concentrated on health, education, and infra-
structure. Water and electricity subsidies are also being redesigned to protect the
most vulnerable. Th ese interventions aim to protect the incomes of the most vul-
nerable households from current and future global and local economic slowdowns,
including declining remittances or massive job cuts. For instance, by taking advantage
of the well-targeted existing conditional cash transfers to the poor, rural areas of the
country can provide additional short-term benefi ts to participants and others in need
of assistance.

192 l PABLO ACOSTA, JAVIER BAEZ, RODOLFO BEAZLEY, AND EDMUNDO MURRUGARRA
An alternative scheme that the government is setting up as targeted social safety nets
for urban areas (since conditional cash transfers target rural areas) includes the devel-
opment of workfare programs, social funds, entrepreneurship and training programs,
and microcredit schemes. In this context the government has set up a comprehensive
Temporary Income Support Program (Programa de Ayuda Temporal al Ingreso [PATI]),
to off set the impacts of the economic slowdown. PATI is a workfare labor market pro-
gram that provides a temporary income transfer to targeted individuals in exchange
for their participation in community activities and services and their participation in
training activities. Th e government’s objective is that PATI become a policy instrument
capable of reaching targeted urban areas in a very short time, with interventions that do
not require the lengthy procedures of typical infrastructure projects. PATI was initiated
as a pilot intervention in two municipalities in 2009 and will expand in 2010 to reach
40,000 participants. PATI will require an eff ort of $40.5 million, or 0.7 percent of GDP,
and is currently fi nanced by the World Bank.
Despite these eff orts, the government of El Salvador still needs to coordinate these
interventions with proper policies that regulate migration and remittance infl ow. As
was shown, remittances sent by out-migrant members of households play a key role
in the standard of living of recipient families. Well-designed policies and their coordi-
nation with social and labor policies can reduce El Salvador’s vulnerability to adverse
external shocks.
Note
1. Th ese exercises could suff er from biases in two directions. On the one hand, the projections
of an artifi cial decline in remittances and its eff ect on poverty could overestimate the true
eff ect if households attempt to compensate—at least partially—for the decline in remittances
with other sources of income, for example, by increasing their labor supply. On the other
hand, the forecast could underestimate the eff ect of the decline in remittances on poverty if
part of these transfers is used—as is very likely—to engage in new economic activities and,
thus, generate additional income. In addition, their use for consumption purposes can also
have multiplicative eff ects for the economy. Furthermore, responses such as increases in
labor supply can have aggregate equilibrium eff ects such as a fall in wages, which would also
bias the projections downward.

193
Chapter 16
Remittance Flows to Mexico and Employment and Total Earnings of Mexican Immigrant Workers in the United States
JESÚS A. CERVANTES GONZÁLEZ AND ALEJANDRO BARAJAS DEL PINO
During recent years, mexico has become the world’s third highest receiver of
remittances. In the 2000–06 period, remittance fl ows to Mexico quadrupled, increas-
ing from $6,573 million in 2000 to $25,567 million in 2006, representing an average
annual growth of 25.4 percent (fi gures 16.1 and 16.2). Th is behavior responded mainly
to two factors: considerable Mexican migration to the United States, legal and illegal,
that implied a higher remittance infl ow, and the signifi cant progress made by Banco de
México in recording remittance transactions.1 An additional factor contributing to the
increase in remittance fl ows to Mexico in recent years and their shift to the formal mar-
ket is the considerable reduction in the costs of sending such transfers. From 1999 to the
present, the cost of sending remittances to Mexico fell by four-fi fths.2 However, from the
second half of 2006, and particularly in 2007, the downturn in the U.S. economy weak-
ened remittance fl ows to Mexico, which grew just 1.9 percent during the latter year. In
2008 remittance fl ows contracted 3.5 percent as the United States entered a recession,
and in 2009 this source of external revenues weakened even further, falling 15.5 percent.
We examine the factors that contributed to the signifi cant decline in remittance
fl ows to Mexico during 2007–09. Th e analysis focuses on developments and the impacts
of the declines in the U.S. labor market, considering that practically all remittance fl ows
to Mexico originate in that country. We also evaluate the recent impact of several
employment indicators on Mexican workers in the United States that have fostered an
improvement in annual remittance fl ows to Mexico since the second quarter of 2010.
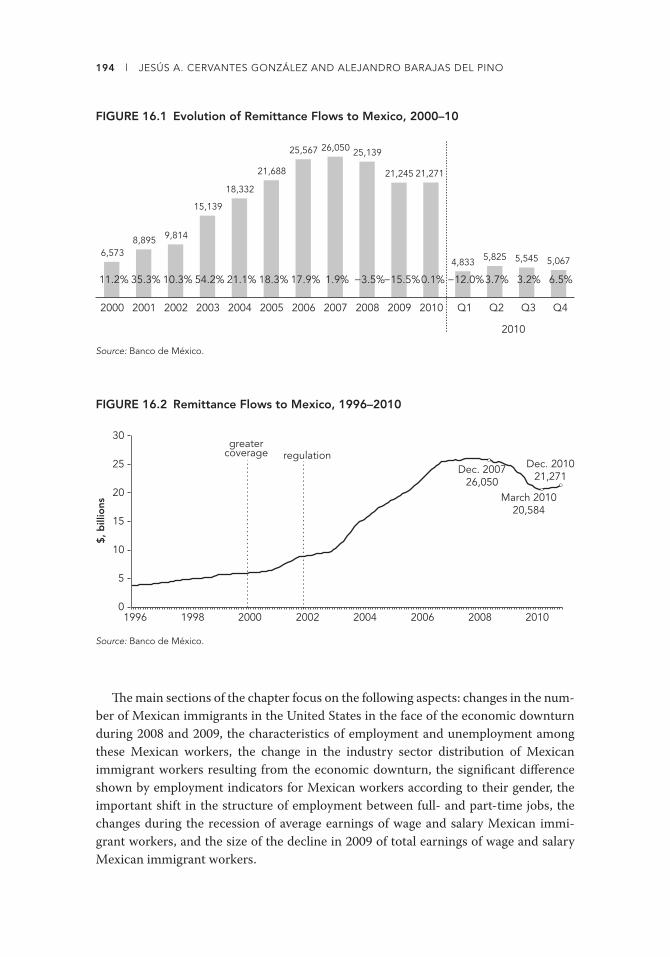
194 l JESÚS A. CERVANTES GONZÁLEZ AND ALEJANDRO BARAJAS DEL PINO
Th e main sections of the chapter focus on the following aspects: changes in the num-
ber of Mexican immigrants in the United States in the face of the economic downturn
during 2008 and 2009, the characteristics of employment and unemployment among
these Mexican workers, the change in the industry sector distribution of Mexican
immigrant workers resulting from the economic downturn, the signifi cant diff erence
shown by employment indicators for Mexican workers according to their gender, the
important shift in the structure of employment between full- and part-time jobs, the
changes during the recession of average earnings of wage and salary Mexican immi-
grant workers, and the size of the decline in 2009 of total earnings of wage and salary
Mexican immigrant workers.
FIGURE 16.1 Evolution of Remittance Flows to Mexico, 2000–10
6,5738,895 9,814
15,139
18,332
21,688
25,567 26,050 25,139
21,245 21,271
4,833 5,825 5,545 5,067
11.2% 35.3% 10.3% 54.2% 21.1% 18.3% 17.9% 1.9% −3.5%−15.5%0.1% −12.0%3.7% 3.2% 6.5%
2000 2001 2002 2003 2004 2005 2006 2007 2008 2009 2010 Q1 Q2 Q3 Q4
2010
Source: Banco de México.
FIGURE 16.2 Remittance Flows to Mexico, 1996–2010
$, b
illio
ns
0
5
10
15
20
25
30
1996 1998 2000 2002 2004 2006 2008 2010
greatercoverage regulation
Dec. 201021,271
March 201020,584
Dec. 200726,050
Source: Banco de México.

16. REMITTANCE FLOWS TO MEXICO AND EMPLOYMENT OF MEXICAN IMMIGRANTS l 195
It is worth mentioning that the decline of total earnings was larger for Mexicans
without citizenship and with lower levels of educational attainment.3 Most of the indi-
cators shown in this chapter are the authors’ own estimates based on information from
the Current Population Survey (CPS), conducted by the U.S. Census Bureau.4
Mexican Immigrants in the U.S. Population and Labor Force
In 2009 there were 31.7 million Mexicans in the United States (table 16.1).5 Of these,
11.6 million were immigrants (3.9 percent of the total population) and represented
almost one-third (31.1 percent) of the total immigrant population. Th e labor force par-
ticipation rate of Mexican immigrants was 66.2 percent, a much larger rate than that
observed for the U.S. population as a whole (51.2 percent). Th e latter refl ects the fact
that most Mexican immigrants are of working age and have a greater need to work than
their American counterparts (given that most of them do not have access to unemploy-
ment insurance and social security).
TABLE 16.1 Population and Immigrants in the United States, 2008–09
Population group
Population Variation
2008 2009 Absolute Relative
Total population 299,083,400 301,364,940 2,281,540 0.76
Native 261,489,638 264,056,021 2,566,383 0.98
Immigrant 37,593,762 37,308,919 −284,843 −0.76
Total Hispanic 46,384,662 47,833,218 1,448,556 3.12
Mexican 30,801,801 31,671,267 869,466 2.82
Native 19,031,027 20,073,834 1,042,807 5.48
Immigrant 11,770,774 11,597,433 −173,341 −1.47
Total labor force 154,286,645 154,142,007 −144,638 −0.09
Total employed 145,362,386 139,877,462 −5,484,924 −3.77
Mexican immigrant labor force 7,674,183 7,677,143 2,960 0.04
Employed Mexican immigrant 7,122,007 6,786,220 −335,787 −4.71
Source: Authors’ calculations.
Note: Total population fi gures take into account only the civilian noninstitutional population; that is, they do not include the population residing in penal institutions, mental institutions, or the military on active service.
In the United States during 2009, the total number of immigrants declined on
average by 285,000 individuals (0.76 percent; table 16.1). Of this number, 61 percent
(173,000 individuals) were Mexican, implying a 1.47 percent reduction in the Mexican
immigrant population. Th is decline was infl uenced not only by the weakness of labor

196 l JESÚS A. CERVANTES GONZÁLEZ AND ALEJANDRO BARAJAS DEL PINO
demand in the United States, but also by a signifi cant increase in deportations. Th us,
the number of Mexican immigrants removed from the United States rose from 169,031
and 186,726 Mexicans in 2005 and 2006, respectively, to 208,996 and 246,851 individu-
als in 2007 and 2008 and to 282,666 Mexicans in 2009 (Offi ce of Immigration Statistics
2009). Also, the number of Mexican immigrants employed in the United States fell by
336,000 individuals, implying a larger percentage contraction of employment (4.71 per-
cent) than that registered by the labor force as a whole in that country (3.77 percent, at
an annual average rate).
Figure 16.3 shows that in 2009 the number of Mexican immigrants in the United
States was equivalent to 10.4 percent of the total population of Mexico, but the corre-
sponding percentage was higher among males (11.8 percent) than females (9.1 percent).
It also indicates that the labor force of Mexican immigrants in the United States in 2009
was equivalent to 16 percent of the economically active population of Mexico.
FIGURE 16.3 Mexican Immigrants in the United States, 2009
per
cent
Mexican immigrants in the United Statesas % of population in Mexico
0
5
10 total
male
female
15
20
Mexican workers in the United Statesas % of Mexico’s labor force
total male
female
Sources: The Mexican data are from INEGI (National Institute of Statistics) and Encuesta Nacional de Ocupación y Empleo, adjusted to incorporate the Preliminary Results of the Population Census, 2010 (INEGI 2011). The U.S. data are the authors’ estimates based on the Current Population Survey, U.S. Census Bureau.
Th e estimates of Mexican immigrant workers’ earnings in the United States
include wage and salary workers in full- and part-time jobs.6 In 2009 the number
of wage and salary immigrants of Mexican origin in the U.S. labor force included
6,161,148 individuals (table 16.2), 80.4 percent of the total Mexican immigrant labor
force (7,677,143 workers; table 16.1). Th is number was made up of 4,207,711 men
(68.3 percent of the total) and 1,953,437 women (the remaining 31.7 percent). Wage
and salary Mexican immigrant workers accounted for 5 percent of the wage and sal-
ary U.S. labor force.

16. REMITTANCE FLOWS TO MEXICO AND EMPLOYMENT OF MEXICAN IMMIGRANTS l 197
TABLE 16.2 Mexican Workers and Immigrants in the United States, 2009
Worker group
Number Percent
Total Male Female Total Male Female
Wage and salary Mexican workers
11,606,259 7,082,131 4,524,128 9.3 11.1 7.4
Immigrant 6,161,148 4,207,711 1,953,437 5.0 6.6 3.2
Citizen 1,548,183 906,211 641,972 1.2 1.4 1.1
Noncitizen 4,612,965 3,301,500 1,311,465 3.7 5.2 2.1
Native 5,445,111 2,874,420 2,570,691 4.4 4.5 4.2
Non-Mexican immigrants 12,993,485 6,895,187 6,098,298 10.4 10.9 10.0
Total immigrants 19,154,633 11,102,898 8,051,735 15.4 17.5 13.2
Total natives 105,335,238 52,435,666 52,899,572 84.6 82.5 86.8
Total workers 124,489,871 63,538,564 60,951,307 100.0 100.0 100.0
Source: Authors’ estimates with data from U.S. Census Bureau Current Population Survey.
Average Earnings of Wage and Salary Mexican Immigrant Workers
During 2009 monthly average earnings of wage and salary Mexican immigrant workers
in the United States were $2,190 (table 16.3). However, the average earnings of those
who had U.S. citizenship ($2,758) were 38 percent higher than those without it ($1,999).
Th is partly refl ected higher levels of schooling of Mexican immigrants with citizenship
than those without it and diff erences in the industry sector distribution of these two
groups of Mexicans.
TABLE 16.3 Average Monthly Earnings of Wage and Salary Mexican Immigrant Workers in the United States, 2008–09
Worker group
2008 2009 Percentage variation
Total Male Female Total Male Female Total Male Female
Wage and salary Mexican workers
2,528 2,762 2,148 2,490 2,713 2,140 −1.5 −1.8 −0.4
Immigrant 2,247 2,451 1,778 2,190 2,385 1,768 −2.5 −2.7 −0.6
Citizen 2,707 3,039 2,187 2,758 3,139 2,220 1.9 3.3 1.5
Noncitizen 2,106 2,299 1,602 1,999 2,179 1,546 −5.1 −5.2 −3.5
Native 2,857 3,242 2,425 2,829 3,194 2,425 −1.0 −1.5 0.0
Other immigrants 3,614 4,132 3,019 3,590 4,056 3,082 −0.4 −1.8 2.1
Total immigrants 3,174 3,490 2,727 3,146 3,423 2,763 −0.9 −1.9 1.3
Total natives 3,484 4,053 2,907 3,498 4,080 2,920 0.4 0.7 0.4
Total workers 3,438 3,956 2,884 3,441 3,963 2,898 0.1 0.2 0.5
Source: Authors’ estimates with data from U.S. Census Bureau Current Population Survey.
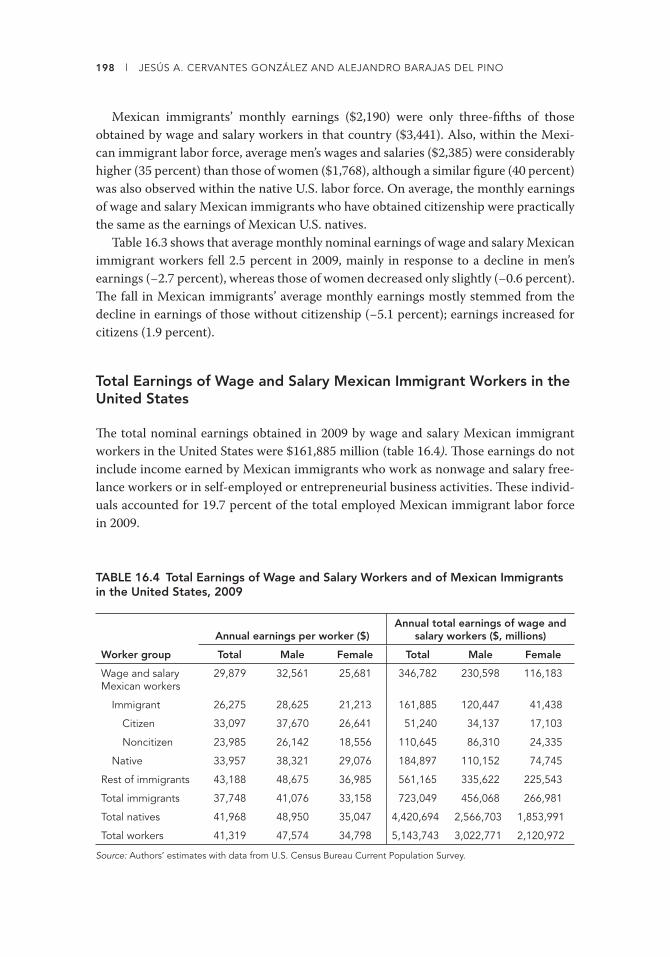
198 l JESÚS A. CERVANTES GONZÁLEZ AND ALEJANDRO BARAJAS DEL PINO
Mexican immigrants’ monthly earnings ($2,190) were only three-fi fths of those
obtained by wage and salary workers in that country ($3,441). Also, within the Mexi-
can immigrant labor force, average men’s wages and salaries ($2,385) were considerably
higher (35 percent) than those of women ($1,768), although a similar fi gure (40 percent)
was also observed within the native U.S. labor force. On average, the monthly earnings
of wage and salary Mexican immigrants who have obtained citizenship were practically
the same as the earnings of Mexican U.S. natives.
Table 16.3 shows that average monthly nominal earnings of wage and salary Mexican
immigrant workers fell 2.5 percent in 2009, mainly in response to a decline in men’s
earnings (−2.7 percent), whereas those of women decreased only slightly (−0.6 percent).
Th e fall in Mexican immigrants’ average monthly earnings mostly stemmed from the
decline in earnings of those without citizenship (−5.1 percent); earnings increased for
citizens (1.9 percent).
Total Earnings of Wage and Salary Mexican Immigrant Workers in the United States
Th e total nominal earnings obtained in 2009 by wage and salary Mexican immigrant
workers in the United States were $161,885 million (table 16.4). Th ose earnings do not
include income earned by Mexican immigrants who work as nonwage and salary free-
lance workers or in self-employed or entrepreneurial business activities. Th ese individ-
uals accounted for 19.7 percent of the total employed Mexican immigrant labor force
in 2009.
TABLE 16.4 Total Earnings of Wage and Salary Workers and of Mexican Immigrants in the United States, 2009
Worker group
Annual earnings per worker ($)Annual total earnings of wage and
salary workers ($, millions)
Total Male Female Total Male Female
Wage and salary Mexican workers
29,879 32,561 25,681 346,782 230,598 116,183
Immigrant 26,275 28,625 21,213 161,885 120,447 41,438
Citizen 33,097 37,670 26,641 51,240 34,137 17,103
Noncitizen 23,985 26,142 18,556 110,645 86,310 24,335
Native 33,957 38,321 29,076 184,897 110,152 74,745
Rest of immigrants 43,188 48,675 36,985 561,165 335,622 225,543
Total immigrants 37,748 41,076 33,158 723,049 456,068 266,981
Total natives 41,968 48,950 35,047 4,420,694 2,566,703 1,853,991
Total workers 41,319 47,574 34,798 5,143,743 3,022,771 2,120,972
Source: Authors’ estimates with data from U.S. Census Bureau Current Population Survey.

16. REMITTANCE FLOWS TO MEXICO AND EMPLOYMENT OF MEXICAN IMMIGRANTS l 199
In 2009 the total nominal earnings of wage and salary Mexican immigrant workers
in the United States fell by $11,574 million compared with 2008 (table 16.5), a decrease
of 6.7 percent that exceeded the decline of 3.6 percent recorded for the total earnings
of wage and salary workers in that country. One outstanding feature of such a decline
in the total earnings is that it encompassed only those without citizenship, a decline
of $13,995 million or 11.2 percent, whereas the earnings of Mexican immigrants with
citizenship actually increased 5 percent. Th e segment of Mexican workers without U.S.
citizenship represents an important source of remittances received in Mexico. Th is seg-
ment accounts for 74.9 percent of wage and salary Mexican immigrant workers and
generates 68.3 percent of such workers’ total earnings.
TABLE 16.5 Variation in the Total Earnings of Wage and Salary Workers and of Mexican Immigrants in the United States, 2009
Worker group
Absolute variation ($, millions) Relative variation (%)
Total Male Female Total Male Female
Wage and salary Mexican workers
−15,647 −14,526 −1,121 −4.3 −5.9 −1.0
Immigrant −11,574 −11,361 −213 −6.7 −8.6 −0.5
Citizen 2,421 729 1,692 5.0 2.2 11.0
Noncitizen −13,995 −12,090 −1,905 −11.2 −12.3 −7.3
Natives −4,072 −3,164 −908 −2.2 −2.8 −1.2
Rest of immigrants −27,497 −23,802 −3,694 −4.7 −6.6 −1.4
Total immigrants −39,072 −35,164 −3,907 −5.1 −7.2 −1.4
Total natives −152,410 −113,879 −38,531 −3.3 −4.3 −2.0
Total workers −193,494 −150,326 −43,169 −3.6 −4.7 −2.0
Source: Authors’ estimates with data from U.S. Census Bureau Current Population Survey.
Tables 16.6 and 16.7 show the sources of the decline in the total earnings of wage
and salary Mexican immigrant workers in the United States during 2009. It therefore
also allows greater knowledge of the factors behind the decline in remittance fl ows to
Mexico. In this regard the following observations are noteworthy:
• Th e decrease in 2009 in the nominal total earnings of wage and salary Mexican
immigrant workers refl ected net job losses totaling 272,905 jobs (4.2 percent) and a
$685 (2.5 percent) decline in their average annual earnings.
• Th e decline in the employment of Mexican immigrant workers stemmed from the
combination of a signifi cant increase of those in part-time employment amounting
to 260,824 individuals (33.5 percent increase) and a severe contraction of wage and
salary Mexicans in full-time employment of 533,728 jobs (9.4 percent decline).
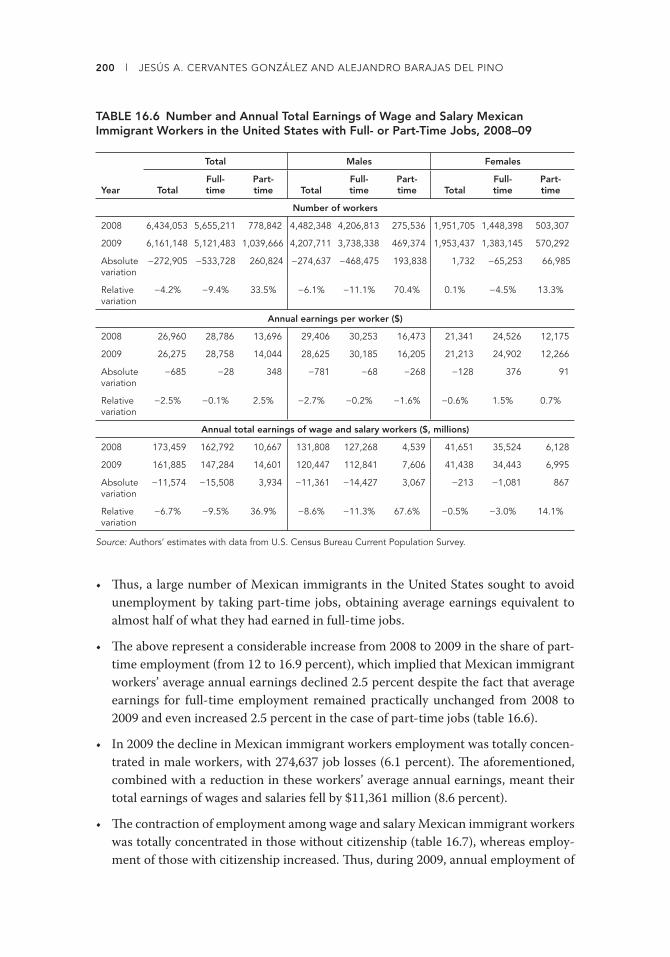
200 l JESÚS A. CERVANTES GONZÁLEZ AND ALEJANDRO BARAJAS DEL PINO
• Th us, a large number of Mexican immigrants in the United States sought to avoid
unemployment by taking part-time jobs, obtaining average earnings equivalent to
almost half of what they had earned in full-time jobs.
• Th e above represent a considerable increase from 2008 to 2009 in the share of part-
time employment (from 12 to 16.9 percent), which implied that Mexican immigrant
workers’ average annual earnings declined 2.5 percent despite the fact that average
earnings for full-time employment remained practically unchanged from 2008 to
2009 and even increased 2.5 percent in the case of part-time jobs (table 16.6).
• In 2009 the decline in Mexican immigrant workers employment was totally concen-
trated in male workers, with 274,637 job losses (6.1 percent). Th e aforementioned,
combined with a reduction in these workers’ average annual earnings, meant their
total earnings of wages and salaries fell by $11,361 million (8.6 percent).
• Th e contraction of employment among wage and salary Mexican immigrant workers
was totally concentrated in those without citizenship (table 16.7), whereas employ-
ment of those with citizenship increased. Th us, during 2009, annual employment of
TABLE 16.6 Number and Annual Total Earnings of Wage and Salary Mexican Immigrant Workers in the United States with Full- or Part-Time Jobs, 2008–09
Year
Total Males Females
TotalFull-time
Part-time Total
Full-time
Part-time Total
Full-time
Part-time
Number of workers
2008 6,434,053 5,655,211 778,842 4,482,348 4,206,813 275,536 1,951,705 1,448,398 503,307
2009 6,161,148 5,121,483 1,039,666 4,207,711 3,738,338 469,374 1,953,437 1,383,145 570,292
Absolute variation
−272,905 −533,728 260,824 −274,637 −468,475 193,838 1,732 −65,253 66,985
Relative variation
−4.2% −9.4% 33.5% −6.1% −11.1% 70.4% 0.1% −4.5% 13.3%
Annual earnings per worker ($)
2008 26,960 28,786 13,696 29,406 30,253 16,473 21,341 24,526 12,175
2009 26,275 28,758 14,044 28,625 30,185 16,205 21,213 24,902 12,266
Absolute variation
−685 −28 348 −781 −68 −268 −128 376 91
Relative variation
−2.5% −0.1% 2.5% −2.7% −0.2% −1.6% −0.6% 1.5% 0.7%
Annual total earnings of wage and salary workers ($, millions)
2008 173,459 162,792 10,667 131,808 127,268 4,539 41,651 35,524 6,128
2009 161,885 147,284 14,601 120,447 112,841 7,606 41,438 34,443 6,995
Absolute variation
−11,574 −15,508 3,934 −11,361 −14,427 3,067 −213 −1,081 867
Relative variation
−6.7% −9.5% 36.9% −8.6% −11.3% 67.6% −0.5% −3.0% 14.1%
Source: Authors’ estimates with data from U.S. Census Bureau Current Population Survey.

16. REMITTANCE FLOWS TO MEXICO AND EMPLOYMENT OF MEXICAN IMMIGRANTS l 201
the former group fell by 317,960 jobs (6.5 percent), this decline being more notewor-
thy for men (264,816 individuals or 7.4 percent) than for women. Th ese changes in
employment of wage and salary Mexican immigrant workers without citizenship was
accompanied by a signifi cant decline in their average annual earnings amounting to
$1,292 (5.1 percent), implying a fall of $13,995 million (11.2 percent) in their total
earnings. During 2009 the increase in employment for Mexican immigrants hold-
ing citizenship might have resulted from the fact that offi cial U.S. fi gures show that
164,920 Mexican immigrants obtained permanent residence that year. We will see
later in more detail the relationship between citizenship, earnings, and remittances.
Industry Distribution of Mexican Immigrant Workers
Th e industry distribution of Mexican immigrant workers in the United States shows
important diff erences from the rest of the labor force (table 16.8). Th us, in 2009, 81 per-
cent of the U.S. labor force was concentrated in the services sector (without taking
into account Mexican immigrants), whereas this fi gure was 61.6 percent in the case of
Mexican immigrant workers. Th e latter are employed more than the rest of the labor
force in the agricultural and industrial sectors (5.1 and 33.3 percent, respectively, as
TABLE 16.7 Number and Annual Total Earnings of Wage and Salary Mexican Immigrant Workers in the United States by Citizenship Status, 2008–09
Year
Citizens Noncitizens
Total Male Female Total Male Female
Number of workers
2008 1,503,128 916,032 587,096 4,930,925 3,566,316 1,364,609
2009 1,548,183 906,211 641,972 4,612,965 3,301,500 1,311,465
Absolute variation 45,055 −9,821 54,876 −317,960 −264,816 −53,144
Relative variation (%) 3.0 −1.1 9.4 −6.5 −7.4 −3.9
Annual earnings per worker ($)
2008 32,478 36,470 26,250 25,277 27,591 19,229
2009 33,097 37,670 26,641 23,985 26,142 18,556
Absolute variation 619 1,200 391 −1,292 −1,449 −673
Relative variation (%) 1.9 3.3 1.5 −5.1 −5.3 −3.5
Annual total earnings of wage and salary workers ($, millions)
2008 48,819 33,408 15,411 124,640 98,400 26,240
2009 51,240 34,137 17,103 110,645 86,310 24,335
Absolute variation 2,421 729 1,692 −13,995 −12,090 −1,905
Relative variation (%) 5.0 2.2 11.0 −11.2 −12.3 −7.3
Source: Authors’ estimates with data from U.S. Census Bureau Current Population Survey.
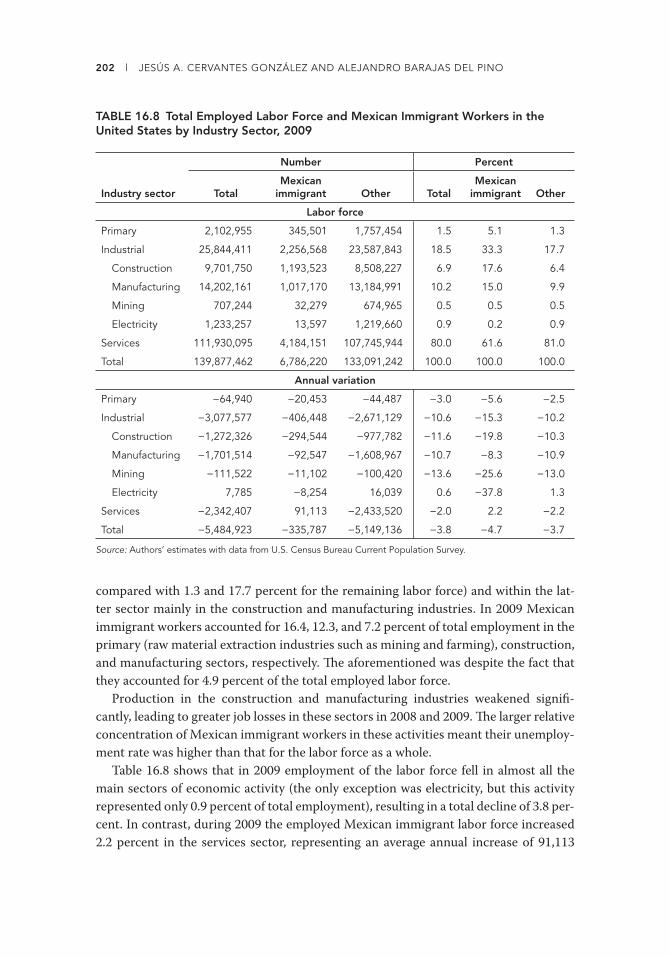
202 l JESÚS A. CERVANTES GONZÁLEZ AND ALEJANDRO BARAJAS DEL PINO
compared with 1.3 and 17.7 percent for the remaining labor force) and within the lat-
ter sector mainly in the construction and manufacturing industries. In 2009 Mexican
immigrant workers accounted for 16.4, 12.3, and 7.2 percent of total employment in the
primary (raw material extraction industries such as mining and farming), construction,
and manufacturing sectors, respectively. Th e aforementioned was despite the fact that
they accounted for 4.9 percent of the total employed labor force.
Production in the construction and manufacturing industries weakened signifi -
cantly, leading to greater job losses in these sectors in 2008 and 2009. Th e larger relative
concentration of Mexican immigrant workers in these activities meant their unemploy-
ment rate was higher than that for the labor force as a whole.
Table 16.8 shows that in 2009 employment of the labor force fell in almost all the
main sectors of economic activity (the only exception was electricity, but this activity
represented only 0.9 percent of total employment), resulting in a total decline of 3.8 per-
cent. In contrast, during 2009 the employed Mexican immigrant labor force increased
2.2 percent in the services sector, representing an average annual increase of 91,113
TABLE 16.8 Total Employed Labor Force and Mexican Immigrant Workers in the United States by Industry Sector, 2009
Industry sector
Number Percent
TotalMexican
immigrant Other TotalMexican
immigrant Other
Labor force
Primary 2,102,955 345,501 1,757,454 1.5 5.1 1.3
Industrial 25,844,411 2,256,568 23,587,843 18.5 33.3 17.7
Construction 9,701,750 1,193,523 8,508,227 6.9 17.6 6.4
Manufacturing 14,202,161 1,017,170 13,184,991 10.2 15.0 9.9
Mining 707,244 32,279 674,965 0.5 0.5 0.5
Electricity 1,233,257 13,597 1,219,660 0.9 0.2 0.9
Services 111,930,095 4,184,151 107,745,944 80.0 61.6 81.0
Total 139,877,462 6,786,220 133,091,242 100.0 100.0 100.0
Annual variation
Primary −64,940 −20,453 −44,487 −3.0 −5.6 −2.5
Industrial −3,077,577 −406,448 −2,671,129 −10.6 −15.3 −10.2
Construction −1,272,326 −294,544 −977,782 −11.6 −19.8 −10.3
Manufacturing −1,701,514 −92,547 −1,608,967 −10.7 −8.3 −10.9
Mining −111,522 −11,102 −100,420 −13.6 −25.6 −13.0
Electricity 7,785 −8,254 16,039 0.6 −37.8 1.3
Services −2,342,407 91,113 −2,433,520 −2.0 2.2 −2.2
Total −5,484,923 −335,787 −5,149,136 −3.8 −4.7 −3.7
Source: Authors’ estimates with data from U.S. Census Bureau Current Population Survey.

16. REMITTANCE FLOWS TO MEXICO AND EMPLOYMENT OF MEXICAN IMMIGRANTS l 203
jobs. Nevertheless, total employment of Mexican immigrant workers fell 4.7 percent,
that is, more than for the labor force as a whole. Th is was because of their greater con-
centration in sectors where employment contracted most. Th e shift of Mexican immi-
grant workers to the services sector was also a move to less well-paid jobs than those
they previously held, and this also contributed to the fall in their total earnings of wage
and salary.
Unemployment Rate among Mexican Immigrant Workers
During 2008–09, the unemployment rate among Mexican immigrant workers in the
United States was higher than that of most other ethnic groups, both native and immi-
grant, except African Americans (table 16.9). Th e increase in the unemployment rate
from 2007 to 2009 was also greater among Mexican immigrants (6.67 percent) than for
natives (4.49 percent). Th e level of unemployment among Mexican immigrants with
citizenship (9.46 percent) was very close to that observed among native workers as a
whole (9.18 percent) in 2009.
TABLE 16.9 Unemployment Rates in the United States, 2006–10
percent
Population group 2006 2007 2008 2009 2010
Change
2007–09 2009–10
Total 4.62 4.62 5.78 9.25 9.63 4.63 0.38
Native 4.74 4.69 5.78 9.18 9.60 4.49 0.42
Male 4.84 4.87 6.18 10.35 10.64 5.48 0.29
Female 4.62 4.48 5.33 7.90 8.46 3.42 0.56
White 3.86 3.86 4.74 7.80 8.04 3.94 0.24
African American 9.43 8.63 10.44 15.27 16.45 6.64 1.18
Asian 3.81 3.74 4.41 8.23 7.91 4.49 −0.32
Mexican 6.11 6.44 8.26 12.88 13.65 6.44 0.77
Nonnative 3.99 4.28 5.83 9.68 9.80 5.40 0.12
Non-Hispanic 3.52 3.71 4.77 7.93 8.28 4.22 0.35
Hispanic 4.45 4.85 6.91 11.43 11.32 6.58 −0.11
Mexican 4.48 4.93 7.20 11.60 11.19 6.67 −0.41
Male 3.68 4.05 6.41 11.09 10.59 7.04 −0.50
Female 6.31 7.03 8.99 12.73 12.46 5.70 −0.27
Citizen 2.81 3.79 5.36 9.46 9.29 5.67 −0.17
Noncitizen 4.91 5.25 7.77 12.33 11.84 7.08 −0.49
Source: Authors’ estimates with data from U.S. Census Bureau Current Population Survey.
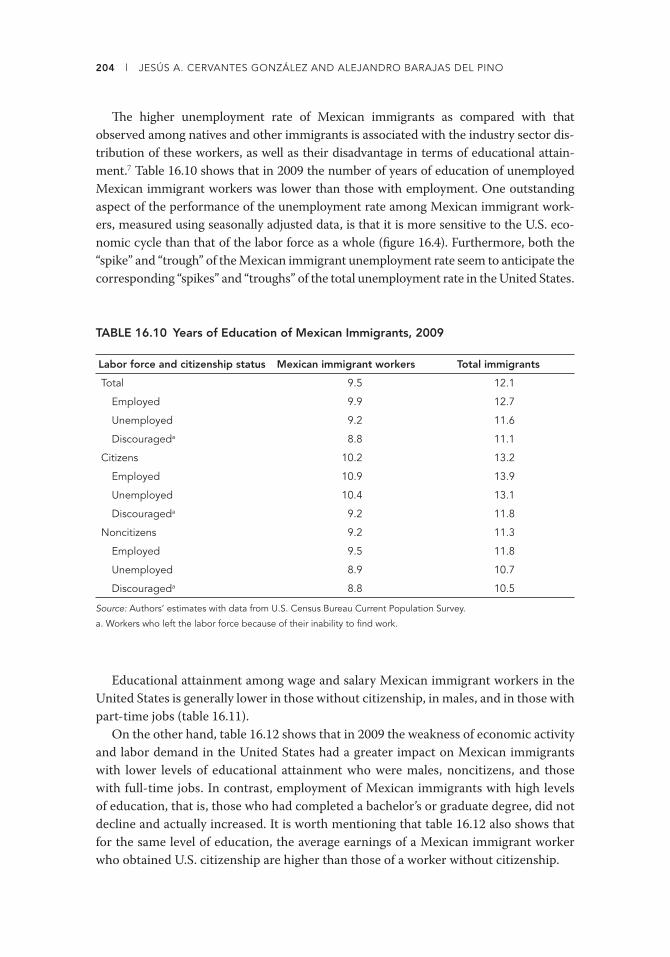
204 l JESÚS A. CERVANTES GONZÁLEZ AND ALEJANDRO BARAJAS DEL PINO
Th e higher unemployment rate of Mexican immigrants as compared with that
observed among natives and other immigrants is associated with the industry sector dis-
tribution of these workers, as well as their disadvantage in terms of educational attain-
ment.7 Table 16.10 shows that in 2009 the number of years of education of unemployed
Mexican immigrant workers was lower than those with employment. One outstanding
aspect of the performance of the unemployment rate among Mexican immigrant work-
ers, measured using seasonally adjusted data, is that it is more sensitive to the U.S. eco-
nomic cycle than that of the labor force as a whole (fi gure 16.4). Furthermore, both the
“spike” and “trough” of the Mexican immigrant unemployment rate seem to anticipate the
corresponding “spikes” and “troughs” of the total unemployment rate in the United States.
TABLE 16.10 Years of Education of Mexican Immigrants, 2009
Labor force and citizenship status Mexican immigrant workers Total immigrants
Total 9.5 12.1
Employed 9.9 12.7
Unemployed 9.2 11.6
Discourageda 8.8 11.1
Citizens 10.2 13.2
Employed 10.9 13.9
Unemployed 10.4 13.1
Discourageda 9.2 11.8
Noncitizens 9.2 11.3
Employed 9.5 11.8
Unemployed 8.9 10.7
Discourageda 8.8 10.5
Source: Authors’ estimates with data from U.S. Census Bureau Current Population Survey.
a. Workers who left the labor force because of their inability to fi nd work.
Educational attainment among wage and salary Mexican immigrant workers in the
United States is generally lower in those without citizenship, in males, and in those with
part-time jobs (table 16.11).
On the other hand, table 16.12 shows that in 2009 the weakness of economic activity
and labor demand in the United States had a greater impact on Mexican immigrants
with lower levels of educational attainment who were males, noncitizens, and those
with full-time jobs. In contrast, employment of Mexican immigrants with high levels
of education, that is, those who had completed a bachelor’s or graduate degree, did not
decline and actually increased. It is worth mentioning that table 16.12 also shows that
for the same level of education, the average earnings of a Mexican immigrant worker
who obtained U.S. citizenship are higher than those of a worker without citizenship.
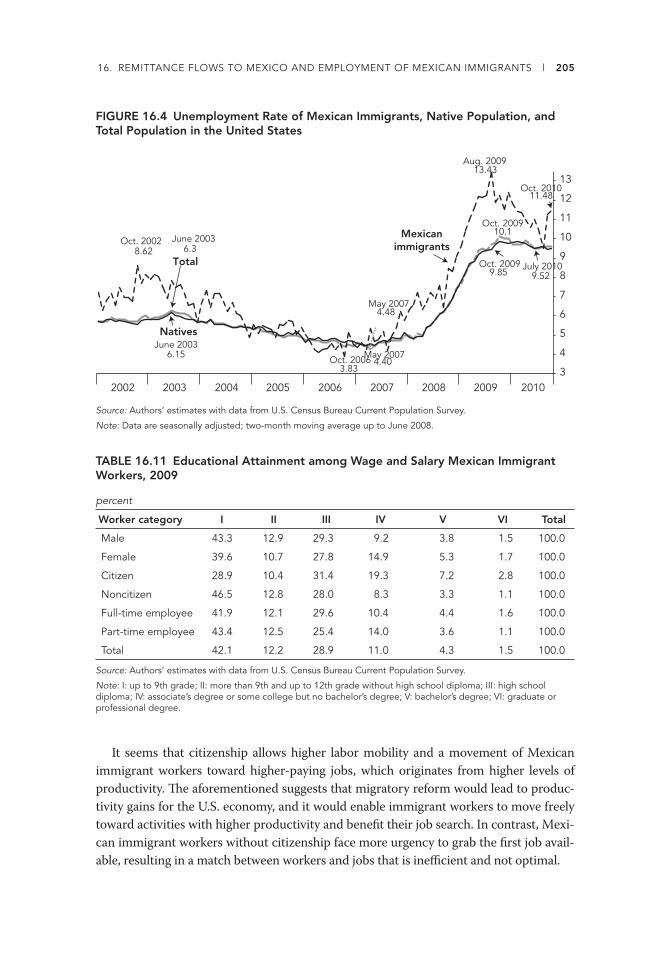
16. REMITTANCE FLOWS TO MEXICO AND EMPLOYMENT OF MEXICAN IMMIGRANTS l 205
TABLE 16.11 Educational Attainment among Wage and Salary Mexican Immigrant Workers, 2009
percent
Worker category I II III IV V VI Total
Male 43.3 12.9 29.3 9.2 3.8 1.5 100.0
Female 39.6 10.7 27.8 14.9 5.3 1.7 100.0
Citizen 28.9 10.4 31.4 19.3 7.2 2.8 100.0
Noncitizen 46.5 12.8 28.0 8.3 3.3 1.1 100.0
Full-time employee 41.9 12.1 29.6 10.4 4.4 1.6 100.0
Part-time employee 43.4 12.5 25.4 14.0 3.6 1.1 100.0
Total 42.1 12.2 28.9 11.0 4.3 1.5 100.0
Source: Authors’ estimates with data from U.S. Census Bureau Current Population Survey.
Note: I: up to 9th grade; II: more than 9th and up to 12th grade without high school diploma; III: high school diploma; IV: associate’s degree or some college but no bachelor’s degree; V: bachelor’s degree; VI: graduate or professional degree.
It seems that citizenship allows higher labor mobility and a movement of Mexican
immigrant workers toward higher-paying jobs, which originates from higher levels of
productivity. Th e aforementioned suggests that migratory reform would lead to produc-
tivity gains for the U.S. economy, and it would enable immigrant workers to move freely
toward activities with higher productivity and benefi t their job search. In contrast, Mexi-
can immigrant workers without citizenship face more urgency to grab the fi rst job avail-
able, resulting in a match between workers and jobs that is ineffi cient and not optimal.
FIGURE 16.4 Unemployment Rate of Mexican Immigrants, Native Population, and Total Population in the United States
June 2003 6.3
May 2007 4.48
Oct. 2009 10.1
June 2003 6.15 May 2007
4.40
Oct. 2009 9.85
July 2010 9.52
Oct. 2002 8.62
Oct. 2006 3.83
Aug. 2009 13.43
Oct. 2010 11.48
3
4
5
6
7
8
9
10
11
12
13
2002 2003 2004 2005 2006 2007 2008 2009 2010
Total
Mexicanimmigrants
Natives
Source: Authors’ estimates with data from U.S. Census Bureau Current Population Survey.
Note: Data are seasonally adjusted; two-month moving average up to June 2008.

206 l JESÚS A. CERVANTES GONZÁLEZ AND ALEJANDRO BARAJAS DEL PINO
During 2009 the total earnings of wage and salary Mexican immigrant workers
decreased by $11,574 million or 6.7 percent (in response to declines of 4.2 percent in
employment and 2.5 percent in average earnings), falling from $173,459 million in 2008
to $161,885 million in 2009. Nevertheless, the corresponding decline in the total earn-
ings amounted to 11.4 percent in those with up to 9 years of education and 11.6 per-
cent in those with between 9 and 12 years of education but no high school diploma
(table 16.13).
TABLE 16.12 Variation in Number and Annual Earnings of Wage and Salary Mexican Immigrant Workers by Educational Attainment, 2009
Worker category I II III IV V VI Total
Absolute variation in number of workers
Male −191,633 −61,207 11,287 −31,188 −1,491 −405 −274,637
Female 28,962 −790 −29,696 −9,877 6,220 6,913 1,732
Citizen 15,512 −8,797 15,642 9,121 7,406 6,171 45,055
Noncitizen −178,183 −53,199 −34,052 −50,186 −2,677 337 −317,960
Full-time employee −315,540 −85,292 −63,047 −69,455 −4,572 4,179 −533,728
Part-time employee 152,869 23,296 44,637 28,390 9,301 2,330 260,823
Total −162,671 −61,996 −18,410 −41,065 4,729 6,508 −272,905
Relative variation in number of workers (%)
Male −9.5 −10.2 0.9 −7.4 −0.9 −0.7 −6.1
Female 3.9 −0.4 −5.2 −3.3 6.4 26.4 0.1
Citizen 3.6 −5.2 3.3 3.2 7.1 16.8 3.0
Noncitizen −7.7 −8.3 −2.6 −11.6 −1.8 0.7 −6.5
Full-time employee −12.8 −12.1 −4.0 −11.5 −2.0 5.3 −9.4
Part-time employee 51.3 21.8 20.3 24.3 32.8 25.9 33.5
Total −5.9 −7.6 −1.0 −5.7 1.8 7.4 −4.2
Average annual earnings ($)
Male 24,387 25,465 30,252 34,368 47,528 64,116 28,625
Female 16,178 16,810 21,654 27,244 38,242 53,521 21,213
Citizen 25,719 26,644 32,989 36,271 48,111 74,608 33,097
Noncitizen 21,149 22,066 25,612 27,444 40,731 48,676 23,985
Full-time employee 24,003 25,189 29,885 34,679 48,499 66,108 28,758
Part-time employee 12,123 12,831 14,699 18,972 16,330 18,421 14,044
Total 21,939 23,048 27,628 31,322 43,866 60,418 26,275
Source: Authors’ estimates with data from U.S. Census Bureau Current Population Survey.
Note: I: Up to 9th grade; II: More than 9th and up to 12th grade without high school diploma; III: high school diploma; IV: associate’s degree or some college but no bachelor’s degree; V: bachelor’s degree; VI: graduate or professional degree.

16. REMITTANCE FLOWS TO MEXICO AND EMPLOYMENT OF MEXICAN IMMIGRANTS l 207
TABLE 16.13 Total Earnings of Wage and Salary Mexican Immigrant Workers by Educational Attainment, 2009
Worker category I II III IV V VI Total
Total earnings ($, millions)
Male 44,414 13,801 37,366 13,372 7,534 3,961 120,447
Female 12,522 3,530 11,746 7,918 3,948 1,773 41,438
Citizen 11,530 4,298 16,025 10,832 5,349 3,206 51,240
Noncitizen 45,406 13,033 33,087 10,458 6,133 2,528 110,645
Full-time employee 51,470 15,659 45,228 18,534 10,867 5,526 147,284
Part-time employee 5,466 1,672 3,884 2,756 615 208 14,601
Total 56,936 17,331 49,112 21,290 11,482 5,734 161,885
Absolute variation in earnings ($, millions)
Male −7,085 −2,006 −538 −2,352 817 −174 −11,361
Female −225 −266 −544 −357 568 610 −213
Citizen 269 −411 452 193 1,022 896 2,421
Noncitizen −7,579 −1,861 −1,534 −2,902 363 −482 −13,995
Full-time employee −8,976 −2,698 −1,724 −3,790 1,250 430 −15,508
Part-time employee 1,666 426 642 1,081 136 −16 3,934
Total −7,310 −2,272 −1,082 −2,709 1,385 414 −11,574
Relative variation in earnings (%)
Male −13.8 −12.7 −1.4 −15.0 12.2 −4.2 −8.6
Female −1.8 −7.0 −4.4 −4.3 16.8 52.4 −0.5
Citizen 2.4 −8.7 2.9 1.8 23.6 38.8 5.0
Noncitizen −14.3 −12.5 −4.4 −21.7 6.3 −16.0 −11.2
Full-time employee −14.8 −14.7 −3.7 −17.0 13.0 8.4 −9.5
Part-time employee 43.8 34.2 19.8 64.6 28.2 −7.2 36.9
Total −11.4 −11.6 −2.2 −11.3 13.7 7.8 −6.7
Source: Authors’ estimates with data from U.S. Census Bureau Current Population Survey.
Note: I: up to 9th grade; II: more than 9th and up to 12th grade without high school diploma; III: high school diploma; IV: associate’s degree or some college but no bachelor’s degree; V: bachelor’s degree; VI: graduate or professional degree.
Th e signifi cant increase in the total earnings of wage and salary Mexican immigrant
workers with citizenship during 2009 was equivalent to $2,421 million or 5.3 percent
and responded to both an increase in the number of those with such migratory status
(45,055 individuals and 3 percent increase; table 16.12) and in their average earnings
(2.2 percent). Th e latter mainly refl ected the fact that most of the Mexican workers
who obtained citizenship were those who had completed a bachelor’s or graduate
degree.

208 l JESÚS A. CERVANTES GONZÁLEZ AND ALEJANDRO BARAJAS DEL PINO
Mexican Immigrant Worker Employment in 2010
During the fi rst half of 2010, demand in the U.S. labor market remained weak (annual
decrease of 1.4 percent; see table 16.14). However, employment of Mexican immigrant
workers increased slightly (0.6 percent). Th is performance strengthened even further in
the second half of the year as the number of employed Mexican immigrant workers rose
by 136,000 individuals or 2 percent.
Th e weakness of labor demand in the United States during the fi rst semester of
2010 was accompanied at the industry sector level by a decline in employment in the
industrial sector. However, in the case of Mexican immigrants, annual increases were
observed in employment during the second semester in all three sectors of economic
activity: industrial, services, and primary. In fact, the annual growth of Mexican immi-
grant employment in the second half of 2010 was also driven by an increase in the
manufacturing sector (3.5 percent).
Recovery of Remittance Flows in 2010 and the Decline of Unemployment among Mexican Immigrant Workers
During 2010, remittance fl ows to Mexico increased slightly by 0.12 percent in annual
terms, but such a fi gure must be taken in the context of a 12 percent fall in the fi rst quar-
ter and annual increases of 3.7 percent, 3.2 percent, and 6.5 percent in the second, third,
and fourth quarters, respectively. Th is recent improvement in remittance fl ows has
responded to higher employment of Mexican immigrant workers in the United States
(table 16.14), which has also fostered a signifi cant decline in their unemployment rate.
Th e weakness of labor demand in the United States in 2009 implied a shift in employ-
ment structure from full- to part-time jobs (fi gure 16.5). Under this assumption, one
positive indicator is that the 20.3 percent “spike” in the share of part-time wage and
salary jobs in total U.S. employment took place during the fi rst half of 2010 (17.6 per-
cent among wage and salary Mexican immigrant workers; fi gure 16.6) and declined to
19.3 percent in the second semester. Th e scenario for wage and salary Mexican immi-
grant workers has improved gradually; in fact, fi gure 16.5 shows that the number of
these workers in full-time employment increased in annual terms during the fi rst and
second semesters of 2010. Finally, fi gure 16.7 shows that the improvement in employ-
ment levels among wage and salary Mexican immigrant workers and the increase in the
participation of full-time jobs led to a slight rebound in their total earnings of wages
and salaries.
Conclusion
Th is chapter has presented an analysis of the factors that led to an almost $5 billion
annual decline in remittance fl ows to Mexico during 2008 and 2009. Given the fact that
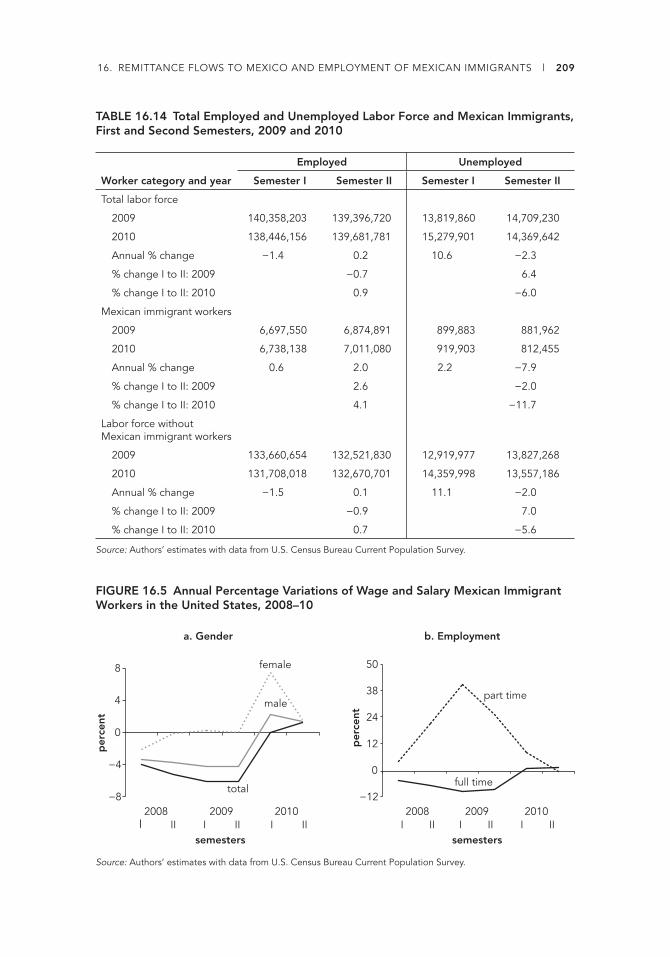
16. REMITTANCE FLOWS TO MEXICO AND EMPLOYMENT OF MEXICAN IMMIGRANTS l 209
TABLE 16.14 Total Employed and Unemployed Labor Force and Mexican Immigrants, First and Second Semesters, 2009 and 2010
Worker category and year
Employed Unemployed
Semester I Semester II Semester I Semester II
Total labor force
2009 140,358,203 139,396,720 13,819,860 14,709,230
2010 138,446,156 139,681,781 15,279,901 14,369,642
Annual % change −1.4 0.2 10.6 −2.3
% change I to II: 2009 −0.7 6.4
% change I to II: 2010 0.9 −6.0
Mexican immigrant workers
2009 6,697,550 6,874,891 899,883 881,962
2010 6,738,138 7,011,080 919,903 812,455
Annual % change 0.6 2.0 2.2 −7.9
% change I to II: 2009 2.6 −2.0
% change I to II: 2010 4.1 −11.7
Labor force without Mexican immigrant workers
2009 133,660,654 132,521,830 12,919,977 13,827,268
2010 131,708,018 132,670,701 14,359,998 13,557,186
Annual % change −1.5 0.1 11.1 −2.0
% change I to II: 2009 −0.9 7.0
% change I to II: 2010 0.7 −5.6
Source: Authors’ estimates with data from U.S. Census Bureau Current Population Survey.
FIGURE 16.5 Annual Percentage Variations of Wage and Salary Mexican Immigrant Workers in the United States, 2008–10
b. Employmenta. Gender
I II I II I II2008 2009 2010
per
cent
−8
−4
0
4
8
total
male
female
semesters I II I II I II2008 2009 2010
semesters
−12
12
50
24
38 part time
full time
per
cent
0
Source: Authors’ estimates with data from U.S. Census Bureau Current Population Survey.

210 l JESÚS A. CERVANTES GONZÁLEZ AND ALEJANDRO BARAJAS DEL PINO
almost all remittances to Mexico originate from the United States, we have focused on
Mexican immigrant workers there.
Our results show that the total earnings of wage and salary Mexican immigrant
workers in the United States fell by almost $11.6 billion (6.7 percent), declining from
$173.5 billion in 2008 to $161.9 billion in 2009. Th is responded to a decline in the
employment of these workers (a net fall of 273,000 jobs or 4.2 percent) and in their
average earnings (2.5 percent). Th e weakness of employment was totally concentrated
FIGURE 16.6 Proportion of Part-Time Employed among Wage and Salary Mexican Immigrant Workers, 2007–10
per
cent
I II I II I II2008 2009 2010
total
semesters
10.3
17.6 17.0
17.9
20.9 20.0
17.0
20.3 19.3
8
10
12
14
16
18
20
22
immigrant workers
native workers
I II 2007
Source: Authors’ estimates with data from U.S. Census Bureau Current Population Survey.
FIGURE 16.7 Number of Wage and Salary Mexican Immigrant Workers in the United States and Their Annual Total Earnings, 2007–10
b. Number of workersa. Annual earnings
6,672,536
6,434,053
6,161,148
6,272,987
mill
ions
6.0
6.5
7.0
2007 2008 2009 2010
171.553 173.459
161.885 162.570
150
155
160
165
170
175
2007 2008 2009 2010
cur
rent
$, b
illio
ns
Source: Authors’ estimates with data from U.S. Census Bureau Current Population Survey.

16. REMITTANCE FLOWS TO MEXICO AND EMPLOYMENT OF MEXICAN IMMIGRANTS l 211
in men (275,000 jobs and 6.1 percent), whereas employment among female Mexican
immigrants remained practically unchanged. Meager labor demand in the United
States also meant that over half a million wage and salary Mexican immigrant workers
lost their full-time job.
Another fi nding is that the declines in employment, average earnings, and the total
earnings of Mexican immigrant workers almost were aff ecting only those without citi-
zenship. From 2008 to 2009, employment in this segment fell by 318,000 jobs (6.5 per-
cent), and their average earnings declined more than $100 per month (5.1 percent),
implying a $14 billion fall in their total earnings of wages and salaries (11.2 percent).
It is also noteworthy that the contraction in the employment of Mexican immigrant
workers was relatively larger than that observed among other immigrant workers and
the labor force as a whole in the United States. Furthermore, from 2007 to 2009 the
deterioration in the unemployment rates of Mexican immigrant workers was higher than
others. Th is is because Mexican immigrants tend to work in sectors of economic activity
that are sensitive to the economic cycle. Such sectors are characterized by higher levels
of unemployment. During the period studied, employment increased in services at the
expense of a decline in the industry jobs. Th is was also evident in the case of Mexican
immigrant workers. Mexican workers’ move to service jobs also meant a shift toward
lower-paying jobs. Th is has led to a sharp fall in the total earnings of these workers.
Th e scenario described for 2008–09 changed in 2010. Despite the persisting weak-
ness of labor demand in the United States, employment of Mexican immigrant workers
recorded a small positive annual variation in the fi rst semester of 2010 (0.6 percent)
and a larger increase in the second (2 percent). Th is improvement in the employment
of Mexican immigrant workers refl ected in the second half of the year showed annual
increases in all three sectors of economic activity: agriculture, services, and industry.
Within the last sector, annual increases were observed in the manufacturing industry
during the second semester. Finally, the recovery of Mexican immigrant worker employ-
ment in the United States and the small improvement in the participation of those with
full-time jobs began to be refl ected in a slight rebound in their total earnings of wages
and salaries. Th is combination of factors explains the annual increase already exhibited
by remittance fl ows to Mexico since the second quarter of 2010.
Notes
1. In recent years Mexico has been the main source of immigrants who obtain permanent resi-
dence in the United States. During fi scal years 2000–07, an average of 169,011 Mexicans per
year obtained permanent residence, and in fi scal years 2008, 2009, and 2010 the correspond-
ing fi gures were 189,989, 164,920, and 139,120 Mexicans, respectively (Offi ce of Immigra-
tion Statistics 2010). A fi scal year is the 12-month period beginning October 1 and ending
September 30.
2. Th e total cost of a $300 remittance to Mexico sent from diff erent cities in the United States
and made via electronic transfer dropped from an average of $28.50 in 1999 to $23.20 in 2000
and to $5.60 in 2009 (Bonilla and Cervantes 2010).

212 l JESÚS A. CERVANTES GONZÁLEZ AND ALEJANDRO BARAJAS DEL PINO
3. A worker who is a nonnative of the United States is considered a citizen once they receive
citizenship from that country’s immigration service. All nonnative workers in the United
States without citizenship are classifi ed as noncitizens. Th e latter can be either legal or illegal
immigrants.
4. Th e CPS provides the basic information on the labor force, employment, and unemployment
in the U.S. economy. Th e survey is conducted monthly for the Bureau of Labor Statistics by
the U.S. Census Bureau.
5. Th e CPS database considers Mexicans to be those who were born in Mexico and those indi-
viduals who declare themselves Mexican, irrespective of whether they were born there.
6. A full-time worker is a worker who usually works 35 or more hours per week at their sole
or principal job, whereas a part-time worker usually works fewer than 35 hours per week at
their sole or principal job.
7. For a comparison of educational attainment levels of Mexican and other immigrant workers
in the United States see Cervantes and Barajas (2009).

PART IV


215
Chapter 17
The Impact of the Global Economic Downturn on Remittances from the European Union
OSCAR GÓMEZ LACALLE
Global remittance flows are estimated to carry over $400 billion per year, of
which $300 billion is received by developing countries. In many low-income destina-
tions remittances have become a major source of external fi nancing, providing income
to the poor and contributing to growth and poverty reduction. In the past, remittances
have been relatively stable compared with other external fl ows and generally unrelated
to business cycles, especially in remittance-source countries (Ratha, Mohapatra and Sil-
wal 2010a). Yet the impact of the recent global downturn on remittance fl ows suggests
that the economic environment in remittance-source countries is relevant for remit-
tance fl ows. In turn, depending on the degree of dependence on remittances in destina-
tion countries, remittances may become a signifi cant transmission channel of the crisis
from developed to developing countries.
Th e objective of this report is to assess the impact of the recent global economic
downturn on remittance fl ows from the European Union (EU). For this purpose,
in the next section I give an overview of the main macroeconomic determinants
of remittances considered in the literature. Recent developments, magnitudes, and
distribution of EU remittances are presented next. Evidence is collected to identify
empirically which determinant(s) predominantly drive EU remittance trends in the
Th e views expressed in this chapter are exclusively those of the author and do not necessarily correspond to those of the
European Commission.

216 l OSCAR GÓMEZ LACALLE
short term. On the basis of these fi ndings, I forecast EU remittances in the period
2010–12. An assessment of the vulnerability of EU remittances to recipient regions
then is presented. Finally, the last section discusses the limitations of this exercise and
briefl y presents the main policies implemented in the EU, which may have an impact
on remittance fl ows.
Channels of the Impact of an Economic Slowdown on Remittance Flows
Th e volume of remittance fl ows in a given corridor depends on a few factors (Labeaga,
Jiménez-Martín, and Jorgensen 2007), and the impact of an economic slowdown on
remittance fl ows can be identifi ed by looking at each of these factors separately:
• Th e stock of migrant workers in a remittance-source country is unlikely to respond
in the short run because the process of migration usually involves high fi xed costs,
which would be lost on returning home. Higher unemployment rates, especially
when coupled with strict immigration policies, can slow new immigration. Th en,
depending on the depth and length of a recession, long-lasting diffi culties for making
a living may eventually force more migrant workers to leave.
• Most short-term adjustments are likely to work through migrants’ income. Migrants
are often employed in sectors sensitive to economic cycles such as construction or
low-wage segments of manufacturing, although they are also employed in sectors
more resilient to economic downturns (such as health care or personal services).
Migrants tend to be less protected by social security systems, and so they are usually
more fl exible in the labor market and ready to take lower-paying jobs under dif-
fi cult work conditions to avoid longer spells of unemployment. Lower wages might
see counterbalancing eff ects on purchasing power in the recent downturn, because
prices of housing, food, and energy, probably together representing the bulk of
migrants’ consumption, have decreased considerably.
• Th e share of income that migrants send home, also referred to as the propensity to
remit, is reportedly more responsive to economic conditions in remittance-recipient
countries than in remittance-source countries. Th is is often explained by the fact that
average remittance transfers account for only one-fi fth of migrants’ income (Ratha,
Mohapatra and Silwal 2010a), which allows migrants to adjust marginally current
expenses and keep remittance fl ows stable.
• Th e costs of transferring remittances, which have come down, on average, over
the last few years but can still be up to 20 percent of the amount sent, should be
less aff ected by the economic slowdown. Th e only sizeable eff ect can come from
tighter migration policies aiming to expel illegal migrants, which may induce illegal
migrants to make more use of unoffi cial and more expensive transfer channels, in
order not to be traceable.

17. IMPACT OF GLOBAL ECONOMIC DOWNTURN ON REMITTANCES FROM THE EU l 217
• Changes in exchange rates may also have an eff ect, depending on whether migrants
keep their remittances in the currency of the remittance-source or of the remittance-
recipient country. Exchange rate developments will also have an eff ect on the general
attractiveness of countries for migrants because they infl uence the income diff eren-
tial to their home countries.
• Developments in the above areas may also have statistical eff ects. Tighter labor mar-
kets coupled with stricter immigration rules could push more migrants into jobs in
the informal sector and into making more use of unoffi cial transfer channels, result-
ing in underestimations of real fl ows, because unoffi cial transfers are more diffi cult
to capture and tend to escape statistical systems.
On balance, although remittances overall are less volatile and less sensitive to economic
downturns than other fi nancial fl ows, estimates suggest the recent global downturn has
had a negative impact on remittance fl ows. Depending on the length and depth of the
downturn, it is reasonable to expect a slower increase or even a decrease in most remit-
tance corridors, compared with the rather buoyant growth of the years preceding the
crisis, when almost all of the determinants of remittances were exerting positive eff ects.
Remittances from the EU: Volume, Distribution, and Recent Developments
Recent Eurostat estimates (fi gure 17.1) show that remittances from the EU-27 fell for
the fi rst time in 2009 after a long expansion and amounted to €76.5 billion.1 Intra-EU
remittances were the largest fl ows throughout the period (about €45 billion, 60 percent
of total fl ows), although most of the overall increase was due to extra-EU fl ows, which
recorded double-digit annual growth rates between 2005 and 2008. However, the latter
fell more in 2009 (−7.2 percent) than intra-EU fl ows (−3 percent).
FIGURE 17.1 EU Remittances by Destination, 2004–09
€, b
illio
ns
0
20
40
60
80
2004 2005 2006 2007 2008 2009
Extra-EU
Intra-EU
Source: Eurostat.

218 l OSCAR GÓMEZ LACALLE
In 2009 Germany was the most important source of remittances from the EU,
recording €11 billion, 14.4 percent of EU remittance outfl ows (table 17.1), followed by
Italy (€9.3 billion), Spain (€8.6 billion), and the Netherlands (€7.3 billion). Th e top 10
remittance-sending EU member states account for two-thirds of total EU outfl ows.
TABLE 17.1 Top 10 Remittance-Sending Member States, 2009
Country €, billions % of total
Germany 11.0 14.4
Italy 9.3 12.1
Spain 8.6 11.3
Netherlands 7.3 9.6
France 3.7 4.9
Belgium 3.0 3.9
Austria 2.1 2.8
Czech Republic 1.8 2.4
Greece 1.3 1.7
Poland 0.9 1.2
Source: Eurostat.
Estimates of workers’ remittances (excluding compensation of employees)2 amounted
to €30.3 billion in 2009 (fi gure 17.2), after a drop of 7.1 percent from the previous year.
As opposed to compensation of employees, most workers’ remittances (almost 75 per-
cent) are destined to go to non-EU countries and show a higher degree of concentration
at origin (table 17.2). In fact, the top 10 member states together send 80.8 percent of EU
workers’ remittances, and Italy and Spain each records remarkable shares in excess of
20 percent of total EU workers’ remittances.
FIGURE 17.2 Workers’ Remittances by Destination, 2004–09
€, b
illio
ns Extra-EU
0
5
10
15
20
25
30
35
2004 2005 2006 2007 2008 2009
Intra-EU
Source: Eurostat.
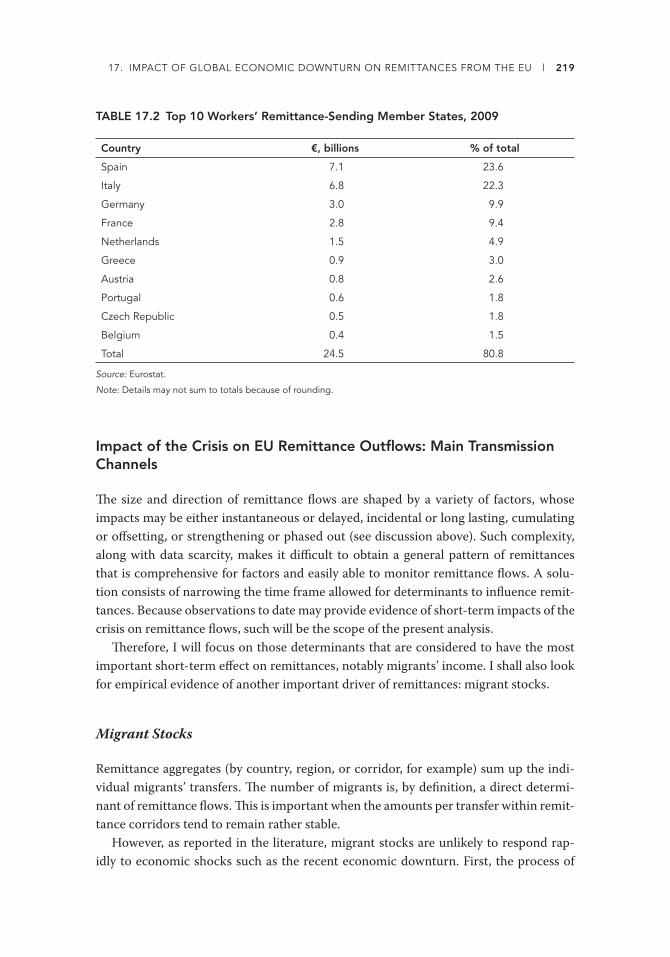
17. IMPACT OF GLOBAL ECONOMIC DOWNTURN ON REMITTANCES FROM THE EU l 219
TABLE 17.2 Top 10 Workers’ Remittance-Sending Member States, 2009
Country €, billions % of total
Spain 7.1 23.6
Italy 6.8 22.3
Germany 3.0 9.9
France 2.8 9.4
Netherlands 1.5 4.9
Greece 0.9 3.0
Austria 0.8 2.6
Portugal 0.6 1.8
Czech Republic 0.5 1.8
Belgium 0.4 1.5
Total 24.5 80.8
Source: Eurostat.
Note: Details may not sum to totals because of rounding.
Impact of the Crisis on EU Remittance Outfl ows: Main Transmission Channels
Th e size and direction of remittance fl ows are shaped by a variety of factors, whose
impacts may be either instantaneous or delayed, incidental or long lasting, cumulating
or off setting, or strengthening or phased out (see discussion above). Such complexity,
along with data scarcity, makes it diffi cult to obtain a general pattern of remittances
that is comprehensive for factors and easily able to monitor remittance fl ows. A solu-
tion consists of narrowing the time frame allowed for determinants to infl uence remit-
tances. Because observations to date may provide evidence of short-term impacts of the
crisis on remittance fl ows, such will be the scope of the present analysis.
Th erefore, I will focus on those determinants that are considered to have the most
important short-term eff ect on remittances, notably migrants’ income. I shall also look
for empirical evidence of another important driver of remittances: migrant stocks.
Migrant Stocks
Remittance aggregates (by country, region, or corridor, for example) sum up the indi-
vidual migrants’ transfers. Th e number of migrants is, by defi nition, a direct determi-
nant of remittance fl ows. Th is is important when the amounts per transfer within remit-
tance corridors tend to remain rather stable.
However, as reported in the literature, migrant stocks are unlikely to respond rap-
idly to economic shocks such as the recent economic downturn. First, the process of
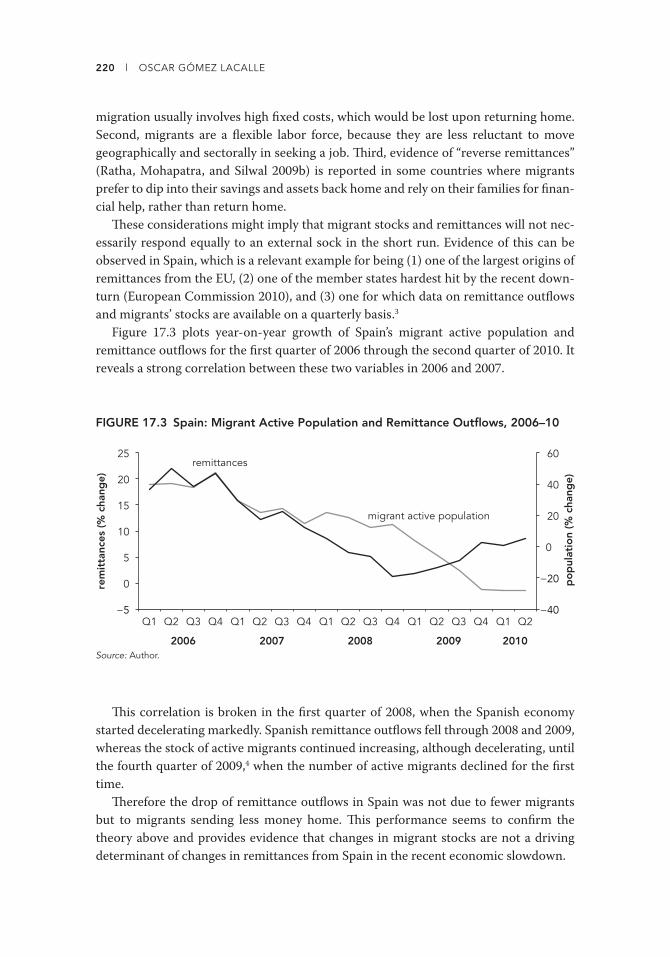
220 l OSCAR GÓMEZ LACALLE
migration usually involves high fi xed costs, which would be lost upon returning home.
Second, migrants are a fl exible labor force, because they are less reluctant to move
geographically and sectorally in seeking a job. Th ird, evidence of “reverse remittances”
(Ratha, Mohapatra, and Silwal 2009b) is reported in some countries where migrants
prefer to dip into their savings and assets back home and rely on their families for fi nan-
cial help, rather than return home.
Th ese considerations might imply that migrant stocks and remittances will not nec-
essarily respond equally to an external sock in the short run. Evidence of this can be
observed in Spain, which is a relevant example for being (1) one of the largest origins of
remittances from the EU, (2) one of the member states hardest hit by the recent down-
turn (European Commission 2010), and (3) one for which data on remittance outfl ows
and migrants’ stocks are available on a quarterly basis.3
Figure 17.3 plots year-on-year growth of Spain’s migrant active population and
remittance outfl ows for the fi rst quarter of 2006 through the second quarter of 2010. It
reveals a strong correlation between these two variables in 2006 and 2007.
FIGURE 17.3 Spain: Migrant Active Population and Remittance Outfl ows, 2006–10
rem
itta
nces
(% c
hang
e)
−40
−20
0
20
40
60
−5
0
5
10
15
20
25
Q1 Q2 Q3 Q4 Q1 Q2 Q3 Q4 Q1 Q2 Q3 Q4 Q1 Q2 Q3 Q4 Q1 Q2
2006 2007 2008 2009 2010
migrant active population
remittances
po
pul
atio
n (%
cha
nge)
Source: Author.
Th is correlation is broken in the fi rst quarter of 2008, when the Spanish economy
started decelerating markedly. Spanish remittance outfl ows fell through 2008 and 2009,
whereas the stock of active migrants continued increasing, although decelerating, until
the fourth quarter of 2009,4 when the number of active migrants declined for the fi rst
time.
Th erefore the drop of remittance outfl ows in Spain was not due to fewer migrants
but to migrants sending less money home. Th is performance seems to confi rm the
theory above and provides evidence that changes in migrant stocks are not a driving
determinant of changes in remittances from Spain in the recent economic slowdown.

17. IMPACT OF GLOBAL ECONOMIC DOWNTURN ON REMITTANCES FROM THE EU l 221
Migrants’ Income
Direct estimates of migrants’ income in the EU are unfortunately unavailable. Yet
indirect evidence can be obtained through an indicator that approximates migrants’
income. Such an indicator should be (1) observable (data should be available for the
period covered by the analysis) and (2) faithful (accurately emulating the performance
of the original variable).
In this vein, the economic and statistical literature (ILO 1998) has long recognized
estimates of income from employment. Although such estimates assume that employ-
ment is the only source of income, this is a reasonable assumption in the case of
migrants because most migrants’ income-earning activities are either paid employment
or self-employment. Another caveat of the employment measure of income is that it
disregards unemployment benefi ts. In the case of migrants, however, such an under-
estimation may not be of much signifi cance, because migrants’ social protection levels
are, on average, considerably lower than those of native workers, especially in the case
of low-skilled migration. Th e employment measure of income also assumes unchanged
wages, which is an acceptable assumption in the short term for registered employment
(workers with legal contracts), given the rather rigid wage formation structures in force
in most member states. Finally, changes in total (native + migrant) employment are pre-
ferred to foreigners’ employment, mainly because considerably higher levels of unregis-
tered active and employed migrants are likely to hinder the reliability of the latter series,
whereas total employment should provide a more sound overall picture of labor market
performance.
Accordingly, fi gure 17.4 plots quarter-on-quarter (q-o-q) percentage changes in
remittance outfl ows from the EU (right-hand side) against total EU employment growth
(q-o-q) (left-hand side).5 Employment data sources are member states’ Labor Force
Surveys, as reported by Eurostat, whose estimation methodology is unrelated to the
FIGURE 17.4 EU: Total Growth in Employment and Remittance Outfl ows, 2006–10
% g
row
th in
em
plo
ymen
t employment
remittances
% c
hang
e in
rem
itta
nce
out
flow
s
Q1 Q2 Q3 Q4 Q1 Q2 Q3 Q4 Q1 Q2 Q3 Q4 Q1 Q2 Q3 Q4 Q1 Q2
2006 2007 2008 2009 2010
−20
−10
0
10
20
−2
−1
0
1
2
Source: Author.

222 l OSCAR GÓMEZ LACALLE
balance-of-payments accounting methodology, from which remittance fi gures are col-
lected.
Figure 17.4 reveals a high correlation (>80 percent) between both variables during
the period considered. Assuming remittances is the dependent variable, these results
suggest that employment growth is driving most of remittances’ short-term fl uctua-
tions in the EU. Additionally, the subcomponent workers’ remittances similarly shows a
high degree of correlation with employment in the EU. Higher volatility of remittances
compared with employment suggests that EU remittances could be highly sensitive to
the economic environment of migrants’ host countries.
Projections
In view of these results, accurate fl ash estimates of quarterly EU remittance fl ows can be
easily derived from quarterly data on employment. Similarly, short-term projections of
remittances can be computed when quarterly forecasts on employment are available.6
European Commission (2010) projections of annual employment growth in the
period 2010–12 may provide an indication of the possible orders of magnitude of the
impact of the crisis on EU remittances. For this purpose I apply a statistical projec-
tion based on a simple ordinary least squares regression of remittances growth on
employment growth. According to the equation derived from observations (2004–
09), changes in remittances explained by changes in employment (R2) are higher than
60 percent. Subsequently, this regression is run to generate remittance growth from
employment growth in 2010–12. Th e estimation returns an increase of EU remit-
tances by 2 percent in 2010, 6 percent in 2011, and 7.5 percent in 2012 (fi gure 17.5).
FIGURE 17.5 Total Employment and Remittance Outfl ows in the European Union, 2004–12
% g
row
th in
em
plo
ymen
t
employment
remittances
% in
crea
se in
rem
itta
nces
−10
−5
0
5
10
15
20
−3
−2
−1
0
1
2
3
2004 2005 2006 2007 2008 2009 2010 2011 2012 Source: Authors; projections based on OLS estimation.
Note: Dotted lines indicate projections.

17. IMPACT OF GLOBAL ECONOMIC DOWNTURN ON REMITTANCES FROM THE EU l 223
Th ese fi gures should, however, be treated with caution, because this simple model
with only one explaining variable and a low number of observations aff ects the accu-
racy of the results.
Relative Vulnerability of Destination Regions to the Decline in EU Remittances
Th e decline in EU remittances is not likely to aff ect all destination countries or regions
equally. Vulnerability to a decline in EU remittances depends on (1) the share of EU fl ows
for total remittances received and (2) the share of EU remittances for other sources of
income at destination. In addition, the relative contribution of individual member states
to EU remittance aggregates is likely to diff er from one corridor to another, which can
be relevant should member states’ remittance outfl ows fl uctuate unevenly in size and
in time.
Table 17.3 reveals divergences in employment prospects (European Commission
2010) for the main member states contributing to remittance fl ows, ranging from
−4.7 percent (Greece) to +0.9 percent (Austria) in 2010, from −0.8 percent (Ireland)
to +2.9 percent (Greece) in 2011, and from −0.3 percent (Portugal) to +1.9 percent
(Greece). Insofar as employment growth is assumed to explain main short-term adjust-
ments in EU remittances, these divergences should lead to diff erent trends in remit-
tance fl ows from each member state. Th e table highlights relatively higher vulnerability
of Albania to a decline in remittances from Greece, Ukraine to remittances from the
Czech Republic, and Romania to remittances from Italy (table 17.4).
TABLE 17.3 Selected Member States’ Employment Forecasts, 2009–12
annual percentage change
Country 2009 2010 2011 2012
Austria −0.9 0.9 0.7 0.7
Czech Republic −1.1 −0.5 0.2 0.3
France −1.2 0.0 0.5 0.7
Germany 0.0 0.3 0.7 0.4
Greece −9.9 −4.7 2.9 1.9
Ireland −8.2 −4.0 −0.8 0.6
Italy −1.7 −0.5 0.1 0.4
Netherlands −1.1 −1.1 0.2 0.3
Portugal −2.6 −0.9 −0.7 −0.3
Spain −6.6 −2.5 −0.2 1.1
EU-27 −1.8 -0.6 0.3 0.6
Source: European Commission.
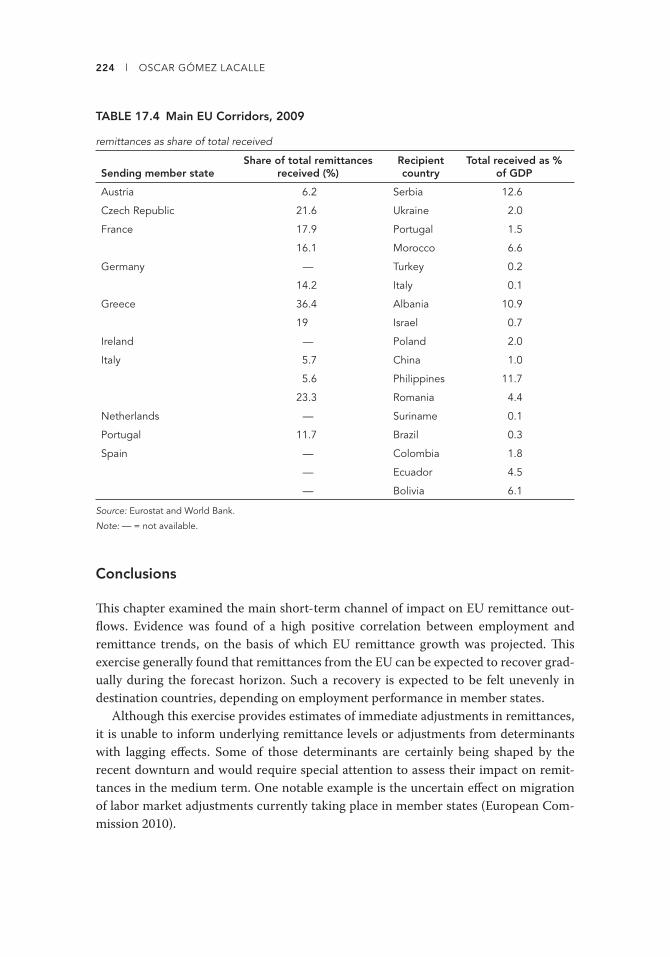
224 l OSCAR GÓMEZ LACALLE
TABLE 17.4 Main EU Corridors, 2009
remittances as share of total received
Sending member stateShare of total remittances
received (%)Recipient country
Total received as % of GDP
Austria 6.2 Serbia 12.6
Czech Republic 21.6 Ukraine 2.0
France 17.9 Portugal 1.5
16.1 Morocco 6.6
Germany — Turkey 0.2
14.2 Italy 0.1
Greece 36.4 Albania 10.9
19 Israel 0.7
Ireland — Poland 2.0
Italy 5.7 China 1.0
5.6 Philippines 11.7
23.3 Romania 4.4
Netherlands — Suriname 0.1
Portugal 11.7 Brazil 0.3
Spain — Colombia 1.8
— Ecuador 4.5
— Bolivia 6.1
Source: Eurostat and World Bank.
Note: — = not available.
Conclusions
Th is chapter examined the main short-term channel of impact on EU remittance out-
fl ows. Evidence was found of a high positive correlation between employment and
remittance trends, on the basis of which EU remittance growth was projected. Th is
exercise generally found that remittances from the EU can be expected to recover grad-
ually during the forecast horizon. Such a recovery is expected to be felt unevenly in
destination countries, depending on employment performance in member states.
Although this exercise provides estimates of immediate adjustments in remittances,
it is unable to inform underlying remittance levels or adjustments from determinants
with lagging eff ects. Some of those determinants are certainly being shaped by the
recent downturn and would require special attention to assess their impact on remit-
tances in the medium term. One notable example is the uncertain eff ect on migration
of labor market adjustments currently taking place in member states (European Com-
mission 2010).

17. IMPACT OF GLOBAL ECONOMIC DOWNTURN ON REMITTANCES FROM THE EU l 225
In turn, medium-term analysis is relevant to orient development policies that aim to
facilitate remittances, to reinforce the link between remittances and development, or to
attenuate the negative impact of remittance declines in recipient countries.
EU member states have long agreed on a set of commitments on remittances, which
are currently in the process of being implemented. Th e objective of these commitments
is threefold: (1) Improving data on remittances: For this purpose member states are
increasingly adopting the recommendations made by the Luxembourg Group regarding
the quality and coverage of data on remittances. (2) Favoring cheaper, faster, and more
secure remittance fl ows: Substantial progress has been achieved by the EU through the
adoption of the Payment Services Directive in November 2007 and the new E-Money
Directive, adopted in October 2009. (3) Enhancing the development impact of remit-
tances: Th is is achieved through various development cooperation programs in the
European Community and member states to support the creation of a business envi-
ronment more conducive to remittances in developing countries.
Additionally, the EU adopted in 2009 a range of immediate actions to help develop-
ing countries mitigate the economic and social consequences of the fi nancial crisis. For
this purpose the EU has mobilized about €2 billion in addition to the EU’s contribu-
tions to international fi nancial institutions’ activities. Th ese actions include, notably,
an ad hoc “Vulnerability FLEX” instrument for 2009 and 2010, acting countercyclically
to allow those developing countries worst hit by the crisis to continue social safety net
spending. Th is is in addition to a “food facility” for 2009–11 adopted to support the
agricultural sector in developing countries and respond to the negative eff ects of vola-
tile food prices on local populations.
Notes
1. Unless mentioned otherwise, remittances include the “compensation of employees” and
“workers’ remittances” as defi ned in the balance-of-payments statistics.
2. EU workers’ remittances would mainly refer to those from immigrants who come from out-
side the EU, whereas compensation of employees mainly refers to payments of cross-border
and seasonal workers who usually come from neighboring countries.
3. No quarterly data on remittances are available for the EU as a whole.
4. Series in fi gure 16.3 are plotted on diff erent scales to take account of the diff erent volatility
of both series.
5. Series in fi gure 16.4 are plotted on diff erent scales to take account of the diff erent volatility
of both series.
6. Th e European Commission does not publish quarterly forecasts on employment. However,
this issue is currently under consideration, and estimates are likely to be included in future
forecast publications.

227
Chapter 18
Remittances and Evolving Migration Flows from Central and Eastern Europe to the United Kingdom
SIMON PEMBERTON AND LISA SCULLION
In recent years, there has been an increasing focus on the migration of people to
the United Kingdom from Central and Eastern European (CEE) countries.1 A key fac-
tor that has infl uenced CEE labor migration patterns to the United Kingdom has been
the European Commission Accession Treaty (2003). Th is set out that for a maximum of
seven years, the EU-15 (pre-2004 countries) would continue to regulate access to their
labor markets because of the uncertainty of the impact of CEE migrants on diff erent
sectors of employment and access to social benefi ts (Traser 2006). Of the EU-15, only
the United Kingdom (along with Ireland and Sweden) decided to “fully” open their labor
markets to CEE workers. Th is created signifi cant “diversion eff ects” in the postenlarge-
ment fl ows of CEE migrant workers to the United Kingdom and Ireland (Ruhs 2006).
Indeed, U.K. Worker Registration Scheme (WRS) fi gures have highlighted that over
1 million registrations for work have been made since 2004 by CEE economic migrants
(Home Offi ce 2010a). Th ese fi gures need to be set against initial U.K. government
expectations of around 20,000 CEE economic migrant workers arriving per annum
(Stenning and others 2006).
Political and media debate, as well as a growing body of academic studies, have sought
to highlight the impact such movements have had on indigenous workers and associated
employment opportunities (Green, Jones, and Owen 2007; Syrett and Lyons 2007) as
well as the implications for public services within the United Kingdom (Pemberton 2008,
2009). Th ere has also been an interest in the economic contribution of such workers.
228 l SIMON PEMBERTON AND LISA SCULLION
In addition, numerous studies have been carried out across the United Kingdom that
consider the experiences and needs of CEE migrant workers (for example, see Hunt and
Steele 2008; MSIO 2006). Many of these investigations have focused on issues such as
employment, accommodation, skills and qualifi cations, and community cohesion. Th e
majority have adopted a survey approach, and, although they have provided very useful
information on a range of issues, more in-depth analysis relating to people’s experiences
is still lacking—and in particular their migration decisions and remittance practices
during a period of increasing economic uncertainty.
Consequently, this chapter seeks to provide a more in-depth understanding on such
issues and CEE migrants’ remittance patterns in respect to savings and expenditure. It
highlights how structural factors and individual agency intersect in diff erent ways for
such groups within an era of global fi nancial crisis. In particular, the analysis provides
new insights into the near-term impact of such crises on CEE migrants’ motivations,
aspirations, and expectations for traveling to or remaining within the United Kingdom,
and the subsequent nature and resilience of their remittance practices.
Context: CEE Migration and Remittances
Existing studies highlight that other than “accessibility,” individuals have migrated to
the United Kingdom based on the perception of the availability of employment and
higher wages than in their home country, where there may be more limited work
opportunities (Bell, Jarman, and Lefebvre 2004). Although employment opportunities
are key for CEE migrants, recent research has also highlighted a range of additional
factors shaping their decisions to come to and/or remain in the United Kingdom,
including access to welfare, as well as education and training opportunities (Scullion
and Pemberton 2010).
It has been claimed that many CEE migrants are keeping well informed about the
economies in their home countries and are willing to make decisions concerning their
movement on fairly short notice (Finch and others 2009). Such decisions have been
related to a fall in recent WRS approvals for CEE migrant workers in the United King-
dom, which declined by over a third between March 2008 and March 2009 (Home
Offi ce 2009). Indeed, it has recently been estimated that as many as 500,000 CEE
migrant workers may now have left the United Kingdom (Finch and others 2009; Pol-
lard, Latorre, and Sriskandarajah 2008).
However, such arguments assume that migrants act as rational economic decision
makers, and they do not necessarily account for the variety of individual circumstances
and other noneconomic factors that infl uence motivations to migrate to, from, and
within countries such as the United Kingdom (Scullion and Pemberton 2010). In the
context of migration fl ows and remittances, this is important and warrants further
attention in the discussion that follows. Indeed, evidence is already available from a

18. REMITTANCES AND FLOWS FROM CENTRAL AND EASTERN EUROPE TO THE UK l 229
recent study in North West England that many CEE migrants have remained in situ
despite rising unemployment (Scullion and Morris 2009).
Furthermore, if an individualistic approach is taken, research has found that both
migration and remittance decisions and practices can vary greatly depending on age,
family ties, and profession (McKay and Winkelmann-Gleed 2005). For example, it has
been claimed that Polish migrants sent home almost ₤1 billion in the fi rst quarter of
2007 (Slack 2007), and in a more recent analysis, Smyth (2010) has claimed that Polish
workers in Britain and Germany provided the largest amount of remittances to Poland
last year, although these had fallen since 2007. Some commentators have argued that
the reduction has occurred as a by-product of family reunifi cation or CEE migrants
having children while in the United Kingdom. In turn, although sending countries may
suff er through such processes, receiving countries (such as the United Kingdom) may
benefi t given that money that was previously sent home may now be spent or saved in
the host country (Cortina and Ochoa-Reza 2008).
What we also need to be aware of is the extent to which remittance practices may be
informed by the interplay between the agency of individual migrants and the structural con-
text within which CEE migrants seek to maneuver (Phizacklea 2000: 119). Structure can be
viewed in terms of its manifestations in institutional factors, government policy being the
most obvious of these. Successive legislation in the United Kingdom has created an immi-
gration system that provides diff erential access to basic rights and services, depending on a
migrant’s area of origin, skills level, and so on. Th ese factors infl uence what resources people
are able to draw on and their capacity to act. CEE migrants are not passive recipients of such
policies and can seek to elaborate or modify structural conditions (Hunt 2008: 282).
It is important to recognize that the public demands for “managed migration” to the
United Kingdom has led to the Points-Based System to restrict migration from outside
the European Economic Area (EEA) (initiated in February 2008) and the introduction
of a permanent cap on non-EEA workers in April 2011. Additionally, the introduction
of the Resident Labour Market test required employers to demonstrate that they have
failed to fi ll vacancies from within the United Kingdom and EEA before they were able
to recruit from outside Europe (UKBA 2008). Such changes were driven by the global
economic downturn and a greater focus on the local impact of international labor
migration (Anderson and Ruhs 2009). However, they were also driven by a belief that
the increasing numbers of CEE migrants arriving in the United Kingdom would enable
the phasing out of low-skill immigration schemes for individuals from other parts of the
world (Home Offi ce 2006).
Many studies have promoted an economic discourse in terms of the contributions
made by CEE migrants to the United Kingdom, with arguments that such individuals
bring with them numerous positive benefi ts for employers and the national economy,
namely, (1) reducing the average age of the workforce, (2) reliability and a good work
ethic helping businesses to expand and diversify, (3) a willingness to work long and/or
antisocial hours, and (4) high rates of productivity while minimizing labor costs and the
threat of infl ation (Green, Jones, and Owen 2007). It has also been estimated that in the

230 l SIMON PEMBERTON AND LISA SCULLION
North West region alone each migrant worker will account for more than £7,000 of tax
revenue (MSIO 2006).
Given this context, it is not surprising that CEE economic migrants are viewed as
a resource to fi ll occupations with both “skills” and “people” shortages (McClaughlin
and Smith 2005; Rennie 2005), although the issue of “brain waste” is also of relevance
given their concentration in less skilled occupations, regardless of skills, experience, or
linguistic capability. Hence although it may appear that U.K. immigration policy may
be privileging CEE migrants above others (non-EEA migrants), the fact that many CEE
migrants appear to be underemployed (and yet have remained in the United Kingdom)
will also have a signifi cant infl uence on shaping their patterns of migration and the
impact of their remittances. It also provides an interesting parallel to the situation in
non-EEA countries where remittances have been a “valuable source of development
fi nance,” but with migrant workers fi nding it increasingly diffi cult to get access to the
U.K. labor market (Datta and others 2006: 11).
Method
Th e research methodology involved 25 semistructured in-depth interviews conducted
during late 2009 and early 2010 with CEE migrant workers who featured prominently
in public and political debates in the United Kingdom. Th e interviews were carried out
by a community researcher, with appropriate language skills, and a mix of “purposive”
and “snowball” sampling was used.
In particular, Czech, Lithuanian, Polish, and Slovak migrant workers were targeted
for both pragmatic reasons (resource and time constraints and language skills and com-
munity links of the interviewer), but also because of such communities being relatively
prominent within the case study area selected for the research: North West England.
Th e basis for selecting the North West was threefold: First, the North West region
has experienced a population decline of 3 percent over the last 20 years, which, coupled
with an aging population (a 12 percent decline in those aged 16–24 has been forecast by
2020), means that there is an increasing reliance on migrant workers to fi ll both “skills”
and “people” shortages (NWDA 2006). Second, the employment rate for the region is
currently 2 percent below the average for England and with the highest proportion of
individuals reliant on the incapacity benefi t in England. Th e region also has high rates
of working age adults with no qualifi cations (Offi ce for National Statistics 2010). Th is
means that migrant labor has been important in addressing job gaps.
With regard to the profi le of the Czech, Lithuanian, Polish, and Slovak individu-
als who participated in the research, there was both a mix of young and more mature
individuals and there was a balance between those who identifi ed themselves as single
(and living with friends or on their own) and those who had families. Th e majority
were currently employed in jobs that mirrored national patterns for the employment of
CEE workers in the United Kingdom (such as warehouse operatives, food processing,
packing, cleaning, and production-line work). A small number were employed in more

18. REMITTANCES AND FLOWS FROM CENTRAL AND EASTERN EUROPE TO THE UK l 231
skilled occupations (such as teaching). Th ree people indicated that they were currently
unemployed. In addition, the interviewees primarily held intermediate-level qualifi ca-
tions in the form of diplomas (or equivalent), but in overall terms such qualifi cations
appeared to have little infl uence on their current type of employment in the United
Kingdom.
Results
Th e results provide a detailed insight of CEE migrants’ motivations, aspirations, and
expectations for traveling to or remaining within the United Kingdom. Th e discussion
considers the extent to which these have remained the same or changed over time in
an era of global fi nancial crisis, and why this may be the case. Th is is crucial because
without having a detailed insight into such issues, it becomes diffi cult to understand
current practice in respect to the nature and level of CEE remittances and how these
may evolve in the future.
CEE Migrants’ Motivations and Expectations for Traveling to or
Remaining within the United Kingdom and the Infl uence of the Global
Financial Crisis
Consistent with the existing literature on CEE migration, economic motivations—in
terms of both high rates of unemployment or a lack of opportunities in the labor market
in their country of origin (a “push” factor) and perceived or actual employment oppor-
tunities in the United Kingdom (a “pull” factor)—were identifi ed as the key reason for
moving by virtually all of the interviewees.
But on the other hand, existing studies do not tend to focus on the extent to which
the relative importance of push-pull factors have changed over time for CEE migrants.
In this respect, the study revealed that for around 60 percent of respondents, the infl u-
ences on their decision to come to the United Kingdom (and the North West region) had
not changed since they had arrived. Th is was despite, in theory, their “agency” increas-
ing as a result of becoming eligible for certain forms of state benefi ts (such as income
support and housing benefi t) once they had been in continuous employment for more
than 12 months. As one interviewee summarized: “Work and solid pay is still the main
motivation to stay despite the current downturn … this country (the United Kingdom)
currently provides much more employment opportunities for people than in Poland.”
For most of the remaining respondents, the research revealed that securing employ-
ment in the United Kingdom, coupled with a view that conditions in their home coun-
try had deteriorated further relative to the U.K. labor market (and a perception of fewer
opportunities for their children in the future), had simply served to reinforce the impor-
tance of the “push” and “pull” factors that had caused them to move before the eco-
nomic downturn. As another respondent noted: “At the moment I am here because I
232 l SIMON PEMBERTON AND LISA SCULLION
know that it is easier to support myself than in Poland … If I move back, I would possibly
not fi nd a job and would lose lots of money.”
With reference to the impact of the fi nancial crisis on relocation within the United
Kingdom and/or return to their host country, the availability and type of employment
(locally) to CEE migrants was argued to be the key issue on whether they stayed within
their local neighborhood, the North West region, or within the United Kingdom. Nev-
ertheless, increasing intramigrant tensions—which it was suggested were increasing as
a result of more competition for fewer jobs—were also cited as an additional factor
in infl uencing the movement of CEE migrants from their existing neighborhoods. For
example, a Czech migrant complained that he was moving elsewhere in the United
Kingdom for work because “most agencies in the region were run by Poles and they just
block you off .”
Failure to remain in work was therefore regarded as having a substantial impact on
the motivation of CEE economic migrants to remain in the United Kingdom. Indeed,
one well-qualifi ed individual commented, “We were planning to stay for fi ve years
… Now? I will be happy if we survive ’til the end of next year [2011] … I am interested
mainly in keeping the job I do now. If I lose it and will not be able to fi nd a similar teach-
ing job, then I would lose my major reason for staying in the United Kingdom.”
Only two interviewees highlighted that their experiences of work (in terms of sat-
isfaction with current working conditions and levels of pay) were leading to a recon-
sideration of whether they wished to remain in the United Kingdom. Th is overriding
economic imperative in the current climate is interesting because other studies have
suggested that disillusionment with work or poor wages have been a key factor in shap-
ing return migration (Coats 2008; Finch and others 2009). In contrast, the research in
North West England indicated that the eff ects of the global fi nancial crisis was leading
CEE migrants to reassess their relative agency: Many were reluctant to even consider
changing jobs, and some almost showed “gratitude” toward having employment.
Th ere was also divergence with certain arguments within the existing literature on
the extent to which CEE migrants were making a deliberate and concerted eff ort (over
and above their general perceptions; see above) to be kept informed about the state of
the economy in their home country. Moreover, most respondents—regardless of hav-
ing knowledge of conditions in their home country—indicated that this was not acting
as an infl uence on their motivation to return, which again is contrary to some previous
studies (Coats 2008). In contrast, respondents perceived that economic conditions were
currently pretty much the same everywhere and that their experiences in the United
Kingdom since arrival had reinforced their decision to come in the fi rst place. In the
words of another Czech migrant, “I don’t follow the situation over there [in the Czech
Republic]. Th e real diff erences between the countries are minimal now. It’s so much
linked together and mutually dependent that the local situations are pretty much the
same.”
Th e amount of time CEE migrants have been in the United Kingdom and the impact
of family reunifi cation and family stability in the current economic climate must also

18. REMITTANCES AND FLOWS FROM CENTRAL AND EASTERN EUROPE TO THE UK l 233
be taken into account. Accordingly, the perceptions that many CEE migrants appear to
hold over the “upheaval” of moving (particularly with families and dependents) appears
to have reduced their propensity to move, regardless of economic conditions back
home. Indeed, a father of four commented that he did not want to drag his family all
over Europe now that his children were in British schools.
Very few CEE migrants appeared to have an awareness of where and when labor
market restrictions in other EU countries were to be relaxed. Th ose who did tended to
be older and had been in the United Kingdom for a reasonable length of time, and the
majority did not think that this would have an impact on their future motivations. Some
respondents—particularly those who were more qualifi ed—did suggest, however, that
they may be more likely to leave in the fi rst instance, with Belgium, Denmark, Finland,
Germany, and Sweden seen as potential destinations. Job availability and a positive local
(built) environment (for example, good quality housing) were key reasons for moving to
such countries. Th is was summed up by a young female Polish interviewee who stated,
If I am single like now, I will go to Germany. And I will try to start there again, from zero.
Because I speak German as good as English—at the same level. Berlin … it is clean in the
city, the houses are better quality … Just walk in Berlin or Düsseldorf, you feel like being in
Europe there. But here, Kensington, Toxteth, it’s the Th ird World.”
At the same time, linguistic capability was viewed as a limiting factor on the “alter-
natives” available to many CEE migrant workers. In essence, only Ireland was seen as a
viable alternative for those who had no knowledge, understanding, or expertise in other
languages. Th is is even less likely to be a suitable alternative given the budgetary prob-
lems that have arisen in Ireland during the latter half of 2010.
Th us to summarize, it is apparent that from an economic perspective, the global
fi nancial crisis appears to have compounded or reinforced the decisions of CEE migrants
who currently remain in the United Kingdom to remain in situ. However, it is also clear
that other noneconomic factors—such as family stability and linguistic capability, as
well as the structural privileging of such individuals in terms of the United Kingdom’s
immigration policy—have intersected with CEE migrant agency and their lack of moti-
vation to return home. Having said this, if the fi nancial crisis deepens further—increas-
ing competition for even fewer jobs between CEE migrants, non-EEA migrants, and
the host population—this may lead to individuals reassessing their options. Th is could
equally be the case for both skilled, well-qualifi ed CEE migrants, as well as those with
fewer skills and qualifi cations given the nature of cuts that are envisaged in the next
three to fi ve years in the United Kingdom across the public and private sectors.
Th e Evolving Nature and Level of CEE Remittances
Having discussed some of the infl uences that motivate CEE migrants to remain in
the United Kingdom in a period of economic uncertainty, it also becomes possible
234 l SIMON PEMBERTON AND LISA SCULLION
to consider the impact of such infl uences on the nature, resilience, and future of CEE
migrants’ remittance practices.
It was clear that the changing economic situation had an eff ect on the resilience of
remittances in several diff erent ways. For example, CEE migrants who remain in the
United Kingdom indicated that they were now actually spending the majority of their
income in the United Kingdom. Th e percentage of wages that individuals spent ranged
from all of their wages to around 50 percent of their wages (on a weekly or monthly
basis). Following the three key expenses (rent, food, and utilities), individuals made
reference to spending their income on transport and travel (this included to and from
work, as well as for leisure purposes), clothes, mobiles phones, Internet access, as well
as leisure activities such as museums, cinemas, and theaters. A number of respondents
also made reference to membership at local gyms or sports centers.
Hence very few CEE migrants made reference to sending money back to their home
country. In the words of one interviewee, “Th e people who saved their money are the
ones who have now returned home. But we live like [we are] at home here.” Th is, per-
haps, is a key fi nding. Th e length of time that CEE migrants have been in the United
Kingdom appears to relate directly to spending and saving ratios. Th e general percep-
tion of CEE migrants—and this has been supported in other research studies (Pollard,
Latorre, and Sriskandarajah 2008)—is that that new CEE arrivals to the United King-
dom were more likely to save in the fi rst instance. After living for some time in the
United Kingdom, however, individuals started to spend their savings. In some cases this
was due to changing circumstances; for example, CEE migrants no longer wished to live
in shared accommodations, possibly because of family reunifi cation issues. However,
some respondents simply referred to wanting to buy additional things as time went on.
Of those who have remained and who indicated that they were saving some of their
income, this was not generally remittance related. Rather, they were attempting to build
a “safety net” to allow them to remain in the United Kingdom while they sought alter-
native employment if they were made redundant. Interestingly, some CEE migrants
also made reference to having accumulated large debts through being employed on an
inconsistent basis in the United Kingdom as a result of the global economic downturn
and that they now needed to pay off . Once again, this appeared to be impinging on the
resilience of their remittances and the extent to which sending countries such as the
Czech Republic, Lithuania, Poland, and Slovakia were benefi ting, and where unemploy-
ment rates have remained generally at a much higher level than in Western Europe
(Smyth 2010).
Linking with current spending and saving patterns and the impact on remittances,
the study explored possible changes to CEE migrants’ future remittance practices. What
emerged was a perception that they were likely to save less and spend more in the future.
Generally, this was not because of any desire to spend more money on particular activi-
ties or items, but rather because of the fi nancial crisis pushing up the cost of living in the
United Kingdom coupled with an emphasis on a reduction in salary costs:
18. REMITTANCES AND FLOWS FROM CENTRAL AND EASTERN EUROPE TO THE UK l 235
When I arrived in the United Kingdom, my fi rst wage was £5.10 an hour. Now I get minimum
wage again and it is £5.73. So the diff erence after four years of work is only 60p. So how many
percent increase is that? And now compare the increase of prices: I think the prices went up
almost 50 percent, for example, for food and local transport. So I rather expect shrinking sav-
ings and remittances as we move forward. (Polish female interviewee, aged 53)
To conclude, most of the interviewees who participated in the study had been in
the United Kingdom for a considerable period of time and had plans to stay in the
medium-to-longer term. Th is appeared to aff ect their individual agency and decisions
over remittances. Indeed, there was very little evidence of CEE migrants (in the cur-
rent climate) sending remittances home. Most were spending the majority of their
income in the United Kingdom. Th e percentage of wages that migrants currently spent
ranged from all of their wages to 50 percent of their wages. Numerous respondents
did try to save some money; however, this was often because of a desire for a “safety
net” in the United Kingdom over and above that provided by the welfare state. With
regard to the latter point, there was little reference made by most CEE migrants to
claiming state benefi ts, nor a desire to do so. Perhaps the one exception in this respect
was more mature CEE migrant workers, who noted that they were hoping to remain
in work within the United Kingdom to become eligible for some form of future U.K.
state pension.
Conclusion
Th is chapter has highlighted some of the near-term impacts of the global fi nancial crisis
on patterns of migration to and from the United Kingdom by CEE labor migrants. It
illustrated that the crisis has led to a degree of transience of such individuals who have
remained in the United Kingdom, although further job losses may infl uence signifi cant
large-scale return migration for both those fi lling “skills” and “people” shortage occupa-
tions. However, such a movement would also be dependent on the economic conditions
in sending (CEE) countries, other EEA countries, and a series of noneconomic factors,
such as migrants’ propensity to move, based on family, linguistic, and other cultural
factors.
From a remittance perspective, the fi nancial crisis has had some impact on the
level of remittances sent by CEE migrants remaining within the United Kingdom: In
essence, they appear to be at a lower level than was the case for those CEE migrants
who migrated temporarily to the United Kingdom during an earlier period of eco-
nomic growth (2004–07) but who have now returned home. Hence the benefi ts over
time may have shifted toward the receiving country (United Kingdom) compared with
the sending (CEE) countries, and this may exacerbate future unevenness in economic
performance of EEA countries. Nevertheless, better capitalization of CEE migrants’
skills, qualifi cations, and experiences may be required to generate further benefi ts for
the United Kingdom. Equally, there is a need to ensure that the benefi ts to the local

236 l SIMON PEMBERTON AND LISA SCULLION
or regional economy of CEE migrant expenditures in the United Kingdom are better
calculated. For example, the New Economics Foundation’s Local Multiplier 3 approach
(or a suitable equivalent) could be used to assess the local multiplier that emerges from
(1) public sector support to CEE migrants and (2) CEE migrants’ disposable income
spent within the neighborhood or region.
Finally, over the longer term, there is uncertainty over the extent to which the United
Kingdom’s current policies of “managed migration” and restrictions on non-EEA
migration will help to ameliorate or exacerbate economic recovery, especially if CEE
migrants are unable or unwilling to address both skills and people shortages. Th us it is
perhaps critical that attempts are made to secure and support the existing stock of CEE
migrants in the United Kingdom to ensure that they can be drawn upon to fi ll vacan-
cies as required, but at the same time acknowledging the importance of remittances
to the economic well-being of sending countries and that these migrants may require
additional support (from host countries) to address their future economic challenges.
Note
1. Th e Czech Republic, Estonia, Hungary, Latvia, Lithuania, Poland, Slovakia, and Slovenia
(commonly referred to as the A8 countries); Bulgaria and Romania (commonly referred to
as the A2 countries).
237
Chapter 19
Effects of the Global Crisis on Migration and Remittances in Albania
ILIR GEDESHI AND NICOLAAS DE ZWAGER
This chapter seeks to examine ways in which the global fi nancial and economic
crisis infl uenced Albanian international migration trends and remittance practices
while also discussing the potential repercussions for the future.
Our analysis draws on a study including a questionnaire survey with 2,470 long-term
migrants, qualitative interviews, and focus groups with migrants carried out between
December 2009 and January 2010. We compare these quantitative data with a baseline
survey conducted a year earlier using the same methodology (de Zwager, Gressmann,
and Gedeshi 2010). Following the methodology, the chapter is divided into three sec-
tions. First, Albanian migration and migrants along with household characteristics are
described; then the impact of the global economic crisis on Albanian migrants and
migration, based on quantitative and qualitative data, is presented; fi nally, the impact
on remittances and return migration is discussed.
Th e study is based on the analysis of both primary and secondary data. It includes
a review of the existing literature and qualitative and quantitative methods (cross-
referenced). Th e qualitative and quantitative methods include six focus group discus-
sions with migrants, 39 semistructured interviews with migrants, and a quantitative
socioeconomic survey with 2,474 migrants. Each of these techniques was used to verify
the results of the others.
Th e survey methodology was adapted from the previous research carried out by
CESS and IASCI in 2008–09 (de Zwager, Gressmann, and Gedeshi 2010). Th is survey of
2,202 migrants provides the baseline data against which the fi ndings from the current
survey are measured.

238 l ILIR GEDESHI AND NICOLAAS DE ZWAGER
Th e migrant survey was carried out around late December 2009 and early January
2010. During this period a large number of Albanian migrants, mainly from Greece,
Italy, and other European countries, return to Albania to celebrate traditional winter
festivities. Th e survey was carried out at the main ports of entry to Albania. Th e num-
ber of interviews conducted at the border points with Greece and Durres Port refl ect
the estimated number of Albanian migrants in Greece and Italy, respectively. At Tirana
International Airport, the survey targeted migrants residing in other countries of
Europe.
Th e questionnaire contained 54 questions designed to elicit quantitative responses
only. We have collected information on sociodemographic characteristics of migrant
households, their fi nancial characteristics (that is, incomes, expenditures, savings,
investments, and remittances), the impact of the global economic crisis on the house-
holds, as well as household strategies for coping with its consequences.
Th e respondents were selected on the basis of having lived more than a year abroad,
being more than 18 years old at the time of the interview, and having migrated for
employment purposes.
Teams of trained and experienced CESS interviewers carried out the questionnaire
survey. Th e interviewers surveyed the migrants while they were waiting in the customs
area of the ports of entry. Th is ensured anonymity and a low refusal rate of less than 1 per-
cent. Th e interview method was face-to-face, and supervisors monitored the process.
Th e survey has certain limitations of which the reader should be aware. It excludes
short-term migrants, irregular migrants, and those who, because of diffi cult economic
or other circumstances, might not have chosen to visit their home country at that time.
We have also conducted qualitative interviews in focus groups using semistructured
questionnaires about the impact of the economic crisis on the migrant households as
well as their coping mechanisms. Focus group participants were long-term migrants of
diff erent ages, education, socioeconomic status, and occupations. Seven to 12 migrants
participated in each focus group. Various quotations have been included in this report,
all with fi ctitious names.
All data presented in the following pages were gained under the current survey and
compared against the available baseline data stipulated above, unless specifi cally men-
tioned and sourced otherwise.
Socioeconomic Characteristics of Albanian Migrants
During the last two decades, mass migration has been at the very core of the political,
economic, and social changes occurring in Albania (UNDP 2006). At the end of 2009,
about 1.2 million people or more than 25 percent of the Albanian population and more
than 35 percent of the labor force were estimated to be living abroad, mainly in Greece
and Italy (de Zwager, Gressmann, and Gedeshi 2010). Smaller numbers were spread
throughout diff erent European countries as well as Australia, Canada, and the United
States. Th us, Albania became a country on the move, as claimed by Carletto and others

19. EFFECTS OF GLOBAL CRISIS ON MIGRATION AND REMITTANCES IN ALBANIA l 239
(2006), or a “sort of laboratory for studying new migratory processes,” if we take King’s
description (2005).
Overall, nearly 65 percent of surveyed migrants migrated in the decade before 2000.
After 2000 the fl ux of migration from Albania has declined. Th is decline can be attrib-
uted, on the one hand, to improvements in the Albanian economy. For instance, from
2000 to 2008, the real average annual gross domestic product (GDP) growth rate was
about 6 percent (World Bank 2010b). Another factor was perhaps tighter migration
controls, particularly in Greece and Italy.
Studies show that economic factors such as diffi cult living conditions, unemploy-
ment, and low salaries represented more than three-fourths of motives to migrate (ETF
2008). Unemployment in Albania was 26 percent in 1992 and 22.6 percent according to
the census of 2001 (INSTAT 2002). Real wages dropped drastically in the early and late
1990s. Almost 26 percent of the population lived below the poverty line, and 4.7 percent
lived in extreme poverty (World Bank 2003). At the end of the 1990s, 149,000 households
or about 20 percent of the country’s households were dependent on “economic aid” pro-
vided by the state. Consequently, migration was primarily economic and best defi ned as
a form of “survival migration” (Barjaba 2002). However, along with diffi cult economic
conditions, other factors such as political uncertainty and violence, personal freedom,
education, and professional career development played a role too (Vullnetari 2007).
Amnesties and other forms of status regularization eff orts in Greece and Italy,
mainly during the 1995–2002 period, helped Albanians settle in these countries (Vull-
netari 2007). Th e survey data show that 96 percent of married Albanian migrants in
Italy and 90 percent of those in Greece have realized family reunifi cation. Almost 1.8
persons, usually husband and wife, work and secure the household income. Children go
to school, and fi nancing their education constitutes one of the main objectives for sav-
ing for many migrant families. Most of the migrants interviewed speak “fl uent” (42 per-
cent) or “well” (52 percent) the language of their host country, showing a high level
of integration. Meanwhile, 36 percent of migrants residing in Germany, Italy, and the
United Kingdom have received language courses and/or professional training. Some
have enrolled at universities. Th us, Albanians abroad have gradually improved their
socioeconomic status (ETF 2008).
According to the migrant survey the main sectors of employment for Albanians
abroad are construction (35 percent), services (21 percent), manufacturing and industry
(17 percent), domestic help (15 percent), and agriculture (10 percent). Job sector divi-
sion exists by gender among the migrants. Males mainly work in construction (49 per-
cent), services (19 percent), and manufacturing and industry (18 percent). Females work
mainly as domestic help (53 percent), as well as in services (26 percent) and manufac-
turing and industry (13 percent). Distinctions exist among sectors of employment for
those who migrate to Germany, Greece, Italy, and the United Kingdom. Compared with
Greece, a larger percentage of migrants in Italy and other European Union (EU) coun-
tries work in manufacturing and services (such as in the United Kingdom), and a lower
percentage works in agriculture.

240 l ILIR GEDESHI AND NICOLAAS DE ZWAGER
A distinctive feature is that 56 percent of the migrants in Italy and 59 percent of
those in Germany and the United Kingdom say that they work as qualifi ed workers,
against 43 percent in Greece. Th is can be largely explained by the labor needs of the host
country economy. Greece, for instance, has had a higher demand for unqualifi ed work
in construction, agriculture, and services (Lyberaki and Lambrianidis 2004). Albanian
entrepreneurs in host countries followed the same pattern: We found that about 8 per-
cent of Albanian migrants have created businesses in their host country, and these busi-
nesses were mainly in construction (43 percent) and services (29 percent) (fi gure 19.1).
FIGURE 19.1 Employment Sectors of Albanian Migrants in Host Countries, 2009–10
per
cent
0
10
20
30
40
50
construction services/tourism
manufacturing domestichelp
agriculture other
otherGreece Italy
Source: CESS Migrant Questionnaire, 2009–10.
The Impact of the Global Economic Crisis on Albanian Migrant Households
Greece and Italy, the two primary countries of destination for Albanian migration,
have been severely aff ected by the global economic crisis. GDP in Italy dropped by
−1.3 percent in 2008 and by −5.0 percent in 2009, and unemployment reached 8.4 per-
cent in December 2009 and 8.6 percent in December 2010 (Eurostat 2011). Greece
saw an average annual increase of 4 percent of GDP during the fi rst fi ve years of the
new millennium, but this dropped to −2.0 percent in 2009 and a further −4.2 percent
in 2010 (Eurostat 2011) (fi gure 19.2). Th is signaled Greece’s entry into its deepest and
most severe recession of the last 30 years (Bastian 2010). Unemployment rose from
8.8 percent in February 2009 to 10.2 percent in December 2009, 12.2 percent in June
2010, and 12.9 percent in September 2010 (Eurostat 2011). Since then the impact of
the crisis on Greece has only deepened, in large part because of the sovereign debt

19. EFFECTS OF GLOBAL CRISIS ON MIGRATION AND REMITTANCES IN ALBANIA l 241
crisis and commensurate severe cutbacks in public spending (10 percent of the state
budget in 2010).
In Albania, offi cial data from the end of 2008 showed GDP growth rates slowing
from quarter to quarter. In 2009 offi cial GDP growth for Albania was 2.5 percent versus
7.5 percent for the same period in 2008 (World Bank 2010b).
FIGURE 19.3 Impact of Economic Crisis on Albanian Households in Migration in 2009
0 10 20 30 40 50 60
no impact
other
job loss
household membershave lost work
decrease in workingdays/hours
lowering ofhousehold income
Greece
Italy
other
GDP growth rate (%)
Source: CESS Migrant Questionnaire, 2009–10.
FIGURE 19.2 GDP Growth and Unemployment Rates in Greece and Italy, 1998–2012p
erce
nt
−6
−3
0
3
6
9
12
15
1998 1999 2000 2001 2002 2003 2004 2005 2006 2007 2008 2009 2010 2011 2012
unemployment, Greece
unemployment, Italy GDP, Greece
GDP, Italy
Source: Eurostat 2011.

242 l ILIR GEDESHI AND NICOLAAS DE ZWAGER
Th e impact of the global economic crisis on Albania is further seen in the deteriora-
tion of other key indicators of economic activity. Foreign debt in 2009 reached 24.3 per-
cent of GDP, from 18.4 percent in 2008 (World Bank 2010b). Exports, three-quarters
of which go to the EU area, dropped in 2009 because of reduced demand there. Remit-
tances from migration, which offi cially dropped for the fi rst time in 2008 by 12 percent,
fell a further 6.5 percent in 2009 and 4.6 percent in the fi rst nine months of 2010 (Bank
of Albania 2010). In 2009 remittances dropped to 10.8 percent of GDP from 13.5 per-
cent in 2007.
Our respondents reported that the most felt eff ects of the economic downturn on
migrant households were “decrease in working days or working hours” (46 percent),
“loss of employment by a member of the family” (14 percent), “personal loss of employ-
ment” (9 percent), and “increase in prices and cost of living” (2.2 percent). Taken
together, these factors refl ect a decrease in household income shared by 54 percent of
interviewed migrants. In contrast, only 23 percent of respondents felt that by the time
of the interview the eff ects of the economic crisis had not aff ected their households.
Unemployment
In most EU countries, especially in those most aff ected by the current economic crisis,
unemployment among migrants is more prevalent than that of the local population
(UNDP 2010). Migrants are often “last hired, fi rst fi red” and have the socioeconomic
profi le and demographic characteristic of employees who are most vulnerable to unem-
ployment and underemployment during an economic crisis (Fix and others 2009). Th ey
commonly work in cyclical and seasonal sectors of the economy such as construction,
manufacturing, hotels, and restaurants. Th ey are often younger, less qualifi ed, and less
educated than the local population and are more likely to work in informal sectors or
without regular work contracts (IOM 2010).
Empirical data from the present survey show that the average unemployment level
of Albanian migrants at the end of 2009 was 9 percent, or slightly higher than the gen-
eral average within the two primary host countries. Th e level of unemployment was
higher among Albanian migrants in Italy (11 percent) than those in Greece (8 per-
cent). On the other hand, the data also indicate that the unemployment level was rap-
idly increasing in Greece during the last months of 2009. Th is refl ects the deepening
economic crisis in that country. As can be seen in fi gure 18.4, almost 75 percent of
unemployed Albanian migrants in Greece lost their employment during the last four
months of 2009, whereas in Italy “only” 30 percent of Albanians lost their jobs in the
same period (fi gure 19.4).
In addition, 14 percent of respondents reported “one or more members of their
household in migration” losing their place of employment over the previous year. As
a result, and at the end of 2009, it is possible to estimate that about 22.5 percent of
Albanian migrant households had at least one unemployed member who had been
employed the year before.
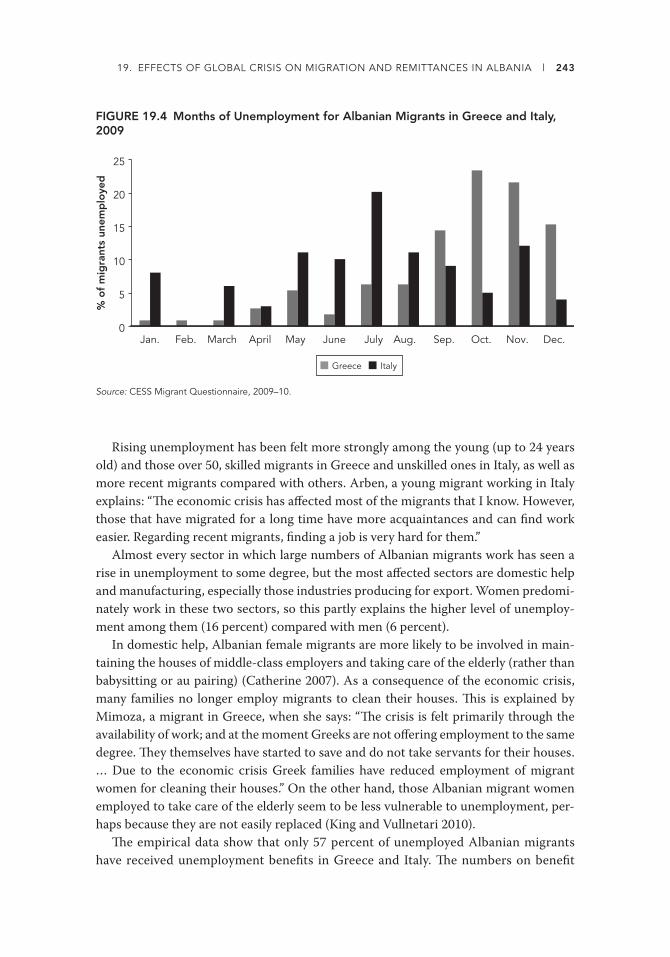
19. EFFECTS OF GLOBAL CRISIS ON MIGRATION AND REMITTANCES IN ALBANIA l 243
Rising unemployment has been felt more strongly among the young (up to 24 years
old) and those over 50, skilled migrants in Greece and unskilled ones in Italy, as well as
more recent migrants compared with others. Arben, a young migrant working in Italy
explains: “Th e economic crisis has aff ected most of the migrants that I know. However,
those that have migrated for a long time have more acquaintances and can fi nd work
easier. Regarding recent migrants, fi nding a job is very hard for them.”
Almost every sector in which large numbers of Albanian migrants work has seen a
rise in unemployment to some degree, but the most aff ected sectors are domestic help
and manufacturing, especially those industries producing for export. Women predomi-
nately work in these two sectors, so this partly explains the higher level of unemploy-
ment among them (16 percent) compared with men (6 percent).
In domestic help, Albanian female migrants are more likely to be involved in main-
taining the houses of middle-class employers and taking care of the elderly (rather than
babysitting or au pairing) (Catherine 2007). As a consequence of the economic crisis,
many families no longer employ migrants to clean their houses. Th is is explained by
Mimoza, a migrant in Greece, when she says: “Th e crisis is felt primarily through the
availability of work; and at the moment Greeks are not off ering employment to the same
degree. Th ey themselves have started to save and do not take servants for their houses.
… Due to the economic crisis Greek families have reduced employment of migrant
women for cleaning their houses.” On the other hand, those Albanian migrant women
employed to take care of the elderly seem to be less vulnerable to unemployment, per-
haps because they are not easily replaced (King and Vullnetari 2010).
Th e empirical data show that only 57 percent of unemployed Albanian migrants
have received unemployment benefi ts in Greece and Italy. Th e numbers on benefi t
FIGURE 19.4 Months of Unemployment for Albanian Migrants in Greece and Italy, 2009
% o
f m
igra
nts
unem
plo
yed
0
5
10
15
20
25
Jan. Feb. March April May June July Aug. Sep. Oct. Nov. Dec.
Greece Italy
Source: CESS Migrant Questionnaire, 2009–10.
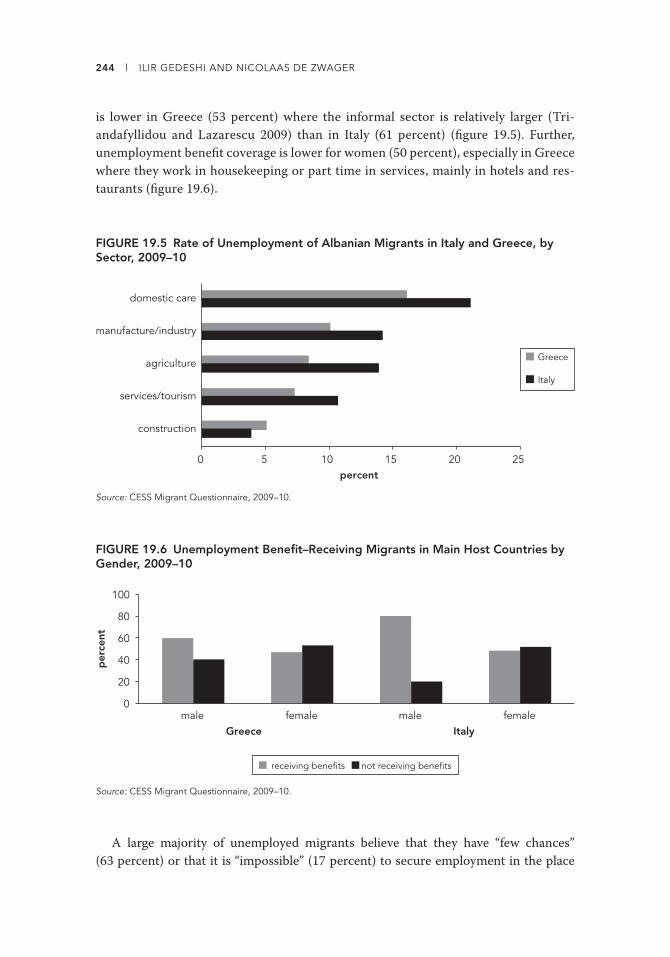
244 l ILIR GEDESHI AND NICOLAAS DE ZWAGER
is lower in Greece (53 percent) where the informal sector is relatively larger (Tri-
andafyllidou and Lazarescu 2009) than in Italy (61 percent) (fi gure 19.5). Further,
unemployment benefi t coverage is lower for women (50 percent), especially in Greece
where they work in housekeeping or part time in services, mainly in hotels and res-
taurants (fi gure 19.6).
FIGURE 19.5 Rate of Unemployment of Albanian Migrants in Italy and Greece, by Sector, 2009–10
Greece
Italy
percent0 5 10 15 20 25
construction
services/tourism
agriculture
manufacture/industry
domestic care
Source: CESS Migrant Questionnaire, 2009–10.
FIGURE 19.6 Unemployment Benefi t–Receiving Migrants in Main Host Countries by Gender, 2009–10
per
cent
0
20
40
60
80
100
male female male female Greece Italy
receiving benefits not receiving benefits
Source: CESS Migrant Questionnaire, 2009–10.
A large majority of unemployed migrants believe that they have “few chances”
(63 percent) or that it is “impossible” (17 percent) to secure employment in the place

19. EFFECTS OF GLOBAL CRISIS ON MIGRATION AND REMITTANCES IN ALBANIA l 245
of migration within the fi rst six months of 2010. Th is percentage is signifi cantly higher
among female migrants than among males. Th is can be explained by the tight labor
market and lack of real choices for women in the two primary host countries.
In many cases, an increase in unemployment within a given sector results in the dis-
placement of the migrants to another sector, but with signifi cantly lower incomes. Th is
mobility is observed especially in the construction sector, which is severely aff ected by
the economic crisis, and toward agriculture or other sectors. Offi cial Greek statistics
show that in 2007 the average value of a working day for males engaged in construc-
tion was €56, and in other sectors this was €36 (Triandafyllidou and Lazarescu 2009).
Consequently, when displaced from one employment sector to another, the migrants’
income lowers signifi cantly.
Others move from higher to lower skilled jobs. Th is is the case with Luan, who said:
“Until recently I worked in a small factory in Athens and received €1,200 per month. It
closed down, and now I have to work as night watch in a trade magazine. Th e work does
not correspond to my education and skills, and the salary is much lower.”
Underemployment: In Working Days and Hours
Forty-six percent of migrants stated that one of the consequences of the economic crisis
was a “shortage of working days or hours,” which resulted in lower household incomes.
According to the migrants, this reduction in working days and hours is experienced
most in the agriculture sector (52 percent), construction (50 percent), and housekeep-
ing (48 percent). It is somewhat less evident in Italy (48 percent) than in Greece (45 per-
cent). It is worse for irregular migrants, that is, those who work in the informal sector
or do casual jobs. Sandri, a migrant who every day goes to “Omonia Square” (the place
where migrants fi nd informal and casual work), as he calls it, says: “Before I used to
work some days a week. Now, although the daily pay rate has been reduced, I am fi nding
less and less work.”
Many others have second jobs, a phenomenon that is widespread among migrants
in Greece. Bashkim, a migrant for several years in a tourist area of Greece, tells of his
experience:
In the construction fi rm where I worked I was employed for six days a week and I was paid
€50 a day. On Sunday, I worked only for myself and could earn more than €50 for the day.
… However, I also did other jobs during the week such as painting, repairs, and so on. As a
result, I could earn about €2,000 per month from all these sources. … Now I see no future
and everything seems harder. My income is much lower.
Other migrants report that in conditions brought on by the economic crisis, the price
of work per unit of production has been reduced, and thus their income has diminished.
Th is was confi rmed by Agim, a migrant who worked for years in the construction sector
in Greece, where, he says:

246 l ILIR GEDESHI AND NICOLAAS DE ZWAGER
Our incomes have shrunk considerably. Completing one cubic meter of concrete (standard
measurement unit in construction) earned €50 before, but now the price has dropped to
€30. … Actually, we work more but earn less. … Th ere are other migrants that are unem-
ployed and accept the jobs for lower payment.
Th e crisis has also worsened their economic and social status. Th e average salary of
migrants in Greece—for the same job—is often lower than that of local hires. Th is dif-
ference is smaller in construction, but higher in other sectors. In 2007, for instance, the
average salary of Albanian migrants was 85 percent of the average salary of equivalent
Greek workers, whereas in other sectors this fi gure was much lower (Gropas and Trian-
dafyllidou 2008). With the economic crisis, Triandafyllidou and Lazarescu (2009) state
that this diff erence has not only increased, but migrants fearing unemployment can
and do accept even lower salaries. Consequently, many entrepreneurs in conditions of
increasing competition are more interested in using cheaper and more fl exible workers
(those who accept work without social insurance and regular contracts), who are often
immigrants.
Diminishing Household Income and Savings
Household incomes declined as a result of the increases in unemployment, decreases
in pay levels, reductions in working hours and days, and shifts from highly paid sec-
tors to low-paid ones. Th us it contributed to the decline in migrant households’
socioeconomic status. Fifty-two percent of migrant families in Greece stated that
their household incomes decreased during 2009 because of the economic crisis. At
the same time, everyday basic expenditures have increased as the prices of goods
and services have gone up. Th us, fi nancial well-being has worsened for 58 percent
of migrants compared to a year earlier, and 10 percent say that it is “much worse”
(table 19.1).
TABLE 19.1 Estimate of Financial Well-Being of Albanian Migrant Households Comparing 2008 and 2009
Comparison of well-being
Greece Italy Other Average
Frequency % Frequency % Frequency % Frequency %
Much better 9 0.7 2 0.2 0 0 11 0.4
Better 132 9.6 11 1.1 5 4.3 148 6.0
Same 346 25.1 233 23.9 40 34.5 619 25.1
Worse 823 59.7 554 56.9 64 55.2 1,441 58.4
Much worse 69 5.0 173 17.8 7 6.0 249 10.1
Total 1,379 100.0 973 100.0 116 100.0 2,468 100.0
Source: CESS Migrant Questionnaire, 2009–10.

19. EFFECTS OF GLOBAL CRISIS ON MIGRATION AND REMITTANCES IN ALBANIA l 247
In January 2009, de Zwager, Gressmann, and Gedeshi (2010) carried out a survey
with 2,202 migrants visiting Albania for their Christmas and New Year holidays. Th e
survey contained detailed questions on the migrants’ income, expenses, savings, and
remittances. A comparison of the results of the two surveys1 shows that the average
incomes of households of Albanian migrants in Greece diminished by about 11 percent
from 2008 to 2009—or from €2,123 per household to €1,897—while the household bud-
get decreased by an average of 4.1 percent (table 19.2).
TABLE 19.2 Comparison of Incomes, Expenses, and Savings of Migrant Households in Greece in 2008 and 2009
2008 (euros) 2009 (euros) Difference (%)
Average monthly household income 2,123 1,897 −10.7
Average monthly household expenditure 1,365 1,310 −4.1
Average monthly household savings 758 587 −22.6
Average yearly household savings 9,096 7,044 −22.6
Source: CESS Migrant Questionnaire, 2009–10; see also de Zwager, Gressmann, and Gedeshi 2010.
Th is negative trend is refl ected in a signifi cant decrease in the fi nancial savings of the
Albanian migrant households. When comparing 2009 with 2008, the average annual
savings of Albanian migrant households—one of the major objectives of migration—
eff ectively decreased from €10,176 to €8,988 per annum.
Th e survey data show that savings have reduced more in Italy, where 76 percent of
migrant households report that they have saved less than a year ago, compared with
Greece (66 percent) and other European countries (61 percent) (table 19.3).
Th e decline of average incomes and savings of migrant households in host countries
has two direct impacts. First, it leads to a lower fl ow of remittances to Albania, and
second, it aff ects the term of the migration cycle, by either shortening it or extending it.
TABLE 19.3 Savings Levels of Albanian Migrant Households in 2009
Savings level
Greece Italy Other Average
Frequency % Frequency % Frequency % Frequency %
Higher 107 7.7 6 0.6 9 7.7 122 4.9
Same 345 25.0 214 21.9 37 31.6 596 24.1
Lower 914 66.1 740 75.9 71 60.7 1,725 69.7
Do not know 16 1.2 15 1.5 0 0.0 31 1.3
Total 1,382 100.0 975 100.0 117 100.0 2,474 100.0
Source: CESS Migrant Questionnaire, 2009–10.

248 l ILIR GEDESHI AND NICOLAAS DE ZWAGER
Remittances Dynamics
Th e yearly fl ow of remittances sent to Albania through formal and informal channels has
increased since 1990 and parallels the rising number of migrants. According to Central
Bank of Albania estimates, remittances by Albanian migrants reached $1,304.5 million
by 2007, rising from $150 million in 1992 (increasing by 870 percent over 15 years).
After 1990, the value of remittances ranged between 10 and 22 percent of Albania’s
GDP (almost the size of an economic sector) and were higher than exports, net foreign
direct investments, and offi cial development aid. Th ese eff ectively covered almost half
the trade defi cit (World Bank 2010b), representing the main foreign fi nancial source,
and one of the main factors determining the extroversion of the Albanian economy (Dit-
ter 2008; Samson 1996). At the microlevel, the most important role played by remit-
tances relates to economic survival and poverty alleviation for many Albanian house-
holds. Th ey represent one of the main factors in distinguishing between “poor” and
“not-poor” households (de Soto and others 2002).
Remittances are used primarily to support basic daily needs (food, clothing, and the
like) of receiving households and thereafter to improve living conditions (such as buy-
ing furniture or home equipment), and, last, to expand or build a new house. A part of
remittances are also used to organize important household and social events (such as
weddings, baptisms, or funerals), whereas a small component might be deposited in the
bank system or, more likely, saved in cash at home (de Soto and others 2002; de Zwager
and others 2005; de Zwager, Gressmann, and Gedeshi 2010; Gedeshi 2002; Vullnetari
2007). Only small parts of remittances are used to invest in economic activities,2 mainly
in microenterprises within the service sector (de Zwager, Gressmann, and Gedeshi
2010). On a larger scale, remittances are mostly used for the import of consumer goods
and “nonproductive” investment, such as housing. Consequently, remittances have
improved the living conditions of many families in Albania but have had a limited role
in sustainable development or job creation.
It is expected that remittance fl ows to Albania, despite a current steady increase,
would decline in the medium term (Civici, Gedeshi, and Shehi 1999; de Zwager and
others 2005; Gedeshi 2002; Gedeshi and Mara 2003). Th is prognosis was based on
eff ects associated with the “maturation of the Albanian migration cycle.” Nikas and
King (2005) warned that an economic crisis in Greece, one of the main destinations of
Albanian migration, would lead to a rapid decrease in remittance volumes and thereby
have negative consequences for the Albanian economy.
Central Bank of Albania data indicate that the pace of remitting slowed during the
second half of the previous decade, declining sharply in 2008. Th e Central Bank of Alba-
nia (2010) estimated that remittances fell to €833 million in 2008 (or €119 million less
than 2007) and to €782 million in 2009, and this tendency continued during 2010.

19. EFFECTS OF GLOBAL CRISIS ON MIGRATION AND REMITTANCES IN ALBANIA l 249
Remittances in 2009–10
We have found that 61 percent of Albanian remittance-sending migrant households
reported remitting less in 2009 compared with 2008. In 2009 this drop was signifi cantly
larger among Albanian migrants in Italy, where 73 percent have sent less remittances
compared with those in Greece (54 percent; see table 19.4).
TABLE 19.4 Comparison of Estimates of Household Remittance Levels to Albania 2008–09
percent
Country More Less Same Do not know
Greece 13.3 54.0 22.3 10.3
Italy 2.1 73.0 19.6 5.3
Other 7.2 62.9 22.7 7.2
Average 9.1 61.1 21.4 8.4
Source: CESS Migrant Questionnaire, 2009–10.
Within the context of the structural discussion above, two obvious factors directly
infl uence the volume of remittances sent to Albania: Th e fi rst is the actual number of
households that send remittances, and the second is the amount these households send.
Comparison of the results of the current survey and the previous survey (de Zwager,
Gressmann, and Gedeshi 2010) shows that the number of remittance-sending house-
holds has decreased by 11 percent and the average value of remittances has decreased
by about 4 percent. Th e decline was much bigger for Albanian immigrants in Italy
(table 19.5).
TABLE 19.5 Comparison of Migrant Household Remittances in 2008–09
Country
Percentage of households remittingAverage amount of remittance sent
per household (euros)
2008 2009 2008 2009
Greece 79.3 72.9 2,089 2,095
Italy 76.6 57.4 2,009 1,710
Other 70.5 62.4 3,548 4,610
Average 77.5 66.3 2,149 2,074
Source: CESS Migrant Questionnaire, 2009–10; de Zwager and others 2010.

250 l ILIR GEDESHI AND NICOLAAS DE ZWAGER
Comparison of the data from the two surveys indicates a decline of about €117 mil-
lion in 2009 compared with 2008.3 Even when sample diff erences are corrected between
the two household surveys, an estimated €109 million drop in remittance values, or
about 16 percent, can be estimated for 2009. Th us the decline in remittances continues.
Th e Central Bank of Albania estimates that, during the fi rst nine months of 2010,
total remittances from Albanian migration shrank by a further 4.6 percent because of
the rapidly deepening economic crisis in Greece and the structural reasons introduced
above.
As can be seen from table 19.6 many migrants expected such a drop, with 18 percent
of the migrants interviewed (but almost 26 percent of those from Greece) forecasting
that they would be remitting less in 2010. In addition, about 59 percent of surveyed
migrants reported that they “did not know” the future value of their remittances. Nearly
71 percent of migrants in Italy could not predict their remittance intentions in 2010.
Th is can in large part be explained by the high level of insecurity caused by the eco-
nomic crisis in Italy at the time of the survey.
TABLE 19.6 Migrant Household Remittance Amounts Forecasted for 2009–10
percent
Country More Less Same Do not know
Greece 7.3 25.8 17.1 49.7
Italy 11.7 9.4 8.0 70.9
Other 25.0 7.8 8.6 58.6
Average 10.0 18.3 13.0 58.7
Source: CESS Migrant Questionnaire, 2009–10.
Albanian Return Migration in Response to the Economic Downturn
During the survey, migrants were specifi cally asked to select and rate the three most
important strategies for coping with the impact of the economic crisis on their house-
holds in their host country (table 19.7). A large number of respondents selected either
“reducing household expenditures in the host country” or “fi nding a second job or
working overtime” as their primary strategy. Many respondents indicated “fi nding a
second job or working overtime” and “use of savings until they fi nd another job” as
their secondary strategies. Finally, a number of respondents stated that they would be
“reducing remittances” and returning to Albania as alternative strategies to cope with
the crisis.
A smaller number of respondents to the survey favored “bringing a part of their
families to Albania” should the crisis continue to have a negative impact on their house-
holds. Th e objective of this strategy is to reduce daily expenditures in the host country
(for instance, by living in smaller fl ats or dividing costs with two or three friends).

19. EFFECTS OF GLOBAL CRISIS ON MIGRATION AND REMITTANCES IN ALBANIA l 251
Despite the fact that return of the “complete household” to Albania is not a favored
option, anecdotal evidence shows that a low level of return migration might have taken
place as a result of the economic crisis. Th is, of course, merits further research.
Who Will Return to Albania?
Albanian migrants in Greece are more likely to consider return migration compared
with those in Italy or other countries. Most migrants considering this option rate their
fi nancial positions as “bad” or “very bad.” Ana, a migrant in Italy, explains:
Our family was not aff ected by the crisis because neither me nor my husband lost our jobs.
… However, most of the Albanian families I know are going through a deep economic cri-
sis. … In the family of a friend of mine, the husband and the two sons became unemployed.
Th ey survive on the income of my friend (the wife/mother) who works in house cleaning
and by the unemployment insurance payment received by one of her sons. … I know of
migrants that started to ask their families in Albania for money. For instance, last year, the
family of a friend of mine, was in such a diffi cult economic situation due to unemployment
that they started to take debts. … Th ey have still to pay for their house credit to the bank.
… Th e family of her sister in Albania helped them by sending them money.
As shown in fi gure 19.7, the majority of migrants considering return as an option will
postpone this eventuality for as long as possible. About 65 percent of migrants in Greece
considered return happening within the year (such as during 2010), and 26 percent say
that this can happen within the fi rst six months. Th is “wait and see” attitude makes it
diffi cult to predict how migrants might act in the future. Clearly it will be dependent on
environmental factors that will shape the return migration prospects. Th e length and
depth of the crisis and its impact on sectors in which Albanian migrants are employed
TABLE 19.7 Planned Strategies for Managing the Effects of the Economic Crisis, While in the Country of Migration
Possible strategyMost
importantSecond most
importantThird most important
Reducing household expenditures in host country 49.4 12.4 3.2
Finding a second job or working overtime 17.7 28.3 3.8
Using savings for living expenses until fi nding a new job 3.2 14.6 14.8
Reducing remittances sent to family, parents, or relatives in Albania
2.0 9.0 13.7
Return to Albania by part of the household (children or parents)
0.9 1.1 4.1
Return to Albania (whole household) 2.8 1.9 11.8
Other 0.2 0.0 0.2
Source: CESS Migrant Questionnaire, 2009–10 ; see also de Zwager, Gressmann, and Gedeshi 2010.

252 l ILIR GEDESHI AND NICOLAAS DE ZWAGER
will be important. Th e corollary factor is the concurrent economic and social situation
in Albania, representing the return environment faced by migrants. Should the socio-
economic situation in Albania deteriorate—in part because of the global economic cri-
sis—migrants are less likely to return.
Repeated quantitative and qualitative surveys by the authors, and notwithstanding
the impact of the economic crisis discussed above, show that the majority of Albanian
migrants have an existing intention of returning to their homeland, but only after they
have reached their migration objective (usually a savings goal) and thereby successfully
concluding their migration cycle. Th is group of potential returnees, however, might be
infl uenced to move their return forward because of the eff ects of the economic crisis
on their personal situation. Some members of this group of migrants may choose to
hasten their return if the eff ects of the economic crisis disturb their migration-related
savings objectives. Erion, who intends to remain in migration for fi ve more years in
order to save to invest in Albania, personifi es this common behavior: “However, if the
crisis deepens and unemployment rises, we can also return next year … We cannot stay
unemployed and consume our savings.”
Consequences for Albanian Migration and Economic Trends
An overall impact has been a decrease in the fl ow of migration, mainly because of high
unemployment rates, a lack of opportunities, and restrictive policies on migrant work-
ers pursued by host countries.
In the midterm an impact is observed in the reaching of migration objectives,
particularly savings, which can lead to the restructuring of migration cycles. Saving
FIGURE 19.7 Projected Time to Return Home of Respondents Who Are Considering This Option, 2009–10
per
cent
Greece Italy
0
20
40
60
80
3 months 6 months 1 year
Source: CESS Migrant Questionnaire, 2009–10.
Note: n = 396 respondents.

19. EFFECTS OF GLOBAL CRISIS ON MIGRATION AND REMITTANCES IN ALBANIA l 253
behaviors of migrants are particularly interesting to study, because they constitute one
of the major objectives of the migration experience itself (de Zwager, Gressmann, and
Gedeshi 2010). Th e average annual savings of Albanian migrant households has eff ec-
tively decreased by 12 percent between 2008 and 2009. Th is delay in achieving primary
savings objectives aff ects the term of the migration cycle—that is, it extends it.
As noted, it is anticipated that the ongoing economic crisis in Greece will result in
both a further reduction in the number of households remitting as well as lowering the
average value of transfers of the remaining remitters. Assuming that the response of
Albanian migrants in Greece was the same in 2010 as that of the migrants in Italy in
2009, the decrease of remittances will have been signifi cant. For instance, a 25 percent
decrease of remitting households, combined with a decrease of 15 percent of the aver-
age value of the remittances, would result—with other factors remaining constant—in a
drop of about €110–112 million in overall remittance value.
When considering the likelihood of the above remittance scenario, two additional
factors need to be taken into account. First, because of a number of migration-related
factors, a lower number of migrants in Greece have realized family reunifi cation to
date, when compared with Albanian migrants in Italy. Second, a signifi cant number
of migrants in Greece originate from the eastern part of the country and from rural
areas, that is, where poverty levels are higher. In these conditions, Albanian migrants
in Greece presumably have a higher obligation to remit to keep supporting their fami-
lies, even when their incomes and savings fall. In addition, it is important to note that
according to repeated surveys (de Zwager, Gressmann, and Gedeshi 2010), remittances
actually represent a relatively small part of the overall migrant household budget in
Greece (about 9 percent).
Remittances constitute an important driver of Albania’s domestic demand. Further
and continued decreases in the fl ux of remittances would lower the standard of living
for many households, cause serious hardship for many, and negatively infl uence some
macroeconomic indicators. Econometric estimates by the World Bank (2010b) suggest
that for the overall economy (excluding agriculture), a 10 percent decline in remittances
would lead to a 3.6 percent reduction in domestic demand, as measured by the index
of sales. Key contributors to Albania’s GDP and most aff ected sectors are construc-
tion, services, and food. It is believed that declining infl ows from workers abroad has
resulted in sharp contractions, evidenced in Albania’s construction sector over the pre-
vious years.
It is estimated that as much as 4 percent of poverty reduction has been lost because
of the eff ects of the crisis in Albania (World Bank 2011b). Th is eff ectively stalled an
accelerating decline in poverty experienced over the preceding decade, even though
the country was one of the least aff ected by the crisis. In fact, Albania’s GDP growth
remained positive throughout the period of the crisis.
According to the survey and following anecdotal experience, no massive return to
Albania is likely or evidenced. Nonetheless, we can draw some scenarios regarding the
possible consequences of the return of migrants.
254 l ILIR GEDESHI AND NICOLAAS DE ZWAGER
Th e fi rst is that returning migrants can put further pressure on already high and
increasing unemployment rates in Albania. At the end of 2010, INSTAT estimated
unemployment at about 13 percent, up from 12.7 percent at the end of 2008. According
to the survey, 47 percent of those migrants who might decide to return as a direct con-
sequence of the economic crisis would seek employment in Albania. Of these, 28 per-
cent wish to work in their profession within the private sector, 10 percent in the public
sector, and 62 percent will “work at whatever job is off ered to them.”
A second scenario—perhaps more optimistic—is related to the transfer of accumu-
lated savings and to the creation of new working places by the migrants themselves,
should they be prepared and wish to invest their fi nancial, human, and social capitals
in Albania. Previous experience in Albania shows that returned migrants create small
enterprises, mainly in the service sector (ETF 2008; Kilic and others 2007; Lyberaki and
Lambrianidis 2004; World Bank 2007a). Confi rming this trend, data from the survey
show that 53 percent of migrants who wish to invest their savings intend to do so mainly
in small commerce (47 percent), agriculture (15 percent), and construction (11 percent).
A third possible scenario is where a part of the family (parents, children, or women)
returns to Albania, which might then be accompanied by an increase of inward remit-
tances to support the resulting increase in daily household expenses in Albania.
Conclusions
In this chapter we argue that the economic global crisis and its negative consequences in
Albania can be seen as an impetus and opportunity to implement new reforms and poli-
cies. In a recent publication (de Zwager, Gressmann, and Gedeshi 2010), it was found
that fi nancial remittances are only a small part of the wealth produced during the past
two decades of Albanian migration. For instance, the authors conclude that the yearly
and accumulating savings of the Albanian migrants are almost fi ve times higher than
remittances over the same period. Further, continued high voluntary return intentions
(49 percent) among Albanians, and the accompanying fi nancial, human, and social cap-
ital they would bring to Albania, can represent an untapped dynamic for economic and
social development in Albania. As always, this potential opportunity is founded on the
precondition that the social, economic, and institutional environment exists in Albania
so that migrants are attracted to return and eff ectively use their substantial accumu-
lated wealth.
Notes
1. Both surveys use the same methodologies.
2. Twelve percent according to the ALSMS 2002 and 11.8 percent according to 2007 ETF study
(see de Zwager, Gressmann, and Gedeshi 2010).
3. Th is number is much higher than that estimated by the Central Bank of Albania and must
be carefully interpreted.

255
Chapter 20
The Impact of the Global Financial Crisis on Migration to and Remittance Flows from Spain
MARTA ROIG AND JOAQUÍN RECAÑO-VALVERDE
Spain, a country of emigration for decades, has rapidly become one of the world’s
main destination countries of immigration. In January 2010, there were 6.6 million
foreign-born persons in Spain, according to the population register; they represented
14 percent of the total population. Right before the economic crisis hit, in 2007, migrants
living in Spain sent nearly €8.5 billion back to their home countries,1 making Spain the
fi fth largest remittance-sending country in the world in absolute terms, after the United
States, Saudi Arabia, the Russian Federation, and Switzerland (Ratha and Xu 2008).
Th is chapter describes migration fl ows to Spain and remittance outfl ows from Spain
during the economic crisis. It also explores the infl uence of recent migration and labor
market trends in the diff erent responses to the crisis observed in remittance fl ows to the
main receiving countries, namely, Bolivia, Colombia, Ecuador, Morocco, and Romania.2
Migration Flows and the Economic Crisis
Th e Spanish economy enjoyed a long period of growth from the early 1990s to 2008.
Although some European countries entered recession in early 2008, Spain was able to
Th is study has been carried out as part of the projects “La movilidad geográfi ca de la población extranjera en España: factores
sociodemográfi cos y territoriales” (SEJ2007-61662) and “Infl exión del ciclo económico y transformaciones de las migraciones
en España” (CSO2010-19177) funded by the Plan Nacional de I+D+i of the Spanish Ministry of Science and Innovation.

256 l MARTA ROIG AND JOAQUÍN RECAÑO-VALVERDE
maintain positive economic growth until the third quarter of 2008. Unemployment started
to grow before that, in early 2008, with the number of persons unemployed increasing
from 2.2 million in the fi rst quarter of 2008 to 3.4 million in the fourth quarter of 2008
and peaking at 4.6 million, 21 percent of the labor force, in the second quarter of 2010.
Immigration grew rapidly during the years of prosperity and Spain became the main
European destination country for immigration in 2004 (Eurostat 2011). Th e infl ow of
migrants reached a peak in 2007, with close to 1 million entries recorded in the popula-
tion register for the full year, including a record infl ow of 200,000 migrants from Roma-
nia. Immigration started to decline in the second quarter of 2007 and continued to fall
until the end of 2009, stabilizing at some 120,000 entries per quarter in 2010 (INE 2011a).
In other words, the observed decline in immigration preceded the economic crisis.
As shown in fi gure 20.1, such a decline was due mainly to a rapid decline in immigra-
tion from Romania, which joined the European Union on January 1, 2007, and in the
number of entries from Bolivia. Infl ows from the other main origin countries, Colom-
bia, Ecuador, and Morocco, continued growing until early 2008.
FIGURE 20.1 Infl ow of Foreign-Born Persons by Country of Birth, 2004–09
tho
usan
ds
0
10
20
30
40
50
60
70
Q1 Q2 Q3 Q4 Q1 Q2 Q3 Q4 Q1 Q2 Q3 Q4 Q1 Q2 Q3 Q4 Q1 Q2 Q3 Q4 Q1 Q2 Q3 Q4
2004 2005 2006 2007 2008 2009
Morocco Colombia BoliviaRomania Ecuador
Source: Authors’ calculations based on microdata from the population register (“Estadística de Variaciones Residenciales”) for 2004–09 (INE Population Register).
As a result of these trends, the total number of foreign-born persons grew rapidly
until 2008, passing from 1.5 million in 2000 to 4.4 million in 2005 and reaching more
than 6 million in 2008, and it has grown slowly since then. In 2010, Colombia, Ecuador,
Morocco, Romania, and the United Kingdom were the main countries of origin among
the 6.6 million foreign-born, as shown in fi gure 20.2. Th e share of migrants from Latin
America increased from 25 percent in 2000 to 41 percent in 2004 and fell to 36 percent
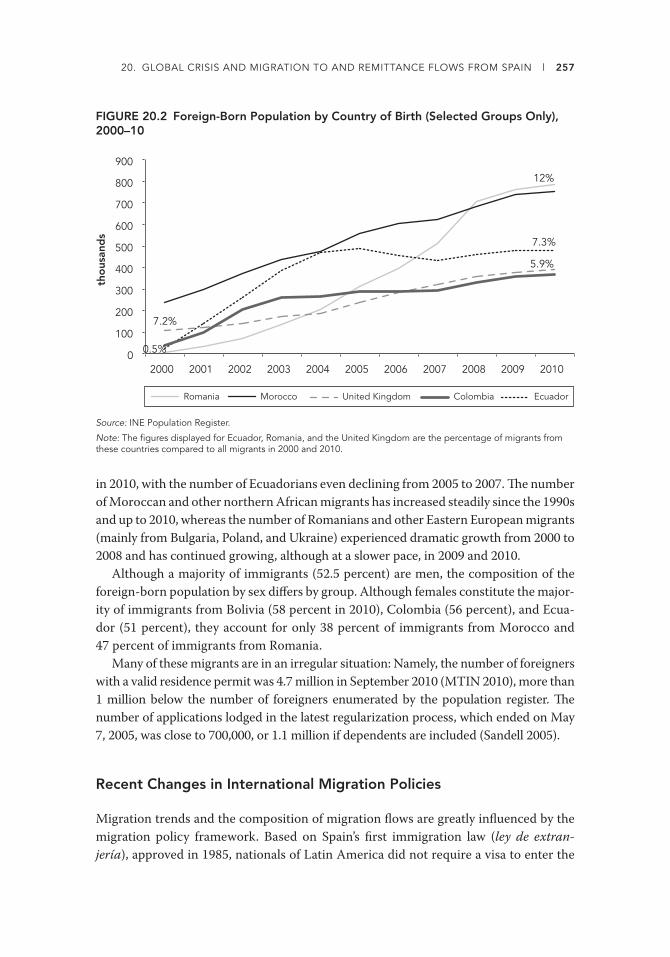
20. GLOBAL CRISIS AND MIGRATION TO AND REMITTANCE FLOWS FROM SPAIN l 257
in 2010, with the number of Ecuadorians even declining from 2005 to 2007. Th e number
of Moroccan and other northern African migrants has increased steadily since the 1990s
and up to 2010, whereas the number of Romanians and other Eastern European migrants
(mainly from Bulgaria, Poland, and Ukraine) experienced dramatic growth from 2000 to
2008 and has continued growing, although at a slower pace, in 2009 and 2010.
Although a majority of immigrants (52.5 percent) are men, the composition of the
foreign-born population by sex diff ers by group. Although females constitute the major-
ity of immigrants from Bolivia (58 percent in 2010), Colombia (56 percent), and Ecua-
dor (51 percent), they account for only 38 percent of immigrants from Morocco and
47 percent of immigrants from Romania.
Many of these migrants are in an irregular situation: Namely, the number of foreigners
with a valid residence permit was 4.7 million in September 2010 (MTIN 2010), more than
1 million below the number of foreigners enumerated by the population register. Th e
number of applications lodged in the latest regularization process, which ended on May
7, 2005, was close to 700,000, or 1.1 million if dependents are included (Sandell 2005).
Recent Changes in International Migration Policies
Migration trends and the composition of migration fl ows are greatly infl uenced by the
migration policy framework. Based on Spain’s fi rst immigration law (ley de extran-
jería), approved in 1985, nationals of Latin America did not require a visa to enter the
FIGURE 20.2 Foreign-Born Population by Country of Birth (Selected Groups Only), 2000–10
tho
usan
ds
Morocco Colombia United KingdomRomania Ecuador
0.5%
12%
7.3%
7.2%
5.9%
0
100
200
300
400
500
600
700
800
900
2000 2001 2002 2003 2004 2005 2006 2007 2008 2009 2010
Source: INE Population Register.
Note: The fi gures displayed for Ecuador, Romania, and the United Kingdom are the percentage of migrants from these countries compared to all migrants in 2000 and 2010.

258 l MARTA ROIG AND JOAQUÍN RECAÑO-VALVERDE
Schengen area. However, starting in 1999, the European Union established the need
for a Schengen visa for nationals of Cuba, the Dominican Republic, and Peru; later
it required a Schengen visa for nationals of Colombia (since January 2002), Ecuador
(August 2003), and Bolivia (April 2007) (MNAEC 2009). Each of these changes caused a
signifi cant increase in migration fl ows from the countries aff ected, in the months before
the visa requirement went into eff ect, and a decline in the number of entries afterward.
As shown in fi gure 20.1, migration from Bolivia peaked in the fi rst quarter of 2007 and
declined sharply after that.
Irregular migration has been an issue in Spain since immigration started to grow in
the early 1990s. As a result, successive Spanish governments resorted to fi ve exceptional
regularization processes from 1991 to 2005. Th e wave of immigration observed from late
2004 to the fi rst half of 2005 was partly motivated by the 2005 regularization campaign
(Proceso de Normalización de Trabajadores Extranjeros 2005), which was the largest
campaign carried out in Spain. In 2006 the Spanish government put in place a new proce-
dure that allows undocumented migrants to obtain a temporary residence permit if they
meet certain conditions, such as being registered where they live, being well established
in their community, and having family members or a job in Spain.3 With the approval of
this new procedure, regularization becomes an individual and permanent process.
In response to the economic crisis, the Spanish government tightened provisions for
family reunifi cation in 2009, requiring a higher minimum income and stricter housing
conditions from those aiming at bringing family members. Th e government has also
launched a new voluntary return-assistance program. Th e program, approved in Novem-
ber 2008, off ers legal migrants who are eligible for unemployment benefi ts free transpor-
tation to their country of origin. Eligible migrants receive 40 percent of their accumu-
lated unemployment benefi ts before departure if they agree to surrender their work and
residence permits and other Spanish documentation and must not return to Spain within
three years of their departure. As of June 2009, the government had approved about 4,000
principal applicants for the return program (McCabe, Lin, and Tanaka 2009).
Th e Spanish government has strongly backed the European Pact on Immigration and
Asylum launched by the government of France and endorsed by all heads of state of the
European Union in 2008. Th e pact argues for a comprehensive, European Union–wide
approach to legal immigration and supports the application of a single, simplifi ed pro-
cedure to attract highly skilled migrants (the “Blue Card” proposal). It calls on member
states to enhance cooperation for the selective repatriation of undocumented migrants,
stresses the need for more eff ective border controls, and underscores the benefi ts of
temporary (and circular) migration (Arango 2010).
Trends in Remittance Flows from Spain
Quarterly outfl ows of workers’ remittances from Spain reached a maximum of €2.3 bil-
lion in the fourth quarter of 2007, right before the crisis hit, declined for the fi rst time
after a period of growth in 2008, to a low of €1.6 million by the fi rst quarter of 2009, and
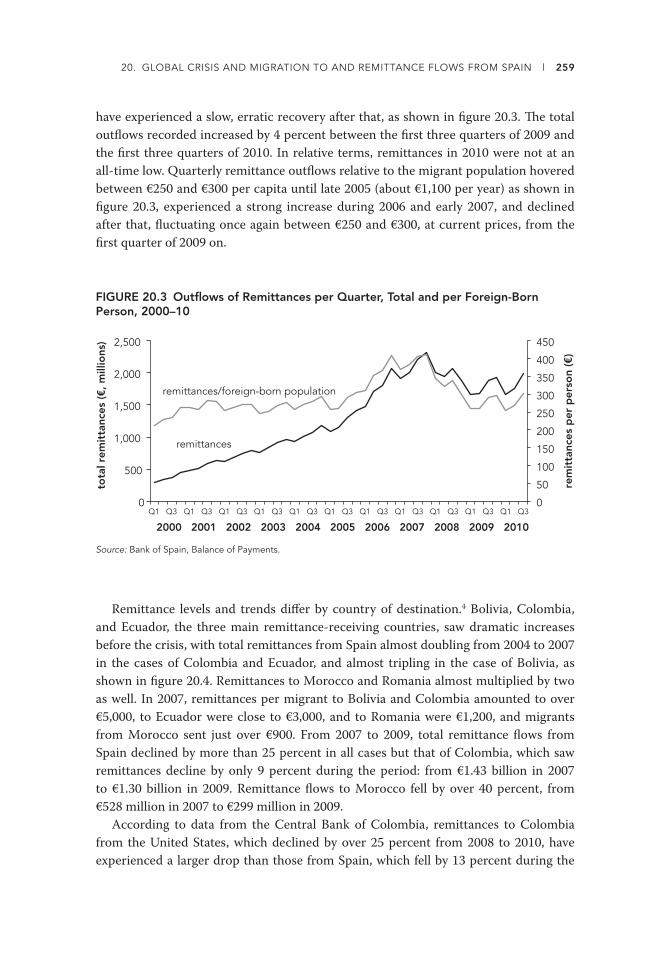
20. GLOBAL CRISIS AND MIGRATION TO AND REMITTANCE FLOWS FROM SPAIN l 259
have experienced a slow, erratic recovery after that, as shown in fi gure 20.3. Th e total
outfl ows recorded increased by 4 percent between the fi rst three quarters of 2009 and
the fi rst three quarters of 2010. In relative terms, remittances in 2010 were not at an
all-time low. Quarterly remittance outfl ows relative to the migrant population hovered
between €250 and €300 per capita until late 2005 (about €1,100 per year) as shown in
fi gure 20.3, experienced a strong increase during 2006 and early 2007, and declined
after that, fl uctuating once again between €250 and €300, at current prices, from the
fi rst quarter of 2009 on.
FIGURE 20.3 Outfl ows of Remittances per Quarter, Total and per Foreign-Born Person, 2000–10
2000 2001 2002 2003 2004 2005 2006 2007 2008 2009 2010
0
50
100
150
200
250
300
350
400
450
0
500
1,000
1,500
2,000
2,500
to
tal r
emit
tanc
es (€
, mill
ions
)
remittances
remittances/foreign-born population
Q1 Q3 Q1 Q3 Q1 Q3 Q1 Q3 Q1 Q3 Q1 Q3
rem
itta
nces
per
per
son
(€)
Q1 Q3 Q1 Q3 Q1 Q3 Q1 Q3 Q1 Q3
Source: Bank of Spain, Balance of Payments.
Remittance levels and trends diff er by country of destination.4 Bolivia, Colombia,
and Ecuador, the three main remittance-receiving countries, saw dramatic increases
before the crisis, with total remittances from Spain almost doubling from 2004 to 2007
in the cases of Colombia and Ecuador, and almost tripling in the case of Bolivia, as
shown in fi gure 20.4. Remittances to Morocco and Romania almost multiplied by two
as well. In 2007, remittances per migrant to Bolivia and Colombia amounted to over
€5,000, to Ecuador were close to €3,000, and to Romania were €1,200, and migrants
from Morocco sent just over €900. From 2007 to 2009, total remittance fl ows from
Spain declined by more than 25 percent in all cases but that of Colombia, which saw
remittances decline by only 9 percent during the period: from €1.43 billion in 2007
to €1.30 billion in 2009. Remittance fl ows to Morocco fell by over 40 percent, from
€528 million in 2007 to €299 million in 2009.
According to data from the Central Bank of Colombia, remittances to Colombia
from the United States, which declined by over 25 percent from 2008 to 2010, have
experienced a larger drop than those from Spain, which fell by 13 percent during the

260 l MARTA ROIG AND JOAQUÍN RECAÑO-VALVERDE
same period (BRC 2010). Whereas remittances from Spain increased by 17 percent
between the fi rst and third trimesters of 2010, those from the United States increased
by 2 percent during the same period.
What Explains Differences in Remittance Flows from Spain by Country of Destination?
Family Reunifi cation
Th e existing evidence shows that having a spouse and children outside the country
of residence strongly infl uences the amount remitted (for example, Bollard and oth-
ers 2009; Echazarra 2010). It is possible that, in response to the crisis, some groups
of migrants opted to bring their family to Spain and reduce the amount remitted to
their countries of origin. Th ere are practically no offi cial data on family reunifi cation,
because it is not a formal category among long-term residence permits. However,
sudden changes in the composition of migration fl ows by age and sex, as recorded
by the Continuous Population Register, may suggest a wave of family reunifi cation
(table 20.1).
Overall, the proportion of women in all migrant fl ows varies signifi cantly by group.
Women constitute 55 percent of all Latin American migrants who arrived during the
period 2004–09; on average, although a large majority of Moroccan migrants are men,
only 34 percent are women. Th e proportion of children is larger among Colombian and
Ecuadorian migrants than among the other two major migrant groups. However, the
crisis has not brought about signifi cant changes in the composition of migration fl ows
by sex or by age among these groups so far (from 2007 to 2009), suggesting that family
reunifi cation has not been a major response by migrants to the crisis.
FIGURE 20.4 Outfl ows of Remittances by Country of Destination, 2004–09€,
mill
ions
0
200
400
600
800
1,000
1,200
1,400
1,600
2004 2005 2006 2007 2008 2009
Morocco
Colombia
Bolivia
Romania
Ecuador
Dominican Republic
Source: Bank of Spain, Balance of Payments.

20. GLOBAL CRISIS AND MIGRATION TO AND REMITTANCE FLOWS FROM SPAIN l 261
It has also been suggested that the crisis actually triggered a return of family members
to their countries of origin, as a strategy to reduce household expenditure and diversify
risk (Lynch 2010). Th e reliability of data on migration outfl ows from Spain is question-
able, because migrants often do not de-register before leaving. Data on the migrant
stock by age show that, from 2008 to 2010, the number of children aged 0–14 declined
signifi cantly among Bolivian, Colombian, and Ecuadorian immigrants (by 21, 12, and
18 percent, respectively), while it continued to grow among Romanian and Moroccan
immigrants (by 4 and 7 percent, respectively). Th e fact that Latin American immigrants
sent dependents back home in larger numbers could explain why remittances to these
countries remained higher than those sent to Romania or Morocco during the crisis,
although it does not make clear why remittances to Colombia remained more stable
than those sent to Bolivia or Ecuador.
Proportion of Migrant Women
Research conducted before the crisis indicates that migrant women remit more than
migrant men, even though men constitute a majority of migrants as well as a major-
ity of remitters (Moré and others 2008). In 2006 migrant women sent €4.2 million to
their countries of origin, whereas migrant men remitted €2.6 million. Women remitted
TABLE 20.1 Proportion of Women and Children among Migrants Entering Spain by Country of Origin, 2004–09
Year Bolivia Colombia Ecuador Morocco Romania
Proportion of women
2004 55.9 53.6 49.6 31.3 46.6
2005 57.8 53.0 48.8 33.8 48.3
2006 55.5 53.4 48.1 36.1 47.9
2007 54.3 51.6 47.9 34.4 43.3
2008 53.8 51.4 47.7 35.6 47.3
2009 51.3 51.9 48.1 37.8 48.9
Proportion of children (0–14 years old)
2004 11.5 21.7 13.0 13.1 9.4
2005 15.6 21.2 24.4 13.7 11.7
2006 14.6 18.0 23.9 13.5 13.1
2007 11.1 17.3 25.8 12.4 11.8
2008 9.3 15.2 23.1 11.9 13.9
2009 9.9 16.4 20.0 12.0 11.1
Source: Authors’ calculations based on microdata from the population register (“Estadística de Variaciones Residenciales”) for 2004–09 (INE Population Register).

262 l MARTA ROIG AND JOAQUÍN RECAÑO-VALVERDE
smaller amounts but did so more often than men. Additional research has shown that
remittances sent by women from Spain to Colombia are more often delegated to health
and education expenses than those sent by men (UN-INSTRAW and IOM 2008). A
stronger presence of women among Latin American migrants may explain why Colom-
bians and Ecuadorians remit more than other groups, but it does not make clear why
remittances to Colombia have been more resilient to the crisis than those sent by all
other major Latin American groups.
Th e Cost of Sending Remittances
Th e cost of sending remittances may also have aff ected how much migrants remit-
ted before and during the crisis. In 2008 the average cost of sending remittances to
Morocco (8.4 percent for an average remittance of €135) was higher than that of remit-
ting to Colombia (6.8 percent), Ecuador (6.7 percent), or Romania (6.6 percent) (World
Bank 2010d). However, remittance fees to Morocco declined signifi cantly during the
crisis, to reach 5.8 percent in the third quarter of 2010, whereas the cost of remitting to
Colombia and Ecuador remained close to 6 percent. Yet the amount of remittances sent
to Morocco dropped signifi cantly whereas remittances to Colombia proved resilient to
the crisis.
Remittance costs are not uniform across the country. Madrid, which is home to 50 of
the 61 money-transfer companies registered in Spain, off ers the lowest remitting costs
in the country and, more generally, in Europe (Remesas 2009). Lower costs and bet-
ter access to money-transfer agencies make it easier for immigrants in Madrid to remit
regularly and more often than those living in other parts of Spain. A survey based on
a sample of 1,071 foreign-born persons and 20 money-transfer agencies suggests that
remittance fl ows from Madrid, which declined by 5.4 percent from 2008 to 2009, were
more resilient at the onset of the crisis than those sent from the rest of Spain: On average,
remittance outfl ows from Spain declined by 9.5 percent during the same period (Comu-
nidad de Madrid 2010). In January 2010, 33 percent of Ecuadorian immigrants living in
Spain resided in Madrid; so did about 25 percent of Bolivian, Colombian, and Roma-
nian immigrants but only 12 percent of Moroccans. Th us, place of residence may have
contributed to a lower propensity to remit among Moroccan migrants, but it does not
explain why remittances sent by Colombian immigrants have been the most resilient.
Th e Colombian peso lost less value than other currencies during the fi rst two years
of the crisis. According to data by the Bank of Spain and the IMF on monthly exchange
rates of the euro to selected currencies, the Colombian peso appreciated by 6 percent,
on average, between 2007 and 2009, the Ecuadorian dollar appreciated by 1 percent,
whereas the Bolivian boliviano depreciated by 9 percent, and the exchange rate of the
Moroccan dirham remained practically constant (Bank of Spain 2011b). In addition,
fl uctuations in the exchange rate of the Colombian peso against the euro were less sig-
nifi cant than those suff ered by the boliviano or the dollar. Th is may have contributed
to the stability of remittance fl ows to Colombia and may also make an eventual return

20. GLOBAL CRISIS AND MIGRATION TO AND REMITTANCE FLOWS FROM SPAIN l 263
to the home country more attractive. However, the Colombian peso depreciated by
16 percent against the euro from 2009 to 2010. Th e impact of this shock on remittance
fl ows during 2010 remains to be seen.
Immigrants and the Labor Market
Some groups of migrants fared better than others in the labor market once the crisis
hit. Unemployment has generally been higher among foreigners than among nationals,
and the crisis has heightened the diff erences between groups. As shown in fi gure 20.5,
although the unemployment rate increased from 7.6 percent in 2007 to 18.0 percent
in 2010 among Spanish workers, it grew from 11.5 percent to 33.9 percent among for-
eigners during the same period.5 Th e record-high unemployment rate observed among
Moroccans (close to 50 percent in 2010) may explain why remittances to Morocco have
declined faster than those sent by other groups. However, it does not explain why remit-
tances to Colombia have been more stable, because unemployment levels and trends
among Colombians are comparable to those observed among other major migrant
groups.
FIGURE 20.5 Unemployment by Nationality, 2001–10
Morocco
Colombia foreigners (total)
RomaniaEcuador
0
10
20
30
40
50
2001 2002 2003 2004 2005 2006 2007 2008 2009 2010
per
cent
Spanish nationals
Source: Authors’ calculations based on microdata from the Labour Force Surveys (“Encuesta de Población Activa”) for 2001–10. Microdata available at http://www.ine.es/prodyser/micro_epa.htm.
It has been suggested that participation in the informal economy is keeping migrants
afl oat (for example, CCOO 2009). Th e size of the informal economy was estimated at
23 percent of Spain’s gross domestic product in 2008, and migrants are overrepresented

264 l MARTA ROIG AND JOAQUÍN RECAÑO-VALVERDE
in the largest informal sectors, namely, construction and services. Could some groups
of migrants have fared better than others in the informal economy during the crisis?
Survey data on employment trends in the formal and informal sectors combined show
that total employment fell the most in the construction sector (by 24 percent from the
fourth quarter of 2008 to mid-2009 alone, and by 14 percent from mid-2009 to mid-
2010) and signifi cantly in the industrial sector, while it kept growing in the services sec-
tor for most of the period, declining by only 5 percent from late 2008 to mid-2009, and
in agriculture.6 Information on the distribution of foreigners by sector of the economy
and occupation indicates that the share of migrants in the services sector is signifi -
cantly higher among Latin Americans than among all other migrant groups: two-thirds
of Latin American migrants, including close to 90 percent of Latin American women,
worked in personal services, catering, security, and sales, on average, in 2005–10, with
a high percentage of them in domestic services. Th e proportion of all other non-EU
migrants working in services was 40 percent, on average, during the same period.7
According to recent labor market trends, migrant employment is recovering. During
the second and third trimesters of 2010, immigrants gained more jobs (109,000) than
natives (42,000), even though they constitute 17 percent of the labor force. Employ-
ment grew by 10 percent in the construction sector among migrants (while it declined
for natives) and by 4 percent in services. Based on these trends, remittances should
continue growing in the last quarter of 2010 and during 2011, although it is too soon to
determine whether the recovery will be long lasting.
Conclusion
In conclusion, the infl ow of migrants to Spain started to decline before the onset of the
economic crisis. Political and policy changes—the entry of Romania into the European
Union in January 2007 and the requirement of an entry visa for Bolivians starting in
April 2007—are the main causes of the strong decline in immigration observed in 2007.
Migration fl ows continued to decline, although at a slower pace, during the initial years
of the crisis.
Th e propensity to remit is higher among Latin American migrants from the coun-
tries selected than among Moroccans or Romanians. In addition, remittances to Latin
America, particularly Colombia, have also been more resilient to the recent economic
shock. Th e impact of the crisis on various currencies and diff erences in unemployment
trends among each group partly explain the diff erent responses to the crisis observed
in remittance fl ows to the countries selected. But other mechanisms may be at play.
Although the higher participation of Latin American migrants in services jobs that have
been less aff ected by the crisis may have kept these migrants afl oat, even if they have
subsisted mainly in the informal economy, we cannot discard the infl uence of diff er-
ent behaviors in the response of migrants to the crisis. It is possible, for instance, that
remittances sent by women, who represent a majority of Latin American migrants, are
more resilient than those sent by men. It is also possible that some groups of migrants,
20. GLOBAL CRISIS AND MIGRATION TO AND REMITTANCE FLOWS FROM SPAIN l 265
Colombians in particular, may have sent their children back home and continued to
send remittances despite increasing economic hardship in preparation for an eventual
return. All in all, this initial overview based on aggregate-level data suggests the pro-
pensity of migrants to remit is not determined by macroeconomic factors only.
Notes
1. Equivalent to approximately $12.5 billion using end of 2007 nominal exchange rates. Th e
World Bank estimates that outfl ows of remittances were higher, over $15 billion, in 2007 (see
http://www.worldbank.org/prospects/migrationandremittances).
2. Data on remittance fl ows to the European Union (EU 15) are available only for the period
2005–07. In 2007, remittances to the EU 15 constituted only 9.4 percent of all remittances
from Spain. Remittances to the United Kingdom (the main country of origin among the EU
15) were only 1.6 percent of the total.
3. Th e new procedure is called arraigo, which can be translated as being well established or
having roots in the place of residence.
4. Th e Bank of Spain does not provide quarterly data on remittances by country of destination.
Th e overview that follows is based on total annual fl ows.
5. Th e information provided by the Economically Active Population Survey (Encuesta de
Población Activa) is available only by country of citizenship of workers in the sample.
6. Manpower, “El mercado de trabajo en los trimestres centrales de 2010 y el impacto de la cri-
sis en las CCAA,” Indice Laboral Manpower, No. 37, December 2010. Th e analysis is based
on data from the Economically Active Population Survey.
7. Information on the distribution of foreigners by sector of the economy and occupation is
available only by major regional group (Latin America and the Caribbean, European Union,
other European countries, and rest of the world).

266 l MARTA ROIG AND JOAQUÍN RECAÑO-VALVERDE
Annex
A: Total Infl ow of Foreign-Born Persons, 2004–10
tho
usan
ds
100
150
200
250
300
Q1 Q2 Q3 Q4 Q1 Q2 Q3 Q4 Q1 Q2 Q3 Q4 Q1 Q2 Q3 Q4 Q1 Q2 Q3 Q4 Q1 Q2 Q3 Q4 Q1 Q2 Q3
2004 2005 2006 2007 2008 2009 2010
Source: INE, Microdata of Estadística de Variaciones Residenciales (2004–09), data available at http://www.ine.es/prodyser/micro_varires.htm. Authors’ calculations. For 2010, fl ows based on population estimates by the National Statistics Institute, data available at http://www.ine.es/jaxi/menu.do?type=pcaxis&path=%2Ft20%2Fp259&fi le=inebase&L=.
B: Foreign Population by Country of Birth, Total Population and
Percentage of Men, on January 1, 2010
Country of birth Total % male
TOTAL 5,747,734 52.50
Europe 2,679,456 52.00
European Union 2,459,180 52.70
Austria 9,450 48.30
Belgium 33,282 51.20
Bulgaria 161,599 53.90
Czech Republic 9,067 43.90
Cyprus 258 59.70
Denmark 12,021 51.40
Estonia 1,409 39.90
Finland 12,255 45.20
France 103,574 50.60
Germany 178,402 49.90
Greece 3,917 64.30
Hungary 8,253 48.40
Ireland 16,180 52.40
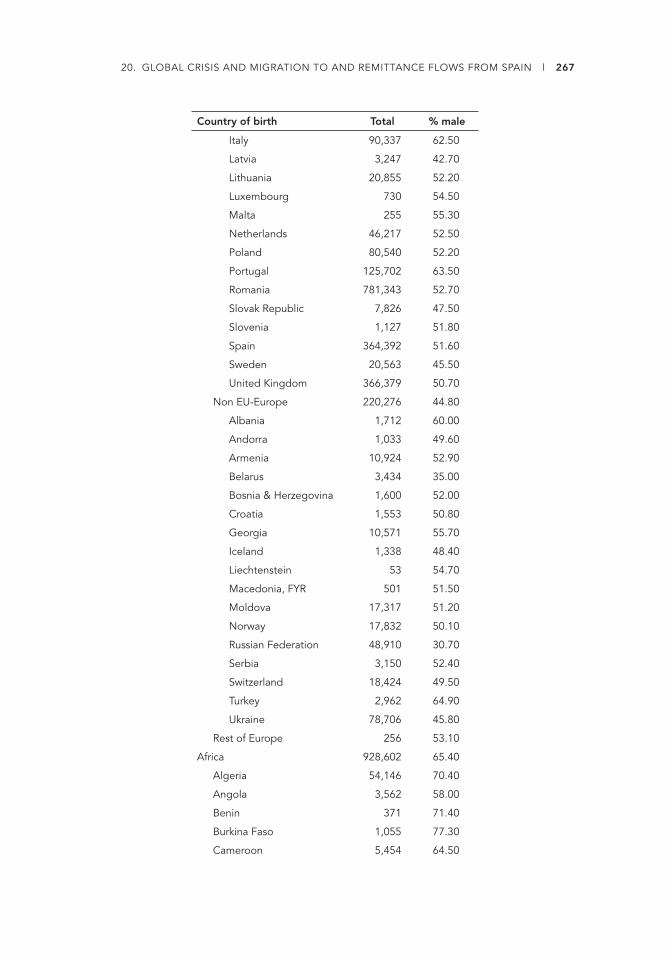
20. GLOBAL CRISIS AND MIGRATION TO AND REMITTANCE FLOWS FROM SPAIN l 267
Country of birth Total % male
Italy 90,337 62.50
Latvia 3,247 42.70
Lithuania 20,855 52.20
Luxembourg 730 54.50
Malta 255 55.30
Netherlands 46,217 52.50
Poland 80,540 52.20
Portugal 125,702 63.50
Romania 781,343 52.70
Slovak Republic 7,826 47.50
Slovenia 1,127 51.80
Spain 364,392 51.60
Sweden 20,563 45.50
United Kingdom 366,379 50.70
Non EU-Europe 220,276 44.80
Albania 1,712 60.00
Andorra 1,033 49.60
Armenia 10,924 52.90
Belarus 3,434 35.00
Bosnia & Herzegovina 1,600 52.00
Croatia 1,553 50.80
Georgia 10,571 55.70
Iceland 1,338 48.40
Liechtenstein 53 54.70
Macedonia, FYR 501 51.50
Moldova 17,317 51.20
Norway 17,832 50.10
Russian Federation 48,910 30.70
Serbia 3,150 52.40
Switzerland 18,424 49.50
Turkey 2,962 64.90
Ukraine 78,706 45.80
Rest of Europe 256 53.10
Africa 928,602 65.40
Algeria 54,146 70.40
Angola 3,562 58.00
Benin 371 71.40
Burkina Faso 1,055 77.30
Cameroon 5,454 64.50
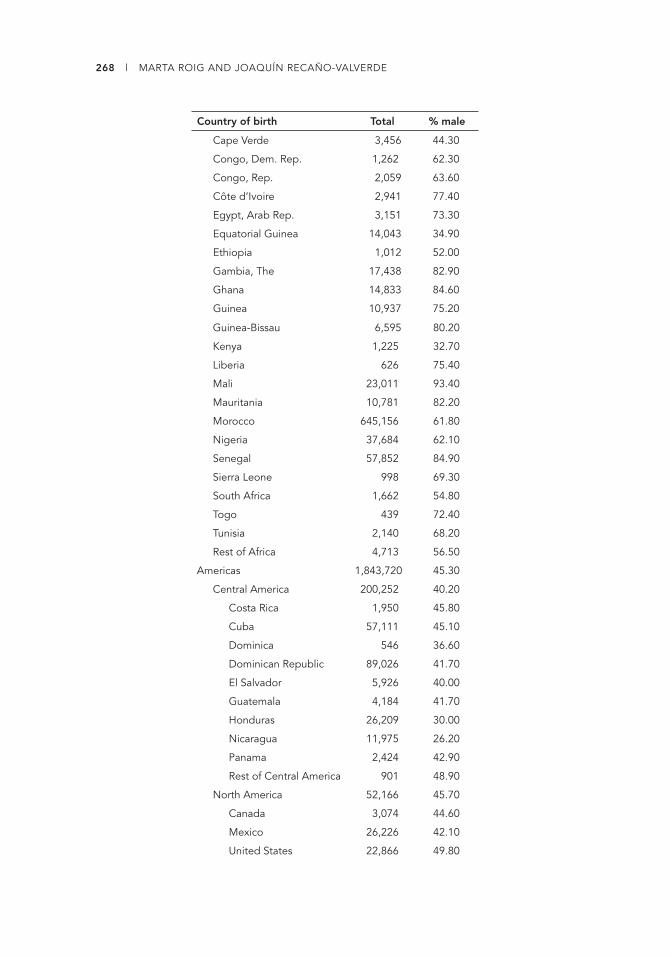
268 l MARTA ROIG AND JOAQUÍN RECAÑO-VALVERDE
Country of birth Total % male
Cape Verde 3,456 44.30
Congo, Dem. Rep. 1,262 62.30
Congo, Rep. 2,059 63.60
Côte d’Ivoire 2,941 77.40
Egypt, Arab Rep. 3,151 73.30
Equatorial Guinea 14,043 34.90
Ethiopia 1,012 52.00
Gambia, The 17,438 82.90
Ghana 14,833 84.60
Guinea 10,937 75.20
Guinea-Bissau 6,595 80.20
Kenya 1,225 32.70
Liberia 626 75.40
Mali 23,011 93.40
Mauritania 10,781 82.20
Morocco 645,156 61.80
Nigeria 37,684 62.10
Senegal 57,852 84.90
Sierra Leone 998 69.30
South Africa 1,662 54.80
Togo 439 72.40
Tunisia 2,140 68.20
Rest of Africa 4,713 56.50
Americas 1,843,720 45.30
Central America 200,252 40.20
Costa Rica 1,950 45.80
Cuba 57,111 45.10
Dominica 546 36.60
Dominican Republic 89,026 41.70
El Salvador 5,926 40.00
Guatemala 4,184 41.70
Honduras 26,209 30.00
Nicaragua 11,975 26.20
Panama 2,424 42.90
Rest of Central America 901 48.90
North America 52,166 45.70
Canada 3,074 44.60
Mexico 26,226 42.10
United States 22,866 49.80

20. GLOBAL CRISIS AND MIGRATION TO AND REMITTANCE FLOWS FROM SPAIN l 269
Source: Population register. Data available at http://www.ine.es/jaxi/menu.do?type=pcaxis&path=%2Ft20%2Fe245&fi le=inebase&L=.
South America 1,591,302 45.90
Argentina 187,104 51.50
Bolivia 206,635 42.40
Brazil 121,287 38.20
Chile 47,316 49.70
Colombia 292,212 44.50
Ecuador 387,367 49.40
Paraguay 84,323 32.70
Peru 141,309 49.20
Uruguay 59,020 50.60
Venezuela, R. B. de 64,443 43.10
Rest of South America 286 43.40
Asia 292,786 61.30
Bangladesh 10,434 81.30
China 137,020 53.80
India 31,692 72.30
Indonesia 1,918 57.40
Iran, Islamic Rep. 3,514 61.30
Iraq 1,195 62.80
Israel 1,983 61.30
Japan 5,120 38.30
Jordan 887 67.60
Kazakhstan 969 39.70
Korea, Rep. 2,781 43.20
Lebanon 1,616 62.00
Nepal 2,454 80.00
Pakistan 54,834 85.80
Philippines 26,402 38.60
Saudi Arabia 369 60.20
Syrian Arab Republic 2,373 63.80
Thailand 1,439 22.40
Vietnam 703 53.30
Rest of Asia 5,083 49.60
Pacifi c Islands 3,170 53.40
Australia 2,189 51.50
New Zealand 795 57.90
Country of birth Total % male


PART V


273
Chapter 21
Forecasting Turkish Workers’ Remittances from Germany during the Financial Crisis
ŞULE AKKOYUNLU
The financial crisis has had a noticeable impact on remittance flows to
developing countries. Remittances to developing countries fell to $307 billion in
2009, which is a 5.5 percent decline from 2008.1 However, the impact of the financial
crisis on other financial flows was even more noticeable; for example, foreign direct
investments (FDIs) and private debt and portfolio equity flows declined by 40 and
80 percent, respectively.2 The situation for Turkey was not so different from that of
other developing countries. Remittances to Turkey decreased from $1.4 billion in
2008 to $0.93 billion in 2009, FDIs in Turkey decreased from $15.7 billion in 2008
to $6.9 billion in 2009, and overseas development aid decreased from $2.02 bil-
lion in 2008 to $0.05 billion in 2009. Only portfolio investments increased from
−$5.1 billion in 2008 to $0.20 billion in 2009. Turkish workers’ remittances have
been an important source of foreign exchange flows to Turkey, especially in the
early 1970s. Figure 21.1 shows the ratio of total Turkish workers’ remittances to
current account inflows.3 Although following the trade liberalization in the early
1980s the role of exports of goods and services has become a more dominant source
for foreign exchange flows, Turkish workers’ remittances are still a stable source of
foreign exchange flows to Turkey.
Developing countries depend heavily on foreign capital fl ows for economic devel-
opment and infrastructure, because domestic capital in these countries is scarce.
Understanding the determinants and future trends of these capital fl ows to developing
countries, especially during and/or after the economic crisis, is essential for economic
stability and economic development as well as for economic policy analysis.4
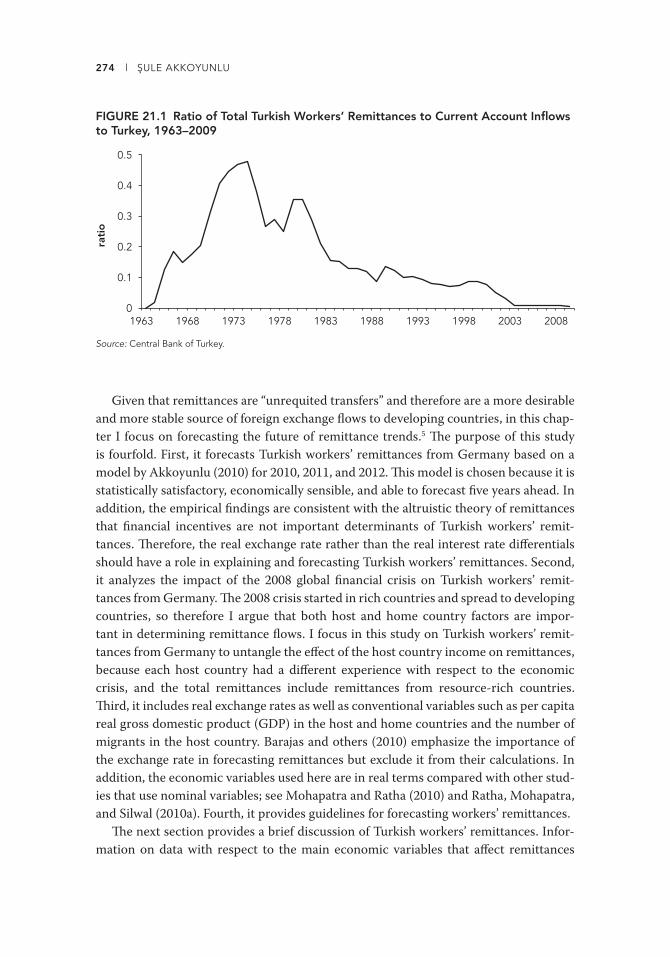
274 l SULE AKKOYUNLU
FIGURE 21.1 Ratio of Total Turkish Workers’ Remittances to Current Account Infl ows to Turkey, 1963–2009
rati
o
0
0.1
0.2
0.3
0.4
0.5
1963 1968 1973 1978 1983 1988 1993 1998 2003 2008
Source: Central Bank of Turkey.
Given that remittances are “unrequited transfers” and therefore are a more desirable
and more stable source of foreign exchange fl ows to developing countries, in this chap-
ter I focus on forecasting the future of remittance trends.5 Th e purpose of this study
is fourfold. First, it forecasts Turkish workers’ remittances from Germany based on a
model by Akkoyunlu (2010) for 2010, 2011, and 2012. Th is model is chosen because it is
statistically satisfactory, economically sensible, and able to forecast fi ve years ahead. In
addition, the empirical fi ndings are consistent with the altruistic theory of remittances
that fi nancial incentives are not important determinants of Turkish workers’ remit-
tances. Th erefore, the real exchange rate rather than the real interest rate diff erentials
should have a role in explaining and forecasting Turkish workers’ remittances. Second,
it analyzes the impact of the 2008 global fi nancial crisis on Turkish workers’ remit-
tances from Germany. Th e 2008 crisis started in rich countries and spread to developing
countries, so therefore I argue that both host and home country factors are impor-
tant in determining remittance fl ows. I focus in this study on Turkish workers’ remit-
tances from Germany to untangle the eff ect of the host country income on remittances,
because each host country had a diff erent experience with respect to the economic
crisis, and the total remittances include remittances from resource-rich countries.
Th ird, it includes real exchange rates as well as conventional variables such as per capita
real gross domestic product (GDP) in the host and home countries and the number of
migrants in the host country. Barajas and others (2010) emphasize the importance of
the exchange rate in forecasting remittances but exclude it from their calculations. In
addition, the economic variables used here are in real terms compared with other stud-
ies that use nominal variables; see Mohapatra and Ratha (2010) and Ratha, Mohapatra,
and Silwal (2010a). Fourth, it provides guidelines for forecasting workers’ remittances.
Th e next section provides a brief discussion of Turkish workers’ remittances. Infor-
mation on data with respect to the main economic variables that aff ect remittances

21. TURKISH WORKERS’ REMITTANCES FROM GERMANY DURING THE CRISIS l 275
is illustrated in the fi gures. Section 3 discusses the determinants of Turkish workers’
remittances from Germany based on Akkoyunlu (2010). Section 4 describes the meth-
odology for forecasting remittances and discusses the results. Section 5 concludes.
Turkish Remittances and the Financial Crisis
Turkish workers’ remittances to Turkey constitute important fi nancial fl ows (fi g-
ure 21.2a). Although total Turkish workers’ remittances saw an increasing trend from
the beginning of the sample and were little aff ected by the economic crises in Turkey
in the early 1970s and 1980s and in 1994, the impact of the 2001 Turkish banking crisis
on Turkish workers’ remittances is very clear.6 Despite the recovery of the remittances
in 2003, it is evident that the remittances decreased in 2008 because of the 2008 global
fi nancial crisis. Th us, Turkish workers’ remittances were aff ected by the home country
conditions as well as the global economic circumstances or the economic conditions in
the host countries.
Remittances by Turkish workers in Germany constitute an important share of the
total remitted by Turkish workers abroad (fi gure 21.2) because of the fact that the larg-
est share (2 million emigrants) of Turks abroad is in Germany, and the majority of them
emigrated for employment reasons. In addition, Turkish workers’ remittances from
Germany, at €1 billion per year, seem to be more stable in the last fi ve years than the
total Turkish workers’ remittances, including the 2008 fi nancial crisis.
FIGURE 21.2 Turkish Workers’ Remittances Total and from Germany, 1963–2009
a. Remittances in dollars
b. Remittances from Germany, in euros
total
from Germany0123456
1963 1968 1973 1978 1983 1988 1993 1998 2003 2008
0
0.5
1.0
1.5
2.0
1963 1968 1973 1978 1983 1988 1993 1998 2003 2008
$, b
illio
ns€,
bill
ions
Sources: Central Bank of Turkey and Deutsche Bundesbank.

276 l SULE AKKOYUNLU
Figure 21.3 shows data on Turkish workers’ remittances only from Germany, total
FDI, total offi cial aid to Turkey, and portfolio equity in Turkey.7 Turkish remittances are
very stable and an important source of foreign reserves compared with FDI, portfolio
equity, and offi cial aid.
FIGURE 21.3 Turkish Workers’ Remittances from Germany and Other Financial Flows to Turkey, 1963–2009
a. Remittances from Germany
d. Portfolio investment in Turkey
$, b
illio
ns
00.51.01.52.02.5
1968 1978 1988 1998 2008 05
10152025
1968 1978 1988 1998 2008
$, b
illio
ns
−10−5
05
1015
1968 1978 1988 1998 2008 $, b
illio
ns
c. Total official aid to Turkey
b. Total FDI to Turkey
1968 1978 1988 1998 2008
$, b
illio
ns
00.51.01.52.02.5
Sources: Central Bank of Turkey, Deutsche Bundesbank, and World Bank Development Indicators.
Table 21.1 shows the important eff ects of the 2008 fi nancial crisis on capital fl ows to
Turkey. Indeed, almost all the fi nancial fl ows to Turkey were aff ected by the global crisis.
Th e 2008 crisis started in developed countries and spread to developing countries,
and therefore it is important to understand how the developed country, in this case
Germany, was aff ected by the 2008 economic crisis and how this in turn aff ected remit-
tances by Turkish workers. Figure 21.4 shows the per capita real GDP growth and
unemployment rate for Germany, which were negatively aff ected by the crisis. Th e per
capita real GDP growth was negative, and the German unemployment rate was high
in 2009. It is expected that remittances will decrease as the income and employment
opportunities decline in the host country.8
Turkish real GDP per capita growth was negative in 2008 but recovered in 2009; how-
ever, the Turkish unemployment rate continued to increase following the 2008 fi nancial
crisis (fi gure 21.4). If Turkish workers are altruistic, then the increase in Turkish eco-
nomic growth should decrease remittances, and this was the case in Turkey. However,
if they had investment motives, the remittances would have increased. In addition the
data on the diff erence between Turkish and German real short-term interest rates show

21. TURKISH WORKERS’ REMITTANCES FROM GERMANY DURING THE CRISIS l 277
TABLE 21.1 Capital Transactions, 2008–10
$, billions
Capital transaction 2008 2009 2010
Current account balance −41.9 −14.4 −33.6
Capital account (excluding reserves) 35.2 9.9 44.4
Direct investments (net) 15.7 6.9 5.7
Portfolio investments (net) −5.1 0.2 12.4
Other investments (net) 24.6 2.8 26.3
Capital fl ows by use 19.5 3.0 38.7
Public −2.9 −0.2 12.6
Private 22.4 3.2 26.0
Direct investments (net) 15.7 6.9 5.7
Workers’ remittances 1.41 0.93 0.96
Overseas development aid 2.02 0.05 —
Reserves 1.1 −0.1 −10.8
Net errors and omissions 5.6 4.6 0.1
Direct investments (net)/current account balance −37.5 −47.8 −16.9
Net errors and omissions/current account balance −13.4 −32.2 −0.2
Sources: Turkish Central Bank and World Bank.
Note: 2010 reports data until August 2010. — = not available.
FIGURE 21.4 Growth Rates of Real per Capita GDP and Unemployment for Germany and Turkey
d. Turkish unemployment ratec. German unemployment rate
per
cent
02468
101214
1968 1978 1988 1998 20080
2
4
6
8
10
12
1968 1978 1988 1998 2008
per
cent
a. German real per capita growth
−0.10−0.08−0.06−0.04−0.02
00.020.040.060.08
1968 1978 1988 1998 2008
per
cent
b. Turkish real per capita growth
−0.12−0.10−0.08−0.06−0.04−0.02
00.020.040.060.080.10
1968 1978 1988 1998 2008
per
cent
Source: German Federal Statistical Offi ce and Turkish Statistical Institute.

278 l SULE AKKOYUNLU
no correlation between Turkish remittances from Germany (fi gure 21.5). Th ese data
further support the empirical fi ndings of Akkoyunlu (2010) that Turkish workers are
driven largely by altruistic motives.
FIGURE 21.5 Turkish and German Real Short-Term Interest Rates, Their Differences, and Turkish Workers’ Remittances from Germany, 1963–2009
d. Remittances from Germany
0
0.5
1.0
1.5
2.0
1968 1978 1988 1998 2008
€, b
illio
ns
a. German real short-term interest rates
per
cent
−3−2−1
01234567
1968 1978 1988 1998 2008
b. Turkish real short-term interest rates
per
cent
−100−80−60−40−20
02040
1968 1978 1988 1998 2008
per
cent
−100−80−60−40−20
02040
1968 1978 1988 1998 2008
c. Difference in real short-term interest rates
Source: Deutsche Bundesbank and Central Bank of Turkey.
Remittances rates are aff ected when Turkish workers have lost jobs because of the
economic crisis. However, the data on the employment of Turkish workers in Germany
show that total employment of Turkish workers in Germany and their employment by
sectors were not aff ected by the 2008 fi nancial crisis (fi gures 21.6 and 21.7).9 Th is can be
explained by the fi ndings of Akkoyunlu and Vogel (2008) that the transition of industrial
employment of Turkish migrants took place before the 2008 fi nancial crisis. In addition,
if immigrant households that receive social security or unemployment insurance are
more likely to remit than other immigrant households, then the high unemployment
rate for Turkish workers should not interrupt remittance rates.10
In addition, fi gure 21.8 shows that the unemployment of Turks in Germany did not
change during this period. Th e most important insight comes from the data on the fl ow
of the Turkish population and from Germany. Figure 21.9 shows that return migration
increased as a result of the economic crisis,11 and the net fl ows as well as the stock of
Turkish population in Germany decreased.
Th e Turkish population is an important determinant of remittances; even though the
economic crisis aff ected both sending and receiving countries negatively, the constant

21. TURKISH WORKERS’ REMITTANCES FROM GERMANY DURING THE CRISIS l 279
FIGURE 21.6 Total and Turkish Employment in Germany, 1991–2009
total employment
Turkish employment
per
cent
0
10
20
30
40
50
60
1991 1993 1995 1997 1999 2001 2003 2005 2007 2009
Source: German Employment Agency (Bundesagentur für Arbeit).
FIGURE 21.7 Turkish Employment in Germany by Sector, 1987–2009
per
cent
0
10
20
30
40
50
60
70
1987 1989 1991 1993 1995 1997 1999 2001 2003 2005 2007 2009
agriculture
manufacturing
construction
trade
services
Source: German Employment Agency (Bundesagentur für Arbeit).
Note: Trade data consists of “Trade and repair of motor vehicles, motorcycles, and personal and household goods.” Services include “Hotels and restaurants; real estate, renting, and business activities; and health and social work.”
FIGURE 21.8 Total and Turkish Unemployment in Germany, 1998–2009
per
cent
total unemployment
Turkish unemployment
0
2
4
6
8
10
12
1998 2000 2002 2004 2006 2008
Source: German Employment Agency (Bundesagentur für Arbeit).
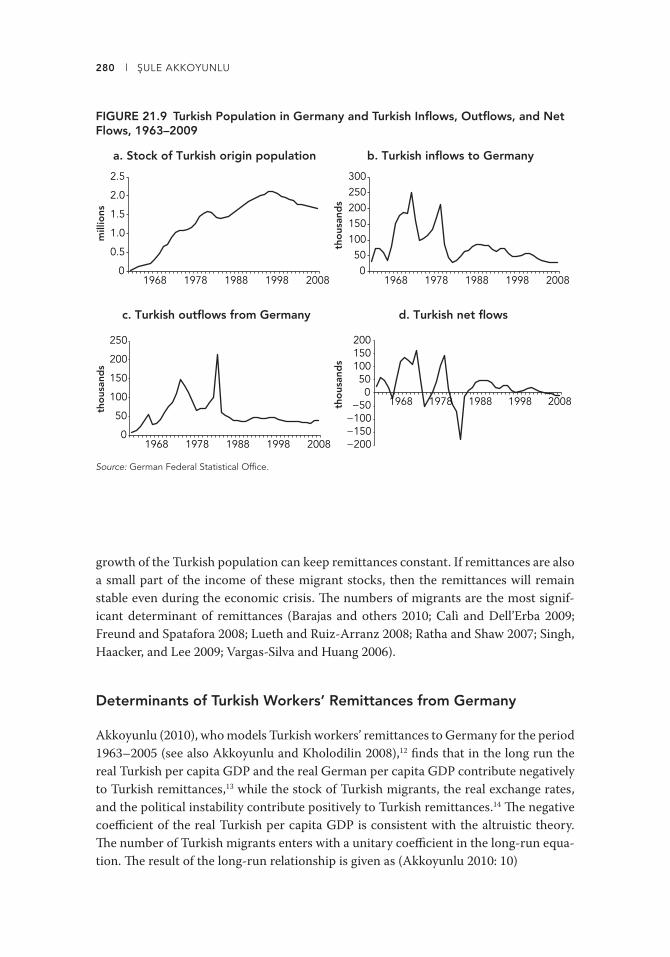
280 l SULE AKKOYUNLU
growth of the Turkish population can keep remittances constant. If remittances are also
a small part of the income of these migrant stocks, then the remittances will remain
stable even during the economic crisis. Th e numbers of migrants are the most signif-
icant determinant of remittances (Barajas and others 2010; Calì and Dell’Erba 2009;
Freund and Spatafora 2008; Lueth and Ruiz-Arranz 2008; Ratha and Shaw 2007; Singh,
Haacker, and Lee 2009; Vargas-Silva and Huang 2006).
Determinants of Turkish Workers’ Remittances from Germany
Akkoyunlu (2010), who models Turkish workers’ remittances to Germany for the period
1963–2005 (see also Akkoyunlu and Kholodilin 2008),12 fi nds that in the long run the
real Turkish per capita GDP and the real German per capita GDP contribute negatively
to Turkish remittances,13 while the stock of Turkish migrants, the real exchange rates,
and the political instability contribute positively to Turkish remittances.14 Th e negative
coeffi cient of the real Turkish per capita GDP is consistent with the altruistic theory.
Th e number of Turkish migrants enters with a unitary coeffi cient in the long-run equa-
tion. Th e result of the long-run relationship is given as (Akkoyunlu 2010: 10)
FIGURE 21.9 Turkish Population in Germany and Turkish Infl ows, Outfl ows, and Net Flows, 1963–2009
a. Stock of Turkish origin population b. Turkish inflows to Germany
c. Turkish outflows from Germany
tho
usan
ds
050
100150200250300
1968 1978 1988 1998 2008
tho
usan
ds
0
50
100
150
200
250
1968 1978 1988 1998 2008
mill
ions
0
0.5
1.0
1.5
2.0
2.5
1968 1978 1988 1998 2008
d. Turkish net flows
tho
usan
ds
−200−150−100−50
50100150200
1968 1978 1988 1998 2008 0
Source: German Federal Statistical Offi ce.

21. TURKISH WORKERS’ REMITTANCES FROM GERMANY DURING THE CRISIS l 281
ln Rt/Y
ht = 39.156 − 2.608 ln pcY
ht − 4.046 ln pcY
ft + 1.495 ln S
t
(21.1)(SE) (3.595) (0.521) (0.765) (0.094)
+ 0.448 ln et + 0.127 P
t(SE) (0.235) (0.063).
In the short run German GDP has a positive impact on remittances, and the sum
of coeffi cients on the home and host countries’ income is equal to one, which is con-
sistent with the altruistic theory (see equation [21.2]). Th e altruistic theory implies
that an increase in a migrant’s income by €1, coupled with a €1 drop in the income
of the migrant’s family left behind, raises the amount transferred by exactly €1. Th e
unit coeffi cient of the stock of Turkish migrants is also confi rmed by the econometric
analysis. Th e negative coeffi cient of Turkish income with a positive coeffi cient of the
real exchange rate further supports the altruistic theory.15 Th e coeffi cient of the real
exchange rate, which is larger than one, indicates that real depreciation leads to higher
remittances even when the remittances are expressed in terms of the host country’s
good (Faini 1994). Furthermore, consistent with the logic of transnational migration
theory, the positive long-run as well as short-run impact of political instability suggests
that Turkish migrants are altruistic. Th us, Turkish migrants respond positively to politi-
cal and economic changes in their home country.
Δln Rt/Y
ht
= −0.033 − 1.346 Δln pcYft
+ 2.083 Δln pcYft
+ 1.131 Δln St
(21.2)
(SE) (0.031) (0.433) (0.734) (0.087)
[t] [−1.07] [−3.11] [2.82] [13.00]
+ 1.022 Δln et + 0.076 P
t − 0.569 ecm
t−1(SE) (0.151) (0.034) (0.071)
[t] [6.75] [2.21] [−8.06],
R2 = 0.909, F(6,36) = 60.08 [0.00], ^σ = 0.103, DW = 1.77,
RSS = 0.3849 for 7 variables and 43 observations,
Far
(2,34) = 0.448 [0.64], Farch
(1,34) = 2.134 [0.15],
χ2
nd (2)= 0.32 [0.85], F
hetero (11,24) = 0.22 [0.99],
Freset
(1,35) = 0.36 [0.55], T = 43 (1963-2005).
Th e present forecasting exercise of Turkish workers’ remittances from Germany for
2010, 2011, and 2012 will be based on this long- and short-run relationship.
Forecasting Turkish Workers’ Remittances from Germany
Th e importance of remittances in poverty reduction, economic development, and
economic growth in developing countries has raised serious concerns about the likely
eff ects of the recent fi nancial crisis on future remittance fl ows to developing countries,
and several studies attempt to forecast remittance fl ows. Calì and Dell’Erba (2009)
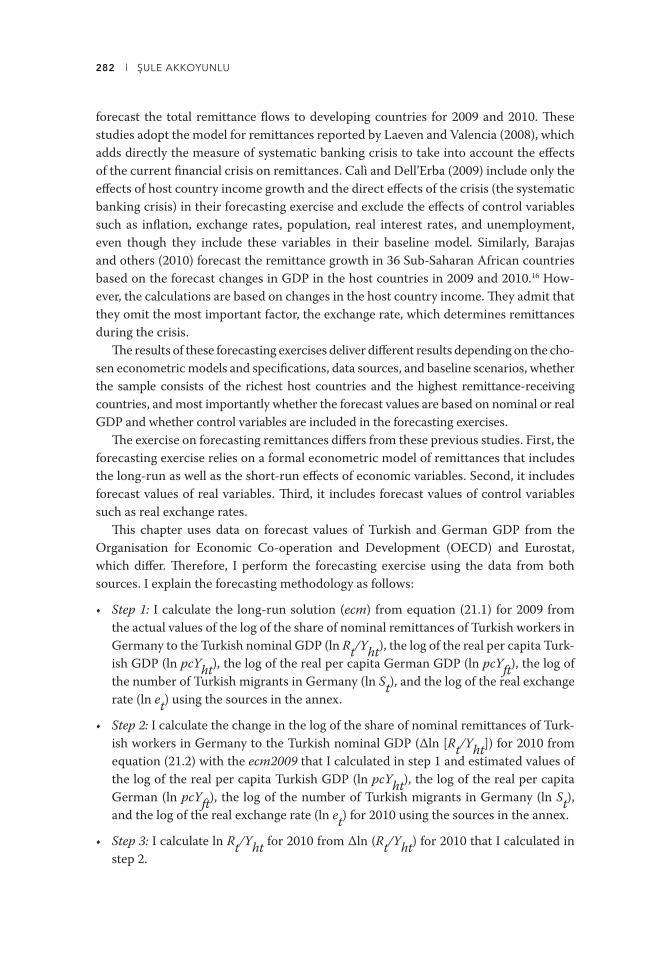
282 l SULE AKKOYUNLU
forecast the total remittance fl ows to developing countries for 2009 and 2010. Th ese
studies adopt the model for remittances reported by Laeven and Valencia (2008), which
adds directly the measure of systematic banking crisis to take into account the eff ects
of the current fi nancial crisis on remittances. Calì and Dell’Erba (2009) include only the
eff ects of host country income growth and the direct eff ects of the crisis (the systematic
banking crisis) in their forecasting exercise and exclude the eff ects of control variables
such as infl ation, exchange rates, population, real interest rates, and unemployment,
even though they include these variables in their baseline model. Similarly, Barajas
and others (2010) forecast the remittance growth in 36 Sub-Saharan African countries
based on the forecast changes in GDP in the host countries in 2009 and 2010.16 How-
ever, the calculations are based on changes in the host country income. Th ey admit that
they omit the most important factor, the exchange rate, which determines remittances
during the crisis.
Th e results of these forecasting exercises deliver diff erent results depending on the cho-
sen econometric models and specifi cations, data sources, and baseline scenarios, whether
the sample consists of the richest host countries and the highest remittance-receiving
countries, and most importantly whether the forecast values are based on nominal or real
GDP and whether control variables are included in the forecasting exercises.
Th e exercise on forecasting remittances diff ers from these previous studies. First, the
forecasting exercise relies on a formal econometric model of remittances that includes
the long-run as well as the short-run eff ects of economic variables. Second, it includes
forecast values of real variables. Th ird, it includes forecast values of control variables
such as real exchange rates.
Th is chapter uses data on forecast values of Turkish and German GDP from the
Organisation for Economic Co-operation and Development (OECD) and Eurostat,
which diff er. Th erefore, I perform the forecasting exercise using the data from both
sources. I explain the forecasting methodology as follows:
• Step 1: I calculate the long-run solution (ecm) from equation (21.1) for 2009 from
the actual values of the log of the share of nominal remittances of Turkish workers in
Germany to the Turkish nominal GDP (ln Rt/Y
ht), the log of the real per capita Turk-
ish GDP (ln pcYht
), the log of the real per capita German GDP (ln pcYft
), the log of
the number of Turkish migrants in Germany (ln St), and the log of the real exchange
rate (ln et) using the sources in the annex.
• Step 2: I calculate the change in the log of the share of nominal remittances of Turk-
ish workers in Germany to the Turkish nominal GDP (Δln [Rt/Y
ht]) for 2010 from
equation (21.2) with the ecm2009 that I calculated in step 1 and estimated values of
the log of the real per capita Turkish GDP (ln pcYht
), the log of the real per capita
German (ln pcYft
), the log of the number of Turkish migrants in Germany (ln St),
and the log of the real exchange rate (ln et) for 2010 using the sources in the annex.
• Step 3: I calculate ln Rt/Y
ht for 2010 from Δln (R
t/Y
ht) for 2010 that I calculated in
step 2.
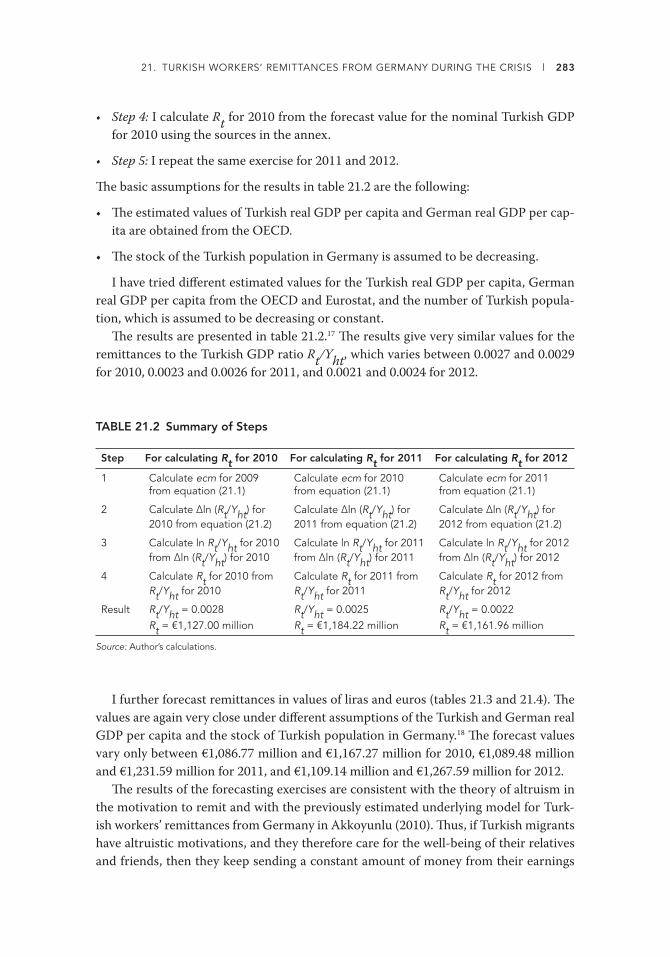
21. TURKISH WORKERS’ REMITTANCES FROM GERMANY DURING THE CRISIS l 283
• Step 4: I calculate Rt for 2010 from the forecast value for the nominal Turkish GDP
for 2010 using the sources in the annex.
• Step 5: I repeat the same exercise for 2011 and 2012.
Th e basic assumptions for the results in table 21.2 are the following:
• Th e estimated values of Turkish real GDP per capita and German real GDP per cap-
ita are obtained from the OECD.
• Th e stock of the Turkish population in Germany is assumed to be decreasing.
I have tried diff erent estimated values for the Turkish real GDP per capita, German
real GDP per capita from the OECD and Eurostat, and the number of Turkish popula-
tion, which is assumed to be decreasing or constant.
Th e results are presented in table 21.2.17 Th e results give very similar values for the
remittances to the Turkish GDP ratio Rt/Y
ht, which varies between 0.0027 and 0.0029
for 2010, 0.0023 and 0.0026 for 2011, and 0.0021 and 0.0024 for 2012.
TABLE 21.2 Summary of Steps
Step For calculating Rt for 2010 For calculating Rt for 2011 For calculating Rt for 2012
1 Calculate ecm for 2009 from equation (21.1)
Calculate ecm for 2010 from equation (21.1)
Calculate ecm for 2011 from equation (21.1)
2 Calculate Δln (Rt/Yht) for 2010 from equation (21.2)
Calculate Δln (Rt/Yht) for 2011 from equation (21.2)
Calculate Δln (Rt/Yht) for 2012 from equation (21.2)
3 Calculate ln Rt/Yht for 2010 from Δln (Rt/Yht) for 2010
Calculate ln Rt/Yht for 2011 from Δln (Rt/Yht) for 2011
Calculate ln Rt/Yht for 2012 from Δln (Rt/Yht) for 2012
4 Calculate Rt for 2010 from Rt/Yht for 2010
Calculate Rt for 2011 from Rt/Yht for 2011
Calculate Rt for 2012 from Rt/Yht for 2012
Result Rt/Yht = 0.0028Rt = €1,127.00 million
Rt/Yht = 0.0025Rt = €1,184.22 million
Rt/Yht = 0.0022Rt = €1,161.96 million
Source: Author’s calculations.
I further forecast remittances in values of liras and euros (tables 21.3 and 21.4). Th e
values are again very close under diff erent assumptions of the Turkish and German real
GDP per capita and the stock of Turkish population in Germany.18 Th e forecast values
vary only between €1,086.77 million and €1,167.27 million for 2010, €1,089.48 million
and €1,231.59 million for 2011, and €1,109.14 million and €1,267.59 million for 2012.
Th e results of the forecasting exercises are consistent with the theory of altruism in
the motivation to remit and with the previously estimated underlying model for Turk-
ish workers’ remittances from Germany in Akkoyunlu (2010). Th us, if Turkish migrants
have altruistic motivations, and they therefore care for the well-being of their relatives
and friends, then they keep sending a constant amount of money from their earnings

284 l SULE AKKOYUNLU
TABLE 21.3 Forecast Results
Variable Rt/Yhta pcYht pcYft St et
Model 1: Per capita real GDP forecast values are from OECD; decreasing stocks are assumed
2009 (actual) 0.0025 2089.701 26616.51 1658083 0.054849162
2010 (forecast) 0.0028 2139.854 27611.97 1628238 0.049015436
2011 (forecast) 0.0025 2170.240 28371.30 1598929 0.044081796
2012 (forecast) 0.0022 2194.980 29052.21 1570149 0.042010283
Model 2: Per capita real GDP forecast values are from OECD; constant stocks are assumed
2009 (actual) 0.0025 2089.701 26616.51 1658083 0.054849162
2010 (forecast) 0.0029 2139.854 27611.97 1658083 0.049015436
2011 (forecast) 0.0026 2170.240 28371.30 1658083 0.044081796
2012 (forecast) 0.0024 2194.980 29052.21 1658083 0.042010283
Model 3: Per capita real GDP forecast values are from Eurostat; decreasing stocks are assumed
2009 (actual) 0.0025 2089.701 26616.51 1658083 0.054849162
2010 (forecast) 0.0027 2225.532 27636.582 1628238 0.049015436
2011 (forecast) 0.0023 2232.295 28304.950 1598929 0.044081796
2012 (forecast) 0.0021 2240.555 28988.236 1570149 0.042010283
Model 4: Per capita real GDP forecast values are from Eurostat; constant stocks are assumed
2009 (actual) 0.0025 2089.701 26616.51 1658083 0.054849162
2010 (forecast) 0.0028 2225.532 27636.582 1658083 0.049015436
2011 (forecast) 0.0024 2232.295 28304.950 1658083 0.044081796
2012 (forecast) 0.0023 2240.555 28988.236 1658083 0.042010283
Source: Author’s calculations.
a. Rt/Yht values for 2009 are actual data whereas the values for 2010, 2011, and 2012 are calculated by the author from equations (21.1) and (21.2) from the actual values of pcYht, pcYft, St, and et for 2009 and from the estimated values of pcYht, pcYft, St, and et for 2010, 2011, and 2012. The sources of data are in the annex.
TABLE 21.4 Value of Turkish Workers’ Remittances from Germany
Model Currency 2009 actual 2010 forecast 2011 forecast 2012 forecast
1 Million lirasMillion euros
1,788.66824.00
2,348.571,127.02
2,344.371,184.22
2,300.301,161.96
2 Million lirasMillion euros
1,788.66824.00
2,432.451,167.27
2,438.151,231.59
2,409.421,267.59
3 Million lirasMillion euros
1,788.66824.00
2,264.691,086.77
2,156.821,089.48
2,195.741,109.14
4 Million lirasMillion euros
1,788.66824.00
2,348.571,127.02
2,250.601,136.85
2,404.861,214.77
Source: Author’s calculations.

21. TURKISH WORKERS’ REMITTANCES FROM GERMANY DURING THE CRISIS l 285
and maintain the consumption patterns of their relatives and friends, especially during
the economic crisis or unexpected events.
Conclusions
Th e importance and benefi ts of remittances for developing countries and the sudden
decline of these fl ows with the current fi nancial crisis have encouraged researchers to
forecast remittance fl ows. Th e results of forecasting exercises show that some regions are
and will be more aff ected than others (Ratha, Mohapatra, and Silwal 2010a, b). Indeed,
Ruiz and Vargas-Silva (2010) show that remittances to Latin America were aff ected dif-
ferently from those to other regions. In addition, each Latin American country had a
diff erent experience with respect to remittances; for instance, a signifi cant correlation is
found between the volume of remittances in previous years to Mexico and the severity
of the housing crisis at the state level in the United States. Th erefore, there are certain
advantages in analyzing remittances on a single-country level. First, the defi nitions of
remittances as well as the types of migrants vary across countries. Second, remittances
to some countries decreased more dramatically during the economic crisis depending
on the severity of the economic crisis in the remittance-sending host country. Th ere-
fore, it is important to analyze the determinants and the future patterns of remittances
on a single-country level to understand the global patterns of remittances. In this study
I forecast Turkish workers’ remittances from Germany because these fl ows constitute
the largest share of the total remittances to Turkey, and these fl ows as well as their ratio
to GDP have been stable over the last few years. Th erefore, it was important to study
whether these fl ows will be stable after the current crisis, based on the medium-term
outlook of the variables that infl uence Turkish workers’ remittances from Germany.
Th e forecasting exercises are based on a previously estimated model of Turkish work-
ers’ remittances from Germany by Akkoyunlu (2010). Th is model found that Turkish
workers’ remittances are determined by the Turkish real GDP per capita, the German
real GDP per capita, the number of Turkish workers in Germany, and the real exchange
rate in the long run as well as in the short run. Th e present forecasting exercises are
based on the predicted values of the Turkish real GDP per capita, the German real GDP
per capita, the number of Turkish workers in Germany, the real exchange rate for 2010,
2011, and 2012, and forecast remittances for 2010, 2011, and 2012.
Th e forecasting results show that the ratio of the Turkish workers’ remittances from
Germany to the Turkish GDP for 2010, 2011, and 2012 will remain almost the same
as during the precrisis period. Th is can be explained by the altruistic motivations for
remittances, which are stronger during economic crises or unexpected events.
Th e most important contributions of my forecasting exercises are as follows. First, I
include predicted values of GDP for the host country (Germany) and the home coun-
try (Turkey) in real and per capita terms. Second, I include the real exchange rate.
Th e importance of the exchange rate movements for the dollar (or the host country

286 l SULE AKKOYUNLU
currency) valuation of remittances has also been pointed out by Mohapatra and Ratha
(2010), who discuss the fact that in dollar terms, remittance fl ows to Armenia, the Kyr-
gyz Republic, and Tajikistan declined by 15, 33, and 34 percent, respectively, in the fi rst
half of 2009 compared with the same period in 2008. However, in ruble terms, remit-
tances to the Kyrgyz Republic in fact increased by 17 percent and those to Armenia and
Tajikistan decreased by only 8 and 10 percent, respectively. Similarly, they also observed
in countries such as Bangladesh, Ethiopia, India, Moldova, Nepal, Pakistan, and the
Philippines that a depreciation of these countries’ currencies led to a surge in remit-
tance fl ows to these countries.
Th e fi ndings in this study have important policy implications and suggest that policy
makers should consider the impact of their policy measures such as price stabilization
and devaluation of remittances. For instance, real devaluation of the lira with an aim to
increase Turkish exports will also have an eff ect on future remittances.
Notes
1. In fact, Ratha and others (2008, 2009a, b) note that the global decrease in remittances started
in the third quarter of 2008.
2. See Ratha, Mohapatra, and Silwal (2010b).
3. Th e current account infl ows are composed of foreign exhange infl ows due to exports of
goods and services, to incomes, and to unrequited transfers.
4. It is shown that remittances alleviate poverty (Adams, Cuecuecha, and Page 2008; Adams
and Page 2003, 2005; Quartey and Blankson 2004; World Bank 2006a) and promote human
and physical capital accumulation, economic growth, and development (Adenutsi 2010;
Amuedo-Dorantes and Pozo 2011; Edwards and Ureta 2003; Fajnzylber and Lopez 2007;
Gupta, Pattillo, and Wagh 2009; Hildebrandt and McKenzie 2005; Phillips 2009; Straubhaar
and Vadean 2006; Valero-Gil 2009; Ziesemer 2006). See also, for extensive empirical litera-
ture on the impact of remittance, Ghosh (2006).
5. Avendano, Gaillard, and Parra (2009), Bugamelli and Paterno (2009), Chami, Hakura, and
Montiel (2009), Giuliano and Ruiz-Arranz (2009), Gupta, Pattillo, and Wagh (2009), Ratha
(2003, 2005, 2007, 2010a), and World Bank (2006a) state that remittances contribute to sta-
bilizing the current account position, reduce the volatility of capital fl ows and output volatil-
ity of remittance-receiving countries, improve the debt sustainability and creditworthiness
of developing countries, and help facilitate access to international capital markets and to
formal fi nancial services.
6. However, several studies (Akkoyunlu and Kholodilin 2008; FEMIP 2006; Galliana 2006;
Unan 2009) point out that, in fact, the dramatic decrease of data from the offi cial Turkish
sources (Central Bank of Turkey) on total Turkish workers’ remittances after the 2001 bank-
ing crisis is due to the measurement. Th e Central Bank of Turkey underwent a major meth-
odological change of this data in 2003: Th e new defi nition of remittances does not include
transfers from Turkish workers going to Germany with a tourist visa but includes transfers
with an objective to earn money. Unan (2009) also argues that during the crisis the offi cial
data on remittances show a decrease, but unoffi cial transfers increase. Th erefore, it is very
important to have a reliable data source on remittances. Th e Deutsche Bundesbank provides

21. TURKISH WORKERS’ REMITTANCES FROM GERMANY DURING THE CRISIS l 287
consistent and reliable data on Turkish workers’ remittances, which enables us to analyze the
eff ects of economic crisis on remittances.
7. Offi cial aid refers to offi cial development assistance.
8. Th e importance of the host country’s conditions is also confi rmed by Barajas and others
(2010), Calì and Dell’Erba (2009), Chami, Hakura, and Montiel (2005), Elbadawi and Rocha
(1992), El Mouhoub, Oudinet, and Unan (2008), El-Sakka and McNabb (1999), Glytsos
(1997), Straubhaar (1986), Swamy (1981), and Vargas-Silva and Huang (2006).
9. Turks are mainly concentrated in sectors such as manufacturing and services (such as hotels
and restaurants).
10. Taylor (2000) found that public transfer schemes in the United States increased remittances
to Mexico.
11. As Ratha (2003) points out, remittances increase with return migration.
12. Akkoyunlu and Kholodilin (2008) adopt the vector autoregressions approach in their study.
13. Th e negative long-run coeffi cient on German GDP that I found in these estimations can be
explained by an increase in income inequality that took place in recent years in Germany;
see Dustmann, Ludsteck, and Schönberg (2009). Th e vast majority of Turkish workers are
unskilled, and therefore the growth rate of their income is very low (almost zero) and is cer-
tainly much lower than the overall economic growth in Germany. Hence the negative long-
run relationship between remittances and German real GDP may refl ect this sharp increase
in income dispersion.
14. Th e theoretical determinants of remittances were provided in a painstaking paper by Lucas
and Stark (1985), who studied remittances on a household level. Th e signs of the coeffi -
cients on household income and migrant income help identify the motives for remittances.
In macrostudies the host country GDP per capita is used to measure economic conditions
in the host country that represent migrants’ employment and earnings prospects. Similary,
home country economic activity is measured by the home country GDP per capita. Negative
economic conditions in the home country encourage migrants to send remittances if they
have altruistic motives. In macromodels, economic policies and economic and political sta-
bility as well as institutions in the home country matter. Th erefore, in macromodels interest
rate diff erentials and exchange rates are added to identify whether migrants have an invest-
ment motive or an altruistic motive. Th e investment motive suggests that devaluation dis-
courages remittances. However, altruistic models predict that a real devaluation positively
aff ects remittances (IMF 2005: ch. 2).
15. Th e positive response of remittances to an increase in the host country’s GDP is reported
in Frankel (2010), Glytsos (1997), Ruiz and Vargas-Silva (2010), and Vargas-Silva and Huang
(2006). In addition, Clarke and Wallsten (2004), Frankel (2010), Ratha, Mohapatra, and Sil-
wal (2010b), World Bank (2006a), Yang (2008b), and Yang and Choi (2007) fi nd a negative or
countercyclical relationship between the remittances and the home country GDP.
16. Singh, Haacker, and Lee (2009) also adopt a similar approach to forecasting remittances to
Africa.
17. Th e annex provides the data sources.
18. I keep the forecast values of real exchange rates the same in all the forecasting exercises
because these values do not diff er from the Deutsche Bundesbank and the OECD.

288 l SULE AKKOYUNLU
Annex: Data Sources
Data Source of actual data
Turkish workers’ remittances from Germany Deutsche Bundesbank
Nominal and real Turkish GDP Turkish Statistical Institute
Real German GDP Deutsche Bundesbank
Turkish population Turkish Statistical Institute
German population German Federal Statistical Offi ce
Nominal exchange rate (liras/euros) Deutsche Bundesbank
Turkish CPI Turkish Statistical Institute
German CPI Deutsche Bundesbank
The stock of Turkish population in Germany German Federal Statistical Offi ce
Data Source of estimated values
Real Turkish GDP Eurostat and OECD
Real German GDP Eurostat and OECD
Turkish population Turkish Statistical Institute
German population German Federal Statistical Offi ce
Nominal exchange rate (liras/euros) Deutsche Bundesbank
Turkish CPI OECD and Eurostat
German CPI OECD and Eurostat
Source: Author.
Note: CPI = consumer price index.
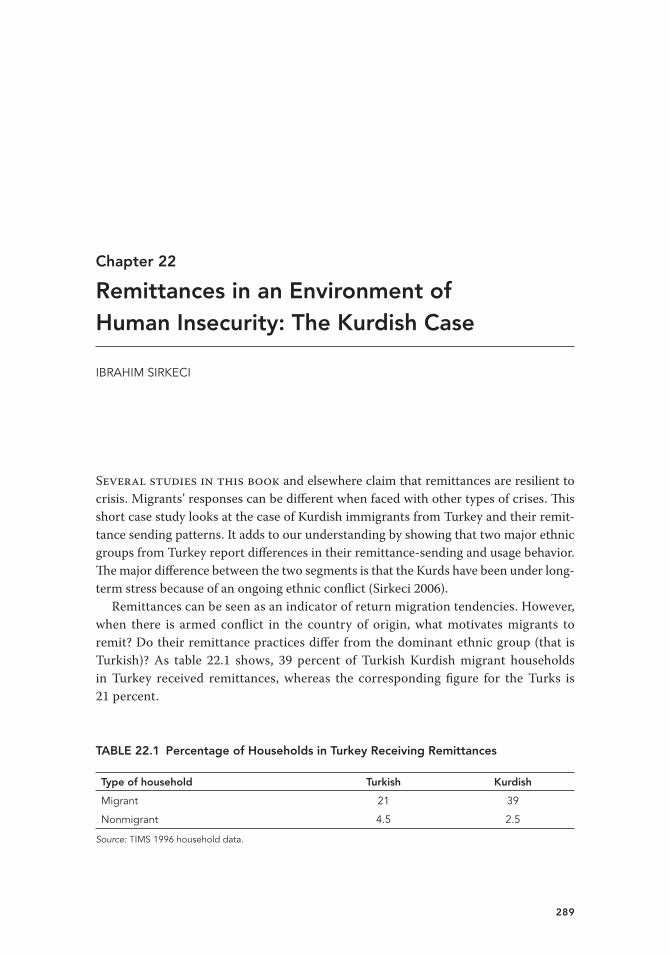
289
Chapter 22
Remittances in an Environment of Human Insecurity: The Kurdish Case
IBRAHIM SIRKECI
Several studies in this book and elsewhere claim that remittances are resilient to
crisis. Migrants’ responses can be diff erent when faced with other types of crises. Th is
short case study looks at the case of Kurdish immigrants from Turkey and their remit-
tance sending patterns. It adds to our understanding by showing that two major ethnic
groups from Turkey report diff erences in their remittance-sending and usage behavior.
Th e major diff erence between the two segments is that the Kurds have been under long-
term stress because of an ongoing ethnic confl ict (Sirkeci 2006).
Remittances can be seen as an indicator of return migration tendencies. However,
when there is armed confl ict in the country of origin, what motivates migrants to
remit? Do their remittance practices diff er from the dominant ethnic group (that is
Turkish)? As table 22.1 shows, 39 percent of Turkish Kurdish migrant households
in Turkey received remittances, whereas the corresponding fi gure for the Turks is
21 percent.
TABLE 22.1 Percentage of Households in Turkey Receiving Remittances
Type of household Turkish Kurdish
Migrant 21 39
Nonmigrant 4.5 2.5
Source: TIMS 1996 household data.

290 l IBRAHIM SIRKECI
Family members, especially spouses, children, and brothers and sisters, sent most
of the remittances identifi ed in the TIMS survey (table 22.2). Th e lower rate for send-
ing remittances among some individuals is often related to the duration of the stay
abroad according to the international migration literature. Remittances from immi-
grants who have stayed abroad longer often tend to decrease for two basic reasons:
Close family members may join them, and relations with other family members and
relatives may weaken over time (Martin, Hönekopp, and Ullmann 1990; Massey and
others 1998/2006).
Th e patterns of sending remittances are related to the nature of relations between
migrants and their relatives left behind and the economic conditions of the members
of the household who stayed in Turkey. If sending remittances and investing at home
means stronger ties with the country of origin and an indicator of return intentions, it is
clear that a majority of migrants from both ethnic groups are unlikely to return. How-
ever, transnational living space allows Turks and Kurds to control their investments in
Turkey without actually returning home (Ammassari and Black 2001).
Table 22.1 shows that more Turkish Kurdish households seem reliant on remittances
than do Turk households. Th is can be related to the fact that the Kurdish-populated
areas have been known for striking underdevelopment compared with the rest of the
country (Sirkeci 2006). However, when the sources of remittances are examined, hardly
any diff erence is observed between Turkish and Kurdish households (table 22.2). Both
ethnic groups received remittances from their family members, and particularly from
their spouses, brothers, sisters, and children. Th e only diff erence is that Turkish Kurds,
unlike Turks, also received remittances from friends. One can relate this to the stronger
communal ties among the Kurds. Patterns of the use of remittances elaborated below
may cast light on this issue (table 22.3). Kurds received more remittances for commu-
nity purposes than the Turks. Th ese may have come not only from relatives, but also
from friends.
TABLE 22.2 Sources of Remittances for Households in Turkey
percent
Sender of remittances Turkish Kurdish
Migrant 15.8 13.3
Spouse 28.1 28.9
Children 31.6 15.6
Parents 8.8 11.4
Sibling 24.6 24.4
Relative 3.5 4.4
Friend 0.0 6.6
n 57 45
Source: TIMS 1996 household data.

22. REMITTANCES IN ENVIRONMENT OF HUMAN INSECURITY: THE KURDISH CASE l 291
Remittance-sending spouses represent divided families. Th is usually refers to a hus-
band working abroad while his wife stays in Turkey. Children sending remittances, on
the other hand, often indicate parents are left behind in Turkey.
Many migrant households also received goods from abroad, including 11 percent of
Turkish and 15 percent of Turkish Kurdish migrant households. Although these goods
consisted of electronic devices, consumer goods, and clothes for the Turks, they were
only clothes and jewelry for Turkish Kurds (table 22.3).
TABLE 22.3 Household Goods Received from Migrants
percent
Turkish Kurdish Total
Received goods from abroad 11 15 12
Have not received goods from abroad 89 85 88
Received television and/or music equipment 4 0 3
Received other consumer goods 1 0 1
Received clothes 10 14 11
Received jewelry 0 1 0
n 294 108 402
Source: TIMS 1996 household data.
Cash remittances are often used for paying daily household expenses, including
food, clothing, and rent. Most of the households that received money from abroad used
it for their daily expenditures (70 percent of Turkish and 80 percent of Turkish Kurd-
ish households; see table 22.4). Th e rest of the money was used for paying medical bills
and fi nancing the marriage of family members in Turkish Kurdish households. Again
a very large portion of remittances were used for daily expenses and probably indicate
struggling family economies in Turkey. Th is may also mean a member or members of
the family who live abroad are obliged to take care of the fi nances of their families left
behind in Turkey.
A contrast is seen between Turkish and Turkish Kurdish households with regard
to remittances received for community purposes. As table 22.4 shows, 17 percent of
Turkish Kurdish households received such remittances as opposed to 11 percent of
their Turkish counterparts; however, the diff erence is not statistically signifi cant. Most
of these contributions were used for religious purposes including building or repair-
ing mosques, maintaining religious ceremonies, and festivities. Among Turkish Kurds,
two-thirds of all community purpose remittances were used for alms in Ramadan. Th is
is important because it can be an indicator of community-level dependency on remit-
tances received from abroad, because alms in Ramadan are the only source of income
for poor people in some sending areas.

292 l IBRAHIM SIRKECI
Turkish Kurdish immigrants interviewed in Cologne highlighted the dependency of
their households left behind in Turkey. Th ey also reported the expectations of their
families in Turkey, although they did not say much about the community. Th ese expec-
tations are usually in two forms: (1) cash and in-kind remittances to contribute to the
family’s economy and (2) help for migration of other members of the family or friends.
Emrah Kuzucu, for example, is under pressure from his family who live in the vil-
lage of Urfa in southern Turkey. He was just 22 when he arrived in Germany in 1998,
and the cost of 8,000 DM (£2,700) for his journey through the Balkans and Austria was
paid for by his family: “Th e 400 DM (£130) I receive from the [German] government
is a very small amount. Th ose I left behind in the village expect money from me. Th ey
don’t know my situation here. I have to send money to them.” At the same time, he was
dealing with the expectations of potential migrants in his village in Turkey: “My friends
[in Turkey] ask ‘Shall we come there?’ I say ‘No, don’t come.’ I say ‘You should acquire
TABLE 22.4 Use of Most Remittances in Turkey
percent
Type of remittance use Turkish Kurdish Total
Received remittance 19.5 42.1 25.5
Did not receive remittance 80.5 57.9 74.5
Use
To pay for daily household expenses 13.6 34.6 19.2
To buy consumer goods 0.3 0.0 0.2
To buy land 0.0 0.9 0.2
To buy fertilizer, seeds, food for animals, and so on 0.7 0.0 0.5
To buy, build, or renovate a house 0.7 0.0 0.5
To pay for medical bills 1.4 3.7 2.0
To repay other debts 0.3 0.0 0.2
To fi nance the marriage of family members 1.0 2.8 1.5
To fi nance other family or religious celebrations 0.3 0.0 0.2
Other 1.4 0.0 1.0
n 294 108 402
Received remittances for community purposesa 10.5 16.7 12.2
Contribution to mosque 5.0 5.0 5.0
For alms in Ramadan 5.0 10.0 7.0
For religious festivities (such as a feast in Ramadan) 1.0 6.0 2.0
Other 2.0 5.0 3.0
n 294 108 402
Source: TIMS 1996 household data.
Note: Community purpose: χ2 = 2.766; signifi cance = 0.096.
a. Details do not sum to totals because more than one purpose was indicated by some respondents.

22. REMITTANCES IN ENVIRONMENT OF HUMAN INSECURITY: THE KURDISH CASE l 293
a profession fi rst and then you can come here.’ I am insisting that ‘If you don’t have a
profession, there is no job for you here.’ ”
Th ese expectations could be the results of reciprocity between the migrant and those
of his or her family left behind. According to the qualitative research, migrants pay a
high (higher in the case of clandestine migration) cost for their migration adventure,
and the families left behind have often paid this cost collectively. Th us, in return, the
family left behind expects benefi ts from its investment.
Migrants’ future plans are made in relation to their direct investment patterns as well.
A very small portion of remittances goes toward investments in Turkey (table 22.4), but
the qualitative interviews may shed further light on what immigrants do with their sav-
ings. Many of the immigrants interviewed in Cologne reported that they own some
property or business interest in Turkey. Immigrants’ family members who lived in Tur-
key ran most of these businesses and properties. Th ese investments can be perceived
as an indication of an inclination to return, but again, the interviewees in Cologne did
not seem too keen on returning but yet make investments, perhaps for the possibility of
returning in the distant future.
Th e transnational nature of migration and migrant communities enables those indi-
viduals and families to pursue lives in more than one country. Remittances invested
in Turkey shall be considered as part of such transnational investment portfolios for
some Kurdish immigrants in Germany rather than indicating an intention to return.
Th is case study shows us that diff erent ethnic groups from the same country of origin
may present diff erent remittance patterns, which are shaped by their cultural traditions,
intensity of relations within households and communities, their time spent abroad, as
well as the relative deprivation (or socioeconomic development) levels that those left
behind have to face in the country of origin. In this case, the Kurds seems to be in need
of more support, for which remittances provide.


295
Chapter 23
Financial Crisis and Remittances from Denmark to Turkey
PINAR YAZGAN AND IBRAHIM SIRKECI
In this short case study, we look at a relatively understudied international migra-
tion stream, migration from Turkey to Denmark, with a focus on remittance-sending
behavior. Our analysis draws on recent fi eldwork carried out in Denmark in between
2008 and 2011, thus covering the most recent global fi nancial crisis. Such economic
crises are expected to have an adverse eff ect on the volume of remittance fl ows. We
have examined this eff ect in the case of Danish Turks, who represent the largest group
among Muslim immigrants in Denmark. Our analysis shows that the Turkish immi-
grants to Denmark over several decades have developed a transnational space based on
frequent visits home and have maintained ties with the hometowns and villages in the
country of origin, Turkey. We therefore believe that such a transnational space plays a
role in the continuation of remitting practices across generations of Turkish immigrants
in Denmark and partly explains the resiliency of remitting behavior to the fi nancial cri-
sis. We have limited our analysis to the survey data and qualitative material we collected
during the fi eldwork. Nevertheless, our study also presents overall statistics about the
Turkish immigrant population in Denmark.
Turkish Migration to Denmark
In line with the overall Turkish international migration patterns to Western Europe,
Denmark has attracted many Turkish immigrants since the 1960s. Th ese migration fl ows
to Western Europe have also represented a move from the rural countryside to urban

296 l PINAR YAZGAN AND IBRAHIM SIRKECI
centers. Over the years, the composition of Turkish migration to Denmark has evolved
from the initial government-led labor migration to include, fi rst, family migrations,
then refugee fl ows, and fi nally irregular migration responding to changes in admission
policies and the overall economic and political environment. Such evolution of migra-
tion was evident in the periodization suggested elsewhere (Sirkeci 2005). Hence four
distinct chronological periods of the Turkish migration in the twentieth century can be
identifi ed: (1) individual migrations motivated by personal reasons, from the late nine-
teenth century onward, (2) compulsory migrations of the non-Muslim minority popu-
lations of Turkey from 1900 until the late 1970s, (3) mass labor migrations and family
reunifi cations, mainly between 1961 and 1980, and (4) irregular migration, including
refugees, asylum seekers, and those making clandestine migrations and the like from
1980 until the present time.
Turkey signed bilateral labor exchange agreements with various European coun-
tries starting with the Federal Republic of Germany in 1961. According to the Ministry
of Labour and Social Security, there were 3,693,121 Turkish citizens living abroad by
the end of 2006. Th ere were also 1,480,256 Turkish citizens who were naturalized by
other countries. Denmark has its share of Turkish immigrants. Despite the fact that no
bilateral agreements were in force between the two countries, Danish fi rms recruited
Turkish workers by individual invitations from the late 1960s until 1973 and continued
until 1980. Following the military intervention in Turkey (September 12, 1980), large
numbers of Turkish and Kurdish refugees and asylum seekers arrived in Denmark. By
1973, 15,000 Moroccan, Pakistani, and Turkish immigrants were living in Denmark
(Jorgensen 2008: 119).
Although only 2,377 Turkish immigrants were in Denmark in 1970–71, by 1980
the number of Turkish immigrants in Denmark had grown to 15,841. According to
the Turkish Ministry of Labour and Social Security, the total increased to 21,544 by
2003. Th e Denmark Statistical Offi ce reports 60,031 Turkish immigrants constituting
the largest ethnic group among the 540,000 immigrant population in Denmark, whose
overall population was 5,534,730 (Statistics Denmark 2011). By January 2011, there
were 30,992 people who were born in Turkey along with 29,039 others who are descen-
dants of the Turkish born (Statistics Denmark 2011). Figure 23.1 shows the growth of
the immigrant population who were born in Turkey. Th us the Turkish minority in Den-
mark is much larger than it seems at fi rst.
Data and Methods
We carried out a mixed-method research including a questionnaire survey and qualita-
tive in-depth interviews with Turkish immigrants in Denmark. Our results are based
on 450 completed questionnaires and 31 qualitative interviews. Th e survey sample
included 182 women and 268 men, 64 percent of whom were either self-employed or
employees. Th e question we asked about remittances was as follows: Do you send money
to your relatives, friends, or others in need of support in Turkey? Th e analysis presented
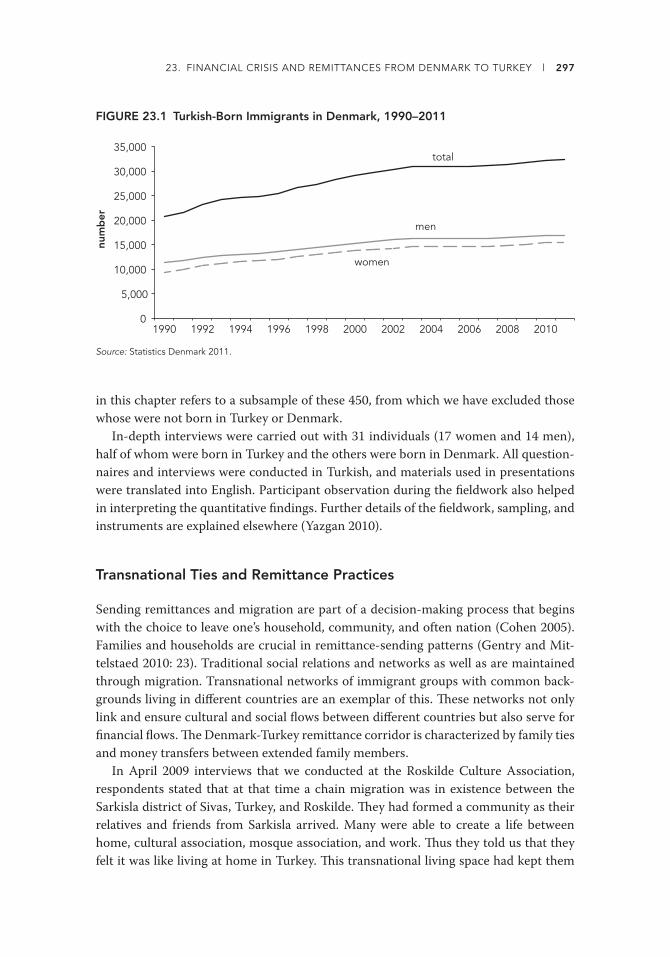
23. FINANCIAL CRISIS AND REMITTANCES FROM DENMARK TO TURKEY l 297
in this chapter refers to a subsample of these 450, from which we have excluded those
whose were not born in Turkey or Denmark.
In-depth interviews were carried out with 31 individuals (17 women and 14 men),
half of whom were born in Turkey and the others were born in Denmark. All question-
naires and interviews were conducted in Turkish, and materials used in presentations
were translated into English. Participant observation during the fi eldwork also helped
in interpreting the quantitative fi ndings. Further details of the fi eldwork, sampling, and
instruments are explained elsewhere (Yazgan 2010).
Transnational Ties and Remittance Practices
Sending remittances and migration are part of a decision-making process that begins
with the choice to leave one’s household, community, and often nation (Cohen 2005).
Families and households are crucial in remittance-sending patterns (Gentry and Mit-
telstaed 2010: 23). Traditional social relations and networks as well as are maintained
through migration. Transnational networks of immigrant groups with common back-
grounds living in diff erent countries are an exemplar of this. Th ese networks not only
link and ensure cultural and social fl ows between diff erent countries but also serve for
fi nancial fl ows. Th e Denmark-Turkey remittance corridor is characterized by family ties
and money transfers between extended family members.
In April 2009 interviews that we conducted at the Roskilde Culture Association,
respondents stated that at that time a chain migration was in existence between the
Sarkisla district of Sivas, Turkey, and Roskilde. Th ey had formed a community as their
relatives and friends from Sarkisla arrived. Many were able to create a life between
home, cultural association, mosque association, and work. Th us they told us that they
felt it was like living at home in Turkey. Th is transnational living space had kept them
FIGURE 23.1 Turkish-Born Immigrants in Denmark, 1990–2011nu
mb
er
0
5,000
10,000
15,000
20,000
25,000
30,000
35,000
1990 1992 1994 1996 1998 2000 2002 2004 2006 2008 2010
men
women
total
Source: Statistics Denmark 2011.

298 l PINAR YAZGAN AND IBRAHIM SIRKECI
in touch with what is happening in Turkey through the ties with relatives and friends in
Denmark and Turkey. It was clear to them that they were aware and engaged with what
is happening in Turkey. A middle-aged Turkish immigrant (Mehmet, aged 45, born in
Turkey) explained this complex web of relations as follows: “At least we are speaking to
our relatives over the phone, going there on holidays, fi nancially helping them. Th ose in
Turkey don’t follow the news as we do it from here. When we go there, we see they have
no clue about what is going on in Turkey.”
Th ose who were left behind live in a relatively deprived environment in their towns
and villages in Turkey. Th is deprivation was among the key reasons for emigration in
the fi rst place. Th us it is interesting to understand whether migrants send remittances
to and contribute to these communities and individuals back in Turkey. In our survey,
about three-quarters of both Turkish-born (73.5 percent) and Danish-born (71.4 per-
cent) Turks in Denmark send remittances to their families, relatives, and friends (n =
363, of whom 294 were born in Turkey and 63 were born in Denmark). A high level of
remittance sending among Danish-born Turks can be an indication of strong ties by the
second and third generations with their parental homeland.
Both men and women were largely remitting home, although the percentage of
women sending money to Turkey (67 percent) was lower than that of men (77 percent).
When employment status is analyzed, we found that 74 percent of those who are in
temporary employment were sending money. Th e corresponding fi gures were 69 per-
cent for the self-employed and 71 percent for employees. Th e highest rates we observed
were among the retired (81 percent), students (80 percent), and unemployed (80 per-
cent). One can speculate on the higher propensity to remit among the retired, students,
and unemployed because this can be linked to regulated welfare benefi ts they may
receive as well as potential income from informal economic activities. Nevertheless,
this requires further investigation.
FIGURE 23.2 Remittance-Sending Behavior of Danish Turks by Country of Birth, 2010
per
cent
0
10
20
30
40
50
60
70
80
born in Turkey born in Denmark
send remittances
do not sendremittances
Source: Authors’ fi eld data.

23. FINANCIAL CRISIS AND REMITTANCES FROM DENMARK TO TURKEY l 299
Many of our respondents in the qualitative survey also indicated their commitment
to send money to their families and relatives in Turkey. It was often put as if sending
money is a moral obligation while also assuming there is need for it:
As a family we are sending money. Usually we send it to our aunt and grandfather to sup-
port them. Because they need it. My father and his two brothers send them some money
every month. Families are sending money, but we as children, young or grown up, are too
contributing as much as we can. Recently, my 15-year-old sister brought her fi rst ever sal-
ary and said, shall we send this to my grandfather? (Ayla, aged 23, born in Denmark).
Ayla, born in Denmark, is a postgraduate student. She, like others in her family, is
very close with her relatives in Turkey, and she sends money to them. Her siblings are
also sending remittances to their grandmother in Turkey. Similarly Eren, another post-
graduate student aged 19 and born in Denmark, states that his peers, like himself, have
strong ties with their relatives in Turkey and send remittances to them: “Many of those
here have strong family ties. For example, we gather as a family and one by one pick [up]
the phone and speak to my grandfather and grandmother in Turkey as we miss them so
much. Whenever they need we help them fi nancially.”
Cihan, aged 32, had come to Denmark from Turkey when he was nine years old. He
told us that fi nancial support to his relatives in Turkey is important and the economic
crisis did not aff ect that:
My uncles and grandmother still live in Turkey. I am on good terms with them. I am always
in touch with my grandmother. She rings me, I ring her. Both my mother and myself, we
never leave her without money, we send as much as we can possibly do. She lives with my
uncle anyway. We have a very large family … Facebook also helped us to be in touch more
regularly. [Th e] economic crisis did not aff ect us in this regard.
Serpil, aged 48, with her husband came to Denmark from Turkey as a political refu-
gee at the beginning of the 1980s. Th ey fi nancially support their families left behind as
much as economic migrants. Th is money fl ow continues over many years and is main-
tained by new generations, too. Danish Turks’ marriages with distant relatives in Turkey
also contribute to the maintenance of remittance fl ows. Th ese marriages strengthen the
transnational ties. Serpil’s son is married to a relative in Turkey:
I used to send some pocket money to my elder sister. We send [money] even if it’s a small
amount. My son completed his military service in 2005 and began seeing his aunt’s daugh-
ter. When his uncle [in Turkey] was not able to pay his insurance, my son had paid it for
him. He paid it to support [him]. We have always been supportive to our family; solidarity
continues after the crisis … I got my papers as a refugee in November 1982. Since then I
send money to Turkey, sometimes documented, sometimes undocumented. Sometimes
I give gold [or] send money instead for Eid ul-Fitr … In the past, people were buying or
building houses in Turkey; nowadays they see themselves permanent here. So they still
send money to Turkey but don’t buy houses like it was in the past. Th ey adjust to Denmark.
Lifestyles changed but solidarity continues.
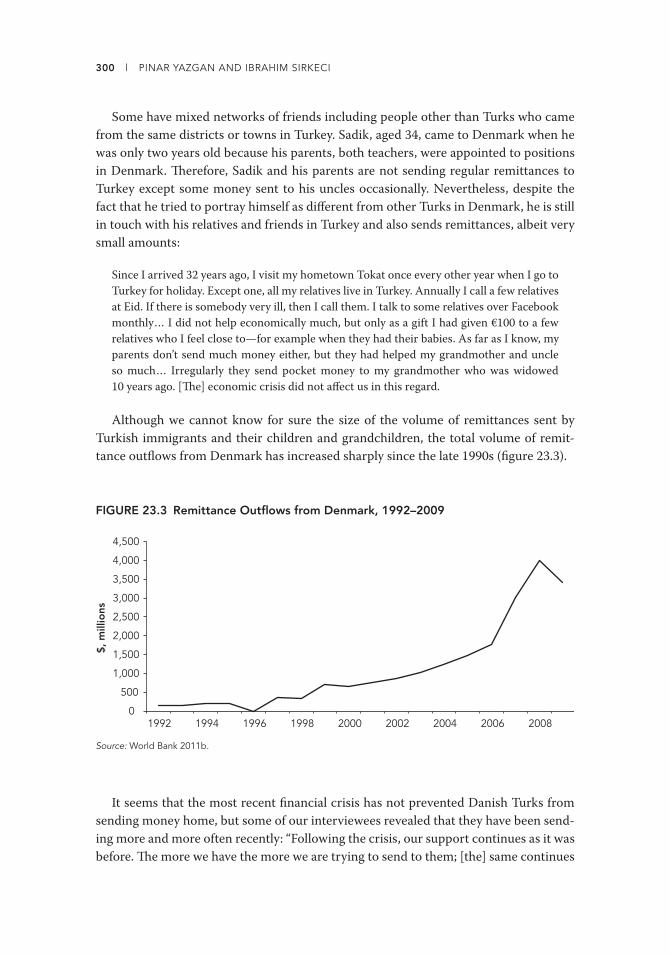
300 l PINAR YAZGAN AND IBRAHIM SIRKECI
Some have mixed networks of friends including people other than Turks who came
from the same districts or towns in Turkey. Sadik, aged 34, came to Denmark when he
was only two years old because his parents, both teachers, were appointed to positions
in Denmark. Th erefore, Sadik and his parents are not sending regular remittances to
Turkey except some money sent to his uncles occasionally. Nevertheless, despite the
fact that he tried to portray himself as diff erent from other Turks in Denmark, he is still
in touch with his relatives and friends in Turkey and also sends remittances, albeit very
small amounts:
Since I arrived 32 years ago, I visit my hometown Tokat once every other year when I go to
Turkey for holiday. Except one, all my relatives live in Turkey. Annually I call a few relatives
at Eid. If there is somebody very ill, then I call them. I talk to some relatives over Facebook
monthly … I did not help economically much, but only as a gift I had given €100 to a few
relatives who I feel close to—for example when they had their babies. As far as I know, my
parents don’t send much money either, but they had helped my grandmother and uncle
so much … Irregularly they send pocket money to my grandmother who was widowed
10 years ago. [Th e] economic crisis did not aff ect us in this regard.
Although we cannot know for sure the size of the volume of remittances sent by
Turkish immigrants and their children and grandchildren, the total volume of remit-
tance outfl ows from Denmark has increased sharply since the late 1990s (fi gure 23.3).
FIGURE 23.3 Remittance Outfl ows from Denmark, 1992–2009
$, m
illio
ns
0
500
1,000
1,500
2,000
2,500
3,000
3,500
4,000
4,500
1992 1994 1996 1998 2000 2002 2004 2006 2008
Source: World Bank 2011b.
It seems that the most recent fi nancial crisis has not prevented Danish Turks from
sending money home, but some of our interviewees revealed that they have been send-
ing more and more often recently: “Following the crisis, our support continues as it was
before. Th e more we have the more we are trying to send to them; [the] same continues

23. FINANCIAL CRISIS AND REMITTANCES FROM DENMARK TO TURKEY l 301
on special dates too” (Ayla, quoted above). Although most of them told us stories
refl ecting that relations, family ties, and indebtedness are very important and thus the
fi nancial crisis appears to be irrelevant, a few of the respondents also underlined the
adverse eff ects of the fi nancial crisis on their lives and earnings in Denmark. Th is is no
surprise to anybody, and hence not surprisingly they also told us that the amounts and
frequency of remittances sent to those left behind in Turkey have changed since they
cannot aff ord to send large amounts or as frequently anymore.
Conclusion
Remittances, if we take a broader defi nition, carry ideas, opinions, attitudes, politics,
and culture in general between Denmark and Turkey. Th e contribution of remittances,
thus, to local development in sending areas is evident though diffi cult to measure. Th e
transnational ties are essential in these fl ows attached to people fl ows; as observed by
Sørensen (2005a: 36), immigrants act as interpreters between the geographies they are
associated with. Th ese fl ows should not be seen as one-way but mutual.
As we mentioned earlier, fi nancial fl ows are often based on family and social ties.
Despite the expectation that these ties with the country of origin and communities of
origin will loosen as time goes by and among new generations, our interviews provided
evidence that Turkish and Kurdish migrants in Denmark tend to continue remitting.
We believe the strong transnational ties between the origin communities and the dias-
pora deserve some credit for this trend. Th us remittances continue to be sent in the
same amounts and frequency as in the past. Th e transnational space created by Turkish
immigrants in Denmark is characterized by a network of a limited number of locations
in Turkey. Th ese networks between the communities strengthened over time as they
provided for the individuals and households involved in migration. Th ese strong net-
works may also explain at least partly why remittances were resilient in the most recent
fi nancial crisis.


303
Chapter 24
Work and Remittance Patterns of Irregular Immigrants in Turkey
OĞUZHAN ÖMER DEMIR AND M. ALPER SOZER
Migration literature is dominated by studies on remittance practices of legal
migrants. Because of the unavailability of data and diffi culty in conducting studies with
undocumented immigrants, remittances by irregular immigrants are understudied. In
this chapter, we present results from recent fi eld research to outline the work and remit-
tance patterns of permanent, transit, and semitransit irregular immigrants caught by
authorities in Turkey while also relating it to the global fi nancial crisis, which has had a
clear impact on remittance fl ows globally (see Migration Letters, special issue on remit-
tances and fi nancial crisis 2010).
Turkey is a historically receiving and sending country for migration (IOM 2008; Kirisci
2002). Th e trend of migration beginning in the 1990s is considerably diff erent from the
trends in the past. Turkey has experienced an increased wave of regular and irregular
migration in the last two decades, and the country has since become a popular destination
point for migrants (Icduygu 2006; Sirkeci 2009). Turkey has been a place of interest for
short-or long-term visitors and immigrants for various reasons, such as tourism, educa-
tion, and employment. Th e number of foreign visitors has increased almost four times
between 1990 and 2008. Entry numbers of foreigners increased 100 percent between 1990
and 2000, and the increase was almost 260 percent between 2000 and 2008.
Turkey is also a transit place for irregular immigrants who are destined for Europe.
Others use Turkey as a semitransit location, and they stay over in Turkey for a period of
time (Icduygu 2003; Koç and Onan 2004). Offi cial statistics show that 660,000 irregu-
lar immigrants were caught by law enforcement authorities in Turkey between 2000
and 2009 (Sirkeci 2009). Of this number, the nationals of Afghanistan, Bangladesh, the

304 l OĞUZHAN ÖMER DEMIR AND M. ALPER SOZER
Islamic Republic of Iran, Iraq, Pakistan, Somalia, and the West Bank and Gaza accounted
for the largest irregular immigrant groups. Many of these were apparently transit irreg-
ular immigrants: Th at is, they entered Turkey illegally and tried to leave Turkey illegally
to reach a European country. Before leaving Turkey, some of these groups, however,
stayed and worked in the country (Icduygu 2003).
Th is study is designed as an exploratory case study. Qualitative and quantitative data
were used to understand irregular transit migrants’ work and remittance patterns. Th e
primary data were collected through a questionnaire survey and interviews. Th e fi rst
data set was generated through a nationwide survey that includes irregular migrants’
migration experiences to and through Turkey. Th e survey included 70 questions in
seven modules: (1) the decision-making process of migrants, (2) transportation pat-
terns, (3) experiences during the journey, (4) relationships with smugglers, (5) pay-
ments, (6) experiences in Turkey (time, work, earnings, police record, remittances, and
the like), and (7) demographics. We benefi ted from Chin’s (1999) questions in formulat-
ing the questionnaire. A focus group meeting was held with the participation of experts
and academics in the fi eld to strengthen measurement validity and reliability. In addi-
tion, in January 2010, a set of preliminary interviews were conducted in Ankara to test
this data collection method. After doing cross-checks to strengthen the measurement
validity and reliability, the questionnaire was fi nalized and sent to police departments of
33 provinces in Turkey where irregular immigrants are captured. Between January 2010
and November 2010, a total of 1,189 irregular immigrants consented to participate in
the survey. Participation in the survey was absolutely voluntary, and none of the irregu-
lar immigrants were forced to respond to the questions. A data set was generated based
on the participants’ responses to the questionnaire. Descriptive and bivariate analyses
were carried out on these data.
We are well aware that the setting has a crucial role in fi eldwork, and carrying out
questionnaires via security forces is particularly problematic in terms of refl exivity
issues identifi ed in the methodological studies. We are also aware that respondents may
not have freely expressed their opinions or disclosed their practices fully in fear that the
information may not work in their favor because their cases were ongoing during the
fi eld research. Th erefore, we would like to warn readers to be cautious in interpreting
the results and fi ndings of the study. Nevertheless, we have tried our best to ensure the
survey data are confi dential and no identifying personal data were collected.
Th e qualitative data were collected through in-depth interviews held with 65 irreg-
ular immigrants in diff erent settings in the cities of Istanbul, Edirne, Izmir, Mersin,
Hatay, Van, and Ankara between January 2010 and November 2010. All interviews
were conducted on a voluntary basis. Obviously, we lacked a sampling list of irreg-
ular migrants in Turkey; therefore, we used nonprobability sampling techniques. To
reach irregular immigrants in their natural setting, we utilized the snowball sampling
technique. Moreover, as a convenient sample, we visited immigrant removal centers
and conducted interviews with subjects awaiting deportation. We ensured every inter-
viewee that we would keep their personal information confi dential. We told them

24. WORK AND REMITTANCE PATTERNS OF IRREGULAR IMMIGRANTS IN TURKEY l 305
they could stop the interview if they felt uncomfortable. We asked several questions
to understand immigrants’ experiences, including remittance and work patterns. Th e
interviews took between 30 minutes and 2.5 hours. Interviews were tape recorded when
interviewees permitted; otherwise, notes were taken. All interviews were fully tran-
scribed and read by two diff erent researchers. An open coding technique was utilized,
which enabled researchers to capture even minor details. Next we formed subthemes
and then combined these subthemes into recurrent themes. For this study, we have used
only a portion of the data, which covers immigrants’ work, stay in Turkey, and remit-
tance patterns.
Findings
Th e fi ndings are presented in a deductive way. First, brief demographics of our sample
are presented. Second, irregular immigrants who sent remittances to their homelands
are examined. Th is section is followed by presentation of variables that include reason
for being in Turkey, work experience, duration of stay, links with homeland, and remit-
tances. In addition to these descriptive analyses, we attempt to discover possible pat-
terns of remittance sending by making a bivariate analysis.
Our fi ndings revealed that the majority of irregular immigrants in Turkey are male
(88 percent); however, there are female migrants (12 percent) who often travel with
their families (husband, children, grandfathers, and others). Although most of the irreg-
ular migrants are single (70 percent), a considerable portion are married (28 percent).
We observed that most married males were traveling alone and had left their families
in their homeland.
Th e mean age of the irregular immigrants is 26 although 7 percent were girls and boys
under the age of 18. Th e vast majority of immigrants are either uneducated (26 percent)
or undereducated (61 percent). Like their education level, their income level is consid-
ered low. Almost half of all irregular migrants make $100 or less per month. A third
were unemployed in their homeland, another third were self-employed, 13 percent were
workers, 5 percent were housewives, and 1 percent were public offi cials (table 24.1).
Only 8 percent reported any work experiences while in Turkey (table 24.1). Th e work
patterns of irregular immigrants vary according to their nationality. Irregular migrants
coming from Afghanistan, the Islamic Republic of Iran, Iraq, and Uzbekistan have ties
and networks with at least an individual with a long-standing history in Turkey.
When they enter Turkey migrants are easily integrated and absorbed into their com-
munities and diasporas. Th ey can fi nd jobs and rent houses, and their nationals provide all
other logistics in a short time. However, Bangladeshi, Myanmar, and Pakistani nationals
show diff erent patterns; their duration of stay in Turkey is considerably shorter.
Surprisingly, 82 percent of irregular migrants reported that they did not have family
members in their homeland. Reporting no family ties in their countries may be a pre-
ventive strategy to avoid deportation, or a strategy for seeking asylum. However, in our
interviews, we observed many irregular immigrants with separated or lost families. Th is
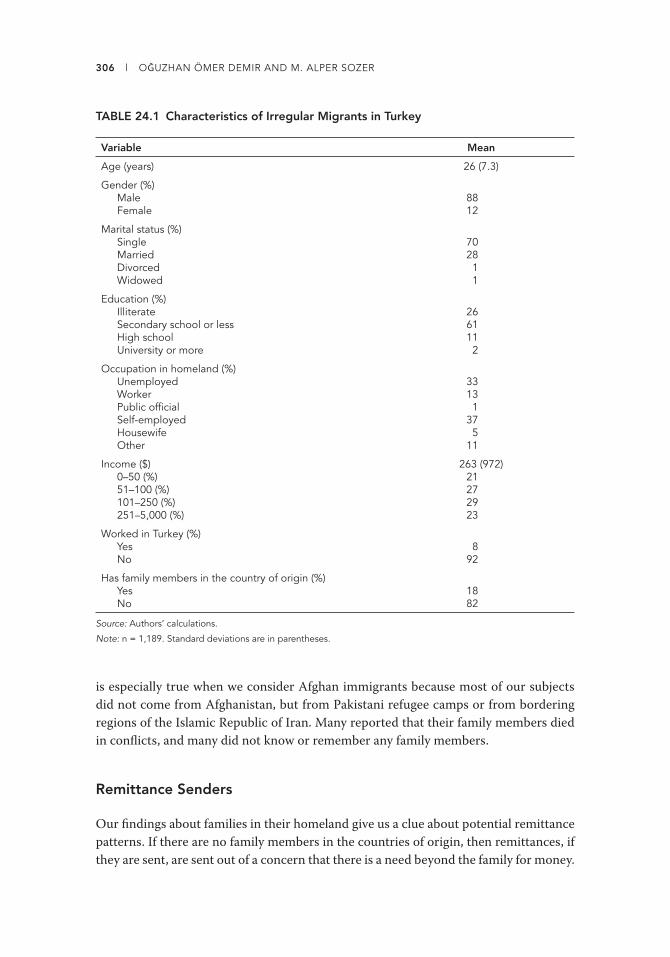
306 l OĞUZHAN ÖMER DEMIR AND M. ALPER SOZER
is especially true when we consider Afghan immigrants because most of our subjects
did not come from Afghanistan, but from Pakistani refugee camps or from bordering
regions of the Islamic Republic of Iran. Many reported that their family members died
in confl icts, and many did not know or remember any family members.
Remittance Senders
Our fi ndings about families in their homeland give us a clue about potential remittance
patterns. If there are no family members in the countries of origin, then remittances, if
they are sent, are sent out of a concern that there is a need beyond the family for money.
TABLE 24.1 Characteristics of Irregular Migrants in Turkey
Variable Mean
Age (years) 26 (7.3)
Gender (%)MaleFemale
8812
Marital status (%)SingleMarriedDivorcedWidowed
702811
Education (%)IlliterateSecondary school or lessHigh schoolUniversity or more
2661112
Occupation in homeland (%)UnemployedWorkerPublic offi cialSelf-employedHousewifeOther
33131
375
11
Income ($)0–50 (%)51–100 (%)101–250 (%)251–5,000 (%)
263 (972)21272923
Worked in Turkey (%)YesNo
892
Has family members in the country of origin (%)YesNo
1882
Source: Authors’ calculations.
Note: n = 1,189. Standard deviations are in parentheses.

24. WORK AND REMITTANCE PATTERNS OF IRREGULAR IMMIGRANTS IN TURKEY l 307
Only 3 percent of irregular migrants reported that they send remittances to their coun-
tries. Th ey were from Afghanistan, Azerbaijan, the Islamic Republic of Iran, Iraq, Myan-
mar, Pakistan, Rwanda, Senegal, Sudan, the Syrian Arab Republic, Turkmenistan, and
Uzbekistan.
Th e mean age of remittance senders is 29 (three years older than the general sample),
and the gender distribution consists of 73 percent males and 27 percent females. Th e
rate of married people is 5 percent higher in remittance senders (33 percent) compared
with the entire sample. Th e uneducated or undereducated population is also 10 percent
higher than the entire sample. Half of remittance senders were making $100 or less in
their countries (table 24.2).
To perform further analysis on this issue, we examined variables related to stay,
work, and remittances and tried to understand why an irregular migrant sends money,
while another one does not.
TABLE 24.2 Characteristics of Irregular Migrants in Turkey Who Send Remittances to Their Country of Origin
Variable Mean
Age (years) 29 (7.8)
Gender (%)MaleFemale
7327
Marital status (%)SingleMarriedDivorcedWidowed
5033107
Education (%)IlliterateSecondary school or lessHigh schoolUniversity or more
21372814
Occupation in homeland (%)UnemployedWorkerPublic offi cialSelf-employedHousewifeOther
21143
4121
Income ($)0–50 (%)51–100 (%)101–250 (%)251–5,000 (%)
277 (683)17333911
Source: Authors’ calculations.
Note: n = 30. Standard deviations are in parentheses.

308 l OĞUZHAN ÖMER DEMIR AND M. ALPER SOZER
An irregular migrant stays in Turkey on average 37 days, whereas the duration of stay
for remittance senders is about one year (366 days). Moreover, the majority of remittance
senders (63 percent) came to work and stay in Turkey. In addition, 87 percent reported
that they work (or worked), which is apparently much higher than the full sample’s work
experience (8 percent of the total reported any work experience). Th eir work experiences
range from a construction worker to a salesperson, and from babysitting to street ped-
dling. Slightly over half of all remittance senders (54 percent) stayed in an apartment.
Only 7 percent reported that they stayed in a temporary place such as a hotel room, which
is considered to be a classic accommodation facility for irregular migrants (table 24.3).
Unlike the full sample, the majority of remittance senders (75 percent) reported that
they had family members in their homelands. Most of our subjects had a kind of family
tie with their countries. A younger Afghan immigrant who has been living in Turkey for
almost two years explained why and how he sent remittances to his homeland:
I had a carpet store in Afghanistan with a good business partner. We were making good
money. In the meantime, I got married. Although we had years of successful business, then
we could not manage it fi nancially. Our business was bankrupted. I was full of debts. My
brothers were in Turkey at that time. I decided to go to Turkey. I am here almost for two
years. I knew Pakistani, Afghani, and English languages. I found many jobs here. I sold
clothes. I worked as a salesperson in Grand Bazaar, because I was communicating with
foreign tourists very well. Th en I worked in a fabric store. In short, I worked in many places
with my brothers to pay my debt back. I sent money to my family many times. I did not
use banks to transfer money. Th e easiest way was to fi nd a trusted friend who was going to
Afghanistan. Until now, I could pay all my debt. I plan to bring my family here to Turkey if
I can get a residence permit.
A younger Afghani immigrant, who was deported twice and captured a third time by
the police, explained why he has to send money to his country:
My family lives in Afghanistan. I have seven sisters and brothers. Two of them have jobs
and can aff ord their lives. However, others are students and they are dependent on me. I
have to work and send money for their expenses. I worked in a restaurant for a long time
in Turkey. I send money through bank transfer. Now I am about to be deported, and I have
nothing, barely no money!
A Myanmar immigrant mentioned why he sent remittance to his homeland as fol-
lows: “I work for a textile company and I make almost $400 every month in Turkey. My
parents were passed away and I have only a sister in my homeland. I send money to her
whenever I fi nd a trusted person going back to my country.”
One can ask why one-fourth of remittance senders transfer money to their home-
lands, despite having no family members there. Our interviews indicate that some of
those senders have debts or planned investments in their countries. An elderly irregular
immigrant from Turkmenistan living in Turkey for over two years explained his remit-
tance experiences:

24. WORK AND REMITTANCE PATTERNS OF IRREGULAR IMMIGRANTS IN TURKEY l 309
I had a wife in my homeland. We got divorced two years ago, and I decided to go to Turkey
to make some money. I had a lot of debts. When I fi rst came in here, I worked in a car wash
company for long years. Th en I worked in a construction site. All I was doing was working
and making some money. My boss was a smart guy. He was sending my money through
bank transfer to bank accounts of people whom I owed. I sent all my earnings to pay my
debts. Fortunately, I have no debt anymore, I paid almost $10,000.
Various sending methods were used; however, irregular immigrants usually send
money through an offi cial transfer system (banks or Western Union), and a large num-
ber reported that they sent money through a trusted friend or a fellow national.
TABLE 24.3 Work and Remittance Patterns of Irregular Migrants Who Sent Remittances to Their Country of Origin
Variable Mean
Duration of stay in Turkey (days) 366 (404)
Reason to leave homeland (%) To make money To fi nd lost family Other
707
23
Reason to enter Turkey (%) To go directly to Europe To work for some time in Turkey, then go to Europe To work and stay in Turkey Other
1317637
Ever worked in Turkey? (%) Yes No
8713
Type of work in Turkey (%) Construction worker Industry worker Babysitter/housekeeper Street peddler Other
2412164
44
Where lived in Turkey (%) Hotel room Apartment Workplace Other
7542514
Family members in country of origin (%) Yes No
7525
How remittances were sent to country of origin (%) Bank transfer Western Union Cash sent via friends/relatives Other
17373710
Source: Authors’ calculations.
Note: n = 30. Standard deviations are in parentheses.
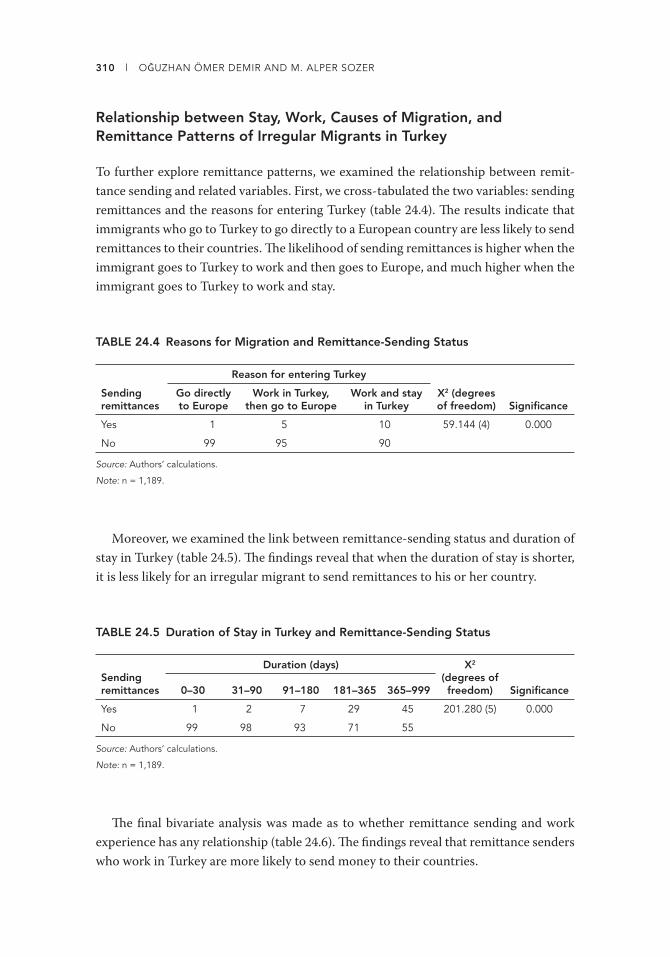
310 l OĞUZHAN ÖMER DEMIR AND M. ALPER SOZER
Relationship between Stay, Work, Causes of Migration, and Remittance Patterns of Irregular Migrants in Turkey
To further explore remittance patterns, we examined the relationship between remit-
tance sending and related variables. First, we cross-tabulated the two variables: sending
remittances and the reasons for entering Turkey (table 24.4). Th e results indicate that
immigrants who go to Turkey to go directly to a European country are less likely to send
remittances to their countries. Th e likelihood of sending remittances is higher when the
immigrant goes to Turkey to work and then goes to Europe, and much higher when the
immigrant goes to Turkey to work and stay.
TABLE 24.4 Reasons for Migration and Remittance-Sending Status
Sending remittances
Reason for entering Turkey
X2 (degrees of freedom) Signifi cance
Go directly to Europe
Work in Turkey, then go to Europe
Work and stay in Turkey
Yes 1 5 10 59.144 (4) 0.000
No 99 95 90
Source: Authors’ calculations.
Note: n = 1,189.
Moreover, we examined the link between remittance-sending status and duration of
stay in Turkey (table 24.5). Th e fi ndings reveal that when the duration of stay is shorter,
it is less likely for an irregular migrant to send remittances to his or her country.
TABLE 24.5 Duration of Stay in Turkey and Remittance-Sending Status
Sending remittances
Duration (days) X2 (degrees of freedom) Signifi cance0–30 31–90 91–180 181–365 365–999
Yes 1 2 7 29 45 201.280 (5) 0.000
No 99 98 93 71 55
Source: Authors’ calculations.
Note: n = 1,189.
Th e fi nal bivariate analysis was made as to whether remittance sending and work
experience has any relationship (table 24.6). Th e fi ndings reveal that remittance senders
who work in Turkey are more likely to send money to their countries.

24. WORK AND REMITTANCE PATTERNS OF IRREGULAR IMMIGRANTS IN TURKEY l 311
TABLE 24.6 Employment and Remittance-Sending Status
Sending remittances
Work in Turkey?
X2 (degrees of freedom) Signifi canceYes No
Yes 28 6 262.929 (1) 0.000
No 71 94
Source: Authors’ calculations.
Note: n = 1,189.
Discussion and Conclusion
Our fi ndings clearly indicate that some irregular migrants send remittances to their
countries of origin. Although they are a small group of people within our total sample,
they are clearly distinct in terms of age, having a family member in the homeland, dura-
tion of stay, work experience, and reasons for entering Turkey.
For many respondents Turkey was an ideal destination, especially during the fi nan-
cial crisis. Th is sometimes even attracted back those who transited Turkey to go to
Europe. A Rwandan and a Senegalese immigrant, for instance, mentioned that they
came back to Turkey from Greece because, as they reported, Athens has become a city
of irregular immigrants and you cannot fi nd employment there (see also Hürriyet 2011).
Our interviews with some irregular migrants show that they were aff ected negatively
by the fi nancial crisis in 2008 and 2009, and therefore they decided to leave their coun-
tries. On the other hand, based on our data, it is diffi cult to say that the fi nancial crisis
aff ected remittance-sending habits of irregular migrants.
Most male irregular migrants work in industry and the construction sector, whereas
female irregular migrants usually fi nd jobs as housekeepers or babysitters. Th ese jobs do
not come with high earnings, and thus remittances are sometimes small; nevertheless,
many migrants will try to send home as much of their remaining earnings as possible.
Th eir remittance habits are related to whether they work and make money. When they
can make money, many send it because they have to take care of people back in their
homeland. Remittances usually go to family members (usually to children and wives),
while some send money to pay their accumulated debts in their homelands. Only a few
irregular migrants send their earnings home to make investments.
As we have mentioned, studies of irregular migration involving interviews and/or sur-
veys need to be treated cautiously. Th is particular type of human mobility is the most dif-
fi cult to capture in statistics and equally diffi cult to capture in qualitative studies because
of its nature and the risks and fears of migrants. Financial behavior is in itself a diffi cult
subject to study because in many cultures it is not so common to disclose earnings or any
details of monetary aff airs. Revealing such information to an outsider or as in our case in
the context of an irregular migrant removal center is even more diffi cult. Th e results and
interpretation might have been completely diff erent if the study had been carried out in
another context and by another team of researchers. Th us refl exivity of the context and
researchers must be kept in mind in interpreting the fi ndings of this study.


PART VI


315
Chapter 25
Labor Migration, Overseas Remittances, and Local Outcomes in the Contemporary Philippines
TY MATEJOWSKY
Few countries today are more closely associated with an entrenched economic
dependence on the deployment of contract labor abroad and the infusion of overseas
remittances than the Philippines (DeParle 2010). For the state, labor emigration has
emerged as an indispensible source of hard foreign currency that, since the 1970s, has
done much to keep the national economy afl oat and ameliorate socioeconomic condi-
tions by alleviating chronic under- and unemployment problems and contributing to
the rise of a consumer-oriented middle class.
Th is market alignment has, less favorably, impeded the development of a sound
domestic economy, leaving the country exposed to global market fl uctuations and pro-
moting a trend of “brain drain” whereby highly skilled and educated Filipino workers
seek more fi nancially remunerative employment opportunities internationally. Notably,
the Philippines is currently experiencing a signifi cant manpower shortage in its educa-
tion and health care sectors because thousands of teachers and medically trained physi-
cians have left their respective professions to take advantage of in-demand nursing jobs
in North America, East Asia, and elsewhere across the global North (Teves 2005).
Notwithstanding these problematic dimensions, policy makers have consistently
favored exporting labor overseas above local job creation as a way to generate sus-
tained economic growth. By 2010 nearly one-tenth of the nation’s population of nearly
100 million were either living or working abroad. Th e amount of dollars sent home by
overseas Filipino workers (OFWs), which represent approximately 13.5 percent of the
316 l TY MATEJOWSKY
country’s gross domestic product, has more than doubled from $7.6 billion to $17.3 bil-
lion between 2003 and 2009 (Onishi 2010). Th e Philippines would be unable to main-
tain recent levels of market expansion without these vital income streams. Th eoreti-
cally, such fi nancial linkages remain relatively fragile and reversible because they are so
closely wedded to the economic performance of OFW host countries.
Beyond its economic implications, the continued outfl ow of labor overseas also has
important social dimensions because it signifi cantly informs Filipinos’ sense of national
identity (Perlez 2002). Dependence on OFWs reinforces popular stereotypes of Fili-
pinos as not only tenacious and resourceful when it comes to confronting adversity
but also remarkably selfl ess in contributing to the welfare of family and community.
Such sentiments are refl ected in government public relations eff orts that urge Filipi-
nos to view their compatriots abroad as the nation’s “new heroes” (Rafael 1997). Less
positively, this reliance on OFWs and their remittances highlights the state’s profound
inability to meet many of its obligations to citizens. Th is failure to provide adequate
domestic employment opportunities, in turn, instills little public confi dence in state
institutions and leaders (Aguilar 1996).
At the household level, overseas contract work demands considerable sacrifi ce on
the part of workers and their dependents. Th e emotional anxieties of family separation,
spousal fi delity, tenuous social support networks within receiving countries, and pos-
sible exploitation by job contractors, travel agents, and foreign employers are just some
of the hardships OFWs face. Perhaps more troubling, the absence of a parent, spouse, or
other valued household member does much to disrupt traditional patterns of domestic
stability and community life (Assis 1995). In fact, the number of Filipinos growing up
with at least one parent working abroad reached nearly 6 million in 2008 (Conde 2008).
Many of these children, although now better materially provided for, fail to develop
deep emotional ties with their absent OFW parent. Th e sporadic presence of a mother
or father in their sons’ or daughters’ lives not only places the burden of child rearing on
the remaining spouses, grandparents, or more extended kin, but also works to compli-
cate existing intrafamilial relations.
I witnessed such complexities fi rst hand while living with a Filipino family during
the late 1990s in Dagupan City, Pangasinan. Th e unmarried and childless household
head, then in her early fi fties, ended up raising her niece (born out of wedlock) while
the girl’s mother worked as a hired domestic, fi rst, in Hong Kong and then, years later,
in the Middle East. Although such familial arrangements are traditionally rather com-
mon in the Philippines, this particular setup complicated issues between the sisters
about parental discipline, authority, and allegiance. Such confl ictive dimensions placed
additional stress on the sisters’ relationship that became particularly acute, especially
for the niece, when her mother returned to the Philippines for a few weeks’ vacation.
Over time, the girl’s mother assumed only a secondary role in her daughter’s life that
continued throughout adolescence and young adulthood.
Despite these hardships, most OFWs maintain, if not an emotional presence, then
certainly an infl uence within their respective households as breadwinners despite

25. PHILIPPINES: LABOR MIGRATION, OVERSEAS REMITTANCES, AND OUTCOMES l 317
remaining away for months or years at a time. Workers are able to bridge this distance
primarily through income remittances that augment domestic budgets and expand the
fi nancial prospects of relatives and dependents. Signifi cantly, the fl ow of remittances
back home contributes to a transformation in the social and material character of many
local neighborhoods. Most OFW homes stand in appreciable contrast to those of their
neighbors in terms of architectural character and material trappings. In areas where
most houses are modest, if not austere, these larger domiciles are typically set behind
privacy walls and feature modern amenities such as air conditioning, Internet access,
cable television, and fl oor plans that by local standards are quite luxurious. Similarly, in
neighborhoods where residents commonly depend on jeepneys (jeeps converted into
minibuses) as their basic mode of transport, it is not uncommon to fi nd one or two
private automobiles parked outside these homes.
In essence, this cycle of overseas labor migration and income remittances represents
nothing if not a practical response to the state’s inability to create adequate employ-
ment opportunities at home. Filipinos are willing to take on the risks of working abroad
because it remains one of the few avenues available to natives toward generating income
and upward mobility. Even as the global economic downturn continues to wreak havoc
on world markets, the deployment of laborers from the Philippines carries on unabated.
Most OFW households remain largely shielded from the crisis’s more adverse eff ects as
the amount of money remitted home trends increasingly upward (DeParle 2010).


319
Chapter 26
The New Zealand–Pacifi c Remittance Corridor: Lowering Remittance Costs
DON ABEL AND KIM HAILWOOD
Remittances are a key factor in Pacifi c island countries, representing 12 percent
of gross domestic product (GDP) on average, yet the Pacifi c region has some of the
highest remittance fees in the world.
To address this issue of remittance fees, in June 2007 the World Bank’s Pacifi c offi ce
convened a high-level public-private stakeholder meeting in Sydney, attended by the
Central Banks of Australia, Fiji, New Zealand, Samoa, and Tonga as well as executives
from the primary remittance service providers in the region. Th e meeting recorded that
although remittance fees were trending downward in other parts of the world, rates
being charged in the Pacifi c were unreasonably high. At that time, remittance providers
were routinely charging 15–25 percent of the value of the transaction and sometimes
even more.
Th is meeting marked the beginning of the New Zealand–Pacifi c Remittance Project,
a project that over the next three years would be responsible for reducing the cost of
sending money between New Zealand and Pacifi c island countries. Th e purpose of this
case study is to record how this was achieved—what worked and what did not.
Background
Although individual remittances from New Zealand to Pacifi c island countries are
often relatively small sums—a few hundred dollars sent home each month—the market
as a whole is far from “low value.” Remittances to the Pacifi c region (principally from

320 l DON ABEL AND KIM HAILWOOD
Australia, New Zealand, and the United States) are estimated by the World Bank to be
worth over $470 million annually (World Bank 2010c). Th is estimate does not capture
payments made through informal, unrecorded channels. Th e World Bank (2006b) notes
this could add at least another 50 percent to the offi cial estimate.
Most Pacifi c island economies are dependent on remittances as an important source
of household income and foreign exchange. Samoa and Tonga are among the top 10
global recipients of migrant remittances as a share of GDP (World Bank 2010d). As well
as providing income directly to households to improve living standards, remittances
are an important source of current account fi nancing, enabling higher levels of imports,
which contribute to macroeconomic stability (Browne and Mineshima 2007).
In Samoa and Tonga remittances far surpass offi cial development assistance receipts.
In these countries, remittances exceed a fi fth of GDP (World Bank 2010c). New Zealand
is a key source of remittances for both countries. Th e simple model of sending money
home has enabled a whole industry to grow and prosper on the back of transacting
remittances.
According to Gibson, McKenzie, and Rohorua (2006) the high transactional costs of
Pacifi c remittances cannot be justifi ed in terms of scale. Th ey analyzed two non-Pacifi c
countries (Ghana and Mozambique) with scales of remittances similar to the New Zea-
land–Tonga corridor. Both African countries had substantially lower money transfer
fees, and the transaction could be completed at one-third of the cost.
Th e impact of the fees charged on remittances can be dramatic, particularly in rela-
tion to the small amounts sent, the purchasing power in the receiving country, and
the typically lower incomes of New Zealand family members sending the money. Any
decrease in remittance costs would result in more money remaining in the pockets of
Pacifi c peoples. It is estimated that remitters to the Pacifi c may face additional charges
of up to $90 million in remittance fees each year—equaling 20 percent of the total
amount formally remitted in 2008 (Luthria 2009).1
Th e World Bank’s 2006 Global Economic Prospects highlighted three strategies for
lowering the cost of remittances: promoting competition, improving migrants’ access
to the fi nancial system, and disseminating information.
In 2007 the Reserve Bank of New Zealand established the cross-government New
Zealand–Pacifi c Remittance Project, which included representatives from the New
Zealand Ministry of Pacifi c Island Aff airs and the Ministry of Foreign Aff airs and Trade
(which manages the New Zealand Aid Programme), in cooperation with the World
Bank. Th e project’s goals were to reduce the total transaction cost of remittances to
between 5 and 7 percent by encouraging competition (including access to banking
products and services), by promoting transparency and fee disclosure, and by building
fi nancial awareness.
Initially the project was hampered by the lack of remittance data needed to assist
policy makers and to inform potential market entrants. By working with the Samoan
and Tongan Central Banks, however, and using the seminal paper of Gibson, McKenzie,
and Rohorua (2006), suffi cient information was gathered to make a start.
26. THE NEW ZEALAND–PACIFIC REMITTANCE CORRIDOR l 321
Competing Financial Services
Australian banks dominate the fi nancial markets in Pacifi c island countries. Although
these Pacifi c island–domiciled banks have sustained high levels of profi tability over the
past decade—30–40 percent return on equity—they have not been signifi cant competi-
tors in the provision of household remittance services.
A key objective of the New Zealand–Pacifi c Remittance Project was to encourage
a New Zealand–based Australian bank to compete eff ectively in the New Zealand–
Pacifi c remittance corridor through using inexpensive electronic means.
In reviewing the electronic card market it was clear that cross-border transactions
could be and were being made using these means without any oversight by authori-
ties. Although the potential money launderer could use this method with impunity,
the genuine, hardworking family member was forced to send small amounts of money
home through traditional banking channels at considerable cost. Th e apparent barriers
to banks developing electronic cards to remit funds across borders were the regulations
for anti–money laundering (AML) and countering the fi nancing of terrorism (CFT).
Th e product identifi ed by New Zealand–based banks as most easily deployed to
achieve low-cost remittances was a card facility using the banking system’s interna-
tional ATM and EFTPOS networks. To encourage such product development required
a change to AML/CFT legislation in New Zealand, and, consequently, the Financial
Transactions Reporting (Interpretations) Regulation was implemented in 2008.
A New Zealand–domiciled Australian bank was the fi rst fi nancial institution to take
advantage of the regulatory change with the launch of a new card facility in 2008. Th is facil-
ity allowed funds to be loaded onto a special remittance card account by a New Zealand–
based remitter, while a second card was issued remotely to an overseas resident, which
allowed money to be withdrawn in the overseas country through the ATM and EFTPOS
networks. Th e facility had to operate within tightly specifi ed parameters, including moni-
toring on a daily basis. Th is meant that the opportunity for abuse was mitigated eff ectively.
Th e remittance card was judged by a New Zealand weekly newspaper as the best
new banking product of the year in a 2009 business feature article. Simultaneously a
website (www.SendMoneyPacifi c.org) was developed, cofunded by Australian and New
Zealand governmental aid agencies, to allow remitters to compare the costs of sending
money through various providers from Australia and New Zealand to Pacifi c island
countries. Th e website was accredited as meeting the World Bank’s standards for remit-
tances databases in 2010.
In part, high fees are the result of a lack of competitive pressure, with operators in
the marketplace able to “hide” the real costs of remitting money home in complex fee
structures. And, in part, high fees have been driven by regulatory costs imposed by cus-
tomer identifi cation and verifi cation requirements. With the introduction of the Finan-
cial Transactions Reporting (Interpretations) Regulation, increased competition from
a new remittance product, and transparency in the market from information provided
via the SendMoneyPacifi c website, costs began to fall.
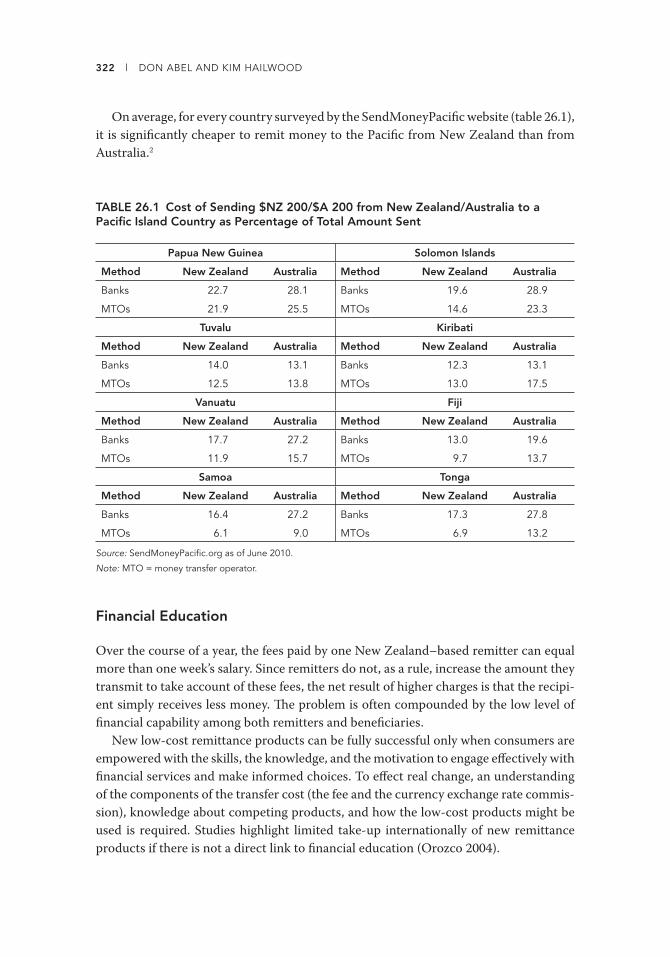
322 l DON ABEL AND KIM HAILWOOD
On average, for every country surveyed by the SendMoneyPacifi c website (table 26.1),
it is signifi cantly cheaper to remit money to the Pacifi c from New Zealand than from
Australia.2
TABLE 26.1 Cost of Sending $NZ 200/$A 200 from New Zealand/Australia to a Pacifi c Island Country as Percentage of Total Amount Sent
Papua New Guinea Solomon Islands
Method New Zealand Australia Method New Zealand Australia
Banks 22.7 28.1 Banks 19.6 28.9
MTOs 21.9 25.5 MTOs 14.6 23.3
Tuvalu Kiribati
Method New Zealand Australia Method New Zealand Australia
Banks 14.0 13.1 Banks 12.3 13.1
MTOs 12.5 13.8 MTOs 13.0 17.5
Vanuatu Fiji
Method New Zealand Australia Method New Zealand Australia
Banks 17.7 27.2 Banks 13.0 19.6
MTOs 11.9 15.7 MTOs 9.7 13.7
Samoa Tonga
Method New Zealand Australia Method New Zealand Australia
Banks 16.4 27.2 Banks 17.3 27.8
MTOs 6.1 9.0 MTOs 6.9 13.2
Source: SendMoneyPacifi c.org as of June 2010.
Note: MTO = money transfer operator.
Financial Education
Over the course of a year, the fees paid by one New Zealand–based remitter can equal
more than one week’s salary. Since remitters do not, as a rule, increase the amount they
transmit to take account of these fees, the net result of higher charges is that the recipi-
ent simply receives less money. Th e problem is often compounded by the low level of
fi nancial capability among both remitters and benefi ciaries.
New low-cost remittance products can be fully successful only when consumers are
empowered with the skills, the knowledge, and the motivation to engage eff ectively with
fi nancial services and make informed choices. To eff ect real change, an understanding
of the components of the transfer cost (the fee and the currency exchange rate commis-
sion), knowledge about competing products, and how the low-cost products might be
used is required. Studies highlight limited take-up internationally of new remittance
products if there is not a direct link to fi nancial education (Orozco 2004).

26. THE NEW ZEALAND–PACIFIC REMITTANCE CORRIDOR l 323
Programs that promote fi nancial capability within the Pacifi c remain on a passive
footing. Th ere is a gap in the provision of relevant, easy-to-access fi nancial information
and advice to help Pacifi c peoples, which is impartial, jargon free, not geared to sell
products, and tailored to their personal circumstances.
Th e second phase of the project, MoneyPACIFIC, began in 2009 with the goal of pro-
viding targeted fi nancial education to Pacifi c peoples in New Zealand and the Pacifi c
region, contributing to a long-term vision of better-informed and more confi dent citi-
zens, able to take advantage of increased competition and choice in the fi nancial sector.
MoneyPACIFIC is directed at building awareness, engagement, and confi dence. Th e
MoneyPACIFIC “brand” consists of a simple logo and a tag line “Financial care is being
aware.” It has a clear terminology link to the SendMoneyPacifi c website.
Th e fi rst MoneyPACIFIC initiative was to produce 35,000 bilingual wall calendars
for Pacifi c households in New Zealand, Samoa, and Tonga, incorporating fi nancial tips
and information relating to the cost of remitting money. Th e 2010 calendars were made
available through schools, churches, and community groups. Following the success of
the fi rst calendar, the print run for the 2011 calendar was doubled to 70,000. Th e Cen-
tral Banks in Samoa and Tonga were key partners in this work.
Th e original proposal was to distribute an A4-sized information sheet on remit-
tances and other fi nancial issues. However, once a piece of paper has been read, it is
easily discarded. It was agreed that with monthly Pacifi c photo shots, a calendar would
be a permanent fi xture in the homes of Pacifi c families. Th e benefi t was that the calen-
dar would be in the household for a year and referenced mainly by mothers, who largely
manage the household and family fi nances.
Th e fi nancial tips in the calendar are being expanded through a public awareness
campaign that focuses on remittances and the teaching of good money skills to chil-
dren. To date these messages have been transmitted on Pacifi c radio stations in New
Zealand.
Initial outreach work conducted within the New Zealand Tongan community points
to this population becoming more aware of diff erent remittance options and the ben-
efi ts of shopping around since the introduction of the two-card remittance facility, the
SendMoneyPacifi c website, and the MoneyPACIFIC calendar (Developing Markets
Associates 2010, as cited in Australia and New Zealand 2010).
What Has Been Achieved, What Did Work, and What Did Not
Th e introduction of the remittance card increased competition in the New Zealand–
Pacifi c corridor, placing pressure on other operators to protect their market share by
reducing costs below the 7 percent targeted by the New Zealand–Pacifi c Remittance
Project. Surprisingly, though, and against expectations, the two-card remittance prod-
uct was not adopted in Australia nor was it widely publicized in Pacifi c island coun-
tries. Consequently, the costs of remitting funds from Australia and New Zealand have

324 l DON ABEL AND KIM HAILWOOD
diverged widely with, for example, the average cost for a person remitting from Austra-
lia to Samoa currently almost twice that from New Zealand.
Th is points to the importance of political engagement on the issue of the cost of
remittances. Both the Australian and New Zealand governments have a keen wish to
see these costs reduced for Pacifi c island communities, and there is a strong trans-
Tasman initiative to meet this objective. In addition, South Pacifi c economic min-
isters and Central Bank governors have agreed that they need to play a leading role
in advocating the importance of fi nancial education and to drive collective national
actions to achieve a strong focus on fi nancial capability within the Pacifi c region. A
set of MoneyPACIFIC goals were agreed on in 2009 by the Pacifi c Islands Forum eco-
nomic ministers to strengthen fi nancial capability in the Pacifi c region over the coming
decade. Th ey include goals on fi nancial education, access to basic fi nancial services,
and consumer protection. Despite a relatively limited budget, the New Zealand–Pacifi c
Remittance Project worked because it brought together a range of public sector institu-
tions (including the World Bank) and private sector interests that jointly believed the
cost of remitting funds to Pacifi c island countries was unnecessarily high. Th eir com-
bined eff ort meant that change became inevitable.
Notes
1. A further impetus to look at remittance costs in New Zealand arose from the temporary
worker migration program: the Recognised Seasonal Employer Scheme. Th is program,
which began in 2007, each year draws up to 8,000 workers to New Zealand, predominantly
from Pacifi c island nations, to work in the horticulture and viticulture sectors. Th eir earn-
ings are often sent home as remittances or repatriated savings.
2. A comparable trans-Tasman cost disparity can also be seen in the World Bank’s Remittance
Prices Worldwide database.
325
Chapter 27
Role of Trade Openness, Remittances, Capital Infl ows, and Financial Development in Vanuatu
RONALD R. KUMAR
Vanuatu, one of the developing Pacifi c island countries (PICs), has a population
of about 240,000, which is growing at a rate of 2.5 percent per year. However, despite
the worldwide adverse impact of the global fi nancial crisis, the economy has been rela-
tively less aff ected. Agriculture is the main driver of the economy; however, in terms
of revenue infl ows, the tourism sector stands out in addition to remittance infl ows in
gaining momentum (ADB 2009b, 2009c; Bedford 2010; Bedford, Bedford, and Ho 2010;
Economic Intelligence Unit 2009).
In this chapter, a macrolevel investigation is carried out to determine the nexus
between remittances, trade openness, fi nancial development, foreign direct invest-
ment, foreign aid, and income.
Inward remittances have surpassed offi cial development assistance of developing
countries (fi gure 27.1) and have been growing substantially despite the worldwide eco-
nomic crisis aff ecting most of the remittance sending countries (WDI 2009).
Remittances, when spent, among other things, on housing, sanitation, health care,
food, and schooling, result in improvements in welfare and human capital, which in
turn have the possibility to increase productivity, freedom of choice, and capacity to
participate in public debate and reduce poverty (Buch and Kuckulenz 2010; De Haas
2005; Maclellan and Mares 2005; Ratha 2007; Sen 1999), besides providing “buff er cash”
during economic crises and natural disasters (Browne and Leeves 2007; UN ESCAP
2007).

326 l RONALD R. KUMAR
A substantial body of literature exists on how fi nancial sector development (Beck,
Levine, and Loayza 2000; King and Levine 1993; Levine, Loayza, and Beck 2000),
trade liberalization (Kar, Peker, and Kaplan 2008; Wacziarg and Welch 2008; Winters,
McCulloch, and McKay 2004), remittance infl ows (Jayaraman, Choong, and Kumar
2009, 2010a, b), and foreign direct investment vis-à-vis developed fi nancial markets
(Alfaro and others 2010) promote economic growth. On the other hand, Shleifer (2009)
and Bowman and Chand (2007) are skeptical of aid having any signifi cant eff ect on
growth.
Recent Trends in Remittance Infl ows
Vanuatu, whose key indicators are given in table 27.1, has a relatively high infl ow of
remittances in absolute terms, particularly in the early period of 1980–2004. However,
the country has since experienced a decline and leveled off to about $7 million in 2009
(table 27.2).1 On average, before 2005, remittances were at about $14 million. Th e trend
in remittances is also supported by the high amount of out-migration (table 27.3).
Vanuatu’s fi nancial sector includes the Reserve Bank of Vanuatu and four main com-
mercial banking institutions (table 27.4).
Findings
Th e study looks into the nexus between remittances, trade openness, capital fl ows, and
economic activities over a 28-year period (1981–2009). Table 27.5 presents the data
used in the study.
FIGURE 27.1 Remittance and Capital Flows to Developing Countries, 1990–2009$,
bill
ions
0
100
200
300
400
500
600
1990 1992 1994 1996 1998 2000 2002 2004 2006 2008
portfolio equity and private nonguaranteeed external debtremittances
official development assistance
foreign direct investment
Sources: WDI 2009, World Bank 2006b, 2008, 2009d.

27. VANUATU: TRADE, REMITTANCES, CAPITAL INFLOWS, FINANCIAL DEVELOPMENT l 327
TABLE 27.1 Vanuatu: Selected Key Indicators
Indicator Value
Land area (square kilometers, thousands) 12.2
Population, 2010 (thousands) 239.8
Population growth, 2008 (%) 2.5
Per capita GDP current prices, 2007 ($) 2,712.6
Aid per capita, 2008 ($) 396.1
Aid as percentage of GNI, 2001–08 11.5
Annual average growth rate, 2001–09 (%) 3.3
Annual average infl ation (CPI), 2001–08 (%) 2.8
Fiscal balance of central government, 2001–07 (% of GDP) −0.4
Current account balance, 2001–07 (% of GDP) −5.7
Rural population as percentage of total population (2008) 75.2
Sources: ADB 2009a, UN ESCAP 2007, WDI 2009.
Note: Interval periods are averages calculated by the author. CPI = consumer price index; GDP = gross domestic product; GNI = gross national income.
TABLE 27.2 Pacifi c Island Countries: Remittances, 1970–2009
Year
Fiji KiribatiPapua New
Guinea SamoaSolomon Islands Tonga Vanuatu
$, mil.
% of GDP
$, mil.
% of GDP
$, mil.
% of GDP
$, mil.
% of GDP
$, mil.
% of GDP
$, mil.
% of GDP
$, mil.
% of GDP
1970–74 — — — — — — — — — — 2 7.5 — —
1975–79 4 0.5 2 4.5 10 0.6 10 13.2 — — 6 16.4 — —
1980–84 8 0.7 2 6.9 5 0.2 19 19.0 — — 10 16.5 8 7.0
1985–89 26 2.2 4 15.8 9 0.3 34 33.8 — — 19 22.5 8 6.0
1990–94 24 1.6 6 19.3 17 0.4 37 28.1 — — 21 15.4 12 6.4
1995–99 30 1.5 7 15.2 13 0.3 44 19.6 2 0.6 61 37.7 22 8.3
2000–04 73 3.6 7 13.3 11 0.3 54 18.9 4 1.6 61 37.7 22 8.3
2005 184 6.2 7 11.4 13 0.3 110 25.9 7 2.4 66 30.6 5 1.4
2006 165 5.2 7 11.3 13 0.2 108 24.0 20 6.0 72 30.5 5 1.2
2007 165 4.8 7 9.0 13 0.2 120 22.9 20 5.1 100 39.6 6 1.1
2008 175 4.7 9 10.7 13 0.2 135 24.0 20 4.8 100 36.9 7 1.2
2009 119 3.9 9 6.7 13 0.2 131 26.5 2.4 0.4 91 29.1 7 1.1
Source: WDI 2009, World Bank 2009d.
Note: The fi ve-year intervals are averages calculated by the author. — = not available.

328 l RONALD R. KUMAR
It is hypothesized that the variables used in the study will have a positive eff ect on
income. Using the conventional Cobb-Douglas production function, with the Hicks-
neutral technical progress, the per worker output (yt) is defi ned as
yt = A
t k
tα , 0 < α < 1, (27.1)
where A = stock of technology, k = capital per worker, and α is the profi t share.
It is also plausible to assume for our purposes that
At
=f (T, REM, TR, FIN). (27.2)
TABLE 27.3 Demographic Profi le of Vanuatu
Year Net migrationPopulation
growth rate (%)Population (10-year average, thousands)
Remittances ($, millions)
1961–70 3,182 3.0 73.5 —
1971–80 3,540 3.1 99.6 —
1981–90 2,455 2.4 130.8 8.2
1991–2000 1,508 2.4 169.9 20.0
2001–05 1,038 2.5 199.8 14.2
2006 — 2.6 216.4 5.0
2007 — 2.6 222.2 5.5
2008 — 2.5 228.0 7.0
2009 — 2.5 233.9 6.9
2010 814a 2.5 239.9 —
Source: United Nations, Department of Economic and Social Affairs, Population Division 2009.
Note: — = not available.
a. Indicates the average for 2006–10 from the database. All fi gures for interval years for other variables are averages calculated by the author.
TABLE 27.4 Commercial Financial Institutions in Vanuatu
Type of institutionNumber of institutions
Assets (billions of vatu)
Assets as % of GDP
% of total assets held
Commercial banks (total) 5 43.1 147.2 11.2
State-controlled 1 2.7 8.5 0.7
Offshore banks 36 337.5 1,061.3 87.8
Insurance companies 3 0.5 1.6 0.1
Pension funds 1 3.1 9.7 0.8
Total 45 384.2 1,219.8 100.0
Source: Jayaraman and Choong 2010: 8.
Note: GDP = gross domestic product.
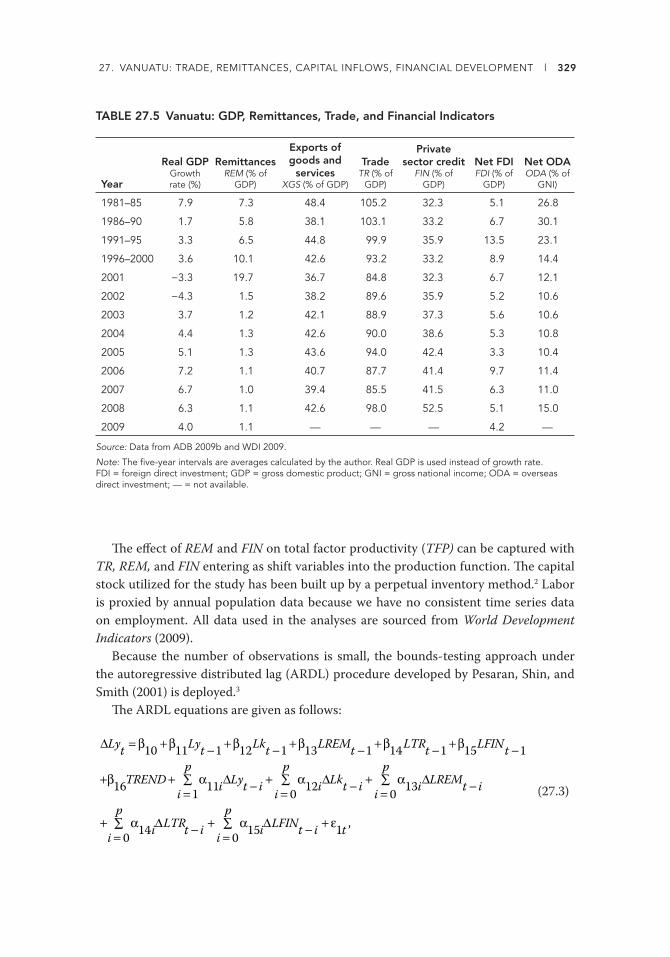
27. VANUATU: TRADE, REMITTANCES, CAPITAL INFLOWS, FINANCIAL DEVELOPMENT l 329
TABLE 27.5 Vanuatu: GDP, Remittances, Trade, and Financial Indicators
Year
Real GDPGrowth rate (%)
RemittancesREM (% of
GDP)
Exports of goods and
servicesXGS (% of GDP)
TradeTR (% of
GDP)
Private sector credit
FIN (% of GDP)
Net FDIFDI (% of
GDP)
Net ODAODA (% of
GNI)
1981–85 7.9 7.3 48.4 105.2 32.3 5.1 26.8
1986–90 1.7 5.8 38.1 103.1 33.2 6.7 30.1
1991–95 3.3 6.5 44.8 99.9 35.9 13.5 23.1
1996–2000 3.6 10.1 42.6 93.2 33.2 8.9 14.4
2001 −3.3 19.7 36.7 84.8 32.3 6.7 12.1
2002 −4.3 1.5 38.2 89.6 35.9 5.2 10.6
2003 3.7 1.2 42.1 88.9 37.3 5.6 10.6
2004 4.4 1.3 42.6 90.0 38.6 5.3 10.8
2005 5.1 1.3 43.6 94.0 42.4 3.3 10.4
2006 7.2 1.1 40.7 87.7 41.4 9.7 11.4
2007 6.7 1.0 39.4 85.5 41.5 6.3 11.0
2008 6.3 1.1 42.6 98.0 52.5 5.1 15.0
2009 4.0 1.1 — — — 4.2 —
Source: Data from ADB 2009b and WDI 2009.
Note: The fi ve-year intervals are averages calculated by the author. Real GDP is used instead of growth rate. FDI = foreign direct investment; GDP = gross domestic product; GNI = gross national income; ODA = overseas direct investment; — = not available.
Th e eff ect of REM and FIN on total factor productivity (TFP) can be captured with
TR, REM, and FIN entering as shift variables into the production function. Th e capital
stock utilized for the study has been built up by a perpetual inventory method.2 Labor
is proxied by annual population data because we have no consistent time series data
on employment. All data used in the analyses are sourced from World Development
Indicators (2009).
Because the number of observations is small, the bounds-testing approach under
the autoregressive distributed lag (ARDL) procedure developed by Pesaran, Shin, and
Smith (2001) is deployed.3
Th e ARDL equations are given as follows:
ΔLyt = β10 +β11Lyt −1 +β12Lkt −1 +β13LREMt −1 +β14LTRt −1 +β15LFINt −1
+β16TREND + α11iΔLyt − ii = 1
p∑ + α12iΔLkt − ii = 0
p∑ + α13iΔLREMt − ii = 0
p∑
+ α14iΔLTRt − ii = 0
p∑ + α15iΔLFINt − ii = 0
p∑ + ε1t ,
(27.3)

330 l RONALD R. KUMAR
ΔLyt = β10 +β11Lyt−1 +β12Lkt−1 +β13LREMt−1 +β14LTRt−1 +β15LFDIt−1
+β26TREND + α21iΔLyt−ii=0
p
∑ + α12iΔLkt−ii=1
p
∑ + α13iΔLREMt−ii=0
p
∑
+ α14 iΔLTRt−ii=0
p
∑ + α15iΔLFDIt−ii=0
p
∑ + ε1t ,
(27.4)
ΔLyt = β10 +β11Lyt−1 +β12Lkt−1 +β13LREMt−1 +β14LTRt−1 +β15LODAt−1
+β26TREND + α21iΔLyt−ii=0
p
∑ + α12iΔLkt−ii=1
p
∑ + α13iΔLREMt−ii=0
p
∑ + α14 iΔLTRt−ii=0
p
∑
+ α15iΔLODAt−ii=0
p
∑ + ε1t .
(27.5)
Two steps are used in examining the relationship between Ly, Lk, LTR, LREM, and
LFIN. First, equations (27.3)–(27.5) are estimated by ordinary least square techniques,4
and then the existence of a long-run relationship can be traced by imposing a restriction
on all estimated coeffi cients of lagged level variables equating to zero. Th e results of the
bounds test are reported in table 27.6.5
Next, the estimation of the long- and short-run equations is carried out. Th e results
are presented in tables 27.7, 27.8, and 27.9. Th e diagnostic test results indicated that
all equations performed well. In addition, the CUSUM and CUSUM of squares plot
showed that the parameters of the models are relatively stable over time.6
From table 27.7, a 1 percent change in trade liberalization (TR) contributes to about
0.8 percent change in income in the long run and about 0.3 percent in the short run.
Remittances (REM) contribute to about 0.07 percent in the long run and 0.04 percent in
the short run. However, fi nancial development (FIN), foreign direct investment (FDI),
and offi cial development assistance (ODA) are statistically not signifi cant contributors
to income.
Th e coeffi cient of the per capita capital stock, on average from tables 27.7–27.9,
which denotes the profi t share, is about 0.26 and is close to the stylized value of one-
third. Similarly, the error correction terms (ECT), an indicator for the speed of conver-
gence to long-run equilibrium, are signifi cant with correct negative coeffi cients for all
the results and on average are about −0.68.
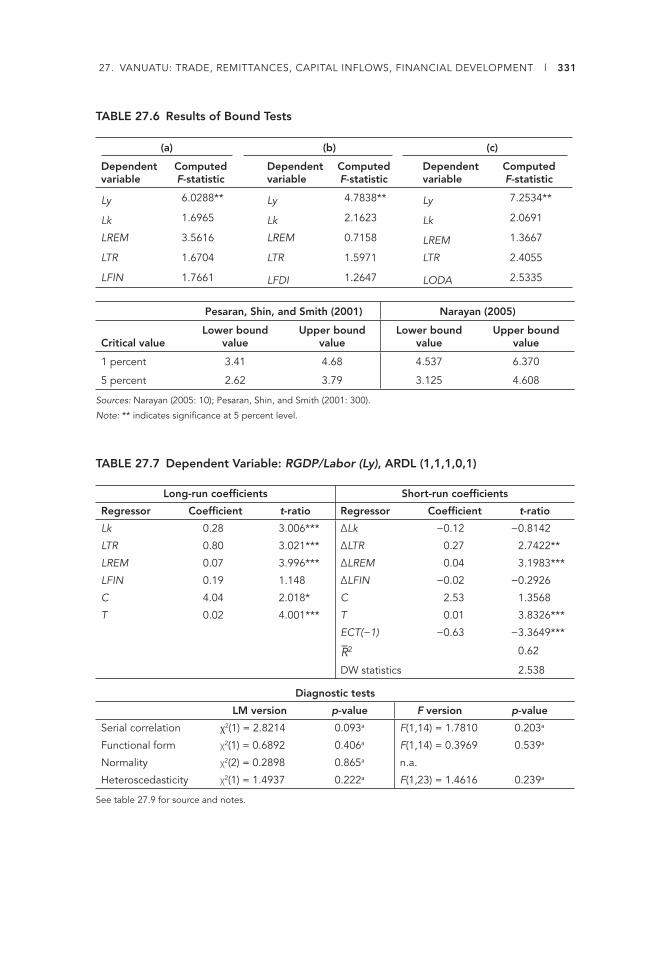
27. VANUATU: TRADE, REMITTANCES, CAPITAL INFLOWS, FINANCIAL DEVELOPMENT l 331
TABLE 27.7 Dependent Variable: RGDP/Labor (Ly), ARDL (1,1,1,0,1)
Long-run coeffi cients Short-run coeffi cients
Regressor Coeffi cient t-ratio Regressor Coeffi cient t-ratio
Lk 0.28 3.006*** ΔLk −0.12 −0.8142
LTR 0.80 3.021*** ΔLTR 0.27 2.7422**
LREM 0.07 3.996*** ΔLREM 0.04 3.1983***
LFIN 0.19 1.148 ΔLFIN −0.02 −0.2926
C 4.04 2.018* C 2.53 1.3568
T 0.02 4.001*** T 0.01 3.8326***
ECT(−1) −0.63 −3.3649***−R2 0.62
DW statistics 2.538
Diagnostic tests
LM version p-value F version p-value
Serial correlation χ2(1) = 2.8214 0.093a F(1,14) = 1.7810 0.203a
Functional form χ2(1) = 0.6892 0.406a F(1,14) = 0.3969 0.539a
Normality χ2(2) = 0.2898 0.865a n.a.
Heteroscedasticity χ2(1) = 1.4937 0.222a F(1,23) = 1.4616 0.239a
See table 27.9 for source and notes.
TABLE 27.6 Results of Bound Tests
(a) (b) (c)
Dependent variable
Computed F-statistic
Dependent variable
Computed F-statistic
Dependent variable
Computed F-statistic
Ly 6.0288** Ly 4.7838** Ly 7.2534**
Lk 1.6965 Lk 2.1623 Lk 2.0691
LREM 3.5616 LREM 0.7158 LREM 1.3667
LTR 1.6704 LTR 1.5971 LTR 2.4055
LFIN 1.7661 LFDI 1.2647 LODA 2.5335
Pesaran, Shin, and Smith (2001) Narayan (2005)
Critical valueLower bound
valueUpper bound
valueLower bound
valueUpper bound
value
1 percent 3.41 4.68 4.537 6.370
5 percent 2.62 3.79 3.125 4.608
Sources: Narayan (2005: 10); Pesaran, Shin, and Smith (2001: 300).
Note: ** indicates signifi cance at 5 percent level.
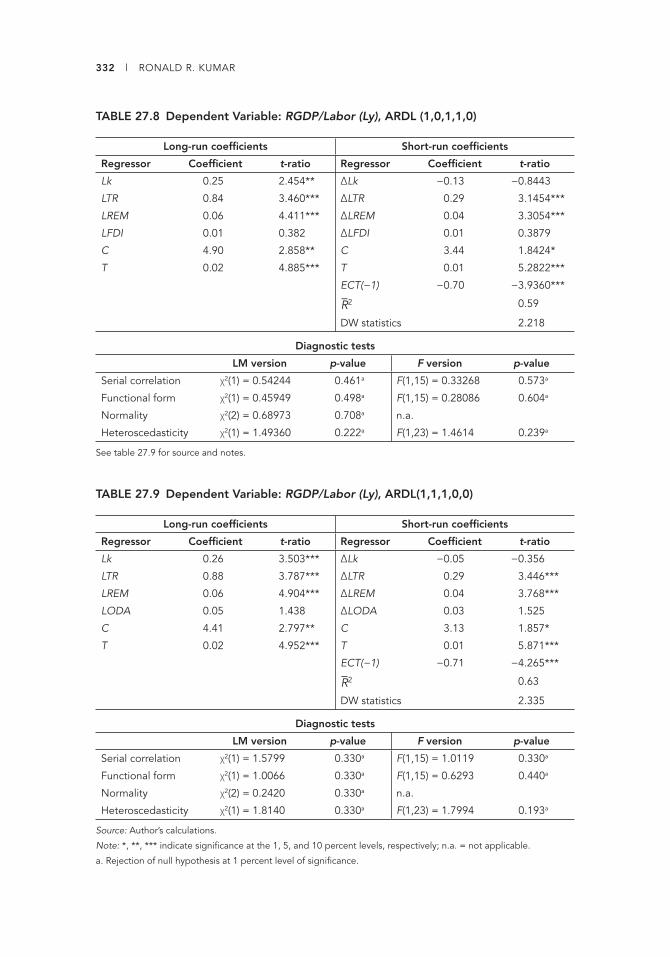
332 l RONALD R. KUMAR
TABLE 27.8 Dependent Variable: RGDP/Labor (Ly), ARDL (1,0,1,1,0)
Long-run coeffi cients Short-run coeffi cients
Regressor Coeffi cient t-ratio Regressor Coeffi cient t-ratio
Lk 0.25 2.454** ΔLk −0.13 −0.8443
LTR 0.84 3.460*** ΔLTR 0.29 3.1454***
LREM 0.06 4.411*** ΔLREM 0.04 3.3054***
LFDI 0.01 0.382 ΔLFDI 0.01 0.3879
C 4.90 2.858** C 3.44 1.8424*
T 0.02 4.885*** T 0.01 5.2822***
ECT(−1) −0.70 −3.9360***−R2 0.59
DW statistics 2.218
Diagnostic tests
LM version p-value F version p-value
Serial correlation χ2(1) = 0.54244 0.461a F(1,15) = 0.33268 0.573a
Functional form χ2(1) = 0.45949 0.498a F(1,15) = 0.28086 0.604a
Normality χ2(2) = 0.68973 0.708a n.a.
Heteroscedasticity χ2(1) = 1.49360 0.222a F(1,23) = 1.4614 0.239a
See table 27.9 for source and notes.
TABLE 27.9 Dependent Variable: RGDP/Labor (Ly), ARDL(1,1,1,0,0)
Long-run coeffi cients Short-run coeffi cients
Regressor Coeffi cient t-ratio Regressor Coeffi cient t-ratio
Lk 0.26 3.503*** ΔLk −0.05 −0.356
LTR 0.88 3.787*** ΔLTR 0.29 3.446***
LREM 0.06 4.904*** ΔLREM 0.04 3.768***
LODA 0.05 1.438 ΔLODA 0.03 1.525
C 4.41 2.797** C 3.13 1.857*
T 0.02 4.952*** T 0.01 5.871***
ECT(−1) −0.71 −4.265***−R2 0.63
DW statistics 2.335
Diagnostic tests
LM version p-value F version p-value
Serial correlation χ2(1) = 1.5799 0.330a F(1,15) = 1.0119 0.330a
Functional form χ2(1) = 1.0066 0.330a F(1,15) = 0.6293 0.440a
Normality χ2(2) = 0.2420 0.330a n.a.
Heteroscedasticity χ2(1) = 1.8140 0.330a F(1,23) = 1.7994 0.193a
Source: Author’s calculations.
Note: *, **, *** indicate signifi cance at the 1, 5, and 10 percent levels, respectively; n.a. = not applicable.
a. Rejection of null hypothesis at 1 percent level of signifi cance.

27. VANUATU: TRADE, REMITTANCES, CAPITAL INFLOWS, FINANCIAL DEVELOPMENT l 333
Conclusions
While reemphasizing the importance of remittances and trade liberalization in a small
and developing economy such as Vanuatu,7 for policy purposes vis-à-vis growth and
development, the following steps are proposed:
Benefi ts from seasonal employment schemes need to be maximized and thus require
that remittances transferred back home be cost eff ective, appropriate sociocultural pol-
icies and trainings should be in place for villages and communities to make the best
use of the remittances, and a consistent work-ready pool of migrant labor needs to be
available on demand.
Barriers to trade need to be minimized with emphasis on developing tourism and
eff ective negotiation along sectoral lines under mode 4 of the General Agreement on
Trade in Services, which covers services provided through temporary movement of
natural persons to another country.
Opening up small bank branches in the islands, providing competitive interest rates,
facilitating small loans, and investing in microfi nance and savings will ensure eff ective
channeling of remittances to productive use. Further, resources committed to improv-
ing the economy’s infrastructure, options to minimize unnecessary overhead, and
ensuring that fi nancial institutions are closely linked with capital investment initiatives
are equally important.
Management of and channeling donor (aid) -initiated projects need to be assessed
critically while strengthening the institutional framework for long-term sustainability
of the key drivers of the economy.
Notes
1. Other PICs have recorded relatively high infl ows of remittances as well (table 27.2).
2. Capital stock is computed using the perpetual inventory method, with investment proxied
by gross fi xed capital formation at constant 1983 prices, initial capital stock two times the
1983 real GDP, and a depreciation rate of 5 percent.
3. Th e unit root test was also carried out using ADF and Phillips-Perron statistics.
4. Other equations are not provided to save space but were investigated during the analysis.
5. Th e interaction between FIN and shift variables (ODA, REM, and TR) could not be explored
in the study because of the small sample size and multicollinearity problems.
6. Th e CUSUM and CUSUM of squares plots are not reported to conserve space. However, the
results are available on request.
7. Th e results, however, cannot be generalized for all PICs.


PART VII


337
Chapter 28
Remittances to Sub-Saharan Africa in the Wake of a Financial Crisis: Source of Resilience or Vulnerability?
WIM NAUDÉ AND HENRI BEZUIDENHOUT
Over the last years, the stock of migrants worldwide has increased from 84 mil-
lion in 1970 to over 194 million by 2005, and the value of remittances in dollars rose from
$2 billion in 1970 to more than $433 billion in 2008. Th e growth rate of out-migration
from Sub-Saharan Africa (SSA) countries has been the highest in the world in recent
years (Naudé 2010). Before, during, and after a fi nancial crisis, remittances can improve
resilience in receiving countries by allowing households to diversify income sources,
to continue investment in human capital formation, to smooth consumption, and to
encourage entrepreneurial activity (Naudé 2009).
Th e question is how responsive are remittances to, and in which manner are remit-
tances aff ected by, global fi nancial crises? Do fi nancial crises reduce the potential of
remittances to build household resilience? In this study we investigated these questions
using data on 23 SSA countries over the period 1980–2008. We look at how remittances
have responded to fi nancial crises in the past so as to determine whether they are a
source of resilience or perhaps of vulnerability.
During such crises, remittances to SSA can be a source of resilience or of vulner-
ability. Th e continent is more dependent than any other region on aid (offi cial develop-
ment assistance) and the second most on remittances. Taken together—foreign direct
investment (FDI), aid, remittances, and portfolio outfl ows—the amount of fi nancial
resources at risk to Africa from a global fi nancial crisis has been estimated at approxi-
mately 12–15 percent of Africa’s gross domestic product (GDP).

338 l WIM NAUDÉ AND HENRI BEZUIDENHOUT
Th e 2008–09 global economic crisis was not the fi rst external globally synchronized
economic shock to Africa. “Synchronized” or “systemic” global economic shocks can
be defi ned as when 10 or more of the world’s advanced economies are simultaneously
in a recession. Th ree years before 2009 saw 10 or more of the 21 advanced economies
simultaneously in recession: 1975, 1980, and 1992 (IMF 2009a). SSA growth subsequently
declined with the exception of the 1980 recession. Th e 1992 recession was also accompa-
nied by fi nancial crises in advanced economies. Th e synchronization between contrac-
tions in global and African growth appears to be more severe from the 1990s onward.
Remittances can be an important resource to build resilience before, during, and
after various crises as well as reduce poverty (Nagarajan 2009). In countries such as
Uganda, remittances are said to have taken one in 11 people out of poverty (Ratha,
Mohapatra, and Plaza 2008). Remittances have been found to be countercyclical, unlike
other capital fl ows that are largely procyclical. Th ey are also viewed as more benefi cial
because they are not “tied” (Straubhaar and Vadean 2005), do not require the repay-
ment of interest (Calì and Dell’ Erba 2009), and do not decline during crises (Nagarajan
2009).1 Th e question is whether remittances to SSA will increase, remain constant, or
decline following a fi nancial crisis.
A recent overview of the impact of global fi nancial crises on remittances is pro-
vided by Calì and Dell’Erba (2009). Th eir paper presupposes that the primary impact
of a global fi nancial crisis would be to reduce remittances to developing countries.
Th e channels through which remittances would be reduced would be through (1) a
reduction in migration from developing to developed countries, in the light of reduced
opportunities, (2) a negative income shock suff ered by migrants, and (3) a reduction in
the amount of money remitted per migrant. Th e extent of this will be country specifi c,
depending on how that host country has been aff ected and which sectors have been
aff ected. According to Nagarajan (2009), migrants employed in construction, manu-
facturing, fi nance, services, retail, and tourism sectors are most exposed. In contrast,
Calì and Dell’Erba (2009: 6) give the example of the Philippines, where many migrants
are employed in the health care industry, where expenditures are less likely to decline
steeply during an economic downturn.
Calì and Dell’Erba (2009) found that generally the coeffi cient on the variable denot-
ing a systemic fi nancial crisis for remittances is insignifi cant. It becomes signifi cant
when, in high-income countries, it interacts with unemployment in the host country.
Th is indicates that, although aff ecting remittances directly, the infl uence of unemploy-
ment on remittances during the times of crisis is also bigger (Calì and Dell’Erba 2009).
Based on the expected impact of the fi nancial crisis on incomes and GDP in host
countries, and on their fi ndings of the independent impact of fi nancial crises on remit-
tances, Calì and Dell’Erba (2009) provided forecasts of the impact of the fi nancial crisis
on remittances for various regions of the world. Th ey estimate that for developing coun-
tries the crisis may result in a decline in remittances of approximately 5–8 percent in
2009, after which remittances will start growing again. For SSA in particular, the decline
in remittances is estimated to be between 4.4 and 6.0 percent.

28. REMITTANCES TO SUB-SAHARAN AFRICA IN THE WAKE OF A FINANCIAL CRISIS l 339
From Calì and Dell’Erba (2009) and the World Bank’s estimates, the implication is
clear that remittances will decline during a global fi nancial crisis. Th ese declines are,
however, relatively modest and set for quick recovery. Th is is also a fi nding from previ-
ous fi nancial crises, because they report, for instance, that during the 1998 Asian crisis,
remittances to East Asia declined by 15 percent in 1998 but recovered to precrisis levels
by 1999. Jha, Sugiyarto, and Vargas-Silva (2009) estimate that remittance fl ows to Asia
have slowed and are beginning to recover.
Barajas and others (2010: 10) take the perspective that, in a crisis, having a large
share of gross national income (GNI) coming from remittances is not a source of resil-
ience, but a source of exposure. Th ey found that (1) in SSA only a few countries are
“remittance dependent” and (2) most African migrants stay within Africa, so they are
less aff ected, and as such they conclude that “the impact of the global decline in remit-
tances on African countries’ GDP growth is expected to be fairly mild.”
Ratha, Mohapatra, and Plaza (2008) also found that remittances are a more resilient
resource fl ow. Th ey also present evidence to suggest that migrants often maintain their
remittances even if their host countries’ economic conditions deteriorate. Th ey con-
clude that remittances are less volatile than other fi nancial fl ows because (1) they are
sent by the migrants, and this tends to be persistent, (2) remittances are often a small
part of migrants’ incomes, and (3) migrant workers often benefi t from fi scal expansion
programs during crisis periods in their host countries.
Th erefore, we can conclude that SSA’s possible lack of extensive and diversifi ed out-
migration has left it less exposed to the drop in remittances as a result of a global fi nan-
cial or economic crisis.
Method, Variables, and Data
Based on the literature survey, we will investigate the following hypothesis:
H1: Remittances to SSA will decline during a globally synchronized fi nancial
crisis.
Our hypothesis results from the fi nding in the literature that a host country’s income
is an important determinant of remittances. Because a signifi cant number of African
migrants fi nd themselves in the European Union, a global fi nancial crisis could aff ect
their ability to remit. We have three reasons, however, in addition to that mentioned
in the previous section, to suspect that H1 may be rejected. One is that many migrant
workers in the European Union may be in jobs that are more recession proof. A second
is that there are more SSA migrants in other SSA countries than European Union coun-
tries. And third is that a global fi nancial crisis may see SSA countries’ exchange rates
depreciate, which may lead to increased remittances.
Our strategy is to estimate a regression equation of the determinants of remittance
infl ows. Th e estimating equation is informed by the literature on the determinants of

340 l WIM NAUDÉ AND HENRI BEZUIDENHOUT
remittances as well as data refl ecting globally synchronized fi nancial crises (see below).
Our panel regression estimating equation, following, for example, Freund and Spatafora
(2008) and Lueth and Ruiz-Arranz (2007), is (in log-linear form)
Rit =
τt
+ χit
β + ci + u
it(28.1)
For i = 1, …, N, and t = 2, …, T, and where Rit
= remittances to country i in period t,
xit
= a 1×K vector of explanatory variables (see below). Some of these vary over t; ci =
unobserved country characteristics that are constant (fi xed) over the time period and
infl uence Rit
; τ = year-specifi c fi xed eff ects, and uit
= a random error term with the
usual properties.
Here xt is a vector containing the explanatory variables. Th ese include the variables
of interest, namely:
• Whether there has been a globally synchronized recession in year t (a dummy vari-
able). If our hypothesis H1 holds, we will fi nd the coeffi cient on this variable to be
negative and signifi cant.
Th e control variables are also contained in xit
. Th ey are the following:
• GNI per capita of the home country. If the coeffi cient hereon is > 0, then remittances
are procyclical, and if <0, then remittances are countercyclical.
• GNI per capita of the host country. It is expected that if the coeffi cient hereon is
> 0, and if it is moreover > 1, then it would indicate that increases in host country
incomes are passed on more in proportion to their home countries (see Freund and
Spatafora 2008).
• Credit extended to the private sector in country i. Th is is a proxy for the fi nancial
development of country i. Th e higher it is, the easier it will be to remit, and therefore
we expect a positive coeffi cient.
• Th e level of the domestic (home country) exchange rate. Remittances are sent as
foreign currency. If the coeffi cient on this variable is found to be larger than zero, it
would indicate that in case of depreciation in the domestic (home country) exchange
rate, a larger dollar amount of remittances will be sent to make use of the higher,
more favorable rate.
• Offi cial development assistance (ODA) to country i. ODA is often claimed to aff ect
remittances. Some observers consider that an increase in ODA to a country will off set
remittances. If this is the case, the coeffi cient on ODA to a country will be negative.
• Th e population of a country. More populous countries will have larger migrant pop-
ulations in absolute terms, and therefore a higher absolute level of remittances.
Finally, we will also, where applicable, include dummy variables to capture any time
trends between 1980 and 2007 and country dummies to capture country fi xed eff ects
(table 28.1).

28. REMITTANCES TO SUB-SAHARAN AFRICA IN THE WAKE OF A FINANCIAL CRISIS l 341
Other control variables, such as host country unemployment, interest rates, and
infl ation, were also investigated, but these were insignifi cant and did not aff ect the
results.
For the estimator, we estimate equation (28.1) by fi rst using a pooled-data ordinary
least squares (OLS), with robust standard errors to account for heteroscedasticity for
our benchmark regressions. However, we are aware that using a static OLS estimation
method may bias our coeffi cients because of possible endogeneity and lack of dynamic
eff ects. Remittances may aff ect the level of the exchange rate, or the volume of aid, or
GNI per capita. Also, remittances may be dynamic and depend on past levels (refl ecting
networks, “family and friends,” and a country’s migrant stock).
To allow for these considerations and to include lagged values of remittances in
equation (28.1), we will therefore also use a “diff erence” (Arellano and Bond 1991) gen-
eralized method of moments (GMM) estimator. Th e “diff erence” GMM estimator can
be illustrated by taking our basic equation (28.1) and rewriting it in dynamic format as
an AR(1) model:
ΔRit
= τt + (α + 1)ΔR
it−1 + Δχ΄
itβ + Δu
it.(28.2)
TABLE 28.1 Summary of Variables and Data Sources
Measure Description Source of data
Dependent variable: remittances
Remittances Infl ows measured in dollars WDI
Variables: disasters Online
Globally synchronized recession
A dummy variable = 1 if there was a globally synchronized recession in the particular year. According to the IMF, these were in 1987, 1997, and 2002.
IMF
Variables: controls
GNI per capita in home country
The gross national product per capita in the home (SSA) country in period t
WDI
GNI per capita in host country
The gross national product per capita in the host country in period t. Here we take the host country income to be that of the SSA average; the main destinations of African migrants are other African countries.
WDI
Credit to the private sector
The credit extended to the private sector in an SSA home country in period i, as a proportion of GDP
WDI
Exchange rate level The local currency average value for the year in dollars WDI
Aid received The amount, in dollars, of aid received from the EU WDI
Population The total population in a country in a particular year WDI
Source: Authors’ compilation.
Note: EU = European Union; IMF = International Monetary Fund; WDI = World Development Indicators (World Bank).

342 l WIM NAUDÉ AND HENRI BEZUIDENHOUT
In equation (27.2), the regressors will be correlated with the error term (for instance,
ΔRit−1
depends on uit−1
). Consequently, instrumental variables are advisable to be
used for the endogenous regressors. Arellano and Bond (1991) proposed the lagged lev-
els of the regressors (such as mit−j
) as instruments to avoid endogeneity and derived a
“diff erence” GMM estimator. We used this estimator, and not a “dynamic GMM estima-
tor,” given that the number of time periods in our sample is relatively large, so that the
lagged levels of the regressors ought to be satisfactory instruments (see, for example,
Bond, Hoeffl er, and Temple 2001).
Data from 23 SSA countries are used for the period 1980–2007.2 Because of availabil-
ity considerations, data are used only from 1980 and because early estimates of remit-
tances were subject to considerable measurement error (Calì and Dell’Erba 2009).
Empirical Findings
Descriptive Statistics
Table 28.2 contains our sample of SSA countries and their respective remittances (on
average over the period and as percentages of GDP). Nigeria, Sudan, Kenya, Senegal,
and Burkina Faso are the countries receiving the largest volumes of remittances on
average, whereas in terms of their contribution to GDP, some countries have a fairly
high dependency on remittances, such as Lesotho with 27.7 percent and Cape Verde
and Togo with 9 percent.
Th e table also contains FDI and ODA as a percentage of GDP for comparative pur-
poses. It can be seen that in several countries—Kenya, Lesotho, Nigeria, Senegal, Swa-
ziland, and Togo—remittances exceeded FDI and ODA in 2007. Moreover, remittances
are less volatile in terms of percentage change than FDI or ODA. We confi rmed this
through a test of the equality of means, which rejects the null of equality.3 Th is would
suggest a rejection of H1.
In terms of our hypothesis, we are interested in the impact of fi nancial crises on remit-
tances. Although remittances may be high in some countries, it does not imply that
remittances are more responsive in cases of crises. In fact, the reduced volatility that we
found suggests that remittances change less in response to crises than FDI and ODA.
Regression Results
Tables 28.3 and 28.4 contain the pooled OLS regression results. Table 27.3 contains the
results when no controls are included. It shows that global fi nancial crises have, as can
be expected, a negative and signifi cant impact on remittance infl ows.
Table 28.4 contains the results: (1) a basic regression without any of the variables
of interest, as a base case, and three further models, introducing (2) global fi nancial
crises.
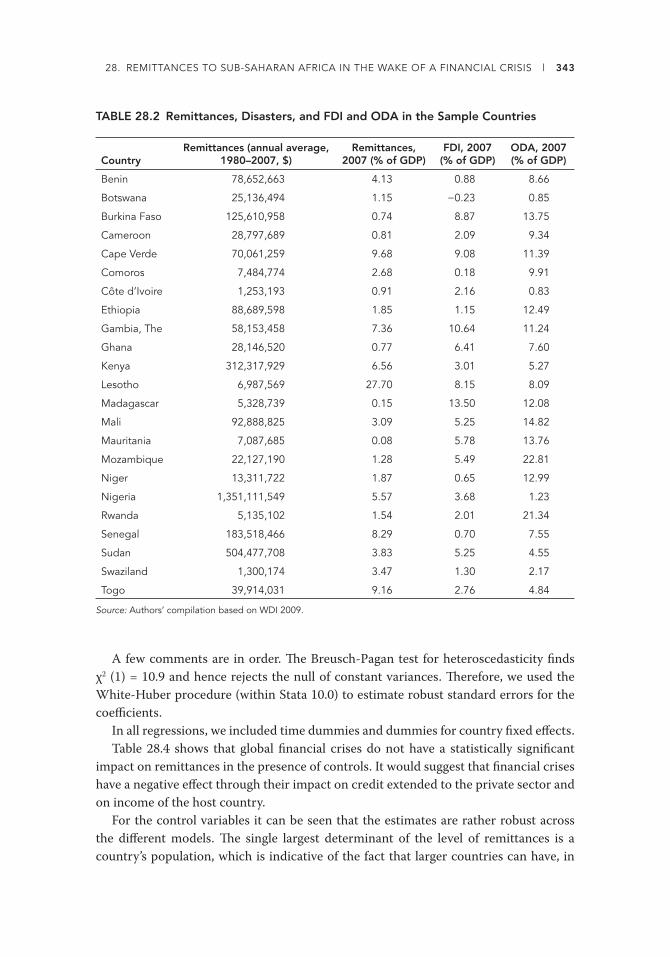
28. REMITTANCES TO SUB-SAHARAN AFRICA IN THE WAKE OF A FINANCIAL CRISIS l 343
A few comments are in order. Th e Breusch-Pagan test for heteroscedasticity fi nds
χ2 (1) = 10.9 and hence rejects the null of constant variances. Th erefore, we used the
White-Huber procedure (within Stata 10.0) to estimate robust standard errors for the
coeffi cients.
In all regressions, we included time dummies and dummies for country fi xed eff ects.
Table 28.4 shows that global fi nancial crises do not have a statistically signifi cant
impact on remittances in the presence of controls. It would suggest that fi nancial crises
have a negative eff ect through their impact on credit extended to the private sector and
on income of the host country.
For the control variables it can be seen that the estimates are rather robust across
the diff erent models. Th e single largest determinant of the level of remittances is a
country’s population, which is indicative of the fact that larger countries can have, in
TABLE 28.2 Remittances, Disasters, and FDI and ODA in the Sample Countries
CountryRemittances (annual average,
1980–2007, $)Remittances,
2007 (% of GDP) FDI, 2007
(% of GDP) ODA, 2007 (% of GDP)
Benin 78,652,663 4.13 0.88 8.66
Botswana 25,136,494 1.15 −0.23 0.85
Burkina Faso 125,610,958 0.74 8.87 13.75
Cameroon 28,797,689 0.81 2.09 9.34
Cape Verde 70,061,259 9.68 9.08 11.39
Comoros 7,484,774 2.68 0.18 9.91
Côte d’Ivoire 1,253,193 0.91 2.16 0.83
Ethiopia 88,689,598 1.85 1.15 12.49
Gambia, The 58,153,458 7.36 10.64 11.24
Ghana 28,146,520 0.77 6.41 7.60
Kenya 312,317,929 6.56 3.01 5.27
Lesotho 6,987,569 27.70 8.15 8.09
Madagascar 5,328,739 0.15 13.50 12.08
Mali 92,888,825 3.09 5.25 14.82
Mauritania 7,087,685 0.08 5.78 13.76
Mozambique 22,127,190 1.28 5.49 22.81
Niger 13,311,722 1.87 0.65 12.99
Nigeria 1,351,111,549 5.57 3.68 1.23
Rwanda 5,135,102 1.54 2.01 21.34
Senegal 183,518,466 8.29 0.70 7.55
Sudan 504,477,708 3.83 5.25 4.55
Swaziland 1,300,174 3.47 1.30 2.17
Togo 39,914,031 9.16 2.76 4.84
Source: Authors’ compilation based on WDI 2009.

344 l WIM NAUDÉ AND HENRI BEZUIDENHOUT
TABLE 28.4 Pooled OLS Regression Results
dependent variable = log of remittances in dollars, controls included
Variable Basic model With global fi nancial crises
Constant −8.72 (−0.59) −8.72 (−0.59)
GNI home −1.92 (−5.86)* −1.92 (−5.86)*
Income host (SSA GDP per capita) 0.44 (2.10)*** 0.44 (2.10)***
Credit private sector 0.61 (5.23)* 0.61 (5.23)*
Exchange rate 0.33 (4.52)* 0.33 (4.52)*
Aid from EU 0.02 (0.17) 0.02 (0.17)
Population 2.30 (2.56)** 2.29 (2.56)***
Global fi nancial crises — −0.90 (−1.32)
Diagnostics
R2 0.85 0.86
Time dummies Yes Yes
Country fi xed effects Yes Yes
N 300 300
F 75.29* 75.29*
Source: Authors’ estimations.
Note: Robust t-ratios are in parentheses. *, **, *** indicate signifi cance at the 1, 5, and 10 percent levels, respectively. EU = European Union; — = not available.
TABLE 28.3 Pooled OLS Regression Results
dependent variable = log of remittances in dollars, no control variables
Global fi nancial crises
Variable
Constant 18.49 (71.6)*
Global fi nancial crises −1.25 (−4.37)*
Diagnostics
R2 0.77
Time dummies Yes
Country fi xed effects Yes
N 644
F 67.16
Source: Authors’ estimations.
Note: Robust t-ratios are in parentheses. * = signifi cance at 1 percent level.
absolute terms, larger migrant populations. To the extent that a country’s population
is a proxy for its migrant stock, the fi nding is consistent with the proxy supposition. In
a dynamic model, this would mean that lagged remittances ought to have a substantial
and signifi cant eff ect.
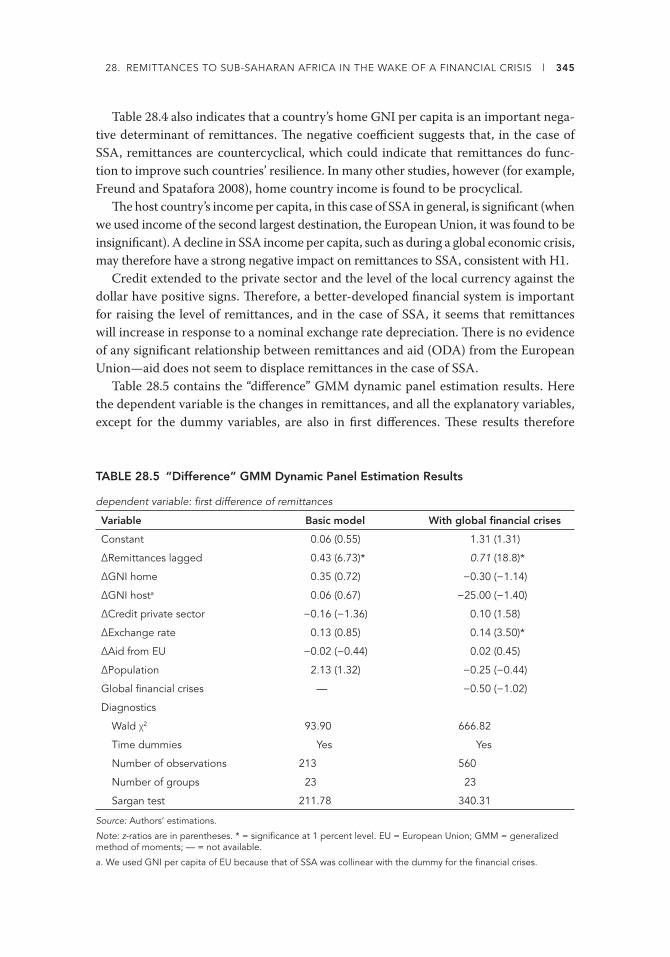
28. REMITTANCES TO SUB-SAHARAN AFRICA IN THE WAKE OF A FINANCIAL CRISIS l 345
Table 28.4 also indicates that a country’s home GNI per capita is an important nega-
tive determinant of remittances. Th e negative coeffi cient suggests that, in the case of
SSA, remittances are countercyclical, which could indicate that remittances do func-
tion to improve such countries’ resilience. In many other studies, however (for example,
Freund and Spatafora 2008), home country income is found to be procyclical.
Th e host country’s income per capita, in this case of SSA in general, is signifi cant (when
we used income of the second largest destination, the European Union, it was found to be
insignifi cant). A decline in SSA income per capita, such as during a global economic crisis,
may therefore have a strong negative impact on remittances to SSA, consistent with H1.
Credit extended to the private sector and the level of the local currency against the
dollar have positive signs. Th erefore, a better-developed fi nancial system is important
for raising the level of remittances, and in the case of SSA, it seems that remittances
will increase in response to a nominal exchange rate depreciation. Th ere is no evidence
of any signifi cant relationship between remittances and aid (ODA) from the European
Union—aid does not seem to displace remittances in the case of SSA.
Table 28.5 contains the “diff erence” GMM dynamic panel estimation results. Here
the dependent variable is the changes in remittances, and all the explanatory variables,
except for the dummy variables, are also in fi rst diff erences. Th ese results therefore
TABLE 28.5 “Difference” GMM Dynamic Panel Estimation Results
dependent variable: fi rst difference of remittances
Variable Basic model With global fi nancial crises
Constant 0.06 (0.55) 1.31 (1.31)
ΔRemittances lagged 0.43 (6.73)* 0.71 (18.8)*
ΔGNI home 0.35 (0.72) −0.30 (−1.14)
ΔGNI hosta 0.06 (0.67) −25.00 (−1.40)
ΔCredit private sector −0.16 (−1.36) 0.10 (1.58)
ΔExchange rate 0.13 (0.85) 0.14 (3.50)*
ΔAid from EU −0.02 (−0.44) 0.02 (0.45)
ΔPopulation 2.13 (1.32) −0.25 (−0.44)
Global fi nancial crises — −0.50 (−1.02)
Diagnostics
Wald χ2 93.90 666.82
Time dummies Yes Yes
Number of observations 213 560
Number of groups 23 23
Sargan test 211.78 340.31
Source: Authors’ estimations.
Note: z-ratios are in parentheses. * = signifi cance at 1 percent level. EU = European Union; GMM = generalized method of moments; — = not available.
a. We used GNI per capita of EU because that of SSA was collinear with the dummy for the fi nancial crises.

346 l WIM NAUDÉ AND HENRI BEZUIDENHOUT
focus on the short-term impacts on remittances, as opposed to the results in table 28.4,
which could be seen as more long term.
Table 28.5 shows that when being able to allow for the dynamic eff ects of remittances,
lagged values of remittances become the single most signifi cant and important deter-
minant of current remittances. Th ere is therefore persistence in remittances—a fi nding
consistent with the earlier fi nding that remittances tend to be stable and less volatile
than other infl ows. It suggests the importance of migrant stocks as a determinant of
remittances. Given the results, over the short term, that remittances will be infl uenced
only by previous remittances (migration stocks) and incomes, exchange rates and fi nan-
cial sector development have a longer-term impact on the level of remittances, with the
response of remittances to crises more long term in the case of SSA.
Concluding Remarks
Africa is particularly susceptible to fi nancial crises. Human migration and correspond-
ing remittance fl ows have for many decades acted as a potential bulwark against these
crises. It is potentially an important source of resilience for households assisting recov-
ery after crises.
What is the remittance response in the wake of a global fi nancial crisis? Th is is the
question we set out to answer in this study. Using panel data on 23 SSA countries over
the period 1980–2007, we derived a hypothesis from a review of the literature:
H1: Remittances to SSA will decline during a globally synchronized fi nancial crisis.
We found only qualifi ed support for our hypothesis. Being relatively stable, remit-
tances are less volatile than other forms of fi nancial fl ows and are therefore a source
of resilience during a global fi nancial crisis. Over the longer term, remittances to SSA
are mainly determined by incomes in the host and home countries, population (migra-
tion growth), the sophistication of the fi nancial system, and the exchange rate. A global
fi nancial crisis does not have a signifi cant impact on remittances in the presence of con-
trols. Remittances will decline, albeit slowly, after a global fi nancial crisis to the extent
that the crisis aff ects incomes, migration stocks, exchange rates, and the banking sys-
tem. If these impacts are brief, then the relative persistence of remittances suggests that
they are a good bulwark against global fi nancial crises in SSA. Migration is therefore an
important source of resilience in the face of fi nancial crises in SSA.
Notes
1. Nagarajan (2009) and Raja (2009) reported that foreign aid could decline by up to 40 percent
during the 2008–09 fi nancial crisis, whereas the World Bank forecast remittances to decline
by approximately 8 percent.

28. REMITTANCES TO SUB-SAHARAN AFRICA IN THE WAKE OF A FINANCIAL CRISIS l 347
2. Th e countries are Benin, Botswana, Burkina Faso, Cameroon, Cape Verde, Comoros, Côte
d’Ivoire, Ethiopia, Th e Gambia, Ghana, Kenya, Lesotho, Madagascar, Mali, Mauritania,
Mozambique, Niger, Nigeria, Rwanda, Senegal, Sudan, Swaziland, and Togo.
3. Results available from the authors on request.


349
Chapter 29
From Shock Absorber to Shock Transmitter: Determinants of Remittances in Sub-Saharan Africa
RAJU JAN SINGH
Reported remittances have substantially increased throughout the develop-
ing world (fi gure 29.1), rising from about $20 billion in 1980 to an estimated $336 bil-
lion in 2008. In Sub-Saharan Africa (SSA), an estimated $20 billion in remittances in
2007 corresponded to about 2.5 percent of regional gross domestic product (GDP), an
amount similar to the offi cial development assistance the region received. However, on
a global scale remittance fl ows to SSA are quite small; they account for only 5 percent
of total remittances to developing countries and in terms of GDP are dwarfed by the
amounts received in the Middle East and South Asia.
Th e general picture hides striking variations by country (fi gure 29.2). Of the 25 larg-
est recipients of remittances in 2008 in terms of GDP, four were in Africa (Cape Verde,
Lesotho, Senegal, and Togo). As a source of foreign exchange, in Benin, Cape Verde, Th e
Gambia, Lesotho, Senegal, Sierra Leone, and Uganda, remittances in 2008 represented
more than 25 percent of each country’s export earnings. Furthermore, although for the
region as a whole the amounts of aid and recorded remittances are similar, in numerous
countries remittances were a multiple of offi cial assistance.
Th e chapter draws on a wider research project including Markus Haacker (London School of Hygiene and Tropical Medi-
cine), Kyung-woo Lee (Columbia University), and Maëlan Le Goff (CERDI–University of Auvergne). Th is work was carried
out when Markus Haacker, Kyung-woo Lee, and the author were at the African Department of the International Monetary
Fund. Th e views expressed in this chapter are those of the author and do not necessarily represent those of the IMF or IMF
policy.
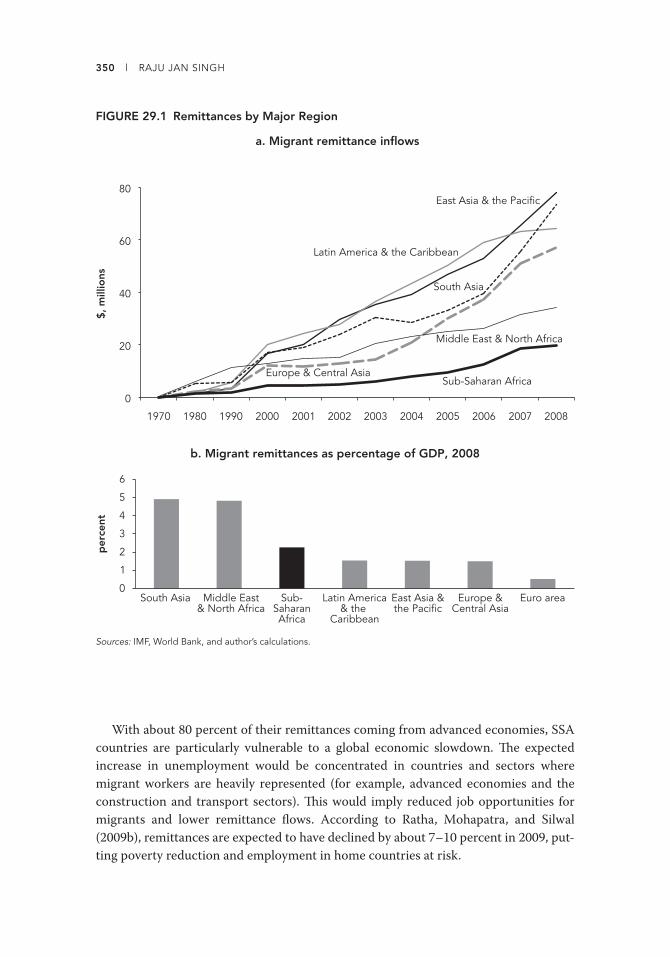
350 l RAJU JAN SINGH
FIGURE 29.1 Remittances by Major Region$,
mill
ions
0
20
40
60
80
1970 1980 1990 2000 2001 2002 2003 2004 2005 2006 2007 2008
East Asia & the Pacific
Europe & Central AsiaSub-Saharan Africa
Latin America & the Caribbean
Middle East & North Africa
South Asia
a. Migrant remittance inflows
b. Migrant remittances as percentage of GDP, 2008
0
1
2
3
4
5
6
South Asia Middle East& North Africa
Sub-SaharanAfrica
Latin America& the
Caribbean
East Asia &the Pacific
Europe &Central Asia
Euro area
per
cent
Sources: IMF, World Bank, and author’s calculations.
With about 80 percent of their remittances coming from advanced economies, SSA
countries are particularly vulnerable to a global economic slowdown. Th e expected
increase in unemployment would be concentrated in countries and sectors where
migrant workers are heavily represented (for example, advanced economies and the
construction and transport sectors). Th is would imply reduced job opportunities for
migrants and lower remittance fl ows. According to Ratha, Mohapatra, and Silwal
(2009b), remittances are expected to have declined by about 7–10 percent in 2009, put-
ting poverty reduction and employment in home countries at risk.

29. DETERMINANTS OF REMITTANCES IN SUB-SAHARAN AFRICA l 351
Going forward, concerns have been expressed about a possible rise in discrimina-
tion and xenophobia, migrant workers being perceived as taking jobs away from local
workers or competing for welfare benefi ts. Numerous host countries have stopped or
imposed restrictions on new admissions of migrants for employment. Home countries
are already experiencing infl ows of returning migrants, which may result in economic
and social instability in poorer countries. Many governments have already adopted
more restrictive policies (for example, Australia, the Republic of Korea, the Russian
Federation, and the United States), and some have even introduced fi nancial incen-
tives to encourage migrant workers to return home (for example, Japan, Spain, and the
United Kingdom). Understanding what drives remittances is therefore crucial. Yet little
research has been done on the determinants of remittances to Africa.
Empirical Analysis
Th e following equation describes the determinants of remittances and includs explana-
tory and control variables that have been shown to be signifi cant in previous studies
(Rapoport and Docquier 2006):
FIGURE 29.2 Main Recipients of Remittances, 2008
a. Top 25 remittance recipients worldwide b. Top 15 remittance recipients in SSA
0 10 20 30 40 50
TajikistanTonga
MoldovaLesothoSamoa
LebanonKyrgyz Rep.
GuyanaNepal
HondurasHaiti
JordanEl Salvador
JamaicaBosnia & Herz.
NicaraguaAlbania
GuatemalaBangladeshPhilippines
SerbiaTogo
Cape VerdeSenegalArmenia
remittances as % of GDP
0 200 400 600 800
Nigeria
Lesotho
Mauritius
Swaziland
Sudan
Kenya
Senegal
Seychelles
Togo
South Africa
Gambia, The
Cape Verde
Uganda
Benin
Sierra Leone
remittances as % of ODA
Sources: IMF, World Bank, and author’s calculations.

352 l RAJU JAN SINGH
ln (REM/GDP)it
= αi + γ
t + β
1 ln y
it + β
2 ln FinDev
it+ β
3 ln y*
it +
β4
ln(Mig/Pop)it
+ β5
ln Insit
+ β6
ln REXit
+ β7
IDit
+ β8
Dualit
+ εit
,(29.1)
where REM/GDP denotes the ratio of remittances to GDP, y is home income, FinDev
stands for an index for the fi nancial development, y* is host income, Mig/Pop is the ratio
of expatriates to population, Ins denotes institutional quality, REX is the real exchange
rate, ID is the interest rate diff erential, Dual is the dual exchange rate dummy variable,
and αi and γ
t are country- and time-specifi c dummies, respectively. Panel fi xed-eff ect
and fi xed-eff ect two-stage least-square estimation methods were used. Th e dependent
variable used here is the ratio of remittances to GDP. Diff erent measures were also tried,
such as remittances to population or just the volume of remittances, but the results
were robust to the choice of measure for remittances.1
Th e sample comprises 36 countries in SSA for 1990 through 2005.2 Data on remit-
tances are drawn from the International Monetary Fund’s (IMF’s) Balance of Payments
Statistics Yearbook (BOPSY). To estimate the annual stock of expatriates, the study
started with the data compiled by Parsons and others (2007) on international bilat-
eral migration. Th is database provides the number of migrants from each of 226 origin
countries to each of 226 destination countries in 2000. From these data were inferred
the number of expatriates for these 36 SSA countries during 1990–2005 using the
World Development Indicators (see annex for a more detailed discussion). Measures of
the diff erentials in interest rates and income between the home and host countries were
constructed as an average of bilateral diff erentials, weighted by the shares of migrants
(from Parsons and others 2007).
Findings
Table 29.1 reports the estimation results. Remittances to SSA do seem to play a shock-
absorbing role. Th e coeffi cient of real per capita GDP in the home country is negative
regardless of the choice of estimation methods. Th is suggests that when adverse eco-
nomic shocks decrease incomes in their home country, migrants would remit more to
protect their families from those shocks.
Th e coeffi cients of host country income and stock of expatriates are, however, posi-
tive and robust. Countries with a large diaspora attract more remittances, and the loca-
tion of expatriate communities matters: Th e wealthier the country where expatriates
are located, the higher the remittances they send back home. Th is result would suggest
that, as the global crisis erodes the incomes and the number of migrants, remittances
should be expected to decline, spreading the crisis to home countries rather than shel-
tering them.
Remittances also refl ect portfolio choices about investment opportunities in the
home country. Th e coeffi cient on institutional quality is signifi cantly positive and
robust. Th is result suggests that countries with better institutions or a more stable

29. DETERMINANTS OF REMITTANCES IN SUB-SAHARAN AFRICA l 353
political system would receive more remittances relative to GDP. Institutional quality
can be viewed as refl ecting the business environment, which in turn should infl uence
the amount of remittances driven by the investment motive.
Once migrants have decided how much to remit, they must then decide how to
send it. Remittances are estimated to be positively correlated with fi nancial deepening.
Countries with more developed fi nancial markets would attract more remittances rela-
tive to GDP. Financial development should ease the process of money transfers and may
reduce the fees associated with sending remittances through competition, so that it can
raise the amount or share of remittances transferred through offi cial channels, which
our data on remittances capture.
TABLE 29.1 Determinants of Remittances
Variable (log) M2/GDP DC/GDPFinancial depth:
M2/GDPa
Financial depth: DC/GDPb
Home income −3.236*(−6.08)
−2.952*(−4.48)
−3.158*(−5.14)
−3.258*(−3.02)
M2/GDP 0.698*(3.37)
1.232*(3.06)
Domestic credit/GDP 0.160(1.15)
0.890*(3.86)
Host income 4.255*(3.64)
4.555*(3.60)
2.567*(2.09)
3.690*(2.66)
Expatriates/population 0.024*(3.59)
0.021*(2.85)
0.027*(3.29)
0.016(1.59)
Institutions 0.400*(2.72)
0.378*(2.43)
0.491*(3.21)
0.274(1.60)
Real exchange rate −0.765*(−3.06)
−0.581**(−2.14)
−0.760**(−2.39)
−0.699**(−1.99)
Interest rate differential −0.039*(−3.56)
−0.039*(−4.30)
−0.030*(−3.52)
−0.025**(−2.64)
Dual exchange rate −0.131(−0.83)
−0.029(−2.16)
−0.126(−0.83)
0.113(0.61)
Observations 352 334 318 296
R2 0.8171 0.8122 0.8251 0.8129
For weak instruments n.a. n.a. 31.289 52.756
p-valuec n.a. n.a. 0.3162 0.2796
Source: Author’s calculations.
Note: Standard errors are robust to autocorrelation in errors. t-values are in parentheses. *, **, and *** indicate 1, 5, and 10 percent signifi cance, respectively. Time-specifi c dummies are included, but estimates are not reported here. DC = domestic credit; M2 = money and quasi-money; n.a. = not applicable.
a. Instrumented: home income, M2/GDP. Instruments: fi rst lag of real GDP per capita and institutions; fi rst and second lags of M2/GDP.
b. Instrumented: home income, DC/GDP. Instruments: fi rst lag of real GDP per capita and institutions; fi rst and second lags of DC/GDP.
c. For overidentifi cation test of all instruments.

354 l RAJU JAN SINGH
Conclusions: What Can Be Done?
Th e fi ndings suggest that remittances vary countercyclically with variations in GDP per
capita in the home country, consistent with the hypothesis that remittances can help
mitigate economic shocks. However, the size, the location, and the income of the dias-
pora are also important determinants of remittances. Th ese results would suggest that
this time around remittances should not be expected to shelter their home economies
from adverse economic shocks, but on the contrary could contribute propagating them.
Th e global scope of the current crisis could turn remittances into shock transmitters.
Against this backdrop, what can home countries do? Th e results presented in this
chapter would suggest several policy options:
• Just as protectionism in trade needs to be avoided, rising protectionism in human
mobility in host countries should be resisted, keeping the number of migrants in
host countries.
• Eff orts should be stepped up in home countries to improve the quality of their insti-
tutional environment, particularly their business climate, to encourage migrants to
send more remittances.
• In particular, measures should be taken to deepen fi nancial intermediation and facil-
itate remittance fl ows through formal channels by lowering transaction costs associ-
ated with sending remittances.
Notes
1. Th e dependent variable used here is the ratio of remittances to GDP. We also tried diff er-
ent measures, such as remittances to population or just the volume of remittances, but the
results were robust to the choice of measure for remittances.
2. Th e countries in the sample are the following: Benin, Botswana, Burkina Faso, Cameroon,
Cape Verde, the Comoros, Republic of Congo, Côte d’Ivoire, Eritrea, Ethiopia, Gabon, Th e
Gambia, Ghana, Guinea, Guinea-Bissau, Kenya, Lesotho, Madagascar, Malawi, Mali, Mau-
ritania, Mauritius, Mozambique, Namibia, Niger, Nigeria, Rwanda, São Tomé and Príncipe,
Senegal, the Seychelles, Sierra Leone, South Africa, Sudan, Swaziland, Tanzania, and Togo.

29. DETERMINANTS OF REMITTANCES IN SUB-SAHARAN AFRICA l 355
Annex
A: Variables and Countries Used for the Analysis
Variable Description Source
Remittances Sum of workers’ remittances, compensation of employees, and migrants’ transfers in dollars
BOPSY, WDI, IMF African Department
Real GDP per capita Real GDP per capita in 2000 constant dollars WDI
Nominal GDP Nominal GDP in dollars WEO
Population Population WDI
Nominal exchange rate
Nominal exchange rate measured as the amount of dollars for one unit of local currency ($/LCU)
WEO
CPI Consumer price index (100 in 2000) WEO
Infl ation CPI infl ation Author’s computation
Investment Gross investment in dollars WEO
Dual exchange rate regime
Dual exchange dummy, 1 for dual or multiple exchange rate regime
IMF (2010)
M2 Money and quasi-money in dollars WDI
Terms of trade Export price index/import price index (100 in 2000)
WEO
Trade openness (imports + exports)/GDP WEO
Stock of expatriates Number of expatriates by origin (see annex B for details)
WDI; Parsons and others (2007)
Private investment Private investment in dollars WEO
Public investment Public investment in dollars WEO
Institutional quality ICRG political risk index (0: highest risk, 100: lowest risk)
ICRG, Political Risk Service Group
Deposit rate Deposit rate IFS
Real exchange rate Real exchange rate against dollars ($/LCUi CPIi/CPI$)
Author’s computation
Government expenditure
General government total expenditure and net lending in dollars
WEO
Host income Weighted average of real per capita GDP in top four expatriate–receiving countries (in 2000 constant dollars)
WDI; Parsons and others (2007)
Nominal interest rate differential
Deposit rate of home country; deposit rate of country with largest migrants’ share from that country
IFS; Parsons and others (2007)
Domestic credit Domestic credit provided by banks (% of GDP) WDI
Source: Author.
Note: CPI = consumer price index; ICRG = International Country Risk Guide; IFS = International Financial Statistics; LCU = local currency unit; M2 = money and quasi-money; WDI = World Development Indicators (World Bank 2010c); WEO = World Economic Outlook (IMF).

356 l RAJU JAN SINGH
B: Construction of the Stock of Expatriate Data
Th e following describes in detail how data are constructed on the number of expatriates
from available sources of migration data (fi gure 29.A1). Th e data used to compute the
stock of expatriates include net migration into each country and the number of migrants
within each country (both from the WDI but recorded only every fi ve years as well as the
international bilateral migration database compiled by Parsons and others 2007).
Suppose there is a country, which we will call home. We will call the rest of the world
foreign. Assume for simplicity that place of birth determines citizenship. Assume fur-
ther that all available stock data are measured at the end of a given period.
Let us defi ne the following variables (equation 29.A1):
Stocks
Ht = number of people born in home country and living there
H*t = number of people born in home country but living in a foreign country
Ft = number of people born in a foreign country but living in home country
F*t = number of people born in a foreign country and living there
Pt = population of home country (H
t + F
t)
Flows
EHt = number of home-born people who migrate from home to a foreign country
IHt = number of home-born people who migrate back home from a foreign country
EFt = number of foreign-born people who migrate from home to a foreign country
IFt = number of foreign-born people who migrate from a foreign country to home
Et = number of out-migration from home (EH
t + EF
t)
It = number of in-migration to home (IH
t + IF
t)
Mt = net migration (I
t + E
t)
DH*t = number of home-born people who die in a foreign country
DFt = number of foreign-born people who die in a home country
What we know is this: Pt , F
t (migration stock from the WDI), hence H
t and M
t (net
migration from the WDI). But what we want to know is: H*t (stock of expatriates). Th e
fl ow of migration is characterized by the following equations:
H*t = H*
t −1
− DH*t + EH
t − IH
t , (29A.1)
Ft
= Ft−1
− DFt + IF
t − EF
t . (29A.2)
Note that births to migrants are counted as increases in the natives for the country
where they live on the assumption we made earlier. Turning to net migration we know
by defi nition:
Mt = I
t − E
t = (IH
t − EH
t) + (IF
t − EF
t),

29. DETERMINANTS OF REMITTANCES IN SUB-SAHARAN AFRICA l 357
which implies
(EHt
− IHt) = (IF
t − EF
t) − M
t. (29A.3)
Combining (28A.1), (28A.2), and (28A.3), we have
H*t = H*
t −1
− DH*t + F
t − F
t−1 + DF
t − M
t. (29A.4)
To construct the stock of expatriates from home, we need a value of H*t for some period
t as well as the number of deaths of migrants, that is, DH*t and DF
t. We address these
issues as follows: First, to obtain the stock of expatriates from home at some period, we
make use of the international bilateral migration database of Parsons and others (2007).
Th en, to estimate the number of deaths of migrants, we fi rst assume the death rate
depends only on place of birth.
On this assumption, we can compute the death of migrants as follows:
DH*t = d
tH*
t −1
,
DFt= d*
t F
t ,
(29A.5)
where dt is the death rate of home-born people and d*
t the death rate of foreign-born
people. We use the crude death rate of home, available from the WDI, to measure d*t
and a simple average of crude death rates for our sample countries to measure d*t . Com-
bining equations (28A.4) and (28A.5) yields the equation for computing the stock of
expatriates:
DH*t = H*
t −1
(1−dt) + F
t − F
t−1 (1−d*
t ) − M
t. (29A.6)
One remaining issue in constructing the data as described so far is that data on
migration stock within a country, Ft in our term, are available only every fi ve years.
Th us we interpolate between two recorded observations linearly to obtain annual data
on the stock of expatriates.
FIGURE 29.A1 Construction of the Stock of Expatriate Data
Birth to F (counted as
rise in H)
Birth to H* (counted as rise in F*)
H
F
H*
F*
DF
EH
IH
EF
IF
DH*
Home Foreign
Source: Singh and others 2011.

359
Chapter 30
A Comparative Examination of Women’s Remittance Practices in Two Somali Communities: Johannesburg, South Africa, and Columbus, Ohio
MARNIE SHAFFER
Women throughout the somali diaspora are renowned for their commitment
to provide fi nancial support to their families abroad (see, for example, Horst 2007).
Although it has only been in recent years that women have been migrating to South
Africa, their sense of responsibility to remit is equally as strong as those women’s who
left Somalia in the early 2000s and before. Th e author conducted research in Mayfair,
a suburb near downtown Johannesburg in Gauteng Province, where the Somali com-
munity is most densely populated, and in Columbus, Ohio, where several pockets of
Somalis are dispersed around the city. Study results indicate that Somali women living
in Mayfair have fewer educational and employment opportunities than those in Colum-
bus, but they nonetheless maintain kinship ties and provide much needed support to
family and friends living elsewhere. Th e Columbus study consists of professional and
otherwise employed women, whereas research in Johannesburg is part of a larger eth-
nographic study that includes employed and unemployed women.
Research in Columbus, Ohio (2008–09), was made possible by the National Science Foundation (REG supplement to NSF
Grant No. BCS-0706795), and work in Johannesburg, South Africa (2010), was funded by Ohio State University and sup-
ported by the African Centre for Migration & Society at the University of the Witwatersrand in Johannesburg.

360 l MARNIE SHAFFER
Th e women interviewed in Columbus all hold jobs and in most cases have either
completed or are working on university degrees. Th ey work in health care, in retail, or
in shops and serve as interpreters. Many of these women provide services to the Somali
community, where their language skills and cultural knowledge are marketable and vital
to meeting the needs of the growing Somali population. Th eir length of time living in
the United States ranges from 8–28 years, and most have strong English language skills.
Women in South Africa tell a diff erent story. Of those interviewed, the earliest one
of these women arrived in the country was in 1995, after the end of apartheid. Most
women in South Africa have not completed a high school degree or its equivalent, and
English profi ciency is for the most part limited.
For many women in Johannesburg employment prospects are often confi ned to
low-paying jobs in the Mayfair area. Although a few women run successful businesses
selling clothing, shoes, perfume, groceries, and jewelry, others eke out a living dealing
qat—a plant whose leaves are chewed for its stimulant eff ects—cooking in restaurants,
working in Somali-, Indian-, Ethiopian-, or Pakistani-owned shops, or selling cloth-
ing, fruits, and vegetables or homemade food on the street, in shops, or door to door.
Employment opportunities for women are limited because it is considered too danger-
ous for them to work in the townships, where men often earn a living wage selling gro-
ceries. Th e sexual division of labor among Somalis means that men who stay in Mayfair
do a variety of jobs, both formal and informal, that generate more income than women’s
work. Furthermore, unemployment rates in Gauteng, offi cially recorded at more than
26 percent (Statistics South Africa 2011), reduce women’s ability to acquire salaried
positions that pay living wages. Many South Africans believe that Somalis rob them of
jobs and other fi nancial opportunities, and Somali women have less formal education
and speak less English than men; consequently, it is improbable that women will work
in the formal sector.
A perception is seen among Somalis in East Africa that anyone living in South Africa
or the United States has the fi nancial means to provide critical support to their rela-
tives at home, but this prevailing myth is far from true. Women in the United States
receive higher earnings and are engaged in more formal employment than those in
South Africa, but remitting responsibilities put a strain on their fi nances and create
stress in their lives. For many women in Johannesburg, life is a daily struggle to collect
the money needed to buy food and to pay rent and school fees for their children. Unlike
their American counterparts, women’s income in South Africa fl uctuates according to
their success as businesswomen. Given the informality of their jobs, women who work
in shops or restaurants receive limited income, and the consequences are that they have
just enough money to support themselves and their families in Mayfair. Th ere are also
high rates of single mothers who must care for their children and earn an income to
support them.
Informants report that the current economic crisis did not disrupt employment lev-
els in Mayfair, but it has aff ected Somalis who send remittances, which are transferred
in dollars. Although the exchange rate is not historically low, the dollar has steadily
30. WOMEN’S REMITTANCE PRACTICES IN TWO SOMALI COMMUNITIES l 361
declined against the South African rand since 2009. Senders who remit $100 a month,
for example, must choose between paying more rand to remit the same amount or
spending the same amount in rand, which will give recipients less money. Th e foreign
exchange rate can infl uence remittance amounts, and a weak dollar is especially painful
to those who remit regularly.
Despite their limitations, including an unfavorable exchange rate, women in South
Africa remit as frequently as they can aff ord to, and they employ numerous strate-
gies to meet their family commitments. One approach is that when a woman becomes
engaged, she and her fi ancé may negotiate the terms of the marriage and the fi nancial
responsibilities he will assume to his wife and her family. Th is is particularly important
for women who are unable to work because of child-care responsibilities and cultural
expectations that confi ne women to staying in their homes while men provide support.
Although some men meet this cultural and religious obligation, others control the fam-
ily’s purse strings and ration the money women receive to run the household. Many
Somalis in Mayfair believe that a woman’s choice for a husband is made, in large part,
by his fi nancial success and ability to support his wife and her family. Failure to assist
his wife in this way, particularly when a man has the fi nancial means to do so, may lead
to divorce.
Women, whether they work or not, may be part of an ayuuto. Ayuuto exists through-
out the diaspora and comprises a group of people who contribute an equal amount
of money to the group every few days, according to the schedule they have created,
which is collected and distributed to a designated individual in the group. Th e recipient
rotates so each person receives the pot of money. Women who are not working may
save a small amount of money their husbands allocate to them for the weekly shopping.
By purchasing cheap items, a woman can set aside money to contribute to her ayuuto.
For example, Sadia, a business owner in Mayfair, is part of an ayuuto with eight people
and 15 rounds in each rotation. Each member contributes R 200 every three days. On
the third day, one person gets R 3,000. Sadia contributes R 600—she sets aside R 200
each day—so she gets a more frequent distribution. In Sadia’s case, she receives ayuuto
payments on the second, seventh, and ninth distribution days, because those are her
numbers in the rotation. Other group members also pay extra, and so they too receive
more frequent payments. If Sadia set aside R 200 every day, she would still have R 9,000
at the end of the same period, but she would not save that money without her group; the
money would be spent on other things. Ayuuto demands discipline while strengthening
kinship ties and social networks because other livelihoods are at stake. Sadia has to save
because other people are counting on her.
Money acquired through ayuuto can be used for remittance purposes. Women
who belong to such groups may set aside the money they earn to send to their families
abroad. If women are not part of an ayuuto and have no job or money when there is
a family emergency or relatives are suff ering, they can ask friends or extended family
members to give them money, called shaxaad, which is a gift that will not be repaid.
In cases where women do have access to cash but are short in diffi cult times, they may

362 l MARNIE SHAFFER
ask their kin, or even the xawilaad businesses that transfer the remittances, for credit
so they have something to remit. Th ey borrow money that will be reimbursed, interest
free, when they can aff ord it. Some women resort to cooking and selling food, or selling
new clothing or gold jewelry, to raise cash, while others rent rooms in their homes to
friends or acquaintances to collect an income. In a few instances, a woman may own
shares in a shop and will receive monthly profi ts from the business even though she is
not involved in the daily operations. Th ese cases are uncommon and likely indicate a
close familial connection to the primary shop owner.
Research data indicate that the current economic crisis has not disturbed remittance
practices among Somalis. Women in Columbus report that they remit to relatives they
have never met, or do not know well, primarily because their parents—and mothers
in particular—asked them to, and they will continue to do so after their parents are
gone. It is too early to test whether this sentiment is echoed in South Africa, but con-
tinued research on women’s remittance practices will be imperative to understanding
how these processes unfold over the next several years. One notable diff erence between
the two communities is that when women in Mayfair have relatives living in the West,
they feel less pressure to remit. Although they still consider it their responsibility, they
believe their relatives in the West are in a better fi nancial position to support their
families in Africa. For women who do not have relatives in Australia, Europe, or North
America, the weight of their responsibility is great, and they make many sacrifi ces to
meet the needs of their kin. When they have nothing to give, their relatives do not
always believe them and accuse the women of abandonment, something that aff ects
them deeply. For women in Columbus, they are acutely aware of the expectations and
implications of the remittances they send, and most of them are happy to help even
with the strain it creates. As one woman said, “I am grateful that I can help; I feel good
about it. It could be them helping me.” For these women, to stop remitting is not an
option. Th e remittances they provide maintain kinship ties and enable the survival of
their families around the world.

PART VIII


365
Chapter 31
The Global Crisis and Expatriates’ Remittances to Lebanon
NASSIB GHOBRIL
The middle east and north Africa (MENA) region, as with nearly every region of
the developing and developed worlds, was not immune from the global fi nancial crisis.
But the extent and transmission of the crisis’s impact varied from region to region and
from country to country. Th e global fi nancial crisis took its toll on the MENA region
through multiple channels, which included terms of trade, capital infl ows, tight credit,
economic slowdown, higher unemployment, lower hydrocarbon prices, and the burst-
ing of real estate and stock market bubbles. Th e region’s increasing integration in the
global economy and capital markets, led by the economies of the Gulf Cooperation
Council (GCC), resulted in an unprecedented infl ow of capital, both international and
intraregional capital, during the high-growth years that preceded the crisis. As such,
one of the most visible impacts of the crisis on the region was the decline in capital
infl ows in general, and of equity and credit fl ows in particular. Th e positive trends that
encouraged traditional equity and bond fl ows also helped increase the fl ow of expatri-
ates’ remittances to the region during the boom years.
Based on the World Bank’s database of remittance infl ows,1 the nominal volume of
remittance fl ows to the MENA region increased by 5.5 percent in 2006 and rose by
21.5 percent in 2007; before this growth slowed to 12 percent in 2008 and contracted
by 6.3 percent in 2009, only to start to recover and grow by 5.3 percent in 2010. In
comparison, foreign direct investment to the region contracted by 8.7 percent and tour-
ism revenues declined marginally by 0.4 percent in 2009 (United Nations 2011: 101).
Further, remittances increased by a total of $11 billion between 2005 and 2008 for an
average of $3.62 billion per year. However, the fl ows contracted by $2.3 billion in 2009,

366 l NASSIB GHOBRIL
leading to an aggregate increase of $8.6 billion between 2005 and 2009 for an average
rise of $2.2 billion per year. As such, remittances to the MENA region grew by a com-
pound annual growth rate (CAGR) of 12.7 percent during 2005–08, but by 7.6 percent
in the 2005–09 period. Further, when comparing various sources of capital and foreign
exchange earnings relative to the economy, remittance infl ows to the MENA region
declined from 3.7 percent of gross domestic product (GDP) in 2008 to 3.5 percent of
GDP in 2009, while foreign direct investment declined from 3.7 percent of GDP in 2008
to 3.3 percent of GDP in 2009, and tourism revenues remained stable at 3.5 percent
of GDP in each of 2008 and 2009 (World Bank 2011a: 100–01). Th erefore, the general
trend shows that remittances to the region were clearly aff ected by the crisis through a
slowdown of such infl ows, in nominal and percentage terms, in relation to the size of
the economy, as well as compared with other sources of foreign capital.
According to the World Bank, migrant remittances are one of the least volatile
sources of foreign exchange earnings for developing countries (Ratha 2003). Although
capital fl ows tend to rise during favorable economic cycles and fall in bad times, remit-
tances appear to show remarkable stability over time. Th e research on the subject has
shown that expatriates’ remittances tend to be stable or even countercyclical in response
to political crisis, economic downturn, or even natural disasters in the recipient coun-
try (Mohapatra, Joseph, and Ratha 2009; Ratha 2003; World Bank 2006a). Although
several studies have demonstrated the importance of both host and home country fac-
tors in determining remittance fl ows, it was not clear how remittances would behave
in response to a signifi cant economic or fi nancial downturn in the host countries
(Mohapatra and Ratha 2010).
Th e MENA region is home to several economies that depend on remittances such as
the Arab Republic of Egypt, Jordan, Lebanon, Morocco, and Tunisia, as well as to some
of the largest country sources of remittances worldwide, such as Kuwait, Qatar, Saudi
Arabia, and the United Arab Emirates. Th is report will analyze trends in Lebanon, a
country that is both one of the smallest Arab economies and one of the largest recipi-
ents of remittances in the MENA region, to determine if remittance fl ows were aff ected
by the crisis and if there was an economic impact as a result. Remittance infl ows to
Lebanon were equivalent to 21.7 percent of GDP in 2009, the highest such ratio among
MENA countries, compared with infl ows equivalent to 3.5 percent of GDP for the
region during the same year. Further, by the end of 2009, Lebanon became the largest
recipient of remittances in the region in nominal terms, relative to its GDP, and on a per
capita basis; as such, infl ows reached $7.6 billion during the year, and were equivalent
to 21.7 percent of GDP and $1,790 per capita.
Remittance Trends during the Crisis
Remittance infl ows continued to grow or remained stable during the years of political
turbulence in the country. Indeed, infl ows to Lebanon grew by 5.6 percent to $5.2 bil-
lion in 2006, then increased by 11 percent to $5.8 billion in 2007, and jumped by

31. THE GLOBAL CRISIS AND EXPATRIATES’ REMITTANCES TO LEBANON l 367
24.5 percent to $7.2 billion in 2008. However, the global fi nancial crisis brought a new
dimension and raised many questions about the sustainability of such infl ows. Indeed,
for the fi rst time, the traditional source countries of remittances were threatened by
the crisis, thereby potentially aff ecting the earning power and asset base of Lebanese
emigrants, as well as their job security.
A fi rst look at offi cial data on remittance infl ows to Lebanon suggest that such infl ows
were not severely aff ected by the crisis. Indeed, nominal gross infl ows grew by 5.3 per-
cent in 2009 compared with declines in all major remittance-receiving economies in
the region: Egypt (−17.8 percent), Morocco (−9 percent), Algeria (−6.5 percent), Mau-
ritania (−6 percent), Jordan (−5.2 percent), the Syrian Arab Republic (−4.8 percent),
Sudan (−3.5 percent), the Republic of Yemen (−2.3 percent), and Tunisia (−0.5 percent)
during the year, and rose only in the West Bank and Gaza economies (3.4 percent).
Also, migrant infl ows to Lebanon posted a CAGR of 13.4 percent between 2005 and
2008, but a CAGR of 11.3 percent in the 2005–09 period. Th is followed the trend in the
region, as the growth in 2005–09 slowed compared with growth in 2005–08 in all major
remittance-receiving countries. On a region-wide basis, remittance infl ows slowed
from a CAGR of 12.7 percent in 2005–08 to 7.6 percent in 2005–09. So the slowdown
of 2.1 percentage points for Lebanon was much milder than the deceleration of 5.1 per-
centage points in the MENA region.
Looking at the quarterly fl uctuations of infl ows at the outset of the crisis gives, how-
ever, a diff erent picture. Remittance infl ows to Lebanon dropped by 20 percent in the
third quarter of 2008, or immediately after the crisis erupted, the highest such drop
among remittance-dependent economies in the region. Further, the turnaround from
the second quarter of 2008 is even more telling, as the change from growth of 21.8 per-
cent in the second quarter to the drop of 20 percent in the third quarter of 2008 shows
a negative “turnaround” of 41.5 percent for Lebanon, constituting the steepest such
change in the region when compared with the turnaround of 35.7 percent for Egypt
during the same quarters, and to a simple slowdown but continuous growth of infl ows
to Jordan, Morocco, and Sudan. However, the fourth quarter tells a diff erent story, as
infl ows to Lebanon grew by a modest 2.4 percent from the previous quarter, compared
with drops of 9 percent in Jordan, 36.4 percent in Morocco, and 9.5 percent in Sudan.
Still, Lebanon’s fourth quarter recovery was mild compared with the 17 percent jump
of infl ows to Egypt quarter-to-quarter. Th e picture improved further in the fi rst quarter
of 2009 when remittances to Lebanon rose by 8.3 percent from the previous quarter,
compared with drops of 24 percent in Egypt, 13 percent in Jordan, and 8 percent in
Morocco. However, infl ows to Lebanon declined by 5.2 percent in the second quarter of
2009 from the preceding period and by 15.5 percent from the same quarter in 2008, but
then recovered by 10 percent in the third quarter from the previous quarter and 16 per-
cent from the same period of the previous year. Th is recovery continued in the last quar-
ter of the year with growth of 4 percent quarter-to-quarter and of 17 percent from the
last quarter of 2008. It appears that Lebanon was aff ected at the outset of the crisis, but
this impact was relatively brief and limited to the third quarter of 2008 and the second

368 l NASSIB GHOBRIL
quarter of 2009. In contrast, infl ows to other remittance-receiving Arab countries had
a more delayed reaction to the crisis, as the impact on infl ows became more apparent
in the fourth quarter of 2008, and became more severe in the fi rst quarter of 2009 and
onward through the rest of the year.
In parallel, remittance infl ows relative to the economy declined in four Arab coun-
tries and rose in four others in 2009 (table 31.1). Lebanon was in the former category, as
infl ows declined from 24 percent of GDP in 2008 to 21.7 percent of GDP in 2009, a drop
of 2.3 percentage points that constituted the most signifi cant drop in the region along
with Jordan (−2.4 percentage points). Th is was caused by a combination of a mild slow-
down in economic activity and a more pronounced slowdown of remittance infl ows (as
detailed above).
TABLE 31.1 Remittance Infl ows in MENA as Percentage of GDP, 2008–09
Country 2008 2009Percentage point change 2008–09
Lebanon 23.9 21.7 −2.3
Jordan 16.7 14.3 −2.4
Morocco 7.8 6.9 −0.9
Yemen, Rep. 5.2 5.5 0.2
Sudan 5.3 5.5 0.1
Tunisia 4.4 4.5 0.1
Egypt, Arab Rep. 5.4 3.8 −1.6
Syrian Arab Republic 2.6 2.5 0.0
Algeria 1.3 1.5 0.2
Sources: Byblos Bank Economic Research and Analysis Department, IMF, Lebanon National Accounts, and World Bank.
Economic Impact
Th e crisis had a direct impact on economic activity in the MENA region, as real GDP
growth slowed down in all major remittance-receiving countries in 2009, with Jordan,
Egypt, and Sudan experiencing the largest deceleration in growth. As such, real GDP
in Jordan slowed by 5.3 percentage points between 2008 and 2009, followed by Egypt
with a deceleration of 2.5 percentage points, and Sudan with a 2.3 percentage-point
slowdown. Lebanon posted the second lowest slowdown, with a deceleration of 0.8 per-
centage point year-on-year, but its real growth rates continued to be the highest among
remittance-dependent economies at 9.3 percent in 2008 and 8.5 percent in 2009, which
contributed to the decline in the infl ows-to-GDP ratio. Indeed, Lebanon’s nominal GDP
grew by 16.3 percent in 2009, a much faster rate than the 5.3 percent growth in nomi-
nal remittance infl ows during the year. Further, Lebanon posted the highest growth in
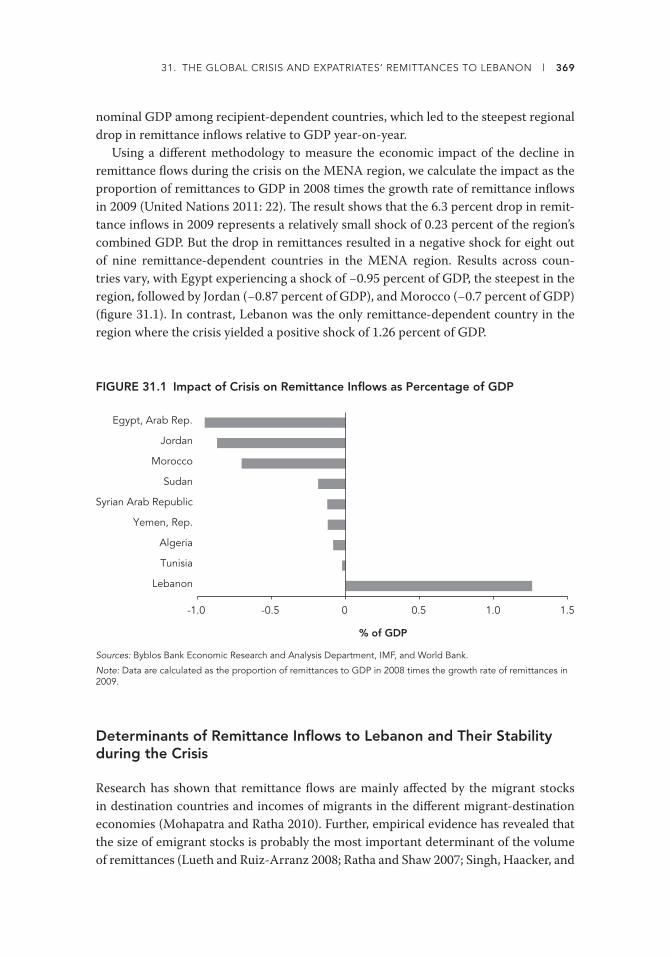
31. THE GLOBAL CRISIS AND EXPATRIATES’ REMITTANCES TO LEBANON l 369
nominal GDP among recipient-dependent countries, which led to the steepest regional
drop in remittance infl ows relative to GDP year-on-year.
Using a diff erent methodology to measure the economic impact of the decline in
remittance fl ows during the crisis on the MENA region, we calculate the impact as the
proportion of remittances to GDP in 2008 times the growth rate of remittance infl ows
in 2009 (United Nations 2011: 22). Th e result shows that the 6.3 percent drop in remit-
tance infl ows in 2009 represents a relatively small shock of 0.23 percent of the region’s
combined GDP. But the drop in remittances resulted in a negative shock for eight out
of nine remittance-dependent countries in the MENA region. Results across coun-
tries vary, with Egypt experiencing a shock of −0.95 percent of GDP, the steepest in the
region, followed by Jordan (−0.87 percent of GDP), and Morocco (−0.7 percent of GDP)
(fi gure 31.1). In contrast, Lebanon was the only remittance-dependent country in the
region where the crisis yielded a positive shock of 1.26 percent of GDP.
FIGURE 31.1 Impact of Crisis on Remittance Infl ows as Percentage of GDP
% of GDP
-1.0 -0.5 0 0.5 1.0 1.5
Lebanon
Tunisia
Algeria
Yemen, Rep.
Syrian Arab Republic
Sudan
Morocco
Jordan
Egypt, Arab Rep.
Sources: Byblos Bank Economic Research and Analysis Department, IMF, and World Bank.
Note: Data are calculated as the proportion of remittances to GDP in 2008 times the growth rate of remittances in 2009.
Determinants of Remittance Infl ows to Lebanon and Their Stability during the Crisis
Research has shown that remittance fl ows are mainly aff ected by the migrant stocks
in destination countries and incomes of migrants in the diff erent migrant-destination
economies (Mohapatra and Ratha 2010). Further, empirical evidence has revealed that
the size of emigrant stocks is probably the most important determinant of the volume
of remittances (Lueth and Ruiz-Arranz 2008; Ratha and Shaw 2007; Singh, Haacker, and

370 l NASSIB GHOBRIL
Lee 2009). Th is is because remittances are sent by the cumulated fl ows of migrants over
the years, and not just by recent migrants, a factor that makes remittances persistent
over time. But in the case of Lebanon, additional factors such as the lack of exchange
rate eff ects and the absence of mass return migration as well as the increase of eco-
nomic risks in GCC countries contributed to the resilience of infl ows during the crisis.
Continuous Migration
Lebanon is a remarkable case of a remittance-dependent economy, with a steady out-
fl ow of emigrants that has ensured a regular infl ow of remittances throughout the years.
A comprehensive study of emigration trends from Lebanon estimated that the total
number of emigrants between 1992 and 2007 was at least 466,000 and that 45 percent
of households in Lebanon have at least one family member who has emigrated during
the covered period (Kasparian 2009: 7). Th e number of migrants during the covered
period accounts for about 10.3 percent of the Lebanese resident population, refl ect-
ing the magnitude of emigration. Further, the distribution of age groups shows that
the overwhelming majority of emigrants were at a productive or preproductive stage
of their life. Indeed, 15 percent were below 25 years of age at the time of emigrating,
69 percent were between 25 and 44 years old, and 13.5 percent were between 45 and
59 years of age. Moreover, 77 percent of emigrants who left the country during the cov-
ered period were between 18 and 35 years of age.
FIGURE 31.2 Main Reasons for Emigration from Lebanon, 1992–2007
% of respondents
0 10 20 30 40 50 60
work
family
studies
political situation
another nationality
lack of confidence in the future
Source: Université Saint-Joseph, Beirut.
Also, emigration accelerated since 2002, as 25 percent of emigrants left the coun-
try between 1992 and 1996, 29 percent emigrated during the 1997–2001 period, and

31. THE GLOBAL CRISIS AND EXPATRIATES’ REMITTANCES TO LEBANON l 371
46 percent left Lebanon between 2002 and 2007. At the time of emigration, 53.5 percent
considered that emigration is fi nal, 18.7 percent said it was temporary, and the balance
of 28 percent did not make a decision at the time (Kasparian 2009: 7). Moreover, emi-
grants consisted of skilled laborers, as 30 percent had business degrees, 25 percent held
engineering diplomas, 13 percent majored in computer sciences, 13 percent were medi-
cal doctors, and 12 percent had degrees in social sciences. Further, 45.4 percent of emi-
grants between 18 and 35 years old had a university diploma compared with 39 percent
of those older than 35 years. Even though a clear majority, or 55 percent, of emigrants
left the country for work-related reasons, this proportion increased over time, because
work was the key driver for emigration of nearly 53 percent of those who left the coun-
try between 1992 and 2001, but increased to 58.3 percent during the 2002–07 period
(Kasparian 2009: 105). Th ese fi gures point to the actual and potential earning power of
emigrants at the time they left the country.
Financial Support
In parallel, the survey indicated that 49 percent of migrants provide fi nancial support to
their families in Lebanon regularly or from time to time. Th e distribution by emigration
bracket shows that earlier migrants tend to be more supportive relative to more recent
emigrants. Indeed, 58 percent of those who migrated between 1992 and 1996 fi nancially
help their families regularly or from time to time, but this ratio declines to 52.6 per-
cent for those who left the country between 1997 and 2001, and further decreases to
41.6 percent for those who migrated during the 2002–07 period (Kasparian 2009: 126).
Th e smaller share of more recent migrants who send remittances to their families is
attributed to the reality that they need time to start generating enough income to allow
them to support their family back home. But the proportion of emigrants who help
their families is still high, irrespective of the stage of migration. Th e fi nancial support is
reinforced by the fact that 76 percent of migrants who left the country and are between
18 and 35 years old visit Lebanon, including 41.4 percent who visit irregularly and
34.3 percent who visit regularly.
Sources of Remittances
Th e destination of emigration refl ects the sources of remittances to Lebanon. During
the 1992–2007 period, 35 percent of emigrants went to Arab countries, 22 percent to
North America, 20 percent to Western Europe, 9 percent to Australia, 8 percent to
Africa, 3 percent to Latin America, and 2 percent to Eastern Europe. What is noticeable
is a trend of rising emigration to Arab countries, mainly GCC countries, over time. In
fact, Arab countries were the destination of 20 percent of overall Lebanese emigrants
between 1992 and 1996, but this proportion rose to 31 percent between 1997 and 2001
and jumped to 45.5 percent during the 2002–07 period.
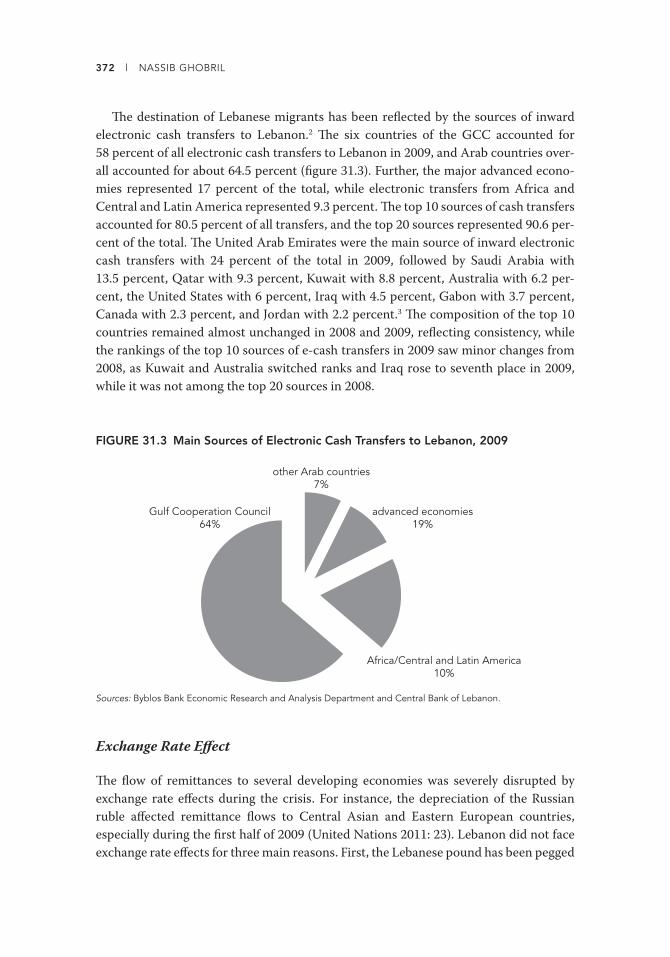
372 l NASSIB GHOBRIL
Th e destination of Lebanese migrants has been refl ected by the sources of inward
electronic cash transfers to Lebanon.2 Th e six countries of the GCC accounted for
58 percent of all electronic cash transfers to Lebanon in 2009, and Arab countries over-
all accounted for about 64.5 percent (fi gure 31.3). Further, the major advanced econo-
mies represented 17 percent of the total, while electronic transfers from Africa and
Central and Latin America represented 9.3 percent. Th e top 10 sources of cash transfers
accounted for 80.5 percent of all transfers, and the top 20 sources represented 90.6 per-
cent of the total. Th e United Arab Emirates were the main source of inward electronic
cash transfers with 24 percent of the total in 2009, followed by Saudi Arabia with
13.5 percent, Qatar with 9.3 percent, Kuwait with 8.8 percent, Australia with 6.2 per-
cent, the United States with 6 percent, Iraq with 4.5 percent, Gabon with 3.7 percent,
Canada with 2.3 percent, and Jordan with 2.2 percent.3 Th e composition of the top 10
countries remained almost unchanged in 2008 and 2009, refl ecting consistency, while
the rankings of the top 10 sources of e-cash transfers in 2009 saw minor changes from
2008, as Kuwait and Australia switched ranks and Iraq rose to seventh place in 2009,
while it was not among the top 20 sources in 2008.
FIGURE 31.3 Main Sources of Electronic Cash Transfers to Lebanon, 2009
other Arab countries7%
Africa/Central and Latin America10%
advanced economies19%
Gulf Cooperation Council64%
Sources: Byblos Bank Economic Research and Analysis Department and Central Bank of Lebanon.
Exchange Rate Eff ect
Th e fl ow of remittances to several developing economies was severely disrupted by
exchange rate eff ects during the crisis. For instance, the depreciation of the Russian
ruble aff ected remittance fl ows to Central Asian and Eastern European countries,
especially during the fi rst half of 2009 (United Nations 2011: 23). Lebanon did not face
exchange rate eff ects for three main reasons. First, the Lebanese pound has been pegged

31. THE GLOBAL CRISIS AND EXPATRIATES’ REMITTANCES TO LEBANON l 373
to the dollar since 1993, and the exchange rate has remained stable despite numerous
political, security, and fi nancial shocks in the country since then. Second, as pointed out
above, the main sources of remittances to Lebanon had currencies pegged to the dollar
and the means to defend any pressure. Indeed, fi ve of the six GCC economies peg their
currency to the dollar and the Kuwaiti dinar is pegged to a basket of currencies, and
authorities have enormous resources to face any eventuality. Th ird, other main sources
of remittances, such as Australia, Canada, and the United States, did not face currency
concerns. Given that Australia, Canada, the GCC, and the United States account for
73 percent of remittance infl ows, the general fl ow of remittances to Lebanon was not
aff ected by any exchange rate eff ect.
Return Migration
When the global fi nancial crisis erupted and its eff ects started to spread to emerging
markets and developing economies in the last quarter of 2008, speculation in Lebanon
was widespread of a mass return of expatriates, particularly from the GCC, given the
magnitude of the crisis’s early impact on the region and its geographic closeness. Some
observers expected the return of between 40,000 and 60,000 migrants overall, and oth-
ers speculated about the return of 10 percent of Lebanese based in the GCC. Still more
considered that the economic downturn in the United States in general, and its fi nancial
sector in particular, would entice migrants in the United States to return to Lebanon.
But these early expectations did not materialize for several reasons. First, the brunt of
the impact in the GCC was on the Emirate of Dubai in the United Arab Emirates. Even
though the fi nancial markets of the other countries were aff ected, the fi nancial and real
economic sectors in Dubai were the most severely hit.
Second, the GCC governments responded proactively to the crisis by using their large
budget surpluses to create fi scal stimulus that contained the slowdown and propped up
economic activity, thereby maintaining consumer and business demand. Th ird, Leba-
nese expatriates in the GCC are overwhelmingly white-collar skilled workers, so they
were able to shift sectors, move to diff erent cities or countries in the region, or adjust
their fi nancial expectations to the new realities and accept lower-paid packages to keep
their job or move to other work opportunities. Fourth, Lebanese migrants in the United
States found it more practical to shift sectors or even careers, or move to diff erent states
within the United States, rather than consider returning to Lebanon.
Fifth, a very important reason return migration did not materialize, and that was
somewhat overlooked in Lebanon, is the fact that Lebanese migrants understand the
lack of opportunities in the home country on the scale they have been accustomed to.
In fact, it constituted the main reason they left the country and was still prevalent at the
time of the crisis. Sixth, the still-fresh history of political instability in the country, and
its potential recurrence, was a key factor that discouraged migrants from returning to
Lebanon. All these reasons combined to disappoint the voices in the country that were

374 l NASSIB GHOBRIL
already forecasting the multifaceted benefi ts of returning migrants, from value-added
experience and skills, to brain return, to increased demand for goods and services,
and the resulting fi nancial windfall. However, there is anecdotal evidence of migrants
returning to Lebanon for personal reasons, and of expatriates in the GCC relocating
their families to Lebanon to reduce living expenditures. But these represent scattered
exceptions rather than a massive trend.
Correlation with Political and Other Risks
Research has shown that expatriates’ remittances tend to be stable or even countercy-
clical in response to a political crisis or economic downturn in the recipient country4
(Mohapatra, Joseph, and Ratha 2009; Ratha 2003; World Bank 2006a). Lebanon went
through severe political turmoil from early 2005 until mid-2008. As a proxy for the
level of political risks during this period, we used the PRS Group’s Political Risk ratings
for Lebanon.5 Th e rating value for Lebanon placed the country in the “Moderate Risk”6
category since June 2000 following the withdrawal of Israeli forces from the country
in the previous month. Lebanon was briefl y downgraded to the “High Risk” category
from January until April 2003, coinciding with the rise in regional tension with the
preparations and then the start of war in Iraq. Lebanon remained in the “Moderate
Risk” category until February 2005, when it was downgraded to the “High Risk” cat-
egory following the assassination of Prime Minister Rafi q Hariri and the ensuing politi-
cal, security, and military instability and uncertainties. Lebanon has remained in the
“High Risk” category despite the restoration of political stability and the improvement
in security conditions since June 2008. Th en, less than four months after political stabil-
ity was restored in Lebanon, the global fi nancial crisis erupted in mid-September after
the collapse of U.S. investment bank Lehman Brothers and started to spread beyond the
confi nes of the U.S. and Western European fi nancial systems.
We conducted a simple correlation analysis that revealed a link between political
instability and remittance infl ows to Lebanon (table 31.2). We found a 0.3 level of cor-
relation between the level of political risks in the country and the infl ow of remittances
between 2005 and 2009. We also found a stronger correlation of 0.56 between the level
of fi nancial risk in Lebanon and remittance infl ows to the country during the same
period. In other words, when the level of fi nancial risk increased in Lebanon, the level
of remittance infl ows grew. Th e fi nancial risk level is represented by the PRS Group’s
Financial Risk ratings for Lebanon, which placed the country in the “Moderate Risk”
category in August 2004 but downgraded it to the “High Risk” category in August 2008
with the start of the global fi nancial crisis.7
We further segregated the timeframe into two periods. Th e fi rst covers the start of
2005 until May 2008, which is the period of political instability in the country. Th e
second covers the period stretching from the start of June 2008 until the end of 2009,
which coincides with the outbreak of the fi nancial crisis and its evolution into a global
economic downturn. Th e results of the analysis for the January 2005 to May 2008 period
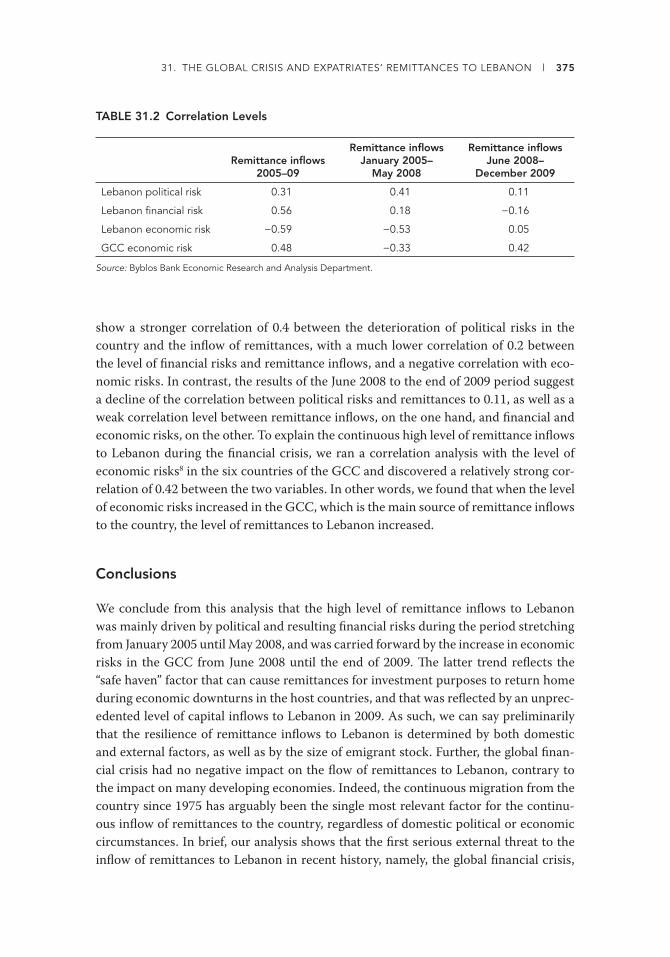
31. THE GLOBAL CRISIS AND EXPATRIATES’ REMITTANCES TO LEBANON l 375
show a stronger correlation of 0.4 between the deterioration of political risks in the
country and the infl ow of remittances, with a much lower correlation of 0.2 between
the level of fi nancial risks and remittance infl ows, and a negative correlation with eco-
nomic risks. In contrast, the results of the June 2008 to the end of 2009 period suggest
a decline of the correlation between political risks and remittances to 0.11, as well as a
weak correlation level between remittance infl ows, on the one hand, and fi nancial and
economic risks, on the other. To explain the continuous high level of remittance infl ows
to Lebanon during the fi nancial crisis, we ran a correlation analysis with the level of
economic risks8 in the six countries of the GCC and discovered a relatively strong cor-
relation of 0.42 between the two variables. In other words, we found that when the level
of economic risks increased in the GCC, which is the main source of remittance infl ows
to the country, the level of remittances to Lebanon increased.
Conclusions
We conclude from this analysis that the high level of remittance infl ows to Lebanon
was mainly driven by political and resulting fi nancial risks during the period stretching
from January 2005 until May 2008, and was carried forward by the increase in economic
risks in the GCC from June 2008 until the end of 2009. Th e latter trend refl ects the
“safe haven” factor that can cause remittances for investment purposes to return home
during economic downturns in the host countries, and that was refl ected by an unprec-
edented level of capital infl ows to Lebanon in 2009. As such, we can say preliminarily
that the resilience of remittance infl ows to Lebanon is determined by both domestic
and external factors, as well as by the size of emigrant stock. Further, the global fi nan-
cial crisis had no negative impact on the fl ow of remittances to Lebanon, contrary to
the impact on many developing economies. Indeed, the continuous migration from the
country since 1975 has arguably been the single most relevant factor for the continu-
ous infl ow of remittances to the country, regardless of domestic political or economic
circumstances. In brief, our analysis shows that the fi rst serious external threat to the
infl ow of remittances to Lebanon in recent history, namely, the global fi nancial crisis,
TABLE 31.2 Correlation Levels
Remittance infl ows 2005–09
Remittance infl ows January 2005–
May 2008
Remittance infl ows June 2008–
December 2009
Lebanon political risk 0.31 0.41 0.11
Lebanon fi nancial risk 0.56 0.18 −0.16
Lebanon economic risk −0.59 −0.53 0.05
GCC economic risk 0.48 −0.33 0.42
Source: Byblos Bank Economic Research and Analysis Department.

376 l NASSIB GHOBRIL
was off set by the large stock of migrants, their income level, the lack of exchange rate
eff ects, and no mass return migration.
Notes
1. Remittances Data, Migration and Remittances Unit, World Bank, http://worldbank.org/
prospects/migrationandremittances.
2. Such transfers provide a reliable proxy for the sources of remittance infl ows, because they
grew from 8 percent of migrant infl ows to Lebanon in 2005 to 14.5 percent of remittances
in 2009.
3. Central Bank of Lebanon (2009).
4. Prior to the global fi nancial crisis, the expanding body of research on remittances has shown
a trend of stability of such infl ows in times of political turmoil and economic downturn in
recipient countries. Also, some studies have found that remittances are strongly countercy-
clical in poor countries, but are procyclical in middle-income countries. But it was not clear
how remittances would behave during a deep economic recession in the host countries.
5. Th e Political Risk Rating includes 12 weighted variables covering both political and social
factors. Th e factors are Government Stability, Socioeconomic Conditions, Investment Pro-
fi le, Internal Confl ict, External Confl ict, Corruption, Military in Politics, Religious Tensions,
Law and Order, Ethnic Tensions, Democratic Accountability, and Bureaucracy Quality.
6. Th e PRS Group rates countries in fi ve categories of Political, Financial, and Economic Risks
ranging from “Very High Risk” to “High Risk,” “Moderate Risk,” “Low Risk,” and “Very Low
Risk.”
7. Th e PRS Group’s Financial Risk Rating measures a country’s ability to fi nance its offi cial,
commercial, and trade debt obligations. Th e components that form the rating are Foreign
Debt as a Percentage of GDP, Foreign Debt Service as a Percentage of Exports of Goods and
Services, Current Account as a Percentage of Exports of Goods and Services, Net Interna-
tional Liquidity as Months of Import Cover, and Exchange Rate Stability.
8. Th e PRS Group’s Economic Risk Rating provides a means of assessing a country’s current
economic strengths and weaknesses. Th e components that form the ratings are GDP per
Head, Real GDP Growth, Annual Infl ation Rate, Budget Balance as a Percentage of GDP, and
the Current Account as a Percentage of GDP.

377
Chapter 32
Migrant Transfers in the MENA Region: A Two-Way Street in Which Traffi c Is Changing
GEORGE NAUFAL AND CARLOS VARGAS-SILVA
This study explores remittances in the Middle East and North Africa (MENA) region
in the face of the current crisis.1 Th is is an interesting region given that it hosts some of
the top remittance-receiving and remittance-sending countries in the world. For instance,
although Saudi Arabia ranks second in the globe in remittance outfl ows with more than
$16 billion, Morocco ranks in the top remittance-receiving countries with $6 billion in
infl ows (Ratha and Xu 2008). Flows in this region are also remarkable relative to the size
of the receiving and sending economies. Bahrain, Lebanon, and Oman rank in the top-10
remittance-sending countries in terms of gross domestic product (GDP), and Jordan and
Lebanon rank in the top-10 remittance-receiving countries in terms of GDP. Th ese facts
illustrate that remittances in the MENA region should be studied as a two-way fl ow.
Nonetheless, as a result of the recent fi nancial crisis, remittance fl ows in both direc-
tions might have been aff ected. Th erefore, there is a need for an analysis of the chang-
ing patterns of remittances in the region. We attempt this by studying data on remit-
tances received from the MENA region by some of the main labor-exporting countries
to the region and data on transfers received by key remittance-receiving countries in the
MENA region. We also discuss several labor policy changes that may aff ect the long-
term prospects of migration in the region and, hence, the fl ow of remittances.
The Response of Migration and Remittances to Crises
A large fraction of the literature on remittances has focused on the determinants of
these fl ows (for example, Brown 1997; Funkhouser 1995; Lucas and Stark 1985). Based

378 l GEORGE NAUFAL AND CARLOS VARGAS-SILVA
on these fi ndings the literature has identifi ed a variety of reasons for migrants’ transfers,
such as altruism, self-interest, loan repayment, and insurance motives.
In at least three of these motives there are reasons to speculate that remittances
would respond to a home country crisis. Altruistic migrants are expected to remit more
when the home country gets hit by a crisis to compensate for the decrease in income.
Self-interested migrants, especially those who are remitting for investment purposes,
may decide to decrease their fl ows and invest in the host country, where they may obtain
more stable returns. Finally, those migrants who have some type of coinsurance agree-
ment with the household are likely to increase their fl ows to fulfi ll their part of the deal.
Th e previous literature does suggest that remittances respond to crises. For instance,
Sri Lanka’s Central Bank reported an increase in remittances, especially from the Gulf
Cooperation Council (GCC) countries, following the 2004 tsunami (Savage and Har-
vey 2007).2 Remittances may also respond to ordinary business cycle fl uctuations with
migrants increasing transfers in reaction to downturns in economic activity back home
(Chami, Fullenkamp, and Jahjah 2005). Yet this response of remittances is more likely
after local fl uctuations in output and in cases in which the majority of the host econo-
mies remain stable. In a situation such as the recent fi nancial crisis with a sluggish world
economy, migrants are also experiencing economic hardships, and, therefore, it would
be challenging for migrants to help households back home.
Th e distinct nature of this crisis may also lead to long-term consequences for migra-
tion and remittances that are diff erent from previous events. For instance, as a response
to the 1973 oil crisis, several European countries terminated their guest-worker pro-
grams. Nonetheless, many migrants decided not to return home and used some of the
rights that they had acquired over the years to bring their families to the host country
(Martin 2001). Hence, instead of a decrease in migration, there was a change in the
type of migration from labor oriented to family reunion. Moreover, although there was
an economic downturn in oil-importing countries, there was an economic expansion
in oil-exporting countries. Many of these countries started to recruit foreign workers,
and there was a change in the direction of labor migrant fl ows. To be specifi c, a massive
infl ow of migrants to the GCC was seen.
Another relevant episode is the Asian fi nancial crisis. Remittances to Asian countries
decreased during the crisis, but the impact was short lived. Th e evidence also suggests that
emigration was part of the coping mechanism of households during that crisis (Hugo 2000).
Migration and Remittances in the MENA Region
In table 32.1 we report the number of times that a country is a top-10 destination for
emigrants of one of the MENA countries. Th ere is nothing surprising about the top des-
tinations: Canada, the United States, the United Kingdom, and Germany. Nonetheless,
this region also has large numbers of internal migrants, with the GCC countries being
the most popular destinations. For instance, for almost half of the countries, Saudi Ara-
bia is a top destination.

32. MIGRANT TRANSFERS IN THE MENA REGION l 379
Th is intraregional migration in the MENA region is usually more common in
younger workers given that in this part of the world unemployment is high for fi rst-time
job seekers (Kabbani and Kothari 2005). Finally, foreign workers in this region come
mainly from Asia, particularly from countries such as Bangladesh, India, Pakistan, and
the Philippines (Ratha and Xu 2008).
Th e top portion of table 32.2 lists several countries in the MENA region along with
the mean value of annual remittance infl ows for 1970–2008. Five countries recorded an
average of remittance infl ows that surpassed $1 billion, and three countries reported an
average double-digit remittances’ share of GDP. In the last two columns of table 32.2,
we link the fi nancial crisis with the traditional remittance receivers in the region by
reporting the growth in gross national income (GNI) for these countries for 2008 (pur-
chasing power parity per capita). It seems that some of the main remittance receivers
in the region such as the Republic of Yemen are among the countries most aff ected by
the crisis in terms of a decrease in GNI. Meanwhile, the Arab Republic of Egypt, the top
remittance receiver during the period, seems to be the least aff ected country.
As seen in the bottom portion of table 32.2, the average remittance outfl ows sur-
passed the $1 billion mark in at least seven countries. Interestingly, it seems that the
economy of Saudi Arabia, the undisputed remittance-sending champion of the region,
has remained relatively strong, with its GNI increasing by 5 percent. Th e working con-
ditions of foreign workers in Saudi Arabia may change because of recent labor policy
changes. For instance, many Asian workers in Saudi Arabia are “domestic helpers”
(about 1.5 million) and have recently benefi ted from new laws that improve their legal
protections (Human Rights Watch 2009a). Although the legal improvements are a
step forward in terms of human rights, there may also be a negative eff ect on migrant
earnings given that the law limits these workers to nine hours of work per day. Th ese
changes in labor policy may aff ect migrants’ incomes and thus their capacity to remit
money back home.
TABLE 32.1 Top-10 Destinations of Migrants from MENA Countries, 2005
Destination Number of timesa Percent
Canada 20 100.0
United States 19 95.0
United Kingdom 16 80.0
Germany 16 80.0
France 15 75.0
Australia 14 70.0
Saudi Arabia 9 45.0
Source: Ratha and Xu 2008.
a. Number of times (out of 20) that a destination is listed as a top-10 destination for migrants of one of the MENA countries.
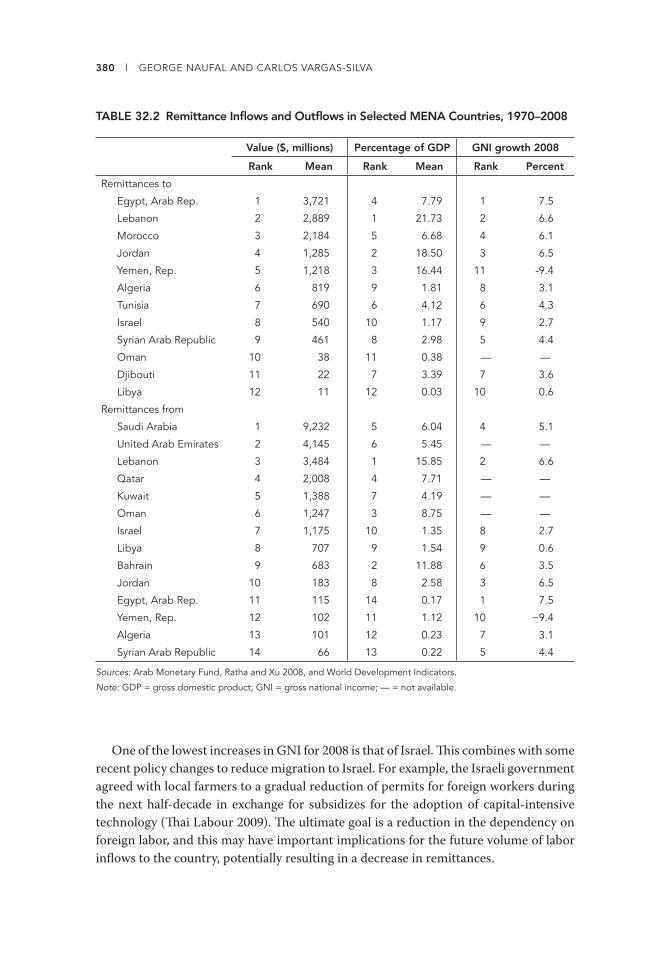
380 l GEORGE NAUFAL AND CARLOS VARGAS-SILVA
TABLE 32.2 Remittance Infl ows and Outfl ows in Selected MENA Countries, 1970–2008
Value ($, millions) Percentage of GDP GNI growth 2008
Rank Mean Rank Mean Rank Percent
Remittances to
Egypt, Arab Rep. 1 3,721 4 7.79 1 7.5
Lebanon 2 2,889 1 21.73 2 6.6
Morocco 3 2,184 5 6.68 4 6.1
Jordan 4 1,285 2 18.50 3 6.5
Yemen, Rep. 5 1,218 3 16.44 11 -9.4
Algeria 6 819 9 1.81 8 3.1
Tunisia 7 690 6 4.12 6 4.3
Israel 8 540 10 1.17 9 2.7
Syrian Arab Republic 9 461 8 2.98 5 4.4
Oman 10 38 11 0.38 — —
Djibouti 11 22 7 3.39 7 3.6
Libya 12 11 12 0.03 10 0.6
Remittances from
Saudi Arabia 1 9,232 5 6.04 4 5.1
United Arab Emirates 2 4,145 6 5.45 — —
Lebanon 3 3,484 1 15.85 2 6.6
Qatar 4 2,008 4 7.71 — —
Kuwait 5 1,388 7 4.19 — —
Oman 6 1,247 3 8.75 — —
Israel 7 1,175 10 1.35 8 2.7
Libya 8 707 9 1.54 9 0.6
Bahrain 9 683 2 11.88 6 3.5
Jordan 10 183 8 2.58 3 6.5
Egypt, Arab Rep. 11 115 14 0.17 1 7.5
Yemen, Rep. 12 102 11 1.12 10 −9.4
Algeria 13 101 12 0.23 7 3.1
Syrian Arab Republic 14 66 13 0.22 5 4.4
Sources: Arab Monetary Fund, Ratha and Xu 2008, and World Development Indicators.
Note: GDP = gross domestic product; GNI = gross national income; — = not available.
One of the lowest increases in GNI for 2008 is that of Israel. Th is combines with some
recent policy changes to reduce migration to Israel. For example, the Israeli government
agreed with local farmers to a gradual reduction of permits for foreign workers during
the next half-decade in exchange for subsidizes for the adoption of capital-intensive
technology (Th ai Labour 2009). Th e ultimate goal is a reduction in the dependency on
foreign labor, and this may have important implications for the future volume of labor
infl ows to the country, potentially resulting in a decrease in remittances.

32. MIGRANT TRANSFERS IN THE MENA REGION l 381
Figure 32.1 displays remittance infl ows and outfl ows for countries in the region.
Remittance outfl ows followed the infl ows closely until 1992, which may be a sign of the
high-level intraregional migration. However, this connection vanished between 1992
and 2006. Although remittance outfl ows continued on the same growth trend, infl ows
deviated from this path and declined in 1993. A possible explanation for these facts is
that GCC countries have progressively substituted regional workers with workers from
Asian countries.
FIGURE 32.1 Mean Remittance Flows in the MENA Region, 1970–2008
0
500
1,000
1,500
2,000
2,500
3,000
1970 1980 1990 2000 2008
rem
itta
nces
($, m
illio
ns)
inflows
outflows
Source: Ratha and Xu 2008.
Remittances during the Crisis
Th e economic crisis has taken a toll on large segments of the population in MENA
countries including foreign workers. Th ese workers took pay cuts and lost jobs, and
some had to return home. Th erefore, their remitting power is expected to be aff ected.
Th is section examines recent data on both remittance outfl ows and infl ows from
selected MENA countries to shed more light on the dynamics of these fl ows during
the crisis. Note that we do not control for other factors that could explain some of the
changes in remittances. Furthermore, the dynamics presented here do not necessarily
refl ect the totality of the impact of the crisis because the economic crisis aff ected coun-
tries at diff erent stages, and its ultimate consequences are still not clear.
Outfl ows
One of the major impediments for migration research in the MENA region is the lack of
adequate data. For many countries in the region the data do not exist, and when data are
at hand, the data are not accessible. Moreover, a variety reasons are found for expressing

382 l GEORGE NAUFAL AND CARLOS VARGAS-SILVA
concerns about the existing remittance data in the MENA region, which range from
inconsistencies in reporting formats by Central Banks to diffi culties in measuring infor-
mal fl ows.
Hence, to explore the impact of the crisis on remittances from the MENA region,
in table 32.3 we resort to data published by the Central Banks of Bangladesh, Pakistan,
and the Philippines. Together with India, these countries represent some of the most
important sources of foreign workers for the GCC. We focus fi rst on Bangladesh, Paki-
stan, and the Philippines because these countries’ Central Banks report monthly data
on remittances from the GCC. Th en we discuss the case of India, for which the data are
not readily available.
Columns (1) to (3) provide information on migrant transfers from the GCC coun-
tries to Bangladesh. Th e fi gures indicate that the leader in remittances from the region is
Saudi Arabia with more than $3 billion in remittances during 2009. Th is sum combines
with almost $2 billion from the United Arab Emirates. Th e growth rate of remittances
from the GCC to Bangladesh remains strong for all countries except Bahrain. Columns
(4) to (6) provide similar information for Pakistan. As can be appreciated from the last
column, a comparison of fl ows for 2008 and 2009 indicates that fl ows from all the GCC
countries to Pakistan have increased.
Columns (7) and (8) report remittances from the GCC countries to the Philippines
for 2008 and 2009. Filipino workers in Saudi Arabia remit over $1 billion per year.
Notice also that fi ve countries sent more than $100 million to the Philippines during
2009. Only in one instance have remittances declined in 2009 in comparison with 2008
(Kuwait). Hence, remittances in the GCC-Philippines corridor have remained stable,
and, in fact, there is a rise in volume for most countries.
TABLE 32.3 Remittances from GCC to Bangladesh, Pakistan, and the Philippines, 2008 and 2009
Sending country
Bangladesh Pakistan Philippines
2008($, mil.)
2009($, mil.)
Growth rate (%)
2008($, mil.)
2009($, mil.)
Growth rate (%)
2008($, mil.)
2009($, mil.)
Growth rate (%)
(1) (2) (3) (4) (5) (6) (7) (8) (9)
Bahrain 167.4 154.2 -8 147.8 157.0 6 159.5 166.2 4
Kuwait 949.5 993.9 5 426.9 437.7 3 125.1 104.6 −16
Oman 243.0 337.4 39 264.4 278.5 5 27.8 34.4 24
Qatar 324.8 366.3 13 283.6 375.4 32 122.9 184.6 50
Saudi Arabia 2,733.6 3,194.3 17 1,403.2 1,690.6 20 1,387.1 1,470.6 6
United Arab Emirates
1,379.5 1,958.1 42 1,289.4 2,011.1 56 621.2 644.8 4
Sources: http://www.bsp.gov.ph/statistics/keystat/ofw.htm; http://www.bangladesh-bank.org; and http://www.sbp.org.pk/ecodata/index2.asp.

32. MIGRANT TRANSFERS IN THE MENA REGION l 383
Th e discussion of table 32.3 suggests that the reduction of remittances from the GCC
to these three countries during the crisis period was only mild. Yet, as shown in fi g-
ure 32.2, if we look at the remittance growth rates for the period January–May 2010 in
comparison with the period January–May 2009, we can detect a further reduction on
the fl ow of remittances from the GCC to some of these countries. In the case of Paki-
stan, there is a reduction of infl ows from Bahrain, Qatar, and the United Arab Emirates;
in the case of Bangladesh, there is a reduction in fl ows from Qatar and the United Arab
Emirates.
FIGURE 32.2 Annual Growth Rate of Remittances from GCC Countries to Bangladesh, Pakistan, and the Philippines, January 2009–May 2010
per
cent
−20
−10
0
10
20
30
40
50
60
Bahrain Kuwait Oman Qatar SaudiArabia
UnitedArab
Emirates
PhilippinesBangladesh Pakistan
Sources: http://www.bsp.gov.ph/statistics/keystat/ofw.htm; http://www.bangladesh-bank.org; and http://www.sbp.org.pk/ecodata/index2.asp.
Table 32.3 supports our possible explanation for the drift in the growth of remit-
tance infl ows and outfl ows in the MENA region. A large share of remittance fl ows from
the GCC is not directed toward other MENA countries but rather to Asian countries.
Two facts may explain this pattern. First, Asian migrants typically do not settle in these
countries and do not bring family members with them and, therefore, may have more
responsibilities back home (Kapiszewski 2006). Second, it is argued that in the GCC
countries, Asians are preferred to Arabs because they are not seen as a political threat.
An infl ux of Arab workers may encourage the idea of a pan-Arab union in which actual
national borders in the region are challenged (Kapiszewski 2006).
Notice that in all three cases fl ows from Kuwait are among the most aff ected. Yet
the situation of foreign workers in Kuwait may improve in the future because of a new

384 l GEORGE NAUFAL AND CARLOS VARGAS-SILVA
law that grants over 2 million foreigners more rights (Human Rights Watch 2009a).
However, the law continues to maintain the kafala system by which each foreign worker
needs a local sponsor, kafeel. Other countries in the region have modifi ed their spon-
sorship system. In Bahrain, for example, the Labour Market Regulatory Authority, and
not employers, is now in charge of sponsoring migrants’ visas (Human Rights Watch
2009b). Foreign workers in the GCC countries need a sponsor, and their rights vary
greatly and mainly depend on their occupation. Th erefore, any signifi cant change in
these rights will ultimately aff ect their working conditions and their remitting patterns.
In addition to Bangladesh, Pakistan, and the Philippines, India is one of the main
labor-exporting countries to the GCC countries. Th e United Arab Emirates is the
main destination for Indian migrants in the region. About 1.5 million Indian migrants
reside in the United Arab Emirates, and Indian migrants are believed to account for
about 30 percent of the population of Dubai (Rajamony 2009). Th ese migrants are typi-
cally employed in the construction or the service sector. Th is can be worrisome given
that Dubai is experiencing a tough economic downturn with particular prominence
of a weak construction sector. Dubai World, the investment company that manages
the portfolio of the Dubai government, announced in 2009 that it was suspending the
repayment of its debt (Bloomberg 2009). Th e recent data suggest that migration from
India to the GCC countries is actually slowing (Rajamony 2009).
Infl ows
As mentioned above, the MENA region is also an important receiver of remittances,
and as such it is important to evaluate the impact of the crisis on remittances to some
of the main receiving countries.
In table 32.4 we list the quarterly volume of transfers received by Egypt, Jordan, and
Morocco since 2008, along with the growth rates with respect to the same quarter of the
previous year. Egypt and Morocco are probably the two most important labor export-
ers in the MENA region; Jordan is another important regional labor exporter, and its
Central Bank reports remittances received on a frequent basis. In all cases there is a
clear pattern of increasing remittances at the beginning of the period, then decreasing
transfers, that is again followed by increasing transfers toward the end of the period.
Hence, there is support for the notion that some of the countries in the region suf-
fered a decrease in remittances around the peak of the crisis. In the case of Egypt it
seems that the decline in transfers in 2009 was dramatic, with remittances declining
by about 24 percent during the second quarter and 25 percent during the fourth quar-
ter. Yet remittances increased signifi cantly during the fi rst quarter of 2010. For Jordan
we do not have data after the second quarter of 2009, but the Central Bank of Jordan
announced that remittances to Jordan decreased by 4 percent in the fi rst seven months
of 2009 relative to the same period of 2008 (Badih 2010). Th is decrease seems to have
been temporary given that the Central Bank of Jordan now reports that remittances
have increased by 2.4 percent during the fi rst four months of 2010.3

32. MIGRANT TRANSFERS IN THE MENA REGION l 385
TABLE 32.4 Quarterly Remittances Received for 2008, 2009, and 2010
millions of dollars
Period
Egypt, Arab Rep. Jordan Morocco
Volume ($, millions)
Growth rate (%)
Volume ($, millions)
Growth rate (%)
Volume ($, millions)
Growth rate (%)
2008: Q1 2,064.8 — 830.9 8.51 1,628.8 17.00
2008: Q2 2,393.2 24.28 985.6 13.88 1,816.4 18.00
2008: Q3 1,950.7 −1.21 1,035.6 13.49 2,120.0 3.00
2008: Q4 2,285.3 7.46 944.0 6.02 1,347.6 −23.00
2009: Q1 1,738.0 −15.83 823.2 −0.93 1,243.7 −24.00
2009: Q2 1,831.7 −23.46 917.7 −6.89 1,446.6 −20.00
2009: Q3 1,855.7 −4.9.0 — — 1,942.1 −8.00
2009: Q4 1,724.2 −24.6.0 — — 1,647.0 22.00
2010: Q1 2,877.4 65.6.0 — — 1,628.8 17.00
Sources: www.cbe.org.eg and www.worldbank.org/prospects/migrationandremittances.
Note: Growth rates are estimated with respect to the same period during the previous year. Q = quarter; — = not available.
Finally, for Morocco there was a signifi cant reduction in transfers starting in the
fourth quarter of 2008, but since late 2009 these fl ows seem to be increasing. Some
European countries with large numbers of Moroccan migrants, such as Spain, started
voluntary return programs in which they provide incentives to encourage migrants
to return home. Although a considerable number of Latin American migrants have
signed up for this program in Spain, the program has not been successful with regard
to Moroccan migrants (McCabe, Lin, and Tanaka 2009). Hence, it seems that many
Moroccan migrants have decided to weather the storm in the host countries instead of
returning home.
Conclusion
Remittances from countries in the MENA region followed the remittance infl ows into
countries in the region closely until 1992, which we take as a manifestation of the high
levels of intraregional migration. Interestingly, this connection vanished after 1992.
One potential explanation for this fact is the growing dependence of this region on
workers from Asia. During the 1970s the thriving GCC countries demanded a large
pool of unskilled workers that was largely fi lled with workers from other MENA coun-
tries. However, workers from the MENA region have faced increased competition from
Asian workers.
With regard to the fi nancial crisis, it seems that remittances from the MENA region
to some popular destinations did not decline in 2009, but some evidence suggests that
we may see a slowdown in remittances for 2010. On the other hand, infl ows to Egypt,

386 l GEORGE NAUFAL AND CARLOS VARGAS-SILVA
Jordan, and Morocco decreased signifi cantly during 2009. Th is was bad news for these
countries given that their revenues from tourism and exports were also aff ected by the
crisis. Oil exporters in the MENA region also face challenging conditions (Ellaboudy
2010) given the noteworthy drop in investment that has, in the end, aff ected the number
of jobs available for migrants. However, remittances to the MENA countries seem to
have been on an upward trend for 2010; hence, it is possible that the impact of the crisis
on remittances was only short term. In general, the short-term prospects of remittance
outfl ows and infl ows in this region remain uncertain.
In regard to recent labor policies adopted in the region, most of these policies have
been directed toward improving the working conditions of foreigners. Although the
majority of these policies fall short of granting full human rights to foreign workers,
these policies are a step forward. Only in a few cases such as Israel is there a formal
government policy to reduce the number of foreign workers. Th e new policies that are
in place in several countries in the region suggest that there is still considerable demand
for foreign labor. As such, the future may bring extra competition between Asian work-
ers and workers from other MENA countries for jobs in the GCC countries.
Notes
1. MENA countries in this study refer to Algeria, Bahrain, Djibouti, the Arab Republic of Egypt,
the Islamic Republic of Iran, Iraq, Israel, Jordan, Kuwait, Lebanon, Libya, Morocco, Oman,
Palestine, Qatar, Saudi Arabia, the Syrian Arab Republic, Tunisia, the United Arab Emirates,
and the Republic of Yemen.
2. GCC countries: Bahrain, Kuwait, Oman, Qatar, Saudi Arabia, and the United Arab Emirates.
3. Source: Central Bank of Jordan Monthly Report. Th e data for Jordan are available at the Cen-
tral Bank of Jordan website, www.cbj.gov.jo. but provided in Jordanian dinars. Th e data sug-
gest that remittances decreased (increased) by 8 and 4 percent during the third and fourth
quarters, respectively, of 2009 and increased by 3 percent during the fi rst quarter of 2010.

387
Bibliography
Acosta, P., C. Calderon, P. Fajnzylber, and H. Lopez. 2008. “What Is the Impact of Inter-
national Migrant Remittances on Poverty and Inequality in Latin America?” World
Development 36: 89–114.
Adams, R. 2009. “Th e Determinants of International Remittances in Developing Coun-
tries.” World Development 37(1): 93–103.
Adams, R. H., Jr. 1991. “Th e Economic Uses and Impact of International Remittances in
Rural Egypt.” Economic Development and Cultural Change 39: 695–722.
—. 2003. “International Migration, Remittances, and the Brain Drain: A Study of
24 Labor Exporting Countries.” Policy Research Working Paper 3069. World Bank,
Washington, DC.
—. 2006. “International Remittances and the Household: Analysis and Review of
Global Evidence.” Journal of African Economies 15(Supp.): 396–425.
Adams, R. H., Jr., A. Cuecuecha, and J. Page. 2008. “Th e Impact of Remittances on Pov-
erty and Inequality in Ghana.” Policy Research Working Paper 4732. World Bank,
Washington, DC.
Adams, R. H., Jr., and J. Page. 2003. “Poverty, Inequality and Growth in Selected Middle
East and North Africa Countries, 1980–2000.” World Development 31(6): 1047–63.
—. 2005. “Do International Migration and Remittances Reduce Poverty in Devel-
oping Countries?” Wor ld Development 33(10): 1645–69.
ADB (Asian Development Bank). 2009a. “Asian Development Outlook 2009: Rebalanc-
ing Asia’s Growth.” Asian Development Bank, Manila. http://www.adb.org/Docu-
ments/Books/ADO/2009/default.asp.
—. 2009b. Fact Sheet. December. Asian Development Bank, Manila.
—. 2009c. “Statistical Database System Online.” Asian Development Bank, Manila.
https://sdbs.adb.org.

388 l BIBLIOGRAPHY
Adenutsi, D. E. 2010. “Do International Remittances Promote Human Development in
Poor Countries? Empirical Evidence from Sub-Saharan Africa.” International Jour-
nal of Applied Economics and Finance 4(1): 31–45.
Adger, W. N. 2000. “Social and Ecological Resilience: Are Th ey Related?” Progress in
Human Geography 24(3): 347–64.
Adger, W. N., P. M. Kelly, A. Winkels, L. Q. Huy, and C. Locke. 2002. “Migration, Remit-
tances, Livelihood Trajectories, and Social Resilience.” Ambio 31(4): 358–66.
Aghion P., G. M. Angelatos, A. Banerjee, and K. Manova. 2005. “Volatility and Growth:
Credit Constraints and Productivity-Enhancing Investment.” NBER Working Paper
11349. Cambridge, MA.
Aguilar, F. V. J. 1996. “Th e Dialectics of Transnational Shame and National Identity.”
Philippine Sociological Review 44: 101–36.
Åkesson, L. 2009. “Remittances and Inequality in Cape Verde: Th e Impact of Changing
Family Organization.” Global Networks 9(3): 381–98.
Akkoyunlu, S. 2010. “Are Turkish Migrants Altruistic? Evidence from the Macro Data.”
KOF Working Paper 246.
Akkoyunlu, S., and K. A. Kholodilin. 2008. “A Link between Workers’ Remittances and
the Business Cycles in Germany and Turkey.” Emerging Markets Trade and Finance
44(5): 23–41.
Akkoyunlu, S., and T. Vogel. 2008. “Self-employment of Immigrants in the UK, the U.S.
and Germany.” Paper presented at the 22nd ESPE Conference, University College
London.
Alfaro, L., A. Chanda, S. Ozcan-Kalemli, and S. Sayek. 2010. “Does Foreign Direct
Investment Promote Growth? Exploring the Role of Financial Markets on Linkages.”
Journal of Development Economics 91: 242–56.
Allen, F., and D. Gale. 1998. “Optimal Financial Crises.” Journal of Finance 53: 1245–83.
Al-Sharmani, M. 2006. “Living Transnationally: Somali Diasporic Women in Cai ro.”
International Migration 44(1): 55–77.
Ambrosetti, E. 2009. “Th e Impact of the Economic Crisis on Migrations Flows between
Italy and North Africa.” CARIM Analytic and Synthetic Notes 36, European Univer-
sity Institute.
Ammassari, S., and R. Black. 2001. “Harnessing the Potential of Migration and Return
to Promote Development: Applying Concepts to West Africa.” Sussex Migration
Working Papers. Sussex: Sussex Center for Migration Research.
Amuedo-Dorantes, C., and S. Pozo. 2010. “Accounting for Remittance and Migration
Eff ects on Children’s Schooling.” World Development 38(12): 1747–59.
—. 2011. “New Evidence on the Role of Remittances on Health Care Expenditures
by Mexican Households.” Review of Economics of the Household 9(1): 69–98.
Ananta, A., and E. N. Arifi n, eds. 2004. International Migration in Southeast Asia.
Singapore: Institute of Southeast Asian Studies.

BIBLIOGRAPHY l 389
Anderson, B., and M. Ruhs. 2009. “Who Needs Migrant Workers? Introduction to the
Analysis of Staff Shortages, Immigration and Public Policy.” Centre on Migration,
Policy and Society (COMPAS), University of Oxford. http://www.compas.ox.ac.uk/
research/labourmarket/a-need-for-migrant-labour/#c228.
Andreoni, J. 1989. “Giving with Impure Altruism: Applications to Charity and Ricardian
Equivalence.” Journal of Political Economy 97(6): 1447–58.
Arai, M., and R. Vilhelmsson. 2004. “Unemployment-Risk Diff erentials between Immi-
grant and Native Workers in Sweden.” Industrial Relations 43: 690–98.
Arango, J. 2010. “Después del Gran Boom. La inmigración en bisagra del cambio.” In La
inmigración en tiempos de crisis: Anuario de la Inmigración en España. Barcelona:
CIDOB.
Arellano, M., and S. Bond. 1991. “Some Tests of Specifi cation for Panel Data: Monte
Carlo Evidence and an Application to Employment Equations.” Review of Economic
Studies 58(2): 277–97.
Ashraf, N., D. Aycinena, C. Martinez, and D. Yang. 2009. “Remittances and the Problem
of Control: A Field Experiment amon g Migrants from El Salvador.” Mimeo. Univer-
sity of Michigan.
Askew, M. 2002. Bangkok: Place, Practice, and Representation. London: Routledge.
Assis, M. M. B. 1995. “Overseas Employment and Social Transformation in Source
Communities: Findings from the Philippines.” Asian and Pacifi c Migration Journal
4(2–3): 327–46.
Australia and New Zealand. 2010. “Australia & New Zealand Governments’ Joint Report
to the Pacifi c Islands Forum Economic Ministers’ Meeting: Trends in Remittance
Fees and Charges.” http://forumsec.org.fj .
Avendano, R., N. Gaillard, and S. N. Parra. 2009. “Are Working Remittances Relevant
for Credit Rating Agencies?” OECD Working Paper 282. Organization for Economic
Co-Operation and Development, Paris.
Aycinena, D., C. Martinez, and D. Yang. 2009. “Th e Impact of Remittance Fees on
Remittance Flows: Evidence from a Field Experiment among Salvadoran Migrants.”
Mimeo. University of Michigan.
Badih, Samia. 2010. “Remittance Flow Remains Strong.” Gulfnews.com, September 12.
http://gulfnews.com/business/features/remittance-fl ow-remains-strong-1.680688.
Bank of Albania. 2010. “Raporti Vjetor 2009.” Tirana.
Bank of Spain. 2011a. “Balance of Payments.” http://www.bde.es/webbde/es/estadis/
estadis.html.
—. 2011b. “Eurosistema, Estadísticas Complementarias.” http://www.bde.es/
webbde/es/estadis/infoest/tc_1_3e.pdf.
Barajas, A., R. Chami, C. Fullenkamp, M. Gapen, and P. Montiel. 2009. “Do Workers’
Remittances Promote Economic Growth?” Working Paper 09/153. IMF, Washing-
ton, DC.

390 l BIBLIOGRAPHY
Barajas, A., R. Chami, C. Fullenkamp, and A. Garg. 2010. “Th e Global Financial Crisis
and Workers’ Remittances to Africa: What’s the Damage?” Working Paper 10/24.
International Monetary Fund, Washington, DC.
Barjaba, K. 2002. “Albanian State Emigration Policy.” Paper presented at the “Interna-
tional Conference on Albanian Migration and New Transnationalism,” Centre for
Migration Research, Sussex University, September 6–7.
Bastian, J. 2010. “Economic Fact Sheet Greece 2009/10.” February. Eliamep.
Beck, T., R. Levine, and N. Loayza. 2000. “Finance and the Sources of Growth.” Journal
of Financial Economics 58: 261–300.
Beck, T., and M. S. Martínez Pería. 2009. “What Explains the Cost of Remittances? An
Examination across 119 Country Corridors.” Policy Research Working Paper 5072.
World Bank, Washington, DC.
Bedford, C. 2010. “What Can We Learn from the Past about Managing the Future in the
Pacifi c.” Keynote address presented at the University of the South Pacifi c’s Interna-
tional Conference, “Future Challenges, Ancient Solutions,” November 29–Decem-
ber 3.
Bedford C., R. Bedford, and E. Ho. 2010. “Engaging with New Zealand’s Recognized
Seasonal Employer Work Policy: Th e Case of Tuvalu.” Asian and Pacifi c Migration
Journal 19: 421–45.
Bell, K., N. Jarman, and T. Lefebvre. 2004. Migrant Workers in Northern Ireland. Belfast:
Institute for Confl ict Research.
Bencivenga, V., and B. Smith. 1991. “Financial Intermediation and Endogenous Growth.”
Review of Economic Studies 58(2): 195–209.
Bencivenga, V., B. Smith, and R. Starr. 1995. “Transaction Costs, Technological Choice,
and Endogenous Growth.” Journal of Economic Th eory 67(1): 53–177.
Bhaopichitr, K., V. Sirimaneetham, A. Luangpenthong, and R. Th ongampai. 2008. Th ai-
land Economic Monitor. April. Bangkok: World Bank Offi ce, Bangkok.
Binford, L. 2003. “Migrant Remittances and (Under)Development in Mexico.” Critique
of Anthropology 23(3): 305–36.
Bloomberg. 2009. “Dubai World Seeks to Delay Debt Payments as Default Risk Soars.”
November 25. http://www.bloomberg.com.
BMZ (Bundesministerium für wirtschaftliche Zusammenarbeit und Entwicklung).
2009. “Studies on the Impact of the Downturn on Migration and Development in the
Philippines, Nepal, and Uzbekistan.” German Federal Ministry for Economic Coop-
eration and Development.
Bollard, A., D. McKenzie, M. Morten, and H. Rapoport. 2009. “Remittances and the
Brain Drain Revisited: Th e Microdata Show Th at More Educated Migrants Remit
More.” Discussion Paper 26/09. Center for Research and Analysis of Migration.
Bond, S., A. Hoeffl er, and J. Temple. 2001. “GMM Estimation of Empirical Growth
Models.” Working Paper. Nuffi eld College, University of Oxford.

BIBLIOGRAPHY l 391
Bonilla, S. A., and J. A. Cervantes. 2010. “Remesas Familiares; Temas Económicos y
Sociales de Actualidad.” In México, ed. E. Sepúlveda. México, D.F: Banco de México.
Bourdieu, P. 1977. Outline of a Th eory of Practice. Cambridge: Cambridge University
Press.
Bowman, C., and S. Chand. 2007. “Size Matters: Th e Impact of Aid on Institutions.”
Research Paper 2007/25. UNU-WIDER. http://www.wider.unu.edu/stc/repec/pdfs/
rp2007/rp2007-25.pdf.
BRC (Banco de la República de Colombia). 2010. Banco de la República de Colombia,
Encuesta Trimestral de Remesas. http://www.banrep.gov.co/estad/dsbb/remesas_
paises.xls.
Brettell, C. B. 2007. “Adjustment of Status, Remittances, and Return: Some Observa-
tions on the 21st Century Migration Processes.” City and Society 19(1): 47–59.
Brown, R. P. C. 1997. “Est imating Remittance Functions for Pacifi c Island Migrants.”
World Development 25(4): 613–26.
—. 1998. “Do Migrants’ Remittances Decline over Time? Evidence from Tongans
and Western Samoans in Australia.” Contemporary Pacifi c 10(1): 107–51.
Brown, R. P. C., and D. A. Ahlburg. 1999. “Remittances in the South Pacifi c.” Interna-
tional Journal of Social Economics 26 (1–3): 325–44.
Brown, R. P. C., and J. Connell. 1994. “Th e Global Flea Market : Migration, Remittances
and the Informal Economy in Tonga.” Development and Change 24(4): 611–47.
Brown, R. P. C., and B. Poirine. 2005. “A Model of Migrants’ Remittances with Human
Capital Investment and Intrafamilial Transfers.” International Migration Review
39(2): 407–38.
Browne, C., and A. Mineshima. 2007. “Remittances in the Pacifi c Region.” IMF Working
Paper 07/35. International Monetary Fund, Washington, DC.
Browne, R., and G. Leeves. 2007. “Impacts of International Migration and Remittances
on Source Country Household Incomes in Small Island States: Fiji and Tonga.” Dis-
cussion Paper 347. School of Economics, University of Queensland, Australia.
Brumer, A. 2008. “Gender Relations in Family-Farm Agriculture and Rural-Urban
Migration in Brazil.” Latin American Perspectives 35(6): 11–28.
Buch, C. M., and A. Kuckulenz. 2010. “Worker Remittances and Capital Flow s to Devel-
oping Countries.” International Migration 48(5): 89–117.
Bugamelli, M., and F. Paterno. 2009. “Do Workers’ Remittances Reduce the Proba bility
of Current Account Reversals?” World Development 37(12): 1821–38.
Calì, M., and S. Dell’Erba. 2009. “Th e Global Financial Crisis and Remittances: What
Past Evidence Suggests.” Working Paper 303. Overseas Development Institute, Lon-
don.
Cameron, R. 1967. Banking in the Early Stages of Industrialization. New York: Oxford
University Press.

392 l BIBLIOGRAPHY
Carletto, G., B. Davis, M. Stampini, and A. Zezza. 2006. “A Country on the Move: Inter-
national Migration in Post-Communist Albania.” International Migration Review
40(4): 767–85.
Carling, J. 2005. “Migrant Remittances and Development Cooperation.” PRIO Report
1/2005. PRIO, Oslo.
—. 2008. “Th e Determinants of Migrant Remittances.” Oxford Review of Economic
Policy 24(3): 581–98.
Catherine, V. 2007. “Femmes immigrées en Grèce. Double vulnérabilité et précarité.”
Revue Interrogations 4(June): 164–82.
CCOO (Centro de Información para Trabajadores Extranjeros). 2009. “Memoria 2009.”
http://www.ccoo.cat/cite/documentacio/memoria2009/index.htm.
Central Bank of Lebanon. 2009. “Financial Markets Handbook 2009.” Bank du Liban
Financial Markets Department, December 31, vol. 12, no. 2. http://www.bdl.gov.lb/fm.
Centre for Development Studies. 2008. “Global Financial Crisis and Kerala Economy:
Impact and Mitigation Measures.” Report submitted to the government of Kerala.
Cervantes, J. A., and A. Barajas. 2009. “Remuneraciones de los trabajadores mexicanos
en Estados Unidos.” Revista de Comercio Exterior 59(9): 735–45.
Chalamwong, Y. 1998. “Economic Crisis, International Migration, and the Labor Mar-
ket in Th ailand.” TDRI Quarterly Review 13(1): 12–21.
Chami, R., C. Fullenkamp, and S. Jahjah. 2005. “Are Immigrant Remittance Flows a
Source of Capital for Development?” IMF Staff Papers 52: 55–81.
Chami, R., D. Hakura, and P. Montiel. 2009. “Remittances: An Automatic Stabilizer?”
IMF Working Paper 09/91. International Monetary Fund, Washington, DC.
Chin, K. 1999. Smuggled Chinese: Clandestine Immigration to the United States. Phila-
delphia: Temple University Press.
Christiansen, C. C. 2008. “Hometown Associations and Solidarities in Kurdish Trans-
national Villages: Th e Migration-Development Nexus in a European Context.” Euro-
pean Journal of Development Research 20(1): 88–103.
Civici, A., I. Gedeshi, and D. Shehi. 1999. “Migration, Agriculture and Rural Develop-
ment in Albania, Bulgaria and FYR of Macedonia: Th e Case of Albania.” ACE-Phare
Programme, P-96-6070R.
Clarke, G., and S. Wallsten. 2004. “Do Remittances Protect Households in Developing
Countries against Shocks? Evidence from a Natural Disaster in Jamaica.” Mimeo.
World Bank, Washington, DC.
Clemens, M. A. 2009. “Skill Flow: A Fundamental Reconsideration of Skilled-Worker
Mobility and Development United Nations Development Programme.” Human
Development Research Paper 2009/08.
Cliggett, L. 2005. “Remitting the Gift: Zambian Mobility and Anthropological Insights
for Migration Studies.” Population, Space and Place 11(1): 35–48.

BIBLIOGRAPHY l 393
Coats, D. 2008. Migration Myths: Employment, Wages and Labour Market Performance.
London: Work Foundation.
COE (Council of E urope). 2006. Social Remittances of the African Diasporas in Europe.
Lisbon: North-South Centre of the Council of Europe.
Cohen, J. H. 2005. “Remittance Outcomes and Migration: Th eoretical Con tests, Real
Opportunities.” Studies in Comparative International Development 40(1): 88–112.
—. 2010. “Oaxacan Migration and Remittances as Th ey Relate to Mexican Migra-
tion Patterns.” Journal of Ethnic and Migration Studies 36(1): 149–61.
Cohen, J. H., and L. Rodriguez. 2005. “Remittance Outcomes in Rural Oaxaca, Mexico:
Challenges, Options and Opportunities for Migrant Households.” Population, Space
and Place 11(1): 49–63.
Cohen, J. H., L. Rodriguez, and M. Fox. 2008. “Gender and Migration in the Central Val-
leys of Oaxaca, Mexico.” International Migration 46(1): 79–101.
Cohen, J., and I. Sirkeci. 2011. Cultures of Migration: Global Nature of Contemporary
Human Mobility. Austin: University of Texas Press.
Comunidad de Madrid. 2010. “Cuantifi cación de las remesas de emigrantes enviadas
desde la Comunidad de Madrid en 2009.” Madrid, February–March 2010. http://
www.remesas.org/fi les/Informe2010_d.pdf.
Conde, C. 2008. “Generation Left behind by Filipino Migrant Workers.” New York Times,
December 23.
Connell, J., and R. P. C. Brown. 1995. Remittances in the Pacifi c: An Overview. Manila:
Asian Development Bank.
Conway, D. 2007. “Th e Importance of Remittances for the Caribbean’s Future Tran-
scends Th eir Macroeconomic Infl uences.” Global Development Studies 4(3–4):
41–76.
Cornelius, W. A., T. J. Espenshade, and I. Salehyan, eds. 2001. Th e International Migra-
tion of the Highly Skilled: Demand, Supply, and Deve lopment Consequences in Send-
ing and Receiving Countries. La Jolla: Center for Comparative Immigration Studies,
University of California, San Diego.
Cortina, J., and E . Ochoa-Reza. 2008. “More Migration and Less Remittances? An
Analysis of Turkish, Polish and Mexican Migration as Th ey Evolve from Remitters
to Savers.” Paper for Migration Task Force Meeting Initiative for Policy Dialogue,
Columbia University, New York, April. http://policydialogue.org.
Cox, D. 1987. “Motives for Private Transfers.” Journal of Political Economy 95(3):
508–46.
Cox, D., Z. Eser, and E. Jimenez. 1998. “Motives for Private Transfers over the Life Cycle:
An Analytical Framework and Evidence for Peru.” Journal of Development Economics
55(1): 57–80.
Curran, S. R., F. Garip, C. Y. Chung, and K. Tangchonlatip. 2005. “Gendered Migrant
Social Capital: Evidence from Th ailand.” Social Forces 84(1): 225–55.

394 l BIBLIOGRAPHY
Dale, A. 2008. “Pakistani and Bangladeshi Women’s Labour Market Participation.”
Working Paper 2008-02. Catie Marsh Centre for Census and Survey Research, Uni-
ve rsity of Manchester.
Danzer, A., and O. Ivaschenko. 2010. “Migration Patterns in a Remittances Dependent
Economy: Evidence from Tajikistan during the Global Financial Crisis.” Migration
Letters 7(2): 190–202.
Datta, K., C. McIlwaine, J. Willis, Y. Evans, J. Herbert, and J. May. 2006. Challenging
Remittances as the New Development Mantra: Perspectives from Low-Paid Migrant
Workers in London. London: University of London.
Davies, S. 2007. “Remittances as Insurance for Idiosyncratic and Covariate Shocks in
Malawi: Th e Importance of Distance and Relationship.” MPRA Paper 4463. Univer-
sity Library, Munich, Germany.
De, P. K., and D. Ratha. 2007. “Does the One Who Leaves Provide Better? Impacts of
International Remittances on Human Capital in Sri Lanka.” Manuscript, New York
University.
De Haas, H. 2005. “International Migration, Remittances and Development: Myths and
Facts.” Th ird World Quarterly 26(8): 1269–84.
DeParle, J. 2010. “D ownturn Does Little to Slow Migration.” New York Times, May 27.
De Soto, H., P. Gordon, I. Gedeshi, and Z. Sinoimeri. 2002. Poverty in Albania: A Quali-
tative Assessment. Washington, DC: World Bank.
De Zwager, N., I. Gedeshi, E. Germenji, and C. Nikas. 2005. Competing for Remittances.
Tirana: IOM.
De Zwager, N., W. Gressmann, and I. Gedeshi. 2010. “Market Analysis: Albania—Maxi-
mising the Development-Impact of Migration-Related Financial Flows and Invest-
ment to Albania.” Vienna, August.
DGEC. 2009. Encuesta de Hogares de Propósitos Múltiples (EPHM). San Salvador: Gen-
eral Directorate of Statistics and Census. http://www.digestyc.gob.sv/MainFrame/
EstadisticasSociales.htm.
Diamond, D., and P. Dybvig. 1983. “Bank Runs, Deposit Insurance and Liquidity.” Jour-
nal of Political Economy 91: 401–19.
Ditter, J.-G. 2008. “L’Albanie, de l’autarcie à la mondialisation.” Revue EurOrient
27(spring): 149–66.
Dixon, C. 1999. Th e Th ai Economy: Uneven Development and Internationalisation. New
York: Routledge.
Djajić, S. 1986. “International Migration, Remittances and Welfare in a Dependent
Economy.” Journal of Development Economics 21: 229–34.
Doner, R. F. 2009. Th e Politics of Uneven Development: Th ailand’s Economic Growth in
Comparative Perspective. Cambridge: Cambridge University Press.
DRC (Development Research Centre). 2009. Making Migration Work for Development.
Brighton: University of Sussex and Department for International Development.

BIBLIOGRAPHY l 395
D’Souza, A. 2010. Moving towards Decent Work for Domestic Workers: An Overview of
the ILO’s Work. Geneva: International Labour Organization.
Durand, J., William Kandel, Emilio A. Parrado, and Douglas S. Massey. 1996. “Interna-
tional Migration and Development in Mexican Communities.” Demography 33(2):
249–64.
Dustmann, C., J. Ludsteck, and U. Schönberg. 2009. “Revisiting the German Wage
Structure.” Quarterly Journal of Economics 124(2): 843–81.
Echazarra, A. 2010. “Accounting for the Time Pattern of Remittances in the Spanish
Context.” Working Paper 5-2010. January. http://www.remesas.org.
Eckstein, Susan. 2010. “Remittances and Th eir Unintended Consequences in Cuba.”
World Development 38(7): 1047–55.
Economic Intelligence Unit. 2009. “Vanuatu Country Report.” July 2009. Economic
Intelligence Unit Limited.
Edwards, A. C., and M. Ureta. 2003. “International Migration, Remittances, and School-
ing: Evidence from El Salvador.” NBER Working Paper W9766. Cambridge, MA.
Elbadawi, I. A., and R. Rocha. 1992. “Determinants of Expatriate Workers’ Remittances
in North Africa and Europe.” Working Paper WPS 1038. Country Economics Depart-
ment, World Bank, Washington, DC.
Ellaboudy, S. 2010. “Th e Global Financial Crisis: Economic Impact on GCC Countries
and Policy Implications.” International Research Journal of Finance and Economics
21: 180–93.
El Mouhoub, M., J. Oudinet, and E. Unan. 2008. “Macroeconomic Determinants of
Migrants’ Remittances in the Southern and Eastern Mediterranean Countries.”
Working Paper 7115. CEPN, Paris.
El Qorchi, M., S. M. Maimbo, and J. F. Wilson. 2003. “Informal Funds Transfer Systems:
An Analysis of the Informal Hawala System.” Joint International Monetary Fund and
World Bank paper. Occasional Paper 222. International Monetary Fund, Washing-
ton, DC.
El-Sakka, M., and R. McNabb. 1999. “Th e Macroeconomic Determinants of Migrant
Remittances.” World Development 27(8): 1493–1502.
ESCWA (Economic and Social Commission for Western Asia). 2009. “Economic and
Social Commission for Western Asia Annual Report: United Annual Report 2008.”
United Nations, New York.
Esim, S., and M. Smith. 2004. Gender and Migration in Arab States: Th e Case of Domes-
tic Workers. Geneva: International Labour Organization.
ETF (European Training Foundation). 2008. “Th e Contribution of Human Resources
Development to Migration Policy in Albania.” Eurostat.
European Commission. 2010. “European Economic Forecast Autumn 2010.” European
Economy 10. Brussels.

396 l BIBLIOGRAPHY
Eurostat. 2011. “Statistics Database.” http://epp.eurostat.ec.europa.eu/portal/page/por-
tal/eurostat/home.
Eversole, R. 2005. “Direct to the Poor Revisted: Migrant Remittances and Development
Assistance.” In Migration and Economy, ed. L. Trager. Walnut Creek: AltaMira Press.
Fagen, Patricia Weiss, and Micah N. Bump. 2006. “Remittances in Confl ict and Cri-
ses: How Remittances Sustain Livelihoods in War, Crises and Transitions to Peace.”
International Peace Academy Policy Paper.
Faini, R. 1994. “Worke rs’ Remittances and the Real Exchange Rate. A Quantitative
Framework.” Journal of Population Economics 7(2): 235–45.
—. 2007. “Remittances and the Brain Drain: Do More Skilled Migrants Remit
More?” World Bank Economic Review 21: 177–91.
Fajnzylber, P., and H. Lopez. 2007. Close to Home: Th e Development Impact of Remit-
tances in Latin America. Washington, DC: World Bank.
Feinerman, E., and E. J. Seiler. 2002. “Private Transfers with Incomplete Information: A
Contribution to the Altruism-Exchange Motivation for Transfers Debate.” Journal of
Population Economics 15: 715–36.
FEMIP (Facility for Euro-Mediterranean Investment and Partnership). 2006. “Study on
Improving the Effi ciency of Workers’ Remittances in Mediterranean Countries.” Feb-
ruary. European Investment Bank, Rotterdam.
Ferenczi, L., and W. F. Wilcox. 1929. International Migrations. Vols. 1 and 2. New York:
National Bureau of Economic Research.
Finch, T., M. Latorre, N. Pollard, and J. Rutter. 2009. Shall We Stay or Shall We Go? Re-
Migration Trends of Britain’s Immigrants. London: Institute for Public Policy Research.
Fix, M., D. G. Papademetriou, J. Batalova, A. Terrazas, S. Y. Lin, and M. Mittelstadt.
2009. “Migration and the Global Recession.” Report Commissioned by the BBC
World Service. September. Migration Policy Institute, Washington, DC.
Ford, K., A. Jampaklay, and A. Chamratrithirong. 2009. “Th e Impact of Circular Migra-
tion and Remittances on Relative Household Wealth in Kanchanaburi Province,
Th ailand.” Asian and Pacifi c Migration Journal 18(2): 283–301.
Foster, A. D., and M. R. Rosenzweig. 2001. “Imperfect Commitment, Altruism, and the
Family: Evidence from Transfer Behavior in Low-Income Rural Areas.” Review of
Economics and Statistics 83: 389–407.
Frankel, J. A. 2009. “Are Bilateral Remittances Countercyclical?” NBER Working Paper
15419. Cambridge, MA.
—. 2010. “Are Bilateral Remittances Countercyclical?” Open Economies Review
22(1): 1–16.
Freund, C., and N. Spatafora. 2008. “Remittances, Transaction Costs, and Informality.”
Journal of Development Economics 86(2): 356–66.
Funkhouser, E. 1995. “Remittances from International Migration: A Comparison of El
Salvador and Nicaragua.” Review of Economics and Statistics 77: 137–46.

BIBLIOGRAPHY l 397
—. 1997. “Labor Market Adjustment to Political Confl ict: Changes in the Labor
Market in El Salvador during the 1980s.” Journal of Development Economics 52:
31–64.
Galliana, A. 2006. “Th e Impact of International Migration on the Economic Develop-
ment of Countries in the Mediterranean Basin.” UN/POP/EGM/2006: 4.
Gamburd, M. R. 2002. Transnationalism and Sri Lanka’s Migrant Households: Th e
Kitchen Spoon’s Handle. New Delhi: Vistaar Publications.
—. 2008. “Milk Teeth and Jet Planes: Kin Relations in Families of Sri Lanka’s Trans-
national Domestic Servants.” City & Society 20(1): 5–31.
Gammage, S. 2006. “Exporting People and Recruiting Remittances: A Development
Strategy for El Salvador?” Latin American Perspectives 33(6): 75–100.
Gammeltoft, P. 2002. “Remittances and Other Financial Flows to Developing Coun-
tries.” Centre for Development Research Working Paper 02.11. August. Copenhagen.
Garcia, M., and D. Paiewonsky. 2006. “Gender, Remittances and Development: Th e
Case of Women Migrants from Vicente Noble, Dominican Republic.” IN STRAW,
United Nations Population Fund (UNFPA), Santo Domingo.
Gedeshi, I. 2002. “Role of Remittances from Albanian Emigrants and Th eir Infl uence in
the Country’s Economy.” Eastern European Economics 40(5): 49–72.
Gedeshi, I., and H. Mara. 2003. Th e Encouragement of Social-Economic Development
in Relation to the Growth of the Role of Remittances. United Nations Development
Programme, Tirana.
Gentry, J. W., and R. A. Mittelstaedt. 2010. “Remittances as Social Exchange: Th e Crit-
ical, Changing Role of Family as the Social Network.” Journal of Macromarketing
30(1): 23–32.
Ghosh, B. 2006. “Migrants’ Remittances and Development: Myths, Rhetoric and Reali-
ties.” International Organization for Migration (IOM), Geneva, and Th e Hague Pro-
cess on Refugees and Migration.
Gibb, H. 2009. “Impacts of the Economic Crisis: Women Migrant Workers in Asia.”
North-South Institute, IWG-GEM Conference 2009: “Gender and Global Economic
Crisis,” July 13–14, 2008.
Gibson, J., D. McKenzie, and H. Rohorua 2006. “How Cost Elastic Are Remittances?
Evidence from Tongan Migrants in New Zealand.” Pacifi c Economic Bulletin 21(1):
112–28.
Gilbertson, G. A. 1995. “Women’s Labor and Enclave Employment: Th e Case of Domin-
ican and Colombian Women in New York City.” International Migration Review
29(3): 657–70.
Giuliano, P., and M. Ruiz-Arranz. 2009. “Remittances, Financial Development and
Growth.” Journal of Development Economics 90(1): 144–52.
Glytsos, N. 1997. “Remitting Behavior of ‘Temporary’ and ‘Permanent’ Migrants: Th e
Case of Greeks in Germany and Australia.” Labour 11(3): 409–35.

398 l BIBLIOGRAPHY
Glytsos, Nicholas P. 2002. “Th e Role of Migrant Remittances in Development: Evidence
from Mediterranean Countries.” International Migration 40(1): 5–26.
Goldsmith, R. W. 1969. Financial Structure and Development. New Haven: Yale Uni-
versity Press.
Gordon, J., and P. Gupta. 2004. “Nonresident Deposits in India: In Search of Return?”
Economic and Political Weekly 39(37): 4165–74.
Government of Nepal. 2010. Economic Survey for Fiscal Year 2009–10. Kathmandu:
Ministry of Finance.
Graner, E., and G. Gurung. 2003. “Arab Ko Lahure: Looking at Nepali Labour Migrants
to Arabian Countries.” Contributions to Nepalese Studies 30(2): 295–325.
Green, A. E., P. Jones, and D. Owen. 2007. “Migrant Workers in the East Midlands
Labour Market.” Report prepared for East Midlands Development Agency. Institute
for Employment and Management, Nottingham.
Green, T., and L. A. Winters. 2010. “Economic Crises and Migration: Learning from the
Past and the Present.” World Economy 33: 1053–72.
Greenwood, J., and B. Jovanovic. 1989. “Financial Development, Growth, and the Dis-
tribution of Income.” Journal of Political Economy 98: 1076–1107.
Gropas, R., and A. Triandafyllidou. 2008. “Discrimination in the Greek Workplace and
the Challenge of Migration.” September. Elliamep.
GTZ (Deutsche Gesellschaft für Internationale Zusammenarbeit), ed. 2010. “Aus-
wirkungen der Wirtschafts- und Finanzkrise auf Migranten, Migration und Remit-
tances. Übergreifende Zusammenhänge und Fallstudien.” Diskussionspapier. GTZ,
Eschborn. http://www.gtz.de/de/themen/wirtschaft-beschaeftigung/23881.htm.
Guarnizo, L. E. 2003. “Th e Economics of Transnational Living.” International Migration
Review 37(3): 666–99.
Guest, P. 1998. “Assessing the Consequences of Internal Migration: Methodological
Issues and a Case Study on Th ailand Based on Longitudinal Household Survey Data.”
In Migration, Urbanization, and Development: New Directions and Issues, ed. R. E.
Bilsborrow. New York: United Nations Population Fund.
Gulfnews. 2009. “Remittances from Jordanian Workers Drop.” September 12. https://
gulfnews.com.
Gupta, P. 2005. “Macroeconomic Determinants of Remittances: Evidence from India.”
IMF Working Paper 05/224. International Monetary Fund, Washington, DC.
—. 2006. “Macroeconomic Determinants of Remittances: Evidence from India.”
Economic and Political Weekly.
—. 2010. “Th e Determinants of Remittances to India.” Migration Letters 7(2): 214–23.
Gupta, S., C. A. Pattillo, and S. Wagh. 2009. “Impact of Remittances on Poverty and
Financial Development in Sub-Saharan Africa.” World Development 37(1): 104–15.
Halliday, T. 2006. “Migration, Risk and Liquidity Constraints in El Salvador.” Economic
Development and Cultural Change 54: 893–925.
BIBLIOGRAPHY l 399
Hammar, T., G. Brochmann, K. Tamas, and T. Faist, eds. 1997. International Migration,
Immobility and Development: Multidisciplinary Perspective. Oxford: Berg.
Harrison, A., T. Britton, and A. Swanson. 2004. “Working Abroad: Th e Benefi ts Flowing
from Nationals Working in Other Economies.” Paper prepared for the Meeting of the
Technical Subgroup for the Task Force on International Trade in Services, Move-
ment of Natural Persons—Mode 4, Paris, September. Statistics Division, United
Nations Department of Economic and Social Aff airs.
Hatton, T. J., and J. G. Williamson. 2005. Global Migration and the World Economy: Two
Centuries of Policy and Performance. Cambridge, MA: MIT Press.
—. 2009. “Global Economic Slumps and Migration.” April 29. www.voxeu.org.
Hicks, J. 1969. A Th eory of Economic History. Oxford: Clarendon Press.
Hildebrandt, N., and D. McKenzie. 2005. “Th e Eff ects of Migration on Child Health in
Mexico.” Economia 6(1): 257–89.
Hitchcock, J. T. 1961. “A Nepalese Hill Village and Indian Employment.” Asian Survey
1(9): 15–20.
Hogue, C., ed. 2005. Th ailand’s Economic Recovery. Singapore: Institute of Southeast
Asian Studies.
Home Offi ce. 2006. A Points Based System—Making Migration Work for Britain. Lon-
don: Home Offi ce.
—. 2009. Accession Monitoring Report: May 2004–March 2009. London: Home
Offi ce.
—. 2010a. Control of Immigration: Quarterly Statistical Summary (January–March
2010). London: Home Offi ce.
—. 2010b. “Government Sets the First Annual Limit for Non-European Workers.”
Press release, November 23.
Horst, C. 2007. “Connected Lives: Somalis in Minneapolis Dealing with Family Respon-
sibilities and Migration Dreams of Relatives.” In Somalia: Diaspora and State Recon-
struction in the Horn of Africa, ed. A. O. Farah, M. Muchie, and J. Gundel. London:
Adonis and Abbey.
Hugo, G. 2000. “Th e Crisis and International Population Movements in Indonesia.”
Asian and Pacifi c Migration Journal 9: 93–129.
—. 2003. “Migration and Development: A Perspective from Asia.” IOM Migration
Research Series 14. International Organization for Migration.
Human Rights Watch. 2009a. “Bahrain: Labor Reforms a Major Advance.” May 13.
https://www.hrw.org.
—. 2009b. “Saudi Arabia: Shura Council Passes Domestic Worker Protections.” July
10. https://www.hrw.org.
Humphrey, M. 1991. “Th e Changing Role of Asian Labour Migration in the Middle
East.” Des Migrations Internationales 7(1): 45–63.
400 l BIBLIOGRAPHY
Hunt, L. 2008. “Women Asylum Seekers and Refugees: Opportunities, Constraints and
the Role of Agency.” Social Policy and Society 7(3): 281–92.
Hunt, L., and A. Steele. 2008. Migrant Workers in Rochdale and Oldham. Salford: Uni-
versity of Salford.
Hunte, C. K. 2004. “Worker’s Remittances, Remittance Decay and Financial Deepening
in Developing Countries.” American Economist 48(2): 82.
Hürriyet. 2011. “Kathimerini: Th e Crisis Made Scholars Escape from Greece to Turkey.”
January 10. http://hurarsiv.hurriyet.com.tr/goster/ShowNew.aspx?id=16722621.
Icduygu, A. 2003. Irregular Migration in Turkey. Geneva: IOM Press.
—. 2006. International Migration Discussions in the Context of Turkey-European
Union Relations. Istanbul: TUSIAD Publications.
ICG (International Crisis Group). 2010. “Central Asia: Migrants and the Economic Cri-
sis.” Asia Report 183(5).
ILO (International Labour Organization). 1998. “Measurement of Income from
Employment. Report II.” Sixteenth International Conference of Labour Statisticians.
International Labour Organization, Geneva.
—. 2008. Yearbook of Labour Statistics: Time Series 2008. Geneva: ILO.
IMF (International Monetary Fund). 2005. World Economic Outlook 2005. Washington,
DC: IMF.
—. 2008. Balance of Payments Statistics Yearbook. Washington, DC: IMF.
—. 2009a. Regional Economic Outlook: Middle East and Central Asia. Washington,
DC: IMF.
—. 2009b. World Economic Outlook: Crisis and Recovery. Washington, DC: IMF.
—. 2010. World Economic Outlook: Recovery, Risk, and Rebalancing. Washington,
DC: IMF.
INE (Instituto Nacional de Estadística). 2011a. “Population Estimates.” National Statis-
tics Institute, Spain. http://www.ine.es/jaxi/menu.do?type=pcaxis&path=%2Ft20%2
Fp259&fi le=inebase&L=.
—. 2011b. “Population Register.” National Statistics Institute, Spain. http://www.
ine.es.
INEGI. 2011. “ ‘Resultados Preliminares’ del Censo de Población y Vivienda 2010.”
INEGI, Mexico City. http://www.inegi.org.mx/sistemas/TabuladosBasicos/prelimi-
nares2010.aspx.
INSTAT. 2002. Albanian Population in 2001. REPOBA.
IOM (International Organization for Migration). 2004. Arab Migration in a Globalized
World. Geneva: IOM.
—. 2008. Migration in Turkey: A Country Profi le. Geneva: IOM.

BIBLIOGRAPHY l 401
—. 2009. “Th e Impact of the Global Economic Crisis on Migrants and Migration.”
IOM Policy Brief. March. IOM, Geneva.
—. 2010. Migration and the Economic Crisis in the European Union: Implications
for Policy. Brussels: IOM.
IPPR (Institute for Public Policy Research). 2009a. “Social Networks and Polish Immi-
gration to the UK.” Economics of Migration Working Paper 5, May. IPPR, London.
—. 2009b. “Th e Impact of the Global Economic Downturn on Migration.” Monitor-
ing Report 2. Department for International Development, London.
Irving, J., S. Mohapatra, and D. Ratha. 2010. “Global Survey of Central Banks on Remit-
tances.” Mimeo. Development Prospects Group, World Bank, Washington, DC.
Jacque, L. L. 1999. “Th e Asian Financial Crisis: Lessons from Th ailand.” Fletcher Forum
of World Aff airs 23(1): 87–99.
Jadhav, N. 2003. “Maximising Development Benefi ts of Migrant Remittances: Th e
Indian Experience.” Paper presented at the “International Conference on Migrant
Remittances,” Department for International Development and World Bank, London,
October 9–10.
Jadhav, N., and B. Singh. 2006. “Worker’s Remittances as Stable Financial Flows: Some
Evidence from India.” Labour and Development 11–12(1/2): 23–47.
Jayaraman, T. K., and C. K. Choong. 2010. “Role of Off shore Financial Center Institu-
tions in Vanuatu.” Working Paper WP2010/05. School of Business and Economics,
University of the South Pacifi c, Suva, Fiji. http://www.econ.fbe.usp.ac.fj /fi leadmin/
fi les/schools/ssed/economics/working_papers/2010/WP5.pdf.
Jayaraman, T. K., C. K. Choong, and R. Kumar. 2009. “Role of Remittances in Economic
Growth in Pacifi c Island Countries: A Study of Samoa.” Perpectives on Global Devel-
opment and Technology 8: 611–27.
—. 2010a. “Role of Remittances in Tongan Economy.” Migration Letters 7: 224–30.
—. 2010b. “A Study on the Role of Remittances in Fiji’s Economic Growth: An Aug-
mented Solow Model Approach.” Working Paper 2010/06. University of the South
Pacifi c, Suva, Fiji. http://www.econ.fbe.usp.ac.fj /fi leadmin/fi les/schools/ssed/eco-
nomics/working_papers/2010/WP_6.pdf.
Jha, S., G. Sugiyarto, and C. Vargas-Silva. 2009. “Th e Global Crisis and the Impact on
Remittances to Developing Asia.” Asian Development Bank Working Paper Series
185. Asian Development Bank.
—. 2010. “Th e Global Crisis and the Impact on Remittances to Developing Asia.”
Global Economic Review 39(1): 59–82.
Jorgensen, M. B. 2008. “Natio nal and Transnational Identities: Turkish Organising Pro-
cesses and Identity Construction in Denmark, Sweden and Germany.” PhD thesis,
Aalborg University SPIRIT, Aalborg University AMID, Academy for Migration Stud-
ies in Denmark.
Justino, P., and O. Shemyakina. 2010. “Remittances and Labor Supply in Post-Confl ict
Tajikistan.” Research Working Paper 35. MICROCON.
402 l BIBLIOGRAPHY
Kabbani, N., and E. Kothari. 2005. “Youth Employment in the MENA Region: A Situ-
ational Assessment.” Social Protection Discussion Paper 534. World Bank, Washing-
ton, DC.
Kakwani, N., and M. Krongkaew. 2000. “Analysing Poverty in Th ailand.” Journal of the
Asia Pacifi c Economy 5(1/2): 141–60.
Kapiszewski, A. 2006. “Arab versus Asian Migrant Workers in the GCC Countries.” Paper
presented at the United Nations Expert Group Meeting on International Migration
and Development in the Arab Region, Department of Economic and Social Aff airs.
United Nations Secretariat, Beirut, May 15–17.
Kar, M., O. Peker, and M. Kaplan. 2008. “Trade Liberalization, Financial Development
and Economic Growth in the Long Term: Th e Case of Turkey.” South East European
Journal of Economics and Business 3: 25–38.
Kasparian, C. 2009. “L’émigration des jeunes Libanais et leurs projects d’avenir.” Obser-
vatoire Universitaire de la Réalité Socio-Economique, Univeristé Saint-Joseph,
Presses de l’Univeristé Saint-Joseph, Beirut.
Katz, E., and O. Stark. 1986. “Labor Migration and Risk Aversion in Less Developed
Countries.” Journal of Labor Economics 4(1): 134–49.
Kaur, A. 2010. “Labour Migration in Southeast Asia: Migration Policies, Labour Exploi-
tation and Regulation.” Journal of the Asia Pacifi c Economy 15(1): 6–19.
Ketkar, S., and D. Ratha. 2009. Innovative Financing for Development. Washington, DC:
World Bank.
Khalaf, S., and S. Alkobaisi. 1999. “Migrants’ Strategies of Coping and Patterns of
Accommodation in the Oil-Rich Gulf Societies: Evidence from the UAE.” British
Journal of Middle Eastern Studies 26(2): 271–98.
Kilic, T., G. Carletto, B. Davis, and A. Zezza. 2007. “Investing Back Home: Return
Migration and Business Ownership in Albania.” Working Paper 4366. World Bank
Policy Research, Washington, DC.
Kim, E. M., ed. 1998. Th e Four Asian Tigers: Economic Development and the Global
Political Economy. San Diego: Academic Press.
King, R. 2005. “Albania as a Laboratory for the Study of Migration and Development.”
Journal of Southern Europe and the Balkans 7(2): 133–56.
King, R., M. Dalipaj, and N. Mai. 2006. “Gendering Migration and Remittances: Evi-
dence from London and Northern Albania.” Population, Space and Place 12(6):
409–34.
King, R., and R. Levine. 1993. “Finance and Growth: Schumpeter Might Be Right.”
Quarterly Journal of Economics 108: 717–37.
King, R., and J. Vullnetari. 2010. “Gender and Remittances in Albania: Or Why ‘Are
Women Better Remitters Th an Men?’ Is Not the Right Question.” Working Paper 58.
University of Sussex, Sussex Centre for Migration Research, Brighton.

BIBLIOGRAPHY l 403
Kirisci, K. 2002. Justice and Home Aff airs Issues in Turkish-EU Relations: Assessing
Turkish Asylum and Immigration Policy and Practice. Ankara: Turkish Economic
and Social Studies Foundation.
Koç, I., and I. Onan. 2004. “International Migrants’ Remittances and Welfare Status of
the Left-Behind Families in Turkey.” International Migration 38(1): 78–112.
Kollmair, M., S. Manandhar, B. Subedi, and S. Th ieme. 2006. “New Figures for Old Sto-
ries: Migration and Remittances in Nepal.” Migration Letters 3(2): 151–60.
Korinek, K., B. Entwisle, and A. Jampaklay. 2005. “Th rough Th ick and Th in: Layers of
Social Ties and Urban Settlement among Th ai Migrants.” American Sociological
Review 70: 779–800.
Krongkaew, M., and N. Kakwani. 2003. “Th e Growth-Equity Trade-off in Modern Eco-
nomic Development: Th e Case of Th ailand.” Journal of Asian Economics 14(5): 735–57.
Labeaga, J. M., S. Jiménez-Martín, and N. Jorgensen. 2007. Th e Volume and Geography
of Remittances from the EU. Madrid: FEDEA.
Laeven, L., and F. Valencia. 2008. “Systemic Banking Crises: A New Database.” Working
Paper 08/224. International Monetary Fund, Washington, DC.
Landolt, P. 2001. “Salvadoran Economic Transnationalism: Embedded Strategies for
Household Maintenance, Immigrant Incorporation, and Entrepreneurial Expan-
sion.” Global Networks 1: 217–42.
Levine, R., N. Loayza, and T. Beck. 2000. “Financial Intermediation and Growth: Cau-
sality and Causes.” Journal of Monetary Economics 46: 31–77.
Levitt, Peggy. 2000. “Migrant Participation across Borders: Towards an Understanding
of Forms and Consequences.” In Immigration Research for a New Century: Multidis-
ciplinary Perspectives, ed. N. Foner, R.G. Rumbaut, and S. J. Gold. New York: Russell
Sage Foundation.
Lianos, T. P., and J. Cavounidis. 2010. “Immigrant Remittances, Stability of Employment
and Relative Deprivation.” International Migration 48(5): 118–41.
Livingston , G. 2006. “Gender, Job Searching, and Employment Outcomes among Mexi-
can Immigrants.” Population Research and Policy Review 25(1): 43–66.
Lopez, J. R., and M. A. Seligson. 1991. “Small Business Development in El Salvador:
Th e Impact of Remittances.” In Migration, Remittances, and Small Business Devel-
opment: Mexico and Caribbean Basin Countries, ed. S. Diaz-Briquets and S. Wein-
traub. Boulder: Westview.
Lowell, B. L., and R. O. de la Garza. 2002. “Th e Development Role of Remittances in U.S.
Latino Communities and Latin America.” In Sending Money Home: Hispanic Remit-
tances and Community Development, ed. R. O. de la Garza and B. L. Lowell. Lanham,
MD: Rowman and Littlefi eld.
Lozano Ascencio, F. 1998. “Las remesas de los migrantes mexicanos en Estados Unidos:
Estimaciones para 1995.” In Migration between Mexico and the United States. Austin:
Mexican Ministry of Foreign Aff airs and the United States Commissi on on Immigra-
tion Reform.

404 l BIBLIOGRAPHY
Lubkemann, S. 2005. “Th e Moral Economy of Nonreturn among Socially Diverted
Labor Migrants from Portugal and Mozambique. In Society for Economic Anthropol-
ogy Monographs 22, ed. L. Trager. Walnut Creek: AltaMira Press.
Lucas, R., Jr. 1988. “On the Mechanics of Economic Development.” Journal of Monetary
Economics 22(1): 3–42.
—. 2005. International Migration and Economic Development, Lessons from Low-
Income Countries. Northampton, MA: Edward Elgar.
Lucas, R. E. B., and O. Stark. 1985. “Motivations to Remit: Eviden ce from Botswana.”
Journal of Political Economy 93(5): 901–17.
Lueth, E., and M. Ruiz-Arranz. 2007. “Determinants of Bilateral Remittance Flows.” B.E.
Journal of Macroeconomics 8(1): article 26.
—. 2008. “Determinants of Bilateral Remittance Flows.” B.E. Journal of Macroeco-
nomics October.
—. 2009. “A Gravity Model of Workers’ Remittances.” IMF Working Pap er 06/290.
Luthria, M. 2009. “Money Transfers into the Pacifi c (Transfer Fees Could Stand a Cut-
Back).” Australian Financial Review, November 10.
Lyberaki, A., and L. Lambrianidis. 2004. “Back and Forth and In-Between: Albanian
Return-Migrants from Greece and Italy.” Journal of International Migration and
Integration 5(1): 77–106.
Lynch, A. 2010. “Estrategias de remesas de los emigrantes frente a la crisis.” Working
Paper 2-2010. January. http://www.remesas.org.
MacFarlane, A. 1976. Resources and Population: A Study of Gurungs of Nepal. London:
Cambridge University Press.
Maclellan, N., and P. Mares. 2005. “Remittances and Labour Mobility in the Pacifi c—A
Working Paper on Seasonal Work Programs in Australia for Pacifi c Islanders.” Mel-
bourne: Swinburne Institute for Social Research. http://researchbank.swinburne.
edu.au/vital/access/manager/Repository/swin:5609.
Maddison, A. 2003. Th e World Economy: Historical Statistics. Paris: Organisation for
Economic Co-operation and Development.
Mahler, S. J., and P. R. Pessar. 2006. “Gender Matters: Ethnographers Bring Gender from
the Periphery toward the Core of Migration Studies.” International Migration Review
40(1): 27–63.
Maimbo, S. M., and D. Ratha. 2005. “Remittances: An Overview.” In Remittances: Devel-
opment Impact and Future Prospects, ed. S. M. Maimbo and D. Ratha. Washington,
DC: World Bank.
Mandelman, F., and A. Zlate. 2010. “Immigration, Remittances and Business Cycles.”
Mimeo. Federal Reserve Bank of Atlanta.
Manseau, G. S. 2005. “Contractual Solutions for Migrant Laborers: Th e Case of Domes-
tic Workers in the Middle East.” http://www.nottingham.ac.uk/shared/shared_hrl-
cpub/HRLC_Commentary_2006/manseau.pdf.

BIBLIOGRAPHY l 405
Mansuri, G. 2007. “Temporary Migration and Rural Development.” In International
Migration, Economic Development, and Policy, ed. Çaglar Özden and Maurice Schiff .
Basingstoke: Palgrave Macmillan.
Martin, P. 2001. “Th ere Is Nothing More Permanent than Temporary Foreign Workers.”
Backgrounder. April. Center for Immig ration Studies.
—. 2009a. “Th e Recession and Migration: Alternative Scenarios.” International
Migration Institute Working Paper 13. International Migration Institute, University
of Oxford.
—. 2009b. “Recession and Migration: A New Era for Labor Migration?” Interna-
tional Migration Review 43(3): 671–91.
Martin, P. L., E. Hönekopp, and H. Ullmann. 1990. “Europe 1992: Eff ects on Labor
Migration.” International Migration Review 24(3): 591–603.
Massa, I., and D. W. te Velde. 2008. “Th e Global Financial Crisis: Will Successful Afri-
can Countries Be Aff ected?” Background paper published by ODI. http://www.odi.
org.uk/resources/details.asp?id=2612&title=global-fi nancial-crisis-will-successful-
african-countries-be-aff ected.
Massey, D. S. 1990. “Social Structure, Household Strategies, and the Cumulative Causa-
tion of Migration.” Population Index 56(1): 3–26.
Massey, D. S., J. Arango, G. Hugo, A. Kouaouci, A. Pellegrino, and J. E. Taylor. 1994. “An
Evaluation of International Migration Th eory: Th e North American Case.” Popula-
tion and Development Review 20(4): 699–751.
—. 1998/2006. Worlds in Motion: Understanding International Migration at the
End of the Millennium. New York: Oxford University Press.
Massey, D. S., and J. E. Taylor. 2004. International Migration: Prospects and Policies in a
Global Market. New York: Oxford University Press.
Mazzucato, V., B. van den Boom, and N. N. N. Nsowah-Nuamah. 2008. “Remittances
in Ghana: Origin, Destination and Issues of Measurement .” International Migration
46(1): 103–22.
McCabe, K., S. Y.-Y. Lin, and H. Tanaka. 2009. “Pay to Go: Countries Off er Cash to
Immigrants Willing to Go.” Migration Information Source, feature story, November.
http://www.migrationinformation.org/Feature/display.cfm?ID=749.
McClaughlin, D., and D. Smith. 2005. “Doctors Go West in Polish Brain Drain.” Th e
Observer, May 15. http://observer.guardian.co.uk.
McCormick, B., and J. Wahba. 2000. “Overseas Employment and Remittances to a Dual
Economy.” Economic Journal 110(463): 509–34.
McKay, S., and A. Winkelmann-Gleed. 2005. “Migrant Workers in the East of England.”
Project report for the East of England Development Agency, Cambridge. London
Metropolitan University, London.
McKinnon, R. 1973. Money and Capital in Economic Development. Washington, DC:
Brookings Institution.

406 l BIBLIOGRAPHY
Menjivar, C. 2000. Fragmented Ties: Salvadoran Immigrant Networks in America.
Berkeley: University of California Press.
Merkle, L., and K. Zimmermann. 1992. Savings, Remittances, and Return Migration.
Economic Letters 38: 77–81.
Miera, F. 2008. “Long Term Residents and Commuters: Change of Patterns in Migration
from Poland to Germany.” Journal of Immigrant & Refugee Studies 6(3): 297–311.
Migration DRC. 2009. “Migration and the Financial Crisis: How Will the Economic
Downturn Aff ect Migrants?” Development Research Centre on Migration, G.P.
Briefi ng, Sussex Centre for Migration Research, Brighton, UK. http://www.migra-
tiondrc.org/publications/briefi ng_papers/BP17.pdf.
Migration Information Source. 2010. “Evidence from the Great Recession Is In: Migra-
tion Flows Dropped, Unemployment among Certain Immigrants Rose.” December 1.
Migration Letters. 2010. Special Issue on Remittances and Financial Crisis. Migration
Letters 7(2).
Migration News. 2010. “Unemployment, Projections, H-1B.” Migration News 17(2).
Ministry of Overseas Indian Aff airs. 2009. “Annual Report 2008–09.” Government of
India, New Delh i.
MNAEC (Ministerio Nacional de Asuntos Exteriores y Cooperación). 2009. “Ministerio
Nacional de Asuntos Exteriores y Cooperación.” http://www.maec.es.
Mohan, G. 2002. “Diaspora and Development.” In Development and Displacement, ed.
J. Robinson. Oxford: Milton Keynes, Open University and Oxford University Press.
Mohapatra, S., G. Joseph, and D. Ratha. Forthcoming. “Remittances and Natural Disas-
ters: Ex-Post Response and Contribution to Ex-Ante Preparedness.” Environment,
Development and Sustainability.
Mohapatra, S., and C. Ozden. 2009. “Migration and Remittances in South Asia.” In
Trade in Services and Investments in South Asia, ed. Ejaz Ghani. Washington, DC:
World Bank.
Mohapatra, S., and D. Ratha. 2010. “Forecasting Migrant Remittances during the Global
Financial Crisis.” Migration Letters 7(2): 203–13.
Moran-Taylor, M. J. 2008. “When Mothers and Fathers Migrate North: Caretakers, Chil-
dren, and Child Rearing in Guatemala.” Latin American Perspectives 35(4): 79–95.
Moré, I., A. Echazarra, B. Halloufi , a nd R. Petru. 2008. “Cuantifi cación de las Remesas
Enviadas por las Mujeres Migrantes desde España.” Resúmen, Madrid. June. http://
www.remesas.org.
Morrison, A. R., M. Schiff , and M. Sjöblom. 2007. Th e International Migration of
Women. Washington, DC: World Bank.
MPI (Migration Policy Institute). 2008. “Top 10 Migration Issues of 2008: Issue #6—
Return Migration: Changing Directions?” MPI, Washington, DC. http://www.migra-
tioninformation.org/Feature/display.cfm?ID=707.
BIBLIOGRAPHY l 407
—. 2010. “Mexico: A Crucial Crossroads.” MPI Country Profi les, Migratio n Infor-
mation Source. www.migrationinformation.org.
MSIO (Merseyside Social Inclusion Observatory). 2006. “Supporting Migrant Workers
in the North West of England.” Briefi ng Paper 8. MSIO, Liverpool.
MTIN (Ministerio de Trabajo e Inmigracíon). 2010. “Extranjeros con certifi cado de
registro o tarjeta de residencia en vigor y Extranjeros con autorización de estancia
por estudios en vigor a 30 de septiembre de 2010.” http://extranjeros.mtin.es.
Mundaca, B. G. 2009. “Remittances, Financial Market Development, and Economic
Growth: Th e Case of Latin America and the Caribbean.” Review of Development Eco-
nomics 13(2): 288–303.
Nagarajan, S. 2009. “Impact of Global Financial Crisis on Remittance Flows to Africa.”
November 17. African Development Bank Group, Subha.
Narayan, P. K. 2005. “Th e Saving and Investment Nexus for China: Evidence from Co-
Integration Tests.” Applied Economics 37: 1979–90.
Naudé, W. A. 2009. “Fallacies about the Global Financial Crisis Harms Recovery in the
Poorest Countries.” December. CESifo Forum, Munich.
—. 2010. “Th e Determinants of Migration from Sub-Saharan African Countries.”
Journal of African Economies 19(3): 330–56.
Naufal, G., and C. Vargas-Silva. 2010. “Migrant Transfers in the MENA Region: A Two
Way Street in Which Traffi c Is Changing.” Migration Letters 7(2): 168–78.
Nayyar, D. 1989. “International Labour Migration from India: A Macro-Economic
Analysis.” In To the Gulf and Back Migration: Studies on the Economic Impact of
Asian Labour Migration, ed. R. Amjad. Geneva: International Labour Offi ce.
Nepal Telecom. 2009. “Annual Report of Nepal Telecom 2009.” http://www.ntc.net.np/
utilities/annualreport_060-61_to_064-65.pdf.
Newell, S. 2005. “Migratory Modernity and the Cosmology of Consumption in Côte
d’Ivoire.” In Society for Economic Anthropology Monographs 22, ed. L. Trager. Walnut
Creek: AltaMira Press.
Niimi, Y., and C. Ozden. 2006. “Migration and Remittances: Causes and Linkages.” Pol-
icy Research Working Paper Series 4087. World Bank, Washington, DC.
Nikas, C., and R. King. 2005. “Economic Growth through Remittances: Lessons from
the Greek Experience of the 1960s Applicable to the Albanian Case.” Journal of
Southern Europe and the Balkans 7(2): 235–57.
NSO (National Statistical Offi ce of Th ailand). 2000. Population and Housing Census
2000. Bangkok: NSO.
NWDA (North West Development Agency). 2006. Northwest Regional Economic Strat-
egy 2006. Warrington: NWDA.
OECD (Organisation for Economic Co-operation and Development). 2000. “Th e
Employment of Foreigners: Outlook and Issues in OECD Countries.” In OECD
Employment Outlook. Paris: OECD.

408 l BIBLIOGRAPHY
—. 2005. Migration, Remittances and Development. Paris: OECD Publications.
—. 2009a. “International Migration: Charting a Course through the Crisis.” OECD
Policy Brief, June. OECD, Paris.
—. 2009b. “International Migration and the Economic Crisis: Understanding the
Links and Shaping Policy Responses.” International Migration Outlook 2009. OECD,
Paris.
—. 2010. International Migration Outlook. Paris: OECD.
Offi ce for National Statistics. 2010. “Regional Profi le—North West: Selected Key Statis-
tics.” https://www.ons.gov.uk.
Offi ce of Immigration Statistics. 2009. Yearbook of Immigration Statistics: 2009. Wash-
ington, DC: U.S. Department of Homeland Security.
Oishi, N. 2005. Women in Motion: Globalization, State Policies, and Labor Migration in
Asia. Stanford, CA: Stanford University Press.
Olimova, S. 2010. “Global Crisis and Labour Migration: Th e Case of Tajikistan.” http://
www.ceri-sciencespo.com/cerifr/transversal/06112009/s_olimova.pdf.
Onishi, N. 2010. “Toiling Far from Home for Philippine Dream.” New York Times, Sep-
tember 18.
O’Rourke, K. 1995. “Emigration and Living Standards in Ireland since the Famine.” Jour-
nal of Population Economics 8(4): 1432–75.
Orozco, M. 2002. “Globalization and Migration: Th e Impact of Family Remittances in
Latin America.” Latin American Politics and Society 44(2): 41–66.
—. 2004. Remittances to Latin America and the Caribbean: Issues and Perspectives
on Development. Washington, DC: Organization of American States.
—. 2006. “International Flows of Remittances: Cost, Competition and Financial
Access in Latin America and the Caribbean—Toward an Industry Scorecard.” Report
prepared for the Inter-American Development Bank, Washington, DC.
—. 2009. “Th e Global Economic Crisis and Intersecting Variables Determining
Remittance Trends.” Paper given at the “Conference on the Impact of the Global
Economic Crisis on Migrants’ Remittances and Its Implications for Development,”
March 21, Utrecht.
Orrenius, P., and M. Zavodny. 2009. “Tied to the Business Cycle: How Immigrants Fare
in Good and Bad Economic Times.” Migration Policy Institute, November. www.
migrationpolicy.org.
Osili, U. O. 2004. “Migrants and Housing Investments: Th eory and Evidence from Nige-
ria.” Economic Development and Cultural Change 52(4): 821–49.
—. 2007. “Remittances and Savings from International Migration: Th eory and Evi-
dence Using a Matched Sample.” Journal of Development Economics 83(2): 446–65.
Pantoja, A. D. 2005. “Transnational Ties and Immigrant Political Incorporation: Th e
Case of Dominicans in Washington Heights, New York.” International Migration
43(4): 123–46.
BIBLIOGRAPHY l 409
Papademetriou, D. G., and P. L. Martin, eds. 1991. Th e Unsettled Relationship: Labor
Migration and Economic Development. London: Greenwood Press.
Parreñas, R. 2005. “Long Distance Intimacy: Class, Gender and Intergenerational Rela-
tions between Mothers and Children in Filipino Transnational Families.” Global Net-
works 5(4): 317–36 .
Parsons, C. R., R. Skeldon, T. L. Walmsey, and L. A. Winters. 2007. “Quantifying Inter-
national Migration: A Database of Bilateral Migration Stocks.” In International
Migration, Economic Development and Policy, ed. Ç. Özden and M. Schiff . London
and Washington, DC: Palgrave Macmillan and World Bank.
Pemberton, S. 2008. “Supporting Economic Migrants in the North West of England.”
Public Policy and Administration 23(1): 80–99.
—. 2009. “Economic Migration from the EU ‘A8’ Accession Countri es and the
Impact on Low Demand Housing Areas: Opportunity or Th reat for Housing Market
Renewal Pathfi nder Programmes in England?” Urban Studies 46(7): 1363–84.
Perlez, J. 2002. “Educated Filipinos, Disillusioned at Home, Look Abroad for a Better
Life.” New York Times, April 3.
Pesaran, M. H., Y. Shin, and R. Smith. 2001. “B ounds Testing Approaches to the Analy-
sis of Level Relationships.” Journal of Applied Econometrics 16: 289–326.
Pfaff -Czarnecka, J. 1995. “Migration under Marginality Conditions: Th e Case of Bajhang.”
In Rural-Urban Interlinkages: A Challenge for Swiss Development Cooperation. Zurich
and Kathmandu: IDA and INFRAS.
Phillips, N. 2009. “Migration as Development Strategy? Th e New Political Economy
of Dispossession and Inequality in the Americas.” Review of International Political
Economy 16(2): 231–59.
Phizacklea, A. 2000. “Ruptures: Migration and Globalisation: Looking Back and Look-
ing Forward.” In Trans-Nationalism and the Politics of Belonging, ed. S. Westwood
and A. Phizacklea. London: Routledge.
Phongpaichit, P., and C. Baker, eds. 2008. Th ai Capital: After the 1997 Crisis. Chiang
Mai: Silkworm Books.
Piper, N. 2005. “Gender and Migration.” Paper prepared for the policy analysis and
research programme of the Global Commission on International Migration.
Pollard, N., M. Latorre, and D. Sriskandarajah. 2008. Floodgates or Turnstiles? Post-
EU Enlargement Migration Flows to (and from) the UK. London: Institute for Public
Policy Research.
Prescott, E., and J. Boyd. 1987. “Dynamic Coalitions, Growth, and the Firm.” In Con-
tractual Arrangements for Intertemporal Trade, ed. E. Prescott and N. Wallace. Min-
neapolis: University of Minnesota Press.
Punzalan, K. 2009. “Th e Economic Crisis and Labour Migrants: A Test for Human
Security?” NTS Insight 1 (June). Singapore.
Qatar: Statistical Appendix. 2009. “International Monetary Fund Country Report.”
09/32. January. Qatar.
410 l BIBLIOGRAPHY
Quartey, P., and T. Blankson. 2004. “Do Migrant Remittances Minimize the Impact of
Macro-Volatility on the Poor in Ghana?” Report submitted to the Global Develop-
ment Network.
Rafael, V. L. 1997. “Your Grief Is Our Gossip: Overseas Filipinos and Other Spectral
Presences.” Public Culture 9: 267–91.
Rahman, M. M. 1999. “Th e Asian Economic Crisis and Bangladeshi Workers in Singa-
pore.” Working Paper 147. Department of Sociology, National University of Singa-
pore, Singapore.
—. 2009. In Quest of Golden Deer: Bangladeshi Transient Migrants Overseas. Saar-
brücken: VDM Verlag.
Raja, K. 2009. “Financial Crisis Will Put a Damper on ODA Flows.” UNCTAD Policy
Brief 7. March.
Rajamony, V. 2009. Impact of the Financial Crisis on Indian Workers in the UAE. Pre-
sentation at the conference “Financial Crisis in the Gulf and Its Impact on South and
South East Asian Migrants,” Centre for Development Studies, India. July 22.
Rajan, I. S., and B. A. Prakash. 2009. “Migration and Development Linkages Re-Exam-
ined in the Context of the Global Economic Crisis.” Invited paper for the Civil Soci-
ety Days of the 3rd Global Forum on Migration and Development, November 2–3,
Athens.
Rajan, I. S., V. J. Varghese, and M. S. Jayakumar. 2009. “Overseas Recruitment Practices
in India: A Critical Assessment.” Report submitted to the International Labour Orga-
nization, Th ailand, and Ministry of Overseas Indian Aff airs, Government of India,
New Delhi.
Ramirez, M., Z. Skrbis, and M. Emmison. 2007. Transnational Family Reunions as Lived
Experience: Narrating a Salvadoran Autoethnography. Identities 14(4): 411–31.
Rapoport, H., and F. Docquier. 2000. “Strategic and Altruistic Remittances.” In Th e Eco-
nomics of Reciprocity, Giving and Altruism, eds. L.-A. Gerard-Varet, S.-C. Kolm, and
J. Mercier Ythier. New York: MacMillan and St. Martin Press, chapter 16, pp. 285–97.
—. 2006. “Th e Economics of Migrants’ Remittances.” In Handbook of the Economics
of Giving, Altruism, and Reciprocity, ed. S. Kolm and J. M. Ythier. New York: Elsevier.
Ratha, D. 2003. “Workers’ Remittances: An Important and Stable Source of External
Finance.” Global Development Finance 157–75.
—. 2005. “Workers’ Remittances: An Important and Stable Source of External
Development Finance.” In Remittances: Development Impact and Future Prospects,
ed. S. M. Maimbo and D. Ratha. Washington, DC: World Bank.
—. 2007. “Leveraging Remittances for Development.” Policy Brief. Migration Policy
Institute, Washington, DC.
—. 2010a. “Diaspora Bonds for Development Financing during the Crisis.” People
Move blog, October 26. World Bank, Washington, DC. http://blogs.worldbank.org/
peoplemove/diaspora-bonds-for-development-fi nancing-during-a-crisis.

BIBLIOGRAPHY l 411
—. 2010b. “Mobilize th e Diaspora for the Reconstruction of Haiti.” In Haiti: Now
and Next. Social Science Research Council (SSRC), New York. http://www.ssrc.org.
Ratha, D., P. De, and S. Mohapatra. 2007. “Shadow Sovereign Ratings for Unrated
Developing Countries.” Policy Research Working Paper 4269. World Bank, Wash-
ington, DC.
—. 2010. “Shadow Sovereign Ratings for Unrated Developing Countries.” World
Development 39(3): 295–307.
Ratha, D., and S. Mohapatra. 2009. “Revised Outlook for Remittance Flows 2009–2011.”
Migration and Development Brief 9. World Bank, Washington, DC.
—. 2010. “Revised Outlook for Remittance Flows 2011–2012.” Migration and
Development Brief. World Bank, Washington, DC.
Ratha, D., S. Mohapatra, and S. Plaza. 2008. “Beyond Aid: New Sources and Innovative
Mechanisms for Financing Development in Sub-Saharan Africa.” Policy Research
Working Paper WPS 4609. World Bank, Washington, DC.
Ratha, D., S. Mohapatra, and A. Silwal. 2009a. “Migration and Remittance Trends 2009:
A Better-than-Expected Outcome So Far, but Signifi cant Risks Ahead.” Migration
and Development Brief 11. World Bank, Washington, DC.
—. 2009b. “Outlook for Remittance Flows 2009–2011: Remittances Expected to
Fall by 7–10 Percent in 2009.” Migration and Development Brief 10. World Bank,
Washington, DC.
—. 2010a. “Outlook for Remittance Flows 2010–11: Remittance Flows to Develop-
ing Countries Remained Resilient in 2009, Expected to Recover during 2010–11.”
Migration and Development Brief 12. World Bank, Washington, DC.
—. 2010b. “Outlook for Remittance Flows 2011–2012: Recovery after the Crisis,
but Risks Lie Ahead.” Migration and Development Brief 13. World Bank, Washing-
ton, DC.
Ratha, D., S. Mohapatra, and Z. Xu. 2008. “Outlook for Remittance Flows 2008–10:
Growth Expected to Moderate Signifi cantly, but Flows to Remain Resilient.” Migra-
tion and Development Brief 8. World Bank, Washington, DC.
Ratha, D., and W. Shaw. 2007. “South-South Migration and Remittance.” Working Paper
102. World Bank, Washington, DC.
Ratha, D., and I. Sirkeci. 2010. “Remittances and the Global Financial Crisis.” Migration
Letters 7(2): 125–31.
Ratha, D., and Z. Xu 2008. Migration and Remittances Factbook. Washington, DC:
World Bank.
Regmi, M. C. 1978. Th atched Huts and Stucco Palaces: Peasants and Landlords in 19th
Century Nepal. New Delhi: Vikas.
Reichert, Joshua. 1981. “Th e Migrant Syndrome: Seasonal U.S. Wage Labor and Rural
Development in Central Mexico.” Human Organization 40(1): 56–66.
412 l BIBLIOGRAPHY
Remesas. 2009. “¿Cuanto cuesta enviar una remesa desde Europa?” February. http://
www.remesas.org.
Remple, H., and R. A. Lobdell. 1978. “Th e Role of Urban-to-Rural Remittances in Rural
Development.” Journal of Development Studies 14: 324–41.
Rennie, D. 2005. “EU Urged to Give British Welcome to Polish Plumbers.” Daily Tele-
graph, September 7. http://www.telegraph.co.uk.
Reserve Bank of India. 2006. “Remittances from Overseas Indians: A Study of Methods
of Transmission, Costs and Time.” RBI Monthly Bulletin, November.
—. 2010. “Remittances from Overseas Indians: Modes of Transfer, Transaction
Cost and Time Taken.” RBI Monthly Bulletin, April.
Richter, K., P. Guest, W. Boonchalaski, N. Piriyathamwong, and N. B. Ogena. 1997.
“Migration and the Rural Family: Report of the Northeastern Follow-up to the
National Migration Survey.” Institute for Population and Social Research, Mahidol
University.
Riester, A. 2009. “Impact of the Global Recession on International Labour Migration
and Remittances.” Background paper. Asian Development Bank, Manila. http://www.
adb.org/documents/events/2009/poverty-social-development/WG1C-impact-on-
migration-Riester-paper.pdf.
—. 2010a. “Th e Impact of the Global Recession on Labour Migration and Remit-
tances. Implications for Poverty Reduction and Development in Nepal, Philippines,
Tajikistan, and Uzbekistan.” In Th e Social Impact of the Global Recession in Asia and
Pacifi c. Manila: Asian Development Bank.
—. 2010b. “Migration and Confl ict: Th e Integration of Burkinabe Migrants Return-
ing from Côte d’Ivoire.” PhD thesis, Martin-Luther Universität Halle/Wittenberg.
Rigg, J. 1998. “Rural-Urban Interactions, Agriculture and Wealth: A Southeast Asian
Perspective.” Progress in Human Geography 22: 497–522.
Rigg, J., S. Veeravongs, L. Veeravongs, and P. Rohitarachoon. 2008. “Reconfi guring
Rural Spaces and Remaking Rural Lives in Central Th ailand.” Journal of Southeast
Asian Studies 39(3): 355–81.
Romer, P. M. 1986. “Increasing Returns and Long-Run Growth.” Journal of Political
Economy 94(5): 1002–37
Rose, S., and R. Shaw. 2008. “Th e Gamble: Circular Mexican Migration and the Return
on Remittances.” Mexican Studies/Estudios Mexicanos 24(1): 79–111.
Ruhs, M. 2006. “Th e Potential of Temporary Migration Programmes in Future Interna-
tional Migration Policy.” International Labour Review 146(1–2): 7–36.
Ruiz, I., and C. Vargas-Silva. 2010. “Another Consequence of the Economic Crisis: A
Decrease in Migrants’ Remittances.” Applied Financial Economics 20(1): 171–82.
—. 2011. “Exploring the Causes of the Slowdown in Remittances to Mexico.”
Empirical Economics.

BIBLIOGRAPHY l 413
Russell, S. S. 1986. “Remittances from International Migration: A Review in Perspec-
tive.” World Development 14(6): 677–96.
Ryan, L., R. A. Sales, M. Tilki, and B. Siara. 2009. “Family Strategies and Transnational
Migration: Recent Polish Migrants in London.” Journal of Ethnic & Migration Studies
35(1): 61–77.
Saith, A. 1989. “Macroeconomic Issues in International Labour Migration—A Review.”
In To the Gulf and Back, ed. R. Amjad. Geneva: International Labour Organization.
Salomone, S. 2006. “Remittances: Overview of the Existing Literature.” European Uni-
versity Institute. http://www.iue.it.
Salt, J. J. Dobson, and A. Latham. 2009. “On the Move? Labour Migration in Times of
Recession.” Policy Network Paper. www.policy-network.net.
Samson, I. 1996. “Albania Experience among Transition Trajectories.” Working paper,
Grenoble.
Sanchez, P. 2007. Cultural Authenticity and Transnational Latina Youth: Constructing a
Meta-Narrative across Borders. Linguistics and Education 18(3–4): 258–82.
Sandell, R. 2005. “Spain’s Quest for Regular Immigration.” ARI 64/2005. May 18. Real
Instituto Elcano de Estudios Internacionales y Estratégicos.
Sander, C. 2003. “Migrant Remittances to Developing Count ries: A Scoping Study.”
Paper prepared for DFID, Bannock Consulting. June.
Savage, K., and P. Harvey. 2007. “Remittances during Crises: Implications for Humani-
tarian Response.” Report Briefi ng Paper 26. Humanitarian Policy Group, London.
Sayan, S. 2006. “Business Cycles and Workers’ Remittances: How Do Migrant Workers
Respond to Cyclical Movements of GDP at Home?” IMF Working Paper No. 06/52,
International Monetary Fund, Washington, DC.
Schiff , M. 2004. “When Migrants Overstay Th eir Legal Welcome: A Proposed Solution
to the Guest-Worker Program.” IZA Discussion Paper 1401.
Schmalzbauer, L. 2008. “Family Divided: Th e Class Formation of Honduran Transna-
tional Families.” Global Networks 8(3): 329–46.
Scullion, L., and G. Morris. 2009. Central and Eastern European Migrants in Tameside.
Salford: University of Salford.
Scullion, L., and S. Pe mberton. 2010. Exploring Migrant Workers Motivations for Migra-
tion and Th eir Perceived Contributions to the UK: A Case Study of Liverpool. Salford:
Migrant Workers North West.
Seddon, D. 2005. “Nepal’s Dependence on Exporting Labour.” www.migrationinformation.
org.
Seddon, D., J. Adhikari, and G. Gurung. 2002. “Foreign Labour Migration and the
Remittance Economy of Nepal.” Critical Asian Studies 34(1): 19–40.
Semyonov, M., and A. Gorodzeisky. 2005. “Labor Migration, Remittances and House-
hold Income: A Comparison between Filipino and Filipina Overseas Workers.” Inter-
national Migration Review 39(1): 45–68.

414 l BIBLIOGRAPHY
Sen, A. 1999. Development as Freedom. New York: Anchor Books.
Shah, N. M. 2004. “Arab Migration Patterns in the Gulf.” In Arab Migration in a Global-
izing World. Geneva: IOM.
Sharma, J., and G. Gurung. 2009. “Impact of Global Economic Slowdown on Remittance
Infl ows and Poverty Reduction in Nepal.” Conference paper for ASEAN/ADB con-
ference, “Th e Imp act of the Global Economic Slowdown on Poverty and Sustainable
Development in Asia and the Pacifi c.” http://www.adb.org/documents/events/2009/
poverty-social-development/papers.asp.
Sharma, J. R. 2008. “Practices of Male Labor Migration from the Hills of Nepal to India
in Development Discourses: Which Pathology?” Gender, Technology and Develop-
ment 12(3): 303–23.
Shauman, K. A., and M. C. Noonan. 2007. “Family Migration and Labor Force Out-
comes: Sex Diff erences in Occupational Context.” Social Forces 85(4): 1735–64.
Shaw, E. S. 1973. Financial Deepening in Economic Development. Oxford: Oxford Uni-
versity Press.
Shaw, J. 2007. “Sri Lanka Country Study.” Monash Asia Institute, Institute for Regional
Development, University of Tasmania, and Foundation for Development Coopera-
tion.
Shehu, A. Y. 2004. “Th e Asian Alternative Remittance Systems and Money Laundering.”
Journal of Money Laundering Control 7(2): 175–85.
Shleifer, A. 2009. “Peter Bauer and the Failure of Foreign Aid.” Cato Journal, 29: 379–90.
Sieveking, N., and M. Fauser. 2009. “Migrationsdynamiken und Entwicklung in West-
afrika: Untersuchungen zur entwicklungspolitischen Bedeutung von Migration in
und aus Ghana und Mali.” Working Paper 68. Center on Migration, Citizenship and
Development, Bielefeld. http://www.uni-bielefeld.de/tdrc/ag_comcad/downloads/
workingpaper_68_sieveking+fauser.pdf.
Singh, B. 2010. “Workers’ Remittances to India: An Examination of Transfer Cost and
Effi ciency.” International Migration 48(5): 63–88.
Singh, R. J. 2010. “From Shock Absorber to Shock Transmitter: Determinants of Remit-
tances in Sub-Saharan Africa.” M igration Letters 7(2): 231–40.
Singh, R. J., M. Haacker, and K.-W. Lee. 2009. “Determinants and Macroeconomic
Impact of Remittances to Sub-Saharan Africa.” IMF Working Paper 09/216. Interna-
tional Monetary Fund, Washington, DC.
Singh, R. J., M. Haacker, K.-W. Lee, and M. LeGoff . 2011. “Determinants and Macroeco-
nomic Impact of Remittances in Sub-Saharan Africa.” Journal of African Economies
20(March): 312–40.
Sirkeci, I. 2005. “Diaspora: Turkish.” In Immigration and Asylum from 1900 to the Pres-
ent, ed. M. Gibney and R. Hansen. Santa Barbara, CA: ABC-Clio.
—. 2006. Th e Environment of Insecurity in Turkey and the Emigration of Turkish
Kurds to Germany. New York: Edwin Mellen Press.

BIBLIOGRAPHY l 415
—. 2009. Improving the Immigration and Asylum Statistics in Turkey [Türkiye’de
Uluslararası Göç ve Sığınma İstatistiklerinin Geliştirilmesi]. Ankara: Turkish Statisti-
cal Institute.
Skeldon, R. 1997. “Rural-to-Urban Migration and Its Implications for Poverty Allevia-
tion.” Asia-Pacifi c Population Journal 12(1): 3–16
—. 2004. “Migration, the Asian Financial Crisis, and Its Aftermath.” In Interna-
tional Migration in the New Millennium, ed. D. Joly. Aldershot: Ashgate.
—. 2008. “International Migration as a Tool in Development Policy: A Passing
Phase?” Population and Development Review 34(1): 1–18.
—. 2010. “Th e Overseas Chinese of South East Asia: History, Culture, Business.”
Journal of Ethnic and Migration Studies 36(7): 1193–94.
Slack, J. 2007. “Polish Immigrants Take £1bn Out of the UK Economy.” Mail Online,
June 28. http://www.dailymail.co.uk/news/article-464759/Polish-immigrants-1bn-
UK-economy.html#.
Smyth, J. 2010. “Poles Based in Ireland Repatriate €841m.” Irish Times, October 26.
Sørensen, N. N. 2005a. “Diaspora, Development and Confl ict: Th e Role of Expatriate
Communities in Development.” In FAU Conference 2005: Reconstructing Post-Con-
fl ict Societies—Challenge and Possibilities. Copenhagen: FAU.
—. 2005b. “Migrant Remittances, Development and Gender.” Danish Institute for
International Studies, Copenhagen. www.diss.dk.
Sørensen, N. N., N. van Hear, and P. Engberg-Pedersen. 2002. “Th e Migration-Develop-
ment Nexus: Evidence and Policy Options State-of-the-Art Overview.” International
Migration 40(5).
Stahl, C. W., and F. Arnold. 1986. “Overseas Workers’ Remittances in Asian Develop-
ment.” International Migration Review 20(4): 899–925.
Stark, O. 1978. “Economic-Demographic Interaction in the Course of Agricultural
Development: Th e Case of Rural-to-Urban Migration.” Research Report 2/78. David
Horowitz Institute for Research of Developing Countries, Tel Aviv.
—. 1991a. “Migration in LDCs: Risk, Remittances, and the Family.” Finance and
Development 28(4): 39–41.
—. 1991b. Th e Migration of Labour. Oxford: Blackwell.
—. 1992. Migration in Developing Countries: Risk, Remittances, and the Family. Tel
Aviv: Tel Aviv University.
Statistics Denmark. 2011. “Migration Statistics.” http://www.dst.dk/homeuk.aspx.
Statistics South Africa. 2011. http://www.statssa.gov.za/census2011/index.asp.
Stenning, A., T. Champion, C. Conway, M. Coombes, S. Dawley, L. Dixon, S. Raybould,
and R. Richardson. 2006. Assessing the Local and Regional Impacts of International
Migration. Newcastle-upon-Tyne: Centre for Urban and Regional Development
Studies.

416 l BIBLIOGRAPHY
Stodolska, M., and C. A. Santos. 2006. “ ‘You Must Th ink of Familia’: Th e Everyday Lives
of Mexican Migrants in Destination Communities.” Social & Cultural Geography
7(4): 627–47.
Straubhaar, T. 1986. “Th e Determinants of Workers’ Remittances: Th e Case of Turkey.”
Weltw irtschafl iches Archiv 122(4): 728–40.
Straubhaar, T., and F. Valdean. 2006. International Migrant Remittances and Th eir Role
in Development. Paris: OECD.
Sunden, A. E., and B. J. Surette. 1998. “Gender Diff erences in the Allocation of Assets in
Retirement Saving Plans.” American Economic Review 88(2): 207–11.
Suro, R., S. Bendixen, B. L. Lowell, and D. C. Benavides. 2002. “Billions in Motion: Latino
Immigrants, Remittances and Banking.” Report produced in cooperation between
the Pew Hispanic Center and the Multilateral Investment Fund. Pew Hispanic Cen-
ter, MIF Fomin, Washington, DC.
Swamy, Gurushri. 1981. “International Migrant Worker’s Remittances: Issues and Pros-
pects.” World Bank Staff Working Paper 481. World Bank, Washington, DC.
Syrett, S., and M. Lyons. 2007. “Migration, New Arrivals and Local Economies.” Local
Economy 22(4): 325–34.
Tacoli, C., G. McGranahan, and D. Satterthwaite. 2008. “Urbanization, Poverty, and
Inequity: Is Rural-Urban Migration a Poverty Problem, or Part of the Solution?” In
Th e New Global Frontier: Urbanization, Poverty an d Environment in the 21st Cen-
tury, ed. G. Marine, G. McGranahan, M. Montgomery, and R. Fernández-Castilla.
London: Earthscan Publications.
Tanner, A. 2005. Emigration, Brain Drain and Development: Th e Case of Sub-Saharan
Africa. Helsinki and Washington, DC: East-West Books and Migration Policy Insti-
tute.
Tatla, D. S. 2002. “A Passage to England: Oral Tradition and Popular Culture among
Early Punjabi Settlers in Britain.” Oral History 30(2): 61–72.
Taylor, J. E. 2000. Do Government Programs “Crowd-In” Remittances? Washington, DC:
Inter-American Dialogue and the Tomas Rivera Policy Inst itute.
Taylor, J. E., J. Arango, G. Hugo, A. Kouaouci, D. S. Massey, and A. Pellegrino. 1996a.
“International Migration and Community Development.” Population Index 62(3):
397–418.
—. 1996b. “International Migration and National Development.” Population Index
62(2): 181–212.
Teves, O. 2005. “Remittances Can’t Replace Good Economic Policies, RP Told.” Associ-
ated Press. http://www.inq7.net.
Th ai Labour. 2009. Farmers Protest in J’lem against Lack of Harvesters. December 9.
https://www.thailabour.org.
Th ieme, S. 2006. Social Networks and Migration: Far West Nepalese Labour Migrants in
Delhi. Munster: LIT Publishing.

BIBLIOGRAPHY l 417
Th omas, B. 1954. Migration and Economic Growth: A Study of Great Britain and the
Atlantic Economy. Cambridge: Cambridge University Press for National Institute of
Economic and Social Research.
Trager, L. 1984. “Migration and Remittances: Urban Income and Rural Households in
the Phili ppines.” Journal of Developing Areas 18: 317–40.
—. 2005. “Women Migrants and Hometown Linakges in Nigeria: Status, Economic
Roles and Contributions to Community Dev elopment.” In Society for Economic
Anthropology Monographs 22, ed. L. Trager. Walnut Creek: AltaMira Press.
Traser, J. 2006. European Citizen Advice Service (ECAS): Who’s Still Afraid of EU
Enlargement? Brussels: ECAS.
Triandafyllidou, A., and D. Lazarescu. 2009. “Th e Impact of the Recent Global Eco-
nomic Crisis on Migration. Preliminary Insights from the South Eastern Borders
of the EU (Greece).” CARIM Analytic and Synthetic Notes 2009/40, Series on the
Impact of Economic Crisis.
UAE Business Forecast Report. 2009. Business Monitor International Ltd.
UKBA (U.K. Border Agency). 2008. “Sponsorship under the Points-Based System.”
http://www.bia.homeoffi ce.gov.uk/employers/points/.
Ullah, A. A. 2010. Rationalizing Migration Decisions: Labour Migrants in East and
Southeast Asia. London: Ashgate.
Ullah, A. A., and P. K. Panday. 2007. “Remitting Money to Bangladesh: What Do
Migrants Prefer? Research Note.” Asian and Pacifi c Migration Journal 16(1): 121–36.
Unan, E. 2009. “Microeconomic Determinants of Turkish Workers’ Remittances: Sur-
vey Results for France-Turkey.” Paper presented at the “International Conference on
Inequalities and Development in the Mediterranean Countries,” May 21–23, Gala-
tasaray University, Istanbul, Turkey.
UNCTAD (United Nations Conference on Trade and Development). 2009. World
Investment Report 2009. New York and Geneva: United Nations.
—. 2010. World Investment Report 2010. New York and Geneva: United Nations.
UN ESCAP (United Nations Economic and Social Commission for Asia and the Pacifi c).
2007. Economic and Social Survey, 2007. Bangkok: UN ESCAP.
UN-INSTRAW (United Nations Entity for Gender Equality and the Empowerment of
Women) and IOM (International Organization for Migration). 2008. Gender and
Remittances: Colombian Migration from the Central Western Metropolitan Area
(AMCO) to Spain.
United Nations. 2009. “International Migration.” Department of Economic and Social
Aff airs, Population Division, New York.
—. 2011. World Economic Situation and Prospects 2011. New York: United Nations
Publications.

418 l BIBLIOGRAPHY
United Nations, Department of Economic and Social Aff airs, Population Division.
2009. “Trends in International Migrant Stock: Th e 2008 Revision.” United Nations
database, POP/DB/MIG/Stock/Rev.2008.
UNDP (United Nations Development Programme). 2006. From Brain Drain to Brain
Gain: Mobilising Albania’s Skilled Diaspora. Tirana.
—. 2008. National Human Development Report: Russian Federation 2008: Russia
Facing Demographic Challenges. New York: UNDP. http://hdr.undp.org/en/reports/
nationalreports/europethecis/russia/NHDR_Russia_2008_Eng.pdf.
—. 2010. “Overcoming Barriers: Human Mobility and Development.” Human
Development Report 2009. New York: UNDP.
Valero-Gil, J. N. 2009. “Remittances and the Household’s Expenditures on Health.” Jour-
nal of Business Strategies 29(spring).
Van Doorn, J. 2004. Migration, Remittances and Small Enterprise Development. Geneva:
International Labour Organization.
Vargas-Silva, C., and P. Huang. 2006. “Macroeconomic Determinants of Workers’
Remittances: Host versus Home Country’s Economic Conditions.” Journal of Inter-
national Trade and Economic Development 15(1): 81–99.
Vertovec, S. 2009. Transnationalism. London: Routledge.
Vickers, A. 2004. “Th e Country and the Cities.” Journal of Contemporary Asia 34(3):
304–17.
Vullnetari, J. 2007. “Albanian Migration and Development: State of the Art Review.”
IMISCOE Working Paper 18. September.
Wacziarg, R., and K. H. Welch. 2008. “Trade Liberalization and Growth: New Evidence.”
World Bank Economic Review 22: 187–231.
WDI. 2009. World Development Indicators 2010. Washington, DC: World Bank.
Welter-Enderlin, R., and B. Hildenbrand, eds. 2006. Resilienz—Gedeihen trotz widriger
Umstände. Heidelberg: Carl Auer Verlag.
Werner, E. E., J. M. Bierman, and F. E. French. 1971. Th e Children of Kauai. A Longitudi-
nal Study from the Prenatal Period to Age Ten. Honolulu: University of Hawaii Press.
Whelpton, J. 2005. A History of Nepal. Cambridge: Cambridge University Press.
Williams, R. 1973. Th e Country and the City. London: Chatto and Windus.
Winters, L. A. 1989. “Th e ‘So-Called Non-Econo mic Objectives’ of Agricultural Policy.”
OECD Economic Studies 13(winter): 237–66.
Winters, L. A., N. McCulloch, and A. McKay. 2004. “Trade Liberalization and Poverty:
Th e Evidence So Far.” Journal of Economic Literature 42: 72–115.
Wong, M. 2006. “Th e Gendered Politics of Remittances in Ghanaian Transnational
Families.” Economic Geography 82(4): 355–81.
Woodruff , C., and R. Zenteno. 2007. “Migration Networks and Microenterprises in
Mexico.” Journal of Development Economics 82: 509–28.

BIBLIOGRAPHY l 419
World Bank. 2003. “Albania—Poverty Assessment.” Report 26213-AL. November 5.
World Bank, Washington, DC.
—. 2005. Global Development Finance, Mobilizing Finance and Managing Vulner-
ability. Washington, DC: World Bank.
—. 2006a. Global Economic Prospects 2006: Economic Implications of Remittances
and Migration. Washington, DC: World Bank.
—. 2006b. Home and Away: Expanding Job Opportunities for Pacifi c Islanders
through Labor Mobility. Washington, DC: World Bank.
—. 2006c. “Nepal Resilience amidst Confl ict: An Assessment of Poverty in Nepal
1995–96 and 2003–04.” Report 34834 NP. Poverty Reduction and Economic Man-
agement Sector Unit, South Asia Region, World Bank, Washington, DC.
—. 2007a. “Albania: Urban Growth, Rural Stagnation and Migration: A Poverty
Assessment.” July 24. World Bank, Washington, DC.
—. 2007b. World Development Indicators. Washington, DC: World Bank.
—. 2008. Global Development Finance 2008, Th e Role of International Banking.
Washington, DC: World Bank.
—. 2009a. Doing Business 2010—Overview. Washington, DC: World Bank.
—. 2009b. Global Development Finance 2009: Charting a Global Recovery. Wash-
ington, DC: World Bank.
—. 2009c. “Income Vulnerabilities and Poverty in El Salvador.” Social Protection
Policy Note. World Bank, Washington, DC.
—. 2009d. Migration and Remittance Data. Washington, DC: World Bank. http://
econ.worldbank.org.
—. 2009e. “Nepal Economic Update.” Economic Policy and Poverty Team, South
Asia Region, World Bank, Washington, DC.
—. 2009f. Swimming against the Tide: How Developing Countries Are Coping with
the Global Crisis. Washington, DC: World Bank.
—. 2009g. “Youth Employability and Economic Opportunities in El Salvador.” Social
Protection Policy Note. World Bank, Washington, DC.
—. 2010a. “Accessing Good Quality Jobs: Priorities for Education, Social Protec-
tion, Science and Technology in El Salvador.” Human Development Policy Note.
World Bank, Washington, DC.
—. 2010b. “Albania: Th e New Growth Agenda.” Country Economic Memorandum,
Report 53599-AL. November. World Bank, Washington, DC.
—. 2010c. “World Bank Development Indicators Database.” https://data.world-
bank.org.
—. 2010d. “World Bank Remittances Prices Worldwide Database.” remittance-
prices.worldbank.org.

420 l BIBLIOGRAPHY
—. 2011a. Global Economic Prospects: Navigating Strong Currents. Washington,
DC: World Bank.
—. 2011b. Migration and Remittances Factbook 2011. Washington, DC: World
Bank.
Yang, D. 2008a. “Coping with Disaster: Th e Impact of Hurricanes on International
Financial Flows, 1970–2002.” B.E. Journal of Economic Analysis & Policy 8(1).
—. 2008b. “International Migration, Remittances, and Household Investment:
Evidence from Philippine Migrants’ Exchange Rate Shocks.” Economic Journal 118:
1–40.
—. 2008c. “International Migration, Human Capital, and Entrepreneurship: Evi-
dence from Philippine Migrants’ Exchange Rate Shocks.” Economic Journal 118:
591–630.
Yang, D., and H. Choi. 2007. “Are Remittances Insurance? Evidence from Rainfall Shocks
in the Philippines.” World Bank Economic Review 21(2): 219–48.
Yang, D., and C. M. Martínez. 2006. “Remittances and Poverty in Migrants’ Home
Areas: Evidence from the Philippines.” In International Migration, Remittances,
and t he Brain Drain, ed. Ç. Özden and M. W. Schiff . Washington, DC, and London:
World Bank and Palgrave Macmillan.
Yazgan, P. 2010. “Belonging and Identity among Migrants from Turkey in Denmark.”
PhD thesis, Social Science Institute, Sakarya University, Turkey.
Yeoh, B., E. Graham, and P. Boyle. 2002. “Migration and Family Relations in the Asia
Pacifi c.” Asia and Pacifi c Migration Journal 11(1): 1–11.
Zachariah, K. C., and S. I. Rajan. 2009. Migration and Development: Th e Kerala Experi-
ence. New Delhi: Daanish Publishers.
—. 2010. “Impact of the Global Recession on Migration and Remittances in Kerala:
New Evidences from the Return Migration Survey (RMS) 2009.” Working Paper 432.
Centre for Development Studies, Kerala, India.
Ziesemer, T. 2006. “Worker Remittances and Growth: Th e Physical and Human Capital
Channels.” UNU-MERIT Working Paper 2006-020.

421
AAbel, Don, 9, 319
Acosta, Pablo, 183
Adams, R., 25
Adhikari, J., 3
Afghanistan
migration, 303, 305, 306
remittance fl ows, 307
Aghion, P., 55
agricultural sector, 201, 239, 245, 254,
264, 325
Akkoyunlu, Şule, 8, 273, 274–75, 278,
280, 283, 285, 287n12
Albania
economic growth in, 239
global fi nancial crisis impact on
migrant households, 240–42,
241f
household income and savings, 246–
47, 246–47t
labor market forecasts in, 223, 223t
remittance fl ows, 248–50, 249–50t
return migration to, 250–52, 251t,
252f
socioeconomic characteristics of
migrants from, 238–40, 240f
Index
Figures, notes, and tables are indicated by f, n, and t following the page number.
underemployment among migrants,
245–46
unemployment rate among migrants,
239, 242–45, 243–44f, 254
women migrants from, 243
Algeria
migration, 83
remittance fl ows, 367, 368t
American Community Survey, 47
anti-money laundering (AML)
regulations, 131, 321
ARDL (autoregressive distributed lag)
procedure, 329
Arellano, M., 342
Armenia, remittance fl ows to, 29, 286
arraigo, 265n3
Asian fi nancial crisis (1997)
economic growth in wake of, 155
labor markets impact of, 81
migration during, 44, 149
private capital fl ows during, 107
remittances during, 102, 150, 339, 378
Association of Nepal Foreign
Employment Agencies, 146
Australia
Albanian migrants in, 238

422 l INDEX
fi nancial services in, 321
immigration policies in, 351
migration, 47, 138
remittance costs in, 322, 322t, 323
remittance fl ows, 320, 371, 372, 373
Austria, labor market forecasts in, 223,
223t
autoregressive distributed lag (ARDL)
procedure, 329
Avendano, R., 286n5
ayuuto savings groups, 361
Azerbaijan, remittance fl ows to, 307
BBaez, Javier, 183
Bahrain
global fi nancial crisis impact on, 67
immigration policies in, 384
migration, 83
remittance fl ows, 377, 382, 383
balance of payments, 107
Balance of Payments Statistics Yearbook
(IMF), 352
Bangladesh
coping mechanisms in, 176–78, 177–
79t, 177f
economic condition of migrants
in UK, 163–66, 164–65f, 166t
in U.S., 160–63, 161f, 162t
exchange rates, impact on remittance
fl ows, 167, 168f
gendered use of remittances, 81–92, 88t
global fi nancial crisis impact on, 154–
63, 156f, 171–79, 173–74f,
175–76t
household uses of remittances, 89–91
migrant welfare funds in, 133
migration, 153–79
to MENA region, 379, 382
to Turkey, 303, 305
to UAE, 83–85, 84f
remittance fl ows, 153–79, 286
from GCC countries, 77, 382, 382t,
383
from MENA region, 381–84, 382t,
383f
trends in, 4
return migration to, 68, 177–78, 178t
women migrants from, 82, 84
Bank of Spain, 262, 265n3
banks as remittance transfer providers,
127–29
Barajas, A., 30n4, 144, 274, 282, 339
Beazley, Rodolfo, 183
Bélanger, Danièle, 7, 81
Belgium, migration to, 43, 233
Bencivenga, V., 55
Benin, remittance fl ows to, 349
Bezuidenhout, Henri, 9, 337
Bilateral Migration Matrix, 103n3
bilateral remittances, 23–24, 30n3,
31–33
Bolivia
EU immigration policies for, 258
migration, 256–57f, 264
remittance fl ows, 255, 259
women migrants from, 257, 261–62,
261t
Bollard, A., 25
Bond, S., 342
Bowman, C., 326
Boyd, J., 55
brain drain, 21, 315
“brain waste,” 230
Brazil, securitization of future
remittance fl ows in, 132
Breusch-Pagan test, 343
Brown, R. P. C., 20
Bugamelli, M., 286n5
Bulgaria, migration from, 257
Bump, Micah N., 3–4
Bureau of Labor Statistics (U.S.), 160
Burkina Faso, remittance fl ows to, 342,
343t
CCalì, M., 281–82, 338, 339
Cambodia, women migrants from, 82
Canada
Albanian migrants in, 238
immigration policies in, 52
migration, 43, 378, 379f
remittance fl ows, 372, 373
Cape Verde, remittance fl ows to, 349
INDEX l 423
capital fl ows, 2f, 3, 6, 30n1, 107, 110, 273,
277t, 286n5. See also remittance
fl ows
Carletto, G., 238
Central and Eastern Europe. See also
specifi c countries
global fi nancial crisis impact on, 37,
231–33
migration and remittance fl ows, 227–
36
remittance trends in, 28
Central Bank of Albania, 248, 250
Central Bank of Bangladesh, 83
Central Bank of Colombia, 259
Central Bank of Turkey, 286n6
Centre for Development Studies, 69, 73,
78, 80n2, 80n4
Centre for Migration Information and
Management, 146
CFT (countering the fi nancing of
terrorism), 131, 321
Chami, R., 286n5
Chand, S., 326
Chin, K., 304
China, trade relationship with GCC
countries, 73
civil society organizations, 84
Clemens, M. A., 25
Cobb-Douglas production function, 328
Cohen, Jeff rey H., 1, 7, 15
Colombia
EU immigration policies for, 258
migration, 256, 256–57f
remittance fl ows, 255, 259, 262, 264
women migrants from, 257, 261–62,
261t
commercial banks, 127, 326
community purpose remittances, 291, 316
compulsory migrations, 296
conditional cash transfers, 191–92
confl ict
Kurdish remittances and, 289
migration decisions infl uenced by, 17
vulnerability of remittances to, 102
construction sector, 71–72, 202, 239,
245, 254, 264, 311, 384
consumption smoothing, 337
continuous migration, 370–71, 370f
contract migration, 69, 92n5
coping mechanisms, 176–78, 177–79t,
177f
Costa Rica, women migrants from, 85
Côte d’Ivoire, migration to, 143
Council of Europe, 15
countering the fi nancing of terrorism
(CFT), 131, 321
cross-border transactions, 321
cultural behavior patterns, 86, 361
Current Population Survey (U.S.), 160,
195
Czech Republic
labor market forecasts in, 223, 223t
remittance fl ows, 230
DDatabase on Indian Economy (Reserve
Bank of India), 94
De, P. K., 135n11
debt repayment, remittances for, 90, 311
Dell’Erba, S., 281–82, 338, 339
del Pino, Alejandro Barajas, 8, 193
Demir, Oğuzhan Ömer, 9, 303
Denmark
migration, 233, 295–96, 297f
remittance fl ows, 297–301, 298f, 300f
unemployment in, 298
women migrants in, 298
Department of Foreign Employment
(Nepal), 134n6
Department of Homeland Security
(U.S.), 157, 169, 190
deportations, 196
Deutsche Bundesbank, 286n6
De Zwager, Nicolaas, 8, 237, 247
Diamond, D., 55, 56
diaspora bonds, 132
Dickey-Fuller tests, 98
“diff erence” generalized method of
moments (GMM) estimator,
341–42, 345, 345t
disaster aid, 3
diversion eff ects, 227
domestic services sector, 239, 243, 245,
264, 311

424 l INDEX
Dominican Republic, women migrants
from, 85
Dubai World, 80n3, 384
Durbin-Watson tests, 98
Dustmann, C., 287n13
Dybvig, P., 55, 56
EEast Asia and Pacifi c. See also specifi c
countries
global fi nancial crisis impact on, 37
migration, 121, 123, 133
remittance trends in, 28
Eckstein, Susan, 3
Economically Active Population Survey
(Spain), 265n5
economic development
in Albania, 239
Asian fi nancial crisis impact on, 155
in El Salvador, 20
in EU, 221–22f, 221–23
global fi nancial crisis impact on, 36–37
in Gulf Cooperation Council
countries, 67, 69–70, 70t
remittance fl ows and, 103n2, 286n4
in South Asia, 37
in Vanuatu, 325, 327t
Ecuador
EU immigration policies for, 258
migration, 256–57f
remittance fl ows, 255, 259, 262
women migrants from, 257, 260, 261t
education
fi nancial, 322–23
of Lebanese migrants, 371
of Mexican migrants, 204–7t
remittance receipts linked to, 24, 25,
120n5, 262
in UK, 228
of women migrants, 86, 90
Egypt, Arab Rep.
global fi nancial crisis impact on, 368,
369
migration, 83
nonresident deposit schemes in, 111
remittance fl ows, 366, 367, 368t, 379,
380t, 384, 385, 385t
securitization of future remittance
fl ows in, 132
elasticity-based forecasting approach,
27–28
electronic cash transfers, 321, 372, 372f
El Salvador
global fi nancial crisis impact on, 183–
92, 184f, 187–89f
remittance fl ows, 20, 183–92, 187–89f
securitization of future remittance
fl ows in, 132, 135n21, 191
E-Money Directive (EU), 225
Employment-Based Permanent
Migration program (U.S.), 47
employment structure. See labor markets
English language skills, 360
entrepreneurship, 24, 58, 337
Ethiopia, remittance fl ows to, 286
ethnic confl ict, 289
European Commission, 222, 225n6
European Commission Accession Treaty,
227
European Pact on Immigration and
Asylum (2008), 258
European Union
global fi nancial crisis impact on, 216–
17, 219–23, 220–21f
immigration policies in, 258
migration, 339
remittance fl ows, 4, 215–25, 265n2
to Lebanon, 371
projections for, 222–23, 222f
trends in, 217–19, 217–18f, 218–19t
vulnerability of destination
regions, 223–24, 223–24t
unemployment in, 221
Eurostat, 221, 282
exchange rates
global fi nancial crisis impact on, 217
remittance fl ow forecasts and, 5, 29,
112, 115, 144, 167, 168f, 262,
282, 285–86, 340, 345, 372–73
South Africa’s remittance fl ows and,
360–61
South Asia’s remittance fl ows and, 79
Sub-Saharan Africa’s remittance fl ows
and, 339

INDEX l 425
Turkey’s remittance fl ows and, 274
extraction industries, 202
FFagen, Patricia Weiss, 3–4
Faini, R., 25
“family and friends eff ects,” 38, 75, 341
family maintenance remittances, 108,
118, 248, 291
family reunifi cation, 25, 234, 239, 258,
260–61, 261t, 296
FDI. See foreign direct investment
Fedecredito (El Salvador), 135n21, 191
female migrants. See gendered use of
remittances; women migrants
feminization of labor migration, 82
Ferenczi, L., 39
fi nancial education, 322
fi nancial institutions and intermediaries
access to, 24, 107
development of, 190–91, 326, 330,
340, 353
in Sub-Saharan Africa, 354
in Vanuatu, 326, 328t
working capital formation and, 54,
55–56, 58–62
Financial Transactions Reporting
(Interpretations) Regulation of
2008 (New Zealand), 321
Finland, migration to, 233
fi scal policy, 72, 191
fi scal stimulus packages. See stimulus
packages
forecasting remittances, 23–33
elasticity-based approach, 27–28
estimation of bilateral remittances,
31–33
matrix-based approach, 27
model for, 25–28
need for, 24
in Turkey, 281–85, 283–84t
foreign aid. See offi cial development
assistance (ODA)
foreign direct investment (FDI)
in MENA region, 365, 366
in Sub-Saharan Africa, 342, 343t
in Turkey, 273, 276, 276f
in Vanuatu, 325, 326, 330
Foreign Employment Department
(Nepal), 134n6
France, migration to, 39, 43, 143
Freund, C., 25, 340
GGabon, remittance fl ows to, 372
Gaillard, N., 286n5
Gambia, remittance fl ows to, 349
GATS (General Agreement on Trade in
Services), 333
Gaza. See West Bank and Gaza
GCC. See Gulf Cooperation Council
(GCC) countries
Gedeshi, Ilir, 8, 237, 247
gendered use of remittances, 81–92. See
also women migrants
future research needs, 11
migration costs and, 87
remittance rates and, 21
in Spain, 261–62, 261t
General Agreement on Trade in Services
(GATS), 333
generalized method of moments (GMM)
estimator, 341–42, 345, 345t
German Development Cooperation, 142
Germany
Albanian migrant workers in, 239
migration, 39, 43, 233, 296, 378, 379f
remittance fl ows, 218–19t
to Poland, 229
to Turkey, 273–88
unemployment in, 276, 277f, 278, 279f
Ghana, remittance costs in, 320
Ghobril, Nassib, 9, 365
Gibson, J., 25, 320
Global Economic Prospects (World
Bank), 320
global fi nancial crisis
in Albania, 240–42, 241f
in Bangladesh, 154–63, 156f, 171–79,
173–74f, 175–76t
in Central and Eastern Europe, 37,
231–33
in East Asia and Pacifi c, 37
in Egypt, 368, 369

426 l INDEX
in El Salvador, 183–92, 184f, 187–89f
in EU, 216–17, 219–23, 220–21f
in Gulf Cooperation Council
countries, 67–80
immigration policies and, 5, 216
in Indonesia, 171
in Jordan, 368, 369
in Kuwait, 67
labor markets and, 189, 217
in Lebanon, 366–74, 368t, 369f
in Middle East and North Africa,
377–78, 381
migrant stocks and, 216, 219–20, 220f
in Morocco, 369
in Oman, 67
in Pakistan, 154–63, 156f
in Philippines, 171
in Qatar, 67
remittance resilience during, 141–47
return migration and, 145–47
in Saudi Arabia, 67
in South Asia, 73–76, 74–76t
in Spain, 255–57, 256–57f
in Sub-Saharan Africa, 338
in Sudan, 368
trade impact of, 36, 154
in Turkey, 275–80
unemployment and, 183, 216
in United Arab Emirates, 67
GMM. See generalized method of
moments estimator
González, Jesús A. Cervantes, 8, 193
Greece
Albanian migrants in, 238–39, 240–
41
debt crisis in, 253
immigration policies in, 239
labor market forecasts in, 223, 223t
nonresident deposit schemes in, 111
return migration from, 251
unemployment in, 50, 240, 241f, 242–
43, 243f
Green, Tim, 7, 35
Gressmann, W., 247
Guatemala, securitization of future
remittance fl ows in, 132
guestworker programs, 43, 155, 378
Guiliano, P., 286n5
Gulf Cooperation Council (GCC)
countries. See also Middle East
and North Africa (MENA);
specifi c countries
economic growth in, 69–70, 70t
employment structure in, 71–72,
71–72t
foreign direct investment in, 73
global fi nancial crisis impact on,
67–80
government expenditures in, 72–73,
73t
migration
from Nepal, 121, 123, 124, 133, 138
from South Asia, 72–73, 77, 77t
trends in, 44, 83
remittance fl ows, 4, 378
to Lebanon, 371–72
to South Asia, 77–79, 78t
return migration, 68–69, 74t, 76, 76t,
373
Gullette, Gregory S., 7, 149
Gupta, Poonam, 7, 93, 96, 102, 105
Gupta, S., 286n5
Gurung, G., 3
HHaacker, M., 30n4, 287n16
Hailwood, Kim, 9, 319
Hakura, D., 286n5
Hariri, Rafi q, 374
Hatton, Tim, 35–36, 37, 38, 39, 42
hawala (informal remittance channel),
95, 109
health care remittances, 90, 262, 291
Homeland Security Department (U.S.),
157, 169, 190
housekeeping. See domestic services
sector
human capital, 82, 135n11, 286n4, 337
hundi (informal remittance channel),
175–76, 176t
Iidentifi cation cards for migrants, 129–
30, 135n18

INDEX l 427
IECs (international education
consultancies), 138
IFAD (International Fund for Aid and
Development), 144
illegal immigration, 190. See also
irregular immigrants
IME Financial Institution Limited, 128
IMF. See International Monetary Fund
immigration policies
global fi nancial crisis impact on, 5,
50–52, 216
in MENA region, 384
remittance fl ow forecasts and, 29
in Spain, 257–58
in UK, 156–57
in U.S., 156–57
incentives for return migration, 48
income
in Albania, 246–47, 246–47t
global fi nancial crisis impact on, 174
migration infl uenced by, 19, 45–46
remittance receipts linked to, 25,
120n5, 345
India
immigration policies in, 157
migrant identifi cation cards, 135n18
migrant welfare funds in, 133
migration, 77
to MENA region, 379, 382, 384
from Nepal, 124, 133
remittance fl ows
to Nepal, 126
shocks aff ecting, 107–20, 113–14t,
115–17f, 117t
stability of, 110–12, 111–12t
structural shifts in, 108–10, 108f, 110t
trends in, 4, 93–105, 94–96f, 97–98t,
100–102t, 103, 103n5, 286
return migration to, 49, 75
Indonesia
Asian fi nancial crisis impact on, 155
global fi nancial crisis impact on, 171
migration, 48
women migrants from, 82, 89
industry distribution, 5, 201–3, 202t,
265n7. See also specifi c industry
sectors
infl ation, 282, 341
informal remittance channels, 95, 109,
175–76, 176t
informal sector employment, 217, 244,
263–64
institutional quality, 352–53
interest rate arbitrage, 110, 115, 119n4
internal migrants, 378
international education consultancies
(IECs), 138
International Finance Corporation,
135n21, 191
International Fund for Aid and
Development (IFAD), 144
International Monetary Fund (IMF)
El Salvador fi scal aid from, 191
on global fi nancial crisis, 36
growth forecast revisions in wake of
fi nancial crisis, 28
International Money Express, 128
intraregional migration, 83, 378–79, 385
Iran, Islamic Rep.
migration, 304, 305, 306
remittance fl ows, 307
Iraq
migration, 304, 305
remittance fl ows, 307, 372
Ireland
famine crisis migration from, 37–38
immigration policies in, 227
labor market forecasts in, 223, 223t
migration, 47, 233
unemployment in, 50
irregular immigrants, 303–11
in Denmark, 296
future research needs, 11
remittance patterns, 306–11, 306–7t,
309–10t
in Spain, 257, 258
Israel
immigration policies in, 380
nonresident deposit schemes in, 111
Italy
Albanian migrants in, 238–39, 240–
41, 249
immigration policies in, 51, 239
labor market forecasts in, 223, 223t

428 l INDEX
remittance fl ows, 218–19t
unemployment in, 240, 241f, 242–43,
243f
JJadhav, N., 96
Japan
immigration policies in, 52
migration, 138
remittance fl ows, 126
return migration incentives off ered
by, 351
Jha, Shikha, 118, 153, 171, 339
Johansen cointegration tests, 112, 113t
Jordan
global fi nancial crisis impact on, 368,
369
migration, 83
remittance fl ows, 366, 367, 368, 368t,
372, 377, 384, 385t, 386
Kkafala system, 384
Kathmandu Post on Nepal migration
trends, 134n6
Kazakhstan
immigration policies in, 51
migration, 142
return migration to, 146
securitization of future remittance
fl ows in, 132
Kenya, remittance fl ows to, 130, 342,
343t
Kerala, returning migrants, 74, 74t
Kholodilin, K. A., 287n12
King, R., 239, 248
kinship ties, 361, 362
Korea. See Republic of Korea
Kumar, Ronald R., 9, 325
Kumari Bank, 128
Kurds
remittance sources, 290–91, 290–91t
remittance uses, 292–93, 292t
Kuwait
economic growth in, 69, 70t
employment structure in, 71
global fi nancial crisis impact on, 67
migration, 83
remittance fl ows, 366, 372
Kyrgyz Republic, remittance fl ows to, 29,
286
Llabor markets. See also unemployment
Asian fi nancial crisis impact on, 81
feminization of labor migration, 82
global fi nancial crisis impact on, 189,
217
in Gulf Cooperation Council
countries, 71–72, 71–72t
in Philippines, 338
remittance behaviors infl uenced by,
19
in Spain, 263–64, 263f
in UK, 163–66, 164–65f, 166t, 231–32
underemployment, 50, 199–200, 200t,
208, 212n6, 245–46
in U.S., 160–63, 161f, 162t
industry distribution, 201–3, 202t
Mexican immigrants in, 195–98,
195t, 196f, 197t
participation rate, 160, 161f
labor mobility, 149, 151, 205, 354
labor policy, 379, 386
Labour Force Survey (UK), 165
Labour Market Regulatory Authority
(Bahrain), 384
Lacalle, Oscar Gómez, 8, 215
Laeven, L., 282
Lagrange Multiplier test, 120n6
language skills, 233, 239, 360
latent entrepreneurs, 90–91
Latin America and the Caribbean. See
also specifi c countries
migration to Spain, 256–57
remittance fl ows, 4, 28, 285, 371, 372
return migration to, 48, 385
women migrants from, 260–61
Lazarescu, D., 246
Lebanon
global fi nancial crisis impact on, 366–
74, 368t, 369f
migration, 83
nonresident deposit schemes in, 111
INDEX l 429
political risk and remittance fl ows,
374–75, 375t
remittance fl ows, 365–77, 368t
continuous migration and, 370–71,
370f
determinants of, 369–74, 370f, 372f
exchange rate eff ect on, 372–73
as fi nancial support, 371
sources of, 371–72, 372f
return migration, 373–74
Lee, K.-W., 30n4, 287n16
Lesotho, remittance fl ows to, 342, 343t,
349
liberalization of fi nancial sector, 94, 101
liberalization of trade, 330, 333
LIBOR (London Interbank Off ered
Rate), 100, 112
Libya, migration from, 83
Lithuania, remittance fl ows to, 230
loan repayment remittances, 90, 311
Local Multiplier 3 approach, 236
London Interbank Off ered Rate
(LIBOR), 100, 112
Lucas, R., Jr., 55
Lucas, R. E. B., 287n14
Ludsteck, J., 287n13
Lueth, E., 25, 340
Luxembourg Group, 225
MMaddison, A., 39
Mahler, S. J., 82
Malaysia
immigration policies in, 51
migration, 123, 123f, 124, 134n4, 138,
143
return migration to, 49, 146
Mali
migration, 143
poverty reduction in, 144–45
remittance fl ows, 142, 144
return migration to, 146–47
managed migration, 236
Mansuri, G., 135n11
manufacturing sector, 71, 183, 202, 239,
243
Martin, P., 46
Massey, D. S., 3, 6, 85
Matejowsky, Ty, 9, 315
matrix-based forecasting approach, 27
Mauritania, remittance fl ows to, 367
McKenzie, D., 25, 320
medical treatment remittances, 90, 262,
291
MENA. See Middle East and North
Africa
Mexico
immigrants in U.S., 195–97, 195t,
196f, 197t
average earnings of, 197–98, 197t
education level of, 204–7t
identifi cation cards for, 135n18
industry distribution of, 201–3,
202t
total earnings of, 198–201, 198–
201t, 206–7t, 210f
unemployment rate among, 203–7,
203t, 205f, 208, 209t
migration, 43, 47
remittance fl ows, 48, 193–212, 194f,
285
securitization of future remittance
fl ows in, 132
women migrants from, 85, 198, 211
microfi nance institutions, 129, 333
Middle East and North Africa (MENA).
See also Gulf Cooperation
Council countries; specifi c
countries
global fi nancial crisis impact on
migration and remittances,
377–78, 381
migration trends, 109–10, 155, 378–
81, 379t
remittance fl ows, 28, 377–86, 380t, 381f
infl ows, 384–85, 385t
outfl ows, 381–84, 382t, 383f
unemployment in, 379
migrant stocks
global fi nancial crisis impact on, 216,
219–20, 220f
in remittance forecasting, 25
resilience of remittances and, 103n5
migrant welfare funds, 133, 228

430 l INDEX
migrants vs. native workers
impact of fi nancial crisis, 49
unemployment rates, 51f
migration. See also specifi c regions and
countries
Asian fi nancial crisis and, 44
compulsory, 296
costs of, 87, 90, 145, 220, 293
economic crises and, 35–52
future projections for, 44–52, 45t, 46f
future research needs, 10–11
global fi nancial crisis and, 36–37, 37f
Great Depression and, 42–43
immigration policies and, 50–52
managed migration, 236
motives for, 150–51, 231–33, 310–11,
370, 370f
in nineteenth-century crises, 37–42,
38f, 40–42f
rural-urban, 149–52
survival migration, 239
in twentieth-century crises, 42–44
migration policy. See immigration policies
Ministry of Labour and Social Security
(Germany), 296
mobile phones, 130, 131f
Mohapatra, S., 77, 102, 103n5, 274, 286,
339, 350
Mohapatra, Sanket, 7, 23, 121
Moldova, remittance fl ows to, 286
MoneyGram, 128
money laundering. See anti-money
laundering (AML) regulations
money order facilities, 130
MoneyPACIFIC, 323, 324
money transfer operators (MTOs), 122,
126, 127–29
Montiel, P., 286n5
Morocco
global fi nancial crisis impact on, 369
migration, 83, 256–57f, 296
remittance fl ows, 255, 259, 262, 264,
366, 367, 368t, 384–85, 385t,
386
women migrants from, 257, 260, 261t
Mozambique, remittance costs in, 320
MTOs. See money transfer operators
Muncha.com, 128
Mundaca, Gabriela, 7, 53, 55
Murrugarra, Edmundo, 183
Myanmar
migration, 305
remittance fl ows, 307
women migrants from, 82
NNagarajan, S., 338, 346n1
Narayana, D., 7, 67
national identity, 316
National Migration Survey (Th ailand),
150
natural disasters, 3
Naudé, Wim, 9, 337
Naufal, George, 9, 377
Nayyar, D., 119n4
Nepal
capital market access leveraging on
remittances, 132
migration
history of, 77, 137–39
policies and institutions, 132–33
trends, 77, 122–25, 123f, 137–39
remittance fl ows, 121–35, 142, 144, 286
access to remittance market, 129–
31, 131f
from GCC countries, 77
from India, 126
market services for, 127–31, 128t,
131f
trends, 125–27, 125f, 126t, 127f
return migration to, 49, 68, 146
securitization of future remittance
fl ows in, 132
women migrants from, 82, 138
Nepal Rastra Bank, 129
Netherlands
migration, 39
remittance fl ows, 218–19t
New Economics Foundation, 236
New Zealand
fi nancial education in, 322–23
migration, 25
Recognised Seasonal Employer
Scheme, 324n1
INDEX l 431
remittance costs in, 319–24, 322t
remittance fl ows, 320
New Zealand–Pacifi c Remittance
Project, 319, 320, 321, 323, 324
Nicaragua, women migrants from, 85
Nigeria, remittance fl ows to, 342, 343t
Niimi, Y., 25
Nikas, C., 248
nonmonetary remittances, 21–22
nonremittance income, 3, 6
nonresident deposit schemes, 111
Non-Resident External Rupee Account
(India), 109
North Africa. See Middle East and North
Africa (MENA)
Norway, unemployment in, 50
OOECD. See Organisation for Economic
Co-operation and Development
Offi ce for National Statistics (UK), 165
offi cial development assistance (ODA)
in Nepal, 121, 125
resilience of, 2f, 3
in Sub-Saharan Africa, 340, 342, 343t,
346n1, 349
in Turkey, 276, 276f
in Vanuatu, 325, 330
OFWs (overseas Filipino workers), 315–
16. See also Philippines
oil crisis (1973), 81, 109, 155, 378
Oman
foreign direct investment in, 73
global fi nancial crisis impact on, 67
migration, 83
remittance fl ows, 377
online remittance providers, 128
Organisation for Economic Co-operation
and Development (OECD)
on economic growth in Turkey and
Germany, 282
on immigration and economic cycles, 44
on remittance trends, 15
on unemployment rates among
migrants, 50
Organization of the Petroleum Exporting
Countries (OPEC), 155
O’Rourke, K., 37, 52n2
Orozco, M., 3
overlapping-generations model, 56, 63
Overseas Employment Administration
(Philippines), 48
overseas Filipino workers (OFWs), 315–
16. See also Philippines
Ozden, C., 25
PPacifi c islands. See East Asia and Pacifi c;
specifi c countries
Pacifi c Islands Forum, 324
Pakistan
development linked to remittances in,
135n11
economic condition of migrants
in UK, 163–66, 164–65f, 166t
in U.S., 160–63, 161f, 162t
global fi nancial crisis impact on, 154–
63, 156f
migrant welfare funds in, 133
migration, 77, 153–69, 296, 304, 305,
306, 379, 382
nonresident deposit schemes in, 111
remittance fl ows, 153–69
exchange rate changes and, 167,
168f, 286
from GCC countries, 77, 382, 382t,
383
from MENA, 381–84, 382t, 383f
trends in, 4
from Turkey, 307
return migration to, 68
Parra, S. N., 286n5
Parsons, C. R., 30n3, 352
part-time employment, 50, 199, 208,
212n6
Paterno, F., 286n5
Pattillo, A., 286n5
Payment Services Directive (EU), 225
Pemberton, Simon, 8, 227
Person of Indian Origin card, 135n18
Pesaran, M. H., 329
Pessar, P. R., 82
PGA (Programa General Anti-Crisis, El
Salvador), 191

432 l INDEX
Philippines
global fi nancial crisis impact on, 171
labor market in, 338
migrant assistance programs, 133
migrant welfare funds in, 133
migration, 48, 379, 382
remittance fl ows
exchange rate changes and, 286
from GCC countries, 382, 382t
from MENA, 381–84, 382t, 383f
migration and, 315–17
remittance transfers in, 130
return migration to, 49
women migrants from, 82, 89, 92
physical capital, 82, 90, 286n4
Plaza, S., 339
Points-Based System (UK), 229
Poland
migration, 125, 133, 257
remittance fl ows, 229, 230
return migration to, 48
political risk and remittance fl ows
in Albania, 238
in India, 102
in Lebanon, 373, 374–75, 375t,
376nn4–5
in Sub-Saharan Africa, 353
in Turkey, 280
Portugal, labor market forecasts in, 223, 223t
post offi ces, 130
poverty reduction
in Albania, 253
in El Salvador, 185, 188
labor mobility and, 149
in Mali, 144–45
in Nepal, 125
remittance receipts linked to, 24, 143,
215, 286n4, 325
in South Asia, 135n11
in Sub-Saharan Africa, 338, 350
Prabhu Money Transfer, 128, 129
Prescott, E., 55
private capital fl ows, 2f, 3, 6, 30n1, 107,
110, 273, 277t, 286n5. See also
remittance fl ows
Programa de Ayuda Temporal al Ingreso
(El Salvador), 192
Programa General Anti-Crisis (PGA, El
Salvador), 191
PRS Group, 374–75, 376nn5–8
public transfer schemes, 287n10
QQatar
economic growth in, 69, 70t
foreign direct investment in, 73
global fi nancial crisis impact on, 67
migration, 83, 123, 123f, 124, 138, 143
remittance fl ows, 126, 366, 372, 383
return migration from, 146
RRahman, MD Mizanur, 7, 81
Raihan, Selim, 171
Rajan, S. Irudaya, 7, 67
Ratha, Dilip, 1, 7, 23, 24, 26, 30n3, 53, 77,
102, 103n5, 121, 135n11, 274, 286,
286n1, 286n5, 287n11, 339, 350
Recaño-Valverde, Joaquín, 8, 255
Recognised Seasonal Employer Scheme
(New Zealand), 324n1
regularization campaigns, 258
regulatory measures for remittance
transfer industry, 107, 131, 321
remittance cards, 321, 323
remittance costs
in El Salvador, 190
future research needs, 11
global fi nancial crisis impact on, 216
in Nepal, 129
in New Zealand, 319–24
in Spain, 262–63
in U.S., 211n2
remittance fl ows. See also specifi c regions
and countries
decline or decay in, 19–20
defi ned, 16
determinants of, 24–25
economic role of, 16–22
family reunifi cation role in, 260
forecasting, 23–33
future research needs, 10–11
gendered use of, 81–92
impact on economic slowdown, 216
INDEX l 433
importance to developing countries, 24
migration and, 16–22
resilience during global fi nancial
crisis, 2–3, 2f, 4–6, 22, 23–33,
141–47
reverse remittances, 220
securitization of future remittance
fl ows, 132, 135n21, 191
theoretical analysis, 15–22
working capital formation and, 53–64
remittance intensities, 26
Remittance Price Database (World
Bank), 135n20
remittance services. See fi nancial
institutions and intermediaries
remittances
capital infl ows and, 96, 96f
current account infl ows and, 95–96,
95f
determinants of, 353
repatriation assistance, 49
Republic of Korea
Asian fi nancial crisis impact on, 155
immigration policies in, 51, 351
migration, 138
remittance fl ows, 126
Reserve Bank of India, 94, 129
Reserve Bank of New Zealand, 320
Reserve Bank of Vanuatu, 326
Resident Labour Market test (UK), 229
return migration. See also specifi c regions
and countries
as coping mechanism, 5, 177–78, 178t
future research needs, 10
global fi nancial crisis and, 145–47
incentives and assistance for, 48–49,
351, 385
reverse remittances, 220
Riester, Andrea, 7, 141
Rohorua, H., 25, 320
Roig, Marta, 8, 255
Romania
migration, 125, 133, 256–57f, 264
remittance fl ows, 223, 255, 259, 262
women migrants from, 257, 261–62,
261t
Romer, P. M., 55
Roskilde Culture Association, 297
Ruiz, I., 285
Ruiz-Arranz, M., 25, 286n5, 340
rural households
in El Salvador, 186
in Nepal, 125
unemployment among, 183
rural-urban migration, 149–52
Russell, S. S., 119n4
Russian Federation
immigration policies in, 50, 351
migration, 125, 133, 142
remittance fl ows, 29, 144, 255
return migration from, 48, 145–46
Rwanda, remittance fl ows to, 307
SSaith, A., 91
Samoa, remittance fl ows to, 320
Saudi Arabia
employment structure in, 71
foreign direct investment in, 73
global fi nancial crisis impact on, 67
immigration policies in, 157
labor policy in, 379
migration, 44, 67, 83, 123, 123f, 138,
143, 378–79, 379f
remittance fl ows, 99, 126, 255, 366,
372, 377, 379, 380t, 382
savings
in Albania, 246–47, 246–47t, 252–53
in Central and Eastern Europe, 234
in El Salvador, 190
by Kurdish migrants, 293
return migration and, 5
by women migrants, 89
Schengen visas, 258
Schönberg, U., 287n13
Scullion, Lisa, 8, 227
seasonal employment schemes, 333
securitization of future remittance fl ows,
132, 135n21, 191
Seddon, D., 3
SendMoneyPacifi c website, 321, 323
Senegal, remittance fl ows to, 307, 342,
343t, 349
services sector, 201, 264, 384

434 l INDEX
Shaff er, Marnie, 9, 359
Sharma, Jeevan Raj, 137
Shaw, W., 24, 26, 30n3
Shin, Y., 329
Shleifer, A., 326
Sierra Leone, remittance fl ows to, 349
Silwal, Ani, 7, 103n5, 121, 274, 350
Singh, Bhupal, 7, 107
Singh, Karan, 7, 93
Singh, Raju Jan, 9, 30n4, 287n16, 349
Singh, Ranjit, 137
Sirkeci, Ibrahim, 1, 7, 8, 15, 289, 295
skilled workers, 47, 230, 371, 373
Slovakia, remittance fl ows to, 230
Smith, B., 55
Smith, R., 329
Smyth, J., 229
social capital, 3, 89
social networks, 75, 151, 297, 300, 316,
341, 361
social resilience, 141
Somalia
migration, 304
remittance fl ows, 359–62
South Africa
remittance transfers in, 130
Somali migrants in, 359–62
unemployment in, 360
women migrants in, 359–62
South Asia. See also specifi c countries
economic growth in, 37
global fi nancial crisis impact on,
73–76, 74–76t
migration, 44, 83
remittance fl ows, 4, 28, 77–79, 78t
return migration, 68–69, 73–76
South Korea. See Republic of Korea
Sozer, M. Alper, 9, 303
Spain
global fi nancial crisis impact on, 255–
57, 256–57f
immigration policies in, 257–58, 264
labor market, 263–64, 263f
migration, 255–69
family reunifi cation, impact of,
260–61, 261t
labor market impact on, 143
trends in, 47, 258–60, 259–60f
nonresident deposit schemes in, 111
remittance costs in, 262–63
remittance fl ows, 218–19t, 220, 220f,
255–69, 265n2
return migration from, 48, 351, 385
unemployment in, 50
women migrants in, 257, 261–62, 261t
Spatafora, N., 25, 340
Sri Lanka
migrant welfare funds in, 133
migration, 77
nonresident deposit schemes in, 111
remittance fl ows, 378
return migration, 68
women migrants from, 82, 89
Stark, O., 287n14
Starr, R., 55
stimulus packages, 6, 51, 373
Straubhaar, T., 119n4
Sub-Saharan Africa. See also specifi c
countries
global fi nancial crisis impact on, 338
remittance fl ows, 337–47, 341t, 343t,
351f
determinants of, 349–57, 353t
forecasting, 282
shock-absorbing role of, 144
sources of, 349, 350f
trends in, 28
return migration to, 351
Sudan
global fi nancial crisis impact on, 368
remittance fl ows, 307, 342, 343t, 367,
368t
Sugiyarto, Guntur, 8, 153, 171, 339
survival migration, 239
Swamy, Gurushri, 119n4
Swaziland, remittance fl ows to, 342, 343t
Sweden
immigration policies in, 227
migration, 39, 233
unemployment in, 49
Switzerland
migration, 43
remittance fl ows, 255
Syrian Arab Republic
INDEX l 435
migration, 83
remittance fl ows, 307, 367, 368t
TTajikistan
remittance fl ows, 29, 142, 144, 286
return migration to, 48, 145–46
women migrants from, 142
Taylor, J. E., 3, 287n10
temporary employment, 298
Temporary Income Support Program (El
Salvador), 192
temporary workers, 109–10, 324n1
terrorism fi nancing regulations. See
countering the fi nancing of
terrorism (CFT)
Th ailand
Asian fi nancial crisis impact on, 155
employment discrimination in, 49
immigration policies in, 51
migrant welfare funds in, 133
nonresident deposit schemes in, 111
rural-urban migration in, 149–52
Th aksin Shinawatra, 150, 152
Th amel.com, 128
Th omas, B., 39
Togo, remittance fl ows to, 342, 343t, 349
Tonga
migration to New Zealand, 25
remittance fl ows, 320
total factor productivity, 329
tourism revenues, 121, 125, 325, 365, 366
trade
fi nanced by remittances, 122
global fi nancial crisis impact on, 36,
154
liberalization of, 330, 333
transaction costs, 320. See also
remittance costs
Triandafyllidou, A., 246
Tunisia
migration, 83
remittance fl ows, 366, 367, 368t
Turkey
banking crisis (2001), 275
global fi nancial crisis impact on, 275–
80
irregular immigrants in, 303–11, 306t,
307t, 309–10t
Kurdish remittances, 289–93
migration
to Denmark, 295–96, 297f
to Germany, 43, 273–88, 274f
nonresident deposit schemes in, 111
remittances
from Denmark, 297–301, 298f,
300f
from Germany, 275–79f, 277t,
280–85, 283–84t
of irregular immigrants, 306–11,
307t, 309–10t
of Kurds, 289–93
sources of, 290–91, 290–91t
uses of, 292–93, 292t
securitization of future remittance
fl ows in, 132
unemployment in, 276, 277f, 278, 279f
women migrants in, 305
Turkmenistan, remittance fl ows in, 307
UUAE Exchange, 128
Uganda
poverty reduction in, 338
remittance fl ows, 349
Ukraine
migration, 257
remittance fl ows, 223
Unan, E., 286n6
underemployment, 50, 199–200, 200t,
208, 212n6, 245–46
undocumented immigrants. See irregular
immigrants
unemployment
Albanian immigrants, 239, 242–45,
243–44f, 254
in Denmark, 298
in EU, 221, 242–45, 243–44f
in Germany, 276, 277f, 278, 279f
global fi nancial crisis impact on, 183,
216
in Greece, 240, 241f, 242–43, 243f
in Italy, 240, 241f, 242–43, 243f
in MENA region, 379
436 l INDEX
Mexican immigrants, 203–7, 203t,
205f, 208, 209t
in South Africa, 360
in Spain, 263–64, 263f
in Turkey, 276, 277f, 278, 279f
in UK, 163, 164–65f, 166
in U.S., 160, 161f, 163, 187–88f, 203–
7, 203t, 205f, 208, 209t
United Arab Emirates
economic growth in, 69, 70t
employment structure in, 71–72
foreign direct investment in, 73
gendered use of remittances in, 81–92
global fi nancial crisis impact on, 67
migration, 83, 123, 123f, 124, 138, 143,
384
remittance fl ows, 126, 366, 372, 382, 383
return migration from, 75, 373
United Kingdom
Albanian migrant workers in, 239
economic condition of migrants in,
163–66, 164–65f, 166t
exchange rate changes, impact on
remittance fl ows, 167, 168f
immigration policies in, 50, 156–57,
169, 169n1, 227, 229
labor market in, 231–32
migration
from Bangladesh, 173
from MENA region, 378, 379f
from Nepal, 138
trends in, 44, 47
remittance fl ows
to Bangladesh and Pakistan, 156–
63, 158t, 159f
to Central and Eastern Europe,
227–36
exchange rates and, 167, 168f
to Poland, 229
return migration from, 48, 351
women migrants in, 165
United Nations Development
Programme, 135n21
United States
Albanian migrants in, 238
economic condition of migrants in,
160–63, 161f, 162t
Great Depression impact on
migration in, 42–43
immigration policies in, 51, 156–57,
169, 169n1, 351
Mexican migrants in, 195–98, 195t,
196f, 197t
migration, 39, 40–42f, 42–43, 47
identifi cation cards for migrants in,
135n18
from MENA region, 378, 379f
from Nepal, 138
part-time employment in, 50
remittance fl ows, 4, 255
to Bangladesh and Pakistan, 156–
63, 158t, 159f
to Colombia, 259
to El Salvador, 186
exchange rates and, 167, 168f
to Lebanon, 372, 373
to Mexico, 48, 193–212, 194f, 285,
287n10
to Pacifi c islands, 320
Somali migrants in, 359–62
unemployment in, 185–87, 187–88f,
203–7, 203t, 205f, 208, 209t
women migrants in, 198, 211, 359–62
Uzbekistan
migration, 305
remittance fl ows, 307
return migration to, 48, 49
VValencia, F., 282
Vanuatu
demographic profi le, 326, 328t
economic indicators, 325, 327t
fi nancial institutions in, 326, 328t
remittance fl ows, 325–33, 326f
trends in, 326, 327t, 329t
Vargas-Silva, Carlos, 9, 153, 171, 285,
339, 377
Vertovec, S., 20
Vietnam, women migrants from, 82
violence. See confl ict
Vogel, T., 278
VoxEU.org, 36
Vulnerability FLEX instrument, 225
INDEX l 437
Wwage diff erentials, 112, 198
Wagh, S., 286n5
welfare funds for migrants, 133, 228
West Bank and Gaza
migration, 83, 304
remittance fl ows, 367
Western Union, 127–28
West Germany, migration to, 43. See also
Germany
Wilcox, W. F., 39
Williamson, Jeff , 36, 37, 38, 39, 42
Winters, L. Alan, 7, 35, 38
women migrants
from Albania, 243
in Denmark, 298
future research needs, 11
irregular migration by, 311
migration costs for, 87
from Nepal, 82, 138
remittance rates of, 21
in South Africa, 359–62
in Spain, 257, 260–62, 261t
from Tajikistan, 142
in Turkey, 305
in UK, 165
in U.S., 198, 211, 359–62
Workers Registration Scheme (UK), 47,
227
working capital formation, 53–64
fi nancial intermediaries’ decisions
and, 58–62
literature review, 55
remittances, role of, 55–63
work permits, 92n5
World Bank
on current account defi cits and
remittances, 286n5
on domestic demand driven by
remittances, 253
growth forecast revisions in wake of
fi nancial crisis, 28
on private capital infl ows, 30n1
on remittance costs, 319, 320
Remittance Price Database, 135n20
on remittances to South Asia, 78–79
on remittances to Sub-Saharan Africa,
346n1
World Development Indicators (World
Bank), 329, 352
XXu, Z., 77
YYang, D., 167
Yazgan, Pinar, 8, 295
Yemen, Rep.
migration, 83
remittance fl ows, 367, 368t, 379, 380t
ECO-AUDIT
Environmental Benefits Statement
The World Bank is committed to preserv-ing endangered forests and natural resources. The Office of the Publisher has chosen to print Migration and Remittances during the Global Financial Crisis and Beyond on recy-cled paper with 50 percent postconsumer fiber in accordance with the recommended standards for paper usage set by the Green Press Initia-tive, a nonprofit program supporting publish-ers in using fiber that is not sourced from endangered forests. For more information, visit www.greenpressinitiative.org.
Saved:• 10 trees• 5 million British
thermal units of total energy
• 1,085 pounds of net greenhouse gases (CO2 equivalent)
• 4,893 gallons of wastewater
• 310 pounds of solid waste

9 0 0 0 0
9 780821 388266
ISBN 978-0-8213-8826-6
SKU 18826
The fi nancial crisis of 2008 started with the collapse of the fi nancial sector in the United States and Western Europe, then quickly spread to countries around the globe. At a time when migrants travel from south to north and east to west (as well as
south to south), it was critical to ask what the impact of the crisis was and is, not just for developing countries, but also for the migrants who hail from them. For many developing countries, migrant remittances were and are central to economic well-being—not just for the nation, but for its citizens as well.
Understanding the impact of the crisis on global markets, developing nations, and the practices of their migrant communities drives this study. Migration and Remittances during the Global Financial Crisis and Beyond explores several important topics, including how the crisis impacted remittance practices globally and how migrants adjusted to meet the challenge of the resulting recession. The authors show how, in most cases, remittances did not drop as quickly or precipitously as did other economic indicators. Migrants from around the globe faced the challenges of the crisis and strategically responded, rethinking their roles, work, and remittances practices. Most important, the authors document that migrants did not and do not drain resources from struggling national economies. Instead, migrants and their remittances are central to the economic health of the households and countries from which they have come.
“The number of international migrants doubled to 215 million in the quarter-century to 2010, while remittances to developing countries more than quadrupled to over $300 billion. There were fears that the 2008–09 global recession would result in the widespread return of migrants and declining remittances to developing countries. These fears were not realized, and this important book explains why.
“Countries that sent migrants to many countries had the fewest returns and the smallest drops in remittances, and freer-migration corridors reacted most quickly to changing economic conditions, as Poles left Ireland within the European Union. The contributors to this book include leading experts on migration and its effects in developing countries, making the book of lasting value.”
—Philip L. Martin
Professor and Chair, Comparative Immigration & Integration Program,Department of Agricultural Economics, University of California, Davis