midterm exam 2 answers - university of wisconsin–madisonmchinn/e310mt2a_f04.pdf · midterm exam 2...
TRANSCRIPT
Economics 310 Menzie D. Chinn Fall 2004 Social Sciences 7418 University of Wisconsin-Madison
Midterm Exam 2 Answers This exam is 60 minutes long. There are 8 questions on the exam – be sure to check that you answer all 8 questions. Points are allocated in proportion to the time allocated. Answer all questions in your bluebook. Make certain you write your name, your student ID number, and your TA’s name on your bluebook. Be sure to show your work, “boxing in” your final answer (don’t “box-in” more than one answer!); partial credit will be awarded for showing your work. Note: there may be some fractions that cannot be simplified, but in general, you should be able to solve for exact numerical solutions using simple multiplication or long division.
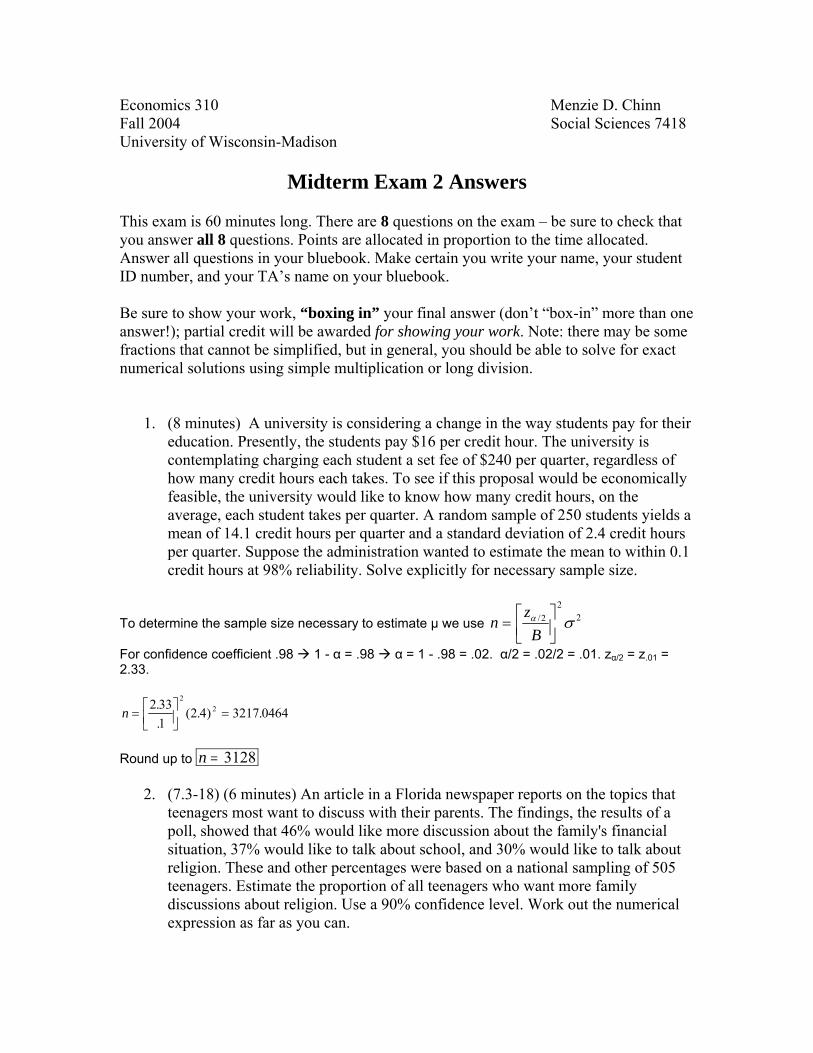
1. (8 minutes) A university is considering a change in the way students pay for their education. Presently, the students pay $16 per credit hour. The university is contemplating charging each student a set fee of $240 per quarter, regardless of how many credit hours each takes. To see if this proposal would be economically feasible, the university would like to know how many credit hours, on the average, each student takes per quarter. A random sample of 250 students yields a mean of 14.1 credit hours per quarter and a standard deviation of 2.4 credit hours per quarter. Suppose the administration wanted to estimate the mean to within 0.1 credit hours at 98% reliability. Solve explicitly for necessary sample size.
To determine the sample size necessary to estimate µ we use nzB
= ⎡⎣⎢
⎤⎦⎥
α σ/22
2
For confidence coefficient .98 1 - α = .98 α = 1 - .98 = .02. α/2 = .02/2 = .01. zα/2 = z.01 = 2.33.
n = ⎡⎣⎢
⎤⎦⎥
=2 33
12 4 3217 0464
22.
.( . ) .
Round up to n = 3128
2. (7.3-18) (6 minutes) An article in a Florida newspaper reports on the topics that teenagers most want to discuss with their parents. The findings, the results of a poll, showed that 46% would like more discussion about the family's financial situation, 37% would like to talk about school, and 30% would like to talk about religion. These and other percentages were based on a national sampling of 505 teenagers. Estimate the proportion of all teenagers who want more family discussions about religion. Use a 90% confidence level. Work out the numerical expression as far as you can.

For confidence coefficient .90, 1 – 0.90 = 0.10 α = 1 - .90 = .10 α/2 = 0.10/2 =0.05 z α/2 = z .05 = 1.645. The 90% CI for p is:
$$ $
/p zpqn
± ⇒α 2 0 30 164530 70
505. .
(. )(. )±
3. (6 minutes) The lifetime of a new computer follows an exponential distribution with a mean of 5400 hours of use. Find the probability that a randomly selected computer will last less than 2700 hours.
Let x = life length. Then x is an exponential random variable with θ = 5400. We want P(x<a); Note P(x<a) = 1-P(x>a). P(x>a) = e –a/θ
P(x>3240) = e –2700/5400 = e -0.5 = 0.606531 Hence, P(x<a) = 1- 0.606531 = 0.606531
4. (6 minutes) A consumer product magazine recently ran a story concerning the
increasing price of VCR's. The story stated that VCR prices dipped in the early 1990's but now are beginning to skyrocket in price. According to the story, the average price of a VCR in 1992 was $209. A sample of 9 VCR's in 1998 yielded an average price of $289 and a standard deviation of $60. Test to determine if the average price of VCR's in 1998 exceeds the average price in 1992. Use α=0.05.
One answer to this question is that nothing can be said, since the sample size is too small to apply the central limit theorem and the t-distribution is inappropriate since no assumption of Normality is made. Another possibility is to ASSUME that the data are normally distributed - it is important to state this explicitly since otherwise the test is invalid - then one could use the t-distribution to test this hypothesis as follows. To determine the average price of VCR's in 1998 exceeds $209, we test: H0: µ = 209 vs. HA: µ > 209 The test statistic is
The test statistic for the test is tx
nxs n
=−
≈−
=−
=µ
σµ0 0 289 209
60 94 0
/ / /.
The rejection region requires α = .05 in the upper tail of the t-distribution with df=n-1=9-1=8. The rejection region is t > t.05 = 1.860 Reject H0 if t > 1.860. Since the observed value of the test statistic falls in the rejection region, H0 is rejected. There is sufficient evidence to indicate that the average VCR price in 1998 exceeds 209 when testing at α = .05.
5. (6 points) Consider the problem of testing the null hypothesis 0H that 0µµ = versus the alternative hypothesis aH that 0µµ ≠ . You have data nxxx ,..., 21 .
5.1 Write down a test of the null hypothesis that has probability of Type I error equal to 0. Be explicit about the testing procedure. What is the power of this test?
The test is “never reject 0H ”. This test has a power of 0.
5.2 Write down a test of the null hypothesis that has power 1 . Be explicit about the
testing procedure. What is the probability of Type I error?
The test is “always reject 0H ”. This test has a size of 1. 6 (6 minutes) Consider the probability distribution shown here.
X 4 6 8 p(x) 1/3 1/3 1/3
Let x be the sample mean for a random sample of n = 2 measurements from this distribution. Show that x is an unbiased estimator for µ by calculating the value of E(x) and E( x ) explicitly using the distribution provided. E(x) = µ = (4)(1/3) + (6)(1/3) + (8)(1/3) = 6 E( x ) = (4)(1/9) + (5)(2/9) + (6)(3/9) + (7)(2/9) + (8)(1/9) = 54/9 = 6 Since E( x ) = µ , x is an unbiased estimator of µ . 7 (14 points total) Suppose the weight of airline passengers and their luggage is
normally distributed with a mean of 200 pounds and a standard deviation of 50 pounds. Safety regulations require that an airplane carry less than 120,000 pounds. 7.1 Suppose the airline wants to be 100% sure that it is in compliance with the
regulation; what is the maximum number of passengers it could allow on one plane?
Let n = number of passengers. Let W = the total weight of the plane. If n = 0, W=0 w.p.1. If n>0, W>120,000 with positive probability. Require n=0.
7.2 Say the airline allows n = 400 passengers on the plane; what is the probability that
the plane meets the regulations?
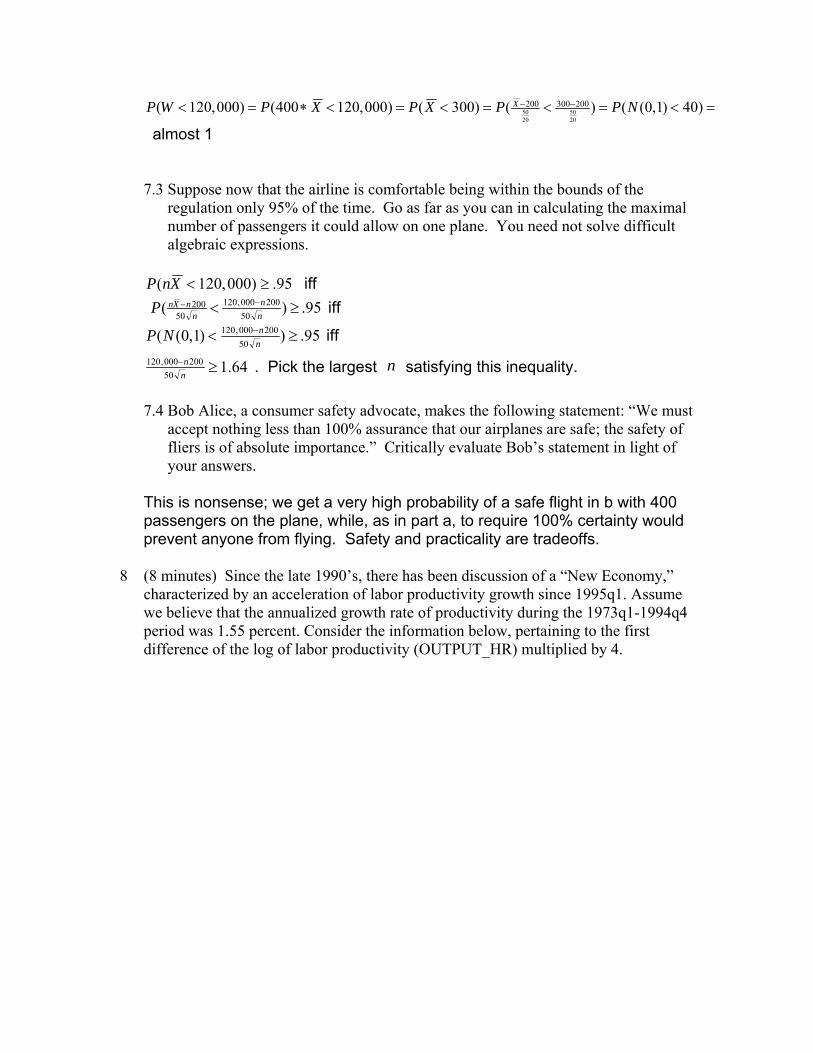
=<=<=<=<∗=< −− )40)1,0(()()300()000,120400()000,120(2050
2050
200300200 NPPXPXPWP X
almost 1
7.3 Suppose now that the airline is comfortable being within the bounds of the
regulation only 95% of the time. Go as far as you can in calculating the maximal number of passengers it could allow on one plane. You need not solve difficult algebraic expressions.
95.)000,120( ≥<XnP iff
95.)(50
200000,12050
200 ≥< −−nn
nnXnP iff
95.))1,0((50
200000,120 ≥< −nnNP iff
64.150
200000,120 ≥−nn . Pick the largest n satisfying this inequality.
7.4 Bob Alice, a consumer safety advocate, makes the following statement: “We must
accept nothing less than 100% assurance that our airplanes are safe; the safety of fliers is of absolute importance.” Critically evaluate Bob’s statement in light of your answers.
This is nonsense; we get a very high probability of a safe flight in b with 400 passengers on the plane, while, as in part a, to require 100% certainty would prevent anyone from flying. Safety and practicality are tradeoffs.
8 (8 minutes) Since the late 1990’s, there has been discussion of a “New Economy,”
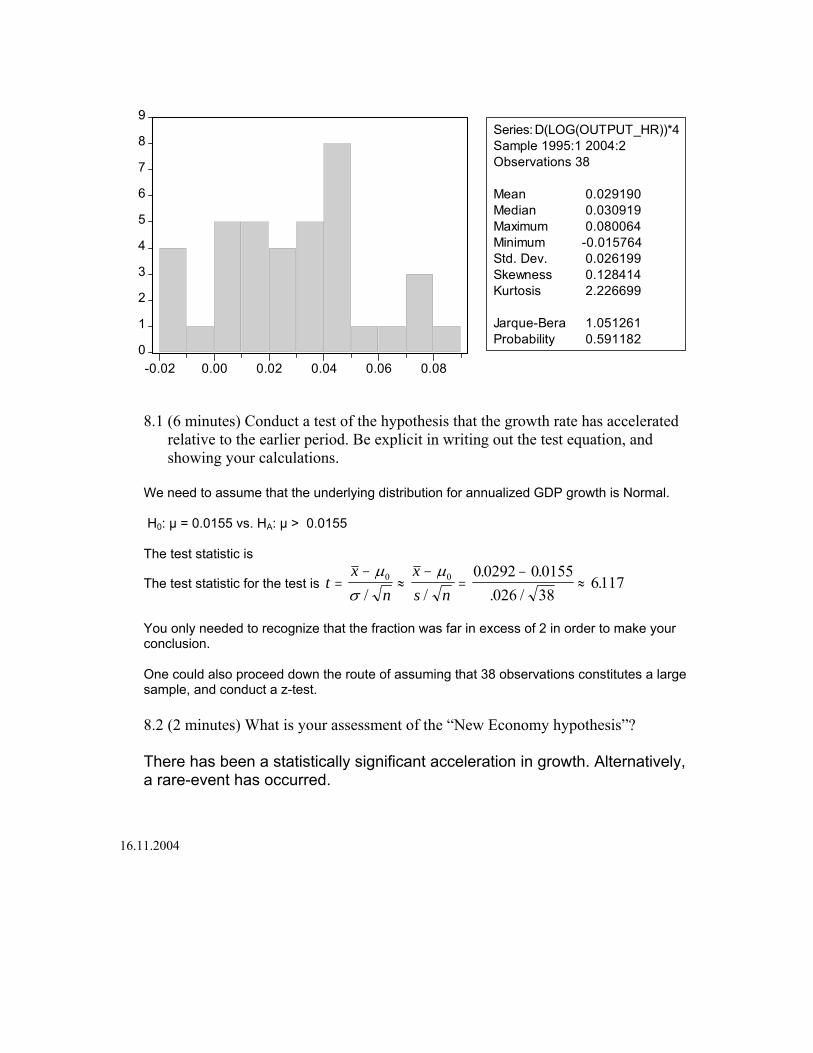
characterized by an acceleration of labor productivity growth since 1995q1. Assume we believe that the annualized growth rate of productivity during the 1973q1-1994q4 period was 1.55 percent. Consider the information below, pertaining to the first difference of the log of labor productivity (OUTPUT_HR) multiplied by 4.
0
1
2
3
4
5
6
7
8
9
-0.02 0.00 0.02 0.04 0.06 0.08
Series: D(LOG(OUTPUT_HR))*4Sample 1995:1 2004:2Observations 38
Mean 0.029190Median 0.030919Maximum 0.080064Minimum -0.015764Std. Dev. 0.026199Skewness 0.128414Kurtosis 2.226699
Jarque-Bera 1.051261Probability 0.591182
8.1 (6 minutes) Conduct a test of the hypothesis that the growth rate has accelerated relative to the earlier period. Be explicit in writing out the test equation, and showing your calculations.
We need to assume that the underlying distribution for annualized GDP growth is Normal. H0: µ = 0.0155 vs. HA: µ > 0.0155 The test statistic is
The test statistic for the test is tx
nxs n
=−
≈−
=−
≈µ
σµ0 0 0 0292 0 0155
026 386117
/ /. .
. /.
You only needed to recognize that the fraction was far in excess of 2 in order to make your conclusion. One could also proceed down the route of assuming that 38 observations constitutes a large sample, and conduct a z-test.
8.2 (2 minutes) What is your assessment of the “New Economy hypothesis”? There has been a statistically significant acceleration in growth. Alternatively, a rare-event has occurred.
16.11.2004