middle school mathematics · mathematics assessment program middle school mathematics time allowed...
TRANSCRIPT

Mathematics Assessment Program
Middle School Mathematics
Time Allowed Section A - 40 minutes; Section B - 40 minutes
These tasks give you a chance to show what you know and how you reason, and to solve mathematical problems. Please show your work and reasoning in the spaces provided. Explain any assumptions you make. Try as many tasks as you can in the time given. If you get stuck on a task, move on to the next task.
Name: _______________________________________ Male Female School: _______________________________ City: _____________ Teacher: ______________________________ Grade: _____________ Date: _______________________________
Do not write in the box below:
MS-3 Short Tasks Bike Ride Linear
Graphs Scatter Diagram
A Million Dollars
Sports Bag
Tuck Shop Total
These tests were developed with support from the Bill and Melinda Gates Foundation
MS - 3

Copyright © 2012 by Mathematics Assessment 1 Test MS--3 Resource Service. All rights reserved
Section A - 40 minutes

Copyright © 2012 by Mathematics Assessment 2 Test MS--3 Resource Service. All rights reserved
Short Tasks 1. The spin on a washing machine takes out 35% of the water in the clothes. The clothes in the washing machine contain 3 pints of water. How much water is left after a spin? ____________________ 2. Draw a circle around the fraction which is nearer to 1.
5_ 6_ 6 or 5
____________________
3. One of the numbers below has the same value as 3.5 x 10⁻³. Write true under the correct number. 35 x 10-4 3.5 x 10³ 0.00035 3500 _________ __________ _________ _________ 4. After being dropped a certain ball always bounces back to 2/5 of the height of its previous bounce. After the first bounce it reaches a height of 125 inches. How high (in inches) will it reach after its fourth bounce
____________________ 5. A picture is copied onto a sheet of paper 8.5 inches by 10 inches. A 1.5 inch margin is left all around. What area in square inches does the picture cover? _____________________
Copyright © 2012 by Mathematics Assessment 3 Test MS--3 Resource Service. All rights reserved
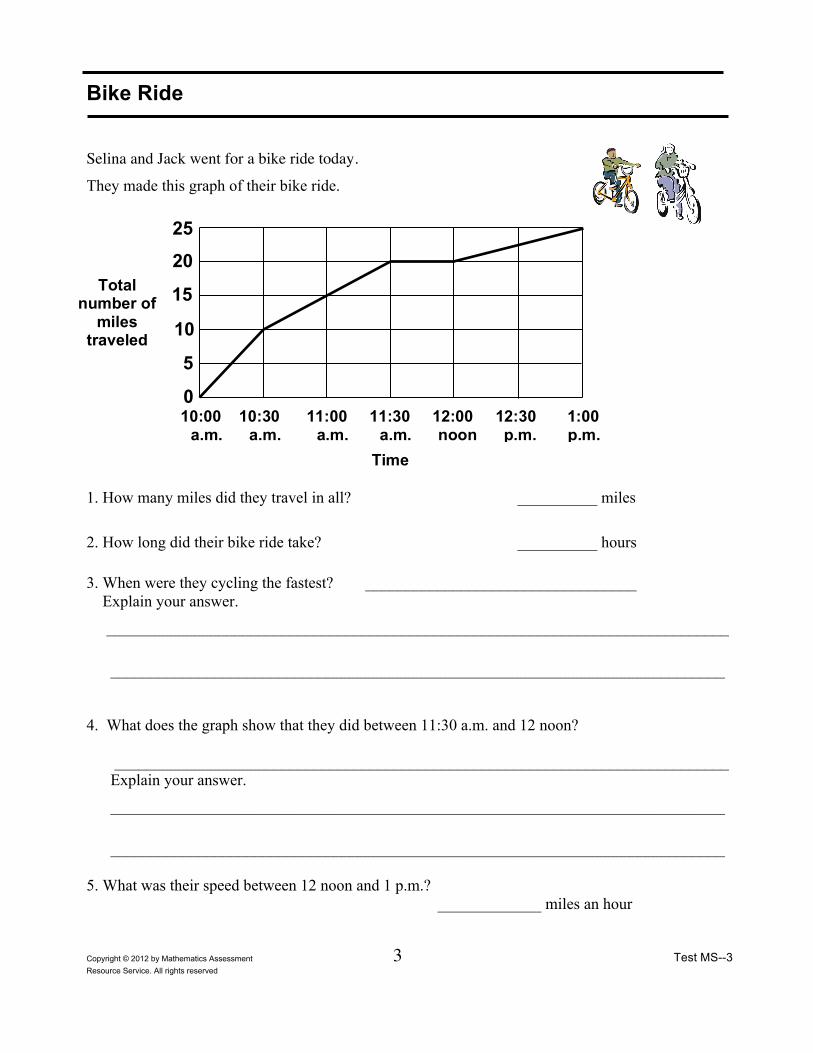
Bike Ride Selina and Jack went for a bike ride today.
They made this graph of their bike ride. 1. How many miles did they travel in all? __________ miles
2. How long did their bike ride take? __________ hours 3. When were they cycling the fastest? __________________________________ Explain your answer.
______________________________________________________________________________
_____________________________________________________________________________ 4. What does the graph show that they did between 11:30 a.m. and 12 noon? _____________________________________________________________________________
Explain your answer.
_____________________________________________________________________________
_____________________________________________________________________________ 5. What was their speed between 12 noon and 1 p.m.? _____________ miles an hour
25
20
15
10
5
0 10:00 10:30 11:00 11:30 12:00 12:30 1:00 a.m. a.m. a.m. a.m. noon p.m. p.m. p.m. Time
Total number of
miles traveled

Copyright © 2012 by Mathematics Assessment 4 Test MS--3 Resource Service. All rights reserved
Linear Graphs
Here are the equations of some linear graphs.
€
y = 3y = 2x+ 62y+ x= 0
y =13x
2y− x= 6
1. Four of the graphs are drawn below. a. Write the correct equation on each graph. b. Draw the graph of the left-over equation on the diagram opposite.

Copyright © 2012 by Mathematics Assessment 5 Test MS--3 Resource Service. All rights reserved
2. a.. Which equation could represent the speed of someone walking steadily? _____________________________ b. Which equation could represent the conversion between two different currencies?
________________________________

Copyright © 2012 by Mathematics Assessment 6 Test MS--3 Resource Service. All rights reserved
Scatter Diagram A group of 66 students took two tests; Test A and Test B. In the scatter diagram, each square represents one student, and shows the scores that student got in the two tests. 1. The mean score for Test A was 19 and the mean score for Test B was 16.
Plot a point to show this on the scatter diagram.
2. Draw a line of best fit on the scatter diagram.
How can a line of best fit be used? ____________________________________________________________________________
____________________________________________________________________________
Scores in Test A and Test B
0
5
10
15
20
25
30
35
0 5 10 15 20 25 30 35 Score in Test A
Scor
e in
Tes
t B

Copyright © 2012 by Mathematics Assessment 7 Test MS--3 Resource Service. All rights reserved
3. Here are five statements about the scores shown on the scatter diagram.
If a statement is true check (√) it. If it is not true, write a correct statement.
Statement Check (√) or write a correct statement
The scatter diagram shows positive correlation between the scores on Test A and the scores on Test B.
The lowest score on Test A is lower than the lowest score for Test B.
The range of scores on Test B is 25.
The student with the highest score on Test A also has the highest score on Test B.
The biggest difference between a student’s scores on the two tests is 5.

Copyright © 2012 by Mathematics Assessment 8 Test MS--3 Resource Service. All rights reserved
A Million Dollars In all these tasks you should show your calculations and give your answers to the nearest whole number. 1. How many $3.50 burgers can you buy for a million, 106, dollars? ________________ 2. How many years does it take to earn 106 dollars if you are paid $30 an hour and work 35 hours a week for 50 weeks a year? ______________________ 3. A dollar bill weighs one gram. How many pounds do 106 dollar bills weigh? (103 grams is 1 kilogram and 1 kilogram is 2.205 pounds.) _____________________ 4. A dollar bill is 0.0043 inches thick. How many yards high is a pile of 106 dollar bills? ______________________

Copyright © 2012 by Mathematics Assessment 9 Test MS--3 Resource Service. All rights reserved
Section B - 40 minutes
Copyright © 2012 by Mathematics Assessment 10 Test MS--3 Resource Service. All rights reserved
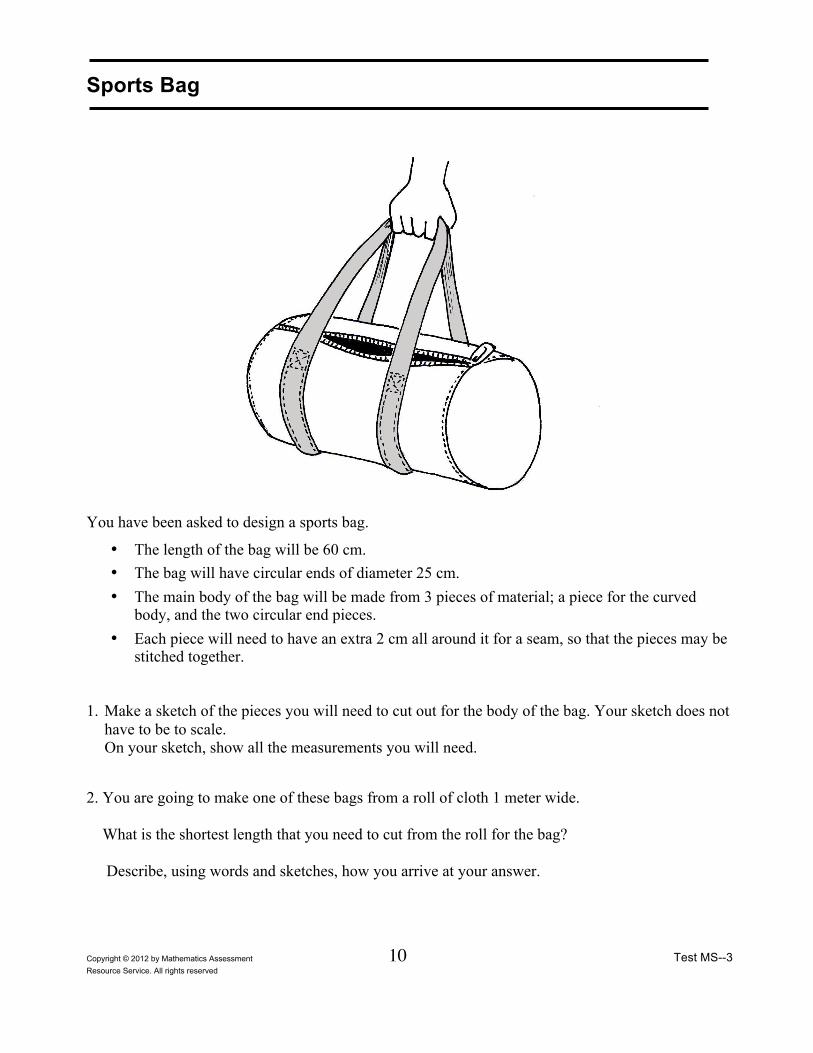
Sports Bag
You have been asked to design a sports bag.
• The length of the bag will be 60 cm. • The bag will have circular ends of diameter 25 cm. • The main body of the bag will be made from 3 pieces of material; a piece for the curved
body, and the two circular end pieces. • Each piece will need to have an extra 2 cm all around it for a seam, so that the pieces may be
stitched together.
1. Make a sketch of the pieces you will need to cut out for the body of the bag. Your sketch does not have to be to scale. On your sketch, show all the measurements you will need.
2. You are going to make one of these bags from a roll of cloth 1 meter wide. What is the shortest length that you need to cut from the roll for the bag? Describe, using words and sketches, how you arrive at your answer.

Copyright © 2012 by Mathematics Assessment 11 Test MS--3 Resource Service. All rights reserved
Sports Bag continued

Copyright © 2012 by Mathematics Assessment 12 Test MS--3 Resource Service. All rights reserved
Candy Bars A group of friends are planning to sell candy bars at the school shop. They conduct a small survey among 30 people, asking the question:
How many candy bars do you eat in a typical week ? Here are their results:
Male1 bar
Female4 bars
Male5 bars
Female1 bar
Male2 bars
Male25 bars
Male13 bars
Female0 bars
Male2 bars
Male9 bars
Male6 bars
Female16 bars
Female14 bars
Male10 bars
Male19 bars
Male11 bars
Female1 bar
Male0 bars
Male1 bar
Male3 bars
Female10 bars
Male25 bars
Female16 bars
Male13 bars
Female30 bars
Male8 bars
Male2 bars
Male0 bars
Male28 bars
Female0 bars
1. Draw graphs or charts to compare the results for males and females.
Copyright © 2012 by Mathematics Assessment 13 Test MS--3 Resource Service. All rights reserved
Candy Bars continued
2. Chris says:
“ We have found that the total number of candy bars eaten by all the males is 183, and the total number eaten by all the females is 92. In general, this means that men eat more candy bars than women.”
(a) Give two reasons why Chris is wrong in his reasoning.
_______________________________________________________________________________
_______________________________________________________________________________
_______________________________________________________________________________
_______________________________________________________________________________
_______________________________________________________________________________
_______________________________________________________________________________
(b) Write one conclusion (comparing males and females) that is supported by the data. Show any work you do.
_______________________________________________________________________________
_______________________________________________________________________________
_______________________________________________________________________________
_______________________________________________________________________________
_______________________________________________________________________________