middle grade indicators of readiness in chicago public schools
TRANSCRIPT

RESEARCH REPORT NOVEMBER 2014
Elaine M. Allensworth, Julia A. Gwynne, Paul Moore, and Marisa de la Torre
Looking Forward to High School and College
Middle Grade Indicators of Readiness in Chicago Public Schools
This report was produced by UChicago CCSR’s publications and communications staff: Emily Krone, Director for Outreach and Communication; Bronwyn McDaniel, Senior Manager for Outreach and Communications; and Jessica Puller, Communications Specialist.
Graphic Design: Jeff Hall Design Photography: David SchalliolEditing: Ann Lindner
11.2014/pdf/[email protected]
ACKNOWLEDGEMENTS
The authors would like to acknowledge the many people who contributed to this work. We thank Robert Balfanz and Julian Betts for providing us with very thoughtful review and feedback which were used to revise this report. We also thank Mary Ann Pitcher and Sarah Duncan, at the Network for College Success, and members of our Steering Committee, especially Karen Lewis, for their valuable feedback. Our colleagues at UChicago CCSR and UChicago UEI, including Shayne Evans, David Johnson, Thomas Kelley-Kemple, and Jenny Nagaoka, were instrumental in helping us think about the ways in which this research would be most useful to practitioners and policy makers. We were fortunate to receive substantial feedback and assistance from the UChicago CCSR communications staff, Bronwyn McDaniel, Jessica Puller, and Emily Krone. We thank the Chicago Public Schools for providing us the data that allowed us to do this work. All work at UChicago CCSR is also supported by operating grants from the Spencer Foundation and the Lewis-Sebring Family Foundation. This study was made possible by a grant from the Bill and Melinda Gates Foundation, to which we are very grateful.
1 Executive Summary
7 Introduction
Chapter 1
17 Issues in Developing and Evaluating Indicators
Chapter 2
23 Changes in Academic Performance from Eighth to Ninth Grade
Chapter 3
29 Middle Grade Indicators of High School Course Performance
Chapter 4
47 Who Is at Risk of Being Off-Track at the End of Ninth Grade?
Chapter 5
55 Who Is at Risk of Earning Less Than As or Bs in High School?
Chapter 6
63 Indicators of Whether Students Will Meet Test Benchmarks
Chapter 7
75 Who Is at Risk of Not Reaching the PLAN and ACT Benchmarks?
Chapter 8
81 How Grades, Attendance, and Test Scores Change
Chapter 9
93 Interpretive Summary
99 References
104 Appendices A-E
TABLE OF CONTENTS
Executive Summary
1
MIDDLE GRADE INDICATORS OF READINESS
Executive Summary Across the country, policymakers are raising the expectations for educational attainment. With changes to the economy resulting in dire economic prospects for high school dropouts, high school graduation has become a necessity. In fact, high school graduation is no longer considered sufficient; policymakers are calling on the nation’s schools to graduate all students ready for college and careers.
Much of the pressure to improve educational attain-
ment is on high schools, but focus has also turned to
earlier grades. There is a very large population of
students who struggle with the transition from the
middle grades to high school, raising concerns that
high school failures are partially a function of poor
middle grade preparation. As a result, middle grade
practitioners are grappling with questions about what
skills students need to succeed in high school, which
markers they should use to gauge whether students are
ready to succeed in high school and beyond, and wheth-
er it is possible to identify in middle grades students
who are likely to struggle in high school and college.
This report is designed to provide a detailed picture
of the relationship between students’ performance in
the middle grades (grades five through eight) and their
subsequent performance in high school and college
among students in the Chicago Public Schools (CPS).
Specifically, the report shows:
• Which of many potential middle grade indicators—
including attendance rates, grades in specific classes
and GPAs, test scores, study habits, grit, discipline
records, and background characteristics—are most
predictive of high school success. It also shows the
degree to which high school readiness is a function
of the high school students choose or the middle
school they attended. With all of the conflicting
messages that policymakers and practitioners hear
about what matters for academic success, these
findings are intended to clarify which factors are
most strongly related to students’ educational
attainment.
• Which students are likely to be successful in high
school—passing their classes, earning high grades
that put them on-track for college enrollment and
graduation, and achieving test scores at ACT’s
benchmarks—and which students are at risk of
failing to meet those standards. These findings are
intended to help schools develop intervention plans
and practices around specific students to help them
reach particular outcomes. They can also provide a
guide for parents about what level of performance
their child needs to be likely to graduate from high
school and be ready for college.
• The degree to which student performance changes
during the middle grades—showing why students
leave the middle grades with different levels of
readiness. For example, do students need to start
the middle grades with high performance to leave
middle school with high levels of readiness? Or does
students’ performance change considerably while
they are in the middle grades? These findings are
intended to help practitioners and policymakers set
realistic goals for improvement.
UCHICAGO CCSR Research Report | Middle Grade Indicators of Readiness in Chicago Public Schools
2
KEY FINDINGS:
Middle Grade Information Can Be Used to Create Simple Indicator Systems of High School Graduation and College ReadinessMany characteristics of students are associated
with their academic outcomes, from background
characteristics to test scores, grades, attendance,
and discipline records, to noncognitive factors. With
so many factors associated with later outcomes, it may
seem like practitioners would need complicated models
to gauge students’ likelihood of success in later years.
However, after taking into account just two or three
key middle school indicators, other information about
students only marginally improves the prediction of
later outcomes.
Grades and failures are best predicted by earlier
grades and attendance. High school test scores
are strongly predicted by earlier test scores.
Other information about students provides only
negligible improvement in the prediction of their
outcomes, beyond the top predictors. Background
characteristics, study habits, and grit are not predictive
of high school performance, once students’ middle
grade GPAs, attendance, and test scores are taken into
account. Background characteristics (e.g., race, gender,
neighborhood poverty, free lunch eligibility, being
old-for-grade, and special education status) are all
related to high school grades and test scores, but they
do not tell us any more about who will pass, get good
grades, or score well on tests in high school, once
we take into account students’ eighth-grade GPAs,
attendance, and test scores. Students’ misconduct
and suspension records in middle school are also not
predictive of high school performance, once we take
into account their attendance, grades, and test scores.
Likewise, students’ reports of their study habits
in eighth grade, and their responses on a grit scale
measuring perseverance in the middle grades, are
not predictive of their performance in high school
beyond their current grades and attendance.1
GPAs from different middle schools are not equiva-
lent, but the differences are generally less than a half
of a GPA point. We often hear that grades are subjec-
tive—that an A average from one school is not equal to
an A average from another school. This suggests that
students with the same academic records are more likely
to succeed if they came from one school than another. In
fact, students with the same grades, attendance, and test
score records upon leaving eighth grade are more likely
to succeed in high school if they came from some middle
schools than from others, net of the effects of which high
schools students attend (see Chapter 3). At the same
time, the differences in success among students with the
same grades from different middle schools are small,
compared to the differences in success among students
with different grades at the same school. As discussed
in Chapter 3, an A average from one school represents a
better likelihood of success than a B average from any
other school. Differences by schools are as much as half
a GPA point, at the most.
While it is common for people to believe that grades
have different meanings across schools, it also appears
that test scores also have different meanings across
schools. Students with the same middle grade test scores
are more likely to score well on the high school tests if
they came from particular middle schools than others
(see Chapter 6). People tend to see test scores as objec-
tive, since everyone takes the same test, but students
can be prepared to do well on the middle grade tests in
ways that do not necessarily translate into higher per-
formance later on.
Test scores are much weaker indicators of high school
grades than middle school grades and attendance.
Many high school interventions are based on test score
proficiency—meeting standards on tests, or reading
at grade level. This is the reasoning behind programs
that offer support based on test scores, such as double-
dose coursing or grade promotion standards in middle
school that delay students’ entry into ninth grade based
on test scores. However, while middle grade test scores
are moderately related to passing classes and getting
high grades in high school, most of the relationship
between test scores and later performance seems to
work through students’ grades. That is, students with
Executive Summary
3
strong test scores are more likely to get good grades
than students with weak test scores, but it is the grades
that matter for later outcomes. Grades are based on a
number of factors in addition to tested skills, including
attendance, assignment completion, and quality of work
over the course of an entire semester. Once we account
for students’ GPAs and attendance in the middle grades,
their test scores do not provide much additional infor-
mation about their likelihood of passing their classes
in high school, and they only improve the prediction of
getting high grades (As and Bs) in high school among
students who also have high grades in middle school.2
High test scores also do not inoculate students
against poor course performance in high school. Only
about a third of students with high test scores in eighth
grade (meeting 2013 ISAT standards in reading and
math) receive at least a B average in high school, and
one-fifth have D averages or lower (see Chapter 5).
Whether students are “ready” for high school depends
not only on their academic performance in the middle
grades but also on the context that they enter into in
ninth grade. Students with the same academic records
in middle school also have different high school outcomes
depending on which high school they attend. Students are
more likely to pass their ninth-grade classes, and to make
larger test score gains, if they attend some high schools
rather than others (see Chapter 3). Especially for stu-
dents with moderate GPAs (between a 1.0 and 3.0), their
probability of being on-track at the end of ninth grade is
strongly influenced by which high school they attend.
Middle Grade Indicators Can Identify Some Students at High Risk, but High School Warning Systems Are Still CriticalWhen thinking about how to address problems with
high school dropout and college readiness, there are
often calls for early intervention (before students get to
high school). Some students can be identified as at high
risk of poor high school outcomes when they are in the
middle grades; early intervention might help them get
on a path to high school and college readiness. Many
other students, however, do not show signs of poor
performance until they get to high school. The change
in context across the transition to high school brings
new challenges to many students who appear to be
doing fine, academically, during the middle grades.
Middle grade attendance and grades can be used to
identify a set of students who are at very high risk
of failing classes and being off-track in high school,
and many of these students can be identified by at
least as early as sixth grade. Students with a very high
risk of failure in high school are chronically absent
in the middle grades or are already receiving Fs in
their classes in the middle grades (see Chapter 4).
The middle grade indicators of very high likelihood
of failure in Chicago are almost identical to middle
grade indicators that were found to be very predictive
of high school dropout in Philadelphia.3 Many of the
students who are at high risk of ninth-grade failure can
be identified by at least as early as sixth grade, although
some fall into this group as their attendance declines
through the middle grade years. Without a dramatic
change in their educational experience, these students
have very little chance of graduating from high school;
they and their future teachers are set up for failure.
While some students can be identified as at high
risk of failing in high school, many other students
who fail their ninth-grade classes in Chicago do
not show signs of being in academic trouble in the
middle grade years. The majority of students who
fail their ninth-grade courses, and are off-track for
graduation in Chicago, cannot be identified precisely
in middle school (see Chapter 4). While there are
calls for early identification of dropouts in middle
school, the change in context over the transition to
high school makes it difficult to predict exactly who
will fail in ninth grade, beyond the students with
very high risk. Once students start to show signs of
1 See Chapter 3, as well as Appendix E, for models that predict high school grades, pass rates, and on-track status with middle grade variables. See Chapter 6, as well as Appendix E, for models
that predict high school test scores with middle grade variables.2 See Chapter 3 and Appendix E for these comparisons.3 Neild and Balfanz (2006).
UCHICAGO CCSR Research Report | Middle Grade Indicators of Readiness in Chicago Public Schools
4
struggle in ninth grade, with absence from classes or
low grades, they become at high risk of not graduating.
Students often leave the middle grades looking like
they are prepared to do very well in high school,
but their grades and attendance drop dramatically
in ninth grade. Students without exceptionally high
performance in middle school are unlikely to get high
grades in high school, and even having a very strong
record in middle school does not ensure a student of
high grades in high school (see Chapter 2). In fact, 40
percent of students who left eighth grade with As or Bs in
their classes and ISAT test scores of 310 (exceeding stan-
dards) in math earned a C or lower in their ninth-grade
math class. Students who enter high school with strong
records but no longer perform well in high school are
another group of students ripe for intervention—inter-
vention to make sure they reach their college potential.
Students need at least a 3.0 GPA in the middle grades
to be college-bound; a 3.5 GPA gives them at least
a 50 percent chance. Prior research on high school
predictors of college graduation shows that, by far,
the most important predictor of college graduation is
students’ high school GPA. Only students who graduate
from high school with at least a B average have a moder-
ate chance of earning a college degree. Parallel to this
finding about college, only those students who leave
eighth grade with GPAs of at least 3.0 have a moderate
chance of earning a 3.0 GPA in high school. Students
who plan to go to college need to get the message that
college requires very strong levels of effort and engage-
ment in both the middle grades and in high school.
Attendance Shows More Variation in Growth Over the Middle Grades Than Grades; Test Performance Is Fairly Constant Over Time Some students show declining attendance and grades
over the middle grades; others show improving atten-
dance and grades. On average, GPAs and attendance
rates are similar in fifth grade through eighth grade in
Chicago. Attendance shows the more variability across
students over time than either grades or test scores. In
particular, some students’ attendance declines con-
siderably in the middle grade years, especially among
students who started out with low attendance in fifth
grade. GPAs improve or fall for some students by as
much as a half of a GPA point as they move from fifth to
eighth grade.
All students show growth in test scores over time
on the vertically scaled state tests (the ISAT), but
their relative performance (e.g., percentile rank) stays
about the same, with very little variation in the amount
that they grow over time—especially in reading (see
Chapter 8). There is a push for students to end eighth
grade in the “exceeds” range on state standards; this
point corresponds closely with the college benchmark
scores on the high school tests. However, students with
average scores in fifth grade would need to improve
their test growth by a rate that is well above the highest
growth currently observed for these students to meet
the “exceeds” range at the end of eighth grade, except by
random chance.
About half of the changes over time in students’
grades, attendance, and test scores can be attributed
to which school they attend during the middle grades.
At some schools, it is typical for students’ grades to im-
prove by about a tenth of a GPA point each year; at other
schools, grades tend to decline by a tenth of a GPA point.
Thus, students’ GPA might end up as much as 0.6 points
different by the eighth grade, based on which school they
attend for the middle grade years. At some schools, atten-
dance tends to decrease by about one percentage point
each year; at others attendance tends to improve by a
percentage point a year. At some schools, students’ math
ISAT scores grow by 15 points a year, and at others they
grow at 11 points a year; reading scores grow by 11 points
a year at some schools, and nine points a year at others.
Strategies aimed at attendance improvement could
likely have as much or more of a pay-off for high
school and college graduation as efforts aimed at
improving test scores. While there is considerable
local and national focus on improving test scores as
a mechanism for improving educational attainment,
attendance is often seen as a low-level goal. Yet, middle
school attendance is much more predictive of passing
high school classes than test scores and is as predictive
of high grades in high school as test scores. High school

Executive Summary
5
outcomes are also higher for students who improve
their attendance during the middle grades than for
students who improve their test scores. Students who
end their middle grade years with strong attendance
are much more likely to do well in their high school
courses than students with weak attendance, regardless
of what their attendance or test scores were in
fifth grade (see Chapter 8).
Attendance is also the critical factor underlying
large declines in student performance in the transition
to high school. Students’ unexcused absences quadruple
in one year, on average, when they go from eighth to
ninth grade (see Chapter 2). Their study habits also
decline. As a result of missing more class time and put-
ting in less effort, students’ grades drop by a half of a
GPA point, on average. For some students, the drop in
attendance leads to high rates of course failure, putting
them off-track for graduation. For others, it takes them
from being B students to C students, putting them
off-track for college readiness. Declining attendance
occurs among students with high test scores, as well
as among students with low test scores. It is the most
critical factor undermining students’ educational at-
tainment. This does not mean that schools should focus
on attendance instead of on challenging instruction;
attendance is the building block that needs to be strong
to enable higher-level engagement in school and the
development of strong academic skills.
Monitoring high-leverage indicators is not a sub-
stitute for improving instruction or creating engaging
environments. But by monitoring those indicators
that are most strongly associated with later outcomes,
school practitioners can make sure that students get the
right levels and kinds of support to keep them on-track
for high school graduation and college readiness. They
can focus attention on indicators that matter the most
for later outcomes and they can establish realistic goals
for student and school improvement.

6
Introduction | Research on Indicators of High School and College Readiness
7
Research on Indicators of High School and College Readiness The expectations for schools have changed over the past 20 years. It is no longer acceptable to graduate only the most motivated students and to prepare only the most academically talented ones for college. Schools are expected to graduate all of their students and to put them on a track for college readiness.
INTRODUCTION
The labor market is grim for students without high
school diplomas,4 and the vast majority of students
now aim to attain a four-year college degree.5 The
pressure is on high schools to improve their graduation
and college-readiness rates. Educators at the secondary
level, however, often contend that students enter high
school without the skills they need to be on-track for
graduation and college readiness.
While it may seem obvious that students need to
enter high school ready to succeed, it is not clear what
it means to be ready. There is little research that ties
middle grade records to high school outcomes, or that
shows how they are related. There is even less work
that ties middle school records to college readiness.
Such information is needed by middle grade practitio-
ners so that they can gauge students’ readiness for
This chapter describes the organization of the study and discusses the prior research on middle school indicators of high school performance and high school indicators of college performance.
later success, set goals for improvement, and provide
support for students who are likely to fail. Middle grade
practitioners can use indicators of readiness to assess
their own success at preparing students for high school
and to focus their efforts on those skills and behaviors
4 Sum et al. (2009); Alliance for Excellent Education (2011); Day and Newburger (2002); Heckman and LaFontaine (2007).
5 National Center for Education Statistics (2007); Roderick et al. (2008).
The majority of schools serving middle grades in Chicago are elementary schools that serve grades K-8. Unlike districts that have a middle school struc-ture, most students do not go through a large school transition until the transition to high school. During the 2008-09 school year, 91 percent of the schools that served eighth-grade students were K-8 schools
(419 schools). About 4 percent of schools with eighth-graders served only the middle grades— some combination of grades four through eight (20 schools), about 3 percent served middle and high school grades—starting at grade six or seven through 12 (14 schools), and the remainder were schools with other grade configurations.
School Grade Structures in Chicago: Mostly K-8 Schools
UCHICAGO CCSR Research Report | Middle Grade Indicators of Readiness in Chicago Public Schools
8
most crucial for later success. High schools could use
better indicators of students’ readiness to program
students into appropriate classes and target supports
as they begin high school.
This report provides the answers to four basic
questions about risk and readiness in the middle grade
years of fifth through eighth grade. It shows which
metrics matter and how schools might use them to
identify students for support.
1 Which middle grade metrics predict ninth-grade failure?
Based on those metrics, which middle grade
students are at risk of failing their ninth-grade
classes, and which are likely to pass their classes
when they get to high school?
2 Which middle grade metrics predict earning high
grades (3.0 or higher) in high school?
Based on those metrics, which middle grade students
have little chance of earning high grades in high
school and which students are likely to do so?
3 Which middle school metrics predict reaching ACT’s
college-readiness benchmarks?
Based on those metrics, which middle grade students are at
risk of missing the benchmarks when they get to high school
and which students are likely to meet them?
4 How does students’ performance on key indicators
change during the middle grades, and what are the
implications for high school success?
In this chapter, we describe the prior research that
set the stage for the study and how this report provides
new information. Each of the subsequent chapters
provides specific pieces of information on middle grade
indicators. Some readers may be more interested in
particular chapters than others. We offer the following
as a guide to the content of the report, which can point
readers to the information of most interest to them:
Chapter 1: Issues in Developing and Evaluating
Indicators. This chapter addresses some of the issues to
consider when deciding which measures of performance
to focus on in early warning indicator systems, how
many to use, and the implications of using different
cut-offs for identifying risk.
Chapter 2: Changes in Academic Performance
from Eighth to Ninth Grade. This chapter provides a
picture of how Chicago students’ academic performance
changes from eighth to ninth grade and provides con-
text for understanding the indicator predictions shown
in later chapters.
Chapter 3: Middle Grade Indicators of High School
Course Performance. This chapter evaluates potential
indicators of high school grades, showing how well
students’ personal characteristics and their academic
performance in the middle grades predict their grades
in ninth and eleventh grade. It also evaluates which
combinations of indicators provide the best predictions.
Chapter 4: Who Is at Risk of Being Off-Track at the
End of Ninth Grade? This chapter shows students’ risk
of failing, based on their middle grade records. This
information could be used by school practitioners to
identify students who are at high risk of failure and can
be used to discuss goals for student performance with
students and their families.
Chapter 5: Who Is at Risk of Earning Less Than As
or Bs in High School? This chapter shows students’
likelihood of earning high grades in high school—grades
that will make them eligible for college and likely to
succeed, once there. The information in this chapter
could be used to discuss goals for student performance
with students and their families.
Chapter 6: Indicators of Whether Students
Will Meet Test Benchmarks. This chapter evaluates
potential middle grade indicators of performance on
high school tests. It compares predictions of perfor-
mance on subject-specific tests and composite test
scores. It also examines the differences in predictions,
based on which middle or high school students attend.
Chapter 7: Who is at Risk of Not Reaching the
PLAN and ACT Benchmarks? This chapter shows the
levels of performance in the middle grades that give stu-
dents a chance of meeting PLAN and ACT benchmarks
in ninth and eleventh grades.
Chapter 8: How Grades, Attendance, and Test
Scores Change. This chapter addresses the degree to
which students show different amounts of growth and
decline in attendance, grades, and test scores over the
middle grade years.
Chapter 9: Interpretive Summary.
Introduction | Research on Indicators of High School and College Readiness
9
Prior Research Shows Passing Classes and Earning High Grades in High School Are Essential for High School and College Graduation, While Test Scores Matter for College Access There is often a perception that students’ performance
on tests is what matters for high school and college
graduation. While there are innumerable studies show-
ing significant relationships between test scores and
educational attainment, grades are more strongly and
consistently found to be related to educational attain-
ment than test scores.6 Furthermore, the relationship
of test scores to high school and college graduation
becomes small, once we take into account students’
GPAs.7 It is students’ grades that ultimately matter
more for high school and college graduation than their
test performance because grades capture more of the
factors relevant for student achievement than test
scores. This does not mean that test scores are irrel-
evant—it is easier for students with higher tested skills
to get good grades—but a focus on test scores as the
dominant factor affecting college readiness would be
misplaced. For this reason, this report focuses on more
than just test scores as indicators of preparation for
high school and college.
There is also a fairly widely held perception that
students’ background factors are more deterministic
of whether they graduate than their grades. However,
while background factors (e.g., race, gender, and
economic status) are related to high school gradua-
tion, once we take into account students’ course grades,
background factors and test scores do little to further
predict students’ future educational attainment.8
Passing classes is essential to graduate high school.
To obtain a diploma, students need to accumulate cred-
its. That means they need to pass their classes. For most
dropouts, the pattern of course failures begins in the
ninth grade; failures then accumulate in later grades,
until they are so far behind that they cannot catch up.
As a result, a simple indicator of whether students are
on-track or not in ninth grade, based on failures in the
ninth-grade year (see box above; The Ninth-Grade
On-Track Indicator), is very predictive of eventual grad-
uation, and accounts for almost all of the differences
in graduation rates by students’ race, gender, economic
status, and other background characteristics, including
test scores.9 Each semester course that a student fails
in ninth grade lowers the probability of graduating by
15 percentage points.10 For this reason, passing ninth-
grade courses is one of the key outcomes examined in
this report.
High grades in high school are essential for college
graduation. While passing courses is critical for gradu-
ating from high school, it is not enough to be ready for
college. Students who are likely to succeed in college
The ninth-grade on-track indicator simply shows whether students are making sufficient progress in ninth grade to be likely to graduate. A student is on-track if she ends ninth grade with at least five full-year credits and no more than one semester F in a core course (English, math, science, or social science). Ninth-grade on-track is highly predictive of eventual
graduation (80 percent correct prediction).A It is more predictive of graduation than any other middle or high school predictor, other than the combinations of predictors that include twelfth-grade performance (i.e., those that are measured during the year of graduation, rather than several years prior), based on comparisons of studies from across the country.B
The Ninth-Grade On-Track Indicator
6 Rumburger and Lim (2008); Allensworth and Easton (2007). 7 Geiser and Santelices (2007); Roderick et al. (2006);
Bowen, Chingos, and McPherson (2009); Allensworth (2013).
8 Allensworth and Easton (2007); Allensworth (2013).9 Allensworth and Easton (2007); Allensworth (2013).10 Allensworth and Easton (2007).
A Allensworth and Easton (2005, 2007). B Bowers, Sprott, and Taff (2013).
UCHICAGO CCSR Research Report | Middle Grade Indicators of Readiness in Chicago Public Schools
10
are not merely passing courses; they are working hard
and earning high grades. Research in Chicago, and
across the country, has found that students’ high school
grades are, by far, the most important predictor of
getting into college and eventually graduating—more
important than ACT or SAT scores or high school
coursework.11 A student who earns at least a B average
in high school has a 50/50 chance of getting a four-year
college degree (see Appendix A for more information).12
Therefore, we focus on students’ probability of earning
high grades as the leading indicator of college readi-
ness. Test scores also play a role in college graduation,
particularly in giving students access to more selective
colleges.13 College selection matters for graduation
because students with the same high school records are
more likely to graduate at some colleges than others.
High test scores help students get access to college.
When colleges make entrance decisions, they usu-
ally rely on both students’ grades and their scores on
college entrance exams (the ACT and SAT). For this
reason, higher scores on the college entrance exams
help students gain access to more selective colleges and
programs (see Appendix A for more information). High
test scores also can help students obtain scholarships. In
Chicago, all students take the ACT college entrance exam
in the spring of their junior year, as part of the state test-
ing system. They can use those scores for applications
to college. They also take ACT-aligned EPAS exams in
earlier years—the EXPLORE in the fall of their eighth-
and ninth-grade years and the PLAN in the fall of their
tenth-grade year. These tests include ACT college-readi-
ness benchmarks—scores that ACT has determined give
students a 50/50 chance of earning grades of B or better
when they get to college, if they continue to make normal
progress. Therefore, we also include scores on ACT’s
EPAS tests as outcomes in this study.
Prior Research Shows Links Between Students’ Middle Grade Performance and High School OutcomesThere are many studies that have shown relationships
between students’ middle grade performance and
later outcomes.14 However, researchers often identify
significant relationships between middle and high
school factors, without considering whether the
middle school indicators are actually good predictors
of later performance, for example, showing how many
students are correctly identified as likely to succeed/
fail in their classes or on their tests in high school.
A few studies have specifically tried to discern the
predictiveness of middle school indicators for high
school performance. These studies provide a good
starting point for considering the types of middle
grade indicators that should be examined as indicators
of high school readiness. They also allow us to compare
patterns in Chicago to other places, which gives us
a sense of whether the same indicators matter in
different places.
Chronic absence or failure in middle school indicates
high risk for eventual dropout. There is a growing body
of work, across multiple cities, that consistently shows
middle school attendance and course failures are strong
predictors of whether students eventually obtain a
high school diploma. Research on middle grade indica-
tors in Philadelphia, Baltimore, New York, and three
school districts in California (San Francisco, Fresno,
and Long Beach) all found that, among the measures
that were studied, course failures and low attendance in
the middle grades were the strongest predictors of high
school course failure or dropout.15 As shown in Chapter
3, this is similar to what we find in Chicago. Studies in
Philadelphia and Baltimore, which examined students’
sixth-grade records, also found that an out-of-school
suspension in sixth grade was highly predictive of not
graduating from high school. Most of the studies also
examined test scores and demographic characteristics—
showing that, while they were related to high school
graduation or on-track rates, they were less predictive
than attendance or grades.
There are also a number of studies that link stu-
dents’ test scores to later grades and high school
graduation and suggest that test scores can be used
as early indicators of high school performance. These
studies often fail to note the low predictive power of
test scores, however, and rarely include students’
grades and attendance in the models for comparison.
One example of this is a study by ACT, Inc., which
Introduction | Research on Indicators of High School and College Readiness
11
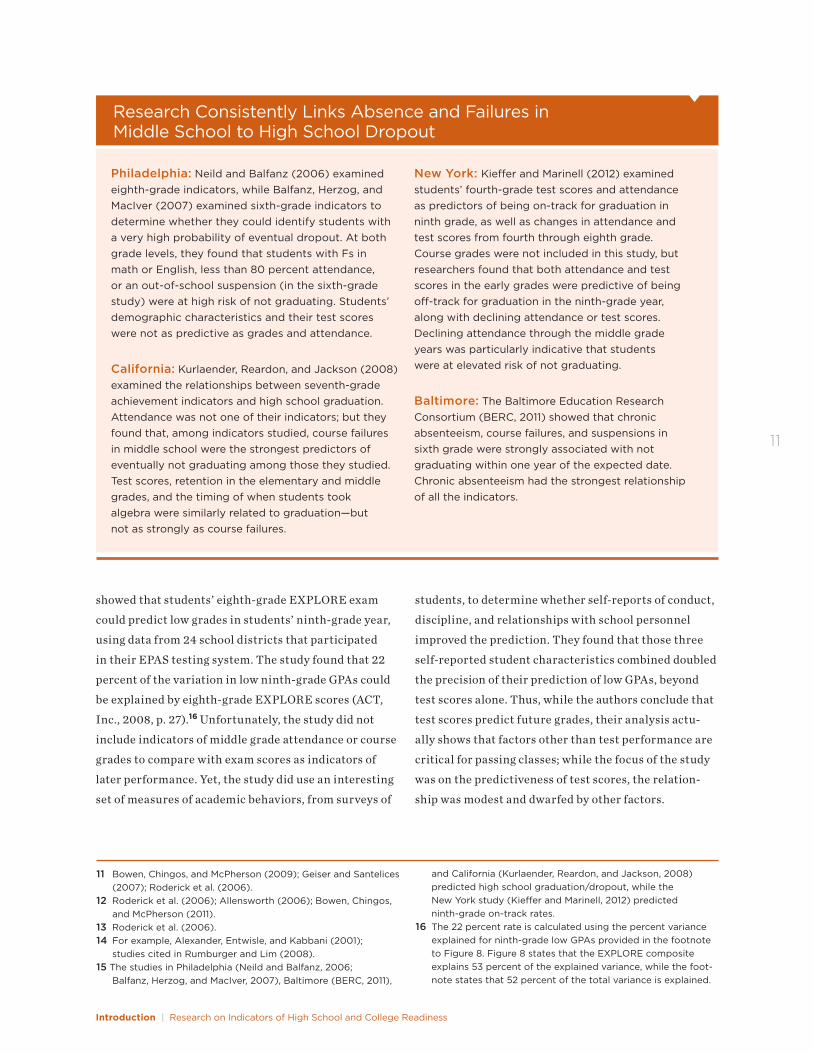
Philadelphia: Neild and Balfanz (2006) examined eighth-grade indicators, while Balfanz, Herzog, and MacIver (2007) examined sixth-grade indicators to determine whether they could identify students with a very high probability of eventual dropout. At both grade levels, they found that students with Fs in math or English, less than 80 percent attendance, or an out-of-school suspension (in the sixth-grade study) were at high risk of not graduating. Students’ demographic characteristics and their test scores were not as predictive as grades and attendance.
California: Kurlaender, Reardon, and Jackson (2008) examined the relationships between seventh-grade achievement indicators and high school graduation. Attendance was not one of their indicators; but they found that, among indicators studied, course failures in middle school were the strongest predictors of eventually not graduating among those they studied. Test scores, retention in the elementary and middle grades, and the timing of when students took algebra were similarly related to graduation—but not as strongly as course failures.
New York: Kieffer and Marinell (2012) examined students’ fourth-grade test scores and attendance as predictors of being on-track for graduation in ninth grade, as well as changes in attendance and test scores from fourth through eighth grade. Course grades were not included in this study, but researchers found that both attendance and test scores in the early grades were predictive of being off-track for graduation in the ninth-grade year, along with declining attendance or test scores. Declining attendance through the middle grade years was particularly indicative that students were at elevated risk of not graduating.
Baltimore: The Baltimore Education Research Consortium (BERC, 2011) showed that chronic absenteeism, course failures, and suspensions in sixth grade were strongly associated with not graduating within one year of the expected date. Chronic absenteeism had the strongest relationship of all the indicators.
Research Consistently Links Absence and Failures in Middle School to High School Dropout
showed that students’ eighth-grade EXPLORE exam
could predict low grades in students’ ninth-grade year,
using data from 24 school districts that participated
in their EPAS testing system. The study found that 22
percent of the variation in low ninth-grade GPAs could
be explained by eighth-grade EXPLORE scores (ACT,
Inc., 2008, p. 27).16 Unfortunately, the study did not
include indicators of middle grade attendance or course
grades to compare with exam scores as indicators of
later performance. Yet, the study did use an interesting
set of measures of academic behaviors, from surveys of
11 Bowen, Chingos, and McPherson (2009); Geiser and Santelices (2007); Roderick et al. (2006).
12 Roderick et al. (2006); Allensworth (2006); Bowen, Chingos, and McPherson (2011).
13 Roderick et al. (2006). 14 For example, Alexander, Entwisle, and Kabbani (2001);
studies cited in Rumburger and Lim (2008).15 The studies in Philadelphia (Neild and Balfanz, 2006;
Balfanz, Herzog, and MacIver, 2007), Baltimore (BERC, 2011),
and California (Kurlaender, Reardon, and Jackson, 2008) predicted high school graduation/dropout, while the New York study (Kieffer and Marinell, 2012) predicted ninth-grade on-track rates.
16 The 22 percent rate is calculated using the percent variance explained for ninth-grade low GPAs provided in the footnote to Figure 8. Figure 8 states that the EXPLORE composite explains 53 percent of the explained variance, while the foot-note states that 52 percent of the total variance is explained.
students, to determine whether self-reports of conduct,
discipline, and relationships with school personnel
improved the prediction. They found that those three
self-reported student characteristics combined doubled
the precision of their prediction of low GPAs, beyond
test scores alone. Thus, while the authors conclude that
test scores predict future grades, their analysis actu-
ally shows that factors other than test performance are
critical for passing classes; while the focus of the study
was on the predictiveness of test scores, the relation-
ship was modest and dwarfed by other factors.
UCHICAGO CCSR Research Report | Middle Grade Indicators of Readiness in Chicago Public Schools
12
Low test scores in the middle grades foretell low test
scores at the end of high school. While test scores
are not strongly predictive of students’ later grades,
students’ test scores in the middle grades are highly
predictive of their test scores at the end of high school.
In California, for example, Zau and Betts (2008) exam-
ined whether indicators from grades four to nine could
predict success on the California exit exam (CAHSEE);
Kurlaender, Reardon, and Jackson (2008), likewise,
examined the relationship between seventh-grade in-
dicators and risk of failure on the CAHSEE. Both found
that students having very weak test scores in the early
grades were at high risk of failing the exit exam. Zau and
Betts (2008) showed that they could predict students’
California exit exam passing almost as well in fourth
grade as they could in ninth. These two studies also
found that students’ course grades, behavior, and atten-
dance in the primary grades could predict passing the
CAHSEE. It is not clear from these studies the extent
to which students’ grades and attendance improve the
prediction of CAHSEE failure, beyond prior test scores,
as the variables were entered together in their statistical
models. However, each was predictive.
ACT, Inc., has shown a strong relationship between
their eighth-grade EXPLORE exam and student perfor-
mance on the corresponding eleventh-grade ACT exam.
Furthermore, they have shown that prior test scores
eclipse other factors in predicting ACT scores. Entering
eighth-grade test scores are far more predictive of
eleventh- and twelfth-grade ACT scores than students’
coursework, grades, or background characteristics dur-
ing high school.17 In their words, “the level of academic
achievement that students attain by eighth grade [their
EXPLORE score] has a larger impact on their [ACT score]
by the time they graduate from high school than anything
that happens academically in high school.” Their inter-
pretation of this relationship is that early intervention is
important. They do not study early intervention, howev-
er, to see if this makes a difference in later performance.
All of these findings, however, could also suggest
that exam performance may not be strongly malleable.
If students’ test scores at the end of high school can be
predicted as well in fourth grade as in ninth grade, and
if students’ high school experiences matter little for
their ACT scores compared to their prior test scores,
how much do students’ experiences in school actually
matter for test scores at all?
As we show in this report, we find only small differ-
ences in students’ test score growth across the middle
grade years. No students with low performance in fifth
grade make up enough ground to have average perfor-
mance by eighth grade, especially in reading. The same
pattern can be seen in Kieffer and Marinell’s (2012)
study in New York, described earlier. They observe very
little variation in test score growth from fourth through
eighth grade, relative to the size of the gaps that exist
initially. We find that, while there is substantial year-
to-year variation in gains, differences tend to even out
when multiple years are considered and are modest
relative to the differences in test scores that students
start out with in the early grades. This brings up ques-
tions about how effective interventions around test
score growth can be for reducing inequities in perfor-
mance, even if students are identified as at risk early on,
as long as all schools have similar resources, incentives,
and approaches.
This Study Extends Prior Research on Middle Grade IndicatorsThis study builds off prior research and extends the
analysis of middle grade performance by asking
questions that have not been addressed before:
Should schools consider a broader range of
indicators, beyond test scores, grades, attendance,
and discipline, such as grit and test score growth?
Prior studies have found relationships of middle school
test scores, grades, attendance, and discipline records with
high school outcomes, so we include these as potential
indicators of high school success. We also include change
during the middle grade years in these indicators, since
Kieffer and Marinell (2012) found them to be predictive in
New York. Prior research in Chicago, and elsewhere, has
shown that it is not just students’ absolute skill levels that
are related to passing classes and getting good grades, but
their skills relative to classroom peers; even students with
above-average achievement are at elevated risk of failure
if their classroom peers have much higher skill levels.18
Therefore, we include indicators of students’ skills relative
to their school cohort peers.
Introduction | Research on Indicators of High School and College Readiness
13
17 ACT, Inc. (2008). 18 Nomi and Allensworth (2013); Farkas, Sheehan, and
Grobe (1990); Kelly (2008).19 The importance of perseverance for academic success gained
considerable attention in a New York Times Magazine article (Tough, 2011), through a manuscript commissioned by the Bill
and Melinda Gates Foundation (Dweck, Walton, and Cohen, 2011). We recently included it as one of a number of important noncognitive factors affecting grades in a UChicago CCSR report (Farrington et al., 2012).
20 Luppescu et al. (2011); Koretz (2005, 2008).
We also expand the indicators under consideration
to include two noncognitive factors—students’ self-
reported grit (or tenacity) and their study behaviors in
the middle grades. The concept of academic tenacity
has received considerable attention in recent years as
an important factor behind students’ academic achieve-
ment.19 Duckworth and her colleagues have found that
grit, or perseverance to pursue long-term goals over the
long-term, shows relationships with the grades of high-
achieving students above and beyond their test scores
(Duckworth et al., 2007). We include a subset of the grit
scale used by Duckworth and colleagues as one of the
indicators of middle grade performance. We also include
a measure of students’ study habits in the middle grades.
Prior research on ninth-grade indicators found stu-
dents’ study habits predict ninth-grade pass rates and
grades, above and beyond their attendance (Allensworth
and Easton, 2007). We might expect that students’ study
habits in middle school predict their success when they
get to high school.
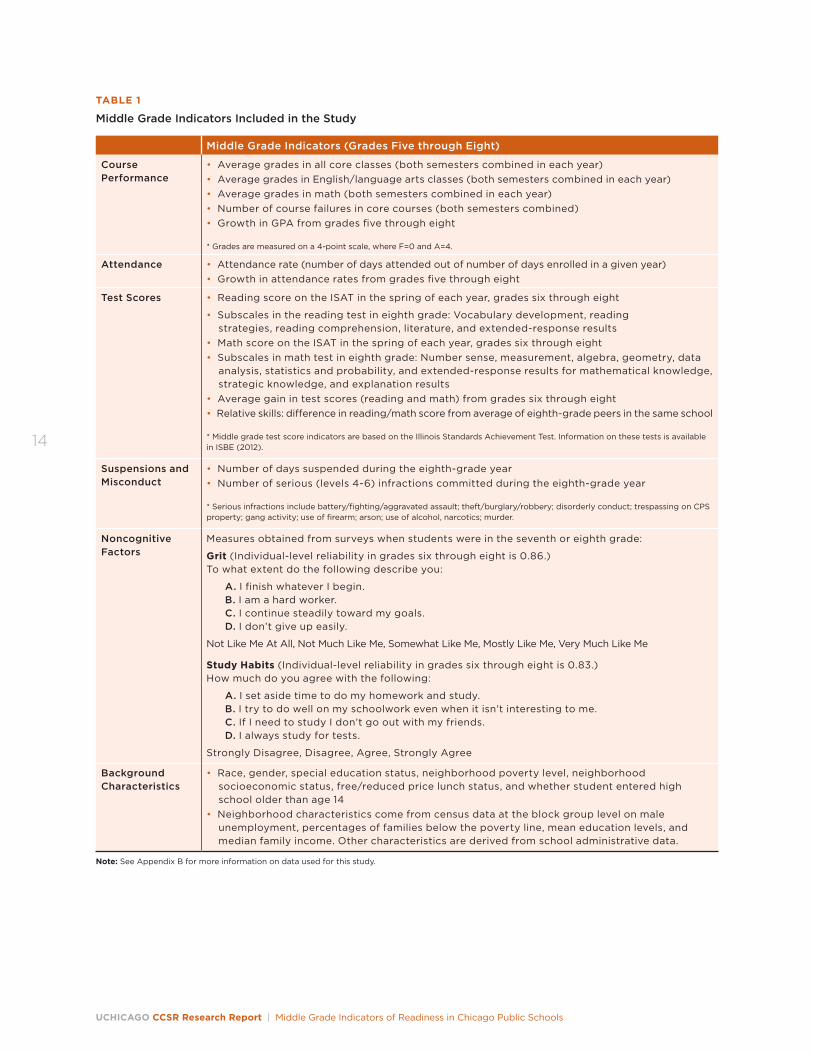
Table 1 provides a list of the middle school indicators
included in this study, and Appendix B lists the defini-
tion of all the indicators.
Which indicators are the most critical indicators to
track? Many variables are related to later outcomes, but
not all indicators are useful or necessary for an effec-
tive indicator system. With the wide array of data that
are now available, practitioners often feel that they are
drowning in data. It is important to critically analyze
the ways which indicators are related to later outcomes,
if practitioners are to focus on the best indicators to
enact change. Chapter 1 discusses some of the issues to
consider when evaluating indicators.
Do the indicators depend on where students attend
middle and high school? Students’ success in ninth grade
is determined not only by their preparation but also by
their experiences in the ninth grade. The structure and
climate of the high school they attend will moderate the
relationships between readiness indicators and ninth-
grade outcomes. It could be, for example, that students of
all skill levels are likely to fail in some high schools. Other
high schools might have very strong student support sys-
tems in place, leading students to succeed who would have
been at risk if they attended other schools. Thus, which in-
dicators are most important, and the levels of those indica-
tors that indicate risk, might depend on which high school
students attend. The Kurlaender et al. (2008) study that
compared three California districts found, for example,
that while course failures and test scores were predictive
of later outcomes in all districts, the timing of algebra was
not. One can also see from their analysis that the threshold
that puts students at risk of failing the CAHSEE varies by
which district students attend—with students in Fresno
at risk if they are simply “below basic” levels on the eighth-
grade assessment, but students in the other districts at
risk only if they are “far below basic” levels.
It is also possible that the predictiveness of indicators
depends on which middle school a student attends. There
is a prevailing belief that GPAs are not comparable across
schools, meaning that two students with the same grades
attending different middle schools may not be equally
ready for high school. Often, concerns are raised that
GPAs are easily manipulated. Yet the same could be said
of many other potential indicators. For example, some
schools seem to manipulate test scores, over-preparing
students for the types of questions asked on the stan-
dardized assessment in a way that would not translate to
different examinations taken in later years.20 Thus, there
may be a different threshold of risk for an indicator, based
on which middle school a student attends.
Who is at risk for not being college-ready, as well as
for not graduating? Prior work on middle school indica-
tors has primarily focused on minimum expected levels
of performance—graduating, passing classes, and pass-
ing exit exams. Middle grade educators also want to be
UCHICAGO CCSR Research Report | Middle Grade Indicators of Readiness in Chicago Public Schools
14
TABLE 1
Middle Grade Indicators Included in the Study
Middle Grade Indicators (Grades Five through Eight)
Course Performance
• Average grades in all core classes (both semesters combined in each year)• Average grades in English/language arts classes (both semesters combined in each year)• Average grades in math (both semesters combined in each year)• Number of course failures in core courses (both semesters combined)• Growth in GPA from grades five through eight * Grades are measured on a 4-point scale, where F=0 and A=4.
Attendance • Attendance rate (number of days attended out of number of days enrolled in a given year)• Growth in attendance rates from grades five through eight
Test Scores • Reading score on the ISAT in the spring of each year, grades six through eight
• Subscales in the reading test in eighth grade: Vocabulary development, reading strategies, reading comprehension, literature, and extended-response results
• Math score on the ISAT in the spring of each year, grades six through eight• Subscales in math test in eighth grade: Number sense, measurement, algebra, geometry, data
analysis, statistics and probability, and extended-response results for mathematical knowledge, strategic knowledge, and explanation results
• Average gain in test scores (reading and math) from grades six through eight• Relative skills: difference in reading/math score from average of eighth-grade peers in the same school * Middle grade test score indicators are based on the Illinois Standards Achievement Test. Information on these tests is available in ISBE (2012).
Suspensions and Misconduct
• Number of days suspended during the eighth-grade year• Number of serious (levels 4-6) infractions committed during the eighth-grade year * Serious infractions include battery/fighting/aggravated assault; theft/burglary/robbery; disorderly conduct; trespassing on CPS property; gang activity; use of firearm; arson; use of alcohol, narcotics; murder.
Noncognitive Factors
Measures obtained from surveys when students were in the seventh or eighth grade:
Grit (Individual-level reliability in grades six through eight is 0.86.) To what extent do the following describe you:
A. I finish whatever I begin. B. I am a hard worker. C. I continue steadily toward my goals. D. I don’t give up easily.
Not Like Me At All, Not Much Like Me, Somewhat Like Me, Mostly Like Me, Very Much Like Me
Study Habits (Individual-level reliability in grades six through eight is 0.83.) How much do you agree with the following:
A. I set aside time to do my homework and study. B. I try to do well on my schoolwork even when it isn’t interesting to me. C. If I need to study I don’t go out with my friends. D. I always study for tests.
Strongly Disagree, Disagree, Agree, Strongly Agree
Background Characteristics
• Race, gender, special education status, neighborhood poverty level, neighborhood socioeconomic status, free/reduced price lunch status, and whether student entered high school older than age 14
• Neighborhood characteristics come from census data at the block group level on male unemployment, percentages of families below the poverty line, mean education levels, and median family income. Other characteristics are derived from school administrative data.
Note: See Appendix B for more information on data used for this study.
Introduction | Research on Indicators of High School and College Readiness
15
able to assess whether their students’ performance puts
them on a path to potentially succeed in college. To be
on-track to college readiness, students should be mak-
ing appropriate gains in learning the skills required for
acceptance to college. These are generally measured
by tests such as ACT’s EPAS system. In Chicago, all
students participate in the EPAS tests and take the
ACT in eleventh grade. Even more importantly, they
need to be performing at sufficiently high levels in their
high school classes to earn high grades. Therefore, we
examine readiness for high school in three ways: Ready
to pass their ninth-grade classes; ready to meet college-
readiness benchmarks at the end of ninth grade; and
ready to earn high grades (As and Bs).
What is students’ level of risk, who is at high risk,
and who might go either way? It is useful to be able
to identify students who have an extremely high risk
of failing to meet an outcome (e.g., high risk of being
off-track, not graduating, missing test benchmarks)
because school personnel know with a high degree of
certainty that the students they target are very likely to
drop out—they are not wasting resources on students
who will graduate without any intervention. These are
“high-yield” indicators that very accurately identify
students who will likely fail without falsely identifying
students who will not fail.21
At the same time, there are limitations to just consid-
ering intervention plans for students at very high risk of
failure. Students at very high risk of failure may not be
very amenable to change. If a student has a 90 percent
chance of dropping out, it will take a very substantial
intervention to get that student to graduate. Yet, a student
with a 50 percent chance of dropping out could go either
way. A more modest intervention might be enough to get
that student to succeed. Even though interventions would
need to be targeted to a larger group, those interventions
might be more effective and potentially less costly.
This suggests that indictor systems might want to
identify students at moderate risk, as well as those at
high risk, so that schools can design tiered intervention
systems that match the level of support to the level of
risk. It is also helpful to know students’ general level
of risk, given their middle grade performance, to help
students and their families understand the connections
between students’ current progress and their likeli-
hood of success in later years and to set goals that will
encourage high levels of performance. These issues are
discussed in more detail in Chapter 1.
How We Answered Questions About Middle Grade IndicatorsTo examine the ways in which middle grade indicators
are predictive of high school success, we followed a
cohort of students in the Chicago Public Schools from
fifth to eleventh grade, using their academic records,
survey data, and census information on their residen-
tial neighborhood. The report focuses on the cohort
of students who were first-time ninth-graders in
2009-10, and who should have been in the eleventh
grade in the 2011-12 school year. See Appendix B on
p.106 for a description of the cohort samples used in
each analysis. The analyses focus on performance in the
ninth-grade year, showing whether middle grade factors
were related to performance when students arrived in
high school. We include some eleventh-grade outcomes
to show whether it is likely students will eventually
graduate and to show the achievement levels that give
students access to college.
We examine the predictiveness of each middle grade
indicator for each ninth-grade outcome. We examine
them alone and in combination—whether each adds
new information for predicting the outcome beyond
the others, or depends on values of others. We try to
determine what minimal combination of predictors is
the most accurate. We also examine the precision in
the prediction—who can be identified for intervention
or success with high certainty, and how accurately we
can predict students’ later performance from their
middle grade records. Finally, we examine to what
degree the predictions depend on which middle school
or high school students attend.
21 For more information on high-yield indicators, see a summary in Heppen and Therriault (2008). Developing Early Warning Systems to Identify Potential High School Dropouts. Retrieved
from: http://www.betterhighschools.org/pubs/documents/ IssueBrief_EarlyWarningSystemsGuide.pdf.

UCHICAGO CCSR Research Report | Middle Grade Indicators of Readiness in Chicago Public Schools
16
After determining the best predictors of each
outcome, we examine the degree to which the best
indicators change across the middle grade years. We
examined student performance from fifth through
eighth grade, whether performance tended to change
on average, and the degree to which some students
showed more growth or decline than others. We also
examined the extent to which these changes could be
attributed to the school that students attended.
Finally, we discuss the implications of this work
for middle school and high school practitioners. The
findings in this report suggest that simplistic calls
for “early intervention” may not be the best solution.
Students’ experiences in high school moderate the
degree to which students succeed, above and beyond
their qualifications upon leaving middle school. Many
students who perform well in the middle grades do
not graduate from high school ready for college. High
schools could make use of middle grade indicators to
make sure students are reaching their potential.
Chapter 1 | Issues in Developing and Evaluating Indicators
17
CHAPTER 1
Issues in Developing and Evaluating Indicators
This chapter discusses issues to consider when designing indicator systems—which indicators to use and how many, as well as impli-cations of different cut-offs for identifying risk. This chapter also explains how to read the graphs that are used in subsequent chapters to compare indicators.
There are myriad studies that show relationships
between students’ academic performance, family
characteristics, neighborhood factors, and personal
factors in the elementary and middle grades with their
academic performance in high school. Many charac-
teristics of students in the middle grades are related
to their performance in high school, but it is difficult
for practitioners to track a large number of indicators
and develop intervention strategies for all of them. It
is also inefficient to focus efforts on factors that have
only weak, indirect, or spurious relationships with
the high school outcomes, when similar amounts of
effort could have a bigger pay-off if focused on factors
with stronger direct relationships with high school
outcomes. An effective early warning indicator system
focuses attention on factors that have strong and direct
relationships with later performance, and that also are
malleable with school practice.
Which Indicators Produce the Most Accurate and Simple System?The simpler an indicator system, the easier it is to track
the indicators and develop intervention plans. Many
potential indicators are correlated with high school
outcomes, but it is not necessary to track all of them.
If a small number of indicators is just as effective at
indicating students’ risk of later outcomes as a larger
number of indicators, school practitioners do not need
to monitor the myriad elements that may be related to
the outcome. Thus, one issue to consider is how to get
the best prediction of later outcomes with the smallest
number of indicators.
Another issue to consider is whether the indicator
is useful only for prediction, or whether it also could
be used as an intermediary outcome to drive change in
the later outcome. For example, in Chicago, schools use
ninth-grade attendance and failure rates as indicators
of eventual high school graduation; they provide fairly
accurate predictions of students’ risk. However, they
are strongly related to high school graduation because
they directly affect it—when students miss class and
fail classes they do not accumulate the credits they
need to graduate. Therefore, Chicago designed student
monitoring systems around the ninth-grade indicators
of attendance and course failure, and schools used those
systems to improve attendance and pass rates in the
ninth grade. This provided a mechanism for driving
improvements through use of the indicator system itself.
In contrast, other indicators are correlated with
high school outcomes simply because they are related
to other factors—their relationship with the outcome
is spurious and would not be a good lever for moving
student outcomes. Other factors have an indirect
relationship with the high school outcome—affecting
it by affecting some other factor that has a direct rela-
tionship. For example, poverty status is related to high
school graduation, but the relationship is indirect—
poverty affects students’ attendance rates and grades,
and their grades affect whether students graduate.
Efforts to track and improve indicators that directly
affect the outcome will generally be most effective for im-
proving the outcome, because no other intervening vari-
able has to change as a result of the intervention. Efforts
to change indicators that have indirect relationships
UCHICAGO CCSR Research Report | Middle Grade Indicators of Readiness in Chicago Public Schools
18
could also improve outcomes, but only to the extent that
the mediating factor also changes. Often practitioners
are frustrated when the results of their efforts do not
translate into improvements in the outcomes that
were targeted for improvement; this occurs when their
efforts are aimed at indicators that are only modestly
or indirectly related to the targeted outcome.
It is standard practice for researchers to enter
potential predictors of an outcome into a statistical
model and then determine which of them show signifi-
cant relationships through the regression coefficients,
controlling for other predictors in the model. However,
because the predictors are correlated with each other,
it is not possible to use regression coefficients to decide
which predictors are actually the best to track.22 This
approach results in unnecessarily complicated indica-
tor systems that include predictors that do not neces-
sarily improve the prediction of the outcome beyond
all of the others. Instead, the model statistics (R2 )
are much more useful than significance levels on
coefficients for determining which potential
indicators produce the simplest indicator system.
The first step in selecting the best indicators is to
identify which has the strongest relationship to the out-
come. The easiest way to do this is to compare correlation
coefficients; although, as discussed in the next section,
researchers should also consider the predictive power
of the indicators and issues of sensitivity and specificity,
as well as cut-off levels that are meaningful for predict-
ing later outcomes. Once the strongest predictor is
identified, the next issue is whether the prediction could
be improved by considering other indicators. Model
statistics on the amount of variation in the outcome that
is explained by the predictors (e.g., the R2 or pseudo-R2 ),
along with changes in the accuracy of predictions (e.g.,
the percentage of students correctly classified), can be
used to determine whether the prediction is significantly
better with any given additional predictor. If the model
does not explain more variation, and the percentage of
students correctly predicted to succeed or fail does not
significantly improve, then the additional indicator is
superfluous. Appendix C describes the methods used
for comparing indicators in this study.
To some extent, this approach also makes it likely that
indicators that are most directly related to the later out-
come will be chosen over indicators that have indirect or
spurious relationships with the outcome. Indicators that
have direct relationships with the outcome will often—
but not always—have the strongest relationships with
the outcome, because no other intervening factor must
change. Indicators with direct relationships will also
continue to add to the prediction when other variables
are included, because their relationship is not dependent
on a third factor. Factors that have indirect or spurious
relationships with the outcome will no longer contribute
to the prediction, once the intervening variables (in the
case of indirect effects) or prior variables (in the case
of spurious relationships) are included in the model.23
At the same time, just because an indicator has a strong
relationship with an outcome does not necessarily mean
that it has a direct effect; such an interpretation would
depend on theory and on research designed to get at
questions of causality. Furthermore, a predictor that
has an indirect or spurious relationship with an outcome
can still be useful in an indicator system if it adds to the
prediction of the later outcome.
Chapters 3 and 6 show the strength of the relation-
ships of each potential middle grade indicator with each
of the high school outcomes, and the degree to which
combinations of potential indicators improve the pre-
diction above and beyond predictions that use smaller
numbers of indicators. Tables of potential indicators and
combinations of indicators are included so that readers
can compare the strength of the relationship of each
potential indicator with the high school outcome, and
see how it changes the prediction. In all cases, predic-
tion models that use just two or three indicators are
almost as predictive as models that use all possible
indicators. Even though many factors are related to
high school achievement, most are indirectly related
to high school achievement through some combination
of middle grade GPAs, attendance, or test scores.
22 The regression coefficients will potentially be strongly affected by multicollinearity. The distribution of shared variance could be arbitrarily attributed to two factors, when one factor is the most directly related, depending on which other variables are
in the model. Some variables may be significant predictors of the outcome, but not add significantly more explanatory power beyond the other variables.
23 For more information on these issues, see Davis (1985).
Chapter 1 | Issues in Developing and Evaluating Indicators
19
How Accurate Are the Predictions That Result from the Indicators?Often, researchers identify factors as related to later
outcomes, without showing the accuracy of predictions
based on the indicator system—the degree to which
students at risk are correctly identified or misidenti-
fied using the indicators. Although an indicator may
be correlated with an outcome, the indicator might not
substantially improve the prediction of that outcome
beyond what would occur if we just assumed that all
students were at risk or not at risk. This often occurs
if an outcome is either very rare or very common. If
an event is rare, even a student with an elevated risk
is unlikely to experience it; the opposite is true for
outcomes that almost all students achieve. An indicator
may be able to precisely identify a subset of students
who are at risk of not achieving an outcome—so that all
of the students who are identified will fail to reach the
outcome without intervention—but miss the majority
of students who fail to achieve the outcome because too
few students were identified as at risk.
When deciding which indicators to use and how to
use them, researchers consider two primary issues. The
first issue is the proportion of students who fail to meet
an outcome who would be identified by the indicator as
at risk of failure. This is known as the sensitivity of the
indicator; a highly sensitive indicator of dropout would
identify a large proportion of the students who drop out.
The second issue is the false-positive or “false alarm”
rate—the percentage of students who do not fail who are
identified as at risk of failure by the indicator. This is
also known as the false-positive proportion.24 If only
60 percent of students flagged by an indicator actually
fail, then there is a high rate of “false alarms” because
40 percent of students would succeed without any in-
tervention. Indicator systems with a high false-positive
rate have the potential to waste valuable resources.25
The false-positive issue was the primary driver of
the indicator work done in Philadelphia by Neild and
Balfanz (2006) and Balfanz, Herzog, and MacIver
(2007) to identify high-yield indicators of dropout;
students flagged with high-yield indicators had at
least a 75 percent likelihood of dropping out. Using
data on Philadelphia schools, the researchers looked
to see whether they could find indicators of eventual
dropout using data on students’ performance in the
middle grades. Using the 75 percent criterion, they
found that an F in English or math and attendance
lower than 80 percent were signals available in middle
school that could be used for precise targeting of
students at very high risk of not graduating. The
Philadelphia indicators are highly useful because
practitioners do not need to worry that students who
are identified with these indicators will succeed
without intervention.
High-yield indicators are useful for targeting inter-
ventions that are expensive or require substantial re-
sources. Their high degree of precision among students
who are flagged as at risk, however, comes at two poten-
tial costs. The first issue is the sensitivity of the indica-
tor—the percentage of students who actually fail but are
not identified with the high-yield indicator. In general,
there is a trade-off between minimizing false positives
(false alarms) and missing true positives (students
who really will fail). This is a very substantial issue for
Chicago, when we try to apply the high-yield indicators
from Philadelphia. In Philadelphia, just over half of
eventual dropouts were identified using the high-yield
indicators.26 But in Chicago, only a small percentage
of eventual dropouts are identified with middle school
high-yield indicators, as discussed in Chapter 3. If all
strategies were based around students with a very high
likelihood of failure, then the majority of students at
risk for dropout would be missed in Chicago.
The second limitation of high-yield indicators is
that interventions to change the outcome may be very
resource-intensive, and there may not even be any
known intervention that can get the students who are
identified as at risk to eventually succeed. For example,
if a student has a 90 percent chance of failing to gradu-
ate, an intervention that successfully lowers her risk by
30 percentage points still would not be enough to make
24 This is calculated as one minus the specificity, which is one minus the proportion of students who succeeded who were identified as succeeding.
25 For a description of these issues, see Bowers et al. (2013).26 Neild and Balfanz (2006) correctly identified 54 percent of
dropouts with their eighth-grade indicators.
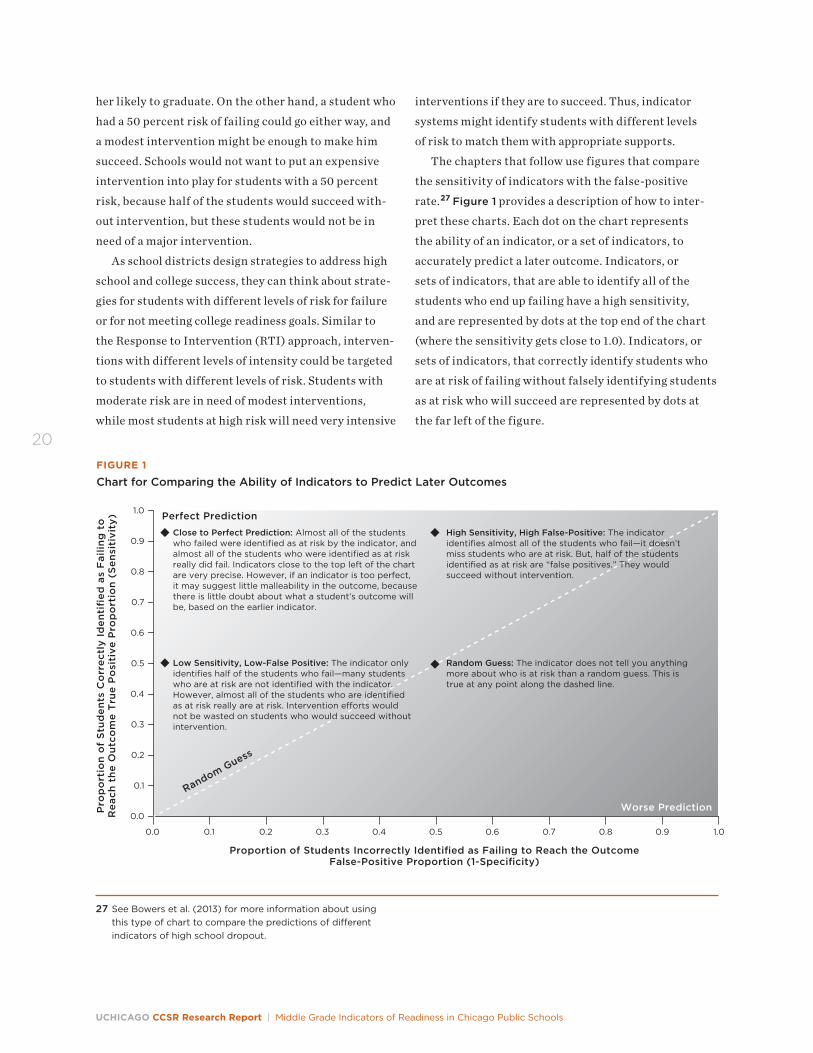
UCHICAGO CCSR Research Report | Middle Grade Indicators of Readiness in Chicago Public Schools
20
her likely to graduate. On the other hand, a student who
had a 50 percent risk of failing could go either way, and
a modest intervention might be enough to make him
succeed. Schools would not want to put an expensive
intervention into play for students with a 50 percent
risk, because half of the students would succeed with-
out intervention, but these students would not be in
need of a major intervention.
As school districts design strategies to address high
school and college success, they can think about strate-
gies for students with different levels of risk for failure
or for not meeting college readiness goals. Similar to
the Response to Intervention (RTI) approach, interven-
tions with different levels of intensity could be targeted
to students with different levels of risk. Students with
moderate risk are in need of modest interventions,
while most students at high risk will need very intensive
interventions if they are to succeed. Thus, indicator
systems might identify students with different levels
of risk to match them with appropriate supports.
The chapters that follow use figures that compare
the sensitivity of indicators with the false-positive
rate.27 Figure 1 provides a description of how to inter-
pret these charts. Each dot on the chart represents
the ability of an indicator, or a set of indicators, to
accurately predict a later outcome. Indicators, or
sets of indicators, that are able to identify all of the
students who end up failing have a high sensitivity,
and are represented by dots at the top end of the chart
(where the sensitivity gets close to 1.0). Indicators, or
sets of indicators, that correctly identify students who
are at risk of failing without falsely identifying students
as at risk who will succeed are represented by dots at
the far left of the figure.
27 See Bowers et al. (2013) for more information about using this type of chart to compare the predictions of different indicators of high school dropout.
Proportion of Students Incorrectly Identified as Failing to Reach the OutcomeFalse-Positive Proportion (1-Specificity)
FIGURE 1
Chart for Comparing the Ability of Indicators to Predict Later Outcomes
Pro
po
rtio
n o
f S
tud
ents
Co
rrec
tly
Iden
tifi
ed a
s F
ailin
g t
oR
each
th
e O
utc
om
e T
rue
Po
siti
ve P
rop
ort
ion
(S
ensi
tivi
ty) Perfect Prediction
Worse Prediction
Random Guess
Close to Perfect Prediction: Almost all of the students who failed were identified as at risk by the indicator, and almost all of the students who were identified as at risk really did fail. Indicators close to the top left of the chart are very precise. However, if an indicator is too perfect, it may suggest little malleability in the outcome, because there is little doubt about what a student’s outcome will be, based on the earlier indicator.
Low Sensitivity, Low-False Positive: The indicator only identifies half of the students who fail—many students who are at risk are not identified with the indicator. However, almost all of the students who are identified as at risk really are at risk. Intervention e�orts would not be wasted on students who would succeed without intervention.
High Sensitivity, High False-Positive: The indicator identifies almost all of the students who fail—it doesn’t miss students who are at risk. But, half of the students identified as at risk are “false positives.” They would succeed without intervention.
Random Guess: The indicator does not tell you anything more about who is at risk than a random guess. This is true at any point along the dashed line.
0.9
1.0
0.8
0.7
0.4
0.2
0.0
0.6
0.3
0.1
0.5
0.9 1.00.80.70.40.20.0 0.60.30.1 0.5
Chapter 1 | Issues in Developing and Evaluating Indicators
21
How Malleable Are the Indicators?Another issue to consider is the extent to which the in-
dicator is malleable and whether there are known strat-
egies for moving it in a school. Indictors do not have to
be malleable to be useful for identifying students’ risk;
non-malleable indicators may be very useful for target-
ing students for interventions if they are highly predic-
tive. However, if indicators directly or indirectly affect
the outcome, and if there are known ways to influence
the indicators, they not only allow school practitioners
to identify students’ risk of failure but also give them an
intermediate outcome to work on for moving the later
outcome. For example, the ninth-grade early warn-
ing indicators used in Chicago around attendance and
grades have been effective for getting more students on
the path to graduation because schools have been able to
develop effective strategies for actually improving stu-
dents’ ninth-grade attendance and course performance.
Indicators that are not within the power of prac-
titioners to change cannot be used to improve school
practices. For example, students’ gender, age at entry
into high school, and race might be associated with
their performance in high school, but high school
practitioners cannot develop strategies to change these
background characteristics. A final question, then, is
the extent to which there is evidence that schools can
change the indicator to a degree that such efforts could
have a substantial impact on the final outcome.
Chapter 8 begins to get at questions of malleability
by examining the degree to which the best indicators
of high school outcomes actually show different rates
of growth across students over the middle grade years.
If no student shows substantial change on an indica-
tor over time, or if all students show the same amount
of growth or decline over time, then there may not be
known strategies to substantially change that indica-
tor. If so, tracking the indicator may not be an effective
means of improving the later outcome, compared to
other indicators that are movable and also related to
the later outcome.
In the end, the indicators that are likely to have the
most potential to improve high school outcomes are
those that have strong, direct relationships with high
school outcomes, which identify students at risk with a
high likelihood of precision, and which can be changed
through intervention. Some of the most commonly used
indicators that are in use today for decisions about who
to target for interventions, and that have been identified
by research as predicting later outcomes, do not meet
these criteria, as discussed in subsequent chapters.

22
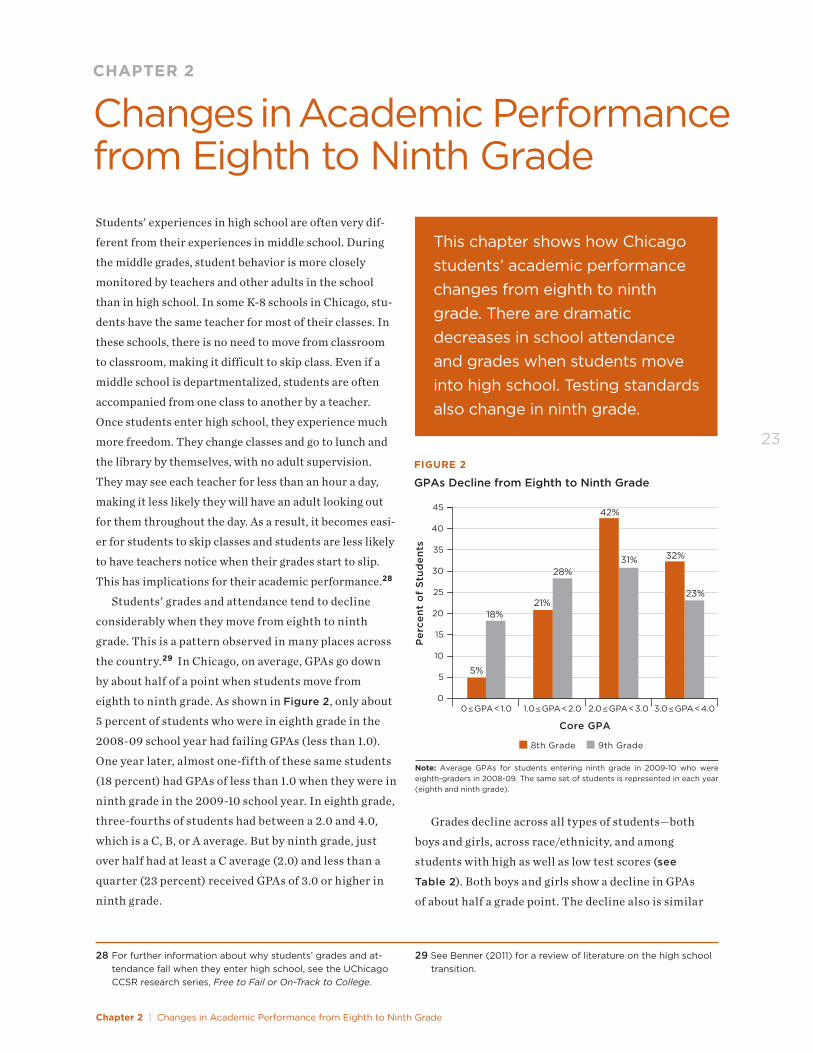
Chapter 2 | Changes in Academic Performance from Eighth to Ninth Grade
23
CHAPTER 2
Changes in Academic Performance from Eighth to Ninth GradeStudents’ experiences in high school are often very dif-
ferent from their experiences in middle school. During
the middle grades, student behavior is more closely
monitored by teachers and other adults in the school
than in high school. In some K-8 schools in Chicago, stu-
dents have the same teacher for most of their classes. In
these schools, there is no need to move from classroom
to classroom, making it difficult to skip class. Even if a
middle school is departmentalized, students are often
accompanied from one class to another by a teacher.
Once students enter high school, they experience much
more freedom. They change classes and go to lunch and
the library by themselves, with no adult supervision.
They may see each teacher for less than an hour a day,
making it less likely they will have an adult looking out
for them throughout the day. As a result, it becomes easi-
er for students to skip classes and students are less likely
to have teachers notice when their grades start to slip.
This has implications for their academic performance.28
Students’ grades and attendance tend to decline
considerably when they move from eighth to ninth
grade. This is a pattern observed in many places across
the country.29 In Chicago, on average, GPAs go down
by about half of a point when students move from
eighth to ninth grade. As shown in Figure 2, only about
5 percent of students who were in eighth grade in the
2008-09 school year had failing GPAs (less than 1.0).
One year later, almost one-fifth of these same students
(18 percent) had GPAs of less than 1.0 when they were in
ninth grade in the 2009-10 school year. In eighth grade,
three-fourths of students had between a 2.0 and 4.0,
which is a C, B, or A average. But by ninth grade, just
over half had at least a C average (2.0) and less than a
quarter (23 percent) received GPAs of 3.0 or higher in
ninth grade.
This chapter shows how Chicago students’ academic performance changes from eighth to ninth grade. There are dramatic decreases in school attendance and grades when students move into high school. Testing standards also change in ninth grade.
28 For further information about why students’ grades and at-tendance fall when they enter high school, see the UChicago CCSR research series, Free to Fail or On-Track to College.
29 See Benner (2011) for a review of literature on the high school transition.
Grades decline across all types of students—both
boys and girls, across race/ethnicity, and among
students with high as well as low test scores (see
Table 2). Both boys and girls show a decline in GPAs
of about half a grade point. The decline also is similar
Per
cen
t o
f S
tud
ents
45
40
35
20
25
10
15
5
0
30
0≤GPA<1.0 1.0≤GPA<2.0 2.0≤GPA<3.0 3.0≤GPA<4.0
5%
18%
8th Grade 9th Grade
Core GPA
21%
28%
42%
31%
FIGURE 2
GPAs Decline from Eighth to Ninth Grade
32%
23%
Note: Average GPAs for students entering ninth grade in 2009-10 who were eighth-graders in 2008-09. The same set of students is represented in each year (eighth and ninth grade).
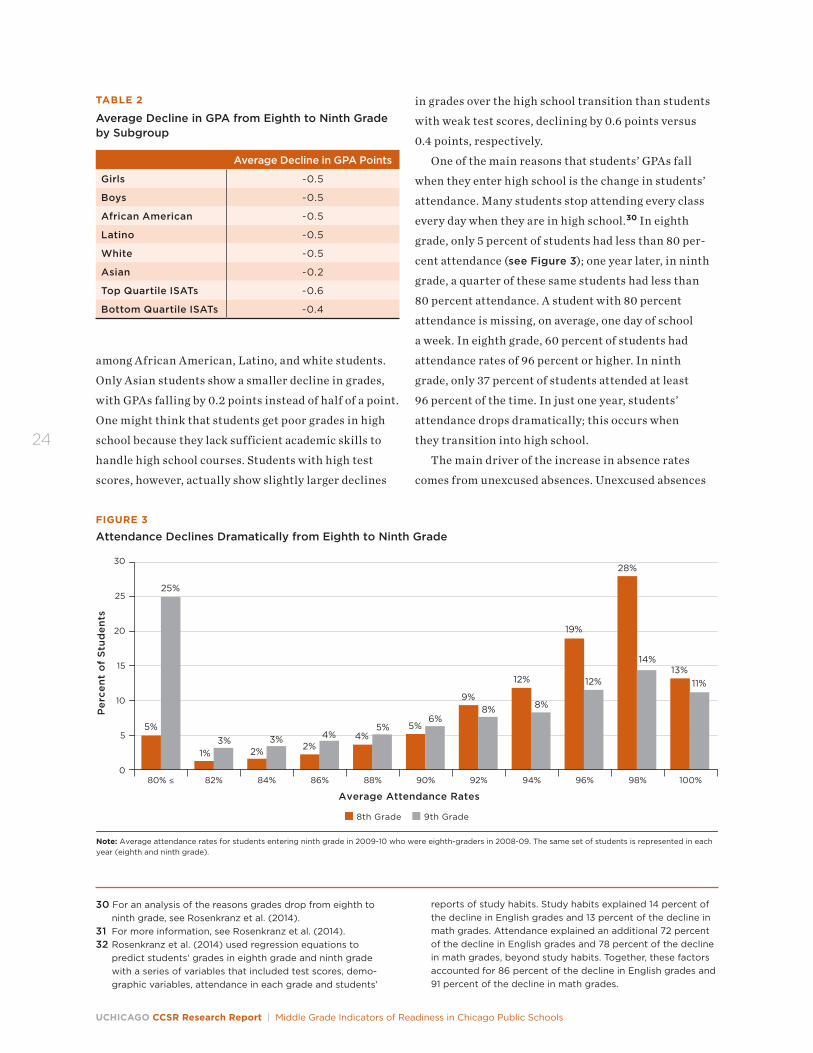
UCHICAGO CCSR Research Report | Middle Grade Indicators of Readiness in Chicago Public Schools
24
TABLE 2
Average Decline in GPA from Eighth to Ninth Grade by Subgroup
Average Decline in GPA Points
Girls -0.5
Boys -0.5
African American -0.5
Latino -0.5
White -0.5
Asian -0.2
Top Quartile ISATs -0.6
Bottom Quartile ISATs -0.4
30 For an analysis of the reasons grades drop from eighth to ninth grade, see Rosenkranz et al. (2014).
31 For more information, see Rosenkranz et al. (2014).32 Rosenkranz et al. (2014) used regression equations to
predict students’ grades in eighth grade and ninth grade with a series of variables that included test scores, demo-graphic variables, attendance in each grade and students’
reports of study habits. Study habits explained 14 percent of the decline in English grades and 13 percent of the decline in math grades. Attendance explained an additional 72 percent of the decline in English grades and 78 percent of the decline in math grades, beyond study habits. Together, these factors accounted for 86 percent of the decline in English grades and 91 percent of the decline in math grades.
Per
cen
t o
f S
tud
ents
30
20
15
10
0
25
80% ≤
Note: Average attendance rates for students entering ninth grade in 2009-10 who were eighth-graders in 2008-09. The same set of students is represented in each year (eighth and ninth grade).
82% 84% 86% 88% 90% 92% 94% 96% 98% 100%
Average Attendance Rates
FIGURE 3
Attendance Declines Dramatically from Eighth to Ninth Grade
55%
25%
1%3%
2%3%
2%4% 4%
5% 5%6%
9%8%
12%
8%
19%
12%
28%
14%13%
11%
8th Grade 9th Grade
among African American, Latino, and white students.
Only Asian students show a smaller decline in grades,
with GPAs falling by 0.2 points instead of half of a point.
One might think that students get poor grades in high
school because they lack sufficient academic skills to
handle high school courses. Students with high test
scores, however, actually show slightly larger declines
in grades over the high school transition than students
with weak test scores, declining by 0.6 points versus
0.4 points, respectively.
One of the main reasons that students’ GPAs fall
when they enter high school is the change in students’
attendance. Many students stop attending every class
every day when they are in high school.30 In eighth
grade, only 5 percent of students had less than 80 per-
cent attendance (see Figure 3); one year later, in ninth
grade, a quarter of these same students had less than
80 percent attendance. A student with 80 percent
attendance is missing, on average, one day of school
a week. In eighth grade, 60 percent of students had
attendance rates of 96 percent or higher. In ninth
grade, only 37 percent of students attended at least
96 percent of the time. In just one year, students’
attendance drops dramatically; this occurs when
they transition into high school.
The main driver of the increase in absence rates
comes from unexcused absences. Unexcused absences
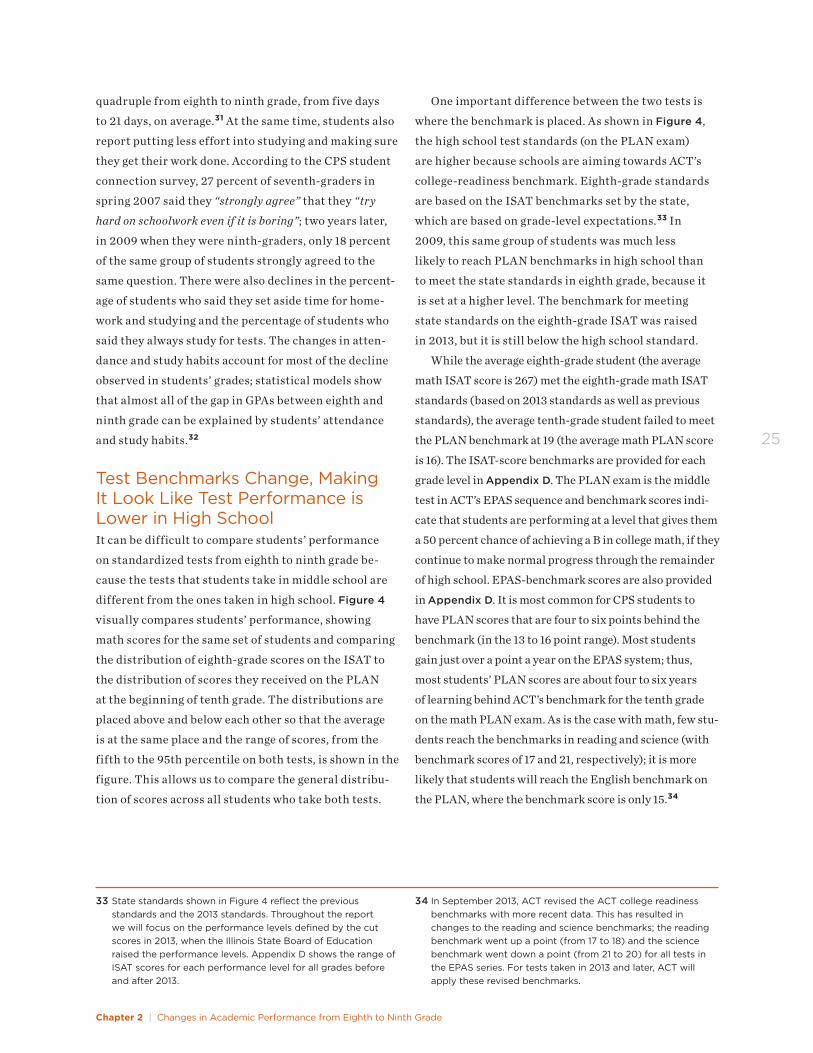
Chapter 2 | Changes in Academic Performance from Eighth to Ninth Grade
25
quadruple from eighth to ninth grade, from five days
to 21 days, on average.31 At the same time, students also
report putting less effort into studying and making sure
they get their work done. According to the CPS student
connection survey, 27 percent of seventh-graders in
spring 2007 said they “strongly agree” that they “try
hard on schoolwork even if it is boring”; two years later,
in 2009 when they were ninth-graders, only 18 percent
of the same group of students strongly agreed to the
same question. There were also declines in the percent-
age of students who said they set aside time for home-
work and studying and the percentage of students who
said they always study for tests. The changes in atten-
dance and study habits account for most of the decline
observed in students’ grades; statistical models show
that almost all of the gap in GPAs between eighth and
ninth grade can be explained by students’ attendance
and study habits.32
Test Benchmarks Change, Making It Look Like Test Performance is Lower in High SchoolIt can be difficult to compare students’ performance
on standardized tests from eighth to ninth grade be-
cause the tests that students take in middle school are
different from the ones taken in high school. Figure 4
visually compares students’ performance, showing
math scores for the same set of students and comparing
the distribution of eighth-grade scores on the ISAT to
the distribution of scores they received on the PLAN
at the beginning of tenth grade. The distributions are
placed above and below each other so that the average
is at the same place and the range of scores, from the
fifth to the 95th percentile on both tests, is shown in the
figure. This allows us to compare the general distribu-
tion of scores across all students who take both tests.
One important difference between the two tests is
where the benchmark is placed. As shown in Figure 4,
the high school test standards (on the PLAN exam)
are higher because schools are aiming towards ACT’s
college-readiness benchmark. Eighth-grade standards
are based on the ISAT benchmarks set by the state,
which are based on grade-level expectations.33 In
2009, this same group of students was much less
likely to reach PLAN benchmarks in high school than
to meet the state standards in eighth grade, because it
is set at a higher level. The benchmark for meeting
state standards on the eighth-grade ISAT was raised
in 2013, but it is still below the high school standard.
While the average eighth-grade student (the average
math ISAT score is 267) met the eighth-grade math ISAT
standards (based on 2013 standards as well as previous
standards), the average tenth-grade student failed to meet
the PLAN benchmark at 19 (the average math PLAN score
is 16). The ISAT-score benchmarks are provided for each
grade level in Appendix D. The PLAN exam is the middle
test in ACT’s EPAS sequence and benchmark scores indi-
cate that students are performing at a level that gives them
a 50 percent chance of achieving a B in college math, if they
continue to make normal progress through the remainder
of high school. EPAS-benchmark scores are also provided
in Appendix D. It is most common for CPS students to
have PLAN scores that are four to six points behind the
benchmark (in the 13 to 16 point range). Most students
gain just over a point a year on the EPAS system; thus,
most students’ PLAN scores are about four to six years
of learning behind ACT’s benchmark for the tenth grade
on the math PLAN exam. As is the case with math, few stu-
dents reach the benchmarks in reading and science (with
benchmark scores of 17 and 21, respectively); it is more
likely that students will reach the English benchmark on
the PLAN, where the benchmark score is only 15.34
33 State standards shown in Figure 4 reflect the previous standards and the 2013 standards. Throughout the report we will focus on the performance levels defined by the cut scores in 2013, when the Illinois State Board of Education raised the performance levels. Appendix D shows the range of ISAT scores for each performance level for all grades before and after 2013.
34 In September 2013, ACT revised the ACT college readiness benchmarks with more recent data. This has resulted in changes to the reading and science benchmarks; the reading benchmark went up a point (from 17 to 18) and the science benchmark went down a point (from 21 to 20) for all tests in the EPAS series. For tests taken in 2013 and later, ACT will apply these revised benchmarks.
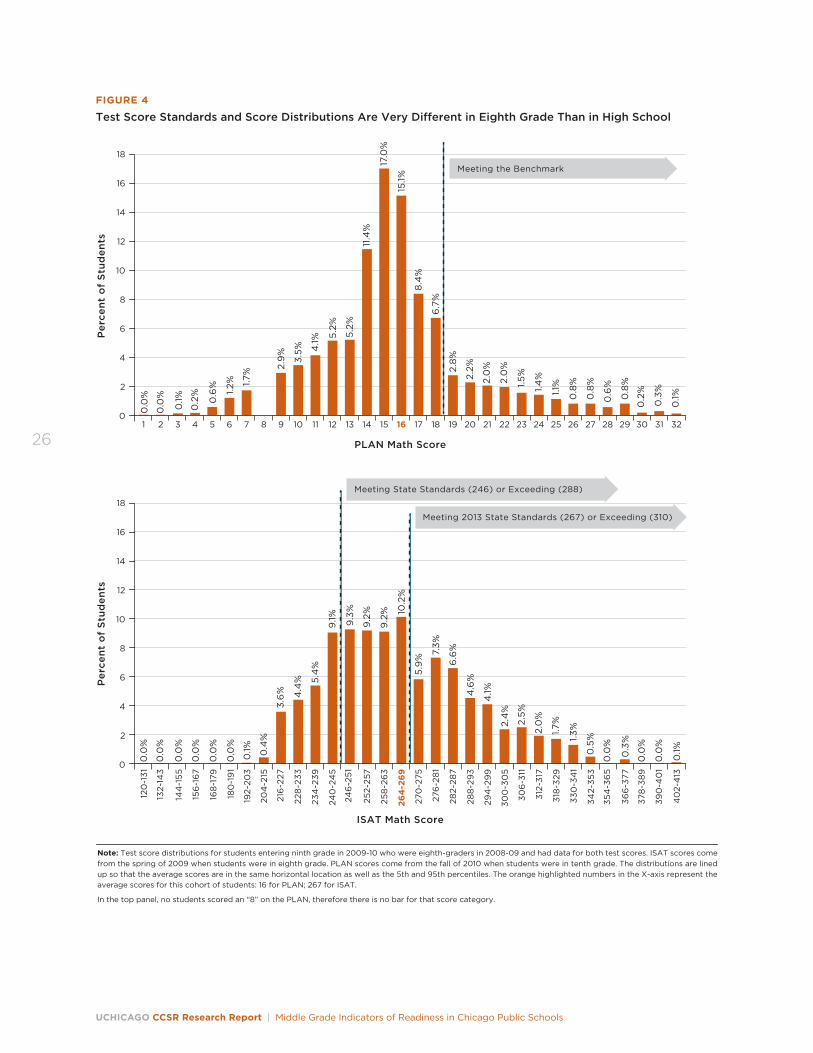
UCHICAGO CCSR Research Report | Middle Grade Indicators of Readiness in Chicago Public Schools
26
Per
cen
t o
f S
tud
ents
18
12
8
4
0
16
10
6
14
1 3 5 7 9 11 13 15 17 19 2321 25 27 29 322 4 6 8 10 12 14 16 18 20 2422 26 28 30 31
PLAN Math Score
FIGURE 4
Test Score Standards and Score Distributions Are Very Di�erent in Eighth Grade Than in High School
2
0.0
%
0.0
%
0.1%
0.2
%
0.6
% 1.7%
1.2%
2.9
%
3.5% 4
.1%
5.2%
5.2%
11.4
%
17.0
%
15.1%
8.4
%
6.7
%
2.8
%
2.2%
2.0
%
2.0
%
1.5%
1.4%
1.1%
0.8
%
0.8
%
0.8
%
0.2
%
0.3
%
0.1%0.6
%
Per
cen
t o
f S
tud
ents
18
12
8
4
0
16
10
6
14
2
Note: Test score distributions for students entering ninth grade in 2009-10 who were eighth-graders in 2008-09 and had data for both test scores. ISAT scores come from the spring of 2009 when students were in eighth grade. PLAN scores come from the fall of 2010 when students were in tenth grade. The distributions are lined up so that the average scores are in the same horizontal location as well as the 5th and 95th percentiles. The orange highlighted numbers in the X-axis represent the average scores for this cohort of students: 16 for PLAN; 267 for ISAT.
In the top panel, no students scored an “8” on the PLAN, therefore there is no bar for that score category.
Meeting the Benchmark
120
-131
132-
143
144
-155
156
-16
7
168
-179
180
-19
1
192-
203
204
-215
216
-227
228
-233
234
-239
240
-24
5
246
-251
252-
257
258
-26
3
264
-269
270
-275
276
-28
1
282-
287
288
-29
3
294
-29
9
300
-30
5
306
-311
312-
317
318
-329
330
-34
1
342-
353
354
-36
5
366
-377
378
-38
9
390
-40
1
40
2-4
13
ISAT Math Score
0.0
%
0.0
%
0.0
%
0.0
%
0.0
%
0.0
%
0.0
%
0.0
%
0.0
%
0.1% 0.4
%
4.4
%
3.6
%
5.4
%
9.1% 9.3
%
9.2
%
9.2
% 10.2
%
5.9
%
7.3%
6.6
%
4.6
%
4.1%
2.4
%
2.5%
2.0
%
1.7%
1.3%
0.5
%
0.3
%
0.1%
Meeting 2013 State Standards (267) or Exceeding (310)
Meeting State Standards (246) or Exceeding (288)
Chapter 2 | Changes in Academic Performance from Eighth to Ninth Grade
27
SummaryStudents’ academic performance declines consider-
ably between the middle grades and high school. They
are missing many more days of classwork due to a large
increase in unexcused absences, and they are less likely
to exhibit strong study habits. Their grades decline by
half of a GPA point from eighth to ninth grade, and the
decline is exactly what would be predicted based on the
change in attendance and study habits. Only about a
quarter of students end their ninth-grade year with
at least a B average, which means the vast majority
are not on-track to be likely to succeed in college. Test
scores are difficult to compare across assessments.
Because the standards are much higher in high school,
however, most students are far away from meeting
the expected scores for their grade level at the start of
tenth grade, while most were meeting state standards
in eighth grade.
In 2013, the cut scores that define the ISAT performance levels were raised to better align with the more rigorous standards of the Common Core State Standards. The old cut point defining “meets standards” was 231 in reading and 246 in math in eighth grade, while the “exceeds standards” was 278 in reading and 288 in math. The new cut points that define “meets standards” went up to 248 in reading and 267 in math. These cut points are very close to the average scores in the district. The new cut points that define “exceeds standards” went down to 271 in reading and up to 310 for math. Prior to the change
in the cut points for meeting and exceeding state standards, the “exceeds standards” point in reading was much harder to reach compared to the math “exceeds standards” point, with very few students exceeding standards in reading while many more were able to exceed standards in math in eighth grade.
Throughout this report, we focus on the performance levels defined by the cut scores in 2013 when the Illinois State Board of Education raised the performance levels.
Appendix D shows the performance levels before and after 2013.
New ISAT Performance Levels

28
Chapter 3 | Middle Grade Indicators of High School Course Performance
29
CHAPTER 3
Middle Grade Indicators of High School Course Performance
This chapter shows how well students’ academic performance in the middle grades predict their grades in high school and which combinations of indicators provide the best predictions. It examines predictions of ninth-grade on-track rates and ninth-grade GPAs, eleventh-grade progress to gradu-ation and eleventh-grade GPAs, and grades in ninth-grade English and math classes.
Passing high school classes is an essential step toward
graduating from high school. When students fail one
or more classes, they miss opportunities to accumulate
credits needed for graduation. Each semester F that
a student receives in ninth grade lowers their prob-
ability of graduating by about 20 percentage points
(Allensworth and Easton, 2007). But merely passing
classes is not sufficient for ensuring that students are
prepared to succeed in college. Students with Cs and Ds
in high school are very unlikely to succeed in college.
In fact, only those earning average grades of B or higher
(a 3.0 GPA) have close to a 50/50 chance of getting a
four-year college degree (Roderick et al., 2006; Bowen,
Chingos, and McPherson, 2009).
Unfortunately, many students receive very low
grades in their ninth-grade classes. Around one-third
(32 percent) of first-time ninth-graders in 2009 were
off-track by the end of ninth grade, meaning they failed
one or more core courses and did not accumulate
enough credits to be promoted to tenth grade. Only
one-quarter of all first-time ninth-graders (23 percent)
had a GPA of 3.0 or higher by the end of the ninth grade.
This sets the stage for poor grades throughout high
school, as shown later in this report.
Advocates for improving high school graduation
and college enrollment rates often ask if it is possible
to intervene before high school and identify students
in the middle grade years who are at risk of failure or
of earning low grades in high school. In this chapter,
we show the predictiveness of middle grade indicators
for being on-track and earning As or Bs in ninth grade
and whether a combination of indicators improve the
prediction of each outcome. In addition, we look at how
school effects influence the predictiveness of eighth-
grade indicators for being on-track and earning high
grades—whether the indicators work differently based
on what school a student attends. Finally, we examine
the predictiveness of middle grade indicators for being
on-track and earning high grades in eleventh grade.
Eighth-Grade Core GPA as a Predictor of High School Outcomes
Of all indicators tested, eighth-grade core GPA is the
best predictor of being on-track at the end of ninth
grade and of passing particular subjects. Each poten-
tial middle grade indicator was examined to determine
how well it could predict whether students were on-
track in ninth grade, based on its correlation, variance
explained, and correct prediction rate. We also looked
to see whether indicators had nonlinear relationships
with on-track rates (where the indicator was more
predictive at low or high levels), and whether combina-
tions of indicators provided much better predictions.
Table 3 provides a partial list of the indicators that we
examined; a complete list is provided in Appendix E.
Out of a large array of indicators of middle grade
performance that we examined as potential indicators,
the strongest predictor of being on-track at the end
of ninth grade is students’ eighth-grade core GPA.35
However, the relationship is only moderately strong,
with a correlation of 0.43 and a pseudo-R2 of 0.18.
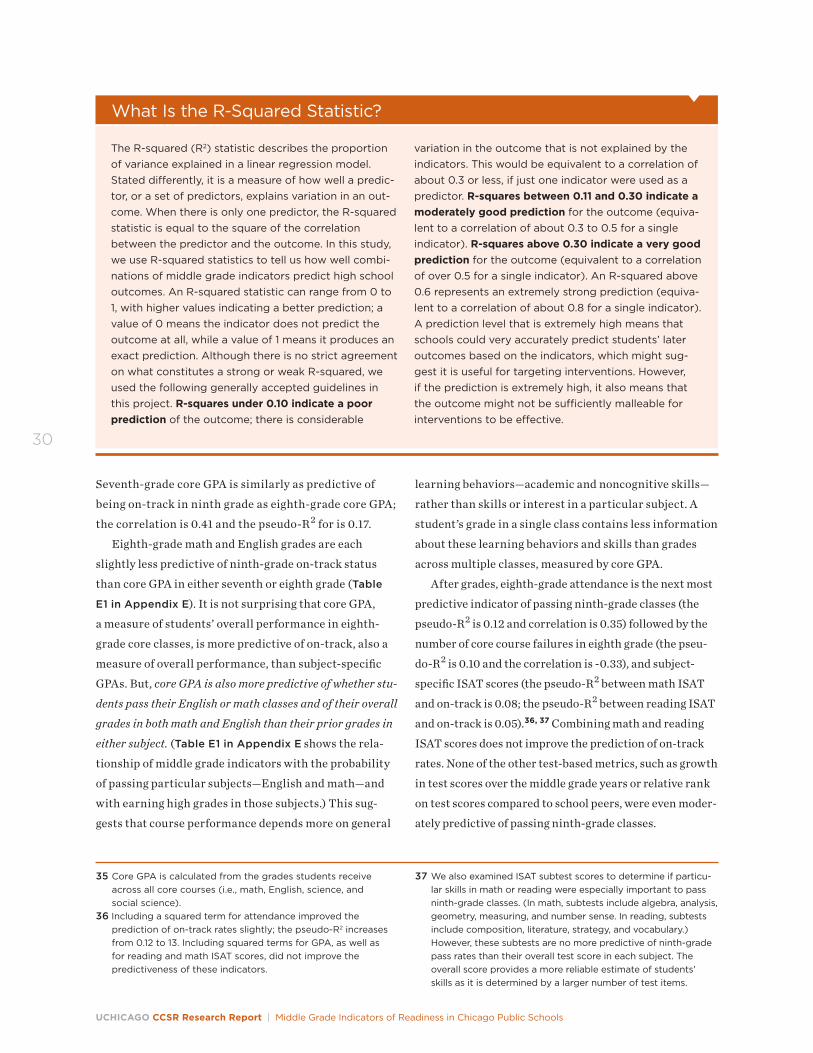
UCHICAGO CCSR Research Report | Middle Grade Indicators of Readiness in Chicago Public Schools
30
Seventh-grade core GPA is similarly as predictive of
being on-track in ninth grade as eighth-grade core GPA;
the correlation is 0.41 and the pseudo-R2 for is 0.17.
Eighth-grade math and English grades are each
slightly less predictive of ninth-grade on-track status
than core GPA in either seventh or eighth grade (Table
E1 in Appendix E). It is not surprising that core GPA,
a measure of students’ overall performance in eighth-
grade core classes, is more predictive of on-track, also a
measure of overall performance, than subject-specific
GPAs. But, core GPA is also more predictive of whether stu-
dents pass their English or math classes and of their overall
grades in both math and English than their prior grades in
either subject. (Table E1 in Appendix E shows the rela-
tionship of middle grade indicators with the probability
of passing particular subjects—English and math—and
with earning high grades in those subjects.) This sug-
gests that course performance depends more on general
learning behaviors—academic and noncognitive skills—
rather than skills or interest in a particular subject. A
student’s grade in a single class contains less information
about these learning behaviors and skills than grades
across multiple classes, measured by core GPA.
After grades, eighth-grade attendance is the next most
predictive indicator of passing ninth-grade classes (the
pseudo-R2 is 0.12 and correlation is 0.35) followed by the
number of core course failures in eighth grade (the pseu-
do-R2 is 0.10 and the correlation is -0.33), and subject-
specific ISAT scores (the pseudo-R2 between math ISAT
and on-track is 0.08; the pseudo-R2 between reading ISAT
and on-track is 0.05).36, 37 Combining math and reading
ISAT scores does not improve the prediction of on-track
rates. None of the other test-based metrics, such as growth
in test scores over the middle grade years or relative rank
on test scores compared to school peers, were even moder-
ately predictive of passing ninth-grade classes.
35 Core GPA is calculated from the grades students receive across all core courses (i.e., math, English, science, and social science).
36 Including a squared term for attendance improved the prediction of on-track rates slightly; the pseudo-R2 increases from 0.12 to 13. Including squared terms for GPA, as well as for reading and math ISAT scores, did not improve the predictiveness of these indicators.
37 We also examined ISAT subtest scores to determine if particu-lar skills in math or reading were especially important to pass ninth-grade classes. (In math, subtests include algebra, analysis, geometry, measuring, and number sense. In reading, subtests include composition, literature, strategy, and vocabulary.) However, these subtests are no more predictive of ninth-grade pass rates than their overall test score in each subject. The overall score provides a more reliable estimate of students’ skills as it is determined by a larger number of test items.
The R-squared (R2) statistic describes the proportion of variance explained in a linear regression model. Stated differently, it is a measure of how well a predic-tor, or a set of predictors, explains variation in an out-come. When there is only one predictor, the R-squared statistic is equal to the square of the correlation between the predictor and the outcome. In this study, we use R-squared statistics to tell us how well combi-nations of middle grade indicators predict high school outcomes. An R-squared statistic can range from 0 to 1, with higher values indicating a better prediction; a value of 0 means the indicator does not predict the outcome at all, while a value of 1 means it produces an exact prediction. Although there is no strict agreement on what constitutes a strong or weak R-squared, we used the following generally accepted guidelines in this project. R-squares under 0.10 indicate a poor prediction of the outcome; there is considerable
variation in the outcome that is not explained by the indicators. This would be equivalent to a correlation of about 0.3 or less, if just one indicator were used as a predictor. R-squares between 0.11 and 0.30 indicate a moderately good prediction for the outcome (equiva-lent to a correlation of about 0.3 to 0.5 for a single indicator). R-squares above 0.30 indicate a very good prediction for the outcome (equivalent to a correlation of over 0.5 for a single indicator). An R-squared above 0.6 represents an extremely strong prediction (equiva-lent to a correlation of about 0.8 for a single indicator). A prediction level that is extremely high means that schools could very accurately predict students’ later outcomes based on the indicators, which might sug-gest it is useful for targeting interventions. However, if the prediction is extremely high, it also means that the outcome might not be sufficiently malleable for interventions to be effective.
What Is the R-Squared Statistic?
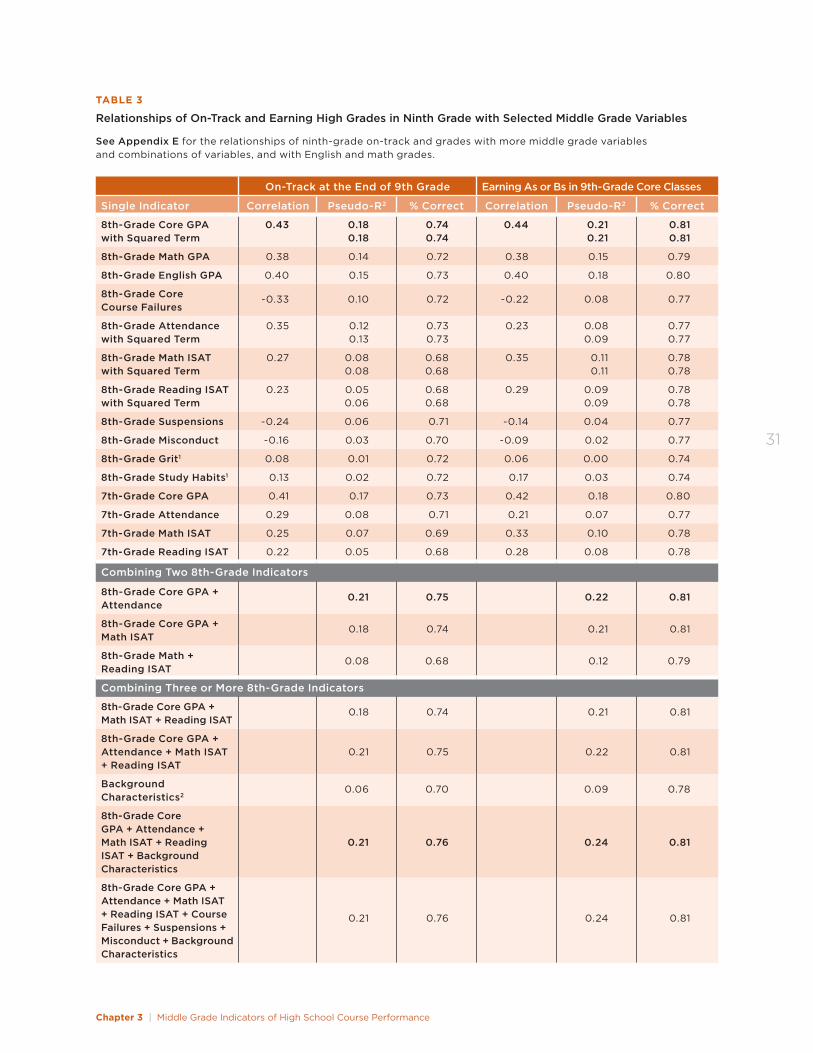
Chapter 3 | Middle Grade Indicators of High School Course Performance
31
TABLE 3
Relationships of On-Track and Earning High Grades in Ninth Grade with Selected Middle Grade Variables See Appendix E for the relationships of ninth-grade on-track and grades with more middle grade variables and combinations of variables, and with English and math grades.
On-Track at the End of 9th Grade Earning As or Bs in 9th-Grade Core Classes
Single Indicator Correlation Pseudo-R2 % Correct Correlation Pseudo-R2 % Correct
8th-Grade Core GPA with Squared Term
0.43 0.18 0.18
0.74 0.74
0.44 0.21 0.21
0.81 0.81
8th-Grade Math GPA 0.38 0.14 0.72 0.38 0.15 0.79
8th-Grade English GPA 0.40 0.15 0.73 0.40 0.18 0.80
8th-Grade Core Course Failures
-0.33 0.10 0.72 -0.22 0.08 0.77
8th-Grade Attendance with Squared Term
0.35 0.12 0.13
0.73 0.73
0.23 0.08 0.09
0.77 0.77
8th-Grade Math ISAT with Squared Term
0.27 0.08 0.08
0.68 0.68
0.35 0.11 0.11
0.78 0.78
8th-Grade Reading ISAT with Squared Term
0.23 0.05 0.06
0.68 0.68
0.29 0.09 0.09
0.78 0.78
8th-Grade Suspensions -0.24 0.06 0.71 -0.14 0.04 0.77
8th-Grade Misconduct -0.16 0.03 0.70 -0.09 0.02 0.77
8th-Grade Grit1 0.08 0.01 0.72 0.06 0.00 0.74
8th-Grade Study Habits1 0.13 0.02 0.72 0.17 0.03 0.74
7th-Grade Core GPA 0.41 0.17 0.73 0.42 0.18 0.80
7th-Grade Attendance 0.29 0.08 0.71 0.21 0.07 0.77
7th-Grade Math ISAT 0.25 0.07 0.69 0.33 0.10 0.78
7th-Grade Reading ISAT 0.22 0.05 0.68 0.28 0.08 0.78
Combining Two 8th-Grade Indicators
8th-Grade Core GPA + Attendance
0.21 0.75 0.22 0.81
8th-Grade Core GPA + Math ISAT
0.18 0.74 0.21 0.81
8th-Grade Math + Reading ISAT
0.08 0.68 0.12 0.79
Combining Three or More 8th-Grade Indicators
8th-Grade Core GPA + Math ISAT + Reading ISAT
0.18 0.74 0.21 0.81
8th-Grade Core GPA + Attendance + Math ISAT + Reading ISAT
0.21
0.75
0.22
0.81
Background Characteristics2
0.06 0.70 0.09 0.78
8th-Grade Core GPA + Attendance + Math ISAT + Reading ISAT + Background Characteristics
0.21
0.76
0.24
0.81
8th-Grade Core GPA + Attendance + Math ISAT + Reading ISAT + Course Failures + Suspensions + Misconduct + Background Characteristics
0.21
0.76
0.24
0.81
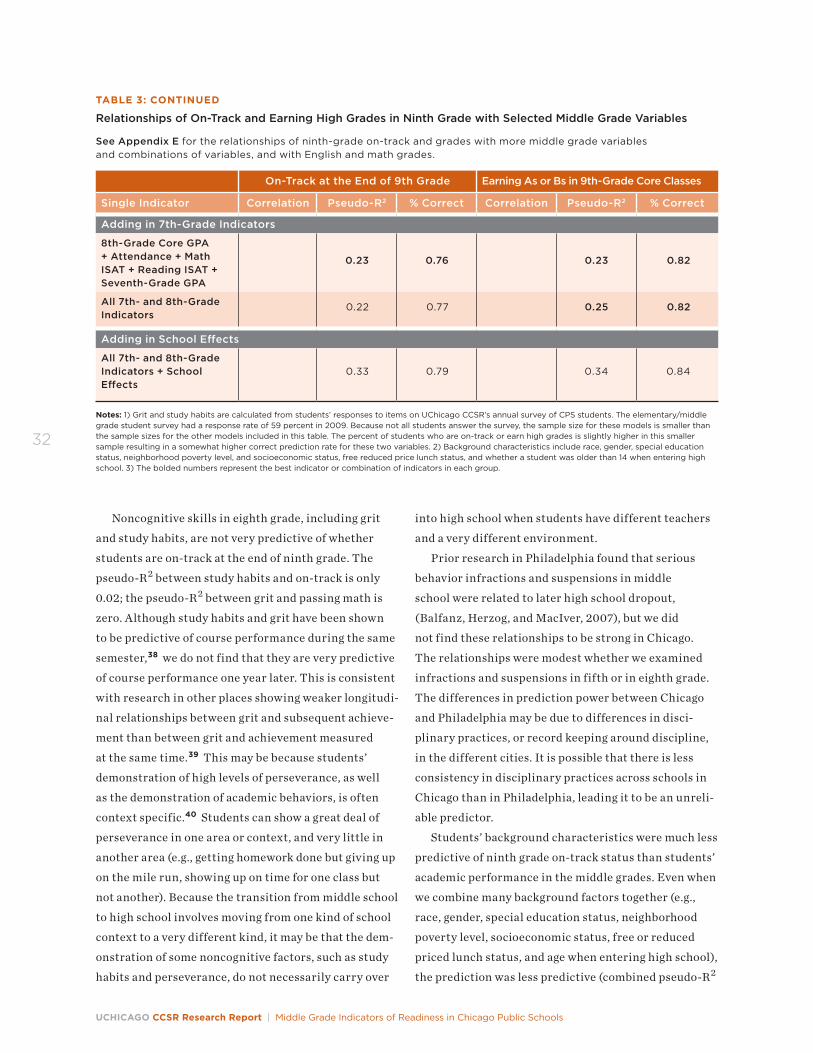
UCHICAGO CCSR Research Report | Middle Grade Indicators of Readiness in Chicago Public Schools
32
TABLE 3: CONTINUED
Relationships of On-Track and Earning High Grades in Ninth Grade with Selected Middle Grade Variables See Appendix E for the relationships of ninth-grade on-track and grades with more middle grade variables and combinations of variables, and with English and math grades.
Noncognitive skills in eighth grade, including grit
and study habits, are not very predictive of whether
students are on-track at the end of ninth grade. The
pseudo-R2 between study habits and on-track is only
0.02; the pseudo-R2 between grit and passing math is
zero. Although study habits and grit have been shown
to be predictive of course performance during the same
semester,38 we do not find that they are very predictive
of course performance one year later. This is consistent
with research in other places showing weaker longitudi-
nal relationships between grit and subsequent achieve-
ment than between grit and achievement measured
at the same time.39 This may be because students’
demonstration of high levels of perseverance, as well
as the demonstration of academic behaviors, is often
context specific.40 Students can show a great deal of
perseverance in one area or context, and very little in
another area (e.g., getting homework done but giving up
on the mile run, showing up on time for one class but
not another). Because the transition from middle school
to high school involves moving from one kind of school
context to a very different kind, it may be that the dem-
onstration of some noncognitive factors, such as study
habits and perseverance, do not necessarily carry over
into high school when students have different teachers
and a very different environment.
Prior research in Philadelphia found that serious
behavior infractions and suspensions in middle
school were related to later high school dropout,
(Balfanz, Herzog, and MacIver, 2007), but we did
not find these relationships to be strong in Chicago.
The relationships were modest whether we examined
infractions and suspensions in fifth or in eighth grade.
The differences in prediction power between Chicago
and Philadelphia may be due to differences in disci-
plinary practices, or record keeping around discipline,
in the different cities. It is possible that there is less
consistency in disciplinary practices across schools in
Chicago than in Philadelphia, leading it to be an unreli-
able predictor.
Students’ background characteristics were much less
predictive of ninth grade on-track status than students’
academic performance in the middle grades. Even when
we combine many background factors together (e.g.,
race, gender, special education status, neighborhood
poverty level, socioeconomic status, free or reduced
priced lunch status, and age when entering high school),
the prediction was less predictive (combined pseudo-R2
On-Track at the End of 9th Grade Earning As or Bs in 9th-Grade Core Classes
Single Indicator Correlation Pseudo-R2 % Correct Correlation Pseudo-R2 % Correct
Adding in 7th-Grade Indicators
8th-Grade Core GPA + Attendance + Math ISAT + Reading ISAT + Seventh-Grade GPA
0.23 0.76
0.23 0.82
All 7th- and 8th-Grade Indicators
0.22 0.77 0.25 0.82
Adding in School Effects
All 7th- and 8th-Grade Indicators + School Effects
0.33
0.79
0.34
0.84
Notes: 1) Grit and study habits are calculated from students’ responses to items on UChicago CCSR’s annual survey of CPS students. The elementary/middle grade student survey had a response rate of 59 percent in 2009. Because not all students answer the survey, the sample size for these models is smaller than the sample sizes for the other models included in this table. The percent of students who are on-track or earn high grades is slightly higher in this smaller sample resulting in a somewhat higher correct prediction rate for these two variables. 2) Background characteristics include race, gender, special education status, neighborhood poverty level, and socioeconomic status, free reduced price lunch status, and whether a student was older than 14 when entering high school. 3) The bolded numbers represent the best indicator or combination of indicators in each group.
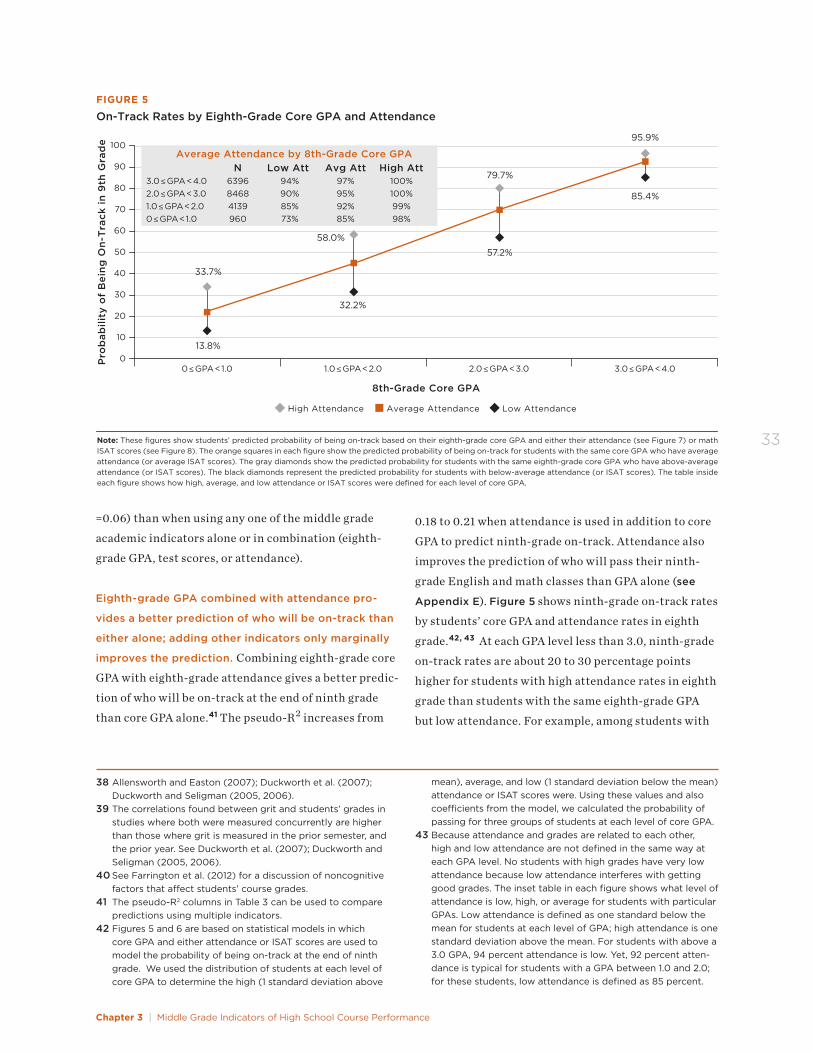
Chapter 3 | Middle Grade Indicators of High School Course Performance
33
38 Allensworth and Easton (2007); Duckworth et al. (2007); Duckworth and Seligman (2005, 2006).
39 The correlations found between grit and students’ grades in studies where both were measured concurrently are higher than those where grit is measured in the prior semester, and the prior year. See Duckworth et al. (2007); Duckworth and Seligman (2005, 2006).
40 See Farrington et al. (2012) for a discussion of noncognitive factors that affect students’ course grades.
41 The pseudo-R2 columns in Table 3 can be used to compare predictions using multiple indicators.
42 Figures 5 and 6 are based on statistical models in which core GPA and either attendance or ISAT scores are used to model the probability of being on-track at the end of ninth grade. We used the distribution of students at each level of core GPA to determine the high (1 standard deviation above
mean), average, and low (1 standard deviation below the mean) attendance or ISAT scores were. Using these values and also coefficients from the model, we calculated the probability of passing for three groups of students at each level of core GPA.
43 Because attendance and grades are related to each other, high and low attendance are not defined in the same way at each GPA level. No students with high grades have very low attendance because low attendance interferes with getting good grades. The inset table in each figure shows what level of attendance is low, high, or average for students with particular GPAs. Low attendance is defined as one standard below the mean for students at each level of GPA; high attendance is one standard deviation above the mean. For students with above a 3.0 GPA, 94 percent attendance is low. Yet, 92 percent atten-dance is typical for students with a GPA between 1.0 and 2.0; for these students, low attendance is defined as 85 percent.
=0.06) than when using any one of the middle grade
academic indicators alone or in combination (eighth-
grade GPA, test scores, or attendance).
Eighth-grade GPA combined with attendance pro-
vides a better prediction of who will be on-track than
either alone; adding other indicators only marginally
improves the prediction. Combining eighth-grade core
GPA with eighth-grade attendance gives a better predic-
tion of who will be on-track at the end of ninth grade
than core GPA alone.41 The pseudo-R2 increases from
0.18 to 0.21 when attendance is used in addition to core
GPA to predict ninth-grade on-track. Attendance also
improves the prediction of who will pass their ninth-
grade English and math classes than GPA alone (see
Appendix E). Figure 5 shows ninth-grade on-track rates
by students’ core GPA and attendance rates in eighth
grade.42, 43 At each GPA level less than 3.0, ninth-grade
on-track rates are about 20 to 30 percentage points
higher for students with high attendance rates in eighth
grade than students with the same eighth-grade GPA
but low attendance. For example, among students with
8th-Grade Core GPA
FIGURE 5
On-Track Rates by Eighth-Grade Core GPA and Attendance
13.8%
32.2%
33.7%
58.0%
57.2%
79.7%
85.4%
95.9%
Pro
bab
ility
of
Bei
ng
On
-Tra
ck in
9th
Gra
de 100
90
80
70
40
20
0
60
30
10
50
0≤GPA<1.0 1.0≤GPA<2.0 2.0≤GPA<3.0 3.0≤GPA<4.0
Average Attendance by 8th-Grade Core GPA N Low Att Avg Att High Att3.0≤GPA<4.0 6396 94% 97% 100%2.0≤GPA<3.0 8468 90% 95% 100%1.0≤GPA<2.0 4139 85% 92% 99%0≤GPA<1.0 960 73% 85% 98%
Note: These figures show students’ predicted probability of being on-track based on their eighth-grade core GPA and either their attendance (see Figure 7) or math ISAT scores (see Figure 8). The orange squares in each figure show the predicted probability of being on-track for students with the same core GPA who have average attendance (or average ISAT scores). The gray diamonds show the predicted probability for students with the same eighth-grade core GPA who have above-average attendance (or ISAT scores). The black diamonds represent the predicted probability for students with below-average attendance (or ISAT scores). The table inside each figure shows how high, average, and low attendance or ISAT scores were defined for each level of core GPA.
High Attendance Average Attendance Low Attendance
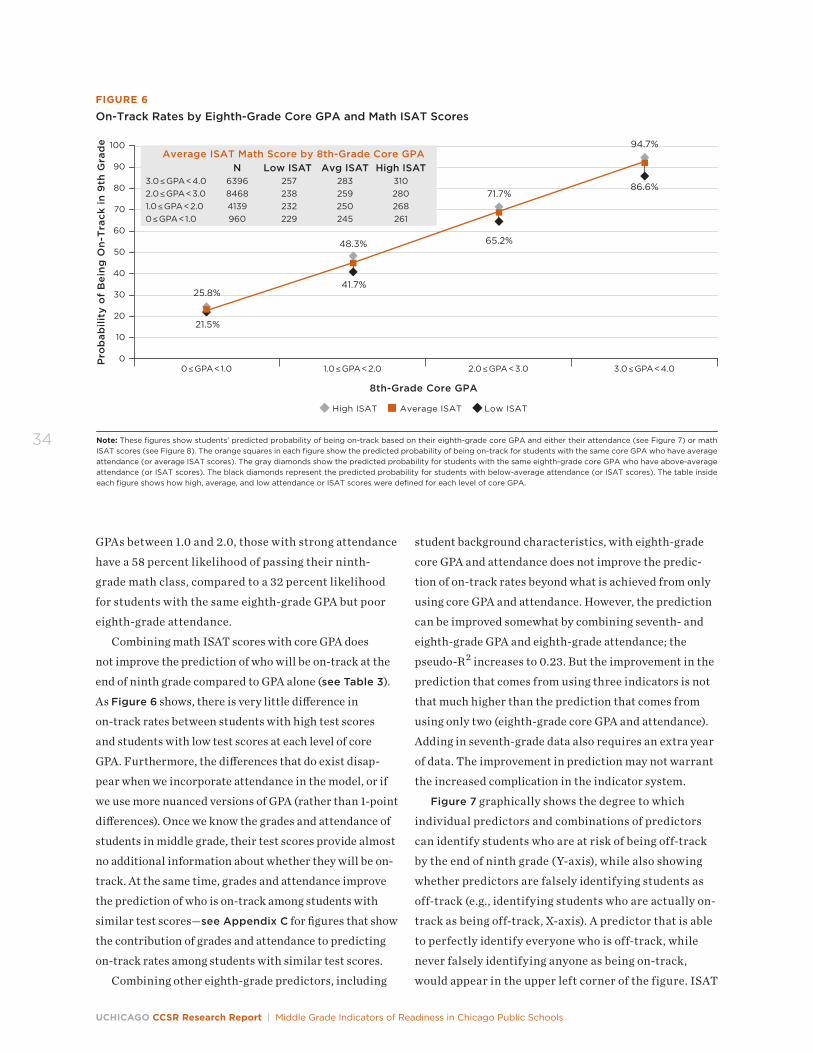
UCHICAGO CCSR Research Report | Middle Grade Indicators of Readiness in Chicago Public Schools
34
GPAs between 1.0 and 2.0, those with strong attendance
have a 58 percent likelihood of passing their ninth-
grade math class, compared to a 32 percent likelihood
for students with the same eighth-grade GPA but poor
eighth-grade attendance.
Combining math ISAT scores with core GPA does
not improve the prediction of who will be on-track at the
end of ninth grade compared to GPA alone (see Table 3).
As Figure 6 shows, there is very little difference in
on-track rates between students with high test scores
and students with low test scores at each level of core
GPA. Furthermore, the differences that do exist disap-
pear when we incorporate attendance in the model, or if
we use more nuanced versions of GPA (rather than 1-point
differences). Once we know the grades and attendance of
students in middle grade, their test scores provide almost
no additional information about whether they will be on-
track. At the same time, grades and attendance improve
the prediction of who is on-track among students with
similar test scores—see Appendix C for figures that show
the contribution of grades and attendance to predicting
on-track rates among students with similar test scores.
Combining other eighth-grade predictors, including
student background characteristics, with eighth-grade
core GPA and attendance does not improve the predic-
tion of on-track rates beyond what is achieved from only
using core GPA and attendance. However, the prediction
can be improved somewhat by combining seventh- and
eighth-grade GPA and eighth-grade attendance; the
pseudo-R2 increases to 0.23. But the improvement in the
prediction that comes from using three indicators is not
that much higher than the prediction that comes from
using only two (eighth-grade core GPA and attendance).
Adding in seventh-grade data also requires an extra year
of data. The improvement in prediction may not warrant
the increased complication in the indicator system.
Figure 7 graphically shows the degree to which
individual predictors and combinations of predictors
can identify students who are at risk of being off-track
by the end of ninth grade (Y-axis), while also showing
whether predictors are falsely identifying students as
off-track (e.g., identifying students who are actually on-
track as being off-track, X-axis). A predictor that is able
to perfectly identify everyone who is off-track, while
never falsely identifying anyone as being on-track,
would appear in the upper left corner of the figure. ISAT
8th-Grade Core GPA
FIGURE 6
On-Track Rates by Eighth-Grade Core GPA and Math ISAT Scores
41.7%
48.3%
21.5%
25.8%
65.2%
71.7%86.6%
94.7%
Pro
bab
ility
of
Bei
ng
On
-Tra
ck in
9th
Gra
de 100
90
80
70
40
20
0
60
30
10
50
0≤GPA<1.0 1.0≤GPA<2.0 2.0≤GPA<3.0 3.0≤GPA<4.0
Note: These figures show students’ predicted probability of being on-track based on their eighth-grade core GPA and either their attendance (see Figure 7) or math ISAT scores (see Figure 8). The orange squares in each figure show the predicted probability of being on-track for students with the same core GPA who have average attendance (or average ISAT scores). The gray diamonds show the predicted probability for students with the same eighth-grade core GPA who have above-average attendance (or ISAT scores). The black diamonds represent the predicted probability for students with below-average attendance (or ISAT scores). The table inside each figure shows how high, average, and low attendance or ISAT scores were defined for each level of core GPA.
Average ISAT Math Score by 8th-Grade Core GPA N Low ISAT Avg ISAT High ISAT3.0≤GPA<4.0 6396 257 283 3102.0≤GPA<3.0 8468 238 259 2801.0≤GPA<2.0 4139 232 250 2680≤GPA<1.0 960 229 245 261
High ISAT Average ISAT Low ISAT
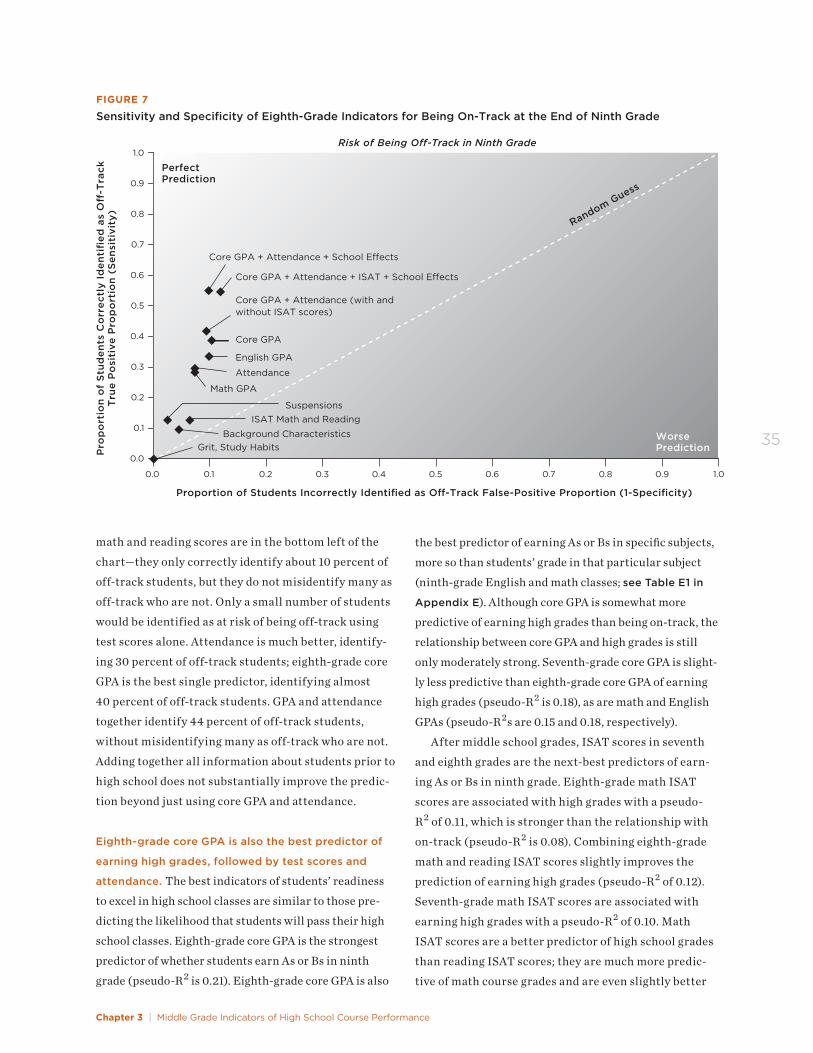
Chapter 3 | Middle Grade Indicators of High School Course Performance
35
Proportion of Students Incorrectly Identified as O-Track False-Positive Proportion (1-Specificity)
FIGURE 7
Sensitivity and Specificity of Eighth-Grade Indicators for Being On-Track at the End of Ninth GradeP
rop
ort
ion
of
Stu
den
ts C
orr
ectl
y Id
enti
fied
as
O
-Tra
ckT
rue
Po
siti
ve P
rop
ort
ion
(S
ensi
tivi
ty)
Perfect Prediction
WorsePrediction
Random Guess
Core GPA + Attendance + School E ects
Core GPA + Attendance + ISAT + School E ects
Core GPA + Attendance (with and without ISAT scores)
Core GPA
English GPA
Math GPA
Suspensions
Attendance
ISAT Math and Reading
Background CharacteristicsGrit, Study Habits
Risk of Being O�-Track in Ninth Grade
0.9
1.0
0.8
0.7
0.4
0.2
0.0
0.6
0.3
0.1
0.5
0.9 1.00.80.70.40.20.0 0.60.30.1 0.5
math and reading scores are in the bottom left of the
chart—they only correctly identify about 10 percent of
off-track students, but they do not misidentify many as
off-track who are not. Only a small number of students
would be identified as at risk of being off-track using
test scores alone. Attendance is much better, identify-
ing 30 percent of off-track students; eighth-grade core
GPA is the best single predictor, identifying almost
40 percent of off-track students. GPA and attendance
together identify 44 percent of off-track students,
without misidentifying many as off-track who are not.
Adding together all information about students prior to
high school does not substantially improve the predic-
tion beyond just using core GPA and attendance.
Eighth-grade core GPA is also the best predictor of
earning high grades, followed by test scores and
attendance. The best indicators of students’ readiness
to excel in high school classes are similar to those pre-
dicting the likelihood that students will pass their high
school classes. Eighth-grade core GPA is the strongest
predictor of whether students earn As or Bs in ninth
grade (pseudo-R2 is 0.21). Eighth-grade core GPA is also
the best predictor of earning As or Bs in specific subjects,
more so than students’ grade in that particular subject
(ninth-grade English and math classes; see Table E1 in
Appendix E). Although core GPA is somewhat more
predictive of earning high grades than being on-track, the
relationship between core GPA and high grades is still
only moderately strong. Seventh-grade core GPA is slight-
ly less predictive than eighth-grade core GPA of earning
high grades (pseudo-R2 is 0.18), as are math and English
GPAs (pseudo-R2s are 0.15 and 0.18, respectively).
After middle school grades, ISAT scores in seventh
and eighth grades are the next-best predictors of earn-
ing As or Bs in ninth grade. Eighth-grade math ISAT
scores are associated with high grades with a pseudo-
R2 of 0.11, which is stronger than the relationship with
on-track (pseudo-R2 is 0.08). Combining eighth-grade
math and reading ISAT scores slightly improves the
prediction of earning high grades (pseudo-R2 of 0.12).
Seventh-grade math ISAT scores are associated with
earning high grades with a pseudo-R2 of 0.10. Math
ISAT scores are a better predictor of high school grades
than reading ISAT scores; they are much more predic-
tive of math course grades and are even slightly better
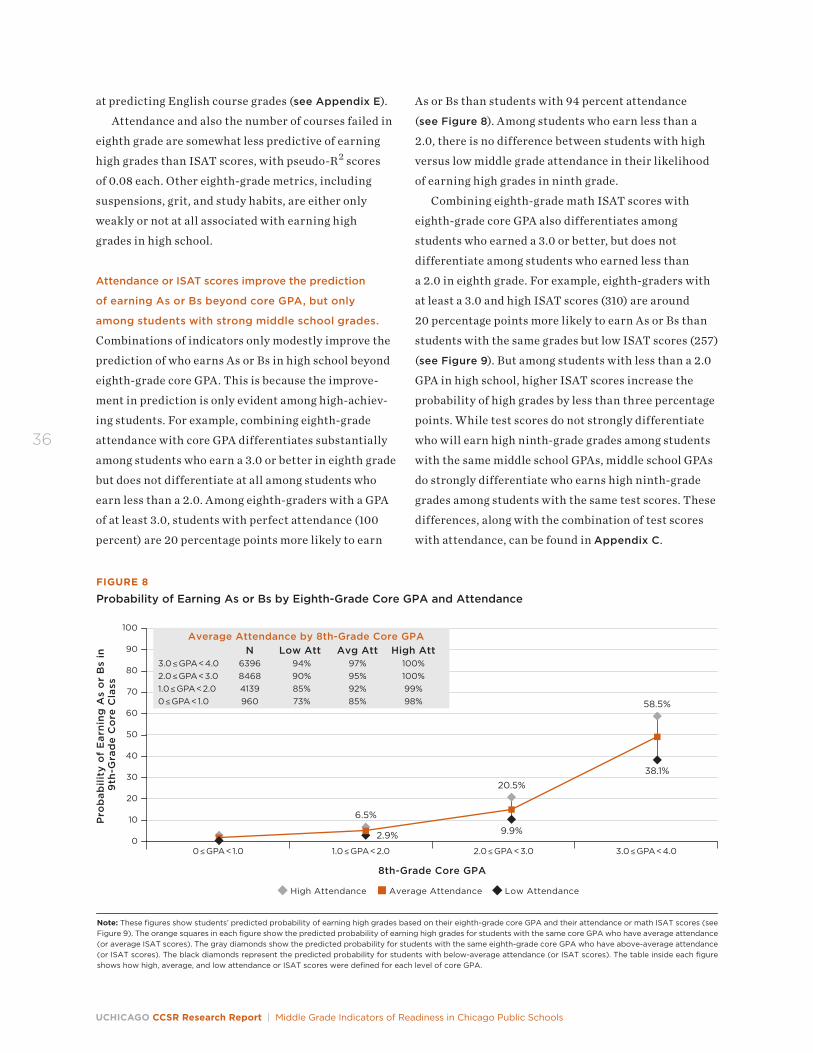
UCHICAGO CCSR Research Report | Middle Grade Indicators of Readiness in Chicago Public Schools
36
at predicting English course grades (see Appendix E).
Attendance and also the number of courses failed in
eighth grade are somewhat less predictive of earning
high grades than ISAT scores, with pseudo-R2 scores
of 0.08 each. Other eighth-grade metrics, including
suspensions, grit, and study habits, are either only
weakly or not at all associated with earning high
grades in high school.
Attendance or ISAT scores improve the prediction
of earning As or Bs beyond core GPA, but only
among students with strong middle school grades.
Combinations of indicators only modestly improve the
prediction of who earns As or Bs in high school beyond
eighth-grade core GPA. This is because the improve-
ment in prediction is only evident among high-achiev-
ing students. For example, combining eighth-grade
attendance with core GPA differentiates substantially
among students who earn a 3.0 or better in eighth grade
but does not differentiate at all among students who
earn less than a 2.0. Among eighth-graders with a GPA
of at least 3.0, students with perfect attendance (100
percent) are 20 percentage points more likely to earn
8th-Grade Core GPA
FIGURE 8
Probability of Earning As or Bs by Eighth-Grade Core GPA and Attendance
2.9%
6.5%
9.9%
20.5%
38.1%
58.5%
High Attendance Average Attendance Low Attendance
Pro
bab
ility
of
Ear
nin
g A
s o
r B
s in
9
th-G
rad
e C
ore
Cla
ss
100
90
80
70
40
20
0
60
30
10
50
0≤GPA<1.0 1.0≤GPA<2.0 2.0≤GPA<3.0 3.0≤GPA<4.0
Average Attendance by 8th-Grade Core GPA N Low Att Avg Att High Att3.0≤GPA<4.0 6396 94% 97% 100%2.0≤GPA<3.0 8468 90% 95% 100%1.0≤GPA<2.0 4139 85% 92% 99%0≤GPA<1.0 960 73% 85% 98%
Note: These figures show students’ predicted probability of earning high grades based on their eighth-grade core GPA and their attendance or math ISAT scores (see Figure 9). The orange squares in each figure show the predicted probability of earning high grades for students with the same core GPA who have average attendance (or average ISAT scores). The gray diamonds show the predicted probability for students with the same eighth-grade core GPA who have above-average attendance (or ISAT scores). The black diamonds represent the predicted probability for students with below-average attendance (or ISAT scores). The table inside each figure shows how high, average, and low attendance or ISAT scores were defined for each level of core GPA.
As or Bs than students with 94 percent attendance
(see Figure 8). Among students who earn less than a
2.0, there is no difference between students with high
versus low middle grade attendance in their likelihood
of earning high grades in ninth grade.
Combining eighth-grade math ISAT scores with
eighth-grade core GPA also differentiates among
students who earned a 3.0 or better, but does not
differentiate among students who earned less than
a 2.0 in eighth grade. For example, eighth-graders with
at least a 3.0 and high ISAT scores (310) are around
20 percentage points more likely to earn As or Bs than
students with the same grades but low ISAT scores (257)
(see Figure 9). But among students with less than a 2.0
GPA in high school, higher ISAT scores increase the
probability of high grades by less than three percentage
points. While test scores do not strongly differentiate
who will earn high ninth-grade grades among students
with the same middle school GPAs, middle school GPAs
do strongly differentiate who earns high ninth-grade
grades among students with the same test scores. These
differences, along with the combination of test scores
with attendance, can be found in Appendix C.
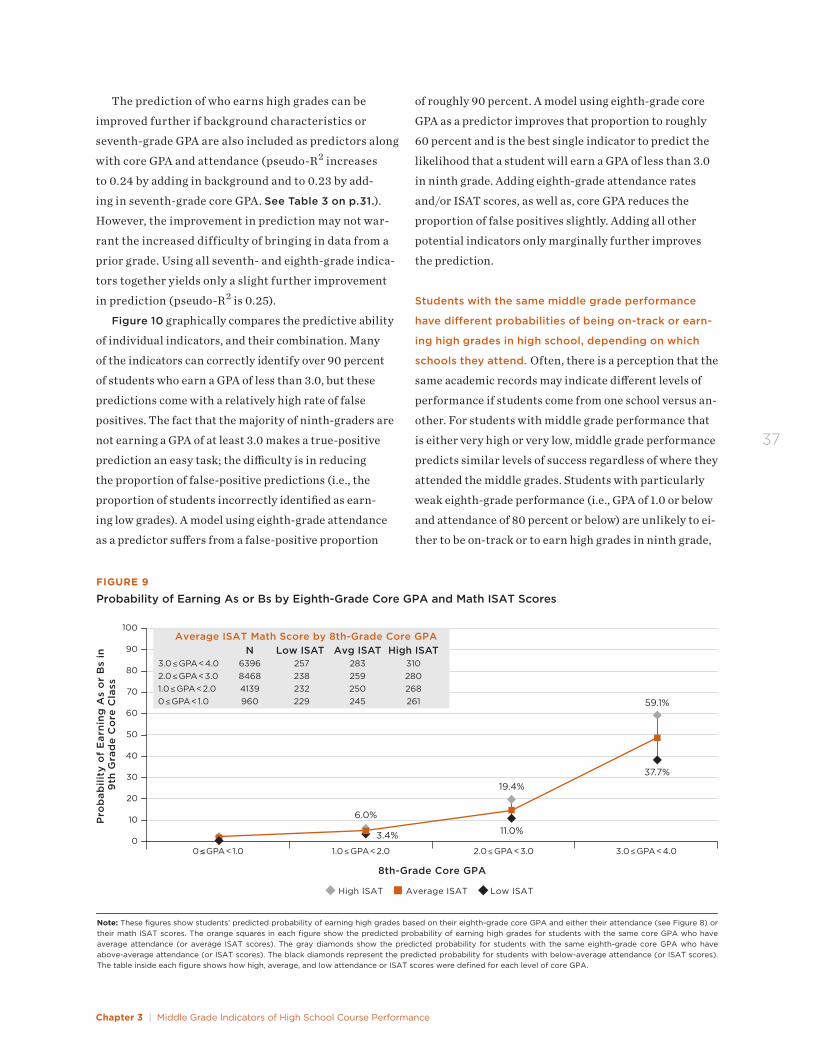
Chapter 3 | Middle Grade Indicators of High School Course Performance
37
8th-Grade Core GPA
FIGURE 9
Probability of Earning As or Bs by Eighth-Grade Core GPA and Math ISAT Scores
3.4%
6.0%
11.0%
19.4%
37.7%
59.1%
High ISAT Average ISAT Low ISAT
Pro
bab
ility
of
Ear
nin
g A
s o
r B
s in
9
th G
rad
e C
ore
Cla
ss
100
90
80
70
40
20
0
60
30
10
50
0≤GPA<1.0 1.0≤GPA<2.0 2.0≤GPA<3.0 3.0≤GPA<4.0
Average ISAT Math Score by 8th-Grade Core GPA N Low ISAT Avg ISAT High ISAT3.0≤GPA<4.0 6396 257 283 3102.0≤GPA<3.0 8468 238 259 2801.0≤GPA<2.0 4139 232 250 2680≤GPA<1.0 960 229 245 261
Note: These figures show students’ predicted probability of earning high grades based on their eighth-grade core GPA and either their attendance (see Figure 8) or their math ISAT scores. The orange squares in each figure show the predicted probability of earning high grades for students with the same core GPA who have average attendance (or average ISAT scores). The gray diamonds show the predicted probability for students with the same eighth-grade core GPA who have above-average attendance (or ISAT scores). The black diamonds represent the predicted probability for students with below-average attendance (or ISAT scores). The table inside each figure shows how high, average, and low attendance or ISAT scores were defined for each level of core GPA.
The prediction of who earns high grades can be
improved further if background characteristics or
seventh-grade GPA are also included as predictors along
with core GPA and attendance (pseudo-R2 increases
to 0.24 by adding in background and to 0.23 by add-
ing in seventh-grade core GPA. See Table 3 on p.31.).
However, the improvement in prediction may not war-
rant the increased difficulty of bringing in data from a
prior grade. Using all seventh- and eighth-grade indica-
tors together yields only a slight further improvement
in prediction (pseudo-R2 is 0.25).
Figure 10 graphically compares the predictive ability
of individual indicators, and their combination. Many
of the indicators can correctly identify over 90 percent
of students who earn a GPA of less than 3.0, but these
predictions come with a relatively high rate of false
positives. The fact that the majority of ninth-graders are
not earning a GPA of at least 3.0 makes a true-positive
prediction an easy task; the difficulty is in reducing
the proportion of false-positive predictions (i.e., the
proportion of students incorrectly identified as earn-
ing low grades). A model using eighth-grade attendance
as a predictor suffers from a false-positive proportion
of roughly 90 percent. A model using eighth-grade core
GPA as a predictor improves that proportion to roughly
60 percent and is the best single indicator to predict the
likelihood that a student will earn a GPA of less than 3.0
in ninth grade. Adding eighth-grade attendance rates
and/or ISAT scores, as well as, core GPA reduces the
proportion of false positives slightly. Adding all other
potential indicators only marginally further improves
the prediction.
Students with the same middle grade performance
have different probabilities of being on-track or earn-
ing high grades in high school, depending on which
schools they attend. Often, there is a perception that the
same academic records may indicate different levels of
performance if students come from one school versus an-
other. For students with middle grade performance that
is either very high or very low, middle grade performance
predicts similar levels of success regardless of where they
attended the middle grades. Students with particularly
weak eighth-grade performance (i.e., GPA of 1.0 or below
and attendance of 80 percent or below) are unlikely to ei-
ther to be on-track or to earn high grades in ninth grade,
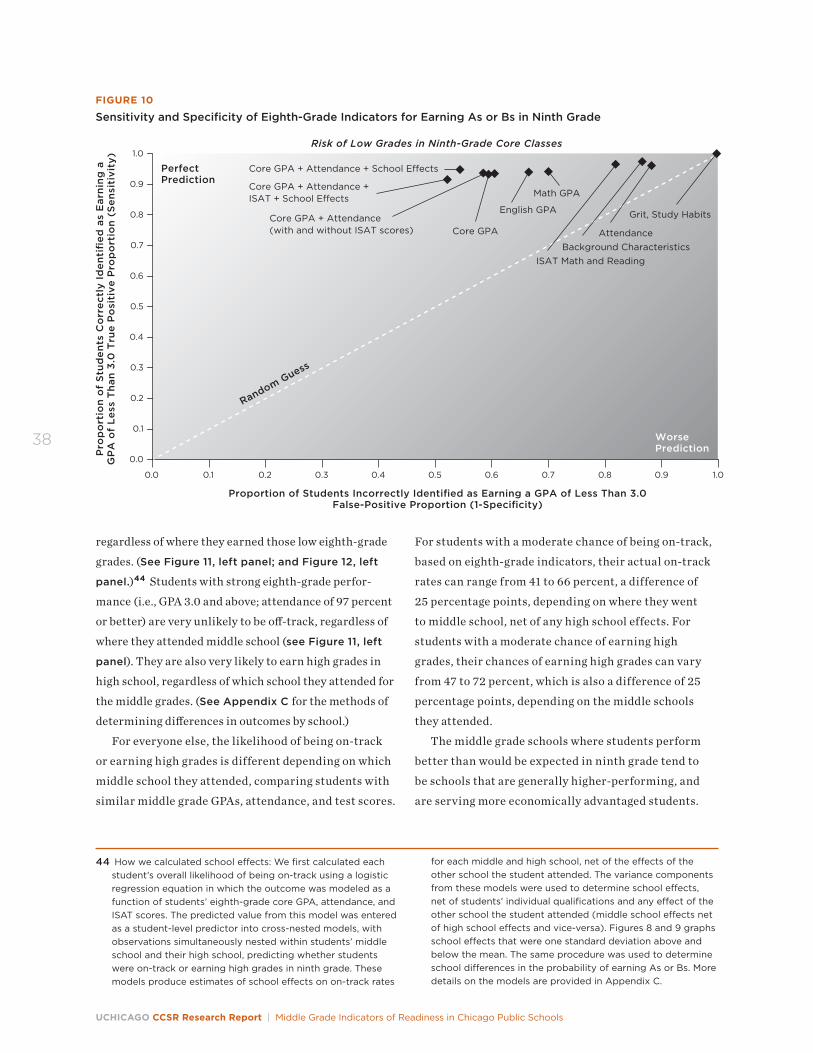
UCHICAGO CCSR Research Report | Middle Grade Indicators of Readiness in Chicago Public Schools
38
regardless of where they earned those low eighth-grade
grades. (See Figure 11, left panel; and Figure 12, left
panel.)44 Students with strong eighth-grade perfor-
mance (i.e., GPA 3.0 and above; attendance of 97 percent
or better) are very unlikely to be off-track, regardless of
where they attended middle school (see Figure 11, left
panel). They are also very likely to earn high grades in
high school, regardless of which school they attended for
the middle grades. (See Appendix C for the methods of
determining differences in outcomes by school.)
For everyone else, the likelihood of being on-track
or earning high grades is different depending on which
middle school they attended, comparing students with
similar middle grade GPAs, attendance, and test scores.
For students with a moderate chance of being on-track,
based on eighth-grade indicators, their actual on-track
rates can range from 41 to 66 percent, a difference of
25 percentage points, depending on where they went
to middle school, net of any high school effects. For
students with a moderate chance of earning high
grades, their chances of earning high grades can vary
from 47 to 72 percent, which is also a difference of 25
percentage points, depending on the middle schools
they attended.
The middle grade schools where students perform
better than would be expected in ninth grade tend to
be schools that are generally higher-performing, and
are serving more economically advantaged students.
44 How we calculated school effects: We first calculated each student’s overall likelihood of being on-track using a logistic regression equation in which the outcome was modeled as a function of students’ eighth-grade core GPA, attendance, and ISAT scores. The predicted value from this model was entered as a student-level predictor into cross-nested models, with observations simultaneously nested within students’ middle school and their high school, predicting whether students were on-track or earning high grades in ninth grade. These models produce estimates of school effects on on-track rates
for each middle and high school, net of the effects of the other school the student attended. The variance components from these models were used to determine school effects, net of students’ individual qualifications and any effect of the other school the student attended (middle school effects net of high school effects and vice-versa). Figures 8 and 9 graphs school effects that were one standard deviation above and below the mean. The same procedure was used to determine school differences in the probability of earning As or Bs. More details on the models are provided in Appendix C.
Proportion of Students Incorrectly Identified as Earning a GPA of Less Than 3.0False-Positive Proportion (1-Specificity)
FIGURE 10
Sensitivity and Specificity of Eighth-Grade Indicators for Earning As or Bs in Ninth GradeP
rop
ort
ion
of
Stu
den
ts C
orr
ectl
y Id
enti
fied
as
Ear
nin
g a
GP
A o
f L
ess
Th
an 3
.0 T
rue
Po
siti
ve P
rop
ort
ion
(S
ensi
tivi
ty)
0.9
1.0
0.8
0.7
0.4
0.2
0.0
0.6
0.3
0.1
0.5
Perfect Prediction
WorsePrediction
Random Guess
Core GPA + Attendance + School E�ects
Core GPA + Attendance + ISAT + School E�ects
Core GPA + Attendance (with and without ISAT scores) Core GPA
English GPA
Math GPA
Attendance
ISAT Math and ReadingBackground Characteristics
Grit, Study Habits
Risk of Low Grades in Ninth-Grade Core Classes
0.9 1.00.80.70.40.20.0 0.60.30.1 0.5
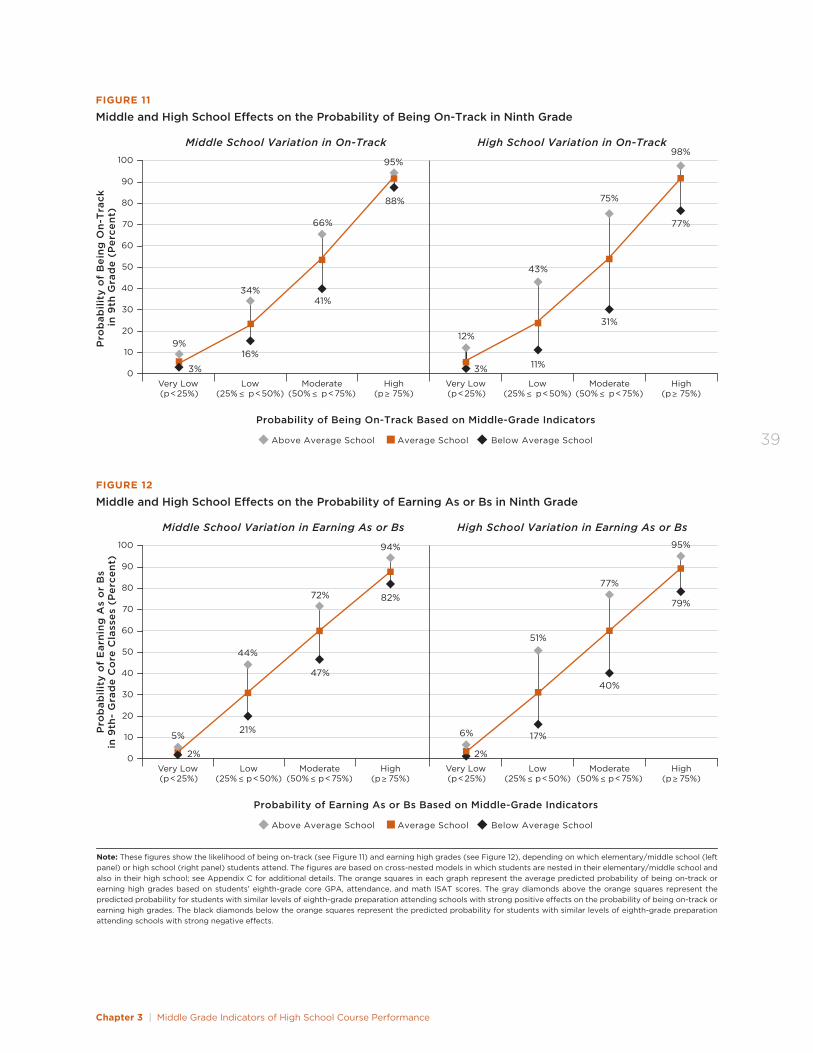
Chapter 3 | Middle Grade Indicators of High School Course Performance
39Probability of Being On-Track Based on Middle-Grade Indicators
FIGURE 11
Middle and High School E�ects on the Probability of Being On-Track in Ninth Grade
3%
34%
16%
66%
41%
9%
88%
95%
Pro
bab
ility
of
Bei
ng
On
-Tra
ck
in 9
th G
rad
e (P
erce
nt)
100
90
80
70
40
20
0
60
30
10
50
Very Low(p<25%)
High(p≥ 75%)
Low(25% ≤ p<50%)
Moderate(50% ≤ p<75%)
Very Low(p<25%)
High(p≥ 75%)
Low(25% ≤ p<50%)
Moderate(50% ≤ p<75%)
Note: These figures show the likelihood of being on-track (see Figure 9) and earning high grades (see Figure 10), depending on which elementary/middle school (left panel) or high school (right panel) students attend. The figures are based on cross-nested models in which students are nested in their elementary/middle school and also in their high school; see Appendix C for additional details. The orange squares in each graph represent the average predicted probability of being on-track or earning high grades based on students’ eighth-grade core GPA, attendance, and math ISAT scores. The gray diamonds above the orange squares represent the predicted probability for students with similar levels of eighth-grade preparation attending schools with strong positive e�ects on the probability of being on-track or earning high grades. The black diamonds below the orange squares represent the predicted probability for students with similar levels of eighth grade preparation attending schools with strong negative e�ects.
Above Average School Average School Below Average School
3%
43%
11%
75%
31%12%
77%
98%Middle School Variation in On-Track High School Variation in On-Track
Probability of Earning As or Bs Based on Middle-Grade Indicators
FIGURE 12
Middle and High School E�ects on the Probability of Earning As or Bs in Ninth Grade
2%
44%
21%
72%
47%
5%
82%
94%
Pro
bab
ility
of
Ear
nin
g A
s o
r B
sin
9th
- G
rad
e C
ore
Cla
sses
(P
erce
nt)
100
90
80
70
40
20
0
60
30
10
50
Very Low(p<25%)
High(p≥ 75%)
Low(25% ≤ p<50%)
Moderate(50% ≤ p<75%)
Very Low(p<25%)
High(p≥ 75%)
Low(25% ≤ p<50%)
Moderate(50% ≤ p<75%)
Note: These figures show the likelihood of being on-track (see Figure 11) and earning high grades (see Figure 12), depending on which elementary/middle school (left panel) or high school (right panel) students attend. The figures are based on cross-nested models in which students are nested in their elementary/middle school and also in their high school; see Appendix C for additional details. The orange squares in each graph represent the average predicted probability of being on-track or earning high grades based on students’ eighth-grade core GPA, attendance, and math ISAT scores. The gray diamonds above the orange squares represent the predicted probability for students with similar levels of eighth-grade preparation attending schools with strong positive e�ects on the probability of being on-track or earning high grades. The black diamonds below the orange squares represent the predicted probability for students with similar levels of eighth-grade preparation attending schools with strong negative e�ects.
Above Average School Average School Below Average School
2%
51%
17%
77%
40%
6%
79%
95%
Middle School Variation in Earning As or Bs High School Variation in Earning As or Bs
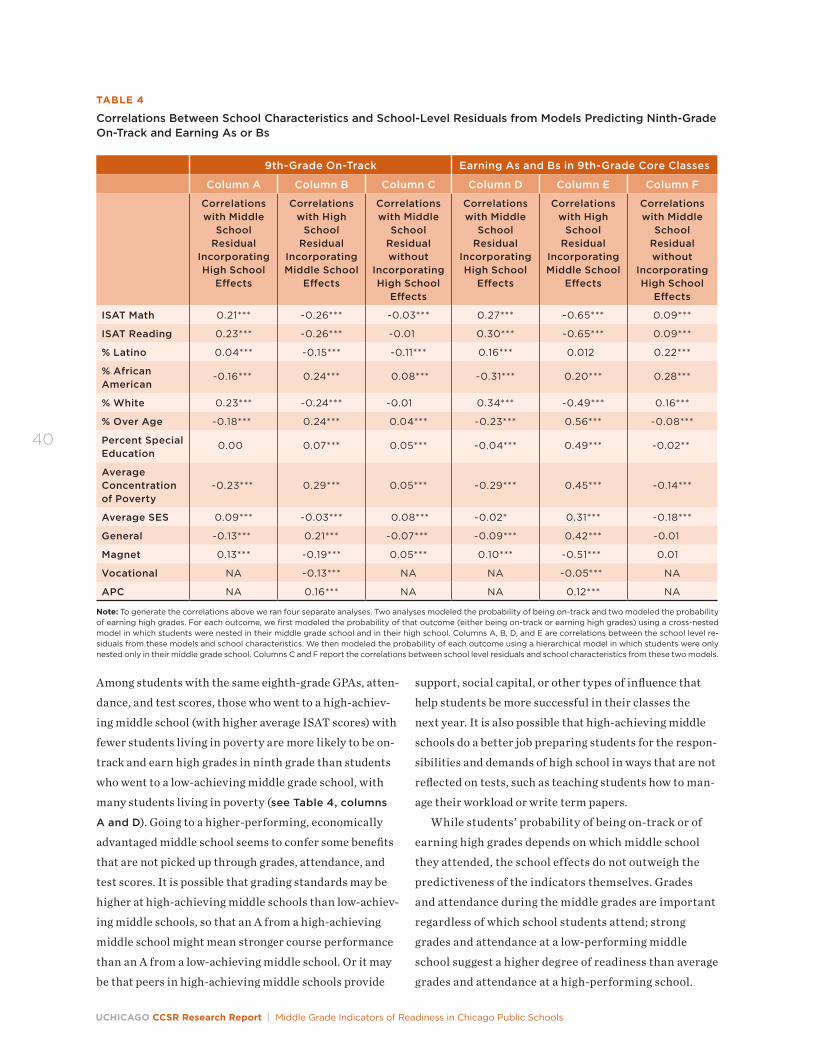
UCHICAGO CCSR Research Report | Middle Grade Indicators of Readiness in Chicago Public Schools
40
TABLE 4
Correlations Between School Characteristics and School-Level Residuals from Models Predicting Ninth-Grade On-Track and Earning As or Bs
9th-Grade On-Track Earning As and Bs in 9th-Grade Core Classes
Column A Column B Column C Column D Column E Column F
Correlations with Middle
School Residual
Incorporating High School
Effects
Correlations with High
School Residual
Incorporating Middle School
Effects
Correlations with Middle
School Residual without
Incorporating High School
Effects
Correlations with Middle
School Residual
Incorporating High School
Effects
Correlations with High
School Residual
Incorporating Middle School
Effects
Correlations with Middle
School Residual without
Incorporating High School
Effects
ISAT Math 0.21*** -0.26*** -0.03*** 0.27*** -0.65*** 0.09***
ISAT Reading 0.23*** -0.26*** -0.01 0.30*** -0.65*** 0.09***
% Latino 0.04*** -0.15*** -0.11*** 0.16*** 0.012 0.22***
% African American
-0.16*** 0.24*** 0.08*** -0.31*** 0.20*** 0.28***
% White 0.23*** -0.24*** -0.01 0.34*** -0.49*** 0.16***
% Over Age -0.18*** 0.24*** 0.04*** -0.23*** 0.56*** -0.08***
Percent Special Education
0.00 0.07*** 0.05*** -0.04*** 0.49*** -0.02**
Average Concentration of Poverty
-0.23***
0.29***
0.05***
-0.29***
0.45***
-0.14***
Average SES 0.09*** -0.03*** 0.08*** -0.02* 0.31*** -0.18***
General -0.13*** 0.21*** -0.07*** -0.09*** 0.42*** -0.01
Magnet 0.13*** -0.19*** 0.05*** 0.10*** -0.51*** 0.01
Vocational NA -0.13*** NA NA -0.05*** NA
APC NA 0.16*** NA NA 0.12*** NA
Note: To generate the correlations above we ran four separate analyses. Two analyses modeled the probability of being on-track and two modeled the probability of earning high grades. For each outcome, we first modeled the probability of that outcome (either being on-track or earning high grades) using a cross-nested model in which students were nested in their middle grade school and in their high school. Columns A, B, D, and E are correlations between the school level re-siduals from these models and school characteristics. We then modeled the probability of each outcome using a hierarchical model in which students were only nested only in their middle grade school. Columns C and F report the correlations between school level residuals and school characteristics from these two models.
Among students with the same eighth-grade GPAs, atten-
dance, and test scores, those who went to a high-achiev-
ing middle school (with higher average ISAT scores) with
fewer students living in poverty are more likely to be on-
track and earn high grades in ninth grade than students
who went to a low-achieving middle grade school, with
many students living in poverty (see Table 4, columns
A and D). Going to a higher-performing, economically
advantaged middle school seems to confer some benefits
that are not picked up through grades, attendance, and
test scores. It is possible that grading standards may be
higher at high-achieving middle schools than low-achiev-
ing middle schools, so that an A from a high-achieving
middle school might mean stronger course performance
than an A from a low-achieving middle school. Or it may
be that peers in high-achieving middle schools provide
support, social capital, or other types of influence that
help students be more successful in their classes the
next year. It is also possible that high-achieving middle
schools do a better job preparing students for the respon-
sibilities and demands of high school in ways that are not
reflected on tests, such as teaching students how to man-
age their workload or write term papers.
While students’ probability of being on-track or of
earning high grades depends on which middle school
they attended, the school effects do not outweigh the
predictiveness of the indicators themselves. Grades
and attendance during the middle grades are important
regardless of which school students attend; strong
grades and attendance at a low-performing middle
school suggest a higher degree of readiness than average
grades and attendance at a high-performing school.
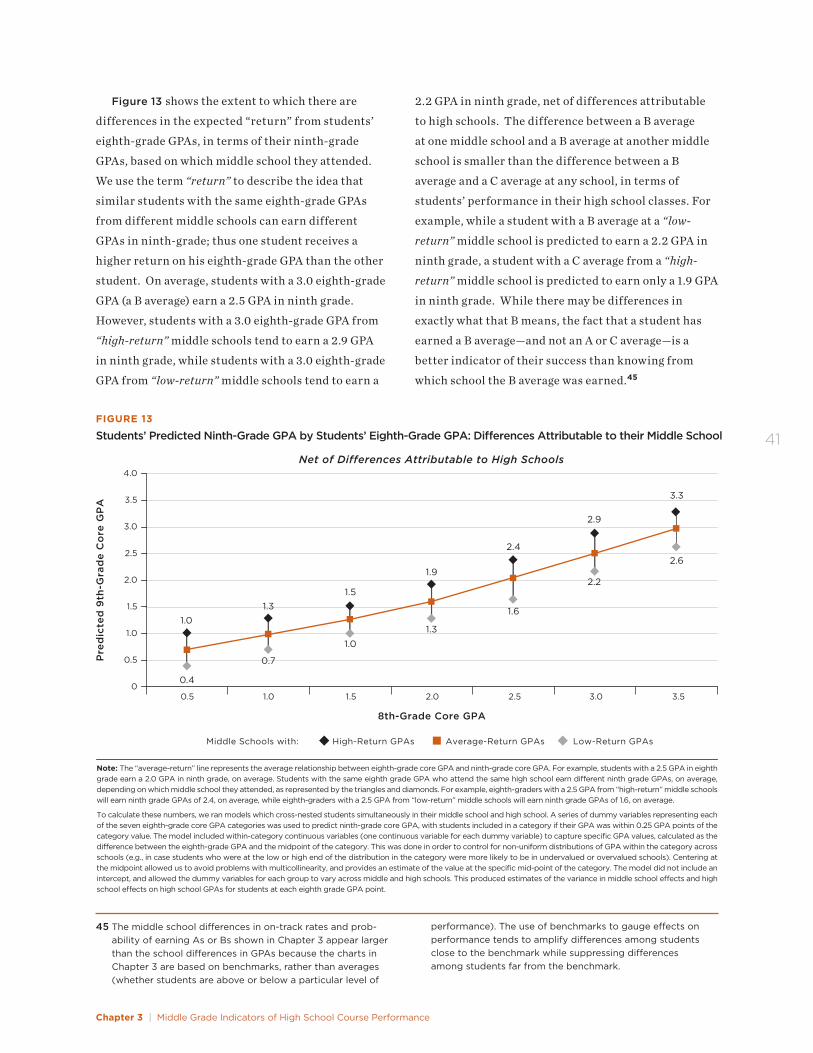
Chapter 3 | Middle Grade Indicators of High School Course Performance
41
2.2 GPA in ninth grade, net of differences attributable
to high schools. The difference between a B average
at one middle school and a B average at another middle
school is smaller than the difference between a B
average and a C average at any school, in terms of
students’ performance in their high school classes. For
example, while a student with a B average at a “low-
return” middle school is predicted to earn a 2.2 GPA in
ninth grade, a student with a C average from a “high-
return” middle school is predicted to earn only a 1.9 GPA
in ninth grade. While there may be differences in
exactly what that B means, the fact that a student has
earned a B average—and not an A or C average—is a
better indicator of their success than knowing from
which school the B average was earned.45
Figure 13 shows the extent to which there are
differences in the expected “return” from students’
eighth-grade GPAs, in terms of their ninth-grade
GPAs, based on which middle school they attended.
We use the term “return” to describe the idea that
similar students with the same eighth-grade GPAs
from different middle schools can earn different
GPAs in ninth-grade; thus one student receives a
higher return on his eighth-grade GPA than the other
student. On average, students with a 3.0 eighth-grade
GPA (a B average) earn a 2.5 GPA in ninth grade.
However, students with a 3.0 eighth-grade GPA from
“high-return” middle schools tend to earn a 2.9 GPA
in ninth grade, while students with a 3.0 eighth-grade
GPA from “low-return” middle schools tend to earn a
Net of Differences Attributable to High Schools
8th-Grade Core GPA
FIGURE 13
Students’ Predicted Ninth-Grade GPA by Students’ Eighth-Grade GPA: Di�erences Attributable to their Middle School
0.4
1.01.3
0.7
1.5
1.0
1.9
1.3
2.4
1.6
2.9
2.2
3.3
2.6
Pre
dic
ted
9th
-Gra
de
Co
re G
PA
4.0
3.0
3.5
2.0
1.0
0
2.5
1.5
0.5
0.5 1.0 1.5 2.0 2.5 3.0 3.5
Note: The “average-return” line represents the average relationship between eighth-grade core GPA and ninth-grade core GPA. For example, students with a 2.5 GPA in eighth grade earn a 2.0 GPA in ninth grade, on average. Students with the same eighth grade GPA who attend the same high school earn di�erent ninth grade GPAs, on average, depending on which middle school they attended, as represented by the triangles and diamonds. For example, eighth-graders with a 2.5 GPA from “high-return” middle schools will earn ninth grade GPAs of 2.4, on average, while eighth-graders with a 2.5 GPA from “low-return” middle schools will earn ninth grade GPAs of 1.6, on average.
To calculate these numbers, we ran models which cross-nested students simultaneously in their middle school and high school. A series of dummy variables representing each of the seven eighth-grade core GPA categories was used to predict ninth-grade core GPA, with students included in a category if their GPA was within 0.25 GPA points of the category value. The model included within-category continuous variables (one continuous variable for each dummy variable) to capture specific GPA values, calculated as the di�erence between the eighth-grade GPA and the midpoint of the category. This was done in order to control for non-uniform distributions of GPA within the category across schools (e.g., in case students who were at the low or high end of the distribution in the category were more likely to be in undervalued or overvalued schools). Centering at the midpoint allowed us to avoid problems with multicollinearity, and provides an estimate of the value at the specific mid-point of the category. The model did not include an intercept, and allowed the dummy variables for each group to vary across middle and high schools. This produced estimates of the variance in middle school e�ects and high school e�ects on high school GPAs for students at each eighth grade GPA point.
Middle Schools with: High-Return GPAs Average-Return GPAs Low-Return GPAs
45 The middle school differences in on-track rates and prob-ability of earning As or Bs shown in Chapter 3 appear larger than the school differences in GPAs because the charts in Chapter 3 are based on benchmarks, rather than averages (whether students are above or below a particular level of
performance). The use of benchmarks to gauge effects on performance tends to amplify differences among students close to the benchmark while suppressing differences among students far from the benchmark.
UCHICAGO CCSR Research Report | Middle Grade Indicators of Readiness in Chicago Public Schools
42
Where students attend high school makes an even
bigger difference for their likelihood of being on-track
or earning high grades than where they attended middle
school (see Figure 11, right panel; Figure 12, right panel
on p.39). For example, among students with a moder-
ate probability of passing their ninth-grade math class,
based on eighth-grade indicators, their chances of being
on-track varies from 75 percent in some high schools
to 31 percent at other high schools, net of middle school
effects (i.e., comparing similar students from similar
middle schools). High school effects on the likelihood
of earning high grades are comparable to those of being
on-track. Among students with a moderate probabil-
ity of earning high grades, the probability of doing so
ranges from 40 to 77 percent.
When we look at the characteristics of the schools
where students earn higher or lower grades than their
qualifications would predict, we see the opposite pattern
as with the middle grade schools. Students are more
likely to be on-track or earn high grades if they attend
high schools that serve more low-achieving, disadvan-
taged peers, compared to students with similar eighth-
grade qualifications who attend higher-achieving high
schools (see Table 4, columns B and E). This might
result from lower standards at high schools serving
more disadvantaged students with low incoming test
scores, or from grading practices that are based on
comparisons among students (e.g., grading on a curve).46
Students might also feel less capable and withdraw ef-
fort if they attend a school with high-achieving peers
where they feel everyone else is smarter than they are,
or exhibit more self-efficacy and engagement if they are
a strong student relative to their school peers.
Students from high-achieving middle schools are
more likely to attend high-achieving high schools
than are students from low-achieving middle schools.
Thus, there are two contradictory effects on grades that
come from attending a high-achieving middle school—
students do better than their grades, attendance, and
test scores would predict, compared to students from
a low-achieving middle school, but they tend to send
students to high schools where students have a lower
likelihood of passing their classes and earning high
grades. These two school effects cancel each other out.
This can be seen in Table 4, columns C and F, which
show middle school effects inclusive of the effects of
the high schools where the middle schools’ students
tend to enroll. While the correlation of on-track rates
with middle school average math scores is 0.21 net of
high school effects, the correlation is close to zero (-0.03)
when high school effects are included with middle school
effects. The largest school effects would be observed
among students who attend high schools that are atypi-
cal for their middle school. Students who moved from
a strong middle school to a weak high school would
be much more likely to pass in ninth grade than their
middle grade performance would indicate, while
students who moved from a weak middle school to a
strong high school would be much less likely to pass
than their middle grade performance would suggest.
In general, knowing which school students attend
in the middle grades, and which school they attend in
ninth grade, substantially improves the prediction of
their risk of failure. Sophisticated indicator systems
could consider these school effects when calculating
students’ risk of ninth-grade off-track status. As shown
in Figure 7 on p.35, by considering school effects, over
half of students who are off-track in ninth grade can be
identified using eighth-grade indicators. Using eighth-
grade GPA together with attendance and school effects
identifies half of students who will be off-track in ninth
grade, without falsely identifying many as at risk of
being off-track when they are not.
Knowledge of school effects also improves the predic-
tion of which students are at risk for low grades in ninth
grade. As shown in Figure 10 on p.38, incorporation of
school effects reduces the proportion of students falsely
identified as at risk of low grades to about 50 percent.
This may not be low enough to be useful for targeting
students for intervention, but the information might
be used to have discussions with students and families
about students’ risk for low grades and what they can do
to reduce that risk.
Middle Grade Indicators Predict Who Will Be On-Track and Who Will Earn High Grades in Eleventh GradeSo far, this chapter has shown how eighth-grade in-
dicators predict students’ likelihood of being able to
pass their classes and earn high grades in ninth grade.
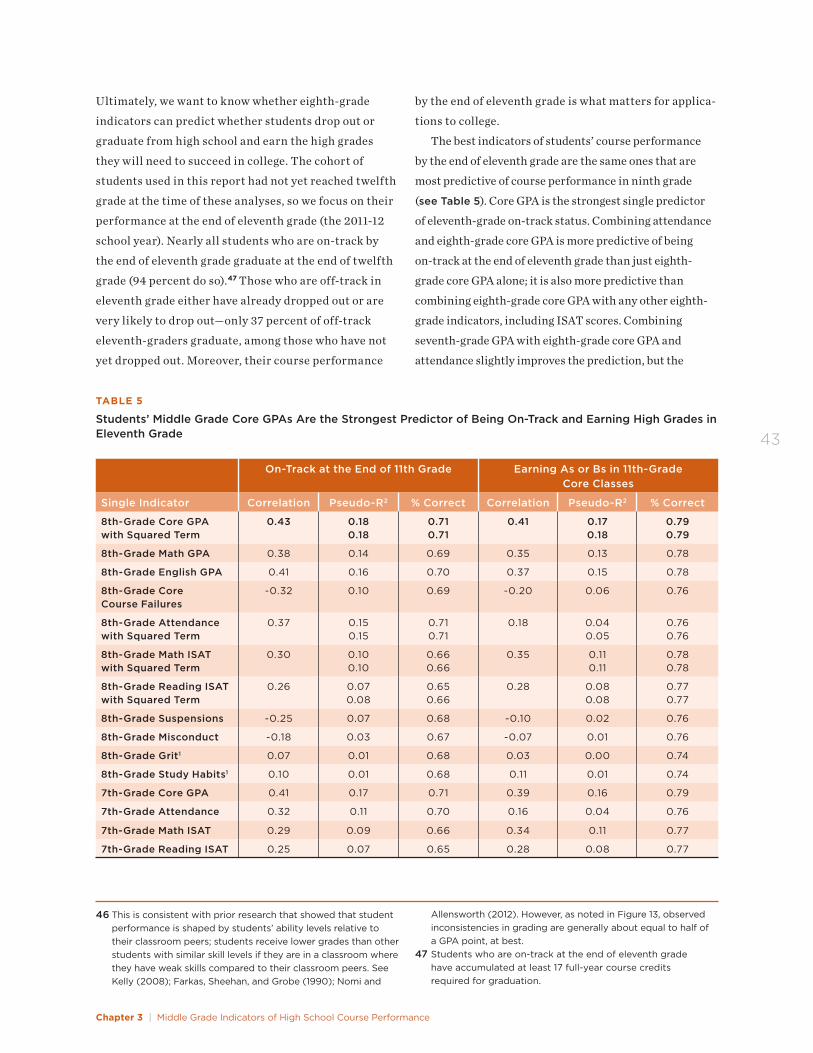
Chapter 3 | Middle Grade Indicators of High School Course Performance
43
46 This is consistent with prior research that showed that student performance is shaped by students’ ability levels relative to their classroom peers; students receive lower grades than other students with similar skill levels if they are in a classroom where they have weak skills compared to their classroom peers. See Kelly (2008); Farkas, Sheehan, and Grobe (1990); Nomi and
Allensworth (2012). However, as noted in Figure 13, observed inconsistencies in grading are generally about equal to half of a GPA point, at best.
47 Students who are on-track at the end of eleventh grade have accumulated at least 17 full-year course credits required for graduation.
TABLE 5
Students’ Middle Grade Core GPAs Are the Strongest Predictor of Being On-Track and Earning High Grades in Eleventh Grade
On-Track at the End of 11th Grade Earning As or Bs in 11th-Grade Core Classes
Single Indicator Correlation Pseudo-R2 % Correct Correlation Pseudo-R2 % Correct
8th-Grade Core GPA with Squared Term
0.43 0.18 0.18
0.71 0.71
0.41 0.17 0.18
0.79 0.79
8th-Grade Math GPA 0.38 0.14 0.69 0.35 0.13 0.78
8th-Grade English GPA 0.41 0.16 0.70 0.37 0.15 0.78
8th-Grade Core Course Failures
-0.32 0.10 0.69 -0.20 0.06 0.76
8th-Grade Attendance with Squared Term
0.37 0.15 0.15
0.71 0.71
0.18 0.04 0.05
0.76 0.76
8th-Grade Math ISAT with Squared Term
0.30 0.10 0.10
0.66 0.66
0.35 0.11 0.11
0.78 0.78
8th-Grade Reading ISAT with Squared Term
0.26 0.07 0.08
0.65 0.66
0.28 0.08 0.08
0.77 0.77
8th-Grade Suspensions -0.25 0.07 0.68 -0.10 0.02 0.76
8th-Grade Misconduct -0.18 0.03 0.67 -0.07 0.01 0.76
8th-Grade Grit1 0.07 0.01 0.68 0.03 0.00 0.74
8th-Grade Study Habits1 0.10 0.01 0.68 0.11 0.01 0.74
7th-Grade Core GPA 0.41 0.17 0.71 0.39 0.16 0.79
7th-Grade Attendance 0.32 0.11 0.70 0.16 0.04 0.76
7th-Grade Math ISAT 0.29 0.09 0.66 0.34 0.11 0.77
7th-Grade Reading ISAT 0.25 0.07 0.65 0.28 0.08 0.77
Ultimately, we want to know whether eighth-grade
indicators can predict whether students drop out or
graduate from high school and earn the high grades
they will need to succeed in college. The cohort of
students used in this report had not yet reached twelfth
grade at the time of these analyses, so we focus on their
performance at the end of eleventh grade (the 2011-12
school year). Nearly all students who are on-track by
the end of eleventh grade graduate at the end of twelfth
grade (94 percent do so).47 Those who are off-track in
eleventh grade either have already dropped out or are
very likely to drop out—only 37 percent of off-track
eleventh-graders graduate, among those who have not
yet dropped out. Moreover, their course performance
by the end of eleventh grade is what matters for applica-
tions to college.
The best indicators of students’ course performance
by the end of eleventh grade are the same ones that are
most predictive of course performance in ninth grade
(see Table 5). Core GPA is the strongest single predictor
of eleventh-grade on-track status. Combining attendance
and eighth-grade core GPA is more predictive of being
on-track at the end of eleventh grade than just eighth-
grade core GPA alone; it is also more predictive than
combining eighth-grade core GPA with any other eighth-
grade indicators, including ISAT scores. Combining
seventh-grade GPA with eighth-grade core GPA and
attendance slightly improves the prediction, but the
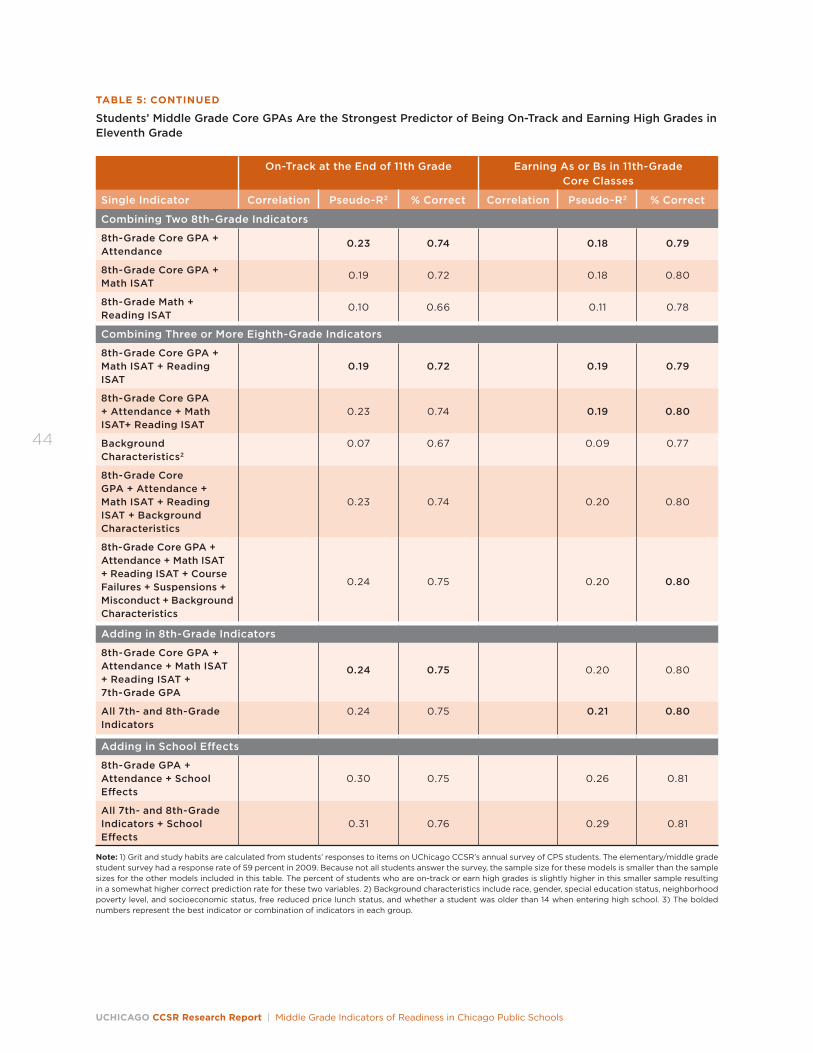
UCHICAGO CCSR Research Report | Middle Grade Indicators of Readiness in Chicago Public Schools
44
On-Track at the End of 11th Grade Earning As or Bs in 11th-Grade Core Classes
Single Indicator Correlation Pseudo-R2 % Correct Correlation Pseudo-R2 % Correct
Combining Two 8th-Grade Indicators
8th-Grade Core GPA + Attendance
0.23 0.74 0.18 0.79
8th-Grade Core GPA + Math ISAT
0.19 0.72 0.18 0.80
8th-Grade Math + Reading ISAT
0.10 0.66 0.11 0.78
Combining Three or More Eighth-Grade Indicators
8th-Grade Core GPA + Math ISAT + Reading ISAT
0.19
0.72
0.19
0.79
8th-Grade Core GPA + Attendance + Math ISAT+ Reading ISAT
0.23
0.74
0.19
0.80
Background Characteristics2
0.07 0.67 0.09 0.77
8th-Grade Core GPA + Attendance + Math ISAT + Reading ISAT + Background Characteristics
0.23
0.74
0.20
0.80
8th-Grade Core GPA + Attendance + Math ISAT + Reading ISAT + Course Failures + Suspensions + Misconduct + Background Characteristics
0.24 0.75
0.20 0.80
Adding in 8th-Grade Indicators
8th-Grade Core GPA + Attendance + Math ISAT + Reading ISAT + 7th-Grade GPA
0.24 0.75
0.20 0.80
All 7th- and 8th-Grade Indicators
0.24 0.75 0.21 0.80
Adding in School Effects
8th-Grade GPA + Attendance + School Effects
0.30
0.75
0.26
0.81
All 7th- and 8th-Grade Indicators + School Effects
0.31
0.76
0.29
0.81
Note: 1) Grit and study habits are calculated from students’ responses to items on UChicago CCSR’s annual survey of CPS students. The elementary/middle grade student survey had a response rate of 59 percent in 2009. Because not all students answer the survey, the sample size for these models is smaller than the sample sizes for the other models included in this table. The percent of students who are on-track or earn high grades is slightly higher in this smaller sample resulting in a somewhat higher correct prediction rate for these two variables. 2) Background characteristics include race, gender, special education status, neighborhood poverty level, and socioeconomic status, free reduced price lunch status, and whether a student was older than 14 when entering high school. 3) The bolded numbers represent the best indicator or combination of indicators in each group.
TABLE 5: CONTINUED
Students’ Middle Grade Core GPAs Are the Strongest Predictor of Being On-Track and Earning High Grades in Eleventh Grade
Chapter 3 | Middle Grade Indicators of High School Course Performance
45
improvement in prediction from a pseudo-R2 of 0.23
to 0.24 may not warrant a more complicated indicator
system that comes from using three indicators versus
two indicators.
Core GPA is also the best single predictor of whether
students earn As or Bs in eleventh grade (see Table 5).
Combining eighth-grade core GPA with attendance,
ISAT scores, or seventh-grade GPA only somewhat im-
proves the prediction of who earns As or Bs over using
eighth-grade core GPA alone, most likely because the
combination of predictors only differentiates between
students who have earned very high grades.
SummaryEighth-grade core GPA is the strongest single predic-
tor of on-track status and earning high grades in high
school. Students’ grades across all subjects are more
predictive of their grade in a specific class (math or
English) than their prior grade in the corresponding
subject. Combining core GPA with attendance, or with
seventh-grade GPA, gives an even better prediction of
who will be on-track at the end of ninth grade, or earn
high grades, than core GPA alone.
Test scores, either alone or in combination with core
GPA, are not all that predictive of who is on-track at the
end of ninth grade. This may seem counter-intuitive
because test scores are often the primary focus in
policy discussions about improving educational attain-
ment and they often are used to identify students in
need of additional academic support. Often overlooked,
attendance rates and GPA in earlier grades are much
better for identifying who will fail their classes and be
off-track at the end of ninth grade.
Eighth-grade test scores do help predict who will
get high grades in high school, but only among students
who already were getting high grades in middle school.
Attendance provides even more information about who
will get high grades in high school, among students with
high prior grades, than test scores. Neither test scores
nor attendance provide much information about who
will earn high grades in high school among students
who had a 2.0 or below in eighth grade, in part, because
it is so unlikely that students with low grades in middle
school will earn high grades in high school.
Combinations of three or more indicators do not
considerably improve the prediction of who is on-track
or who earns high grades over predictions based on
only two indicators (grades and attendance), suggesting
that a complex system incorporating multiple indica-
tors will not provide much more information than only
two indicators. Knowing where students went to middle
and high school, however, does substantially improve
the prediction of whether students will be on-track or
earn high grades.
Although middle grade indicators cannot identify
all students who are at risk of being off-track, they
can be used to identify a subset of students who are
at high risk of ninth-grade failure. About half of
students who are off-track in the ninth grade can be
identified accurately with middle grade predictors—
few of the students who are identified as at risk succeed.
Resources devoted to intervention for these students
would not be wasted on students who would succeed
without any intervention. The next chapter examines
what middle grade indicators tell us about who is likely
to be off-track by the end of ninth grade.

46

Chapter 4 | Who Is at Risk of Being Off-Track at the End of Ninth Grade?
47
CHAPTER 4
Who Is at Risk of Being Off-Track at the End of Ninth Grade?
This chapter shows students’ risk of failing based on their middle grade records. This information could be used by school practi-tioners to identify students who are at high risk of failure and to discuss goals for student perfor-mance with both students and their families.
The previous chapter showed that eighth-grade core
GPA and attendance together provide the best parsimo-
nious prediction of ninth-grade failure and being off-
track for graduation, of all of the potential indicators
that were examined; other metrics, such as subject-spe-
cific grades, test scores, and background characteris-
tics, do not provide more information beyond students’
core grades and attendance. The prediction is far from
perfect; students’ experiences in ninth grade determine
whether they pass their ninth-grade classes and remain
on-track for graduation. But eighth-grade indicators
can identify subsets of students who are at high risk
or very high risk of being off-track by the end of ninth
grade. In this chapter, we used eighth-grade core GPA,
eighth-grade attendance, and eighth-grade ISAT scores
to identify how many students were at risk of being
off-track and failing in high school. We included ISAT
scores in the prediction to be sure that the risk groups
include students with similar tested skill levels, as well
as similar course performance and attendance.
To design intervention systems, schools need to
know the magnitude of the level of risk of their stu-
dents—how many students are at some risk of failing,
and how many are at very high risk of failing. Students
with different levels of risk may need different inter-
ventions, and there are cost constraints as to how many
students can be targeted with extra resources. Students
with very high risk are almost certain to fail without
intervention; yet, because they are at very high risk,
their outcomes may be very difficult to change unless
substantial resources are allocated to them. Students
with moderate or low risk may succeed without any
intervention; but they may need only a modest interven-
tion to succeed, and a sizable group will fail without any
support. The decision about how to allocate resources
hinges on how many students are identified as being at
different levels of risk.
Students’ Risk of Being Off-Track by Middle Grade Indicators
Eighth-grade students with less than 80 percent
attendance or GPAs less than 1.0 are at extremely
high risk of being off-track in ninth grade. In
Chicago, about 5 percent of middle grade students
can be identified as being at very high risk of being
off-track in the ninth grade, based on their eighth-
grade GPA and attendance (see Figure 14). These are
students with extremely low grades and attendance in
the middle grades.
Eighth-grade students with C/D averages and chronic
absence in middle school are at high risk of being
off-track in ninth grade. Around 16 percent of students
can be identified as being at high risk of being off-track
(see Figure 14). These students are more likely to be
off-track than on-track in high school; they have a 50 to
75 percent likelihood of being off-track. They had very
poor performance in eighth grade, with an average GPA
of 1.5 (a combination of Ds and Cs). Their attendance
was better than students at extremely high risk of being
off-track—they came to school 91 percent of the time,
on average. Many of them they were still chronically
absent, however, missing more than five weeks of school
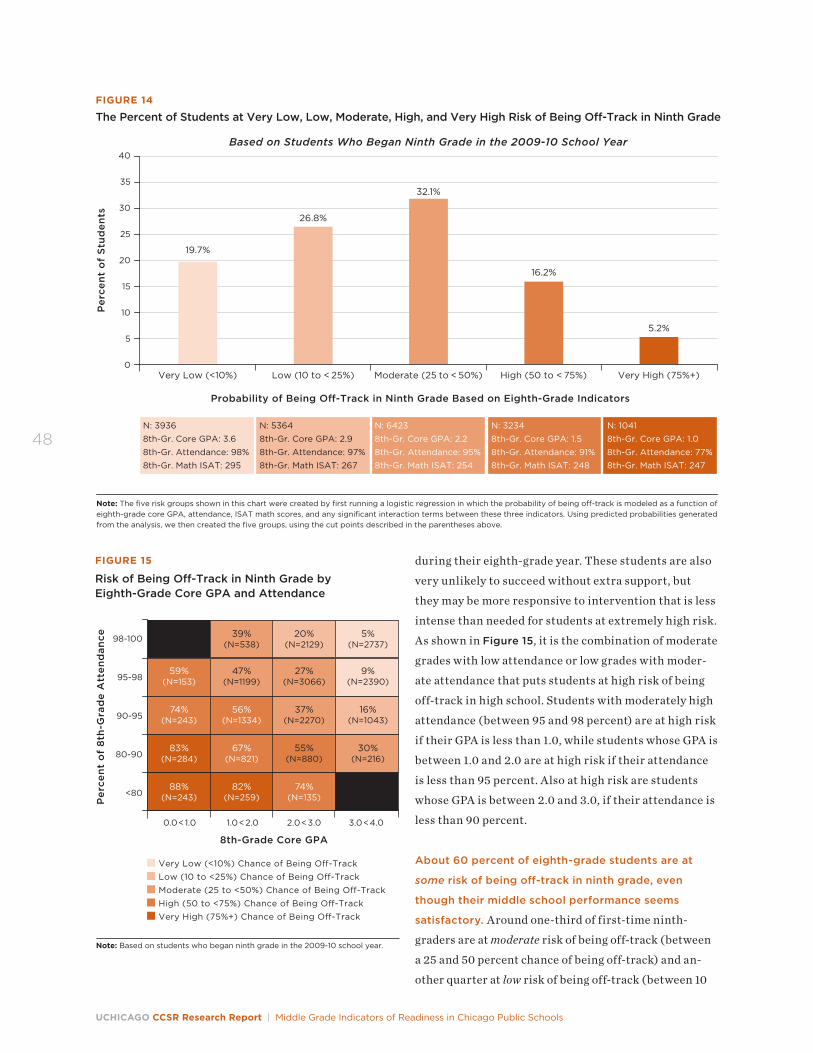
UCHICAGO CCSR Research Report | Middle Grade Indicators of Readiness in Chicago Public Schools
48
during their eighth-grade year. These students are also
very unlikely to succeed without extra support, but
they may be more responsive to intervention that is less
intense than needed for students at extremely high risk.
As shown in Figure 15, it is the combination of moderate
grades with low attendance or low grades with moder-
ate attendance that puts students at high risk of being
off-track in high school. Students with moderately high
attendance (between 95 and 98 percent) are at high risk
if their GPA is less than 1.0, while students whose GPA is
between 1.0 and 2.0 are at high risk if their attendance
is less than 95 percent. Also at high risk are students
whose GPA is between 2.0 and 3.0, if their attendance is
less than 90 percent.
About 60 percent of eighth-grade students are at
some risk of being off-track in ninth grade, even
though their middle school performance seems
satisfactory. Around one-third of first-time ninth-
graders are at moderate risk of being off-track (between
a 25 and 50 percent chance of being off-track) and an-
other quarter at low risk of being off-track (between 10
Per
cen
t o
f S
tud
ents
40
20
15
10
0
30
25
35
FIGURE 14
The Percent of Students at Very Low, Low, Moderate, High, and Very High Risk of Being O�-Track in Ninth Grade
5
19.7%
26.8%
32.1%
16.2%
5.2%
Based on Students Who Began Ninth Grade in the 2009-10 School Year
Note: The five risk groups shown in this chart were created by first running a logistic regression in which the probability of being o�-track is modeled as a function of eighth-grade core GPA, attendance, ISAT math scores, and any significant interaction terms between these three indicators. Using predicted probabilities generated from the analysis, we then created the five groups, using the cut points described in the parentheses above.
N: 39368th-Gr. Core GPA: 3.68th-Gr. Attendance: 98%8th-Gr. Math ISAT: 295
N: 53648th-Gr. Core GPA: 2.98th-Gr. Attendance: 97%8th-Gr. Math ISAT: 267
N: 64238th-Gr. Core GPA: 2.28th-Gr. Attendance: 95%8th-Gr. Math ISAT: 254
N: 32348th-Gr. Core GPA: 1.58th-Gr. Attendance: 91%8th-Gr. Math ISAT: 248
N: 10418th-Gr. Core GPA: 1.08th-Gr. Attendance: 77%8th-Gr. Math ISAT: 247
Very Low (<10%) Low (10 to < 25%) Moderate (25 to < 50%) High (50 to < 75%) Very High (75%+)
Probability of Being O�-Track in Ninth Grade Based on Eighth-Grade Indicators
Per
cen
t o
f 8
th-G
rad
e A
tten
dan
ce 98-100
95-98
90-95
80-90
<80
0.0<1.0 1.0<2.0 2.0<3.0 3.0<4.0
Very Low (<10%) Chance of Being O�-TrackLow (10 to <25%) Chance of Being O�-TrackModerate (25 to <50%) Chance of Being O�-TrackHigh (50 to <75%) Chance of Being O�-TrackVery High (75%+) Chance of Being O�-Track
8th-Grade Core GPA
39%(N=538)
20%(N=2129)
5%(N=2737)
47%(N=1199)
59%(N=153)
27%(N=3066)
9%(N=2390)
56%(N=1334)
74%(N=243)
37%(N=2270)
16%(N=1043)
67%(N=821)
83%(N=284)
55%(N=880)
82%(N=259)
88%(N=243)
74%(N=135)
30%(N=216)
FIGURE 15
Risk of Being O�-Track in Ninth Grade by Eighth-Grade Core GPA and Attendance
Note: Based on students who began ninth grade in the 2009-10 school year.
Chapter 4 | Who Is at Risk of Being Off-Track at the End of Ninth Grade?
49
and 25 percent). Students with a moderate risk of being
off-track had about a C average in eighth grade and 95
percent attendance (see Figure 14). Students who were
at low risk of being off-track had a B- GPA and 97 percent
attendance, on average. While the risk of being off-track
is not high for these two groups, because of their size,
these two groups account for just over half of all stu-
dents who were off-track at the end of ninth grade:
37 percent of all students who were off-track in ninth
grade were at moderate risk, while 15 percent were at
low risk based on their eighth-grade performance.
Because of the size of the moderate- and low-risk
groups, costly interventions would be impractical. Even
though these students are not at high risk of being off-
track, they are at some risk, and modest efforts around
attendance improvement could have big pay-offs in the
long run because so many students are in these two
groups. Such interventions might include conversations
with students and parents about their risk of failing in
high school, lowering risk with better attendance and
effort, teaching strategies for help-seeking and support
when they are in high school, and discussions about
parental monitoring through the transition to high
school. These students need to be closely monitored in
the transition to high school; otherwise, many will show
declining attendance and effort in ninth grade.
Only about one-fifth of students have very little
risk of being off-track in ninth grade—students
with a B average or higher and 95 percent or better
attendance in middle school. There are some stu-
dents whose risk of falling off-track to graduation is 10
percent or lower. These are students whose GPA was
a 3.0 or better, and whose attendance was 95 percent
or above in eighth grade. Even though being on-track
for graduation is a very low bar for judging high school
performance, few students leave middle school assured
of being ready to meet this basic expectation.
The signals for students’ risk of failing either ninth-
grade English or math are the same as those for being
off-track. English and math are subjects of primary
concern to educators, as reading and math skills pro-
vide a base for learning in other subjects. The previous
chapter showed that students’ prior grades in English
or math, or their test scores in reading or math, were
not any more predictive of their ninth-grade grades
in either specific subject than their overall GPA and
attendance rate. Based on eighth-grade performance,
around 11 percent of ninth-grade students are at high or
very high risk of failing math, and 12 percent are at high
or very high risk for failing English (see Figures 16 and
17). Students who are at high or very high risk of failing
math or English had about a 1.2 GPA in eighth grade and
85 percent attendance, on average.
Students’ Risk of Being Off-Track in Ninth Grade Carries On to Eleventh GradeThe same middle grade indicators that predict ninth-
grade on-track status also predict whether students are
on-track to graduate by the end of eleventh grade, where
on-track in eleventh grade is defined as having suffi-
cient credits to be a twelfth-grader the following year
and still enrolled in school. Thus, middle grade indica-
tors can be used to identify students who are at great
risk of dropping out before they start high school. In
fact, students’ likelihood of being on-track in eleventh
grade is similar to their likelihood of being on-track in
ninth grade, based on their eighth-grade records.
Low grades and poor attendance in middle grades
indicate students are unlikely to graduate. Students
with less than a 1.0 eighth-grade GPA are at high risk of
being off-track when they finish ninth grade, and also
at the end of eleventh grade (see Figure 18). Only about
a quarter (26 percent) of students with an eighth-grade
GPA that is less than 1.0 are on-track when they finish
ninth grade and about a quarter (22 percent) are still
on-track at the end of eleventh grade. Students with
higher eighth-grade GPAs have higher likelihoods of
being on-track in both ninth and eleventh grades, and
the probability is similar in both years because ninth-
grade performance is very indicative of performance
through the remaining high school years.
The same general pattern can be seen in Figure 19,
which shows ninth- and eleventh-grade on-track rates
by eighth-grade attendance. Students with less than 80
percent attendance are extremely likely to be off-track
for graduation in both ninth grade and eleventh grade;
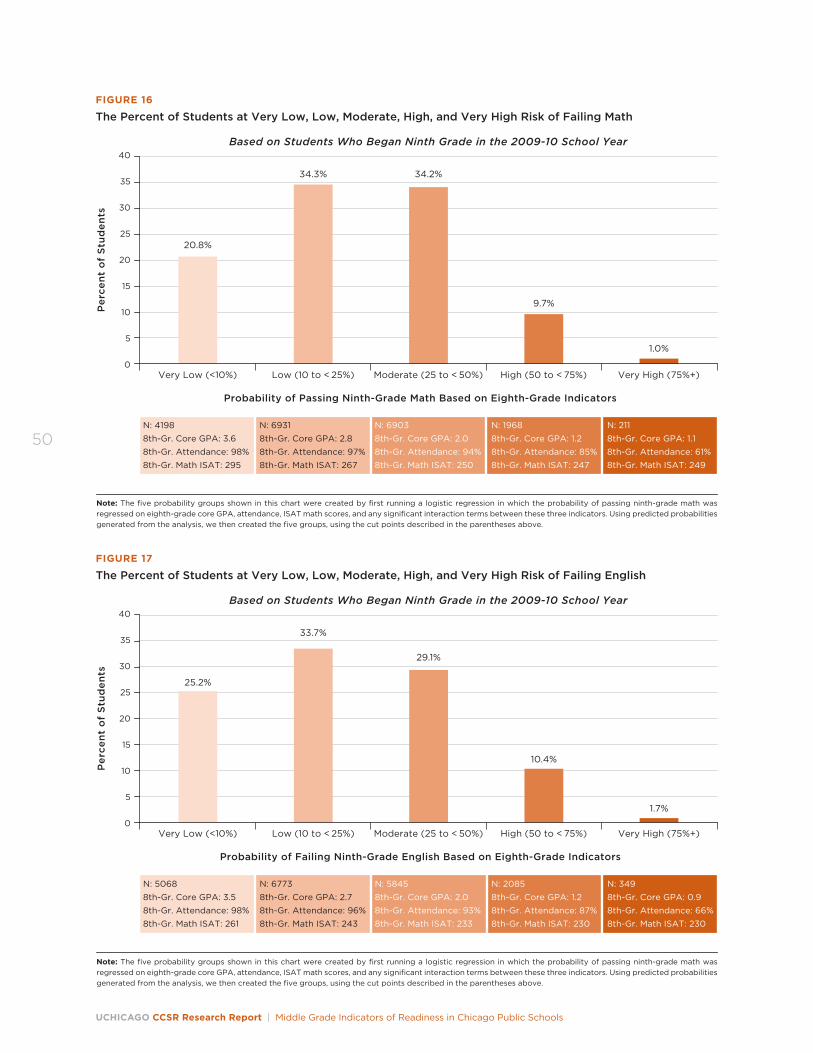
UCHICAGO CCSR Research Report | Middle Grade Indicators of Readiness in Chicago Public Schools
50
Per
cen
t o
f S
tud
ents
40
20
15
10
0
30
25
35
FIGURE 16
The Percent of Students at Very Low, Low, Moderate, High, and Very High Risk of Failing Math
5
20.8%
34.3% 34.2%
9.7%
1.0%
Based on Students Who Began Ninth Grade in the 2009-10 School Year
Note: The five probability groups shown in this chart were created by first running a logistic regression in which the probability of passing ninth-grade math was regressed on eighth-grade core GPA, attendance, ISAT math scores, and any significant interaction terms between these three indicators. Using predicted probabilities generated from the analysis, we then created the five groups, using the cut points described in the parentheses above.
N: 41988th-Gr. Core GPA: 3.68th-Gr. Attendance: 98%8th-Gr. Math ISAT: 295
N: 69318th-Gr. Core GPA: 2.88th-Gr. Attendance: 97%8th-Gr. Math ISAT: 267
N: 69038th-Gr. Core GPA: 2.08th-Gr. Attendance: 94%8th-Gr. Math ISAT: 250
N: 19688th-Gr. Core GPA: 1.28th-Gr. Attendance: 85%8th-Gr. Math ISAT: 247
N: 2118th-Gr. Core GPA: 1.18th-Gr. Attendance: 61%8th-Gr. Math ISAT: 249
Very Low (<10%) Low (10 to < 25%) Moderate (25 to < 50%) High (50 to < 75%) Very High (75%+)
Probability of Passing Ninth-Grade Math Based on Eighth-Grade Indicators
Per
cen
t o
f S
tud
ents
40
20
15
10
0
30
25
35
FIGURE 17
The Percent of Students at Very Low, Low, Moderate, High, and Very High Risk of Failing English
5
Very Low (<10%)
25.2%
Low (10 to < 25%)
33.7%
Moderate (25 to < 50%)
29.1%
High (50 to < 75%)
10.4%
Very High (75%+)
1.7%
Based on Students Who Began Ninth Grade in the 2009-10 School Year
Note: The five probability groups shown in this chart were created by first running a logistic regression in which the probability of passing ninth-grade math was regressed on eighth-grade core GPA, attendance, ISAT math scores, and any significant interaction terms between these three indicators. Using predicted probabilities generated from the analysis, we then created the five groups, using the cut points described in the parentheses above.
N: 50688th-Gr. Core GPA: 3.58th-Gr. Attendance: 98%8th-Gr. Math ISAT: 261
N: 67738th-Gr. Core GPA: 2.78th-Gr. Attendance: 96%8th-Gr. Math ISAT: 243
N: 58458th-Gr. Core GPA: 2.08th-Gr. Attendance: 93%8th-Gr. Math ISAT: 233
N: 20858th-Gr. Core GPA: 1.28th-Gr. Attendance: 87%8th-Gr. Math ISAT: 230
N: 3498th-Gr. Core GPA: 0.98th-Gr. Attendance: 66%8th-Gr. Math ISAT: 230
Probability of Failing Ninth-Grade English Based on Eighth-Grade Indicators
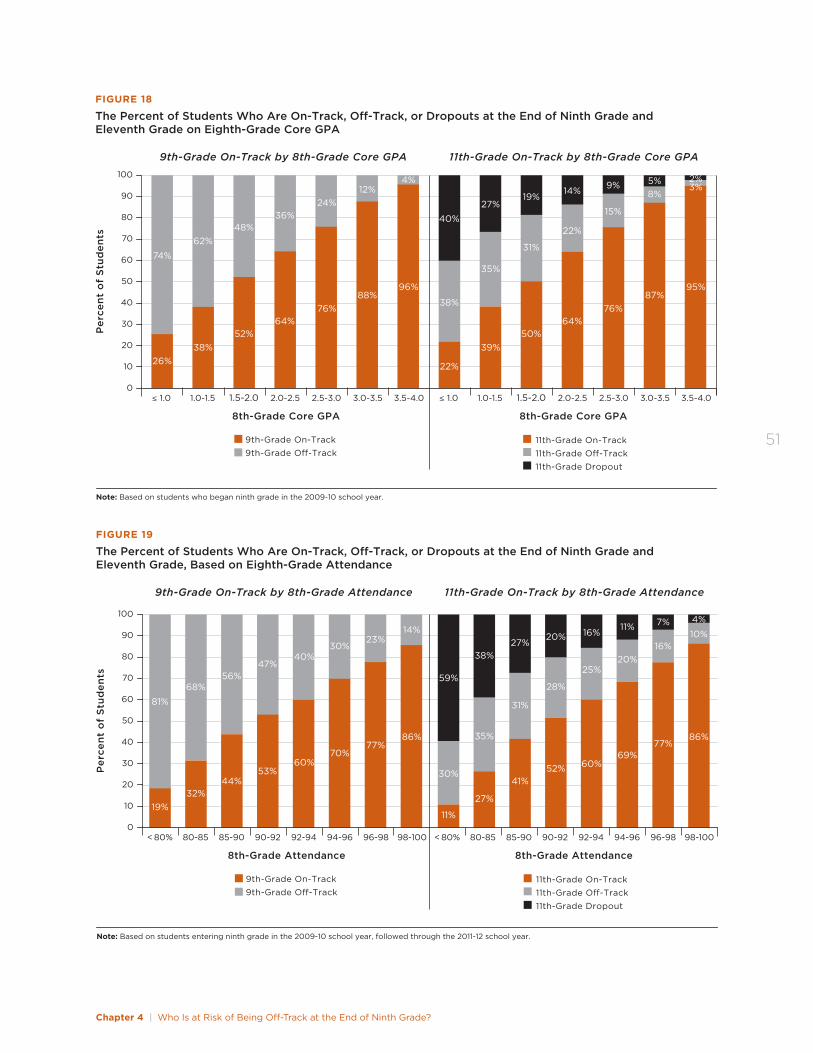
Chapter 4 | Who Is at Risk of Being Off-Track at the End of Ninth Grade?
51
8th-Grade Core GPA
FIGURE 18
The Percent of Students Who Are On-Track, O�-Track, or Dropouts at the End of Ninth Grade and Eleventh Grade on Eighth-Grade Core GPA
Per
cen
t o
f S
tud
ents
100
90
80
70
40
20
0
60
30
10
50
≤ 1.0 2.0-2.5 2.5-3.0 3.0-3.5 3.5-4.01.0-1.5 1.5-2.0
Note: Based on students who began ninth grade in the 2009-10 school year.
9th-Grade On-Track 9th-Grade O�-Track
26%
74%
38%
62%
52%
48%
64%
36%
76%
24%
88%
12%
96%
8th-Grade Core GPA
≤ 1.0 2.0-2.5 2.5-3.0 3.0-3.5 3.5-4.01.0-1.5 1.5-2.0
11th-Grade On-Track 11th-Grade O�-Track 11th-Grade Dropout
39%50%
64%76%
87%95%
4%
22%
35%
27%
31%
19%
22%
14%
15%
9%8%5%
3%2%
38%
40%
9th-Grade On-Track by 8th-Grade Core GPA 11th-Grade On-Track by 8th-Grade Core GPA
8th-Grade Attendance
FIGURE 19
The Percent of Students Who Are On-Track, O�-Track, or Dropouts at the End of Ninth Grade and Eleventh Grade, Based on Eighth-Grade Attendance
Per
cen
t o
f S
tud
ents
100
90
80
70
40
20
0
60
30
10
50
< 80% 90-92 92-94 94-96 98-10096-9880-85 85-90
Note: Based on students entering ninth grade in the 2009-10 school year, followed through the 2011-12 school year.
9th-Grade On-Track 9th-Grade O-Track
19%
81%
32%
68%
44%
56%
53%
47%
60%
40%
70%
30%
77%
23%
11th-Grade On-Track 11th-Grade O-Track 11th-Grade Dropout
86%
14%
27%
35%
38%
41%
31%
27%
52%
28%
20%
60%
25%
16%
69%
20%
11%
86%
10%
4%
77%
16%
7%
11%
30%
59%
8th-Grade Attendance
< 80% 90-92 92-94 94-96 98-10096-9880-85 85-90
9th-Grade On-Track by 8th-Grade Attendance 11th-Grade On-Track by 8th-Grade Attendance
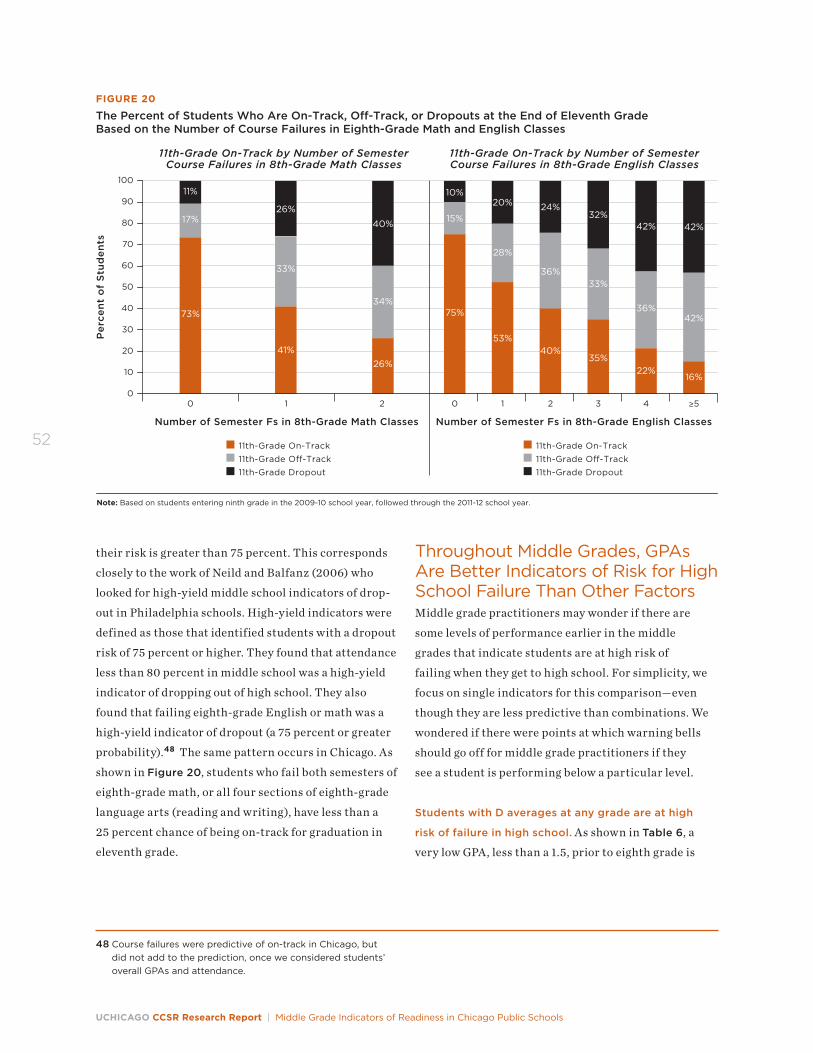
UCHICAGO CCSR Research Report | Middle Grade Indicators of Readiness in Chicago Public Schools
52
their risk is greater than 75 percent. This corresponds
closely to the work of Neild and Balfanz (2006) who
looked for high-yield middle school indicators of drop-
out in Philadelphia schools. High-yield indicators were
defined as those that identified students with a dropout
risk of 75 percent or higher. They found that attendance
less than 80 percent in middle school was a high-yield
indicator of dropping out of high school. They also
found that failing eighth-grade English or math was a
high-yield indicator of dropout (a 75 percent or greater
probability).48 The same pattern occurs in Chicago. As
shown in Figure 20, students who fail both semesters of
eighth-grade math, or all four sections of eighth-grade
language arts (reading and writing), have less than a
25 percent chance of being on-track for graduation in
eleventh grade.
Number of Semester Fs in 8th-Grade Math Classes
FIGURE 20
The Percent of Students Who Are On-Track, O�-Track, or Dropouts at the End of Eleventh Grade Based on the Number of Course Failures in Eighth-Grade Math and English Classes
Per
cen
t o
f S
tud
ents
100
90
80
70
40
20
0
60
30
10
50
0 1 2
Note: Based on students entering ninth grade in the 2009-10 school year, followed through the 2011-12 school year.
11th-Grade On-Track 11th-Grade O�-Track 11th-Grade Dropout
11th-Grade On-Track 11th-Grade O�-Track 11th-Grade Dropout
75%
15%
10%
73%
17%
11%
41%
33%
26%
26%
34%
40%
Number of Semester Fs in 8th-Grade English Classes
0
40%
36%
24%
2
35%
33%
32%
3
22%
36%
42%
4
16%
42%
42%
≥5
53%
28%
20%
1
11th-Grade On-Track by Number of Semester Course Failures in 8th-Grade Math Classes
11th-Grade On-Track by Number of Semester Course Failures in 8th-Grade English Classes
Throughout Middle Grades, GPAs Are Better Indicators of Risk for High School Failure Than Other FactorsMiddle grade practitioners may wonder if there are
some levels of performance earlier in the middle
grades that indicate students are at high risk of
failing when they get to high school. For simplicity, we
focus on single indicators for this comparison—even
though they are less predictive than combinations. We
wondered if there were points at which warning bells
should go off for middle grade practitioners if they
see a student is performing below a particular level.
Students with D averages at any grade are at high
risk of failure in high school. As shown in Table 6, a
very low GPA, less than a 1.5, prior to eighth grade is
48 Course failures were predictive of on-track in Chicago, but did not add to the prediction, once we considered students’ overall GPAs and attendance.
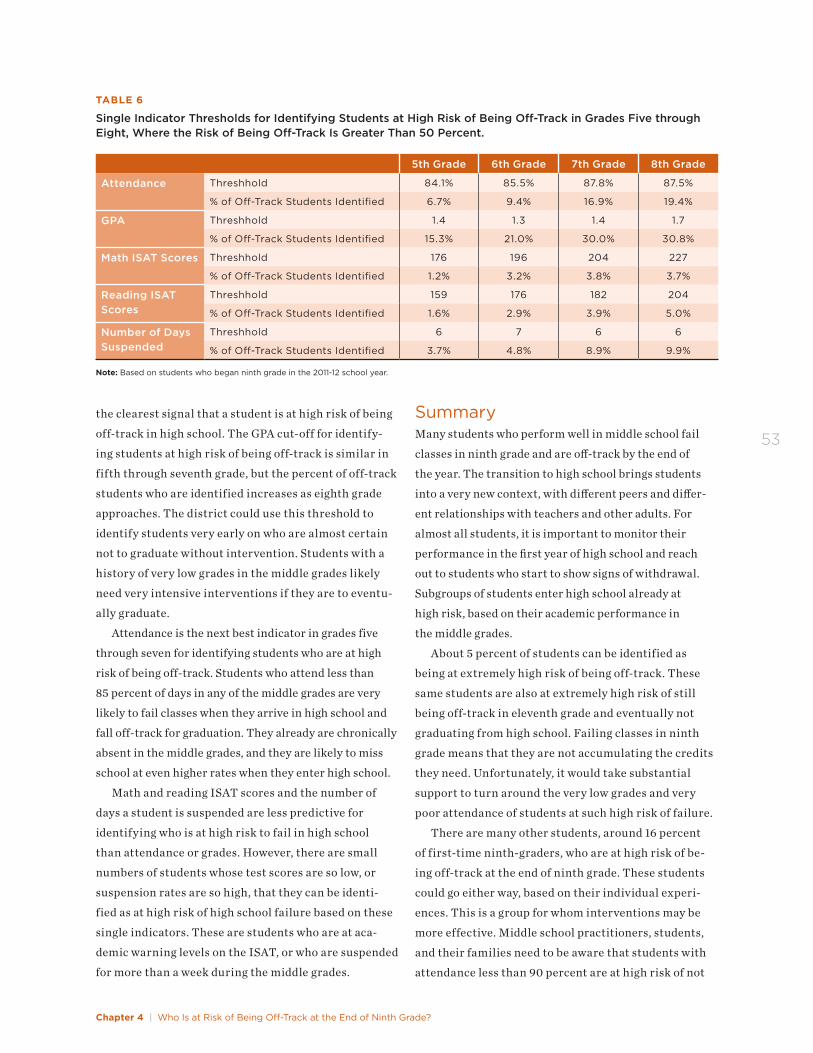
Chapter 4 | Who Is at Risk of Being Off-Track at the End of Ninth Grade?
53
the clearest signal that a student is at high risk of being
off-track in high school. The GPA cut-off for identify-
ing students at high risk of being off-track is similar in
fifth through seventh grade, but the percent of off-track
students who are identified increases as eighth grade
approaches. The district could use this threshold to
identify students very early on who are almost certain
not to graduate without intervention. Students with a
history of very low grades in the middle grades likely
need very intensive interventions if they are to eventu-
ally graduate.
Attendance is the next best indicator in grades five
through seven for identifying students who are at high
risk of being off-track. Students who attend less than
85 percent of days in any of the middle grades are very
likely to fail classes when they arrive in high school and
fall off-track for graduation. They already are chronically
absent in the middle grades, and they are likely to miss
school at even higher rates when they enter high school.
Math and reading ISAT scores and the number of
days a student is suspended are less predictive for
identifying who is at high risk to fail in high school
than attendance or grades. However, there are small
numbers of students whose test scores are so low, or
suspension rates are so high, that they can be identi-
fied as at high risk of high school failure based on these
single indicators. These are students who are at aca-
demic warning levels on the ISAT, or who are suspended
for more than a week during the middle grades.
SummaryMany students who perform well in middle school fail
classes in ninth grade and are off-track by the end of
the year. The transition to high school brings students
into a very new context, with different peers and differ-
ent relationships with teachers and other adults. For
almost all students, it is important to monitor their
performance in the first year of high school and reach
out to students who start to show signs of withdrawal.
Subgroups of students enter high school already at
high risk, based on their academic performance in
the middle grades.
About 5 percent of students can be identified as
being at extremely high risk of being off-track. These
same students are also at extremely high risk of still
being off-track in eleventh grade and eventually not
graduating from high school. Failing classes in ninth
grade means that they are not accumulating the credits
they need. Unfortunately, it would take substantial
support to turn around the very low grades and very
poor attendance of students at such high risk of failure.
There are many other students, around 16 percent
of first-time ninth-graders, who are at high risk of be-
ing off-track at the end of ninth grade. These students
could go either way, based on their individual experi-
ences. This is a group for whom interventions may be
more effective. Middle school practitioners, students,
and their families need to be aware that students with
attendance less than 90 percent are at high risk of not
TABLE 6
Single Indicator Thresholds for Identifying Students at High Risk of Being Off-Track in Grades Five through Eight, Where the Risk of Being Off-Track Is Greater Than 50 Percent.
5th Grade 6th Grade 7th Grade 8th Grade
Attendance Threshhold 84.1% 85.5% 87.8% 87.5%
% of Off-Track Students Identified 6.7% 9.4% 16.9% 19.4%
GPA Threshhold 1.4 1.3 1.4 1.7
% of Off-Track Students Identified 15.3% 21.0% 30.0% 30.8%
Math ISAT Scores Threshhold 176 196 204 227
% of Off-Track Students Identified 1.2% 3.2% 3.8% 3.7%
Reading ISAT Scores
Threshhold 159 176 182 204
% of Off-Track Students Identified 1.6% 2.9% 3.9% 5.0%
Number of Days Suspended
Threshhold 6 7 6 6
% of Off-Track Students Identified 3.7% 4.8% 8.9% 9.9%
Note: Based on students who began ninth grade in the 2011-12 school year.

UCHICAGO CCSR Research Report | Middle Grade Indicators of Readiness in Chicago Public Schools
54
graduating. Middle school and high school staff do not
need to wait until these students are failing their ninth-
grade classes to intervene. Mentorship programs, such
as Check and Connect,49 may be helpful in improving
their grades and attendance. They could also be identi-
fied for support from the start of high school to improve
their likelihood of passing ninth-grade classes.
While passing ninth-grade classes is an important
step toward graduating from high school, it is not
sufficient for ensuring that students are prepared to
engage in college level work. To be ready for college,
high school students need to be working hard at a very
high level of performance so that they are learning the
skills and knowledge they need to succeed in college;
this means earning As or Bs in high school classes. In
the next chapter, we show which students are likely to
earn As or Bs in high school and how many students
have little chance of doing so.
49 Sinclair et al. (2005); Lehr et al. (2004).

Chapter 5 | Who Is at Risk of Earning Less Than As or Bs in High School?
55
CHAPTER 5
Who Is at Risk of Earning Less Than As or Bs in High School?
This chapter shows which students are likely to earn high grades in high school—grades that make them eligible for col-lege and likely to succeed, once there. The information in this chapter can be used to discuss goals for student performance with students and their families.
Passing courses is essential for graduating from high
school, but simply passing is not enough if students are
to have a good chance of succeeding in college; they
need to be engaged in their classes and earning As or Bs.
Students who earn Cs or Ds in high school are unlikely
to graduate from college, while those with a B average (a
3.0 GPA) have about a 50/50 chance of earning a four-
year college degree (see Appendix A). Unfortunately,
few students actually achieve a GPA of at least 3.0 in
ninth grade. In 2009, for example, only 23 percent of
first-time freshmen earned A or B averages in their core
classes. This sets the stage for poor course performance
throughout high school.50
This chapter identifies which students are likely to
earn As or Bs in high school. While the indicators that
are predictive of As or Bs are similar to those for passing
classes in high school, the competencies and behaviors
students must demonstrate in order to earn As or Bs are
much higher—and their probability of success is much
lower. Eighth-graders who plan to eventually attend
college need to excel in their courses in order to have
a chance of earning sufficiently strong grades in high
school that put them on the path to college readiness.
Eighth-Graders with Good Grades, Attendance, and Test Scores Have Only a Moderate Chance of Earning As or Bs in Ninth Grade Chapter 3 showed that students’ eighth-grade core
GPAs are the best predictors of earning high grades
in high school. For students with strong eighth-grade
GPAs, considering their attendance rates or ISAT
scores, along with GPA, improves the accuracy of the
prediction. Students’ probability of success based on
these factors can be seen in Figure 21. The left-hand
portion of the figure shows that eighth-graders must
have very strong attendance or very strong test scores,
in addition to high grades, in order to have even a 50
percent chance of earning As or Bs in ninth grade.
Because only students with at least a 3.0 eighth-grade
GPA have at least a 22 percent chance of earning As or
Bs in high school, the right-hand portion of the figure
takes a finer-grained look at students with high grades
by subdividing the 3.0 to 4.0 GPA category. It shows
only students with the highest grades (GPAs above 3.7)
have at least a 50 percent chance of earning As or Bs
in ninth grade. Moreover, of the students with a GPA
greater than 3.7, only those with attendance rates
greater than 98 percent or ISAT math scores above 310
have more than a 75 percent chance of earning As or Bs.
To put this in context, students with attendance rates
of 98 percent or higher are missing less than a week of
school, and those scoring at a 310 or above are
in the “exceeds” range on the ISAT.
50 While grades are higher, on average, in eleventh and twelfth grades than grades nine and 10, this is because students with low grades tend to drop out. When we compare the
same students over time, we see that grades do not improve through high school, on average.
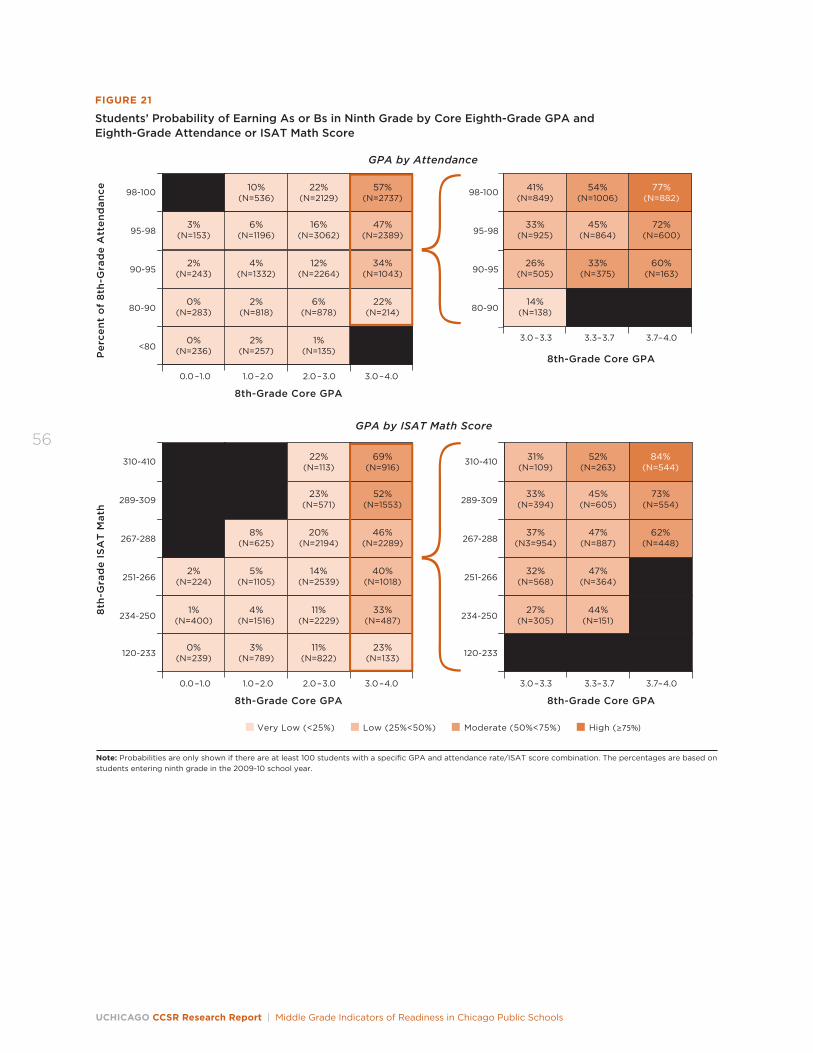
UCHICAGO CCSR Research Report | Middle Grade Indicators of Readiness in Chicago Public Schools
56
3.0–3.3 3.3–3.7 3.7–4.0
Per
cen
t o
f 8
th-G
rad
e A
tten
dan
ce 98-100
95-98
90-95
80-90
<80
0.0–1.0 1.0–2.0 2.0–3.0 3.0–4.0
Very Low (<25%) Low (25%<50%) Moderate (50%<75%) High (≥75%)
8th-Grade Core GPA
8th-Grade Core GPA
3.0–3.3 3.3–3.7 3.7–4.0
8th-Grade Core GPA
10%(N=536)
22%(N=2129)
57%(N=2737)
6%(N=1196)
3%(N=153)
16%(N=3062)
47%(N=2389)
4%(N=1332)
2%(N=243)
12%(N=2264)
34%(N=1043)
2%(N=818)
0%(N=283)
6%(N=878)
2%(N=257)
0%(N=236)
1%(N=135)
22%(N=214)
FIGURE 21
Students’ Probability of Earning As or Bs in Ninth Grade by Core Eighth-Grade GPA and Eighth-Grade Attendance or ISAT Math Score
Note: Probabilities are only shown if there are at least 100 students with a specific GPA and attendance rate/ISAT score combination. The percentages are based on students entering ninth grade in the 2009-10 school year.
98-100
95-98
90-95
80-90
41%(N=849)
54%(N=1006)
77%(N=882)
33%(N=925)
45%(N=864)
72%(N=600)
26%(N=505)
33%(N=375)
60%(N=163)
14%(N=138)
GPA by Attendance
8th
-Gra
de
ISA
T M
ath
310-410
289-309
267-288
251-266
234-250
120-233
0.0–1.0 1.0–2.0 2.0–3.0 3.0–4.0
8th-Grade Core GPA
22%(N=113)
69%(N=916)
23%(N=571)
52%(N=1553)
8%(N=625)
20%(N=2194)
46%(N=2289)
5%(N=1105)
2%(N=224)
14%(N=2539)
3%(N=789)
0%(N=239)
11%(N=822)
4%(N=1516)
1%(N=400)
11%(N=2229)
40%(N=1018)
GPA by ISAT Math Score
310-410
289-309
267-288
251-266
234-250
120-233
84%(N=544)
73%(N=554)
47%(N=887)
62%(N=448)
47%(N=364)
32%(N=568)
37%(N3=954)
52%(N=263)
45%(N=605)
33%(N=394)
31%(N=109)
44%(N=151)
27%(N=305)
33%(N=487)
23%(N=133)
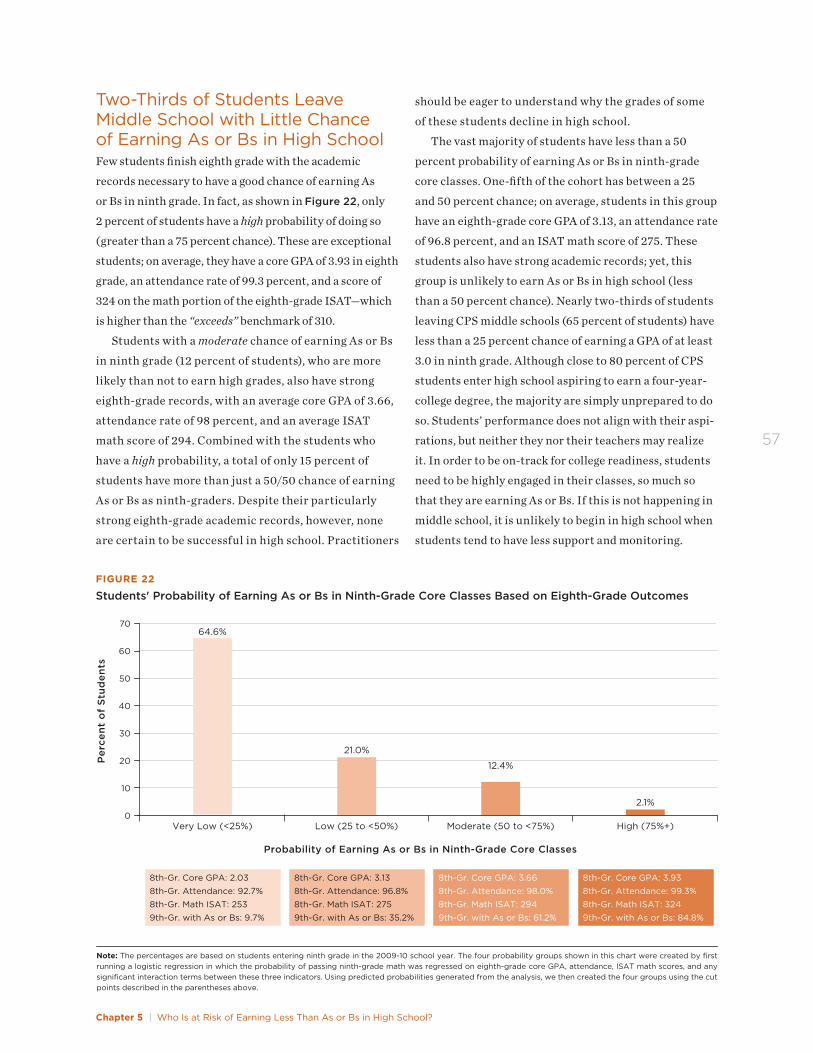
Chapter 5 | Who Is at Risk of Earning Less Than As or Bs in High School?
57
Two-Thirds of Students Leave Middle School with Little Chance of Earning As or Bs in High SchoolFew students finish eighth grade with the academic
records necessary to have a good chance of earning As
or Bs in ninth grade. In fact, as shown in Figure 22, only
2 percent of students have a high probability of doing so
(greater than a 75 percent chance). These are exceptional
students; on average, they have a core GPA of 3.93 in eighth
grade, an attendance rate of 99.3 percent, and a score of
324 on the math portion of the eighth-grade ISAT—which
is higher than the “exceeds” benchmark of 310.
Students with a moderate chance of earning As or Bs
in ninth grade (12 percent of students), who are more
likely than not to earn high grades, also have strong
eighth-grade records, with an average core GPA of 3.66,
attendance rate of 98 percent, and an average ISAT
math score of 294. Combined with the students who
have a high probability, a total of only 15 percent of
students have more than just a 50/50 chance of earning
As or Bs as ninth-graders. Despite their particularly
strong eighth-grade academic records, however, none
are certain to be successful in high school. Practitioners
should be eager to understand why the grades of some
of these students decline in high school.
The vast majority of students have less than a 50
percent probability of earning As or Bs in ninth-grade
core classes. One-fifth of the cohort has between a 25
and 50 percent chance; on average, students in this group
have an eighth-grade core GPA of 3.13, an attendance rate
of 96.8 percent, and an ISAT math score of 275. These
students also have strong academic records; yet, this
group is unlikely to earn As or Bs in high school (less
than a 50 percent chance). Nearly two-thirds of students
leaving CPS middle schools (65 percent of students) have
less than a 25 percent chance of earning a GPA of at least
3.0 in ninth grade. Although close to 80 percent of CPS
students enter high school aspiring to earn a four-year-
college degree, the majority are simply unprepared to do
so. Students’ performance does not align with their aspi-
rations, but neither they nor their teachers may realize
it. In order to be on-track for college readiness, students
need to be highly engaged in their classes, so much so
that they are earning As or Bs. If this is not happening in
middle school, it is unlikely to begin in high school when
students tend to have less support and monitoring.
Per
cen
t o
f S
tud
ents
70
30
20
10
0
50
40
60
FIGURE 22
Students' Probability of Earning As or Bs in Ninth-Grade Core Classes Based on Eighth-Grade Outcomes
Note: The percentages are based on students entering ninth grade in the 2009-10 school year. The four probability groups shown in this chart were created by first running a logistic regression in which the probability of passing ninth-grade math was regressed on eighth-grade core GPA, attendance, ISAT math scores, and any significant interaction terms between these three indicators. Using predicted probabilities generated from the analysis, we then created the four groups using the cut points described in the parentheses above.
Very Low (<25%)
64.6%
8th-Gr. Core GPA: 2.038th-Gr. Attendance: 92.7%8th-Gr. Math ISAT: 2539th-Gr. with As or Bs: 9.7%
8th-Gr. Core GPA: 3.138th-Gr. Attendance: 96.8%8th-Gr. Math ISAT: 2759th-Gr. with As or Bs: 35.2%
8th-Gr. Core GPA: 3.668th-Gr. Attendance: 98.0%8th-Gr. Math ISAT: 2949th-Gr. with As or Bs: 61.2%
8th-Gr. Core GPA: 3.938th-Gr. Attendance: 99.3%8th-Gr. Math ISAT: 3249th-Gr. with As or Bs: 84.8%
Low (25 to <50%)
21.0%
Moderate (50 to <75%)
12.4%
High (75%+)
2.1%
Probability of Earning As or Bs in Ninth-Grade Core Classes
UCHICAGO CCSR Research Report | Middle Grade Indicators of Readiness in Chicago Public Schools
58
The Likelihood of Earning As or Bs in Subject-Specific Classes Is Similar to That Across All Core ClassesEducators may wonder whether different indicators
are predictive of high grades in particular classes,
such as English versus math. We found almost no dif-
ferences in which indicators of performance predicted
high grades in math versus English. Subject-specific
indicators, such as grades or test scores in English or
math, were less predictive of grades in ninth-grade
English and math than students’ core GPA and com-
bined test scores across subjects. Most students have
low probabilities of earning As or Bs in ninth-grade
English and math, although their chances are slightly
better in English than in math (see Figures 23 and 24).
About three-fourths of Chicago students leave middle
school with less than a 50/50 chance of earning As or Bs
in ninth-grade English; 84 percent of students have less
than a 50/50 chance of earning As or Bs in ninth-grade
math, based on their eighth-grade records. Less than 5
percent of students leave eighth grade with a very high
likelihood of earning As or Bs in ninth-grade English
(with at least a 75 percent chance of doing so). Less
than 2 percent have a very high likelihood of earning
As or Bs in math in ninth grade, based on their eighth-
grade records.
By Eleventh Grade, Even Fewer Students Earn Bs or BetterIf students are followed an additional two years—to
eleventh grade—the patterns look similar to those seen
in ninth grade, although grades are somewhat lower in
eleventh grade and some students have dropped out of
school. Grade point averages generally do not improve
as students progress through high school, so low likeli-
hoods for earning As or Bs in ninth grade foretell low
GPAs in eleventh grade when students are applying to
college. Put another way, students’ course performance
in eighth grade has implications for their grades not
only in the following year but also for the entirety of
their high school careers.
Figure 25 shows students’ ninth-grade GPAs and
eleventh-grade GPAs, based on their eighth-grade GPAs.
51 Roderick et al. (2006)
Eleventh-grade GPAs are divided into groups, based on
prior research that ties high school grades to college
outcomes: students with a GPA below 2.0 are not likely
to graduate from college and only have access to college
if they have ACT scores of 21 or higher, which is rare.
Those with a GPA between 2.0 and 3.0 are qualified for
a non-selective or somewhat selective college, if they
also have an ACT score of at least 18. However, while
they can enroll in college, their chances of graduat-
ing from college are slim. In order to be qualified for a
selective college, and to have at least a 50/50 chance of
graduating, students need a GPA above 3.0 and an ACT
score of at least 18.51 (See Appendix A for a summary
table that ties college access to students’ high school
GPAs and ACT scores.)
Students leaving eighth grade with very high
grades—an A average of 3.5 or higher—have fairly even
odds of leaving high school with a B average or better
(3.0 or above). Sixty-one percent of the students with an
eighth-grade GPA of at least 3.5 earn As or Bs in ninth
grade; that proportion drops to 54 percent in eleventh
grade. These students have access to selective colleges,
if they have an ACT score of at least 18. Another one-
third of the students with the top eighth-grade grades
earn a GPA between 2.0 and 3.0 in ninth and eleventh
grade. While these students have access to somewhat
selective colleges, their chances of graduating from col-
lege are less than 40 percent (see Appendix A).
Among students who earned a mix of As and Bs in
eighth grade (with a GPA between 3.0 and 3.5), less than
a third (29 percent) finish eleventh grade with a GPA
that signals they are likely to succeed in college (at least
a 3.0). Another 24 percent finish with grades so low they
are not even qualified for college (less than a 2.0).
Eighth-graders who earn low grades have almost no
chance of graduating from college. More than half of the
students with an eighth-grade GPA between 1.5 and 2.0
are not qualified for college, and 20 percent drop out
by eleventh grade. Students who earn an eighth-grade
GPA of less than 1.0 are nearly as likely to drop out (44
percent) by eleventh grade as not, and the vast majority
who do stay in school perform at levels that leave them
unqualified for college.
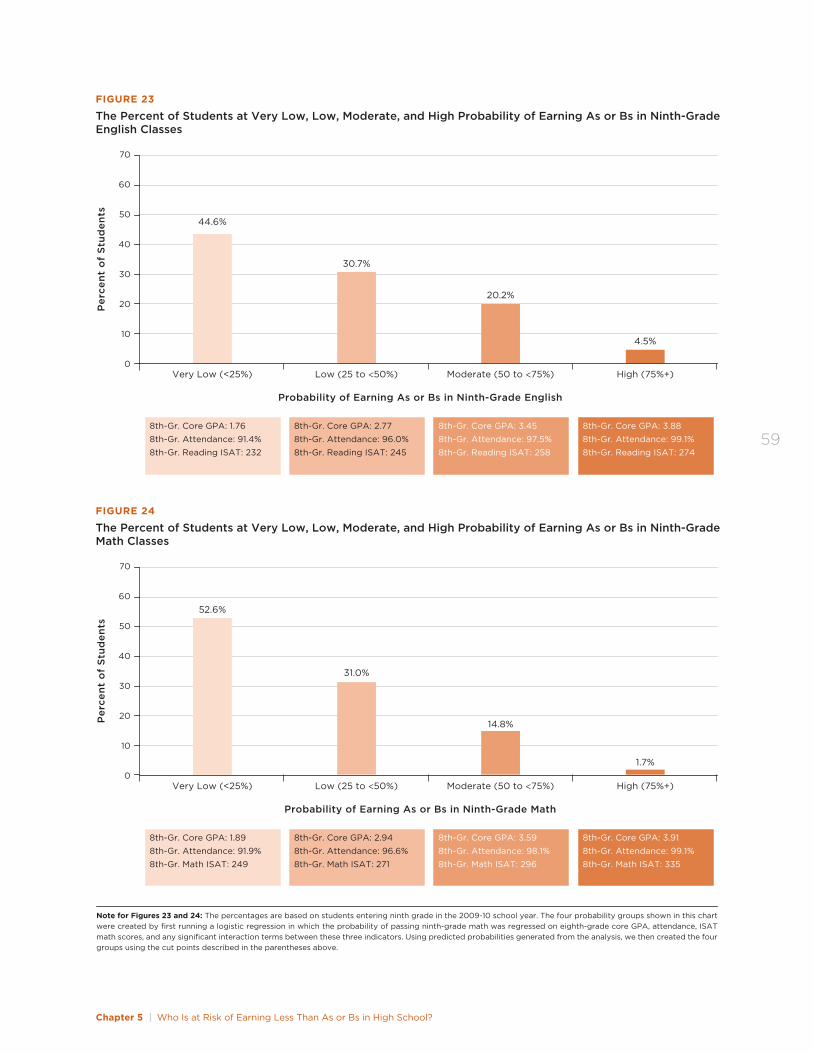
Chapter 5 | Who Is at Risk of Earning Less Than As or Bs in High School?
59
Per
cen
t o
f S
tud
ents
70
30
20
10
0
50
40
60
FIGURE 23
The Percent of Students at Very Low, Low, Moderate, and High Probability of Earning As or Bs in Ninth-Grade English Classes
44.6%
30.7%
20.2%
4.5%
Very Low (<25%)
8th-Gr. Core GPA: 1.768th-Gr. Attendance: 91.4%8th-Gr. Reading ISAT: 232
8th-Gr. Core GPA: 2.778th-Gr. Attendance: 96.0%8th-Gr. Reading ISAT: 245
8th-Gr. Core GPA: 3.458th-Gr. Attendance: 97.5%8th-Gr. Reading ISAT: 258
8th-Gr. Core GPA: 3.888th-Gr. Attendance: 99.1%8th-Gr. Reading ISAT: 274
Low (25 to <50%) Moderate (50 to <75%) High (75%+)
Probability of Earning As or Bs in Ninth-Grade English
Note: The percentages are based on students entering ninth grade in the 2009-10 school year. The four probability groups shown in this chart were created by first running a logistic regression in which the probability of passing ninth-grade math was regressed on eighth-grade core GPA, attendance, ISAT math scores, and any significant interaction terms between these three indicators. Using predicted probabilities generated from the analysis, we then created the four groups using the cut points described in the parentheses above.
Per
cen
t o
f S
tud
ents
70
30
20
10
0
50
40
60
FIGURE 24
The Percent of Students at Very Low, Low, Moderate, and High Probability of Earning As or Bs in Ninth-Grade Math Classes
52.6%
31.0%
14.8%
1.7%
Very Low (<25%)
8th-Gr. Core GPA: 1.898th-Gr. Attendance: 91.9%8th-Gr. Math ISAT: 249
8th-Gr. Core GPA: 2.948th-Gr. Attendance: 96.6%8th-Gr. Math ISAT: 271
8th-Gr. Core GPA: 3.598th-Gr. Attendance: 98.1%8th-Gr. Math ISAT: 296
8th-Gr. Core GPA: 3.918th-Gr. Attendance: 99.1%8th-Gr. Math ISAT: 335
Low (25 to <50%) Moderate (50 to <75%) High (75%+)
Probability of Earning As or Bs in Ninth-Grade Math
Note for Figures 23 and 24: The percentages are based on students entering ninth grade in the 2009-10 school year. The four probability groups shown in this chart were created by first running a logistic regression in which the probability of passing ninth-grade math was regressed on eighth-grade core GPA, attendance, ISAT math scores, and any significant interaction terms between these three indicators. Using predicted probabilities generated from the analysis, we then created the four groups using the cut points described in the parentheses above.
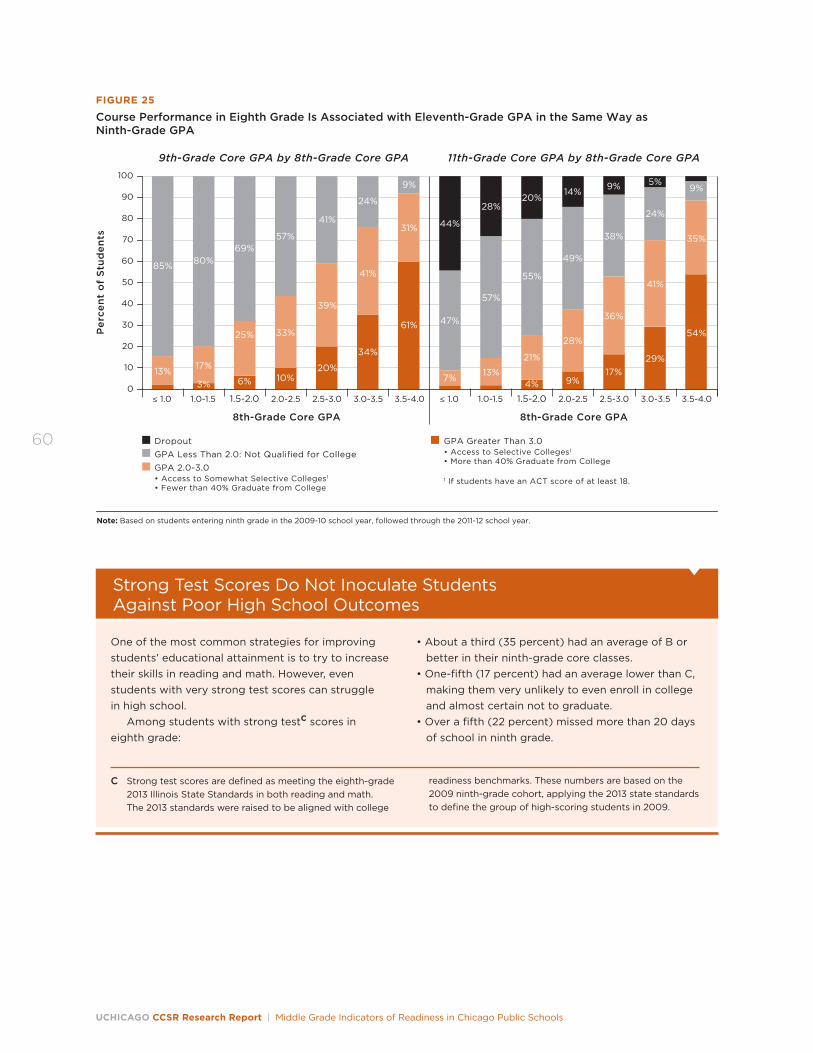
UCHICAGO CCSR Research Report | Middle Grade Indicators of Readiness in Chicago Public Schools
60
One of the most common strategies for improving students’ educational attainment is to try to increase their skills in reading and math. However, even students with very strong test scores can struggle in high school.
Among students with strong testC scores in eighth grade:
• About a third (35 percent) had an average of B or better in their ninth-grade core classes. • One-fifth (17 percent) had an average lower than C, making them very unlikely to even enroll in college and almost certain not to graduate. • Over a fifth (22 percent) missed more than 20 days of school in ninth grade.
Strong Test Scores Do Not Inoculate Students Against Poor High School Outcomes
C Strong test scores are defined as meeting the eighth-grade 2013 Illinois State Standards in both reading and math. The 2013 standards were raised to be aligned with college
readiness benchmarks. These numbers are based on the 2009 ninth-grade cohort, applying the 2013 state standards to define the group of high-scoring students in 2009.
8th-Grade Core GPA
FIGURE 25
Course Performance in Eighth Grade Is Associated with Eleventh-Grade GPA in the Same Way as Ninth-Grade GPA
Per
cen
t o
f S
tud
ents
100
90
80
70
40
20
0
60
30
10
50
≤ 1.0 2.0-2.5 2.5-3.0 3.0-3.5 3.5-4.01.0-1.5 1.5-2.0
Note: Based on students entering ninth grade in the 2009-10 school year, followed through the 2011-12 school year.
13%
85%
17%
3%
80%
25%
6%
69%
33%
10%
57%
39%
20%
41%
41%
34%
24%
61%
31%
8th-Grade Core GPA
≤ 1.0 2.0-2.5 2.5-3.0 3.0-3.5 3.5-4.01.0-1.5 1.5-2.0
DropoutGPA Less Than 2.0: Not Qualified for CollegeGPA 2.0-3.0• Access to Somewhat Selective Colleges1
• Fewer than 40% Graduate from College
GPA Greater Than 3.0• Access to Selective Colleges1
• More than 40% Graduate from College
1 If students have an ACT score of at least 18.
13%
21%
4%
28%
9%
36%
17%
41%
29%
54%
35%
9%
7%
57%
28%
55%
20%
49%
14%
38%
9%
24%
5%9%
47%
44%
9th-Grade Core GPA by 8th-Grade Core GPA 11th-Grade Core GPA by 8th-Grade Core GPA
Chapter 5 | Who Is at Risk of Earning Less Than As or Bs in High School?
61
SummaryWhile a student’s eighth-grade record can give some
idea of his likelihood to succeed in ninth grade, many
Chicago students experience a large decline in perfor-
mance that is not evident until the transition to high
school. Even students with exemplary eighth-grade
records suffer some decline and are unlikely to main-
tain their eighth-grade levels of performance during
high school. Only those eighth-graders with GPAs
greater than 3.0 have even a moderate chance of earn-
ing As or Bs in ninth grade. Students with a good chance
of high grades in high school tend to have eighth-grade
GPAs of 3.5 or higher, along with strong attendance or
test scores.
This suggests that course performance in the
middle grades needs to be very strong if students are
to be to be ready for college at the end of high school.
Earning a mix of Bs and Cs in eighth grade is simply not
good enough. Many students with an eighth-grade GPA
less than 3.0 drop out by eleventh grade, and the grades
of all but a few students who are still enrolled are so low
that they will be unqualified for any four-year college
(less than a 2.0). At the same time, nine out of 10 stu-
dents with an eighth-grade GPA greater than 3.5 go on
to finish eleventh grade with a GPA that provides access
to at least a somewhat selective college (greater than a
2.0). Students who aspire to college must be engaged in
their courses and performing at a high level even prior
to ninth grade.
Most students are unlikely to earn As or Bs in ninth
grade, despite the fact they may be doing so in eighth
grade. High schools may want to investigate why it
is so difficult for students with strong middle grade
records to be successful in ninth grade. If high schools
could monitor the performance of their students, they
might discover what types of supports are needed to
keep grades from dropping. To help students at least
maintain their levels of performance from the previous
year would yield significant improvements in academic
records and their likelihood of succeeding in college.

62

Chapter 6 | Indicators of Whether Students Will Meet Test Benchmarks
63
CHAPTER 6
Indicators of Whether Students Will Meet Test Benchmarks
This chapter evaluates potential middle grade indicators of per-formance on high school tests (EPAS) and which combinations of indicators provide the best pre-diction. This chapter focuses on composite scores first, and then on subject-specific EPAS tests.
ACT scores, along with students’ GPA and other factors,
determine the type of college students have access to af-
ter high school graduation. Students with ACT scores of
24 or higher, in combination with GPAs of 3.0 or higher,
are likely to have access to very selective colleges.
(Table A1 in Appendix A shows the relationships of
students’ eleventh-grade GPA, ACT scores, and the kind
of colleges students have access to given their qualifica-
tions.) Students with the same test scores who attend
colleges with different levels of selectivity have differ-
ent earnings over their career. This is especially true
for minority students, and these differences in earn-
ings based on college selectivity increase over time.52
Besides being important for college access, ACT scores
are also important when applying for scholarships and
loans to pay for college.
In Chicago, students take three tests as part of the
Educational Planning and Assessment System (EPAS):
the EXPLORE in the fall of eighth and ninth grade,
PLAN in the fall of tenth grade, and ACT in the spring of
eleventh grade.53 These tests measure student achieve-
ment in English, reading, mathematics, and science.
The four subject-area scores are averaged together to
calculate a composite score. This portion of our analysis
focuses on students’ PLAN scores, because the PLAN is
taken after the ninth-grade year. At the end of the chap-
ter, the focus shifts to ACT scores, which are reported
to colleges as part of the application process.
The PLAN test scores range from 1 to 32. For each
subject, ACT has defined a college readiness bench-
mark; this is the score at which ACT has determined
that students have a 50 percent chance of earning a B or
better and a 75 percent chance of earning a C or better
in corresponding college courses.54 The PLAN college
readiness benchmarks are 15 for English, 17 for reading,
19 for math, and 21 for science; the composite value is
18. This chapter examines students’ average test scores,
whether students reach the benchmarks in the different
subjects, and whether students score a PLAN composite
of 18 or above.
Many Chicago students do not meet the college read-
iness benchmarks on the PLAN; 48 percent of first-time
freshmen in the fall of 2010, who took PLAN in the fall
of 2011, reached the benchmark in English, 30 percent
did in reading, 16 percent in math, and only 6 percent
in science. These subject-specific patterns are simi-
lar to the results of the ACT taken in eleventh grade.
While these percentages are lower than the national
numbers, the subject-specific trends mirror the trends
nationwide. Seventy percent of the 2011-12 PLAN-
tested tenth-graders, nationally, met the benchmark in
52 Dale and Krueger (2012); Hoxby (2001).53 In the past, CPS students also took the PLAN test in the fall of
their eleventh grade. Some students might also take the ACT in the fall of their twelfth grade to improve their ACT score before applying to college.
54 Those are English composition, social science, college algebra, and biology. Social science college courses included history, psychology, sociology, political science,
and economics classes (Allen and Sconing, 2005). In Septem-ber 2013, ACT revised the ACT college-readiness benchmarks with more recent data (Allen, 2013). This has resulted in changes to the reading and science benchmarks; the reading benchmark went up a point, and the science benchmark went down a point for all tests in the EPAS series. For tests taken in 2013 and later, ACT will apply these revised benchmarks.
UCHICAGO CCSR Research Report | Middle Grade Indicators of Readiness in Chicago Public Schools
64
English, 52 percent in reading, 36 percent in math, and
27 percent in science.55
Given the low percentages of students reaching the
benchmarks, many practitioners are looking for ways
to help students meet these benchmarks through early
intervention. Because the EPAS system is not available
prior to eighth grade, it is difficult for school practitio-
ners, students, and parents to know whether middle
ACT’s college-readiness benchmarks are described in a report by Allen and Sconing (2005) and then revised in Allen (2013).
The benchmarks were calculated based on data that came from colleges that participated in ACT’s Course Placement Service. In the 2005 report, the English benchmark analysis was based on 46 two-year colleges and 46 four-year colleges with 76,122 students, while the science benchmark analysis was based on 17 two-year colleges and 14 four-year colleges with 14,136 students.D Benchmarks were chosen to be the median value of ACT scores across colleges that give a 50/50 chance to students to earn a B or better in a college course. These cut-off scores varied from college to college. For example, in half of colleges, students with an ACT score of 18 have a 50/50 chance of getting a B or better in English Composition; in another quarter students only need a 14 to have a 50/50 chance of earning a B or better, while in 25 percent of colleges students need a score of 20 in English ACT to have a 50/50 chance at a B or higher. The variability is lower for algebra and science, and fewer students were part of those analyses.
ACT benchmarks provide a context from which one can make meaning out of a score. For example, on its own, a score of 20 has no meaning. Knowing, however, that the benchmark score on the math portion of the ACT represents the point at which a student has a 50/50 chance of getting a B or higher in a college algebra class puts a score of 20 in context as one that is not too far behind the benchmark.
Yet, while they provide meaning to a specific score, differences in the preparation and later success of students who meet the benchmark versus those who do not are not necessarily meaningful. There are many factors other than students’ ACT scores that are more strongly associated with their college success than their test score. These factors include attributes of the college a student attends and the classes in which the student enrolls at that college—the quality of instruc-tion, institutional setting, and fit between student and college. They also include other academic skills and noncognitive factors that are not measured on the ACT—such as students’ ability to show up to class and put forth their best effort and creativity, as well as the supports they receive from family and peers.
Just because students make a benchmark does not mean that they will do well in their college classes; students who meet the ACT benchmarks have a 50 percent chance of scoring Bs or better in their college classes. That means that half of the students who score just at or above the benchmark do not receive at least a B. At the same time, many students who score below the benchmark do perform well. With ACT’s reading benchmark, for example, a score of 21 gives a student a 50 percent chance of a B in a college social science class, but a score of 16—one that is 4 points lower and equivalent to about three to four years of growth in high school—gives a student a 40 percent chance of earning a B or better.E Thus, a large difference in scores results in only a slight difference in the probability of success.
ACT Benchmarks
grade students are on a trajectory that makes it likely
they will meet the benchmarks in high school and what
the goals should be on tests given in the middle grade
years in order to be aligned with later high school tests.
Therefore, this chapter shows how middle grade indica-
tors are related to PLAN test scores and the degree to
which they can predict whether students will reach the
college-readiness benchmarks on the PLAN and ACT.
55 ACT, Inc. (2012).
D The 2013 report replicates the same analysis with more recent data. The number of students varied from 131,000 for social science to 42,000 for biology, while the number of colleges varied from 136 in the English Composition I analysis to 90 for biology analysis.
E Based on graph of the relationship between ACT scores and grades at a “typical” college in Allen and Sconing (2005).
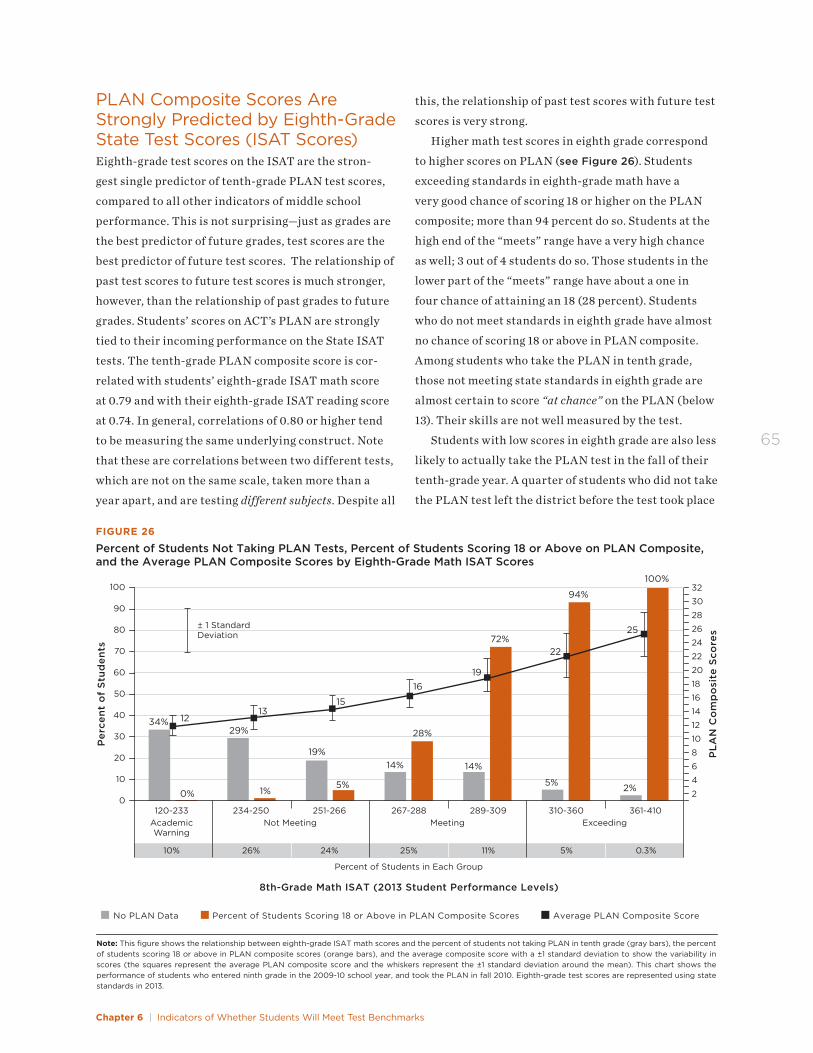
Chapter 6 | Indicators of Whether Students Will Meet Test Benchmarks
65
PLAN Composite Scores Are Strongly Predicted by Eighth-Grade State Test Scores (ISAT Scores)Eighth-grade test scores on the ISAT are the stron-
gest single predictor of tenth-grade PLAN test scores,
compared to all other indicators of middle school
performance. This is not surprising—just as grades are
the best predictor of future grades, test scores are the
best predictor of future test scores. The relationship of
past test scores to future test scores is much stronger,
however, than the relationship of past grades to future
grades. Students’ scores on ACT’s PLAN are strongly
tied to their incoming performance on the State ISAT
tests. The tenth-grade PLAN composite score is cor-
related with students’ eighth-grade ISAT math score
at 0.79 and with their eighth-grade ISAT reading score
at 0.74. In general, correlations of 0.80 or higher tend
to be measuring the same underlying construct. Note
that these are correlations between two different tests,
which are not on the same scale, taken more than a
year apart, and are testing different subjects. Despite all
this, the relationship of past test scores with future test
scores is very strong.
Higher math test scores in eighth grade correspond
to higher scores on PLAN (see Figure 26). Students
exceeding standards in eighth-grade math have a
very good chance of scoring 18 or higher on the PLAN
composite; more than 94 percent do so. Students at the
high end of the “meets” range have a very high chance
as well; 3 out of 4 students do so. Those students in the
lower part of the “meets” range have about a one in
four chance of attaining an 18 (28 percent). Students
who do not meet standards in eighth grade have almost
no chance of scoring 18 or above in PLAN composite.
Among students who take the PLAN in tenth grade,
those not meeting state standards in eighth grade are
almost certain to score “at chance” on the PLAN (below
13). Their skills are not well measured by the test.
Students with low scores in eighth grade are also less
likely to actually take the PLAN test in the fall of their
tenth-grade year. A quarter of students who did not take
the PLAN test left the district before the test took place
8th-Grade Math ISAT (2013 Student Performance Levels)
FIGURE 26
Percent of Students Not Taking PLAN Tests, Percent of Students Scoring 18 or Above on PLAN Composite, and the Average PLAN Composite Scores by Eighth-Grade Math ISAT Scores
Per
cen
t o
f S
tud
ents
100
90
80
70
40
20
0
60
30
10
50
120-233
± 1 Standard Deviation
234-250 251-266 267-288 289-309 310-360 361-410
Note: This figure shows the relationship between eighth-grade ISAT math scores and the percent of students not taking PLAN in tenth grade (gray bars), the percent of students scoring 18 or above in PLAN composite scores (orange bars), and the average composite score with a ±1 standard deviation to show the variability in scores (the squares represent the average PLAN composite score and the whiskers represent the ±1 standard deviation around the mean). This chart shows the performance of students who entered ninth grade in the 2009-10 school year, and took the PLAN in fall 2010. Eighth-grade test scores are represented using state standards in 2013.
No PLAN Data Percent of Students Scoring 18 or Above in PLAN Composite Scores Average PLAN Composite Score
Academic Warning
Not Meeting Meeting Exceeding
1%
29%
5%
19%14%
28%
14%
72%
5%
94%
2%
100%
1213
15
1619
22
25
0%
34%P
LA
N C
om
po
site
Sco
res
20
32
30
28
26
24
22
6
18
16
14
12
10
8
2
4
Percent of Students in Each Group
10% 26% 24% 25% 11% 5% 0.3%
UCHICAGO CCSR Research Report | Middle Grade Indicators of Readiness in Chicago Public Schools
66
with tenth-grade test scores, the correlation is much
weaker than with prior test scores—around 0.56 (see
Table 7). Combined, students’ background character-
istics (e.g., race, gender, special education status, free
and reduced-priced status, neighborhood poverty and
socioeconomic status, and whether students are old for
grade) explain a third of the variation in test scores,
similar to core grades (see adjusted-R2 in Table 7).
Special education, whether students are old for grade,
free and reduced-priced lunch, and race data are the
background variables most strongly associated with
test scores. Attendance, misconducts, suspensions,
grit, and study habits have very weak relationships with
tenth-grade test scores, explaining a meager proportion
of the variation in test scores.
PLAN scores are better predicted by using more than
one prior test score, from multiple subjects or grades.
Two middle grade test scores combined from different
subjects (reading and math) or from different grades
(seventh and eighth grade) are slightly more predic-
tive of PLAN scores in any subject than just one test
by itself. For example, the adjusted-R2 from a model in
which eighth-grade math and reading ISAT scores are
combined to predict PLAN math scores in tenth grade
improves from 0.63 to 0.68, compared to a model with
only eighth-grade math ISAT scores (see Table 7 and
Table E.2 in Appendix E). This is because any one score
is likely to have measurement error; students have
good days and bad days, and multiple measures pro-
vide a more precise estimate of their true ability than
one score by itself. This also suggests that each test
measures underlying general skills as much as subject-
specific learning. The addition of the information of
one more test score helps with the prediction of the
PLAN scores mainly for students close to exceeding or
exceeding in math in eighth grade, where there is more
variation in their scores. This could be an indication
of a lack of precision in scoring at the high end of the
ISAT or that school effects are more important for these
students, as discussed later in the chapter.
Once we know students’ reading and math test
scores in eighth grade, adding other information does
not help much with the prediction of high school test
scores, with the exception of adding school information
and 7 percent dropped out of school. The rest (66 per-
cent) were still in school—some of them were in ninth
grade (25 percent), but a large proportion (41 percent)
was enrolled in tenth grade and did not take the test.
The analyses presented in this chapter are based on stu-
dents who took the PLAN tests their second year of high
school. Because they represent only those students with
test scores who were enrolled in the tenth grade, the av-
erage PLAN scores and percent meeting the benchmark
at each level of the ISAT are somewhat biased upward—
they would likely be lower if all students who took the
eighth-grade ISAT were tested on the PLAN in tenth
grade. Even with this upward bias, the probability of
scoring 18 or above on the PLAN composite for students
at the most typical ISAT score levels is very low.
Test scores in earlier grades are almost as predic-
tive of PLAN scores as eighth-grade test scores, and
much more predictive than background characteris-
tics, grades, or attendance. Table 7 shows the degree
to which middle grade indicators predict students’
performance on the PLAN—both the prediction of the
composite score and the probability of scoring 18 on
the composite. Not only are tests taken in eighth grade
highly correlated with PLAN composite scores, but
tests taken in years prior to eighth grade are almost
as predictive. The correlations between PLAN com-
posite scores and ISAT scores in eighth, seventh, and
even sixth grade are nearly identical. The correlation
between the ISAT scores in two consecutive years is
also high: in reading it is 0.81 and in math it is 0.88. This
implies that students who score high one year will tend
to score high the following year and the data from either
year—eighth or seventh grade—can predict how stu-
dents will do on the PLAN. Even sixth-grade test scores
are very good predictors of PLAN composite scores and
better predictors than other eighth-grade indicators
that are not based on tests. Chapter 8 shows students’
test trajectories in the middle grades and what these
correlations mean for differences in students’ test score
growth over the middle grade years.
Eighth-grade course performance, other middle
grade indicators, and background variables are weaker
predictors of PLAN composite scores than middle grade
test data. While eighth-grade core GPA is correlated
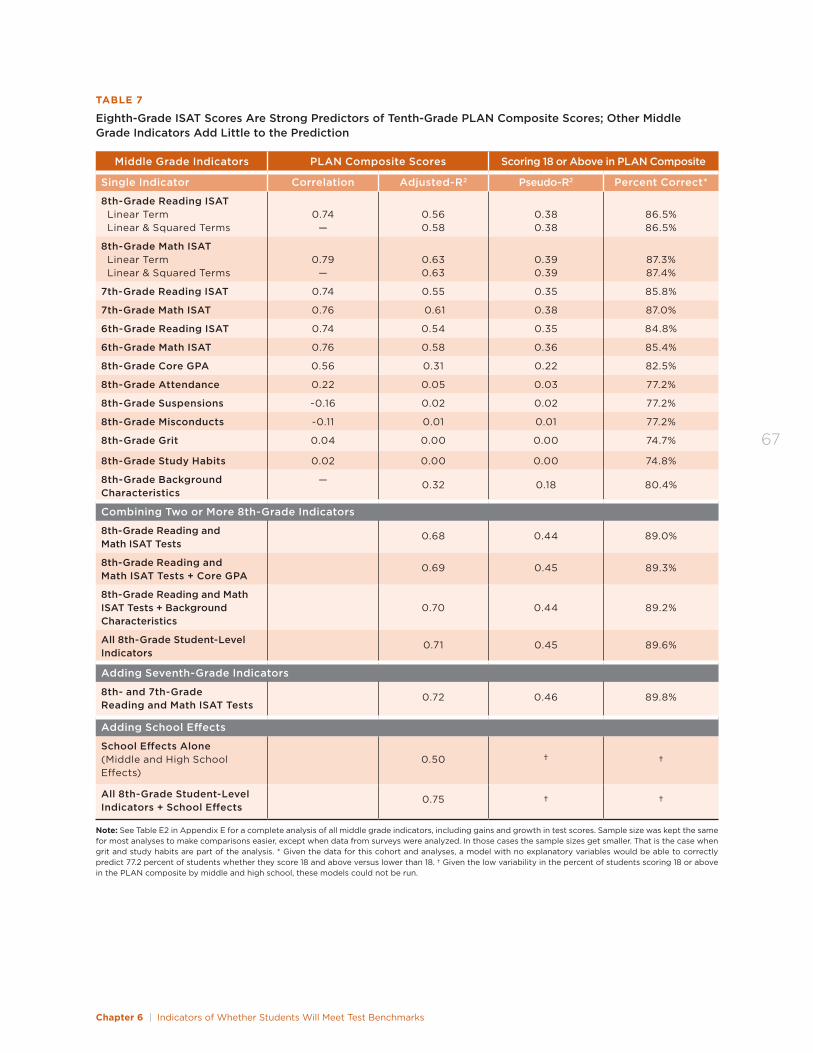
Chapter 6 | Indicators of Whether Students Will Meet Test Benchmarks
67
TABLE 7
Eighth-Grade ISAT Scores Are Strong Predictors of Tenth-Grade PLAN Composite Scores; Other Middle Grade Indicators Add Little to the Prediction
Middle Grade Indicators PLAN Composite Scores Scoring 18 or Above in PLAN Composite
Single Indicator Correlation Adjusted-R2 Pseudo-R2 Percent Correct*
8th-Grade Reading ISAT Linear Term Linear & Squared Terms
0.74
—
0.56 0.58
0.38 0.38
86.5% 86.5%
8th-Grade Math ISAT Linear Term Linear & Squared Terms
0.79
—
0.63 0.63
0.39 0.39
87.3% 87.4%
7th-Grade Reading ISAT 0.74 0.55 0.35 85.8%
7th-Grade Math ISAT 0.76 0.61 0.38 87.0%
6th-Grade Reading ISAT 0.74 0.54 0.35 84.8%
6th-Grade Math ISAT 0.76 0.58 0.36 85.4%
8th-Grade Core GPA 0.56 0.31 0.22 82.5%
8th-Grade Attendance 0.22 0.05 0.03 77.2%
8th-Grade Suspensions -0.16 0.02 0.02 77.2%
8th-Grade Misconducts -0.11 0.01 0.01 77.2%
8th-Grade Grit 0.04 0.00 0.00 74.7%
8th-Grade Study Habits 0.02 0.00 0.00 74.8%
8th-Grade Background Characteristics
— 0.32 0.18 80.4%
Combining Two or More 8th-Grade Indicators
8th-Grade Reading and Math ISAT Tests
0.68 0.44 89.0%
8th-Grade Reading and Math ISAT Tests + Core GPA
0.69 0.45 89.3%
8th-Grade Reading and Math ISAT Tests + Background Characteristics
0.70
0.44
89.2%
All 8th-Grade Student-Level Indicators
0.71 0.45 89.6%
Adding Seventh-Grade Indicators
8th- and 7th-Grade Reading and Math ISAT Tests
0.72 0.46 89.8%
Adding School Effects
School Effects Alone (Middle and High School Effects)
0.50
†
†
All 8th-Grade Student-Level Indicators + School Effects
0.75 † †
Note: See Table E2 in Appendix E for a complete analysis of all middle grade indicators, including gains and growth in test scores. Sample size was kept the same for most analyses to make comparisons easier, except when data from surveys were analyzed. In those cases the sample sizes get smaller. That is the case when grit and study habits are part of the analysis. * Given the data for this cohort and analyses, a model with no explanatory variables would be able to correctly predict 77.2 percent of students whether they score 18 and above versus lower than 18. † Given the low variability in the percent of students scoring 18 or above in the PLAN composite by middle and high school, these models could not be run.
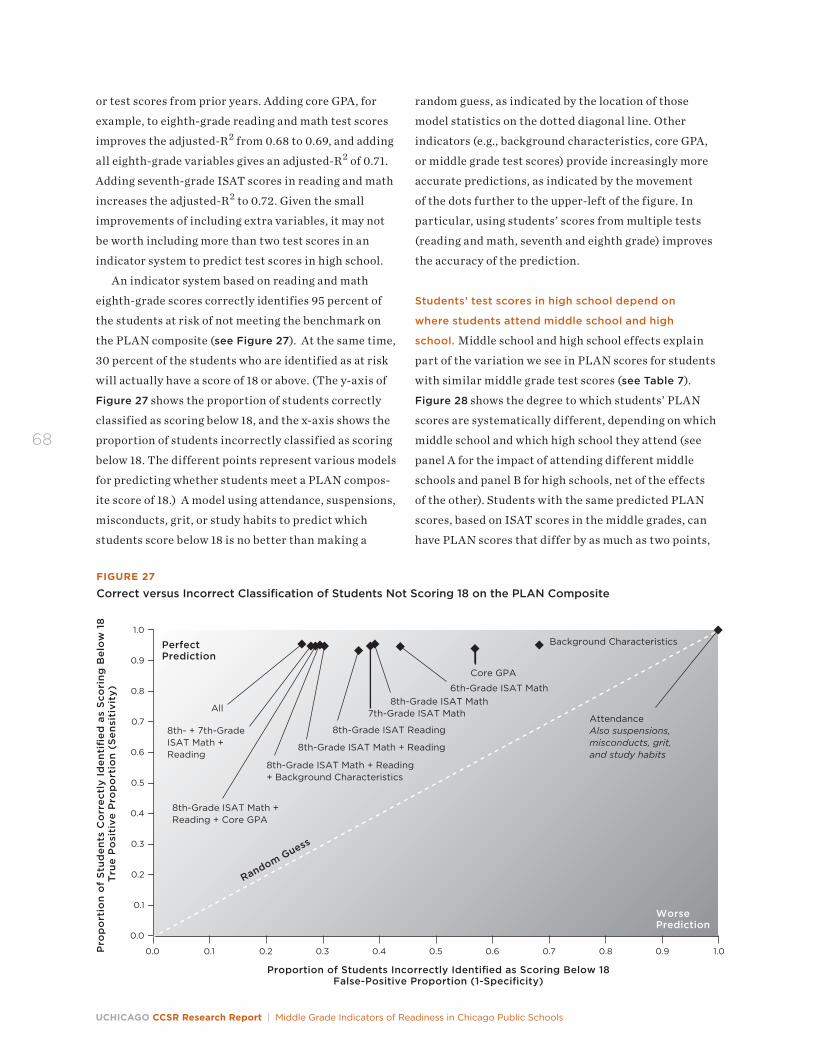
UCHICAGO CCSR Research Report | Middle Grade Indicators of Readiness in Chicago Public Schools
68
or test scores from prior years. Adding core GPA, for
example, to eighth-grade reading and math test scores
improves the adjusted-R2 from 0.68 to 0.69, and adding
all eighth-grade variables gives an adjusted-R2 of 0.71.
Adding seventh-grade ISAT scores in reading and math
increases the adjusted-R2 to 0.72. Given the small
improvements of including extra variables, it may not
be worth including more than two test scores in an
indicator system to predict test scores in high school.
An indicator system based on reading and math
eighth-grade scores correctly identifies 95 percent of
the students at risk of not meeting the benchmark on
the PLAN composite (see Figure 27). At the same time,
30 percent of the students who are identified as at risk
will actually have a score of 18 or above. (The y-axis of
Figure 27 shows the proportion of students correctly
classified as scoring below 18, and the x-axis shows the
proportion of students incorrectly classified as scoring
below 18. The different points represent various models
for predicting whether students meet a PLAN compos-
ite score of 18.) A model using attendance, suspensions,
misconducts, grit, or study habits to predict which
students score below 18 is no better than making a
Proportion of Students Incorrectly Identified as Scoring Below 18False-Positive Proportion (1-Specificity)
FIGURE 27
Correct versus Incorrect Classification of Students Not Scoring 18 on the PLAN Composite
Pro
po
rtio
n o
f S
tud
ents
Co
rrec
tly
Iden
tifi
ed a
s S
cori
ng
Bel
ow
18
Tru
e P
osi
tive
Pro
po
rtio
n (
Sen
siti
vity
)
0.9
1.0
0.8
0.7
0.4
0.2
0.0
0.6
0.3
0.1
0.5
Perfect Prediction
WorsePrediction
Random Guess
Core GPA
All
6th-Grade ISAT Math
AttendanceAlso suspensions, misconducts, grit, and study habits
Background Characteristics
0.9 1.00.80.70.40.20.0 0.60.30.1 0.5
8th-Grade ISAT Math
8th-Grade ISAT Reading
7th-Grade ISAT Math
8th-Grade ISAT Math + Reading + Background Characteristics
8th-Grade ISAT Math + Reading
8th- + 7th-Grade ISAT Math + Reading
8th-Grade ISAT Math + Reading + Core GPA
random guess, as indicated by the location of those
model statistics on the dotted diagonal line. Other
indicators (e.g., background characteristics, core GPA,
or middle grade test scores) provide increasingly more
accurate predictions, as indicated by the movement
of the dots further to the upper-left of the figure. In
particular, using students’ scores from multiple tests
(reading and math, seventh and eighth grade) improves
the accuracy of the prediction.
Students’ test scores in high school depend on
where students attend middle school and high
school. Middle school and high school effects explain
part of the variation we see in PLAN scores for students
with similar middle grade test scores (see Table 7).
Figure 28 shows the degree to which students’ PLAN
scores are systematically different, depending on which
middle school and which high school they attend (see
panel A for the impact of attending different middle
schools and panel B for high schools, net of the effects
of the other). Students with the same predicted PLAN
scores, based on ISAT scores in the middle grades, can
have PLAN scores that differ by as much as two points,
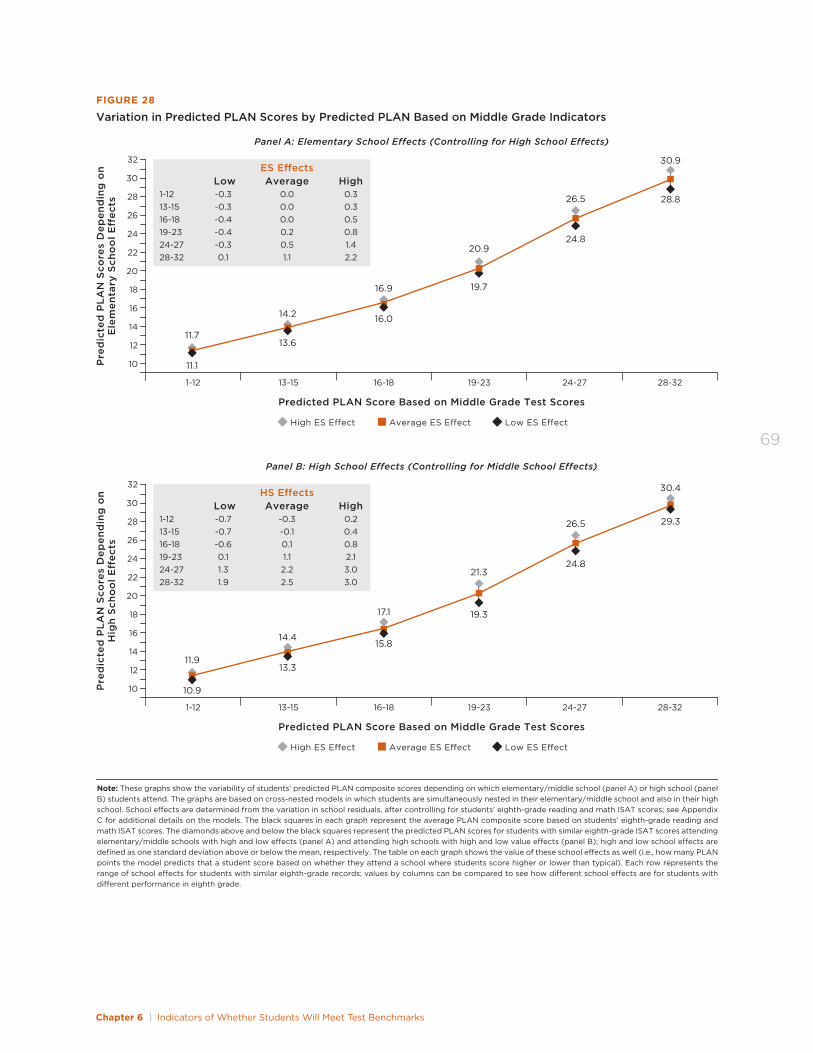
Chapter 6 | Indicators of Whether Students Will Meet Test Benchmarks
69
Predicted PLAN Score Based on Middle Grade Test Scores
FIGURE 28
Variation in Predicted PLAN Scores by Predicted PLAN Based on Middle Grade Indicators
11.1
11.713.6
14.2 16.0
16.9 19.7
20.924.8
26.5 28.8
30.9
High ES E ect Average ES E ect Low ES E ect
Pre
dic
ted
PL
AN
Sco
res
Dep
end
ing
on
Ele
men
tary
Sch
oo
l E�
ects
1-12 13-15 16-18 19-23 28-3224-27
ES E�ects Low Average High1-12 -0.3 0.0 0.313-15 -0.3 0.0 0.316-18 -0.4 0.0 0.519-23 -0.4 0.2 0.824-27 -0.3 0.5 1.428-32 0.1 1.1 2.2
Note: These graphs show the variability of students’ predicted PLAN composite scores depending on which elementary/middle school (panel A) or high school (panel B) students attend. The graphs are based on cross-nested models in which students are simultaneously nested in their elementary/middle school and also in their high school. School e ects are determined from the variation in school residuals, after controlling for students’ eighth-grade reading and math ISAT scores; see Appendix C for additional details on the models. The black squares in each graph represent the average PLAN composite score based on students’ eighth-grade reading and math ISAT scores. The diamonds above and below the black squares represent the predicted PLAN scores for students with similar eighth-grade ISAT scores attending elementary/middle schools with high and low e ects (panel A) and attending high schools with high and low value e ects (panel B); high and low school e ects are defined as one standard deviation above or below the mean, respectively. The table on each graph shows the value of these school e ects as well (i.e., how many PLAN points the model predicts that a student score based on whether they attend a school where students score higher or lower than typical). Each row represents the range of school e ects for students with similar eighth-grade records; values by columns can be compared to see how di erent school e ects are for students with di erent performance in eighth grade.
Panel A: Elementary School Effects (Controlling for High School Effects)
20
32
30
28
26
24
22
18
16
14
12
10
Predicted PLAN Score Based on Middle Grade Test Scores
10.9
11.913.3
14.415.8
17.1 19.3
21.324.8
26.5 29.3
30.4
High ES E ect Average ES E ect Low ES E ect
Pre
dic
ted
PL
AN
Sco
res
Dep
end
ing
on
Hig
h S
cho
ol E
�ec
ts
1-12 13-15 16-18 19-23 28-3224-27
HS E�ects Low Average High1-12 -0.7 -0.3 0.213-15 -0.7 -0.1 0.416-18 -0.6 0.1 0.819-23 0.1 1.1 2.124-27 1.3 2.2 3.028-32 1.9 2.5 3.0
Panel B: High School Effects (Controlling for Middle School Effects)
20
32
30
28
26
24
22
18
16
14
12
10
UCHICAGO CCSR Research Report | Middle Grade Indicators of Readiness in Chicago Public Schools
70
depending on which middle school they attended, after
removing any effects of where they attend high school.
Among students with high scores, middle school effects
are particularly strong. These differences might be
due to variation in the types of skills students learned
in the middle grades—students at schools that taught
specifically to the types of questions on the ISAT, at the
expense of the types of skills and questions asked on
ACT’s EPAS system (PLAN test), might not score as well
on the PLAN as their ISAT scores would suggest. Some
middle schools may have better prepared their students
for the type of work that prepares them to score well on
the EPAS. Schools at which students perform better on
high school tests than their middle grade tests would
predict also tend to have students that get better high
school grades than their middle school grades would
predict; the correlation between middle school effects
on grades and tests scores is 0.34, net of high school
effects and students’ eighth-grade achievement.
Variation in PLAN scores for students with the same
ISAT scores also depend on the high school they attend.
These differences could represent different rates of
learning in high school or alignment of high school in-
struction with the PLAN. High school effects tend to be
larger for students scoring in the middle of the distribu-
tion, not the extremes. Two students with same middle
grade ISAT score, who came from the same elementary
school, can vary in their PLAN math score by as much
as 2 points, depending on which high school they attend.
Students gain about a point a year on average, which sug-
gests that students gain about twice as much each year
on their math scores at some schools than at others.
High ISAT scores not only increase students’ likeli-
hood of scoring well on the PLAN but also give them
access to high schools where students show higher-
than-average gains. Students with low scores in the
middle grades generally attend high schools where
students make smaller-than-average gains. As shown in
the table within panel B of Figure 28, among students
with low test scores, some attend high schools where
the average school effect is 0.7 points below average,
while others attend schools where the average effect is
about 0.2 above expected; while there is a range among
the school effects, none are particularly high and some
are quite low. On the other hand, high-scoring students
generally attend high schools that contribute to their
scores by almost two points or more on average. These
estimates come from models that compare gains among
students with the same incoming scores, suggesting
that students with high skills leaving the middle grades
tend to go to high schools with above-average gains.
Students who attend middle schools with high-
achieving, more advantaged peers are more likely to
score higher on their PLAN math test than their ISAT
scores would predict, compared to students with the
same eighth-grade test scores who attended middle
schools with lower-achieving, less advantaged peers.
Table 8 shows the relationships of middle school charac-
teristics with middle school effects on test scores—effects
that are not reflected in students’ ISAT scores, and net of
any effects that result from where their students attend
high school. The second column shows high school ef-
fects, net of any effects of where students attend middle
school, and controlling for their eighth-grade ISAT
scores. The final column shows middle school effects
without controlling for high school effects, allowing for
the fact that middle schools tend to send their students
to particular high schools. Students’ high school PLAN
scores are better than their ISAT scores at predicting
if they come from middle schools serving students who
come from neighborhoods with lower levels of poverty
(r=-0.34), fewer students who are over-age for their grade
(r=-0.34), and more students who are white (r=0.32).
Students are also more likely to have higher PLAN
composite scores if they attend high schools with
higher-achieving and more advantaged peers (see the
second column of Table 8), even after removing any
effects of their middle school. The absolute size of these
correlations is always larger for high schools than for
middle schools, but these correlations only reflect
school effects that are not reflected in students’ eighth-
grade ISAT scores. Attending high schools with high-
scoring students is particularly strongly associated with
students scoring higher on the PLAN than their ISAT
scores would predict (r=0.77). This is consistent with
prior research that suggests students learn more in class-
es with higher-achieving peers.56 Their scores are also
higher if they attend high schools serving students who
come from neighborhoods with lower levels of poverty
(r=-0.42), fewer students who are over-age for their grade
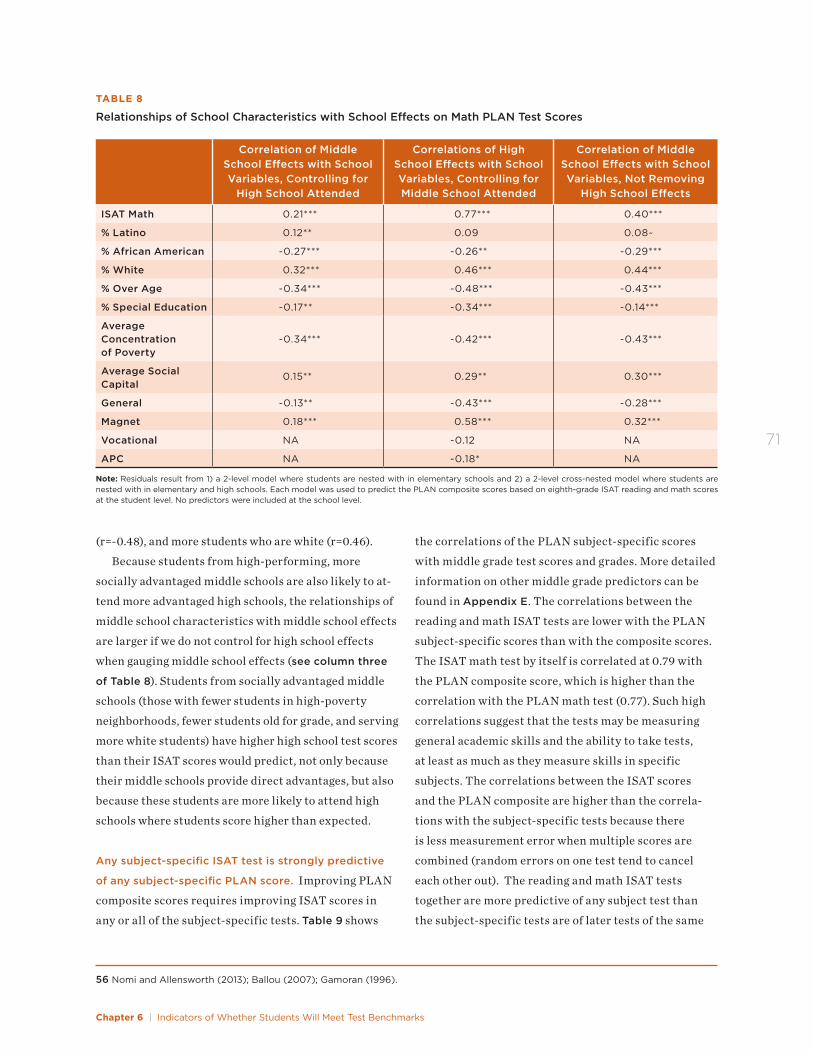
Chapter 6 | Indicators of Whether Students Will Meet Test Benchmarks
71
TABLE 8
Relationships of School Characteristics with School Effects on Math PLAN Test Scores
Correlation of Middle School Effects with School Variables, Controlling for
High School Attended
Correlations of High School Effects with School Variables, Controlling for Middle School Attended
Correlation of Middle School Effects with School Variables, Not Removing
High School Effects
ISAT Math 0.21*** 0.77*** 0.40***
% Latino 0.12** 0.09 0.08~
% African American -0.27*** -0.26** -0.29***
% White 0.32*** 0.46*** 0.44***
% Over Age -0.34*** -0.48*** -0.43***
% Special Education -0.17** -0.34*** -0.14***
Average Concentration of Poverty
-0.34***
-0.42***
-0.43***
Average Social Capital
0.15** 0.29** 0.30***
General -0.13** -0.43*** -0.28***
Magnet 0.18*** 0.58*** 0.32***
Vocational NA -0.12 NA
APC NA -0.18* NA
Note: Residuals result from 1) a 2-level model where students are nested with in elementary schools and 2) a 2-level cross-nested model where students are nested with in elementary and high schools. Each model was used to predict the PLAN composite scores based on eighth-grade ISAT reading and math scores at the student level. No predictors were included at the school level.
56 Nomi and Allensworth (2013); Ballou (2007); Gamoran (1996).
(r=-0.48), and more students who are white (r=0.46).
Because students from high-performing, more
socially advantaged middle schools are also likely to at-
tend more advantaged high schools, the relationships of
middle school characteristics with middle school effects
are larger if we do not control for high school effects
when gauging middle school effects (see column three
of Table 8). Students from socially advantaged middle
schools (those with fewer students in high-poverty
neighborhoods, fewer students old for grade, and serving
more white students) have higher high school test scores
than their ISAT scores would predict, not only because
their middle schools provide direct advantages, but also
because these students are more likely to attend high
schools where students score higher than expected.
Any subject-specific ISAT test is strongly predictive
of any subject-specific PLAN score. Improving PLAN
composite scores requires improving ISAT scores in
any or all of the subject-specific tests. Table 9 shows
the correlations of the PLAN subject-specific scores
with middle grade test scores and grades. More detailed
information on other middle grade predictors can be
found in Appendix E. The correlations between the
reading and math ISAT tests are lower with the PLAN
subject-specific scores than with the composite scores.
The ISAT math test by itself is correlated at 0.79 with
the PLAN composite score, which is higher than the
correlation with the PLAN math test (0.77). Such high
correlations suggest that the tests may be measuring
general academic skills and the ability to take tests,
at least as much as they measure skills in specific
subjects. The correlations between the ISAT scores
and the PLAN composite are higher than the correla-
tions with the subject-specific tests because there
is less measurement error when multiple scores are
combined (random errors on one test tend to cancel
each other out). The reading and math ISAT tests
together are more predictive of any subject test than
the subject-specific tests are of later tests of the same
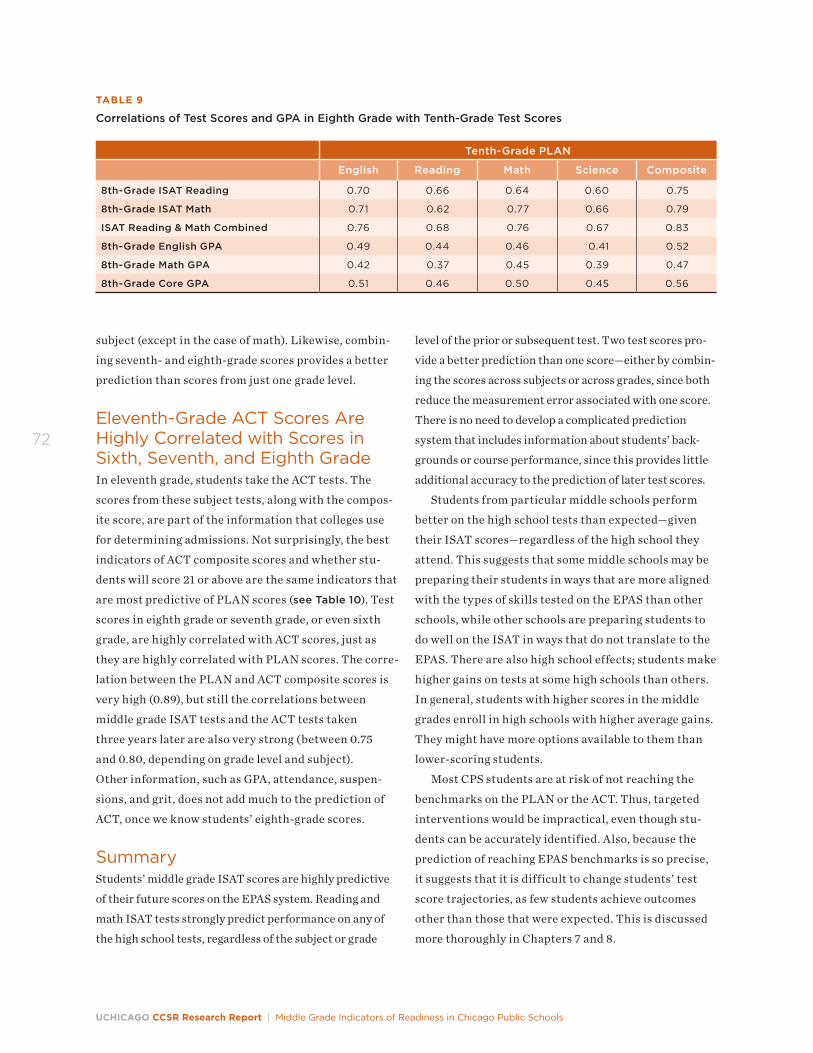
UCHICAGO CCSR Research Report | Middle Grade Indicators of Readiness in Chicago Public Schools
72
subject (except in the case of math). Likewise, combin-
ing seventh- and eighth-grade scores provides a better
prediction than scores from just one grade level.
Eleventh-Grade ACT Scores Are Highly Correlated with Scores in Sixth, Seventh, and Eighth GradeIn eleventh grade, students take the ACT tests. The
scores from these subject tests, along with the compos-
ite score, are part of the information that colleges use
for determining admissions. Not surprisingly, the best
indicators of ACT composite scores and whether stu-
dents will score 21 or above are the same indicators that
are most predictive of PLAN scores (see Table 10). Test
scores in eighth grade or seventh grade, or even sixth
grade, are highly correlated with ACT scores, just as
they are highly correlated with PLAN scores. The corre-
lation between the PLAN and ACT composite scores is
very high (0.89), but still the correlations between
middle grade ISAT tests and the ACT tests taken
three years later are also very strong (between 0.75
and 0.80, depending on grade level and subject).
Other information, such as GPA, attendance, suspen-
sions, and grit, does not add much to the prediction of
ACT, once we know students’ eighth-grade scores.
SummaryStudents’ middle grade ISAT scores are highly predictive
of their future scores on the EPAS system. Reading and
math ISAT tests strongly predict performance on any of
the high school tests, regardless of the subject or grade
level of the prior or subsequent test. Two test scores pro-
vide a better prediction than one score—either by combin-
ing the scores across subjects or across grades, since both
reduce the measurement error associated with one score.
There is no need to develop a complicated prediction
system that includes information about students’ back-
grounds or course performance, since this provides little
additional accuracy to the prediction of later test scores.
Students from particular middle schools perform
better on the high school tests than expected—given
their ISAT scores—regardless of the high school they
attend. This suggests that some middle schools may be
preparing their students in ways that are more aligned
with the types of skills tested on the EPAS than other
schools, while other schools are preparing students to
do well on the ISAT in ways that do not translate to the
EPAS. There are also high school effects; students make
higher gains on tests at some high schools than others.
In general, students with higher scores in the middle
grades enroll in high schools with higher average gains.
They might have more options available to them than
lower-scoring students.
Most CPS students are at risk of not reaching the
benchmarks on the PLAN or the ACT. Thus, targeted
interventions would be impractical, even though stu-
dents can be accurately identified. Also, because the
prediction of reaching EPAS benchmarks is so precise,
it suggests that it is difficult to change students’ test
score trajectories, as few students achieve outcomes
other than those that were expected. This is discussed
more thoroughly in Chapters 7 and 8.
TABLE 9
Correlations of Test Scores and GPA in Eighth Grade with Tenth-Grade Test Scores
Tenth-Grade PLAN
English Reading Math Science Composite
8th-Grade ISAT Reading 0.70 0.66 0.64 0.60 0.75
8th-Grade ISAT Math 0.71 0.62 0.77 0.66 0.79
ISAT Reading & Math Combined 0.76 0.68 0.76 0.67 0.83
8th-Grade English GPA 0.49 0.44 0.46 0.41 0.52
8th-Grade Math GPA 0.42 0.37 0.45 0.39 0.47
8th-Grade Core GPA 0.51 0.46 0.50 0.45 0.56
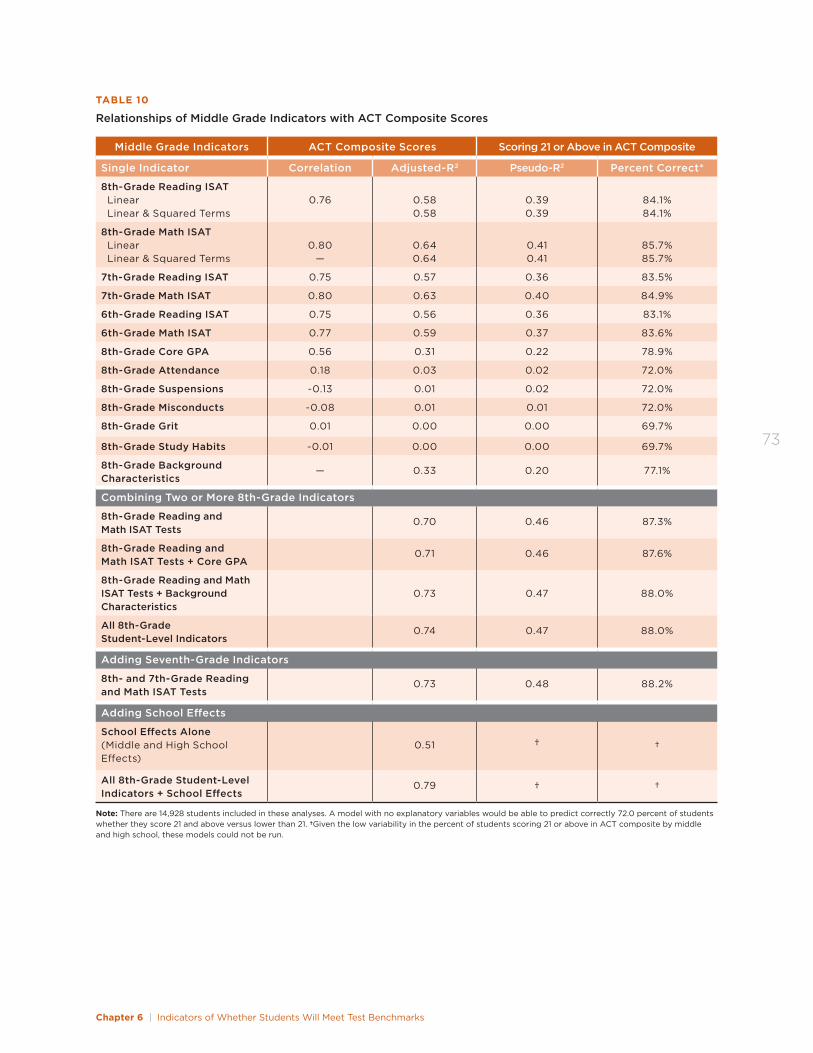
Chapter 6 | Indicators of Whether Students Will Meet Test Benchmarks
73
TABLE 10
Relationships of Middle Grade Indicators with ACT Composite Scores
Middle Grade Indicators ACT Composite Scores Scoring 21 or Above in ACT Composite
Single Indicator Correlation Adjusted-R2 Pseudo-R2 Percent Correct*
8th-Grade Reading ISAT Linear Linear & Squared Terms
0.76
0.58 0.58
0.39 0.39
84.1% 84.1%
8th-Grade Math ISAT Linear Linear & Squared Terms
0.80
—
0.64 0.64
0.41 0.41
85.7% 85.7%
7th-Grade Reading ISAT 0.75 0.57 0.36 83.5%
7th-Grade Math ISAT 0.80 0.63 0.40 84.9%
6th-Grade Reading ISAT 0.75 0.56 0.36 83.1%
6th-Grade Math ISAT 0.77 0.59 0.37 83.6%
8th-Grade Core GPA 0.56 0.31 0.22 78.9%
8th-Grade Attendance 0.18 0.03 0.02 72.0%
8th-Grade Suspensions -0.13 0.01 0.02 72.0%
8th-Grade Misconducts -0.08 0.01 0.01 72.0%
8th-Grade Grit 0.01 0.00 0.00 69.7%
8th-Grade Study Habits -0.01 0.00 0.00 69.7%
8th-Grade Background Characteristics
— 0.33 0.20 77.1%
Combining Two or More 8th-Grade Indicators
8th-Grade Reading and Math ISAT Tests
0.70 0.46 87.3%
8th-Grade Reading and Math ISAT Tests + Core GPA
0.71 0.46 87.6%
8th-Grade Reading and Math ISAT Tests + Background Characteristics
0.73
0.47
88.0%
All 8th-Grade Student-Level Indicators
0.74 0.47 88.0%
Adding Seventh-Grade Indicators
8th- and 7th-Grade Reading and Math ISAT Tests
0.73 0.48 88.2%
Adding School Effects
School Effects Alone (Middle and High School Effects)
0.51
†
†
All 8th-Grade Student-Level Indicators + School Effects
0.79 † †
Note: There are 14,928 students included in these analyses. A model with no explanatory variables would be able to predict correctly 72.0 percent of students whether they score 21 and above versus lower than 21. †Given the low variability in the percent of students scoring 21 or above in ACT composite by middle and high school, these models could not be run.

74
Chapter 7 | Who Is at Risk of Not Reaching the PLAN and ACT Benchmarks?
75
CHAPTER 7
Who Is at Risk of Not Reaching the PLAN and ACT Benchmarks?
This chapter shows the levels of performance in the middle grades that give students a chance of meeting PLAN and ACT benchmarks in the tenth and eleventh grades.
In the previous chapter, we showed that middle grade
test scores strongly predict how students will score on
their tenth- and eleventh-grade tests. In this chapter,
we show who is at risk of not reaching benchmarks and
how middle grade ISAT scores are related to PLAN
scores. Only students with very high test scores in the
middle grades (close to exceeding standards in math
and in reading) have a good chance to reach the bench-
marks in tenth grade. Unfortunately, most students are
scoring far from the high scores (high “meets” range
or “exceeds standards”) and have an extremely small
chance of reaching those benchmarks. The strong rela-
tionship between ISAT and EPAS scores allows middle
grade practitioners, parents, and students to identify
students’ likely scores on the PLAN—which could help
them set challenging, but attainable, learning goals that
are appropriate for individual students, as opposed to
benchmarks that are universally applied even if unat-
tainable by currently known practices.
The Vast Majority of Students Are at Very High Risk of Not Reaching the Tenth-Grade PLAN BenchmarksMore than half of CPS students are not meeting
standards, and one-quarter just barely meet standards
(low range of the “meets” range) in eighth-grade math.
A student who is just meeting standards or is just below
standards is likely to score below the benchmark in all
four subjects tested in PLAN—from two points below in
English to six points below in science. In order to meet
the ACT benchmarks at the end of eleventh grade, stu-
dents who are one point behind on the PLAN will need
to make gains that are twice what is typical over the
tenth- and eleventh-grade years, while students that
are two points behind would need to grow three times
the average rate.57
Students are less likely to meet the math and science
benchmarks than the reading and English benchmarks.
This occurs not because students have lower perfor-
mance in math and science but because the benchmarks
are set higher. Based on their middle grade test scores,
about one-third of students are at very high risk (less
than a 1-in-4 chance) of scoring below the English
benchmark, and over half of students are at very
high risk of scoring below the reading benchmark (see
Figure 29). Over three-fourths of students are at very
high risk of missing the math benchmark, and over 90
percent of students are at very high risk of missing the
science benchmark. Nationally, in 2011-12, only about
one-fifth of PLAN takers pass all four benchmarks;
70 percent pass English, 52 percent pass reading,
36 percent pass math, and 27 percent pass science.58
While many students have extremely low probabili-
ties of reaching any of the ACT benchmarks, there are
some groups of students who have a fairly good chance
of reaching some of the benchmarks. Almost half of
students have a good chance (greater than 50 percent)
of meeting the benchmarks in English, and almost a
quarter of students have a good chance of meeting the
benchmarks in reading. On average, these students
have scores that are at the high end of the “meets” range
on their reading tests in the middle grades. Fourteen
57 Based on a typical growth of just over one point per year. 58 ACT, Inc. (2012).
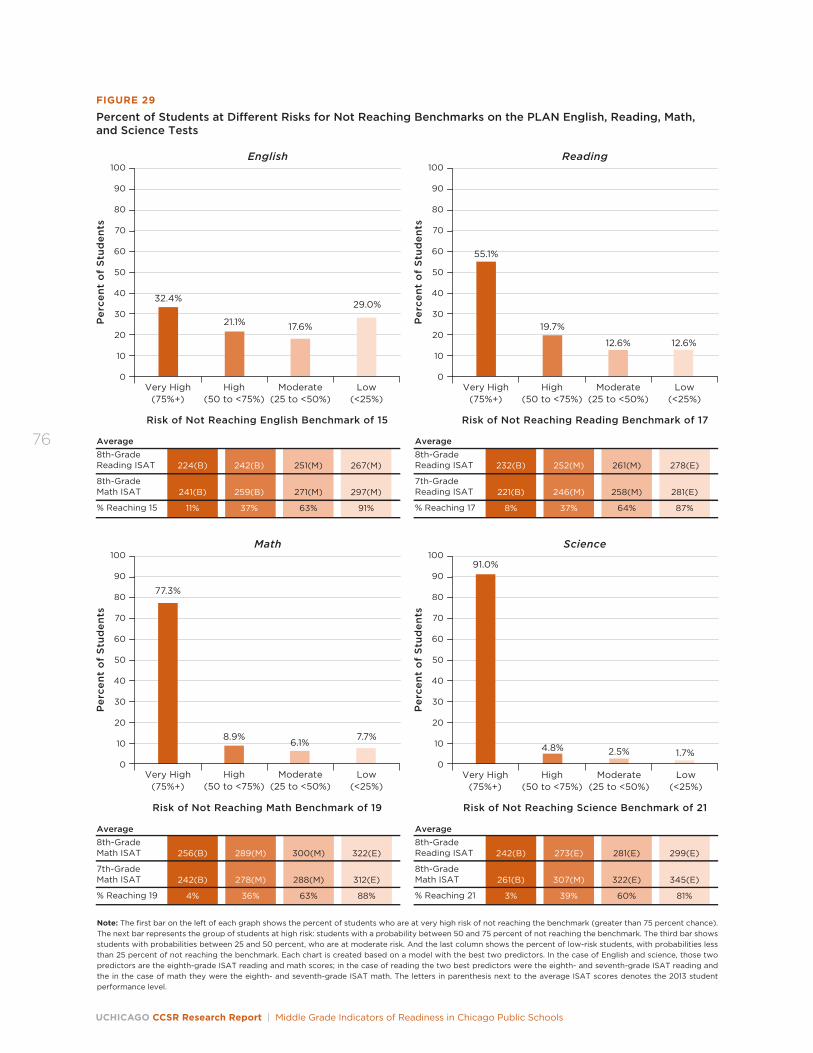
UCHICAGO CCSR Research Report | Middle Grade Indicators of Readiness in Chicago Public Schools
76
242(B)
261(B)
3%
273(E)
307(M)
39%
281(E)
322(E)
60%
299(E)
345(E)
81%
289(M)
278(M)
36%
300(M)
288(M)
63%
322(E)
312(E)
88%
Per
cen
t o
f S
tud
ents
100
30
20
10
0
60
40
80
90
50
70
FIGURE 29
Percent of Students at Di�erent Risks for Not Reaching Benchmarks on the PLAN English, Reading, Math, and Science Tests
Note: The first bar on the left of each graph shows the percent of students who are at very high risk of not reaching the benchmark (greater than 75 percent chance). The next bar represents the group of students at high risk: students with a probability between 50 and 75 percent of not reaching the benchmark. The third bar shows students with probabilities between 25 and 50 percent, who are at moderate risk. And the last column shows the percent of low-risk students, with probabilities less than 25 percent of not reaching the benchmark. Each chart is created based on a model with the best two predictors. In the case of English and science, those two predictors are the eighth-grade ISAT reading and math scores; in the case of reading the two best predictors were the eighth- and seventh-grade ISAT reading and the in the case of math they were the eighth- and seventh-grade ISAT math. The letters in parenthesis next to the average ISAT scores denotes the 2013 student performance level.
Risk of Not Reaching English Benchmark of 15
Very High(75%+)
32.4%
High(50 to <75%)
21.1%
Moderate(25 to <50%)
17.6%
Low(<25%)
29.0%
Per
cen
t o
f S
tud
ents
100
30
20
10
0
60
40
80
90
50
70
Risk of Not Reaching Reading Benchmark of 17
Very High(75%+)
55.1%
High(50 to <75%)
19.7%
Moderate(25 to <50%)
12.6%
Low(<25%)
12.6%
Average8th-GradeReading ISAT
8th-GradeMath ISAT
% Reaching 15
224(B)
241(B)
11%
242(B)
259(B)
37%
251(M)
271(M)
63%
267(M)
297(M)
91%
Average8th-GradeReading ISAT
7th-GradeReading ISAT
% Reaching 17
232(B)
221(B)
8%
252(M)
246(M)
37%
261(M)
258(M)
64%
278(E)
281(E)
87%
Average8th-GradeMath ISAT
7th-GradeMath ISAT
% Reaching 19
256(B)
242(B)
4%
Average8th-GradeReading ISAT
8th-GradeMath ISAT
% Reaching 21
English Reading
Per
cen
t o
f S
tud
ents
100
30
20
10
0
60
40
80
90
50
70
Risk of Not Reaching Math Benchmark of 19
Very High(75%+)
77.3%
High(50 to <75%)
8.9%
Moderate(25 to <50%)
6.1%
Low(<25%)
7.7%
Per
cen
t o
f S
tud
ents
100
30
20
10
0
60
40
80
90
50
70
Risk of Not Reaching Science Benchmark of 21
Very High(75%+)
91.0%
High(50 to <75%)
4.8%
Moderate(25 to <50%)
2.5%
Low(<25%)
1.7%
Math Science
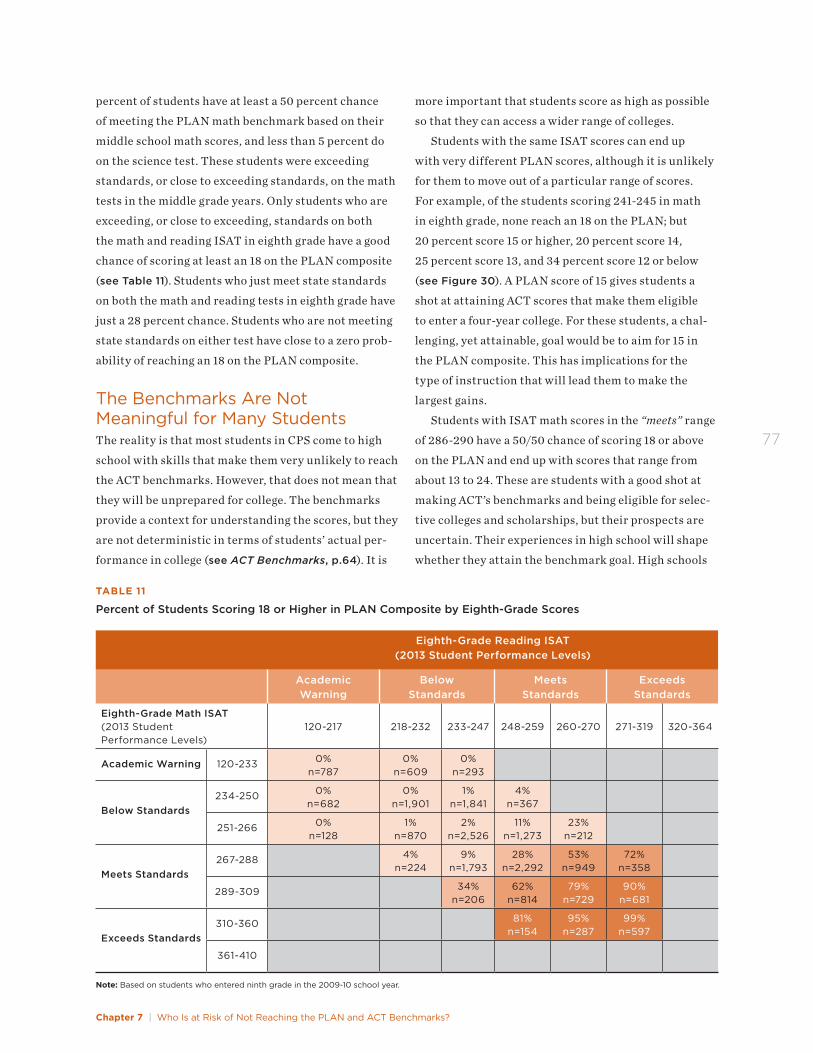
Chapter 7 | Who Is at Risk of Not Reaching the PLAN and ACT Benchmarks?
77
percent of students have at least a 50 percent chance
of meeting the PLAN math benchmark based on their
middle school math scores, and less than 5 percent do
on the science test. These students were exceeding
standards, or close to exceeding standards, on the math
tests in the middle grade years. Only students who are
exceeding, or close to exceeding, standards on both
the math and reading ISAT in eighth grade have a good
chance of scoring at least an 18 on the PLAN composite
(see Table 11). Students who just meet state standards
on both the math and reading tests in eighth grade have
just a 28 percent chance. Students who are not meeting
state standards on either test have close to a zero prob-
ability of reaching an 18 on the PLAN composite.
The Benchmarks Are Not Meaningful for Many StudentsThe reality is that most students in CPS come to high
school with skills that make them very unlikely to reach
the ACT benchmarks. However, that does not mean that
they will be unprepared for college. The benchmarks
provide a context for understanding the scores, but they
are not deterministic in terms of students’ actual per-
formance in college (see ACT Benchmarks, p.64). It is
TABLE 11
Percent of Students Scoring 18 or Higher in PLAN Composite by Eighth-Grade Scores
Eighth-Grade Reading ISAT (2013 Student Performance Levels)
Academic Warning
Below Standards
Meets Standards
Exceeds Standards
Eighth-Grade Math ISAT (2013 Student Performance Levels)
120-217
218-232
233-247
248-259
260-270
271-319
320-364
Academic Warning 120-233 0% n=787
0% n=609
0% n=293
Below Standards234-250 0%
n=6820%
n=1,9011%
n=1,8414%
n=367
251-266 0% n=128
1% n=870
2% n=2,526
11% n=1,273
23% n=212
Meets Standards267-288 4%
n=2249%
n=1,79328%
n=2,29253%
n=94972%
n=358
289-309 34% n=206
62% n=814
79% n=729
90% n=681
Exceeds Standards310-360 81%
n=15495%
n=28799%
n=597
361-410
Note: Based on students who entered ninth grade in the 2009-10 school year.
more important that students score as high as possible
so that they can access a wider range of colleges.
Students with the same ISAT scores can end up
with very different PLAN scores, although it is unlikely
for them to move out of a particular range of scores.
For example, of the students scoring 241-245 in math
in eighth grade, none reach an 18 on the PLAN; but
20 percent score 15 or higher, 20 percent score 14,
25 percent score 13, and 34 percent score 12 or below
(see Figure 30). A PLAN score of 15 gives students a
shot at attaining ACT scores that make them eligible
to enter a four-year college. For these students, a chal-
lenging, yet attainable, goal would be to aim for 15 in
the PLAN composite. This has implications for the
type of instruction that will lead them to make the
largest gains.
Students with ISAT math scores in the “meets” range
of 286-290 have a 50/50 chance of scoring 18 or above
on the PLAN and end up with scores that range from
about 13 to 24. These are students with a good shot at
making ACT’s benchmarks and being eligible for selec-
tive colleges and scholarships, but their prospects are
uncertain. Their experiences in high school will shape
whether they attain the benchmark goal. High schools
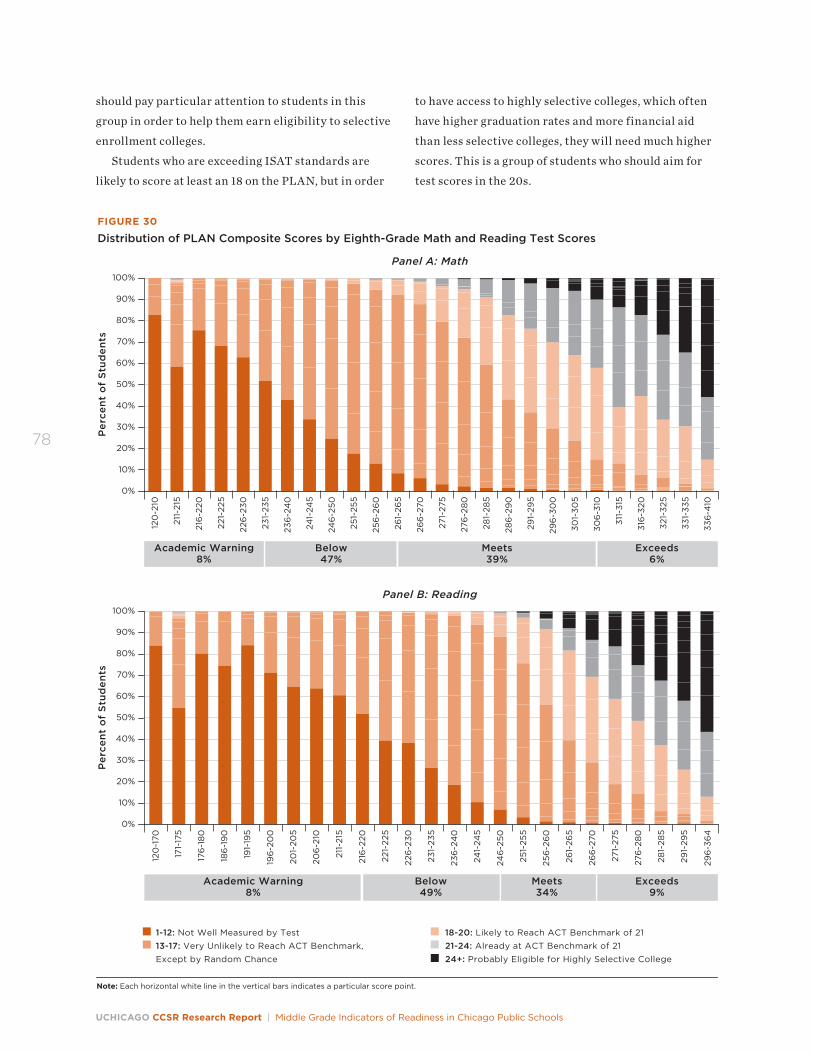
UCHICAGO CCSR Research Report | Middle Grade Indicators of Readiness in Chicago Public Schools
78
should pay particular attention to students in this
group in order to help them earn eligibility to selective
enrollment colleges.
Students who are exceeding ISAT standards are
likely to score at least an 18 on the PLAN, but in order
FIGURE 30
Distribution of PLAN Composite Scores by Eighth-Grade Math and Reading Test Scores
Per
cen
t o
f S
tud
ents
90%
100%
80%
70%
40%
20%
0%
60%
30%
10%
50%
120
-210
211-
215
216
-220
221-
225
226
-230
231-
235
236
-24
0
241-
245
246
-250
251-
255
256
-26
0
261-
265
266
-270
271-
275
276
-28
0
281-
285
286
-29
0
291-
295
296
-30
0
301-
305
306
-310
311-
315
316
-320
321-
325
331-
335
336
-410
1-12: Not Well Measured by Test13-17: Very Unlikely to Reach ACT Benchmark, Except by Random Chance
18-20: Likely to Reach ACT Benchmark of 2121-24: Already at ACT Benchmark of 2124+: Probably Eligible for Highly Selective College
Panel A: Math
Academic Warning8%
Exceeds6%
Below47%
Meets39%
Per
cen
t o
f S
tud
ents
90%
100%
80%
70%
40%
20%
0%
60%
30%
10%
50%
120
-170
171-
175
176
-18
0
186
-19
0
191-
195
196
-20
0
201-
205
206
-210
211-
215
216
-220
221-
225
226
-230
231-
235
236
-24
0
241-
245
246
-250
251-
255
256
-26
0
261-
265
266
-270
271-
275
276
-28
0
281-
285
291-
295
296
-36
4
Panel B: Reading
Academic Warning8%
Exceeds9%
Below49%
Meets34%
Note: Each horizontal white line in the vertical bars indicates a particular score point.
to have access to highly selective colleges, which often
have higher graduation rates and more financial aid
than less selective colleges, they will need much higher
scores. This is a group of students who should aim for
test scores in the 20s.
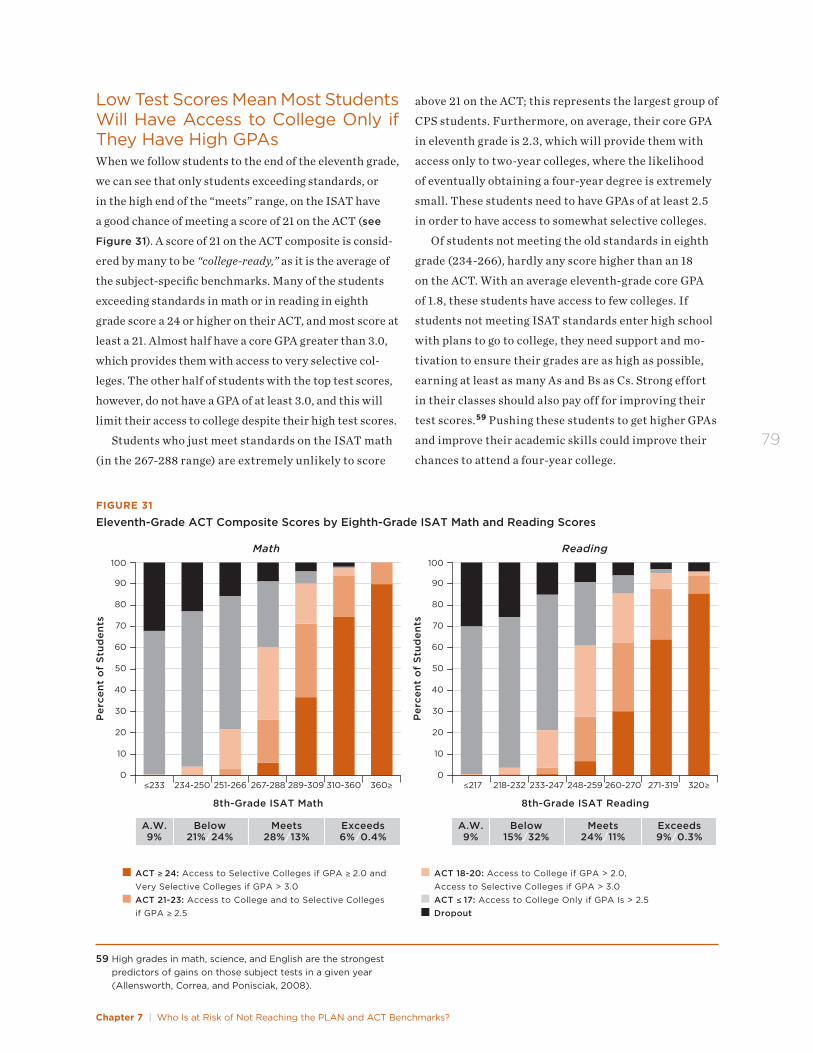
Chapter 7 | Who Is at Risk of Not Reaching the PLAN and ACT Benchmarks?
79
Low Test Scores Mean Most Students Will Have Access to College Only if They Have High GPAsWhen we follow students to the end of the eleventh grade,
we can see that only students exceeding standards, or
in the high end of the “meets” range, on the ISAT have
a good chance of meeting a score of 21 on the ACT (see
Figure 31). A score of 21 on the ACT composite is consid-
ered by many to be “college-ready,” as it is the average of
the subject-specific benchmarks. Many of the students
exceeding standards in math or in reading in eighth
grade score a 24 or higher on their ACT, and most score at
least a 21. Almost half have a core GPA greater than 3.0,
which provides them with access to very selective col-
leges. The other half of students with the top test scores,
however, do not have a GPA of at least 3.0, and this will
limit their access to college despite their high test scores.
Students who just meet standards on the ISAT math
(in the 267-288 range) are extremely unlikely to score
59 High grades in math, science, and English are the strongest predictors of gains on those subject tests in a given year (Allensworth, Correa, and Ponisciak, 2008).
8th-Grade ISAT Math
FIGURE 31
Eleventh-Grade ACT Composite Scores by Eighth-Grade ISAT Math and Reading Scores
Per
cen
t o
f S
tud
ents
90
100
80
70
40
20
0
60
30
10
50
≤233 267-288 289-309 310-360 360≥234-250 251-266
Math Reading
8th-Grade ISAT Reading
Per
cen
t o
f S
tud
ents
90
100
80
70
40
20
0
60
30
10
50
≤217 248-259 260-270 271-319 320≥218-232 233-247
A.W.9%
Exceeds6%/0.4%
Below21%/24%
Meets28%/13%
A.W.9%
Exceeds9%/0.3%
Below15%/32%
Meets24%/11%
ACT ≥ 24: Access to Selective Colleges if GPA ≥ 2.0 and Very Selective Colleges if GPA > 3.0ACT 21-23: Access to College and to Selective Collegesif GPA ≥ 2.5
ACT 18-20: Access to College if GPA > 2.0, Access to Selective Colleges if GPA > 3.0 ACT ≤ 17: Access to College Only if GPA Is > 2.5Dropout
above 21 on the ACT; this represents the largest group of
CPS students. Furthermore, on average, their core GPA
in eleventh grade is 2.3, which will provide them with
access only to two-year colleges, where the likelihood
of eventually obtaining a four-year degree is extremely
small. These students need to have GPAs of at least 2.5
in order to have access to somewhat selective colleges.
Of students not meeting the old standards in eighth
grade (234-266), hardly any score higher than an 18
on the ACT. With an average eleventh-grade core GPA
of 1.8, these students have access to few colleges. If
students not meeting ISAT standards enter high school
with plans to go to college, they need support and mo-
tivation to ensure their grades are as high as possible,
earning at least as many As and Bs as Cs. Strong effort
in their classes should also pay off for improving their
test scores.59 Pushing these students to get higher GPAs
and improve their academic skills could improve their
chances to attend a four-year college.
UCHICAGO CCSR Research Report | Middle Grade Indicators of Readiness in Chicago Public Schools
80
SummaryParents, teachers, and students can gauge students’
likely PLAN and ACT scores based on their ISAT
performance and develop meaningful goals for learn-
ing based on college expectations before students begin
high school. What those goals are for an individual
student should depend not only on readiness bench-
marks and standards but also on students’ current level
of academic skills.
Test scores are useful for parents and teachers to
gauge students’ level of academic skills; they provide
information that can be used to guide further instruc-
tion and decisions about coursework. State standards
and college-ready benchmarks provide a context for
making meaning from scores. In practice, however,
these benchmarks do not make good goals for the vast
majority of students. For students exceeding eighth-
grade standards in both reading and math, the ACT
benchmarks provide targets that are too low to provide
a good chance of attaining scholarships and getting
into highly selective colleges. All other students have a
very slim chance of meeting the ACT benchmark scores,
potentially leading to frustration and disappointment
on the part of students and school staff. Unless schools
can figure out how to substantially increase the rates
at which the students learn—given the resources they
can make available—the benchmarks are not attainable
for most students except by random chance. The goal
should be to reach the highest attainable scores, even if
those scores are below benchmarks. High PLAN scores
will put students on a better path to reach high ACT
composite scores; this, in combination with high GPAs,
will help students to access more selective colleges,
even if a student does not score at the benchmark.
What can be done before students reach high school?
One strategy is to be discerning when advising students
about applying to high school, since the previous
chapter showed that students with the same middle
grade scores make very different test score gains at
different high schools. Another obvious answer is to
assist students to attain higher levels of performance
in the middle grades so that they have a better chance
of getting good PLAN and ACT scores. There is a push
to move all students to the “exceeds” range on the ISAT,
and this year standards changed at the state level to
more closely align with college expectations. These
benchmarks are useful only if schools know how to
improve students’ test scores sufficiently to reach
these levels of performance. Chapter 8 shows how
much students’ test scores grow in the middle grades;
variation in growth is much smaller than most people
believe, especially in reading. Currently, there are no
schools that come close to moving students from just
meeting standards to exceeding them.
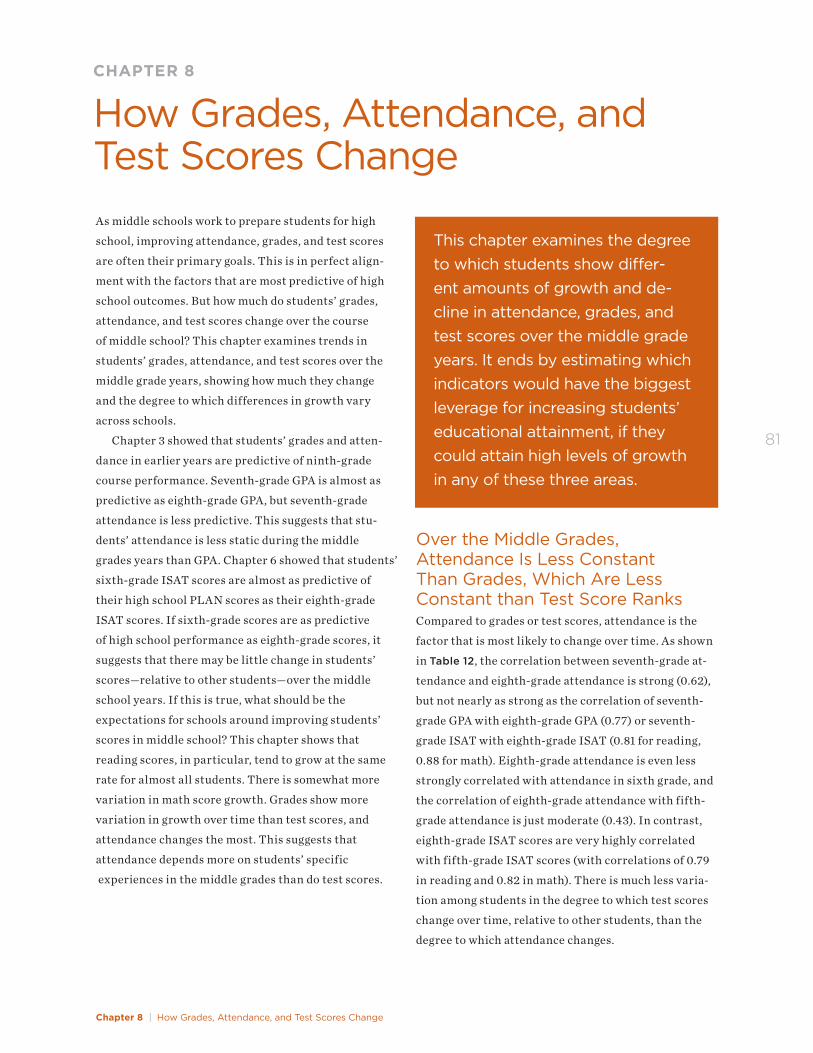
Chapter 8 | How Grades, Attendance, and Test Scores Change
81
CHAPTER 8
How Grades, Attendance, and Test Scores Change
This chapter examines the degree to which students show differ-ent amounts of growth and de-cline in attendance, grades, and test scores over the middle grade years. It ends by estimating which indicators would have the biggest leverage for increasing students’ educational attainment, if they could attain high levels of growth in any of these three areas.
As middle schools work to prepare students for high
school, improving attendance, grades, and test scores
are often their primary goals. This is in perfect align-
ment with the factors that are most predictive of high
school outcomes. But how much do students’ grades,
attendance, and test scores change over the course
of middle school? This chapter examines trends in
students’ grades, attendance, and test scores over the
middle grade years, showing how much they change
and the degree to which differences in growth vary
across schools.
Chapter 3 showed that students’ grades and atten-
dance in earlier years are predictive of ninth-grade
course performance. Seventh-grade GPA is almost as
predictive as eighth-grade GPA, but seventh-grade
attendance is less predictive. This suggests that stu-
dents’ attendance is less static during the middle
grades years than GPA. Chapter 6 showed that students’
sixth-grade ISAT scores are almost as predictive of
their high school PLAN scores as their eighth-grade
ISAT scores. If sixth-grade scores are as predictive
of high school performance as eighth-grade scores, it
suggests that there may be little change in students’
scores—relative to other students—over the middle
school years. If this is true, what should be the
expectations for schools around improving students’
scores in middle school? This chapter shows that
reading scores, in particular, tend to grow at the same
rate for almost all students. There is somewhat more
variation in math score growth. Grades show more
variation in growth over time than test scores, and
attendance changes the most. This suggests that
attendance depends more on students’ specific
experiences in the middle grades than do test scores.
Over the Middle Grades, Attendance Is Less Constant Than Grades, Which Are Less Constant than Test Score RanksCompared to grades or test scores, attendance is the
factor that is most likely to change over time. As shown
in Table 12, the correlation between seventh-grade at-
tendance and eighth-grade attendance is strong (0.62),
but not nearly as strong as the correlation of seventh-
grade GPA with eighth-grade GPA (0.77) or seventh-
grade ISAT with eighth-grade ISAT (0.81 for reading,
0.88 for math). Eighth-grade attendance is even less
strongly correlated with attendance in sixth grade, and
the correlation of eighth-grade attendance with fifth-
grade attendance is just moderate (0.43). In contrast,
eighth-grade ISAT scores are very highly correlated
with fifth-grade ISAT scores (with correlations of 0.79
in reading and 0.82 in math). There is much less varia-
tion among students in the degree to which test scores
change over time, relative to other students, than the
degree to which attendance changes.
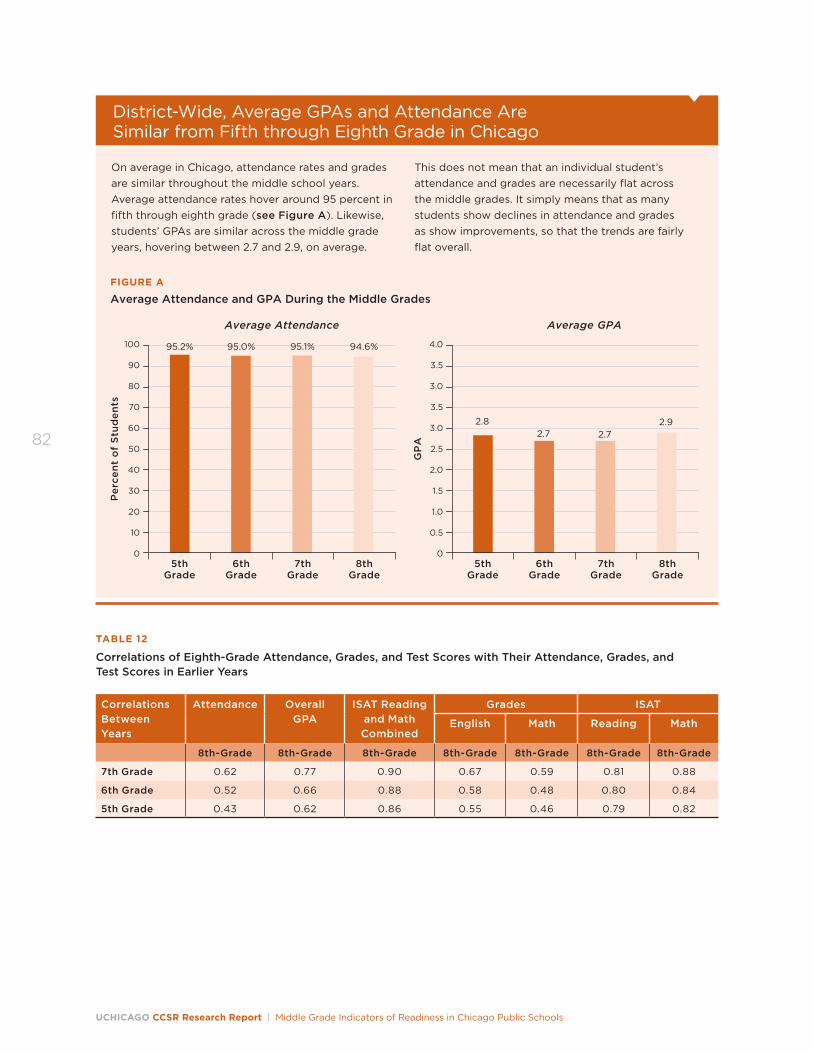
UCHICAGO CCSR Research Report | Middle Grade Indicators of Readiness in Chicago Public Schools
82
TABLE 12
Correlations of Eighth-Grade Attendance, Grades, and Test Scores with Their Attendance, Grades, and Test Scores in Earlier Years
Correlations Between Years
Attendance Overall GPA
ISAT Reading and Math Combined
Grades ISAT
English Math Reading Math
8th-Grade 8th-Grade 8th-Grade 8th-Grade 8th-Grade 8th-Grade 8th-Grade
7th Grade 0.62 0.77 0.90 0.67 0.59 0.81 0.88
6th Grade 0.52 0.66 0.88 0.58 0.48 0.80 0.84
5th Grade 0.43 0.62 0.86 0.55 0.46 0.79 0.82
On average in Chicago, attendance rates and grades are similar throughout the middle school years. Average attendance rates hover around 95 percent in fifth through eighth grade (see Figure A). Likewise, students’ GPAs are similar across the middle grade years, hovering between 2.7 and 2.9, on average.
This does not mean that an individual student’s attendance and grades are necessarily flat across the middle grades. It simply means that as many students show declines in attendance and grades as show improvements, so that the trends are fairly flat overall.
District-Wide, Average GPAs and Attendance Are Similar from Fifth through Eighth Grade in Chicago
Per
cen
t o
f S
tud
ents
100
30
20
10
0
60
40
80
90
50
70
FIGURE A
Average Attendance and GPA During the Middle Grades
5thGrade
95.2%
6thGrade
95.0%
7thGrade
95.1%
8thGrade
5thGrade
6thGrade
7thGrade
8thGrade
94.6%
GP
A
4.0
1.5
1.0
0.5
0
3.0
2.0
3.0
3.5
2.5
3.5
2.82.7 2.7
2.9
Average Attendance Average GPA
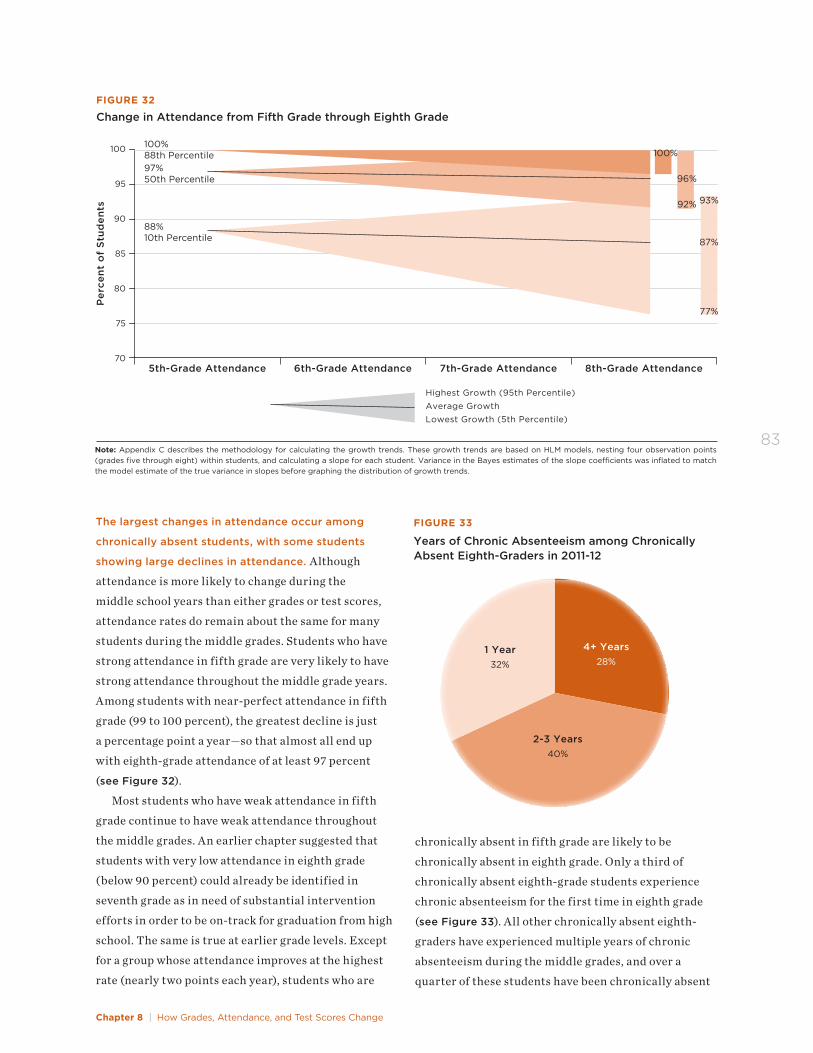
Chapter 8 | How Grades, Attendance, and Test Scores Change
83
The largest changes in attendance occur among
chronically absent students, with some students
showing large declines in attendance. Although
attendance is more likely to change during the
middle school years than either grades or test scores,
attendance rates do remain about the same for many
students during the middle grades. Students who have
strong attendance in fifth grade are very likely to have
strong attendance throughout the middle grade years.
Among students with near-perfect attendance in fifth
grade (99 to 100 percent), the greatest decline is just
a percentage point a year—so that almost all end up
with eighth-grade attendance of at least 97 percent
(see Figure 32).
Most students who have weak attendance in fifth
grade continue to have weak attendance throughout
the middle grades. An earlier chapter suggested that
students with very low attendance in eighth grade
(below 90 percent) could already be identified in
seventh grade as in need of substantial intervention
efforts in order to be on-track for graduation from high
school. The same is true at earlier grade levels. Except
for a group whose attendance improves at the highest
rate (nearly two points each year), students who are
chronically absent in fifth grade are likely to be
chronically absent in eighth grade. Only a third of
chronically absent eighth-grade students experience
chronic absenteeism for the first time in eighth grade
(see Figure 33). All other chronically absent eighth-
graders have experienced multiple years of chronic
absenteeism during the middle grades, and over a
quarter of these students have been chronically absent
Per
cen
t o
f S
tud
ents
100
70
80
90
95
75
85
FIGURE 32
Change in Attendance from Fifth Grade through Eighth Grade
5th-Grade Attendance 6th-Grade Attendance 7th-Grade Attendance 8th-Grade Attendance
100%88th Percentile97%50th Percentile
88%10th Percentile
Highest Growth (95th Percentile)Average GrowthLowest Growth (5th Percentile)
Note: Appendix C describes the methodology for calculating the growth trends. These growth trends are based on HLM models, nesting four observation points (grades five through eight) within students, and calculating a slope for each student. Variance in the Bayes estimates of the slope coe�cients was inflated to match the model estimate of the true variance in slopes before graphing the distribution of growth trends.
96%
100%
92%
77%
87%
93%
FIGURE 33
Years of Chronic Absenteeism among Chronically Absent Eighth-Graders in 2011-12
1 Year32%
2-3 Years40%
4+ Years28%
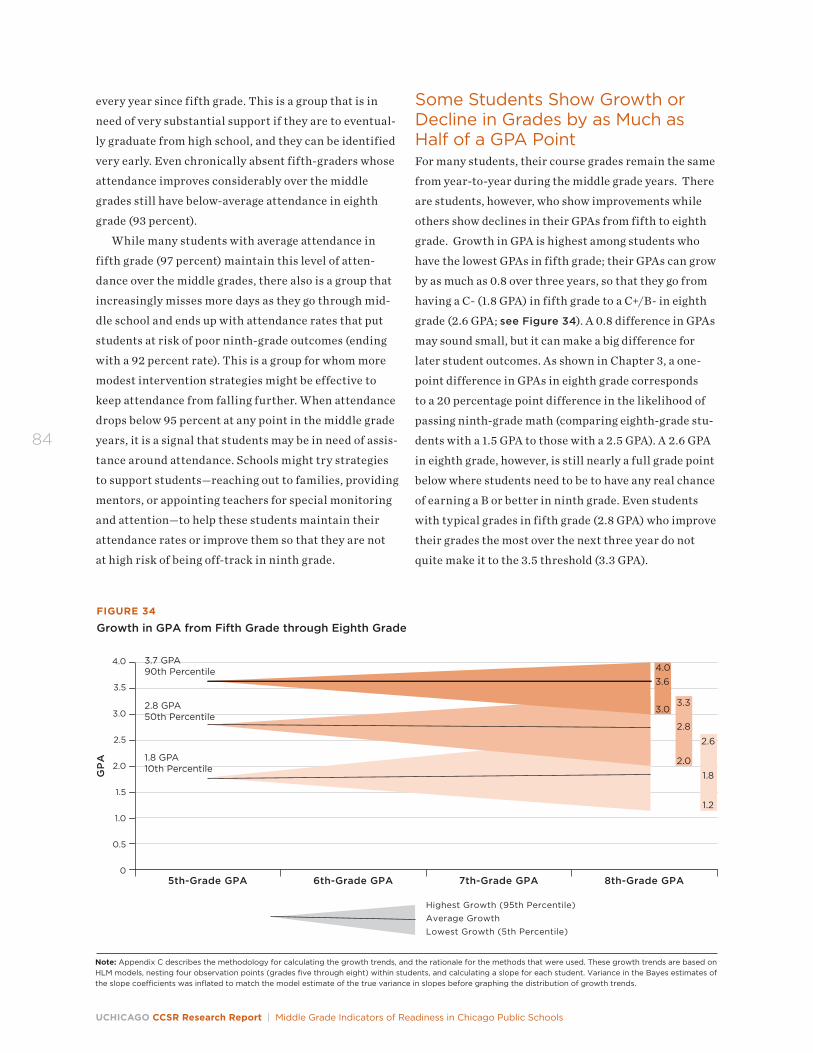
UCHICAGO CCSR Research Report | Middle Grade Indicators of Readiness in Chicago Public Schools
84
every year since fifth grade. This is a group that is in
need of very substantial support if they are to eventual-
ly graduate from high school, and they can be identified
very early. Even chronically absent fifth-graders whose
attendance improves considerably over the middle
grades still have below-average attendance in eighth
grade (93 percent).
While many students with average attendance in
fifth grade (97 percent) maintain this level of atten-
dance over the middle grades, there also is a group that
increasingly misses more days as they go through mid-
dle school and ends up with attendance rates that put
students at risk of poor ninth-grade outcomes (ending
with a 92 percent rate). This is a group for whom more
modest intervention strategies might be effective to
keep attendance from falling further. When attendance
drops below 95 percent at any point in the middle grade
years, it is a signal that students may be in need of assis-
tance around attendance. Schools might try strategies
to support students—reaching out to families, providing
mentors, or appointing teachers for special monitoring
and attention—to help these students maintain their
attendance rates or improve them so that they are not
at high risk of being off-track in ninth grade.
Some Students Show Growth or Decline in Grades by as Much as Half of a GPA PointFor many students, their course grades remain the same
from year-to-year during the middle grade years. There
are students, however, who show improvements while
others show declines in their GPAs from fifth to eighth
grade. Growth in GPA is highest among students who
have the lowest GPAs in fifth grade; their GPAs can grow
by as much as 0.8 over three years, so that they go from
having a C- (1.8 GPA) in fifth grade to a C+/B- in eighth
grade (2.6 GPA; see Figure 34). A 0.8 difference in GPAs
may sound small, but it can make a big difference for
later student outcomes. As shown in Chapter 3, a one-
point difference in GPAs in eighth grade corresponds
to a 20 percentage point difference in the likelihood of
passing ninth-grade math (comparing eighth-grade stu-
dents with a 1.5 GPA to those with a 2.5 GPA). A 2.6 GPA
in eighth grade, however, is still nearly a full grade point
below where students need to be to have any real chance
of earning a B or better in ninth grade. Even students
with typical grades in fifth grade (2.8 GPA) who improve
their grades the most over the next three year do not
quite make it to the 3.5 threshold (3.3 GPA).
GP
A
4.0
0
1.0
3.0
3.5
0.5
2.0
1.5
2.5
FIGURE 34
Growth in GPA from Fifth Grade through Eighth Grade
5th-Grade GPA 6th-Grade GPA 7th-Grade GPA 8th-Grade GPA
Highest Growth (95th Percentile)Average GrowthLowest Growth (5th Percentile)
Note: Appendix C describes the methodology for calculating the growth trends, and the rationale for the methods that were used. These growth trends are based on HLM models, nesting four observation points (grades five through eight) within students, and calculating a slope for each student. Variance in the Bayes estimates of the slope coe�cients was inflated to match the model estimate of the true variance in slopes before graphing the distribution of growth trends.
3.7 GPA90th Percentile
2.8 GPA50th Percentile
1.8 GPA10th Percentile
3.3
2.0
2.8
2.6
1.8
1.2
3.6
3.0
4.0
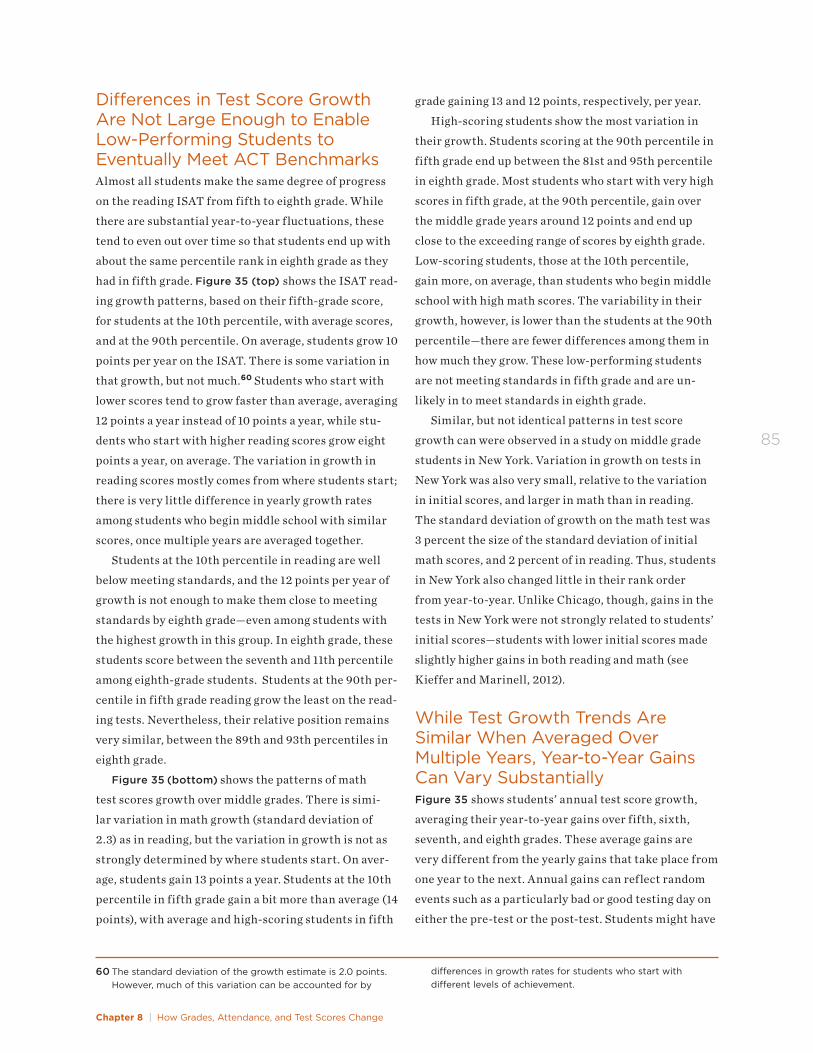
Chapter 8 | How Grades, Attendance, and Test Scores Change
85
60 The standard deviation of the growth estimate is 2.0 points. However, much of this variation can be accounted for by
differences in growth rates for students who start with different levels of achievement.
Differences in Test Score Growth Are Not Large Enough to Enable Low-Performing Students to Eventually Meet ACT Benchmarks Almost all students make the same degree of progress
on the reading ISAT from fifth to eighth grade. While
there are substantial year-to-year fluctuations, these
tend to even out over time so that students end up with
about the same percentile rank in eighth grade as they
had in fifth grade. Figure 35 (top) shows the ISAT read-
ing growth patterns, based on their fifth-grade score,
for students at the 10th percentile, with average scores,
and at the 90th percentile. On average, students grow 10
points per year on the ISAT. There is some variation in
that growth, but not much.60 Students who start with
lower scores tend to grow faster than average, averaging
12 points a year instead of 10 points a year, while stu-
dents who start with higher reading scores grow eight
points a year, on average. The variation in growth in
reading scores mostly comes from where students start;
there is very little difference in yearly growth rates
among students who begin middle school with similar
scores, once multiple years are averaged together.
Students at the 10th percentile in reading are well
below meeting standards, and the 12 points per year of
growth is not enough to make them close to meeting
standards by eighth grade—even among students with
the highest growth in this group. In eighth grade, these
students score between the seventh and 11th percentile
among eighth-grade students. Students at the 90th per-
centile in fifth grade reading grow the least on the read-
ing tests. Nevertheless, their relative position remains
very similar, between the 89th and 93th percentiles in
eighth grade.
Figure 35 (bottom) shows the patterns of math
test scores growth over middle grades. There is simi-
lar variation in math growth (standard deviation of
2.3) as in reading, but the variation in growth is not as
strongly determined by where students start. On aver-
age, students gain 13 points a year. Students at the 10th
percentile in fifth grade gain a bit more than average (14
points), with average and high-scoring students in fifth
grade gaining 13 and 12 points, respectively, per year.
High-scoring students show the most variation in
their growth. Students scoring at the 90th percentile in
fifth grade end up between the 81st and 95th percentile
in eighth grade. Most students who start with very high
scores in fifth grade, at the 90th percentile, gain over
the middle grade years around 12 points and end up
close to the exceeding range of scores by eighth grade.
Low-scoring students, those at the 10th percentile,
gain more, on average, than students who begin middle
school with high math scores. The variability in their
growth, however, is lower than the students at the 90th
percentile—there are fewer differences among them in
how much they grow. These low-performing students
are not meeting standards in fifth grade and are un-
likely in to meet standards in eighth grade.
Similar, but not identical patterns in test score
growth can were observed in a study on middle grade
students in New York. Variation in growth on tests in
New York was also very small, relative to the variation
in initial scores, and larger in math than in reading.
The standard deviation of growth on the math test was
3 percent the size of the standard deviation of initial
math scores, and 2 percent of in reading. Thus, students
in New York also changed little in their rank order
from year-to-year. Unlike Chicago, though, gains in the
tests in New York were not strongly related to students’
initial scores—students with lower initial scores made
slightly higher gains in both reading and math (see
Kieffer and Marinell, 2012).
While Test Growth Trends Are Similar When Averaged Over Multiple Years, Year-to-Year Gains Can Vary SubstantiallyFigure 35 shows students’ annual test score growth,
averaging their year-to-year gains over fifth, sixth,
seventh, and eighth grades. These average gains are
very different from the yearly gains that take place from
one year to the next. Annual gains can reflect random
events such as a particularly bad or good testing day on
either the pre-test or the post-test. Students might have
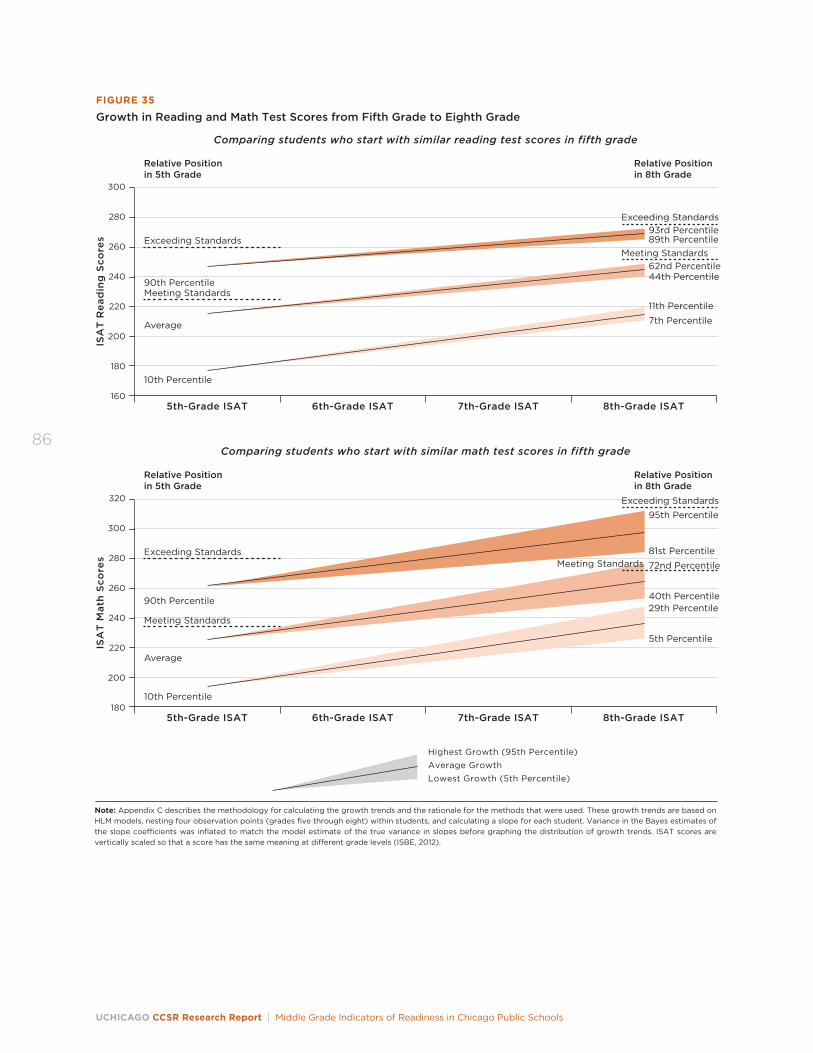
UCHICAGO CCSR Research Report | Middle Grade Indicators of Readiness in Chicago Public Schools
86
ISA
T R
ead
ing
Sco
res
300
160
180
260
280
220
200
240
FIGURE 35
Growth in Reading and Math Test Scores from Fifth Grade to Eighth Grade
5th-Grade ISAT 6th-Grade ISAT 7th-Grade ISAT 8th-Grade ISAT
Relative Positionin 5th Grade
Relative Positionin 8th Grade
Exceeding Standards
90th Percentile
Average
Meeting Standards
10th Percentile
Highest Growth (95th Percentile)Average GrowthLowest Growth (5th Percentile)
Note: Appendix C describes the methodology for calculating the growth trends and the rationale for the methods that were used. These growth trends are based on HLM models, nesting four observation points (grades five through eight) within students, and calculating a slope for each student. Variance in the Bayes estimates of the slope coe�cients was inflated to match the model estimate of the true variance in slopes before graphing the distribution of growth trends. ISAT scores are vertically scaled so that a score has the same meaning at di�erent grade levels (ISBE, 2012).
Comparing students who start with similar reading test scores in fifth grade
Exceeding Standards93rd Percentile89th Percentile
62nd Percentile44th Percentile
11th Percentile
7th Percentile
ISA
T M
ath
Sco
res
320
180
200
280
300
240
220
260
5th-Grade ISAT 6th-Grade ISAT 7th-Grade ISAT 8th-Grade ISAT
Relative Positionin 5th Grade
Relative Positionin 8th Grade
Exceeding Standards
90th Percentile
Average
Meeting Standards
10th Percentile
Comparing students who start with similar math test scores in fifth grade
Exceeding Standards
Meeting Standards
Meeting Standards
95th Percentile
81st Percentile
72nd Percentile
40th Percentile29th Percentile
5th Percentile
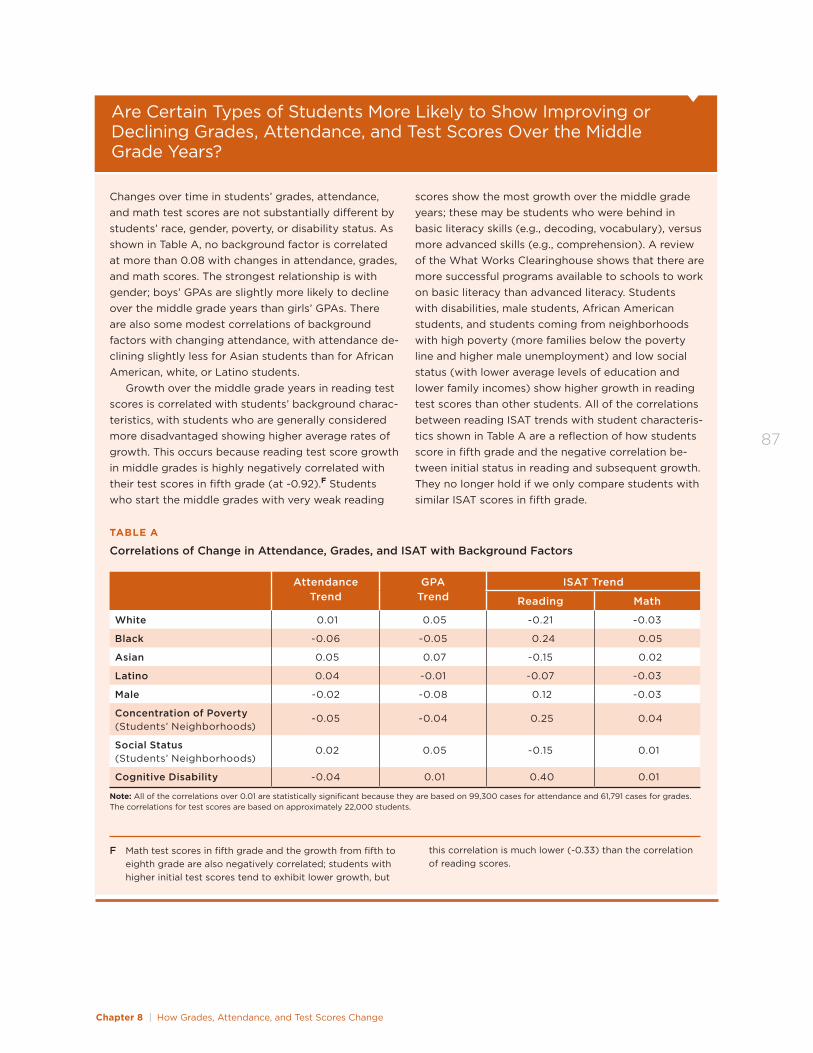
Chapter 8 | How Grades, Attendance, and Test Scores Change
87
F Math test scores in fifth grade and the growth from fifth to eighth grade are also negatively correlated; students with higher initial test scores tend to exhibit lower growth, but
this correlation is much lower (-0.33) than the correlation of reading scores.
Changes over time in students’ grades, attendance, and math test scores are not substantially different by students’ race, gender, poverty, or disability status. As shown in Table A, no background factor is correlated at more than 0.08 with changes in attendance, grades, and math scores. The strongest relationship is with gender; boys’ GPAs are slightly more likely to decline over the middle grade years than girls’ GPAs. There are also some modest correlations of background factors with changing attendance, with attendance de-clining slightly less for Asian students than for African American, white, or Latino students.
Growth over the middle grade years in reading test scores is correlated with students’ background charac-teristics, with students who are generally considered more disadvantaged showing higher average rates of growth. This occurs because reading test score growth in middle grades is highly negatively correlated with their test scores in fifth grade (at -0.92).F Students who start the middle grades with very weak reading
scores show the most growth over the middle grade years; these may be students who were behind in basic literacy skills (e.g., decoding, vocabulary), versus more advanced skills (e.g., comprehension). A review of the What Works Clearinghouse shows that there are more successful programs available to schools to work on basic literacy than advanced literacy. Students with disabilities, male students, African American students, and students coming from neighborhoods with high poverty (more families below the poverty line and higher male unemployment) and low social status (with lower average levels of education and lower family incomes) show higher growth in reading test scores than other students. All of the correlations between reading ISAT trends with student characteris-tics shown in Table A are a reflection of how students score in fifth grade and the negative correlation be-tween initial status in reading and subsequent growth. They no longer hold if we only compare students with similar ISAT scores in fifth grade.
Are Certain Types of Students More Likely to Show Improving or Declining Grades, Attendance, and Test Scores Over the Middle Grade Years?
TABLE A
Correlations of Change in Attendance, Grades, and ISAT with Background Factors
Attendance Trend
GPA Trend
ISAT Trend
Reading Math
White 0.01 0.05 -0.21 -0.03
Black -0.06 -0.05 0.24 0.05
Asian 0.05 0.07 -0.15 0.02
Latino 0.04 -0.01 -0.07 -0.03
Male -0.02 -0.08 0.12 -0.03
Concentration of Poverty(Students’ Neighborhoods)
-0.05 -0.04 0.25 0.04
Social Status(Students’ Neighborhoods)
0.02 0.05 -0.15 0.01
Cognitive Disability -0.04 0.01 0.40 0.01
Note: All of the correlations over 0.01 are statistically significant because they are based on 99,300 cases for attendance and 61,791 cases for grades. The correlations for test scores are based on approximately 22,000 students.
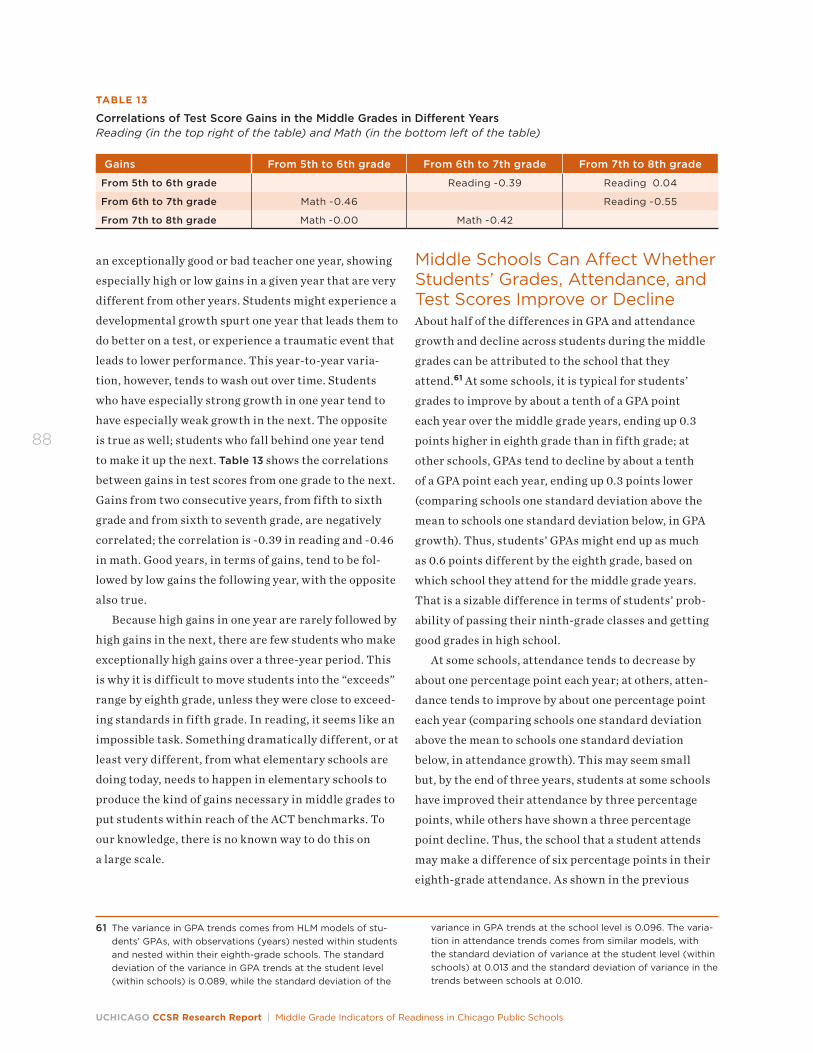
UCHICAGO CCSR Research Report | Middle Grade Indicators of Readiness in Chicago Public Schools
88
TABLE 13
Correlations of Test Score Gains in the Middle Grades in Different Years Reading (in the top right of the table) and Math (in the bottom left of the table) Gains From 5th to 6th grade From 6th to 7th grade From 7th to 8th grade
From 5th to 6th grade Reading -0.39 Reading 0.04
From 6th to 7th grade Math -0.46 Reading -0.55
From 7th to 8th grade Math -0.00 Math -0.42
an exceptionally good or bad teacher one year, showing
especially high or low gains in a given year that are very
different from other years. Students might experience a
developmental growth spurt one year that leads them to
do better on a test, or experience a traumatic event that
leads to lower performance. This year-to-year varia-
tion, however, tends to wash out over time. Students
who have especially strong growth in one year tend to
have especially weak growth in the next. The opposite
is true as well; students who fall behind one year tend
to make it up the next. Table 13 shows the correlations
between gains in test scores from one grade to the next.
Gains from two consecutive years, from fifth to sixth
grade and from sixth to seventh grade, are negatively
correlated; the correlation is -0.39 in reading and -0.46
in math. Good years, in terms of gains, tend to be fol-
lowed by low gains the following year, with the opposite
also true.
Because high gains in one year are rarely followed by
high gains in the next, there are few students who make
exceptionally high gains over a three-year period. This
is why it is difficult to move students into the “exceeds”
range by eighth grade, unless they were close to exceed-
ing standards in fifth grade. In reading, it seems like an
impossible task. Something dramatically different, or at
least very different, from what elementary schools are
doing today, needs to happen in elementary schools to
produce the kind of gains necessary in middle grades to
put students within reach of the ACT benchmarks. To
our knowledge, there is no known way to do this on
a large scale.
Middle Schools Can Affect Whether Students’ Grades, Attendance, and Test Scores Improve or DeclineAbout half of the differences in GPA and attendance
growth and decline across students during the middle
grades can be attributed to the school that they
attend.61 At some schools, it is typical for students’
grades to improve by about a tenth of a GPA point
each year over the middle grade years, ending up 0.3
points higher in eighth grade than in fifth grade; at
other schools, GPAs tend to decline by about a tenth
of a GPA point each year, ending up 0.3 points lower
(comparing schools one standard deviation above the
mean to schools one standard deviation below, in GPA
growth). Thus, students’ GPAs might end up as much
as 0.6 points different by the eighth grade, based on
which school they attend for the middle grade years.
That is a sizable difference in terms of students’ prob-
ability of passing their ninth-grade classes and getting
good grades in high school.
At some schools, attendance tends to decrease by
about one percentage point each year; at others, atten-
dance tends to improve by about one percentage point
each year (comparing schools one standard deviation
above the mean to schools one standard deviation
below, in attendance growth). This may seem small
but, by the end of three years, students at some schools
have improved their attendance by three percentage
points, while others have shown a three percentage
point decline. Thus, the school that a student attends
may make a difference of six percentage points in their
eighth-grade attendance. As shown in the previous
61 The variance in GPA trends comes from HLM models of stu-dents’ GPAs, with observations (years) nested within students and nested within their eighth-grade schools. The standard deviation of the variance in GPA trends at the student level (within schools) is 0.089, while the standard deviation of the
variance in GPA trends at the school level is 0.096. The varia-tion in attendance trends comes from similar models, with the standard deviation of variance at the student level (within schools) at 0.013 and the standard deviation of variance in the trends between schools at 0.010.
Chapter 8 | How Grades, Attendance, and Test Scores Change
89
62 We cannot definitively test whether the observed relation-ships of the indicators with the outcomes are direct, indirect, or spurious, as there may be unmeasured variables that were not included in the models employed for Chapter 1 through
Chapter 3. However, the methods employed to compare among the indicators were designed to determine which showed the largest direct relationships among the predictors that were available.
chapter, six percentage points in attendance is very
substantial in terms of students’ probability of suc-
cess in high school; a difference of 10 percentage points
moves a student from perfect attendance (100 percent)
to chronically absent (90 percent).
There are also differences across schools in the size
of students’ yearly gains on the ISAT; some schools
show higher gains across the middle grade years than
others. In reading, half of the differences in students’
gains can be attributed to which school they attend.
Among students at the 50th percentile, for example,
students at schools with high growth gain 11 points a
year, while those at schools with low growth gain nine
points a year (comparing schools one standard devia-
tion above the mean to schools one standard deviation
below, in test score growth). In math, school differences
account for more than half of the differences across
students in yearly growth; students at schools with high
growth gain 15 points a year, while those at schools with
low growth gain 11 points a year. Despite the differences
in what schools can contribute to growth, the gaps in
test scores are so large from the start of middle school
that no schools close those gaps in the middle grades.
Middle Grade GPA and Attendance Have the Greatest Potential for Improving High School OutcomesAs schools look for indicators that are likely to have
high leverage for moving student outcomes, they need
to consider two factors. First, they need to consider
whether moving the indicator would likely move the
later outcome they care about (e.g., high school and
college graduation). Second, they need to consider
the degree to which they can move the indicator with
known strategies. The first factor depends on the
degree to which the indicator is strongly and directly
related to later outcomes. For high school gradua-
tion and college readiness, course grades are the most
strongly related to later outcomes, followed by atten-
dance, followed by ISAT scores; for ACT scores, ISAT
scores are the strongest predictor.62 The second factor
depends on having known programmatic effects for
moving the indicators, and evidence that differences
in school practices result in differences in growth on
the indicator. Variation in growth across students dur-
ing the middle grades provides some indication of the
degree to which there are known strategies to change
the indicators during the middle grade years.
To put both of these factors together, Figure 36
shows the predicted ninth-grade outcomes for a stu-
dent that ended fifth grade with average attendance,
grades, and test scores, but showed very high levels of
growth on each of the indicators from fifth to eighth
grade. Figure 36 also shows the predicted ninth-grade
outcomes for a student that had average performance in
fifth grade, but showed little improvement throughout
the middle grade years. While this is simply a simula-
tion, and there are many factors that might influence
students’ actual performance, it provides an estimate
of the degree to which students’ high school outcomes
could be influenced by what happens to their perfor-
mance in the middle grades.
What happens in middle grades does seem to mat-
ter considerably for students’ ninth-grade outcomes,
especially their growth in grades and attendance. While
students with average performance in fifth grade are
unlikely to be at the top of their class in high school,
their probability of being on-track goes from 54 to 95
percent, depending on whether their grades declined
( from 2.8 to 2.0) or improved ( from 2.8 to 3.3) during
the middle grades. Likewise, their predicted ninth-
grade GPA goes from 1.9 to 2.4, based on whether their
grades declined or improved from fifth to eighth grade.
Their predicted PLAN scores are also one point higher
(16 compared to 15) if their grades improved, rather
than declined, from fifth to eighth grade.
Changes in attendance over the middle grade years
are also strongly associated with different ninth-grade
outcomes. Students’ probability of being on-track goes
from 66 to 93 percent, depending on whether their
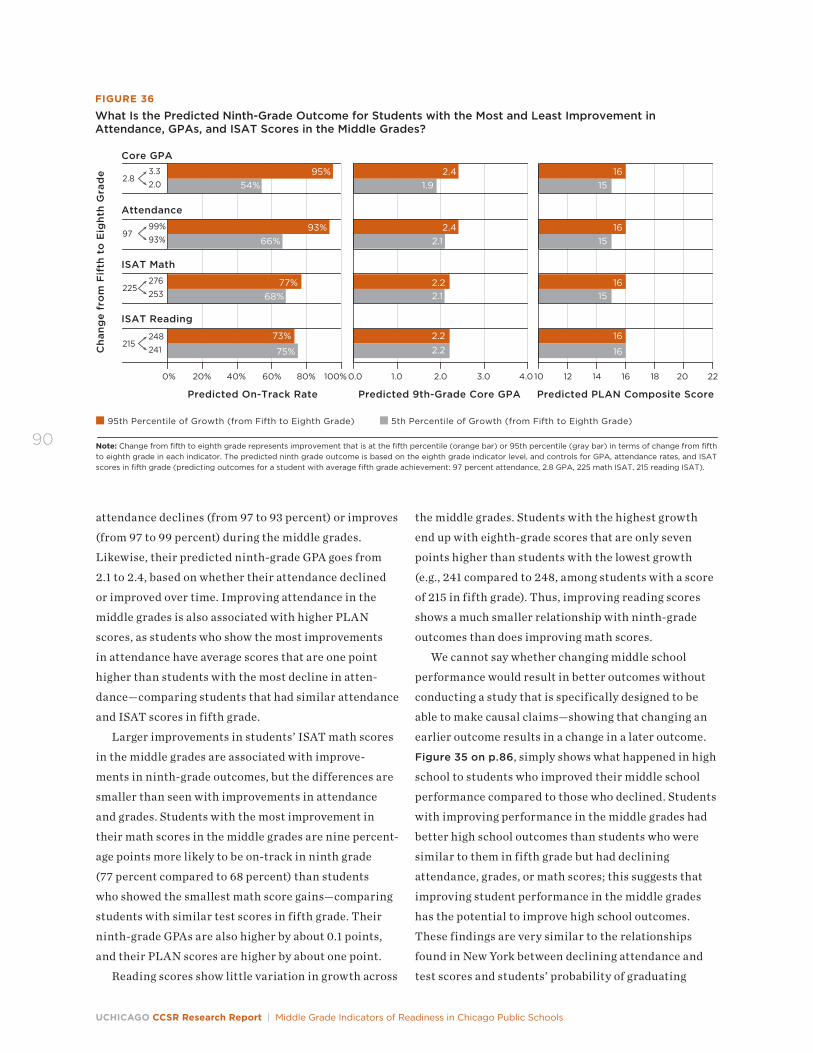
UCHICAGO CCSR Research Report | Middle Grade Indicators of Readiness in Chicago Public Schools
90
attendance declines (from 97 to 93 percent) or improves
(from 97 to 99 percent) during the middle grades.
Likewise, their predicted ninth-grade GPA goes from
2.1 to 2.4, based on whether their attendance declined
or improved over time. Improving attendance in the
middle grades is also associated with higher PLAN
scores, as students who show the most improvements
in attendance have average scores that are one point
higher than students with the most decline in atten-
dance—comparing students that had similar attendance
and ISAT scores in fifth grade.
Larger improvements in students’ ISAT math scores
in the middle grades are associated with improve-
ments in ninth-grade outcomes, but the differences are
smaller than seen with improvements in attendance
and grades. Students with the most improvement in
their math scores in the middle grades are nine percent-
age points more likely to be on-track in ninth grade
(77 percent compared to 68 percent) than students
who showed the smallest math score gains—comparing
students with similar test scores in fifth grade. Their
ninth-grade GPAs are also higher by about 0.1 points,
and their PLAN scores are higher by about one point.
Reading scores show little variation in growth across
FIGURE 36
What Is the Predicted Ninth-Grade Outcome for Students with the Most and Least Improvement in Attendance, GPAs, and ISAT Scores in the Middle Grades?
Note: Change from fifth to eighth grade represents improvement that is at the fifth percentile (orange bar) or 95th percentile (gray bar) in terms of change from fifth to eighth grade in each indicator. The predicted ninth grade outcome is based on the eighth grade indicator level, and controls for GPA, attendance rates, and ISAT scores in fifth grade (predicting outcomes for a student with average fifth grade achievement: 97 percent attendance, 2.8 GPA, 225 math ISAT, 215 reading ISAT).
Predicted On-Track Rate
95th Percentile of Growth (from Fifth to Eighth Grade) 5th Percentile of Growth (from Fifth to Eighth Grade)
Predicted 9th-Grade Core GPA Predicted PLAN Composite Score
1516
1516
1516
1.9
2.1
2.1
2.4
2.2
2.454%
66%
95%
93%
68%77%
Core GPA
Attendance
ISAT Math
ISAT Reading
0% 20% 40% 60% 80% 100%
73%
75%
1.00.0 2.0 3.0 4.0
2.22.2
1210 14 16 18 20 22
16
16
2.83.32.0
9799%93%
225276253
215248241C
han
ge
fro
m F
ifth
to
Eig
hth
Gra
de
the middle grades. Students with the highest growth
end up with eighth-grade scores that are only seven
points higher than students with the lowest growth
(e.g., 241 compared to 248, among students with a score
of 215 in fifth grade). Thus, improving reading scores
shows a much smaller relationship with ninth-grade
outcomes than does improving math scores.
We cannot say whether changing middle school
performance would result in better outcomes without
conducting a study that is specifically designed to be
able to make causal claims—showing that changing an
earlier outcome results in a change in a later outcome.
Figure 35 on p.86, simply shows what happened in high
school to students who improved their middle school
performance compared to those who declined. Students
with improving performance in the middle grades had
better high school outcomes than students who were
similar to them in fifth grade but had declining
attendance, grades, or math scores; this suggests that
improving student performance in the middle grades
has the potential to improve high school outcomes.
These findings are very similar to the relationships
found in New York between declining attendance and
test scores and students’ probability of graduating
Chapter 8 | How Grades, Attendance, and Test Scores Change
91
high school. Declining attendance in the middle grades
was particularly strongly associated with a lowered
probability of high school graduation. Declining test
performance was also associated with a lower prob-
ability of graduating in New York, especially in math
(Kieffer and Marinell, 2012).
SummaryFor most students, attendance, grades, and test score
ranks are fairly stable over the middle grades. However,
some students show improvements in grades and at-
tendance over the middle grade years; these students’
ninth-grade outcomes are substantially higher than
the ninth-grade outcomes of students who had similar
achievement levels in fifth grade, but showed declining
attendance and grades in middle school. There is less
variation in growth in test scores across students than
in grades or attendance because students who have
high test score gains in one year tend to have low test
score gains in the next, and vice-versa. About half of
the differences in students’ growth in attendance,
grades, and test scores over the middle grades can be
attributed to their school. Because attendance varies
the most across the middle grade years, and because it
is strongly related to ninth-grade course performance,
improvements in attendance may have particularly high
leverage for improving high school outcomes, compared
to other indicators.

92
Chapter 9 | Interpretive Summary
93
CHAPTER 9
Interpretive SummarySchool districts across the country are trying to figure out what they can do to get all of their students to graduate from high school and be ready for success in college. There is recognition that these efforts need to begin prior to high school, but there is little guidance on what it is that schools should target in the middle grades to affect outcomes at the end of high school, and how to identify who is at risk for not succeeding in later years.
In this report, we show that students’ risk of poor per-
formance in high school—and their level of readiness
to succeed—can be identified with just two or three key
indicators of middle school performance. It is not nec-
essary to put together complicated prediction models
based on multiple indicators. Schools could use infor-
mation on students’ level of risk for different outcomes
to design intervention strategies for individual students
and for assessing which problems with readiness are
most critical in particular schools.
The key indicator of readiness for passing classes,
being on-track, and getting good grades in high
school is students’ overall core GPA in the middle
grades. Students’ GPA across all of their core courses
is a better indicator of readiness for passing any one
specific class (e.g., algebra, English) than their grades in
that specific class in middle school. This is true in fifth
grade, as well as in eighth grade. Often people think of
grades as subjective and not good indicators of later
performance. They may think that GPAs at early grade
levels are particularly subjective. However, if grades
were mostly subjective, they would not predict later
outcomes. Grades are much better predictors of future
performance than indicators that are considered more
objective, such as test scores. Middle grade attendance
is also predictive of high school course performance
and improves the prediction of ninth-grade course
performance beyond students’ grades alone. These
two indicators by themselves can be used together in
a simple indicator chart to show students’ likelihood
of success in their ninth-grade courses, based on their
middle grade records.
There are other indicators that slightly improve the
prediction of students’ high school course performance.
Among students with high grades in middle school, test
scores can help predict who is likely to get As and Bs in
high school. Indicator systems could also incorporate
school effects, since students with similar middle grade
performance (grades, attendance, and test scores) have
different likelihoods of success, based on which middle
school they attended and in which high school they
enroll. While these additional factors improve the
accuracy of the prediction, there is a trade-off in that
they make calculations more complicated.
The key indicator of meeting benchmarks on the
EPAS exams in high school (e.g., the PLAN taken at the
start of tenth grade) is performance on standardized
tests in middle grades—the ISAT reading and math
exams. A student’s score on either the reading or the
math ISAT is a very good indicator of whether he or she
will meet the college-readiness benchmark on any of
the four subject-area tests on the PLAN. Combining
the reading and math ISAT scores together, or combin-
ing ISAT scores from multiple years (e.g., students’
seventh-grade score with their eighth-grade score),
UCHICAGO CCSR Research Report | Middle Grade Indicators of Readiness in Chicago Public Schools
94
improves the prediction of students’ PLAN score on any
subject-specific test and on the composite score (the
average of all of the subject-specific tests). The subject-
specific tests are each very predictive of scores in other
subjects, almost as predictive as tests within the same
subject. This suggests that both the ISAT and the PLAN
tests are measuring general knowledge and skills at
least as much as knowledge and skills in any given sub-
ject area. In general, the more tests that are used to pre-
dict the high school test score (e.g., multiple subjects,
multiple years), the more accurate the prediction.
Middle school performance can be used to identify
students at high or very high risk of not performing well
in high school—for being off-track, getting low grades,
or not meeting benchmarks. However, there are many
students at moderate risk of receiving low or failing
grades whose performance could go either way. The
change in school context from eighth to ninth grade
makes it difficult to predict accurately the grades these
students will receive in high school. For this reason, it is
critical that student performance be monitored during
the ninth-grade year to make sure students are per-
forming up to their potential.
Implications for Addressing High School DropoutCalls for ending high school dropout often call for early
intervention. As shown in this report, early interven-
tion will not solve all of the problems that lead students
to drop out. It is during ninth grade that many students
fall off-track to graduation. In Chicago, most future
dropouts do not show strong signs of withdrawal until
ninth grade. However, there are some students that can
be identified as at high risk very early—students who
need intervention before high school and across the
transition—if they are to have a chance of graduating.
Many students can be identified as at very high risk
of not graduating at least as early as fifth grade, based
on their attendance and grades. The same levels of
the same indicators identify students with an ex-
tremely high risk of not graduating in Chicago as in
Philadelphia—attendance less than 80 percent or a final
year grade of F in their math or language arts class puts
students at extremely high risk of failure (with a greater
than 75 percent chance).63 This suggests that there are
common underlying patterns in the factors that can be
used to identify future dropouts in middle school. One
key difference between Philadelphia and Chicago is that
a larger proportion of eventual dropouts can be identi-
fied earlier in Philadelphia than in Chicago. This could
be caused by the structure of schools in Chicago versus
schools in Philadelphia—most elementary schools in
Chicago serve students in grades K-8 and students do
not face a middle school transition. It is possible that
students fall off-track to graduation earlier when their
major school transition occurs in the middle grades
instead of high school.64 In Chicago, just focusing on
students with very high risk of dropout based on middle
school indicators would only capture a very small
number of future dropouts. Different cities face differ-
ent challenges and need to develop strategies with the
indicators that meet their own circumstances.
For students with 80 percent or lower attendance
in the middle grades or a GPA of less than 1.0 in the
middle grades, interventions are strongly warranted
while they are in middle school. These students are
extremely likely to drop out of school, with a risk
greater than 75 percent, unless they experience a sub-
stantial change in the way in which they are engaging
with school. Students earning a mix of Cs and Ds or
below, or who attend less than 90 percent of the time
in middle school, have less than a 50 percent chance of
being on-track when they get to high school. Moderate
interventions might be sufficient to get them to succeed
in high school.
In general, students whose middle school attendance
is below 95 percent have not developed strategies to get
to school every day, despite whatever obstacles they
face. Ninety percent attendance is considered chronic
absenteeism, and students who are chronically absent
in the middle grades are more likely to be off-track
63 Neild and Balfanz (2006); Balfanz, Herzog, and MacIver (2007).
64 Achievement tends to decline during transitions to middle school and high school (Alspaugh, 1998; Barber and Olsen, 2004; Eccles, Lord, and Midgely, 1991).

Chapter 9 | Interpretive Summary
95
than on-track when they get to high school. In the less-
supportive high school environment, chronic absence is
likely to drop to intermittent attendance, and moderate
attendance is likely to drop to chronic absence. While
the group of students with less than 95 percent at-
tendance may be too large for intensive interventions,
moderate efforts to reach out to families or provide
community support to help students address barriers
to school attendance might actually have considerable
pay-off later on.
In the summer before ninth grade, high schools can
use students’ grades and attendance from middle school
to identify students for whom it is most critical to estab-
lish trusting relationships. Students with eighth-grade
attendance less than 90 percent or a GPA of less than 2.0
in eighth grade are very likely to need support during
the ninth-grade year. Schools could reach out to these
students and their parents to establish positive connec-
tions before problems occur. Some schools in CPS have
used Freshman Watchlists for this purpose in the past,
reaching out to particular students during the summer
through the district’s Freshmen Connection program.
Once students are in high school, schools can put
students on the right path toward graduation by closely
monitoring their attendance and grades. Many schools
that have used ninth-grade “success reports” to identify
students in need of support have shown substantial
improvements in their ninth-grade on-track rates and
progress toward graduation.65
Efforts to improve students’ attendance and grades
could have benefits for improving not only high school
graduation rates but also college outcomes. The factors
that are important for high school graduation—grades
and attendance—are also important for college readi-
ness. Often efforts to improve high school graduation
are seen as separate from efforts at improving college
readiness—one targets low-achieving students, while the
other targets high-achieving students. However, the two
goals are complementary. Getting more students ready
for college requires substantial improvements in stu-
dents’ grades and attendance in the middle grade years.
Implications for Improving College Readiness Almost all students want to go to college, but the vast
majority of students who leave eighth grade in Chicago
do not even have a 1-in-4 chance of finishing high school
with the qualifications that indicate they will succeed in
college. The biggest stumbling block is students’ grades.
Despite all of the attention on test scores, high school
grades are the strongest predictors of college graduation
and middle school grades are the strongest predictors of
high school grades. Yet, only a quarter of CPS students
earn the grades that indicate they will succeed in college.
Grades are a reflection of students’ work effort—
coming to class, getting assignments completed,
participating, studying, and delivering high-quality
work day after day. These academic behaviors are what
matter for college success. They are also some of the
same behaviors that employers look for in workers.
Preparing for college requires students to work hard in
their classes; by putting in effort around challenging
work, students develop the strategies and skills they
will need at higher levels of education. Students may
not remember the Pythagorean Theorem down the line,
but working hard to understand and apply it helps them
build the cognitive frameworks and study habits that
allow them to conquer math problems later on. Putting
together an excellent term paper may teach students
something new about the world, but it also teaches them
how to organize their thinking and put information
together in new ways. It is the process of working hard
on academic work that gets students ready for college.
While students and their parents may know that grades
and work effort matter for college, they may not realize
how important they are or how high they need to be for
students to be on a path to college readiness.
Students need to know that college readiness means
at least B-level work, starting at least in the middle
grades. Grades do not usually get better when work
gets harder and students are given more responsibility.
Instead, grades tend to decline as students move into
65 See Allensworth (2013) for a description of the ways in which high schools used indicators to improve on-track rates.
UCHICAGO CCSR Research Report | Middle Grade Indicators of Readiness in Chicago Public Schools
96
and through high school. If students do not have at least
a B average in the middle grades, they are extremely
unlikely to end high school with at least a B average.
Students with lower than a 3.0 high school GPA have a
slim chance of graduating from college, and they will
be ineligible to attend many colleges or receive most
scholarships. Families should not have to wait until
the junior year in high school to realize this. Middle
schools can reach out to families of students who are
not making high grades to let them know that they are
not on-track to be ready for college. They can make sure
that teachers are keeping up with their grading in the
parent portal and have clear grading policies, so that
students and parents always know where their grades
stand and can notice if they slip. For some students,
this knowledge may be enough to motivate higher work
effort. For others, it may take support from teachers,
mentors, or support staff to reach out, determine why
students’ grades are low, and then develop strategies to
support their particular needs.
The ways that teachers structure their classes can
influence whether students put in strong or weak work
effort. Teaching is a complex task. Teachers need to de-
sign methods for engaging students around challenging
academic work, even though students enter their class
with different skill levels, different histories of success,
and their own issues and priorities. The ways in which
teachers implement their lessons have implications
for the degree to which their students put in effort. As
discussed in the report, Teaching Adolescents to Become
Learners,66 students put more effort into their classes
when they have positive mindsets about the work—when
they feel like they can be successful, that they belong
in the class, that the work has value and will lead them
to have stronger skills. A host of factors can undermine
positive mindsets. For example, being at the bottom
of the class in skill levels can make students feel they
cannot succeed and do not belong.67 Lessons without
clear goals can keep students from seeing the value in
the work they are asked to do. Clear grading standards
and constant feedback can provide motivation to keep
up with work.68
Mindsets are not set in stone. They change as stu-
dents move across different contexts—different classes,
different schools. Teachers can modify their instruc-
tion and their interactions with students to encourage
positive mindsets about the work. The fact that non-
cognitive factors, such as study habits and grit in eighth
grade, are not predictive of ninth-grade performance
provides evidence that they are context-specific, rather
than just a feature of individuals. When a student is not
putting in effort, a teacher or other adult could find out
why they are putting in little effort—what it is about
the class or about students’ own experiences and skills
that is preventing strong performance. Teachers also
can design courses so that they intentionally develop
students’ learning strategies, such as metacognitive
skills and study habits, as part of teaching their course
subject. Explicitly teaching strategies to do better in
class can pay off with better success on tests and assign-
ments in that class and in future work. Other research
at UChicago CCSR has found that students’ grades are
higher the more teachers monitor their performance
and provide help as soon as they start to fall behind.69
Teachers can also reach out to students who miss
class as soon as they are absent to make sure they start
attending regularly and do not fall behind in their work.
If students miss multiple days, it is important to find
out why and figure out strategies to help students get to
school. Students should have close to 100 percent atten-
dance to be on a path to be ready for college.
Attendance is critical, at least as important as test
performance. It may seem like a low bar—get students
to come to school every day. But if students are not in
school, they cannot learn. Even among students with
high grades and test scores, those with very strong
attendance in middle school (98 percent or higher) get
much better grades in high school than those with mod-
erate attendance (e.g., 94 percent). By the time students
are in high school, and in college, they need to know
how to get themselves to class. Efforts aimed at 100 per-
cent attendance could actually have substantial pay-off
in students’ eventual success in college and careers, but
problems with attendance are often dismissed as being
of low importance compared to progress on tests.
Figuring out how to get to school when other factors
may interfere—from family sickness and transportation
issues, to the pull of more interesting activities—is not
of secondary importance to improving test scores. This
Chapter 9 | Interpretive Summary
97
is more difficult for some schools than others, as schools
serving many students in poverty will struggle with
issues around transportation, health care, safety, and
residential instability. But there is no reason to think
that these schools would be less successful at improving
attendance than at improving test scores, which are also
hard to address in highly impoverished communities.
Schools and the public are concerned about meeting
ACT benchmarks, but reaching benchmark scores is
less important for college readiness than maximiz-
ing learning growth and getting good grades. There
is a strong focus on raising test scores to reach ACT
benchmark scores. However, while all students’ scores
grow as they move through the middle grades and high
school, they do not grow at rates that are different
enough to make up for the initial differences in scores
across students. This makes benchmarks irrelevant for
all but a subset of students, because they are too high
for some students and too low for others. Setting one
testing goal for all students sets up many students and
schools for failure and does not push students at the
high end to meet their potential. It gives a false sense
of success for schools serving students with high test
scores to begin with, while setting impossible standards
for schools serving students with the weakest skills.
All schools have reading and math improvement as
a priority, and the differences between schools in the
instruction that students receive are not enough to
make up for the large differences that exist before they
enter the middle grades. This is not only true in Chicago
but it also can be inferred from research in many other
places.70 Getting high gains on tests may take more
resources—smaller classes, more time, more individual-
ized assistance—for students with weak skills than are
currently available to most schools.71 The good news is
that students can have success in high school and col-
lege despite test scores that are well below ACT’s bench-
marks. In fact, students who score well below ACT’s
benchmark scores do not have a substantially lower
probability of success in college classes than students
who meet the benchmark. For example, while the prob-
ability of earning at least a B in a college social science
class for students at the benchmark reading score of 21
is 50 percent, the probability of earning at least a B for
students with a score of 16 is 40 percent.72
Even students who have high test scores and strong
GPAs in the middle grades do not necessarily perform
well in high school; many students fall off the path to
college readiness in high school. In schools serving low-
income minority students, it is particularly important
that those students who have a chance of success get
opportunities that will allow them to be competitive
with students from more advantaged schools. Students
need classroom environments that encourage them to
put in strong effort, earn high grades, and show high
rates of learning growth. If students are coming into
high school with strong middle school records and not
performing well, high schools need to find out why.
Research has shown that students learn more when
they are in orderly environments with high expecta-
tions.73 Schools can achieve this in multiple ways. For
academically strong students, they can run honors
classes, IB programs, and advanced classes.74 Or they
can put sufficient support staff in place in mixed-ability
classes so that expectations are high for all students,
and so that teachers are able to provide differentiated
instruction in an orderly environment.75 They can
make sure that students with low achievement have
sufficient support, time for learning, and student-
66 Farrington et al. (2012).67 Nomi and Allensworth (2013).68 Rosenkranz et al. (2014).69 Allensworth et al. (2014).70 As noted in Chapter 4, tests in early grades are extremely
predictive of test scores in later grades, suggesting that there is little variation in long-term growth on tests taken (e.g., in California): see Zau and Betts (2008); Kurlaender, Reardon, and Jackson (2008); New York: Kieffer and Marinell (2012): or on ACT’s EPAS system: ACT, Inc. (2008).
71 For example, evidence suggests that struggling adolescent readers can show improvements in literacy with intensive, individualized interventions (Kamil et al., 2008). But
individualized interventions require additional resources for students.
72 See the figures in Allen and Sconing (2005), the report used to set the original ACT benchmark scores.
73 See Gates Foundation (2010); Allensworth et al. (2014).74 In general, high-achieving students have higher test score
gains when in classes that are sorted by skills. See Nomi and Allensworth (2009, 2012, 2013); Collins and Gan (2013); Argys, Rees, and Brewer (1996); Loveless (1999).
75 We found that all students’ achievement improved in algebra classes where students with below-average skills received an extra period of instruction simultaneously to their primary algebra class (Nomi and Allensworth, 2012).
UCHICAGO CCSR Research Report | Middle Grade Indicators of Readiness in Chicago Public Schools
98
centered pedagogy to enable them to be engaged and
successful in challenging classes.76 Students tend to
put in more effort and earn higher grades when teach-
ers are attuned to their academic needs and provide
support as soon as they start to struggle. Monitoring
systems can make it easier for educators to identify
students who need help so they can reach out as soon
as a student’s performance starts to slip or is below
their potential.
Monitoring systems could help students get the right
level and kinds of support to keep them on-track for
high school and college graduation. High schools in
Chicago have made extraordinary progress over the
last five years in improving student performance in
the ninth grade by using early warning indicators to
support student performance in their classes. Ninth-
grade on-track rates have increased from around 59
percent to close to 85 percent in just a few years. In
many high schools, educators have designed systems for
reaching out to ninth-grade students whose absences
are high or grades are low to find out why they are
struggling and figure out ways to help them perform
better. Schools are setting goals around particular
groups of students, identifying them, and tracking the
progress of their intervention plans. They are using
data on grades and attendance to have difficult, but
important, conversations about how they could better
support their students to make progress towards high
school graduation. Most of these systems have focused
on getting students on-track to graduation. Similar
systems could be designed around students who are
falling off-track to college readiness. The success of
data-driven practices around grades and attendance
in high schools suggests that similar efforts in schools
serving the middle grades might do much to further
improve CPS students’ educational attainment.
76 When Chicago implemented its double-algebra policy, it provided support for teachers and twice as much instructional time for students. The challenge and
instructional quality in algebra classes improved for students with below-average test scores, and they learned more math (Nomi and Allensworth, 2009, 2012).
References
99
References
ACT, Inc. (2008). The forgotten middle. Iowa City, IA: ACT. Retrieved from http://www.act.org/research/policymakers/pdf/ForgottenMiddle.pdf.
ACT, Inc. (2012). The condition of college & career readiness. Iowa City, IA: ACT. Retrieved from http://media.act.org/documents/CCCR12-NationalReadinessRpt.pdf?_ga=1.256103106.857372413.1414731200.
Alexander, K.L., Entwisle, D.R., and Kabbani, N.S. (2001).The dropout process in life course perspective: Early risk factors at home and school. Teachers College Record, 103(5), 760-822.
Allen, J., and Sconing, J. (2005). Using ACT assessment scores to set benchmarks for college readiness. ACT Research Report Series 2005-3. Retrieved from http://www.act.org/research/researchers/reports/pdf/ACT_RR2005-3.pdf.
Allen, J. (2013). Updating the ACT college readiness benchmarks. ACT Research Report Series 2013 (6). Retrieved from http://www.act.org/research/researchers/reports/pdf/ACT_RR2013-6.pdf.
Allensworth, E. (2006). Update to: From High School to the Future: A First Look at Chicago Public School Graduates’ College Enrollment, College Preparation, and Graduation from Four-Year Colleges Chicago, IL: University of Chicago Consortium on Chicago School Research.
Allensworth, E. (2013). The use of ninth-grade early warning indicators to improve Chicago schools. Journal of Education for Students Placed at Risk, 18(1), 68-83.
Allensworth, E., Correa, M., and Ponisciak, S. (2008). From High School to the Future: ACT Preparation—Too Much, Too Late. Chicago, IL: University of Chicago Consortium on Chicago School Research.
Allensworth, E., and Easton, J.Q. (2005). The On-Track Indicator as a Predictor of High School Graduation. Chicago, IL: University of Chicago Consortium on Chicago School Research.
Allensworth, E., and Easton, J.Q. (2007). What Matters for Staying On-Track and Graduating in Chicago Public High Schools: A Close Look at Course Grades, Failures, and Attendance in the Freshman Year. Chicago, IL: University of Chicago Consortium on Chicago School Research.
Allensworth, E., Gwynne, J., Pareja, A.S., Sebastian, J., and Stevens, W.D. (2014). Free to Fail or On-Track to College: Setting the Stage for Academic Rigor: Without Classroom Control and Student Support, a Challenging Curriculum Falls Flat. Chicago, IL: University of Chicago Consortium on Chicago School Research.
Alliance for Excellent Education (2011). The High Cost of High School Dropouts: What the Nation Pays for Inadequate High Schools. Washington, DC: Alliance for Excellent Education.
Alspaugh, J.W. (1998). Achievement loss associated with the transition to middle school and high school. The Journal of Educational Research, 92(1), 20-25.
Argys, L.M., Rees, D.I., and Brewer, D.J. (1996). Detracking America’s schools: Equity at zero costs? Journal of Policy Analysis and Management, 15(4), 623-645.
Balfanz, R., Herzog, L., and MacIver, D.J. (2007).Preventing student disengagement and keeping students on the graduation path in urban middle-grades schools: Early identification and effective interventions. Educational Psychologist, 42(4), 223-235.
Ballou, D. (2007). Magnet schools and peers: Effects on student achievement [PowerPoint document]. Retrieved from schoolchoice.uconn.edu/assets/PPT/4B_Ballou.ppt.
Baltimore Education Research Consortium (BERC) (2011). Destination Graduation: Sixth-Grade Early Warning Indicators for Baltimore City Schools: Their Prevalence and Impact. Baltimore, MD: BERC.
Barber, B.K., and Olsen, J.A. (2004). Assessing the transitions to middle and high school. Journal of Adolescent Research, 19(1), 3-30.
Benner, A.D. (2011). The transition to high school: Current knowledge, future directions. Educational Psychology Review, 23(3), 299-328.
UCHICAGO CCSR Research Report | Middle Grade Indicators of Readiness in Chicago Public Schools
100
Bowen, W.G., Chingos, M.M., and McPherson, M.S. (2009).Crossing the Finish Line: Completing College at America’s Public Universities. Princeton, NJ: Princeton University Press.
Bowers, A.J., Sprott, R., and Taff, S.A. (2013). Do we know who will drop out? A review of the predictors of dropping out of high school: Precision, sensitivity, and specificity. The High School Journal, 96(2), 77-100.
Collins, C.A., and Gan, L. (2013). Does sorting students improve scores? An analysis of class composition. NBER Working Paper No. 18848. Cambridge, MA: National Bureau of Economic Research. Retrieved from http://www.nber.org/papers/w18848.
Dale, S., and Krueger, A. (2012). Estimating the return to college selectivity over the career using administrative earnings data. NBER Working Paper No. 17159. Cambridge, MA: National Bureau of Economic Research. Retrieved from http://www.nber.org/papers/w17159.
Davis, J.A. (1985).The Logic of Causal Order. Newbury Park, CA: Sage.
Day, J.C., and Newburger, E.C. (2002). The big payoff: Educational attainment and synthetic estimates of work-life earnings. Washington, DC: U.S. Census Bureau (P23-210).
Duckworth, A.L., and Seligman, M.E.P. (2005). Self-discipline outdoes IQ in predicting academic per-formance of adolescents. Psychological Science, 16(12), 939-944.
Duckworth, A.L., and Seligman, M.E.P. (2006). Self-discipline gives girls the edge: Gender in self- discipline, grades, and achievement test scores. Journal of Educational Psychology, 98(1), 198-208.
Duckworth, A.L., Peterson, C., Matthews, M.D., and Kelly, D.R. (2007). Grit: Perseverance and passion for long-term goals. Journal of Personality and Social Psychology, 92(6), 1087-1101.
Dweck, C., Cohen, G., and Walton, G. (2011). Academic tenacity. An unpublished white paper prepared for the Bill & Melinda Gates Foundation.
Eccles, J.S., Lord, S., and Midgley, C. (1991). What are we doing to early adolescents? The impact of educational contexts on early adolescents. American Journal of Education, 99(4), 521-542.
Farkas, G., Sheehan, D., and Grobe R.P. (1990).Coursework mastery and school success: Gender, eth-nicity, poverty groups within an urban school district. American Educational Research Journal, 27(4), 807-827.
Farrington, C.A., Roderick, M., Allensworth, E., Nagaoka, J., Keyes, T.S., Johnson, D.W., and Beechum, N.O. (2012). Teaching Adolescents to Become Learners: The Role of Noncognitive Factors in Shaping School Performance. Chicago, IL: University of Chicago Consortium on Chicago School Research.
Gamoran, A. (1996). Student achievement in public magnet, public comprehen-sive, and private city high schools. Educational Evaluation and Policy Analysis, 18(1), 1-18.
Gates Foundation. (2010). Learning about teaching: Initial findings from the measures of effective teaching project. Retrieved from http://www.metproject.org/downloads/Preliminary_Findings-Research_Paper.pdf.
Geiser, S., and Santelices, V. (2007). Validity of High School Grades in Predicting Student Success Beyond the Freshman Year: High-School Record versus Standardized Tests as Indicators of Four-year College Outcomes. Berkeley, CA: University of Berkeley Center for Studies in Higher Education.
Heckman, J.J., and LaFontaine, P.A. (2007). The American high school graduation rate: Trends and levels. NBER Working Paper No. 13670. Cambridge, MA: National Bureau of Economic Research. Retrieved from http://www.nber.org/papers/w13670.
Heppen, J.B., and Therriault, S.B. (2008). Developing Early Warning Systems to Identify Potential High School Dropouts. Washington, DC: National High School Center. Retrieved from http://www.betterhighschools.org/pubs/documents/IssueBrief_EarlyWarningSystemsGuide.pdf.
Hoxby, C.M. (2001). The return to attending a more selective college: 1960 to the present. In M. Devlin and J. Meyerson (Eds.), Forum Futures: Exploring the Future of Higher Education, 2000 Papers (pp. 13-42). Forum Strategy Series, Volume 3. Oxford, OH: Jossey-Bass.
Illinois State Board of Education. (2008). Illinois Standards Achievement Test 2008 Technical Manual. Springfield, IL: Illinois State Board of Education Assessment Division. Retrieved from http://www.isbe.net/assessment/pdfs/isat_tech_2008.pdf.
Illinois State Board of Education. (2011). Interpretive Guide 2011 Illinois Standards Achievement Test. Springfield, IL: Illinois State Board of Education. Retrieved from http://www.isbe.net/assessment/pdfs/ISAT_Interpr_Guide_2011.pdf.
References
101
Illinois State Board of Education. (2012). Illinois Standards Achievement Test 2012 Technical Manual. Springfield, IL: Illinois State Board of Education Assessment Division. Retrieved from http://www.isbe.net/assessment/pdfs/isat_tech_2012.pdf.
Kamil, M.L., Borman, G.D., Dole, J., Kral, C.C., Salinger, T., and Torgesen, J. (2008). Improving adolescent literacy: Effective classroom and intervention practices: A practice guide (NCEE #2008-4027). Washington, DC: National Center for Education Evaluation and Regional Assistance, Institute of Education Sciences, U.S. Department of Education. Retrieved from http://ies.ed.gov/ncee/wwc/pdf/practice_guides/adlit_pg_082608.pdf.
Kelly, S. (2008). What types of students’ effort are rewarded with high marks? Sociology of Education, 81(1), 32-52.
Kieffer, M.J., and Marinell, W.H. (2012). Navigating the Middle Grades: Evidence from New York City. New York, NY: Research Alliance for New York City Schools.
Koretz, D. (2005). Alignment, high stakes, and the inflation of test scores. Yearbook of the National Society for the Study of Education, 104(2), 99-118.
Koretz, D. (2008). Measuring Up: What Educational Testing Really Tells Us. Cambridge, MA: Harvard University Press.
Kurlaender, M., Reardon, S.F., and Jackson, J. (2008).Middle School Predictors of High School Achievement in Three California School Districts. Santa Barbara, CA: University of California, California Dropout Research Project.
Lehr, C.A., Sinclair, M.F., and Christenson, S.L. (2004). Addressing student engagement and truancy prevention during the elementary school years: A replication study of the Check and Connect model. Journal of Education for Students Placed at Risk (JESPAR), 9(3), 279-301.
Loveless, T. (1999). The Tracking Wars: State Reform Meets School Policy. Washington, DC: Brookings Institution Press.
Luppescu, S., Allensworth, E., Moore, P., de la Torre, M., and Murphy, J., with Jagesic, S. (2011). Trends in Chicago’s Schools Across Three Eras of Reform. Chicago, IL: University of Chicago Consortium on Chicago School Research.
National Center for Education Statistics. (2007). The condition of education (NCES 2007-064). U.S. Department of Education. Washington, DC: National Center for Education Statistics.
Neild, R.C., and Balfanz, R. (2006). Unfulfilled promise: The dimensions and characteristics of Unfulfilled Promise: The Dimensions and Characteristics of Philadelphia’s Dropout Crisis, 2000-05. Philadelphia, PA: Philadelphia Youth Transitions Collaborative.
Nomi, T., and Allensworth, E. (2009). “Double-dose” algebra as an alternative strategy to remediation: Effects on students’ academic outcomes. Journal of Research on Educational Effectiveness, 2(2), 111-148.
Nomi, T., and Allensworth, E. (2012). Sorting and supporting: Why double-dose algebra led to better test scores but more course failures. American Educational Research Journal, 50(4), 1-33.
Nomi, T., and Allensworth, E. (2014). Skill-Based Sorting in the Era of College Prep for All: Costs and Benefits. Chicago, IL: University of Chicago Consortium on Chicago School Research.
Raudenbush, S., and Bryk, A.S. (2002). Hierarchical Linear Models: Applications and Data Analysis Methods. Newbury Park, CA: Sage.
Roderick, M., Coca, V., Moeller, E., and Kelley-Kemple, T. (2013). From High School to the Future: The Challenge of Senior Year in Chicago Public Schools. Chicago, IL: University of Chicago Consortium on Chicago School Research.
Roderick, M., Nagaoka, J., Allensworth, E., Coca, V., Correa, M., and Stoker, G. (2006). From High School to the Future: A First Look at Chicago Public School Graduates’ College Enrollment, College Preparation, and Graduation from Four-Year Colleges. Chicago, IL: University of Chicago Consortium on Chicago School Research.
Roderick, M., Nagaoka, J., Coca, V., Moeller, E., Roddie, K., Gilliam, J., and Patton, D. (2008). From High School to the Future: Potholes on the Road to College. Chicago, IL: University of Chicago Consortium on Chicago School Research.
Rosenkranz, T., de la Torre, M., Stevens, W.D., and Allensworth, E. (2014). Free to Fail or On-Track To College: Why Grades Drop When Students Enter High School and What Adults Can Do About It. Chicago, IL: University of Chicago Consortium on Chicago School Research.
Rumburger, R., and Lim, S.A. (2008). Why Students Drop Out of School: A Review of 25 Years of Research. Santa Barbara, CA: California Dropout Research Project.

UCHICAGO CCSR Research Report | Middle Grade Indicators of Readiness in Chicago Public Schools
102
Sinclair, M.F., Christenson, S.L., and Thurlow, M.L. (2005). Promoting school completion of urban secondary youth with emotional or behavioral disabilities. Exceptional Children, 71(4), 465-482.
Sum, A., Khatiwada, I., and McLaughlin, J. (2009). The Consequences of Dropping Out of High School: Joblessness and Jailing for High School Dropouts and the High Cost for Taxpayers. Boston, MA: Center for Labor Market Studies (Northeastern University).
Tough, P. (2011).What if the secret to success is failure? New York Times. Retrieved from http://www.nytimes.com/2011/09/18/magazine/what-if-the-secret-to-success-is-failure.html?scp=2&sq=the%20character%20test&st=cse.
Zau, A.C., and Betts, J.R. (2008). Predicting Success, Preventing Failure: An Investigation of the California High School Exit Exam. San Francisco, CA: Public Policy Institute of California.

103
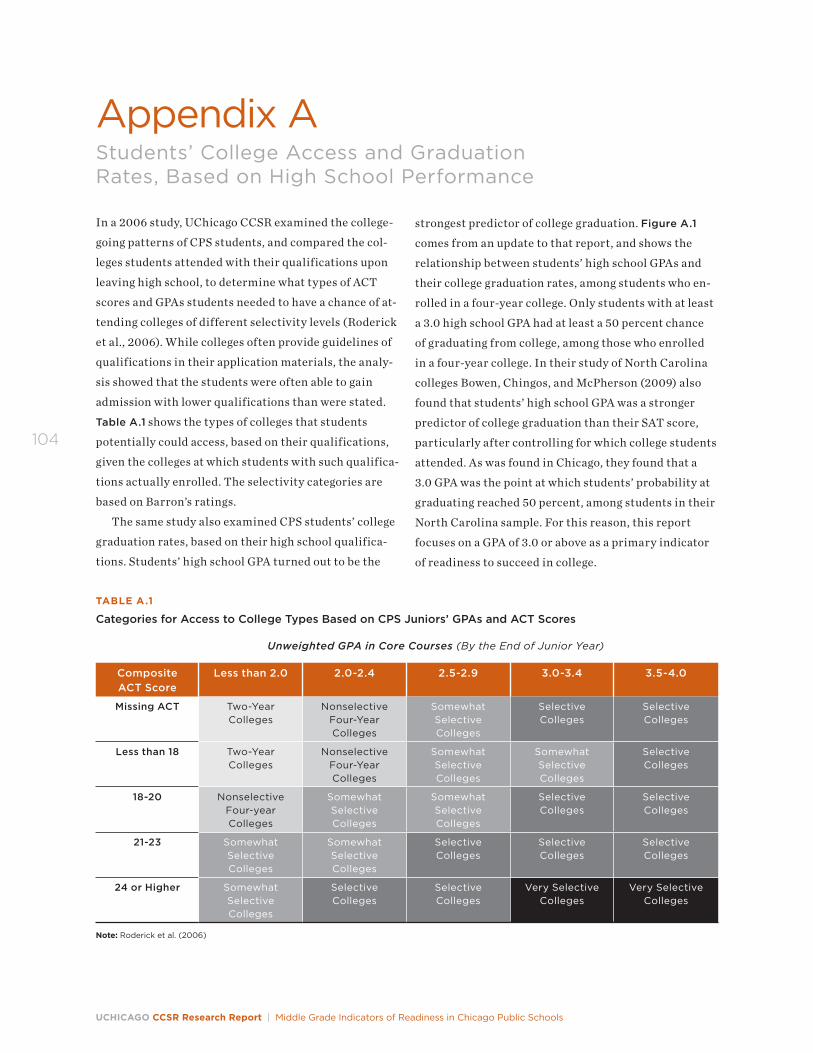
UCHICAGO CCSR Research Report | Middle Grade Indicators of Readiness in Chicago Public Schools
104
Appendix AStudents’ College Access and Graduation Rates, Based on High School Performance
In a 2006 study, UChicago CCSR examined the college-
going patterns of CPS students, and compared the col-
leges students attended with their qualifications upon
leaving high school, to determine what types of ACT
scores and GPAs students needed to have a chance of at-
tending colleges of different selectivity levels (Roderick
et al., 2006). While colleges often provide guidelines of
qualifications in their application materials, the analy-
sis showed that the students were often able to gain
admission with lower qualifications than were stated.
Table A.1 shows the types of colleges that students
potentially could access, based on their qualifications,
given the colleges at which students with such qualifica-
tions actually enrolled. The selectivity categories are
based on Barron’s ratings.
The same study also examined CPS students’ college
graduation rates, based on their high school qualifica-
tions. Students’ high school GPA turned out to be the
strongest predictor of college graduation. Figure A.1
comes from an update to that report, and shows the
relationship between students’ high school GPAs and
their college graduation rates, among students who en-
rolled in a four-year college. Only students with at least
a 3.0 high school GPA had at least a 50 percent chance
of graduating from college, among those who enrolled
in a four-year college. In their study of North Carolina
colleges Bowen, Chingos, and McPherson (2009) also
found that students’ high school GPA was a stronger
predictor of college graduation than their SAT score,
particularly after controlling for which college students
attended. As was found in Chicago, they found that a
3.0 GPA was the point at which students’ probability at
graduating reached 50 percent, among students in their
North Carolina sample. For this reason, this report
focuses on a GPA of 3.0 or above as a primary indicator
of readiness to succeed in college.
TABLE A.1
Categories for Access to College Types Based on CPS Juniors’ GPAs and ACT Scores
Unweighted GPA in Core Courses (By the End of Junior Year)
Composite ACT Score
Less than 2.0 2.0-2.4 2.5-2.9 3.0-3.4 3.5-4.0
Missing ACT Two-Year Colleges
Nonselective Four-Year Colleges
Somewhat Selective Colleges
Selective Colleges
Selective Colleges
Less than 18 Two-Year Colleges
Nonselective Four-Year Colleges
Somewhat Selective Colleges
Somewhat Selective Colleges
Selective Colleges
18-20 Nonselective Four-year Colleges
Somewhat Selective Colleges
Somewhat Selective Colleges
Selective Colleges
Selective Colleges
21-23 Somewhat Selective Colleges
Somewhat Selective Colleges
Selective Colleges
Selective Colleges
Selective Colleges
24 or Higher Somewhat Selective Colleges
Selective Colleges
Selective Colleges
Very Selective Colleges
Very Selective Colleges
Note: Roderick et al. (2006)
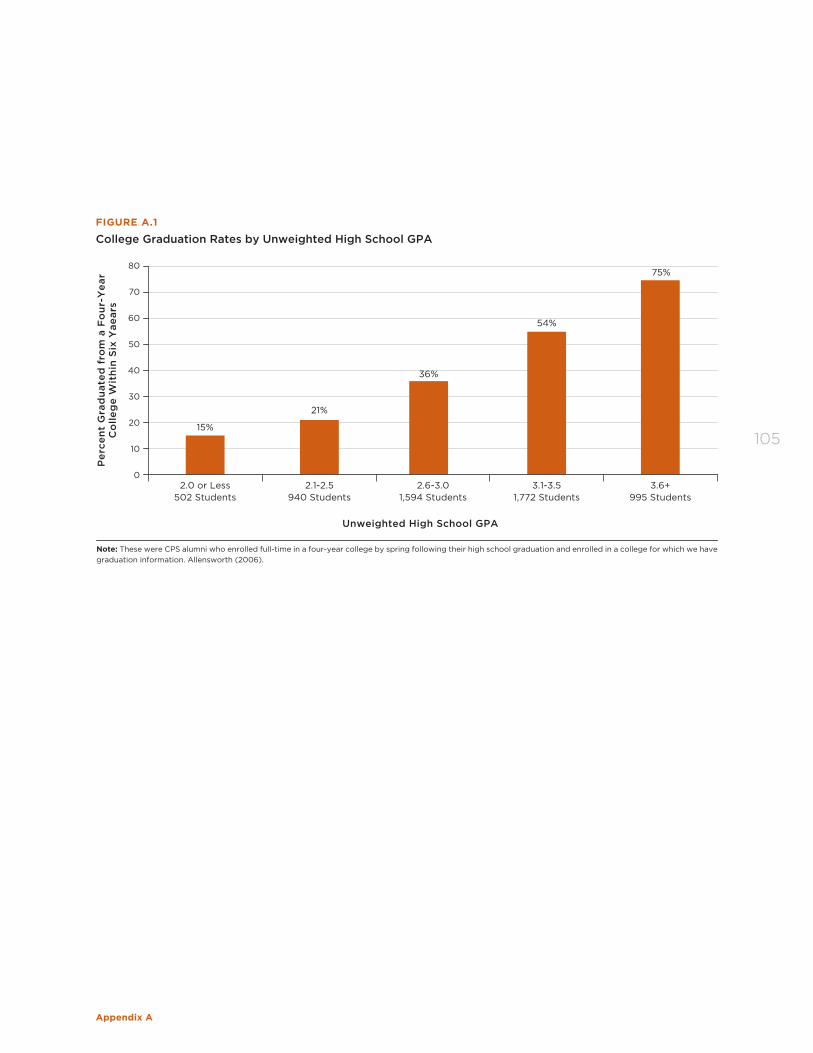
Appendix A
105
Per
cen
t G
rad
uat
ed f
rom
a F
ou
r-Y
ear
Co
lleg
e W
ith
in S
ix Y
aear
s
80
40
30
20
0
60
50
70
FIGURE A.1
College Graduation Rates by Unweighted High School GPA
10
15%
21%
36%
54%
75%
Note: These were CPS alumni who enrolled full-time in a four-year college by spring following their high school graduation and enrolled in a college for which we have graduation information. Allensworth (2006).
2.0 or Less502 Students
2.1-2.5940 Students
2.6-3.01,594 Students
3.1-3.51,772 Students
3.6+995 Students
Unweighted High School GPA
UCHICAGO CCSR Research Report | Middle Grade Indicators of Readiness in Chicago Public Schools
106
Appendix BData Definitions
Sample Used for the Indicator Analysis (Chapters 3 through 7)The indicator analysis is based on the cohort of students
who were first-time freshmen in the fall of 2009. The
students in the analytic sample attended either a neigh-
borhood, vocational, magnet school, or an Academic
Preparatory Center (APC) in ninth grade. Charter
school students are also included in the analysis of test
scores (see Chapters 6 and 7). Students’ transcripts are
not available for charter schools, which is why they are
not included in the analysis of ninth-grade on-track
rates or grades. Alternative school students are not in-
cluded in the analysis. Alternative schools do not follow
the same curriculum and graduation requirements as
other schools. Students were included if they enrolled
for at least 120 days during the prior year (2008-09
school year) out of a school year of 170 days total.
• In Chapters 3 through 5, the analysis is based on
students with data on ninth-grade GPA and eighth-
grade GPA, attendance, and ISAT scores. This cohort
comprised 19,963 students.
• In Chapters 6 and 7, the analysis is based on students
with data on tenth-grade PLAN and eighth-grade
GPA and attendance, and ISAT scores in eighth,
seventh, and sixth grade. This cohort comprised
20,356 students (including students in charter high
schools).
Sample Used for the Growth Analysis in Chapter 8Growth analyses were done in different ways for grades
and attendance than for test scores. To examine test
score growth, we used one cohort of students over four
years—the same 2009 ninth-grade cohort used for all
other analyses in the report. For the analysis of grades
and attendance, we did not have data on grades and
attendance for this cohort as far back as fifth grade,
since these data just became available in 2007. There-
fore, we used later cohorts of students to examine
growth over time in grades and attendance—students
who were in fifth grade in 2007-09.
• Change in attendance from fifth to eighth grade
was examined using data from three cohorts of
students: those who were in fifth grade in the fall of
2007, 2008, or 2009. This cohort comprised 99,300
students. The samples used in the analyses of at-
tendance and also GPA trends differ from the sample
used to validate middle grade indicators and analyze
ISAT trends because of limited data from the middle
grade years for students who were first-time ninth-
graders in 2009. The first year in which attendance
and GPA data were available for students in elemen-
tary and middle schools was 2007-08, meaning there
were only two years of middle grade data for the
cohort of students used in the rest of the report.
• Change in GPA from fifth to eighth grade was exam-
ined using data from two cohorts of students: those
who were in fifth grade in the fall of 2007 or 2008.
Eighth-grade GPA data were not yet available for the
fifth-graders in 2009 when the analysis was per-
formed. This cohort comprised 61,791 students. Only
two cohorts of fifth-grade students were used in the
GPA analysis, instead of the three cohorts used in the
attendance analysis because at the time the analysis
was done we had not yet received GPA data files from
2012 or beyond when most of the fifth-graders from
2009-10 would have been in seventh grade or higher.
• Change in test scores from fifth to eighth grade was
examined using students who were ninth-graders
in the fall of 2009. Students form this cohort with
test scores in any of those years are used to calculate
test scores growth. This cohort comprised just over
27,300 students.
Appendix B
107
Variables Considered as Potential Middle Grade Indicators• Core GPA is the average of grades earned in the fol-
lowing subjects: English, math, science, and social
science on a 4-point scale where A=4 regardless of
level (e.g., Honors).
• Growth in GPA: the average yearly growth or
decline in GPA that students experienced
between fifth to eighth grade
• Failures is a count of the number of semester
failures in eighth-grade core subjects (English,
math, science, and social science).
• Misconducts include infractions of severity 4 or
higher. We did not include lower levels of miscon-
ducts because they are less likely to be reported
consistently across schools. Higher-level infractions
are reported more consistently than lower-level
infractions because they are usually accompanied
by a suspension.
• Suspensions is a count of the number of days a
student spent out of school due to suspension.
• Grit (reliability=0.86) is a measure constructed
from students’ responses to the following questions
on UChicago CCSR’s annual survey of CPS students.
It is based on a scale developed by Duckworth et al.
(2007):
• I finish whatever I begin
• I am a hard worker
• I continue steadily towards my goals
• I don’t give up easily
• Study Habits (reliability=0.73) is a measure construct-
ed from students’ responses to the following questions
on UChicago CCSR’s annual survey of CPS students:
• I set aside time to do my homework and study
• I try to do well on my schoolwork even when it
isn’t interesting to me
• If I need to study, I don’t go out with my friends
• I always study for tests
• Background Characteristics include indicators of
race/ethnicity, gender, special education status,
neighborhood concentration of poverty and so-
cial status, free/reduced-priced lunch status, and
whether a student was older than 14 when entering
high school. Neighborhood concentration of poverty
is based on data from the 2000 U.S. Census on the
census block group in which students lived. Students’
home addresses were used to link each student to a
particular block group within the city, which could
then be linked to census data on the economic condi-
tions of the student’s neighborhood. Two indicators
were used to construct these variables, the log of
the percentage of household above the poverty line
and the log of the percentage of men employed in the
block group. Neighborhood social status is based on
data from the 2000 U.S. Census on the census block
group in which students lived. Students’ home ad-
dresses were used to link each student to a particular
block group within the city, which could then be
linked to census data on the economic conditions
of the student’s neighborhood. Two indicators were
used to construct these variables, the average level of
education among adults over age 21 and the log of the
percentage of men in the block group employed as
managers or executives.
UCHICAGO CCSR Research Report | Middle Grade Indicators of Readiness in Chicago Public Schools
108
• Attendance is a proportion of the number of days
attended out of the number of days enrolled.
• Growth in attendance: the average yearly growth
or decline in attendance rate that students
experienced between fifth and eighth grade.
• Illinois Standard Achievement Test (ISAT) measures
individual student achievement relative to the Illinois
Learning Standards. Students in grades three through
eight take the ISAT in reading and math. Information
on the ISAT is available in ISBE (2012).
• Subscales: scores in the reading test in eighth
grade in the areas of vocabulary development,
reading strategies, reading comprehension,
literature, and extended-response results.
Scores in math test in eighth grade in the areas of
number sense, measurement, algebra, geometry,
data analysis, statistics and probability; and
extended-response results for mathematical
knowledge, strategic knowledge, and explanation
results.
• Gains over middle grades: gains were calculated
annually over the middle grades (from fifth to
sixth grade, from sixth to seventh grade, and from
seventh to eighth grade) and averaged.
• Relative class rank: relative rank in reading/math
score from average of eighth-grade peers in the
same school.
High School Outcomes• PLAN and ACT tests are tests taken by CPS students
as part of the Educational Planning and Assessment
System (EPAS): the EXPLORE in the fall of eighth
and ninth grade; PLAN in the fall of tenth grade;
and ACT in the spring of eleventh grade. These tests
measure student achievement in English, reading,
mathematics, and science. The four subject-area
scores are averaged together to calculate a composite
score. The PLAN test scores range from 1 to 32. For
each subject, ACT has defined a college-readiness
benchmark; this is the score at which ACT has
determined that students have a 50 percent chance
of earning a B or better and a 75 percent chance
of earning a C or better in corresponding college
courses. Appendix D lists the benchmarks for the
PLAN and ACT. Information about the EPAS system
tests is available at ACT’s website: www.act.org.
• Ninth-grade on-track is an indicator of whether
students are making the basic level of progress in
ninth grade to be on-track to graduating within
four years. Ninth-graders are on-track if they
have at least five full-year credits and have failed
no more than one semester in a core course by the
end of their first year of high school. Students who
are on-track at the end of their freshman year are
nearly four times more likely to graduate from high
school than their classmates who are not on-track
(Allensworth and Easton, 2005).
• Eleventh-grade on-track is an indicator of whether
students have made sufficient progress to be on-
track to graduate from high school within four years
by the end of their third year of high school. Students
are considered on-track in eleventh grade if they
have at least 17 credits by the end of their third year
of high school. Students are considered off-track in
eleventh grade if they do not have at least 17 credits
by the end of their third year of high school, regard-
less of whether they are officially designated as
eleventh-graders or not.
• GPA is the average of grades earned on a 4-point
scale where A=4 regardless of level (e.g., Honors).
Core GPA takes the average of English, math,
science, and social science; Math GPA is based
on grades from only math classes; and English
GPA is based on grades from only English classes.
• Passing Math is an indicator of whether students
passed all semesters of math class. Put another way,
this variable indicates whether or not students re-
ceived exactly zero semester Fs in math classes.
• Passing English is an indicator of whether students
passed all semesters of English class. Put another
way, this variable indicates whether or not students
received exactly zero semester Fs in English classes.
Appendix C
109
Appendix CResearch Methodology
Methods for Comparing Indicators in Chapters 3 and 6 The process of examining potential indicators of high
school success involved several steps. We examined, in
the following order: 1) which indicators showed strong
relationships with later outcomes, and how predictive
they were individually; 2) the shape of the relationship
among those indicators that were strongly predictive;
3) which indicators were predictive above and beyond
others—adding new information to the prediction; 4)
how the indicators functioned together to predict later
outcomes; and 5) whether predictions varied by school.
These steps were performed separately for each high
school outcome.
We began by gauging the general strength of the
relationship of each potential indicator with each out-
come through bivariate correlations. For dichotomous
outcomes (those that can be characterized as success
versus failure—such as being on-track, passing math,
meeting the benchmark—we also calculated the sensi-
tivity and specificity of predictions using each potential
indicator as a predictor of each outcome, with 50 per-
cent probability as the point for classifying each case
as a success or failure on the outcome. The bivariate
relationships and prediction statistics of each potential
indicator with high school outcomes are provided in
Tables E.1 and E.2 in Appendix E.
For those indicators that showed moderate to strong
relationships with high school outcomes, we exam-
ined the shape of the relationship—whether there was
a steady improvement in the outcome for each unit of
improvement in the indicator, or whether the indicator
was related to the outcome at just high or low levels, etc.
The relationships were examined through simple charts
that graphed levels of the outcome at different levels of
the predictor. These figures are not included in the re-
port, but the nature of relationships of the variables can
be seen through figures that graph each outcome by the
predictors; for example, Figures 7 and 8 show that the
relationship between eighth-grade GPA and the prob-
ability of earning As and Bs in high school is strongest
among students with high eighth-grade GPAs.
We then conducted a series of analyses in which we
examined combinations of potential indicators for each
high school outcome. With each outcome, we started
with the indicator that had the strongest bivariate rela-
tionship, and then we added additional predictors one
at a time to determine whether each added new infor-
mation to improve the prediction. We used regression
models (or logistic regression models for dichotomous
outcomes), comparing the R-square (pseudo-R-square),
percent correct prediction, sensitivity, and specificity
derived from each model. We focused on model statis-
tics, rather than coefficients associated with individual
variables, to discern whether inclusion of each addition-
al potential indicator in the model improved the predic-
tion of the high school outcome beyond the prediction
of a simpler model without that potential indicator. The
model statistics from select combinations of predic-
tors—those with the greatest potential for improving the
prediction—are displayed in the bottom of Tables 3 and
7 in Chapters 4 and 7 and in the tables in Appendix E.
Once we discerned the indictors that provided
unique information to the prediction model, we
examined the ways in which the different indicators to-
gether predicted the outcomes; for example, whether an
indicator provided information at all levels of the other
predictor or whether its relationship with the outcome
depended on levels of the other predictor. Figures 7
and 8 provide an example of a case when a predictor
(attendance or ISAT scores) improves the prediction
of the outcome (earning As and Bs) only at particular
levels of another indicator (among students with high
eighth-grade GPAs).
The figures displayed in Chapter 3 show the contri-
bution of attendance and test scores for predicting on-
track rates and high grades among students with similar
middle school GPAs. We chose those displays because
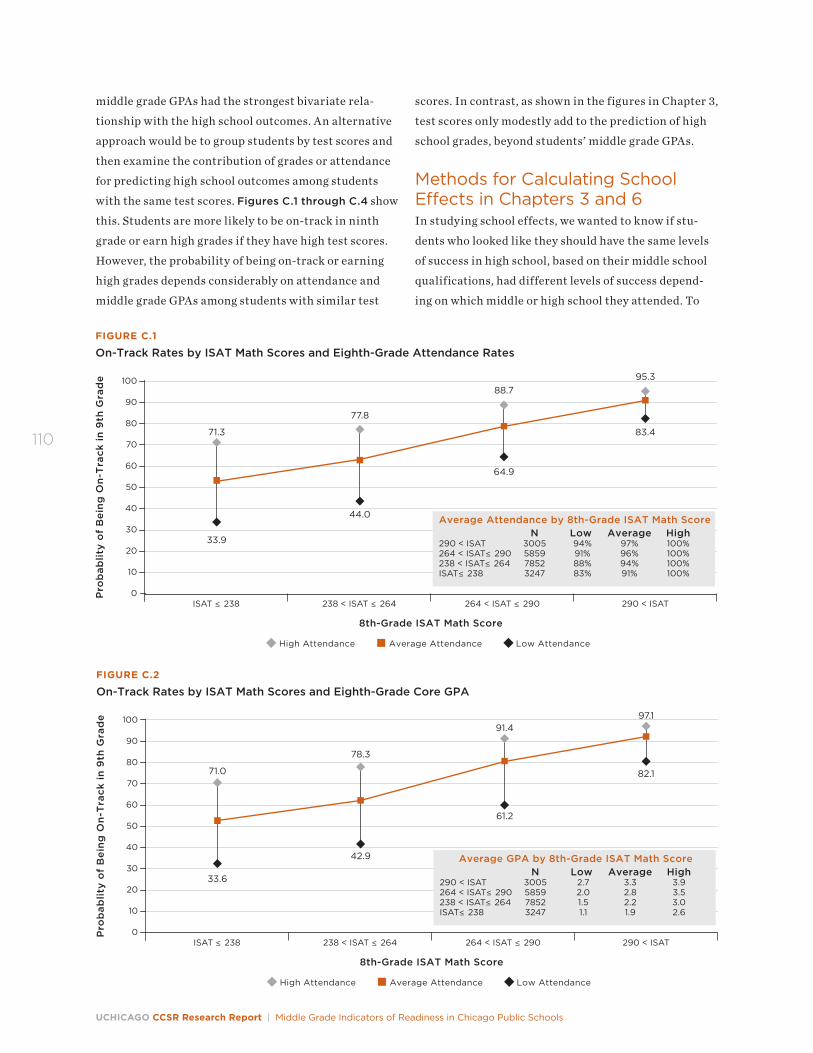
UCHICAGO CCSR Research Report | Middle Grade Indicators of Readiness in Chicago Public Schools
110
middle grade GPAs had the strongest bivariate rela-
tionship with the high school outcomes. An alternative
approach would be to group students by test scores and
then examine the contribution of grades or attendance
for predicting high school outcomes among students
with the same test scores. Figures C.1 through C.4 show
this. Students are more likely to be on-track in ninth
grade or earn high grades if they have high test scores.
However, the probability of being on-track or earning
high grades depends considerably on attendance and
middle grade GPAs among students with similar test
scores. In contrast, as shown in the figures in Chapter 3,
test scores only modestly add to the prediction of high
school grades, beyond students’ middle grade GPAs.
Methods for Calculating School Effects in Chapters 3 and 6In studying school effects, we wanted to know if stu-
dents who looked like they should have the same levels
of success in high school, based on their middle school
qualifications, had different levels of success depend-
ing on which middle or high school they attended. To
8th-Grade ISAT Math Score
FIGURE C.1
On-Track Rates by ISAT Math Scores and Eighth-Grade Attendance Rates
33.9
71.3
64.9
77.8
88.7
44.0
83.4
95.3
High Attendance Average Attendance Low Attendance
Pro
bab
lity
of
Bei
ng
On
-Tra
ck in
9th
Gra
de
ISAT ≤ 238 238 < ISAT ≤ 264 264 < ISAT ≤ 290 290 < ISAT
Average Attendance by 8th-Grade ISAT Math Score N Low Average High290 < ISAT 3005 94% 97% 100%264 < ISAT≤ 290 5859 91% 96% 100%238 < ISAT≤ 264 7852 88% 94% 100%ISAT≤ 238 3247 83% 91% 100%
40
100
90
80
70
60
50
30
20
10
0
8th-Grade ISAT Math Score
FIGURE C.2
On-Track Rates by ISAT Math Scores and Eighth-Grade Core GPA
33.6
71.0
61.2
78.3
91.4
42.9
82.1
97.1
High Attendance Average Attendance Low Attendance
Pro
bab
lity
of
Bei
ng
On
-Tra
ck in
9th
Gra
de
ISAT ≤ 238 238 < ISAT ≤ 264 264 < ISAT ≤ 290 290 < ISAT
Average GPA by 8th-Grade ISAT Math Score N Low Average High290 < ISAT 3005 2.7 3.3 3.9264 < ISAT≤ 290 5859 2.0 2.8 3.5238 < ISAT≤ 264 7852 1.5 2.2 3.0ISAT≤ 238 3247 1.1 1.9 2.6
40
100
90
80
70
60
50
30
20
10
0
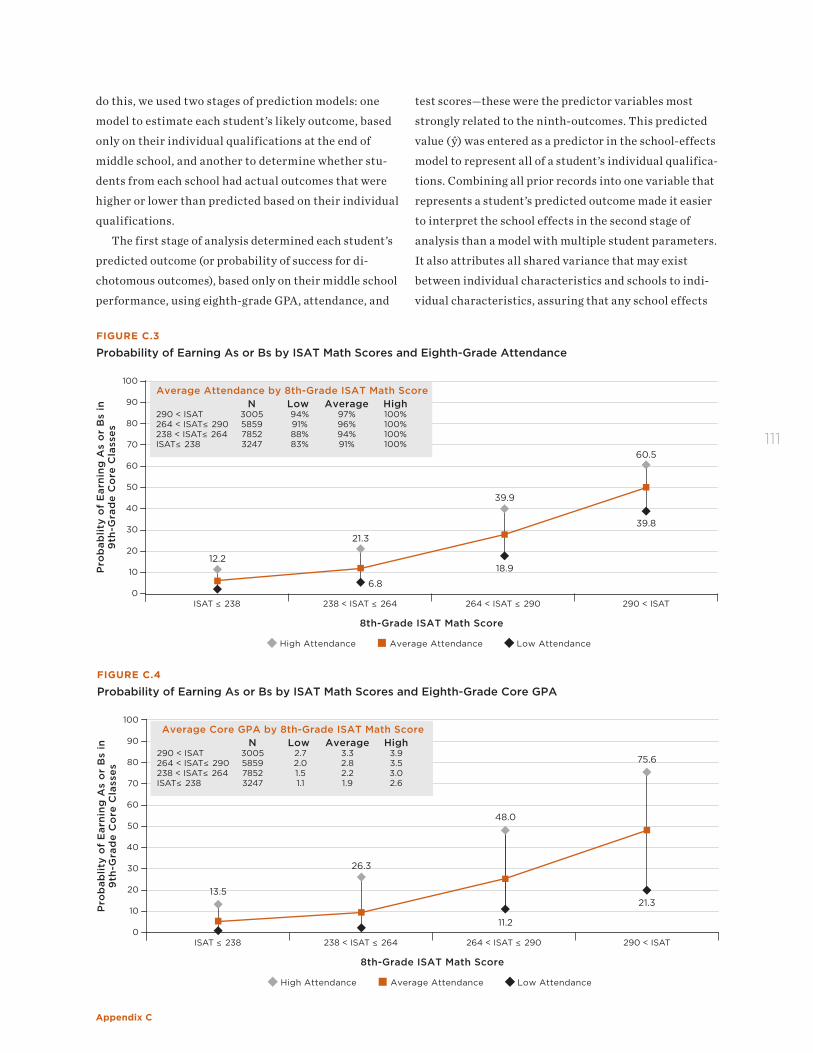
Appendix C
111
do this, we used two stages of prediction models: one
model to estimate each student’s likely outcome, based
only on their individual qualifications at the end of
middle school, and another to determine whether stu-
dents from each school had actual outcomes that were
higher or lower than predicted based on their individual
qualifications.
The first stage of analysis determined each student’s
predicted outcome (or probability of success for di-
chotomous outcomes), based only on their middle school
performance, using eighth-grade GPA, attendance, and
test scores—these were the predictor variables most
strongly related to the ninth-outcomes. This predicted
value (ŷ) was entered as a predictor in the school-effects
model to represent all of a student’s individual qualifica-
tions. Combining all prior records into one variable that
represents a student’s predicted outcome made it easier
to interpret the school effects in the second stage of
analysis than a model with multiple student parameters.
It also attributes all shared variance that may exist
between individual characteristics and schools to indi-
vidual characteristics, assuring that any school effects
8th-Grade ISAT Math Score
FIGURE C.3
Probability of Earning As or Bs by ISAT Math Scores and Eighth-Grade Attendance
12.218.9
6.8
39.9
21.3
39.8
60.5
High Attendance Average Attendance Low Attendance
Pro
bab
lity
of
Ear
nin
g A
s o
r B
s in
9th
-Gra
de
Co
re C
lass
es
ISAT ≤ 238 238 < ISAT ≤ 264 264 < ISAT ≤ 290 290 < ISAT
Average Attendance by 8th-Grade ISAT Math Score N Low Average High290 < ISAT 3005 94% 97% 100%264 < ISAT≤ 290 5859 91% 96% 100%238 < ISAT≤ 264 7852 88% 94% 100%ISAT≤ 238 3247 83% 91% 100%
40
100
90
80
70
60
50
30
20
10
0
8th-Grade ISAT Math Score
FIGURE C.4
Probability of Earning As or Bs by ISAT Math Scores and Eighth-Grade Core GPA
13.5
11.2
48.0
26.3
21.3
75.6
High Attendance Average Attendance Low Attendance
Pro
bab
lity
of
Ear
nin
g A
s o
r B
s in
9th
-Gra
de
Co
re C
lass
es
ISAT ≤ 238 238 < ISAT ≤ 264 264 < ISAT ≤ 290 290 < ISAT
Average Core GPA by 8th-Grade ISAT Math Score N Low Average High290 < ISAT 3005 2.7 3.3 3.9264 < ISAT≤ 290 5859 2.0 2.8 3.5238 < ISAT≤ 264 7852 1.5 2.2 3.0ISAT≤ 238 3247 1.1 1.9 2.6
40
100
90
80
70
60
50
30
20
10
0
UCHICAGO CCSR Research Report | Middle Grade Indicators of Readiness in Chicago Public Schools
112
that are discerned do not result simply from the selec-
tion of students with particular achievement levels into
specific schools. For this reason, we may be underesti-
mating school effects, but we are certain that any school
effects that are identified actually can be attributed to
schools rather than to individuals.
School effects were calculated through cross-nested
models, with students nested simultaneously in their
eighth-grade school and their ninth-grade school. For
each outcome, the predicted value of the outcome from
the first stage analysis (ŷ) controls for students’ quali-
fications (see models below). The extent that students
from particular middle schools or high schools have out-
comes that are higher or lower than the predicted values
are captured with the school effects (b00 and c00 ). Cross-
nesting students in both schools allows us to capture
middle school and high school effects net of each other.
LEVEL-1 MODEL
outcome = π0 + π1*(ŷ)
LEVEL-2 MODEL
(students nested simultaneously in their middle and
high school)
π0 = θ0 + b00 + c00π1 = θ1
After determining the middle and high school
effects, net of each other, we ran hierarchical models
with students nested in their middle grade school only
to determine the middle school effects incorporating
high school effects. These models attribute high school
effects to middle schools, showing the actual effect of
attending a particular middle school, given the sending/
receiving patterns that exist between schools.
Methods for Calculating Growth Over Time in Chapter 8We begin by discussing the analysis of growth trends
on the ISAT; attendance and grade models were similar,
but had some differences, as discussed below. Growth
trends on ISAT scores were based on the population
of students who were first-time ninth-graders in the
fall of 2009. For the ISAT trends, data comes from the
tests students took in the spring of 2006, 2007, 2008,
and 2009. If students had data at any point in time in
those four years they were included in the analysis. We
included all schools and all students with test data, re-
gardless of whether they were receiving special educa-
tion or bilingual services.
We modeled trends in ISAT scores over time using
a two level HLM model in which annual ISAT scores at
level 1 were nested within students at level 2. Students’
scores at level 1 were modeled as a function of students’
grade level (centered at grade eight), and also whether a
student had been retained in that year or had skipped a
grade that year. Because there were only four points to
the trend, and preliminary models had shown that the
quadratic term was very small in these models, we did
not include a nonlinear term in the model for simplic-
ity when estimating school effects. We also looked for
anomalies from linear growth at specific grade levels,
which are discussed further below. The models for read-
ing and math ISAT scores, attendance, and grades were
basically the same:
LEVEL-1
ISAT Score = π0 + π1*(Grade – Centered Grade 8) + π2*(Old for Grade) + π3*(Retained) + π4*(Skipped
Grade) + e
LEVEL-2
π0 = γ00 + u0π1 = γ10 + u1π2 = γ20π3 = γ30π4 = γ40
where:
• grade is the growth trajectory slope, centered around
grade 8, so that it is 0 when grade=8, -1 when grade=7,
etc.
• old for grade is 1 if student was old for grade at the
first data point they appear in the data
• retained is 0 if never retained in grade at that point,
1 if retained that year and for each year after that, 2
the second time retained and 2 after that, and so on
if there are multiple years of grade retention
• skipped grade is 0 if never skipped a grade, 1 if they
skipped a grade and after that, 2 the second time
and so on.
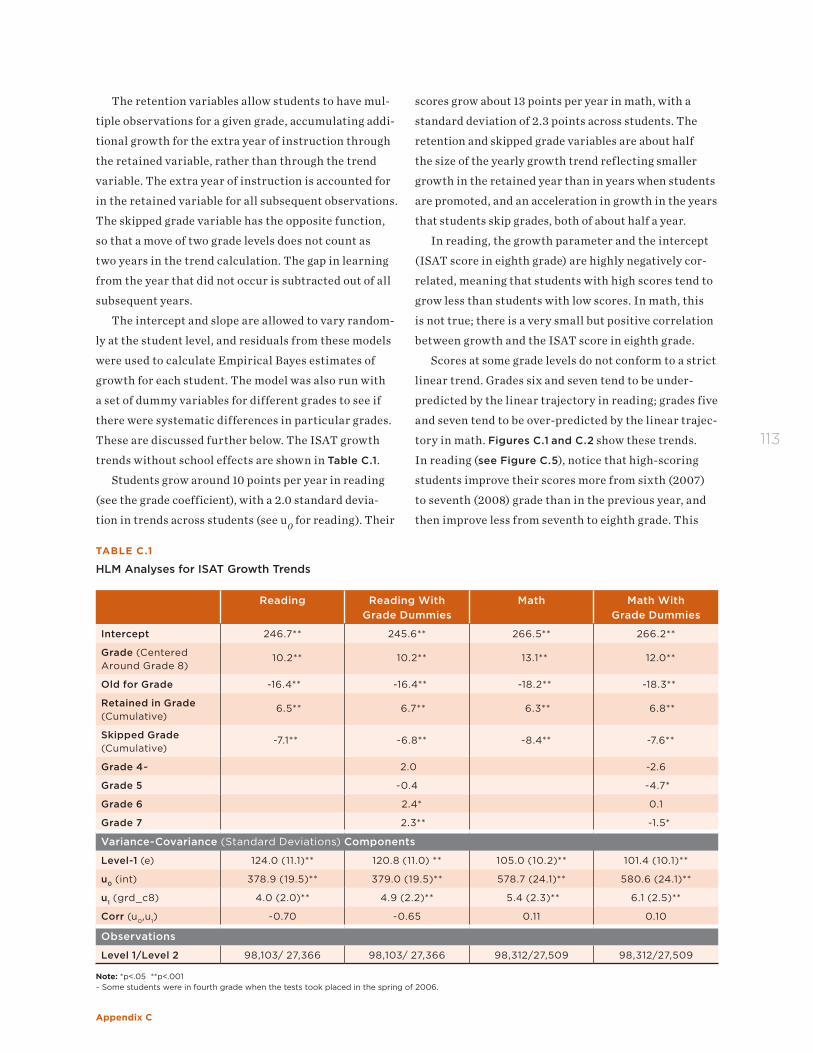
Appendix C
113
TABLE C.1
HLM Analyses for ISAT Growth Trends
Reading Reading With Grade Dummies
Math Math With Grade Dummies
Intercept 246.7** 245.6** 266.5** 266.2**
Grade (Centered Around Grade 8)
10.2** 10.2** 13.1** 12.0**
Old for Grade -16.4** -16.4** -18.2** -18.3**
Retained in Grade (Cumulative)
6.5** 6.7** 6.3** 6.8**
Skipped Grade (Cumulative)
-7.1** -6.8** -8.4** -7.6**
Grade 4~ 2.0 -2.6
Grade 5 -0.4 -4.7*
Grade 6 2.4* 0.1
Grade 7 2.3** -1.5*
Variance-Covariance (Standard Deviations) Components
Level-1 (e) 124.0 (11.1)** 120.8 (11.0) ** 105.0 (10.2)** 101.4 (10.1)**
u0 (int) 378.9 (19.5)** 379.0 (19.5)** 578.7 (24.1)** 580.6 (24.1)**
u1 (grd_c8) 4.0 (2.0)** 4.9 (2.2)** 5.4 (2.3)** 6.1 (2.5)**
Corr (u0,u1) -0.70 -0.65 0.11 0.10
Observations
Level 1/Level 2 98,103/ 27,366 98,103/ 27,366 98,312/27,509 98,312/27,509
Note: *p<.05 **p<.001 ~ Some students were in fourth grade when the tests took placed in the spring of 2006.
scores grow about 13 points per year in math, with a
standard deviation of 2.3 points across students. The
retention and skipped grade variables are about half
the size of the yearly growth trend reflecting smaller
growth in the retained year than in years when students
are promoted, and an acceleration in growth in the years
that students skip grades, both of about half a year.
In reading, the growth parameter and the intercept
(ISAT score in eighth grade) are highly negatively cor-
related, meaning that students with high scores tend to
grow less than students with low scores. In math, this
is not true; there is a very small but positive correlation
between growth and the ISAT score in eighth grade.
Scores at some grade levels do not conform to a strict
linear trend. Grades six and seven tend to be under-
predicted by the linear trajectory in reading; grades five
and seven tend to be over-predicted by the linear trajec-
tory in math. Figures C.1 and C.2 show these trends.
In reading (see Figure C.5), notice that high-scoring
students improve their scores more from sixth (2007)
to seventh (2008) grade than in the previous year, and
then improve less from seventh to eighth grade. This
The retention variables allow students to have mul-
tiple observations for a given grade, accumulating addi-
tional growth for the extra year of instruction through
the retained variable, rather than through the trend
variable. The extra year of instruction is accounted for
in the retained variable for all subsequent observations.
The skipped grade variable has the opposite function,
so that a move of two grade levels does not count as
two years in the trend calculation. The gap in learning
from the year that did not occur is subtracted out of all
subsequent years.
The intercept and slope are allowed to vary random-
ly at the student level, and residuals from these models
were used to calculate Empirical Bayes estimates of
growth for each student. The model was also run with
a set of dummy variables for different grades to see if
there were systematic differences in particular grades.
These are discussed further below. The ISAT growth
trends without school effects are shown in Table C.1.
Students grow around 10 points per year in reading
(see the grade coefficient), with a 2.0 standard devia-
tion in trends across students (see u0 for reading). Their
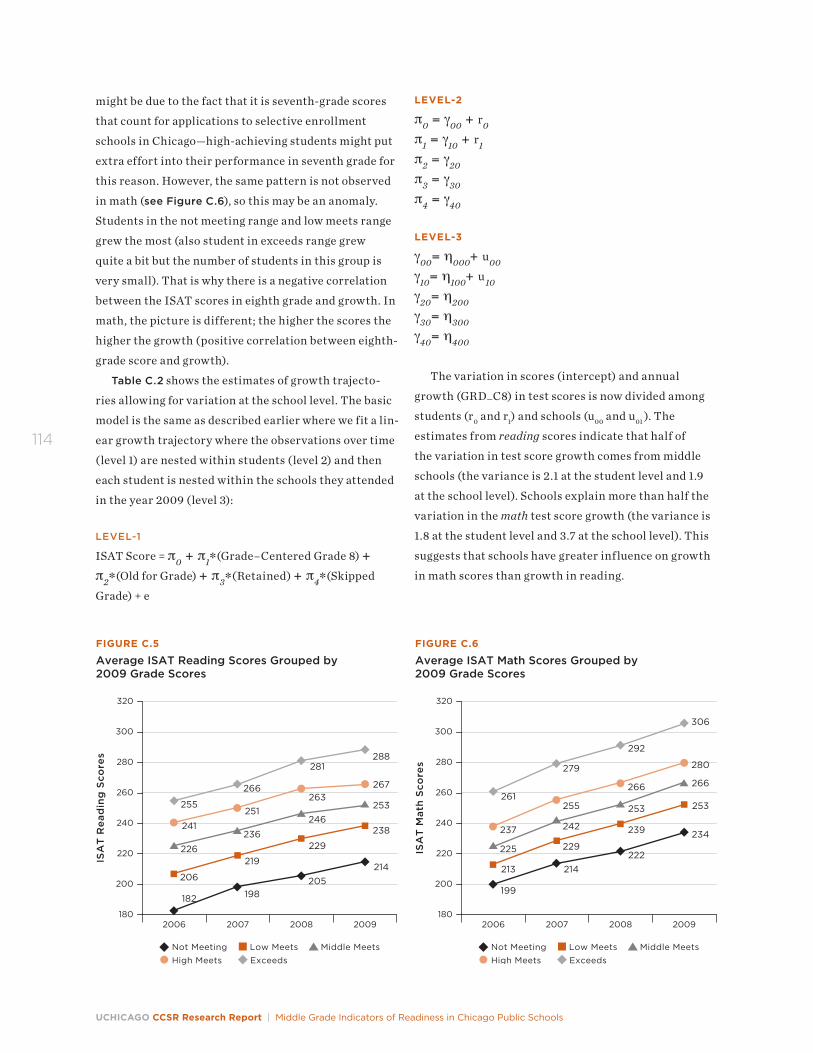
UCHICAGO CCSR Research Report | Middle Grade Indicators of Readiness in Chicago Public Schools
114
might be due to the fact that it is seventh-grade scores
that count for applications to selective enrollment
schools in Chicago—high-achieving students might put
extra effort into their performance in seventh grade for
this reason. However, the same pattern is not observed
in math (see Figure C.6), so this may be an anomaly.
Students in the not meeting range and low meets range
grew the most (also student in exceeds range grew
quite a bit but the number of students in this group is
very small). That is why there is a negative correlation
between the ISAT scores in eighth grade and growth. In
math, the picture is different; the higher the scores the
higher the growth (positive correlation between eighth-
grade score and growth).
Table C.2 shows the estimates of growth trajecto-
ries allowing for variation at the school level. The basic
model is the same as described earlier where we fit a lin-
ear growth trajectory where the observations over time
(level 1) are nested within students (level 2) and then
each student is nested within the schools they attended
in the year 2009 (level 3):
LEVEL-1
ISAT Score = π0 + π1*(Grade–Centered Grade 8) + π2*(Old for Grade) + π3*(Retained) + π4*(Skipped
Grade) + e
LEVEL-2
π0 = γ00 + r0π1 = γ10 + r1π2 = γ20π3 = γ30π4 = γ40
LEVEL-3
γ00= η000+ u00γ10= η100+ u10γ20= η200γ30= η300γ40= η400
The variation in scores (intercept) and annual
growth (GRD_C8) in test scores is now divided among
students (r0 and r1) and schools (u00 and u01 ). The
estimates from reading scores indicate that half of
the variation in test score growth comes from middle
schools (the variance is 2.1 at the student level and 1.9
at the school level). Schools explain more than half the
variation in the math test score growth (the variance is
1.8 at the student level and 3.7 at the school level). This
suggests that schools have greater influence on growth
in math scores than growth in reading.
FIGURE C.5
Average ISAT Reading Scores Grouped by 2009 Grade Scores
241
206
226
182
255251
219
236
198
266263
229
246
205
281
267
238
253
214
288
ISA
T R
ead
ing
Sco
res
300
320
280
260
240
220
180
200
2006 2007 2008 2009
Not Meeting Low Meets Middle MeetsHigh Meets Exceeds
FIGURE C.6
Average ISAT Math Scores Grouped by 2009 Grade Scores
237
213
225
199
261255
229
242
214
279
266
239
253
222
292
280
253
266
234
306
ISA
T M
ath
Sco
res
300
320
280
260
240
220
180
200
2006 2007 2008 2009
Not Meeting Low Meets Middle MeetsHigh Meets Exceeds
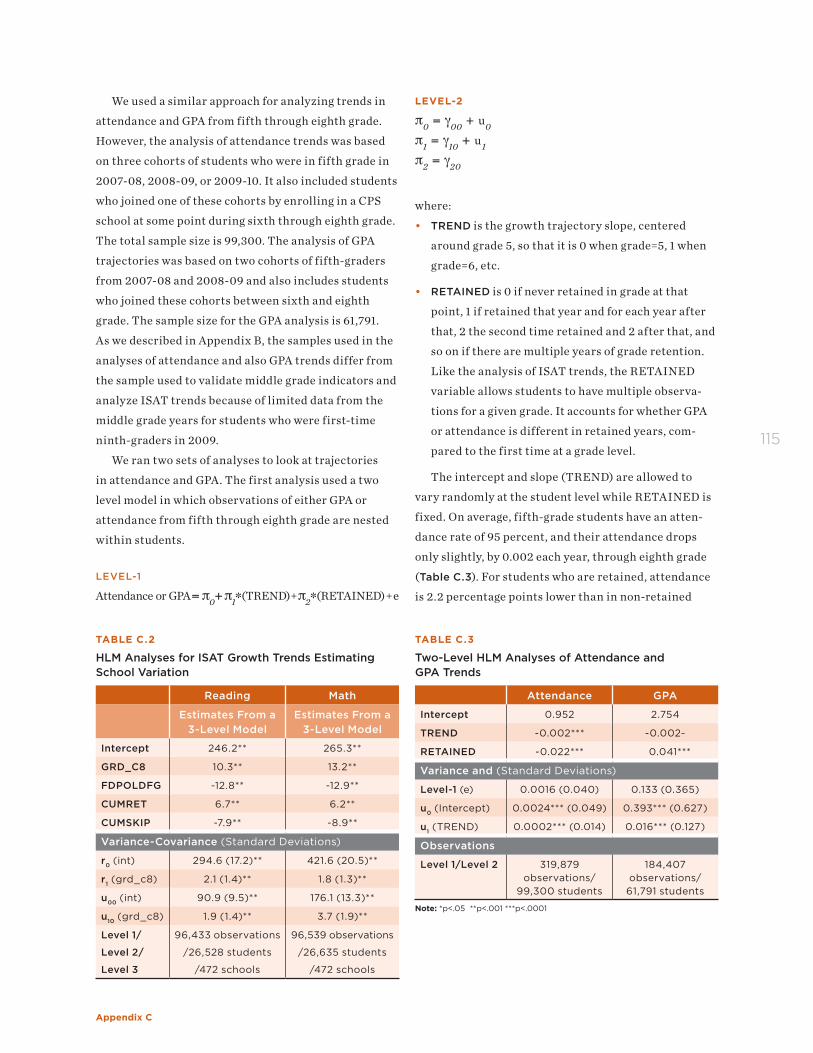
Appendix C
115
TABLE C.3
Two-Level HLM Analyses of Attendance and GPA Trends
Attendance GPA
Intercept 0.952 2.754
TREND -0.002*** -0.002~
RETAINED -0.022*** 0.041***
Variance and (Standard Deviations)
Level-1 (e) 0.0016 (0.040) 0.133 (0.365)
u0 (Intercept) 0.0024*** (0.049) 0.393*** (0.627)
u1 (TREND) 0.0002*** (0.014) 0.016*** (0.127)
Observations
Level 1/Level 2 319,879 observations/
99,300 students
184,407 observations/
61,791 students
Note: *p<.05 **p<.001 ***p<.0001
We used a similar approach for analyzing trends in
attendance and GPA from fifth through eighth grade.
However, the analysis of attendance trends was based
on three cohorts of students who were in fifth grade in
2007-08, 2008-09, or 2009-10. It also included students
who joined one of these cohorts by enrolling in a CPS
school at some point during sixth through eighth grade.
The total sample size is 99,300. The analysis of GPA
trajectories was based on two cohorts of fifth-graders
from 2007-08 and 2008-09 and also includes students
who joined these cohorts between sixth and eighth
grade. The sample size for the GPA analysis is 61,791.
As we described in Appendix B, the samples used in the
analyses of attendance and also GPA trends differ from
the sample used to validate middle grade indicators and
analyze ISAT trends because of limited data from the
middle grade years for students who were first-time
ninth-graders in 2009.
We ran two sets of analyses to look at trajectories
in attendance and GPA. The first analysis used a two
level model in which observations of either GPA or
attendance from fifth through eighth grade are nested
within students.
LEVEL-1
Attendance or GPA = π0 + π1*(TREND) + π2*(RETAINED) + e
TABLE C.2
HLM Analyses for ISAT Growth Trends Estimating School Variation
Reading Math
Estimates From a 3-Level Model
Estimates From a 3-Level Model
Intercept 246.2** 265.3**
GRD_C8 10.3** 13.2**
FDPOLDFG -12.8** -12.9**
CUMRET 6.7** 6.2**
CUMSKIP -7.9** -8.9**
Variance-Covariance (Standard Deviations)
r0 (int) 294.6 (17.2)** 421.6 (20.5)**
r1 (grd_c8) 2.1 (1.4)** 1.8 (1.3)**
u00 (int) 90.9 (9.5)** 176.1 (13.3)**
u10 (grd_c8) 1.9 (1.4)** 3.7 (1.9)**
Level 1/
Level 2/
Level 3
96,433 observations
/26,528 students
/472 schools
96,539 observations
/26,635 students
/472 schools
LEVEL-2
π0 = γ00 + u0π1 = γ10 + u1π2 = γ20
where:
• TREND is the growth trajectory slope, centered
around grade 5, so that it is 0 when grade=5, 1 when
grade=6, etc.
• RETAINED is 0 if never retained in grade at that
point, 1 if retained that year and for each year after
that, 2 the second time retained and 2 after that, and
so on if there are multiple years of grade retention.
Like the analysis of ISAT trends, the RETAINED
variable allows students to have multiple observa-
tions for a given grade. It accounts for whether GPA
or attendance is different in retained years, com-
pared to the first time at a grade level.
The intercept and slope (TREND) are allowed to
vary randomly at the student level while RETAINED is
fixed. On average, fifth-grade students have an atten-
dance rate of 95 percent, and their attendance drops
only slightly, by 0.002 each year, through eighth grade
(Table C.3). For students who are retained, attendance
is 2.2 percentage points lower than in non-retained
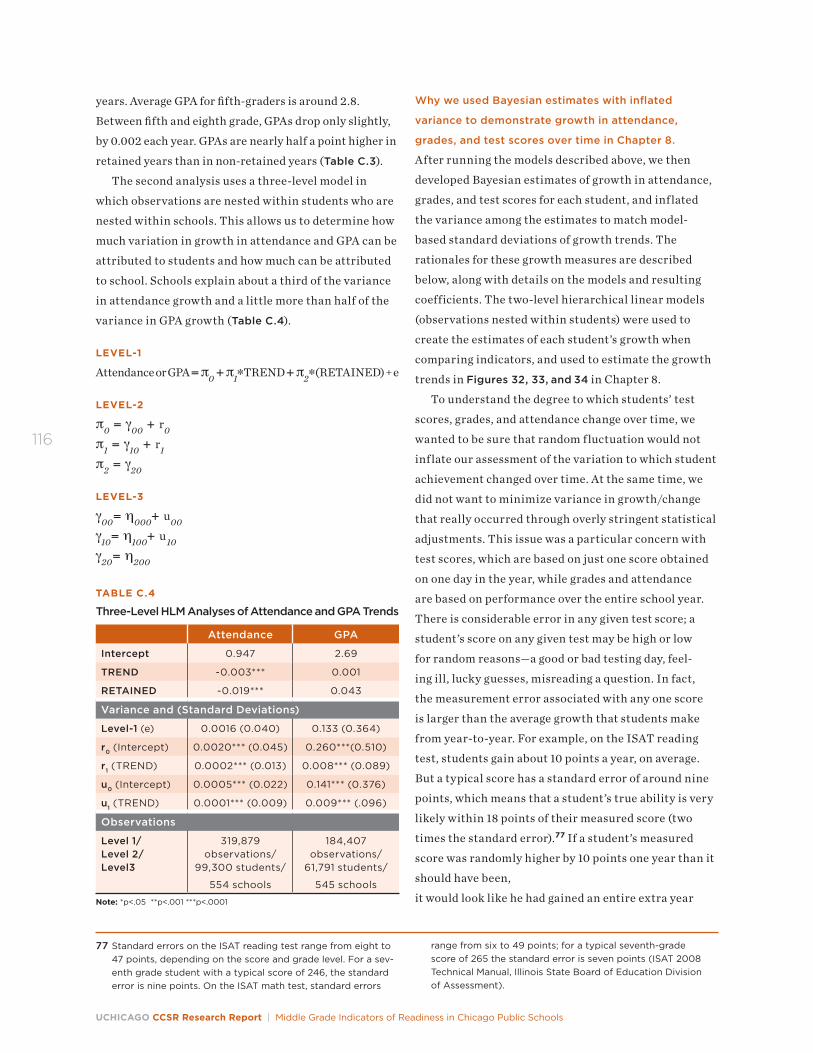
UCHICAGO CCSR Research Report | Middle Grade Indicators of Readiness in Chicago Public Schools
116
years. Average GPA for fifth-graders is around 2.8.
Between fifth and eighth grade, GPAs drop only slightly,
by 0.002 each year. GPAs are nearly half a point higher in
retained years than in non-retained years (Table C.3).
The second analysis uses a three-level model in
which observations are nested within students who are
nested within schools. This allows us to determine how
much variation in growth in attendance and GPA can be
attributed to students and how much can be attributed
to school. Schools explain about a third of the variance
in attendance growth and a little more than half of the
variance in GPA growth (Table C.4).
LEVEL-1
Attendance or GPA = π0 + π1*TREND + π2*(RETAINED) + e
LEVEL-2
π0 = γ00 + r0π1 = γ10 + r1π2 = γ20
LEVEL-3
γ00= η000+ u00γ10= η100+ u10γ20= η200
Why we used Bayesian estimates with inflated
variance to demonstrate growth in attendance,
grades, and test scores over time in Chapter 8.
After running the models described above, we then
developed Bayesian estimates of growth in attendance,
grades, and test scores for each student, and inflated
the variance among the estimates to match model-
based standard deviations of growth trends. The
rationales for these growth measures are described
below, along with details on the models and resulting
coefficients. The two-level hierarchical linear models
(observations nested within students) were used to
create the estimates of each student’s growth when
comparing indicators, and used to estimate the growth
trends in Figures 32, 33, and 34 in Chapter 8.
To understand the degree to which students’ test
scores, grades, and attendance change over time, we
wanted to be sure that random fluctuation would not
inflate our assessment of the variation to which student
achievement changed over time. At the same time, we
did not want to minimize variance in growth/change
that really occurred through overly stringent statistical
adjustments. This issue was a particular concern with
test scores, which are based on just one score obtained
on one day in the year, while grades and attendance
are based on performance over the entire school year.
There is considerable error in any given test score; a
student’s score on any given test may be high or low
for random reasons—a good or bad testing day, feel-
ing ill, lucky guesses, misreading a question. In fact,
the measurement error associated with any one score
is larger than the average growth that students make
from year-to-year. For example, on the ISAT reading
test, students gain about 10 points a year, on average.
But a typical score has a standard error of around nine
points, which means that a student’s true ability is very
likely within 18 points of their measured score (two
times the standard error).77 If a student’s measured
score was randomly higher by 10 points one year than it
should have been,
it would look like he had gained an entire extra year
77 Standard errors on the ISAT reading test range from eight to 47 points, depending on the score and grade level. For a sev-enth grade student with a typical score of 246, the standard error is nine points. On the ISAT math test, standard errors
range from six to 49 points; for a typical seventh-grade score of 265 the standard error is seven points (ISAT 2008 Technical Manual, Illinois State Board of Education Division of Assessment).
TABLE C.4
Three-Level HLM Analyses of Attendance and GPA Trends
Attendance GPA
Intercept 0.947 2.69
TREND -0.003*** 0.001
RETAINED -0.019*** 0.043
Variance and (Standard Deviations)
Level-1 (e) 0.0016 (0.040) 0.133 (0.364)
r0 (Intercept) 0.0020*** (0.045) 0.260***(0.510)
r1 (TREND) 0.0002*** (0.013) 0.008*** (0.089)
u0 (Intercept) 0.0005*** (0.022) 0.141*** (0.376)
u1 (TREND) 0.0001*** (0.009) 0.009*** (.096)
Observations
Level 1/ Level 2/ Level3
319,879 observations/
99,300 students/
554 schools
184,407 observations/
61,791 students/
545 schools
Note: *p<.05 **p<.001 ***p<.0001
Appendix C
117
worth of skills when he had not. We examined a
number of potential methods of estimating growth in
test scores, and the variance in test score growth over
time, described below. We then applied the same meth-
ods to examine changes in grades and attendance over
the middle grade years.
A simple method for calculating the average growth
that students make from fifth to eighth grade on the
ISAT exam is to estimate a growth trajectory (slope)
for each student using OLS regression models fit to
each student’s data. This method gives the average
gain made over three years (four time points) for each
student. However, scores that are much higher or lower
than the student’s real ability can make it look like
gains are smaller or larger than they really are. This is
especially true if a score with substantial error occurs
at the beginning or end of the time series, in fifth or
eighth grade. As a first, simple examination of whether
this should be a concern, we calculated the growth
trajectory for each student through OLS models, and
plotted students’ scores against their estimated growth
trajectory, for a random sample of students. We could
easily see that this did seem to be a problem for some
students, as their estimated slope was overly influenced
by scores that were substantially lower or higher than
other points.
An alternative method of calculating growth was
to get Empirical Bayes estimates of each student’s
average yearly growth through hierarchical linear
models (HLM) that nested observations within stu-
dents (Raudenbush and Bryk, 2002). The Bayesian
estimates minimize variance introduced by scores
that are exceptionally high or low, compared to a stu-
dent’s scores in other years, given the typical growth
trajectory. If scores are inconsistent relative to typical
growth, the trend is adjusted to reflect the most likely
true growth trajectory—given the patterns observed in
other students. However, this method has the potential
to reduce the differences between students in their
growth trends beyond what is true variation.
We decided to test which method produced the most
accurate estimates of students’ abilities at the end of
eighth grade (OLS growth estimates or Bayes growth
estimates), given where they started in fifth grade. If
the OLS estimate inflated or deflated growth based
on poor measurement in some years, the eighth-grade
score estimated based on the OLS trajectories should be
incorrectly lower or higher than their true score. If the
Bayesian estimate reduced true differences in students’
growth, the eighth-grade score estimated based on the
Bayesian trajectories should also be incorrectly lower
or higher than their true score. We then compared
those estimated scores to students’ scores on a differ-
ent exam, the EXPLORE, which is taken at the start
of the ninth-grade year. Students’ performance on the
EXPLORE should be strongly predicted by their true
skills at the end of the eighth-grade year.
All things being equal, we expected that, unless they
were substantially better estimates of growth than the
OLS estimates, the Bayesian estimates should have
had a weaker correlation with EXPLORE scores since
their variance was constrained. However, this was not
the case. The eighth-grade scores that were estimated
based on the Bayesian growth estimates were more
predictive of ninth-grade EXPLORE test scores, even
though there was less total variation (see Table C.5).
This convinced us that much of the variance in the OLS
estimates was noise, not true growth in skills, espe-
cially on the reading test where there were much larger
differences between the trends calculated through OLS
and HLM.
However, we were concerned that representing
the Bayes estimates of growth as the true variance
in growth would not be accurate in terms of the total
variation in growth. Variation in the empirical Bayes
estimates is known to be reduced beyond the true vari-
ance, as each estimate is pulled towards the group mean
based on the number of observations used to construct
the estimate.78 In this case, each estimate was based on
only a small number of test observations (four each).
Therefore, we inflated the variance among the Bayes
estimates based on the maximum likelihood estimate of
78 Raudenbush and Bryk (2002).
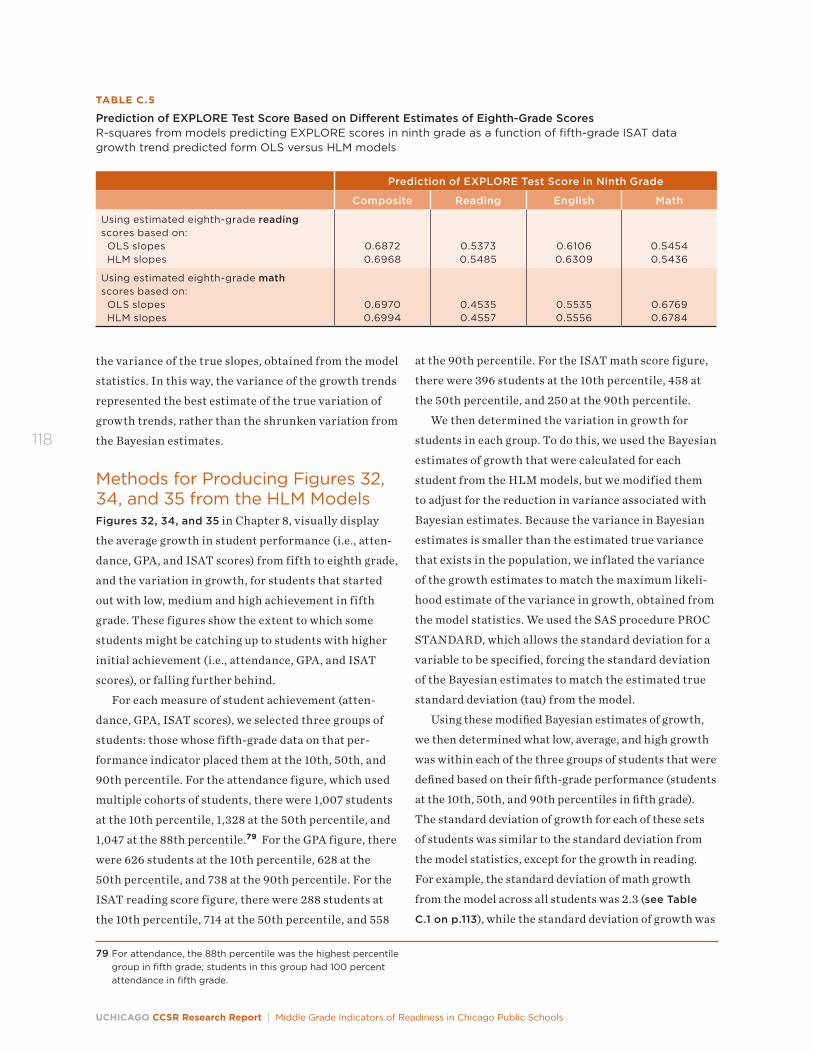
UCHICAGO CCSR Research Report | Middle Grade Indicators of Readiness in Chicago Public Schools
118
the variance of the true slopes, obtained from the model
statistics. In this way, the variance of the growth trends
represented the best estimate of the true variation of
growth trends, rather than the shrunken variation from
the Bayesian estimates.
Methods for Producing Figures 32, 34, and 35 from the HLM ModelsFigures 32, 34, and 35 in Chapter 8, visually display
the average growth in student performance (i.e., atten-
dance, GPA, and ISAT scores) from fifth to eighth grade,
and the variation in growth, for students that started
out with low, medium and high achievement in fifth
grade. These figures show the extent to which some
students might be catching up to students with higher
initial achievement (i.e., attendance, GPA, and ISAT
scores), or falling further behind.
For each measure of student achievement (atten-
dance, GPA, ISAT scores), we selected three groups of
students: those whose fifth-grade data on that per-
formance indicator placed them at the 10th, 50th, and
90th percentile. For the attendance figure, which used
multiple cohorts of students, there were 1,007 students
at the 10th percentile, 1,328 at the 50th percentile, and
1,047 at the 88th percentile.79 For the GPA figure, there
were 626 students at the 10th percentile, 628 at the
50th percentile, and 738 at the 90th percentile. For the
ISAT reading score figure, there were 288 students at
the 10th percentile, 714 at the 50th percentile, and 558
at the 90th percentile. For the ISAT math score figure,
there were 396 students at the 10th percentile, 458 at
the 50th percentile, and 250 at the 90th percentile.
We then determined the variation in growth for
students in each group. To do this, we used the Bayesian
estimates of growth that were calculated for each
student from the HLM models, but we modified them
to adjust for the reduction in variance associated with
Bayesian estimates. Because the variance in Bayesian
estimates is smaller than the estimated true variance
that exists in the population, we inflated the variance
of the growth estimates to match the maximum likeli-
hood estimate of the variance in growth, obtained from
the model statistics. We used the SAS procedure PROC
STANDARD, which allows the standard deviation for a
variable to be specified, forcing the standard deviation
of the Bayesian estimates to match the estimated true
standard deviation (tau) from the model.
Using these modified Bayesian estimates of growth,
we then determined what low, average, and high growth
was within each of the three groups of students that were
defined based on their fifth-grade performance (students
at the 10th, 50th, and 90th percentiles in fifth grade).
The standard deviation of growth for each of these sets
of students was similar to the standard deviation from
the model statistics, except for the growth in reading.
For example, the standard deviation of math growth
from the model across all students was 2.3 (see Table
C.1 on p.113), while the standard deviation of growth was
79 For attendance, the 88th percentile was the highest percentile group in fifth grade; students in this group had 100 percent attendance in fifth grade.
TABLE C.5
Prediction of EXPLORE Test Score Based on Different Estimates of Eighth-Grade ScoresR-squares from models predicting EXPLORE scores in ninth grade as a function of fifth-grade ISAT data growth trend predicted form OLS versus HLM models
Prediction of EXPLORE Test Score in Ninth Grade
Composite Reading English Math
Using estimated eighth-grade reading scores based on: OLS slopes HLM slopes
0.6872 0.6968
0.5373 0.5485
0.6106 0.6309
0.5454 0.5436
Using estimated eighth-grade math scores based on: OLS slopes HLM slopes
0.6970 0.6994
0.4535 0.4557
0.5535 0.5556
0.6769 0.6784
Appendix C
119
2.0 among students at the 10th percentile, 2.3 among
students at the 50th percentile, and 2.8 among students
at the 90th percentile. Because there is a large negative
covariance between initial reading test score and growth
on the reading tests, the standard deviation of growth
for each set of students with particular reading scores in
fifth grade was smaller than the overall variation. This is
because much of the variation in growth overall is deter-
mined by students’ initial status. The standard deviation
of growth in each group was about one-third the size of
the standard deviation for the population.
The figure graphs the growth that corresponded
to the 5th, 50th, and 95th percentiles for each group
of students. In this way, the figures show the range of
growth observed for students that started out initially
with low, medium and high performance. By using this
method we can see the differences in growth based on
initial status that could not be discerned by the over-
all estimates. For example, it shows that students that
started with initially low attendance had the largest
decline in attendance. We did not include quadratic
terms in the models because there were only four points
of time used to construct the slopes and the nonlinear
coefficients were very small when included.
Methods for Calculating Figure 36To create Figure 36, we first regressed each ninth-
grade outcome on the corresponding fifth-grade value
for that outcome; in other words, ninth-grade GPA was
regressed on fifth-grade GPA, ninth-grade on-track
was regressed on fifth-grade GPA and tenth-grade math
PLAN scores were regressed on fifth-grade math ISAT
scores. The residuals from this regression represent
how different the ninth-grade outcome is conditional
on the fifth-grade values. The residuals from each
of those analyses are then regressed on each of the
primary eighth-grade indicators (GPA, attendance,
ISAT math, and ISAT reading) to discern the prediction
based on eighth-grade data conditional on the values
of fifth grade. Using the coefficients from both set of
regressions, we calculated what the value of each ninth-
grade outcome would be given an eighth-grade GPA of
2.0 or 3.3 for students with a fifth-grade GPA of 2.5;
eighth-grade attendance of 93 percent or 99 percent
with a fifth-grade attendance of 97 percent; math ISAT
scores of 253 or 276 and reading ISAT scores of 241 or
248 with fifth-grade test scores of 225 in math and 215
in reading.
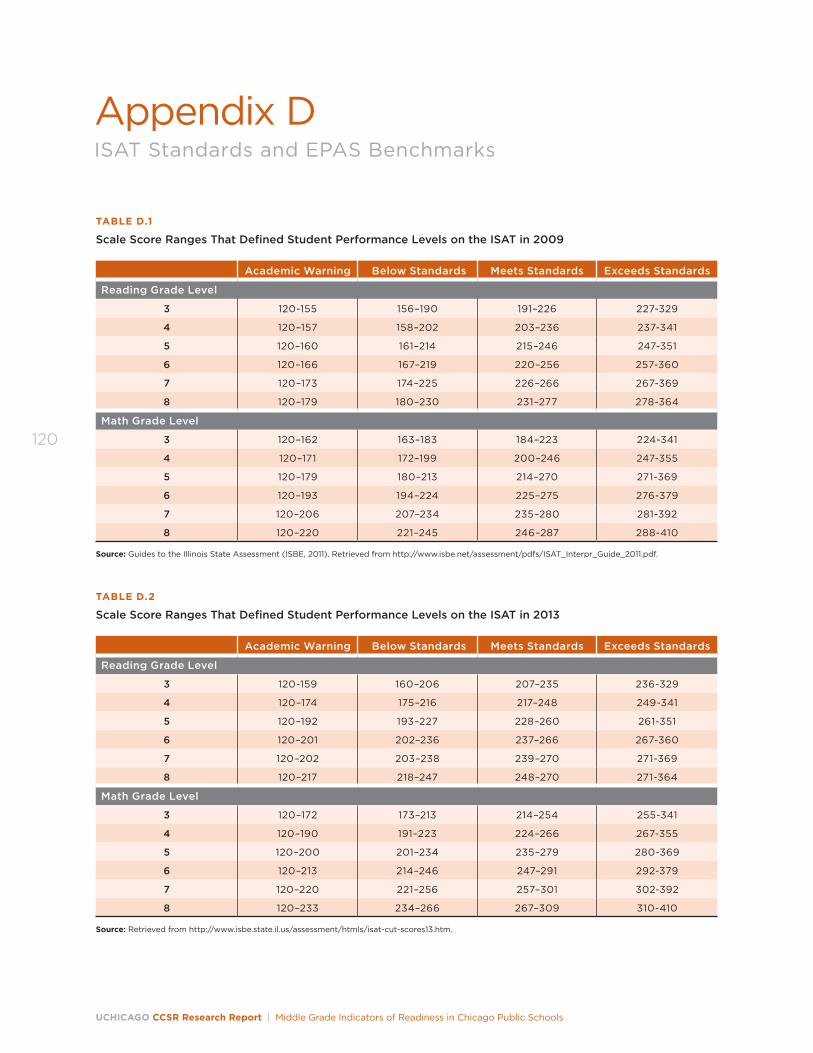
UCHICAGO CCSR Research Report | Middle Grade Indicators of Readiness in Chicago Public Schools
120
Appendix DISAT Standards and EPAS Benchmarks
TABLE D.1
Scale Score Ranges That Defined Student Performance Levels on the ISAT in 2009
Academic Warning Below Standards Meets Standards Exceeds Standards
Reading Grade Level
3 120-155 156–190 191–226 227-329
4 120–157 158–202 203–236 237-341
5 120–160 161–214 215–246 247-351
6 120–166 167–219 220–256 257-360
7 120–173 174–225 226–266 267-369
8 120–179 180–230 231–277 278-364
Math Grade Level
3 120–162 163–183 184–223 224-341
4 120–171 172–199 200–246 247-355
5 120–179 180–213 214–270 271-369
6 120–193 194–224 225–275 276-379
7 120–206 207–234 235–280 281-392
8 120–220 221–245 246–287 288-410
Source: Guides to the Illinois State Assessment (ISBE, 2011). Retrieved from http://www.isbe.net/assessment/pdfs/ISAT_Interpr_Guide_2011.pdf.
TABLE D.2
Scale Score Ranges That Defined Student Performance Levels on the ISAT in 2013
Academic Warning Below Standards Meets Standards Exceeds Standards
Reading Grade Level
3 120-159 160–206 207–235 236-329
4 120–174 175–216 217–248 249-341
5 120–192 193–227 228–260 261-351
6 120–201 202–236 237–266 267-360
7 120–202 203–238 239–270 271-369
8 120–217 218–247 248–270 271-364
Math Grade Level
3 120–172 173–213 214–254 255-341
4 120–190 191–223 224–266 267-355
5 120–200 201–234 235–279 280-369
6 120–213 214–246 247–291 292-379
7 120–220 221–256 257–301 302-392
8 120–233 234–266 267–309 310-410
Source: Retrieved from http://www.isbe.state.il.us/assessment/htmls/isat-cut-scores13.htm.
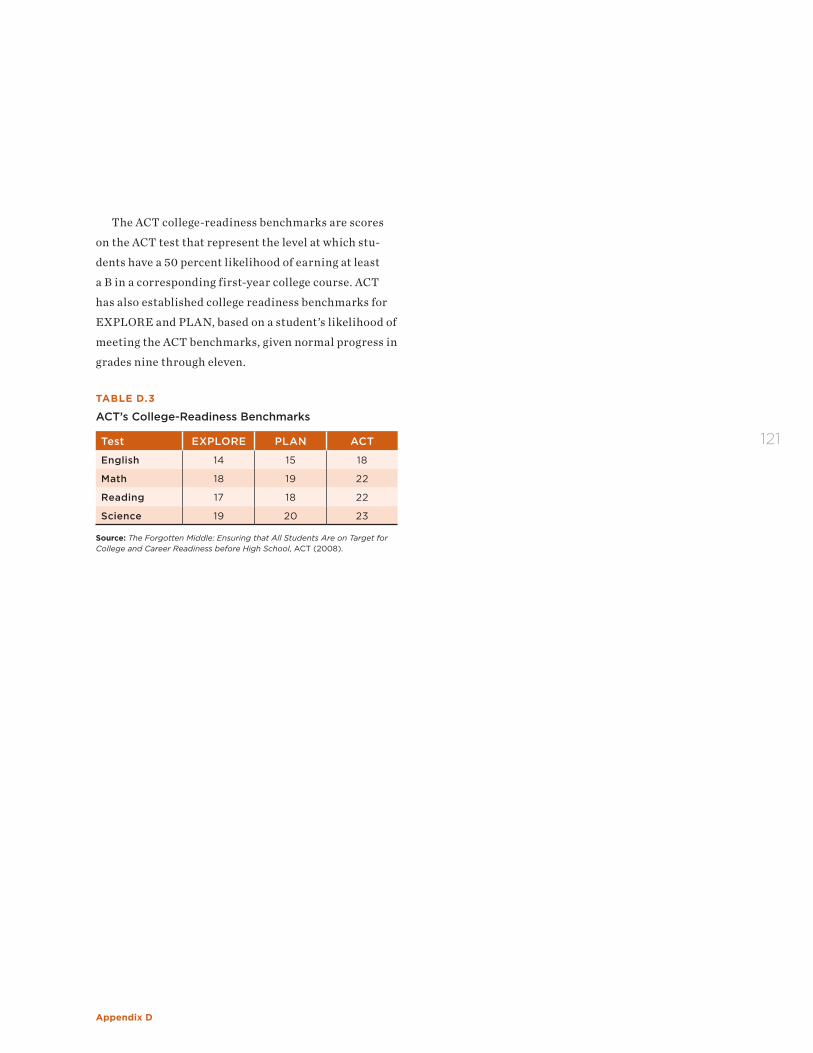
Appendix D
121
The ACT college-readiness benchmarks are scores
on the ACT test that represent the level at which stu-
dents have a 50 percent likelihood of earning at least
a B in a corresponding first-year college course. ACT
has also established college readiness benchmarks for
EXPLORE and PLAN, based on a student’s likelihood of
meeting the ACT benchmarks, given normal progress in
grades nine through eleven.
TABLE D.3
ACT’s College-Readiness Benchmarks
Test EXPLORE PLAN ACT
English 14 15 18
Math 18 19 22
Reading 17 18 22
Science 19 20 23
Source: The Forgotten Middle: Ensuring that All Students Are on Target for College and Career Readiness before High School, ACT (2008).
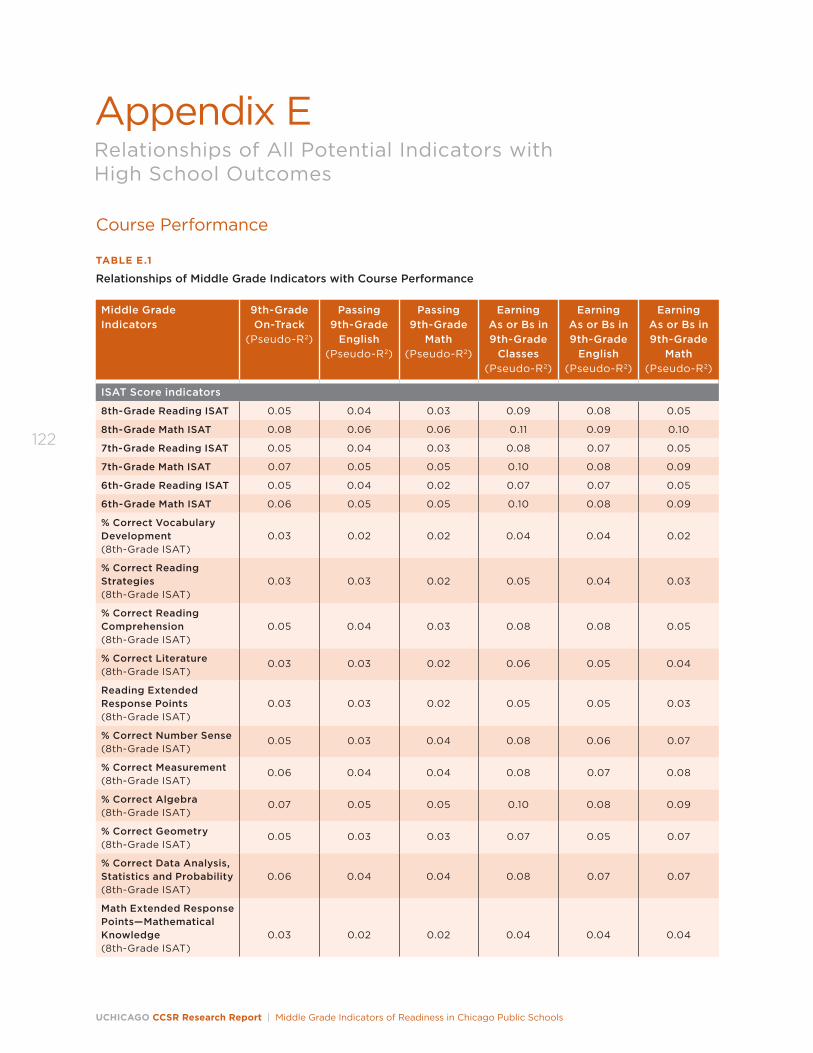
UCHICAGO CCSR Research Report | Middle Grade Indicators of Readiness in Chicago Public Schools
122
Appendix ERelationships of All Potential Indicators with High School Outcomes
Course Performance
TABLE E.1
Relationships of Middle Grade Indicators with Course Performance
Middle Grade Indicators
9th-Grade On-Track
(Pseudo-R2)
Passing 9th-Grade
English (Pseudo-R2)
Passing 9th-Grade
Math (Pseudo-R2)
Earning As or Bs in 9th-Grade
Classes (Pseudo-R2)
Earning As or Bs in 9th-Grade
English (Pseudo-R2)
Earning As or Bs in 9th-Grade
Math (Pseudo-R2)
ISAT Score indicators
8th-Grade Reading ISAT 0.05 0.04 0.03 0.09 0.08 0.05
8th-Grade Math ISAT 0.08 0.06 0.06 0.11 0.09 0.10
7th-Grade Reading ISAT 0.05 0.04 0.03 0.08 0.07 0.05
7th-Grade Math ISAT 0.07 0.05 0.05 0.10 0.08 0.09
6th-Grade Reading ISAT 0.05 0.04 0.02 0.07 0.07 0.05
6th-Grade Math ISAT 0.06 0.05 0.05 0.10 0.08 0.09
% Correct Vocabulary Development (8th-Grade ISAT)
0.03
0.02
0.02
0.04
0.04
0.02
% Correct Reading Strategies (8th-Grade ISAT)
0.03
0.03
0.02
0.05
0.04
0.03
% Correct Reading Comprehension (8th-Grade ISAT)
0.05
0.04
0.03
0.08
0.08
0.05
% Correct Literature (8th-Grade ISAT)
0.03 0.03 0.02 0.06 0.05 0.04
Reading Extended Response Points (8th-Grade ISAT)
0.03
0.03
0.02
0.05
0.05
0.03
% Correct Number Sense (8th-Grade ISAT)
0.05 0.03 0.04 0.08 0.06 0.07
% Correct Measurement (8th-Grade ISAT)
0.06 0.04 0.04 0.08 0.07 0.08
% Correct Algebra (8th-Grade ISAT)
0.07 0.05 0.05 0.10 0.08 0.09
% Correct Geometry (8th-Grade ISAT)
0.05 0.03 0.03 0.07 0.05 0.07
% Correct Data Analysis, Statistics and Probability (8th-Grade ISAT)
0.06
0.04
0.04
0.08
0.07
0.07
Math Extended Response Points—Mathematical Knowledge (8th-Grade ISAT)
0.03
0.02
0.02
0.04
0.04
0.04
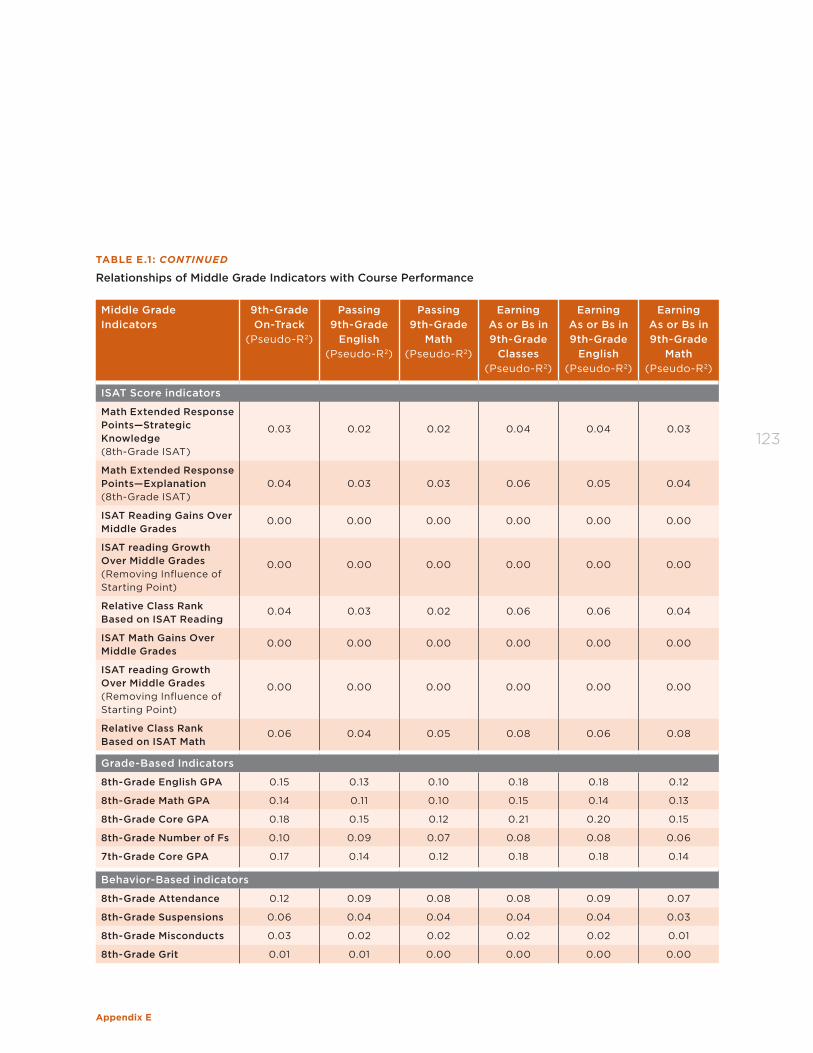
Appendix E
123
Middle Grade Indicators
9th-Grade On-Track
(Pseudo-R2)
Passing 9th-Grade
English (Pseudo-R2)
Passing 9th-Grade
Math (Pseudo-R2)
Earning As or Bs in 9th-Grade
Classes (Pseudo-R2)
Earning As or Bs in 9th-Grade
English (Pseudo-R2)
Earning As or Bs in 9th-Grade
Math (Pseudo-R2)
ISAT Score indicators
Math Extended Response Points—Strategic Knowledge (8th-Grade ISAT)
0.03 0.02 0.02 0.04 0.04 0.03
Math Extended Response Points—Explanation (8th-Grade ISAT)
0.04
0.03
0.03
0.06
0.05
0.04
ISAT Reading Gains Over Middle Grades
0.00 0.00 0.00 0.00 0.00 0.00
ISAT reading Growth Over Middle Grades (Removing Influence of Starting Point)
0.00 0.00 0.00 0.00 0.00 0.00
Relative Class Rank Based on ISAT Reading
0.04 0.03 0.02 0.06 0.06 0.04
ISAT Math Gains Over Middle Grades
0.00 0.00 0.00 0.00 0.00 0.00
ISAT reading Growth Over Middle Grades (Removing Influence of Starting Point)
0.00 0.00 0.00 0.00 0.00 0.00
Relative Class Rank Based on ISAT Math
0.06 0.04 0.05 0.08 0.06 0.08
Grade-Based Indicators
8th-Grade English GPA 0.15 0.13 0.10 0.18 0.18 0.12
8th-Grade Math GPA 0.14 0.11 0.10 0.15 0.14 0.13
8th-Grade Core GPA 0.18 0.15 0.12 0.21 0.20 0.15
8th-Grade Number of Fs 0.10 0.09 0.07 0.08 0.08 0.06
7th-Grade Core GPA 0.17 0.14 0.12 0.18 0.18 0.14
Behavior-Based indicators
8th-Grade Attendance 0.12 0.09 0.08 0.08 0.09 0.07
8th-Grade Suspensions 0.06 0.04 0.04 0.04 0.04 0.03
8th-Grade Misconducts 0.03 0.02 0.02 0.02 0.02 0.01
8th-Grade Grit 0.01 0.01 0.00 0.00 0.00 0.00
TABLE E.1: CONTINUED
Relationships of Middle Grade Indicators with Course Performance
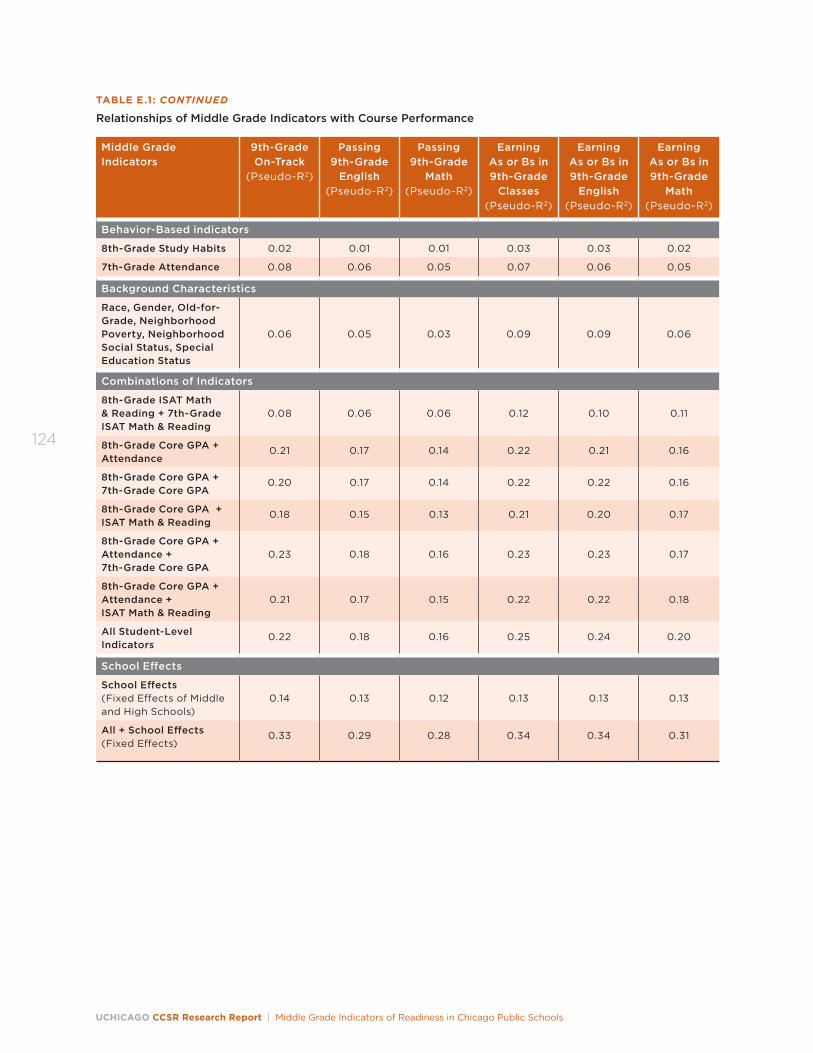
UCHICAGO CCSR Research Report | Middle Grade Indicators of Readiness in Chicago Public Schools
124
Middle Grade Indicators
9th-Grade On-Track
(Pseudo-R2)
Passing 9th-Grade
English (Pseudo-R2)
Passing 9th-Grade
Math (Pseudo-R2)
Earning As or Bs in 9th-Grade
Classes (Pseudo-R2)
Earning As or Bs in 9th-Grade
English (Pseudo-R2)
Earning As or Bs in 9th-Grade
Math (Pseudo-R2)
Behavior-Based indicators
8th-Grade Study Habits 0.02 0.01 0.01 0.03 0.03 0.02
7th-Grade Attendance 0.08 0.06 0.05 0.07 0.06 0.05
Background Characteristics
Race, Gender, Old-for-Grade, Neighborhood Poverty, Neighborhood Social Status, Special Education Status
0.06
0.05
0.03
0.09
0.09
0.06
Combinations of Indicators
8th-Grade ISAT Math & Reading + 7th-Grade ISAT Math & Reading
0.08
0.06
0.06
0.12
0.10
0.11
8th-Grade Core GPA + Attendance
0.21 0.17 0.14 0.22 0.21 0.16
8th-Grade Core GPA + 7th-Grade Core GPA
0.20 0.17 0.14 0.22 0.22 0.16
8th-Grade Core GPA + ISAT Math & Reading
0.18 0.15 0.13 0.21 0.20 0.17
8th-Grade Core GPA + Attendance + 7th-Grade Core GPA
0.23
0.18
0.16
0.23
0.23
0.17
8th-Grade Core GPA + Attendance + ISAT Math & Reading
0.21
0.17
0.15
0.22
0.22
0.18
All Student-Level Indicators
0.22 0.18 0.16 0.25 0.24 0.20
School Effects
School Effects (Fixed Effects of Middle and High Schools)
0.14
0.13
0.12
0.13
0.13
0.13
All + School Effects (Fixed Effects)
0.33 0.29 0.28 0.34 0.34 0.31
TABLE E.1: CONTINUED
Relationships of Middle Grade Indicators with Course Performance
Appendix E
125
Test ScoresThis section shows adjusted-R2 for models predicting
PLAN test scores and pseudo-R2 for PLAN benchmarks
for all the potential middle grade indicators used in the
analyses. Table E.2 shows the prediction fit for subject-
specific scores, as well as composite scores.
As with composite scores, the PLAN subject-specific
scores are predicted almost as well with sixth-grade
scores as with eighth-grade scores. In some cases,
PLAN English and reading scores are best predicted
by middle grade reading scores, while PLAN math and
science scores are best predicted by middle grade math
scores. Combining two test scores helps improve the
prediction of any PLAN scores. For PLAN English and
science, the best prediction comes from combining
eighth-grade reading and math scores; for PLAN read-
ing the best prediction comes from combining seventh-
and eighth-grade reading scores; and for PLAN math,
the best prediction comes from combining seventh-
and eighth-grade math scores. Adding core GPA or
students’ background characteristics only slightly
improves the fit of the models. Knowing the middle
school and high school that students attend can help
with the prediction of PLAN subject-specific scores.
The same findings apply to whether students reach
the benchmarks in each subject.
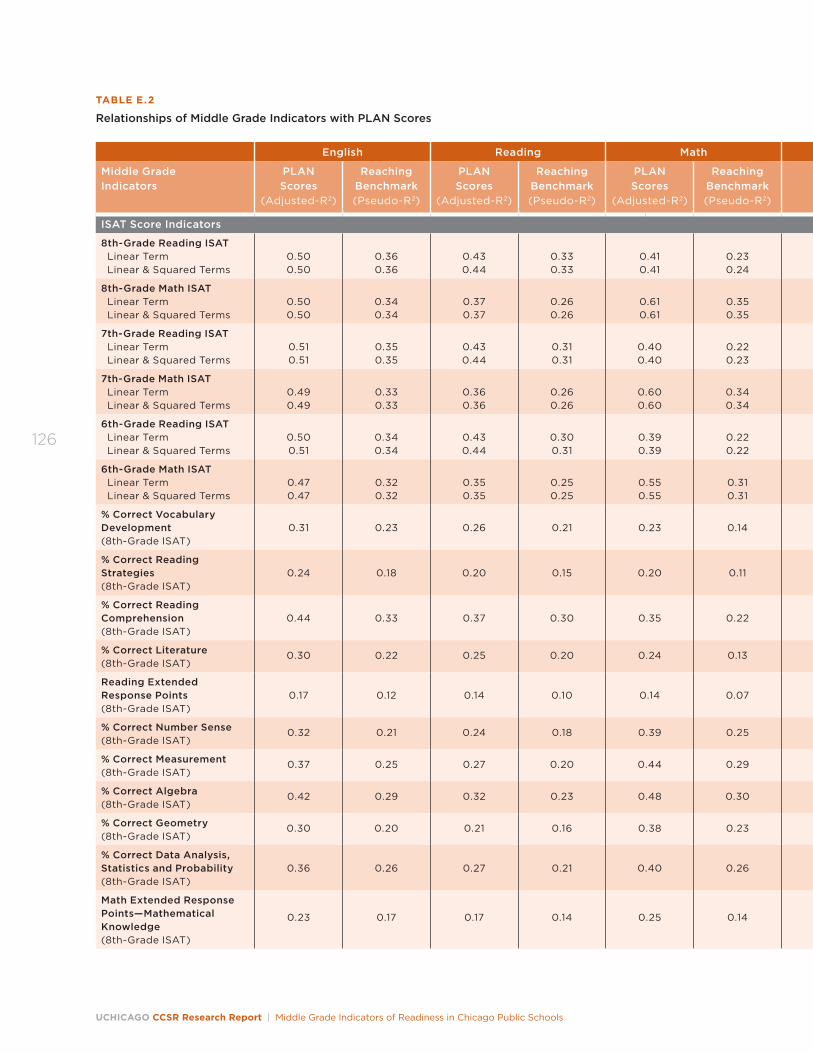
UCHICAGO CCSR Research Report | Middle Grade Indicators of Readiness in Chicago Public Schools
126
TABLE E.2
Relationships of Middle Grade Indicators with PLAN Scores
English Reading Math Science Composite
Middle Grade Indicators
PLAN Scores
(Adjusted-R2)
Reaching Benchmark (Pseudo-R2)
PLAN Scores
(Adjusted-R2)
Reaching Benchmark (Pseudo-R2)
PLAN Scores
(Adjusted-R2)
Reaching Benchmark (Pseudo-R2)
PLAN Scores
(Adjusted-R2)
Reaching Benchmark (Pseudo-R2)
PLAN Scores
(Adjusted-R2)
Reaching Benchmark (Pseudo-R2)
ISAT Score Indicators
8th-Grade Reading ISAT Linear Term Linear & Squared Terms
0.50 0.50
0.36 0.36
0.43 0.44
0.33 0.33
0.41 0.41
0.23 0.24
0.37 0.38
0.15 0.16
0.56 0.58
0.38 0.38
8th-Grade Math ISAT Linear Term Linear & Squared Terms
0.50 0.50
0.34 0.34
0.37 0.37
0.26 0.26
0.61 0.61
0.35 0.35
0.43 0.44
0.18 0.18
0.63 0.63
0.39 0.39
7th-Grade Reading ISAT Linear Term Linear & Squared Terms
0.51 0.51
0.35 0.35
0.43 0.44
0.31 0.31
0.40 0.40
0.22 0.23
0.36 0.38
0.15 0.16
0.56 0.57
0.35 0.35
7th-Grade Math ISAT Linear Term Linear & Squared Terms
0.49 0.49
0.33 0.33
0.36 0.36
0.26 0.26
0.60 0.60
0.34 0.34
0.43 0.44
0.18 0.18
0.62 0.62
0.38 0.38
6th-Grade Reading ISAT Linear Term Linear & Squared Terms
0.50 0.51
0.34 0.34
0.43 0.44
0.30 0.31
0.39 0.39
0.22 0.22
0.35 0.37
0.15 0.16
0.55 0.57
0.35 0.35
6th-Grade Math ISAT Linear Term Linear & Squared Terms
0.47 0.47
0.32 0.32
0.35 0.35
0.25 0.25
0.55 0.55
0.31 0.31
0.39 0.40
0.16 0.17
0.58 0.58
0.36 0.36
% Correct Vocabulary Development (8th-Grade ISAT)
0.31
0.23
0.26
0.21
0.23
0.14
0.19
0.09
0.33
0.22
% Correct Reading Strategies (8th-Grade ISAT)
0.24
0.18
0.20
0.15
0.20
0.11
0.15
0.07
0.26
0.17
% Correct Reading Comprehension(8th-Grade ISAT)
0.44
0.33
0.37
0.30
0.35
0.22
0.29
0.15
0.48
0.35
% Correct Literature(8th-Grade ISAT)
0.30 0.22 0.25 0.20 0.24 0.13 0.19 0.09 0.33 0.21
Reading Extended Response Points(8th-Grade ISAT)
0.17
0.12
0.14
0.10
0.14
0.07
0.11
0.04
0.19
0.11
% Correct Number Sense(8th-Grade ISAT)
0.32 0.21 0.24 0.18 0.39 0.25 0.26 0.014 0.40 0.27
% Correct Measurement(8th-Grade ISAT)
0.37 0.25 0.27 0.20 0.44 0.29 0.31 0.15 0.46 0.31
% Correct Algebra(8th-Grade ISAT)
0.42 0.29 0.32 0.23 0.48 0.30 0.33 0.16 0.52 0.34
% Correct Geometry(8th-Grade ISAT)
0.30 0.20 0.21 0.16 0.38 0.23 0.25 0.12 0.38 0.25
% Correct Data Analysis, Statistics and Probability(8th-Grade ISAT)
0.36
0.26
0.27
0.21
0.40
0.26
0.28
0.13
0.44
0.31
Math Extended Response Points—Mathematical Knowledge(8th-Grade ISAT)
0.23 0.17 0.17 0.14 0.25 0.14 0.17 0.07 0.27 0.17
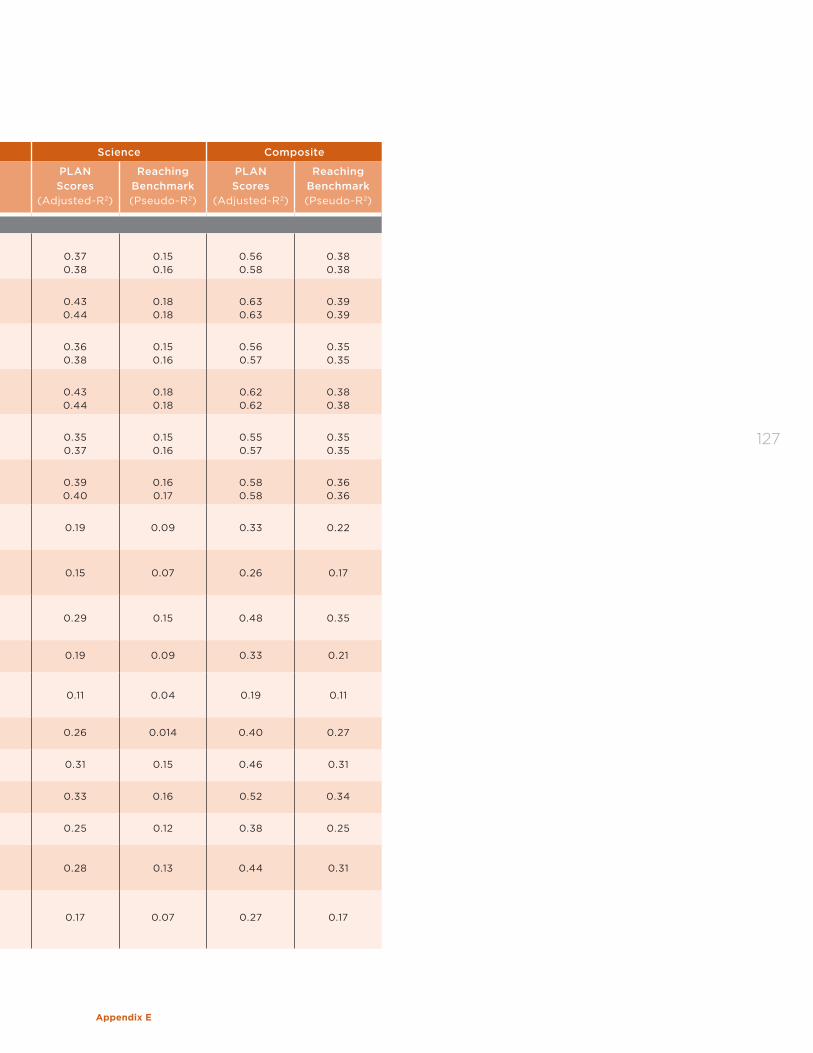
Appendix E
127
TABLE E.2
Relationships of Middle Grade Indicators with PLAN Scores
English Reading Math Science Composite
Middle Grade Indicators
PLAN Scores
(Adjusted-R2)
Reaching Benchmark (Pseudo-R2)
PLAN Scores
(Adjusted-R2)
Reaching Benchmark (Pseudo-R2)
PLAN Scores
(Adjusted-R2)
Reaching Benchmark (Pseudo-R2)
PLAN Scores
(Adjusted-R2)
Reaching Benchmark (Pseudo-R2)
PLAN Scores
(Adjusted-R2)
Reaching Benchmark (Pseudo-R2)
ISAT Score Indicators
8th-Grade Reading ISAT Linear Term Linear & Squared Terms
0.50 0.50
0.36 0.36
0.43 0.44
0.33 0.33
0.41 0.41
0.23 0.24
0.37 0.38
0.15 0.16
0.56 0.58
0.38 0.38
8th-Grade Math ISAT Linear Term Linear & Squared Terms
0.50 0.50
0.34 0.34
0.37 0.37
0.26 0.26
0.61 0.61
0.35 0.35
0.43 0.44
0.18 0.18
0.63 0.63
0.39 0.39
7th-Grade Reading ISAT Linear Term Linear & Squared Terms
0.51 0.51
0.35 0.35
0.43 0.44
0.31 0.31
0.40 0.40
0.22 0.23
0.36 0.38
0.15 0.16
0.56 0.57
0.35 0.35
7th-Grade Math ISAT Linear Term Linear & Squared Terms
0.49 0.49
0.33 0.33
0.36 0.36
0.26 0.26
0.60 0.60
0.34 0.34
0.43 0.44
0.18 0.18
0.62 0.62
0.38 0.38
6th-Grade Reading ISAT Linear Term Linear & Squared Terms
0.50 0.51
0.34 0.34
0.43 0.44
0.30 0.31
0.39 0.39
0.22 0.22
0.35 0.37
0.15 0.16
0.55 0.57
0.35 0.35
6th-Grade Math ISAT Linear Term Linear & Squared Terms
0.47 0.47
0.32 0.32
0.35 0.35
0.25 0.25
0.55 0.55
0.31 0.31
0.39 0.40
0.16 0.17
0.58 0.58
0.36 0.36
% Correct Vocabulary Development (8th-Grade ISAT)
0.31
0.23
0.26
0.21
0.23
0.14
0.19
0.09
0.33
0.22
% Correct Reading Strategies (8th-Grade ISAT)
0.24
0.18
0.20
0.15
0.20
0.11
0.15
0.07
0.26
0.17
% Correct Reading Comprehension(8th-Grade ISAT)
0.44
0.33
0.37
0.30
0.35
0.22
0.29
0.15
0.48
0.35
% Correct Literature(8th-Grade ISAT)
0.30 0.22 0.25 0.20 0.24 0.13 0.19 0.09 0.33 0.21
Reading Extended Response Points(8th-Grade ISAT)
0.17
0.12
0.14
0.10
0.14
0.07
0.11
0.04
0.19
0.11
% Correct Number Sense(8th-Grade ISAT)
0.32 0.21 0.24 0.18 0.39 0.25 0.26 0.014 0.40 0.27
% Correct Measurement(8th-Grade ISAT)
0.37 0.25 0.27 0.20 0.44 0.29 0.31 0.15 0.46 0.31
% Correct Algebra(8th-Grade ISAT)
0.42 0.29 0.32 0.23 0.48 0.30 0.33 0.16 0.52 0.34
% Correct Geometry(8th-Grade ISAT)
0.30 0.20 0.21 0.16 0.38 0.23 0.25 0.12 0.38 0.25
% Correct Data Analysis, Statistics and Probability(8th-Grade ISAT)
0.36
0.26
0.27
0.21
0.40
0.26
0.28
0.13
0.44
0.31
Math Extended Response Points—Mathematical Knowledge(8th-Grade ISAT)
0.23 0.17 0.17 0.14 0.25 0.14 0.17 0.07 0.27 0.17
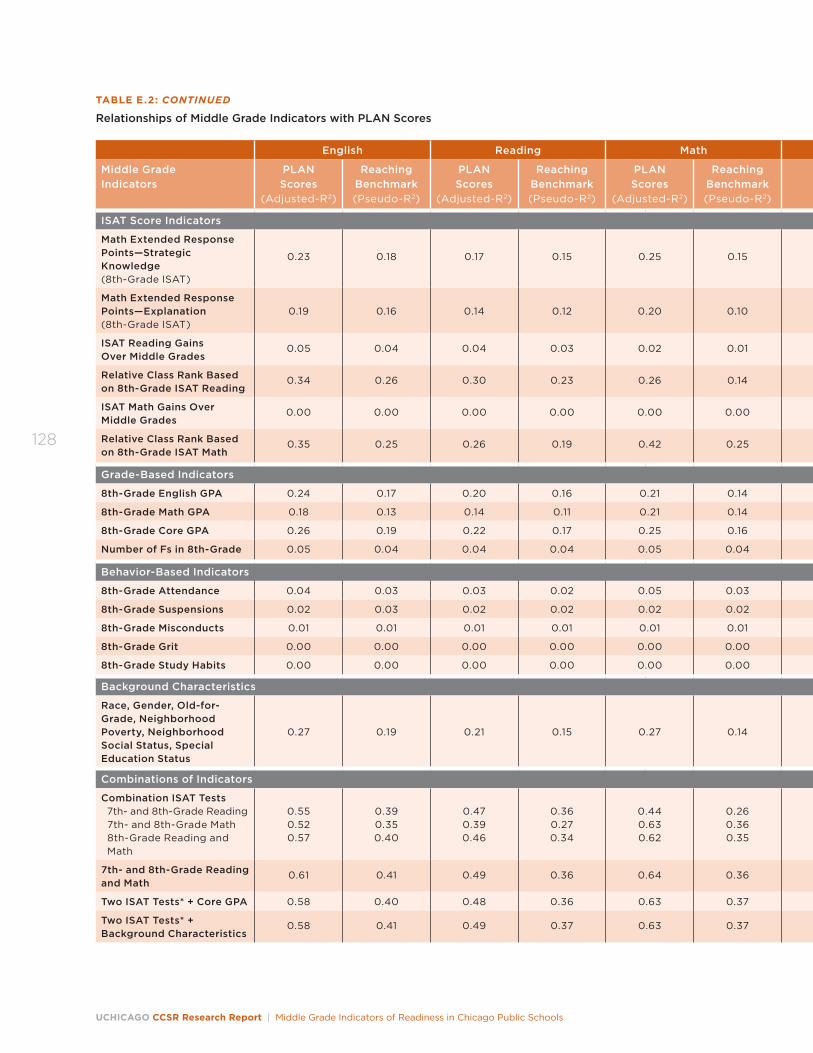
UCHICAGO CCSR Research Report | Middle Grade Indicators of Readiness in Chicago Public Schools
128
English Reading Math Science Composite
Middle Grade Indicators
PLAN Scores
(Adjusted-R2)
Reaching Benchmark (Pseudo-R2)
PLAN Scores
(Adjusted-R2)
Reaching Benchmark (Pseudo-R2)
PLAN Scores
(Adjusted-R2)
Reaching Benchmark (Pseudo-R2)
PLAN Scores
(Adjusted-R2)
Reaching Benchmark (Pseudo-R2)
PLAN Scores
(Adjusted-R2)
Reaching Benchmark (Pseudo-R2)
ISAT Score Indicators
Math Extended Response Points—Strategic Knowledge (8th-Grade ISAT)
0.23 0.18 0.17 0.15 0.25 0.15 0.16 0.07 0.27 0.19
Math Extended Response Points—Explanation(8th-Grade ISAT)
0.19
0.16
0.14
0.12
0.20
0.10
0.13
0.04
0.22
0.13
ISAT Reading Gains Over Middle Grades
0.05 0.04 0.04 0.03 0.02 0.01 0.02 0.00 0.04 0.30
Relative Class Rank Based on 8th-Grade ISAT Reading
0.34 0.26 0.30 0.23 0.26 0.14 0.23 0.09 0.38 0.24
ISAT Math Gains Over Middle Grades
0.00 0.00 0.00 0.00 0.00 0.00 0.00 0.00 0.00 0.00
Relative Class Rank Based on 8th-Grade ISAT Math
0.35 0.25 0.26 0.19 0.42 0.25 0.29 0.12 0.44 0.28
Grade-Based Indicators
8th-Grade English GPA 0.24 0.17 0.20 0.16 0.21 0.14 0.17 0.08 0.27 0.19
8th-Grade Math GPA 0.18 0.13 0.14 0.11 0.21 0.14 0.15 0.06 0.23 0.16
8th-Grade Core GPA 0.26 0.19 0.22 0.17 0.25 0.16 0.20 0.09 0.31 0.22
Number of Fs in 8th-Grade 0.05 0.04 0.04 0.04 0.05 0.04 0.04 0.02 0.06 0.05
Behavior-Based Indicators
8th-Grade Attendance 0.04 0.03 0.03 0.02 0.05 0.03 0.03 0.01 0.05 0.03
8th-Grade Suspensions 0.02 0.03 0.02 0.02 0.02 0.02 0.02 0.01 0.02 0.02
8th-Grade Misconducts 0.01 0.01 0.01 0.01 0.01 0.01 0.01 0.00 0.01 0.01
8th-Grade Grit 0.00 0.00 0.00 0.00 0.00 0.00 0.00 0.00 0.00 0.00
8th-Grade Study Habits 0.00 0.00 0.00 0.00 0.00 0.00 0.00 0.00 0.00 0.00
Background Characteristics
Race, Gender, Old-for-Grade, Neighborhood Poverty, Neighborhood Social Status, Special Education Status
0.27
0.19
0.21
0.15
0.27
0.14
0.22
0.10
0.32
0.18
Combinations of Indicators
Combination ISAT Tests 7th- and 8th-Grade Reading 7th- and 8th-Grade Math 8th-Grade Reading and Math
0.55 0.52 0.57
0.39 0.35 0.40
0.47 0.39 0.46
0.36 0.27 0.34
0.44 0.63 0.62
0.26 0.36 0.35
0.38 0.44 0.46
0.17 0.19 0.19
0.61 0.66 0.69
0.41 0.41 0.44
7th- and 8th-Grade Reading and Math
0.61 0.41 0.49 0.36 0.64 0.36 0.48 0.21 0.72 0.46
Two ISAT Tests* + Core GPA 0.58 0.40 0.48 0.36 0.63 0.37 0.45 0.20 0.69 0.45
Two ISAT Tests* + Background Characteristics
0.58 0.41 0.49 0.37 0.63 0.37 0.46 0.21 0.70 0.44
TABLE E.2: CONTINUED
Relationships of Middle Grade Indicators with PLAN Scores
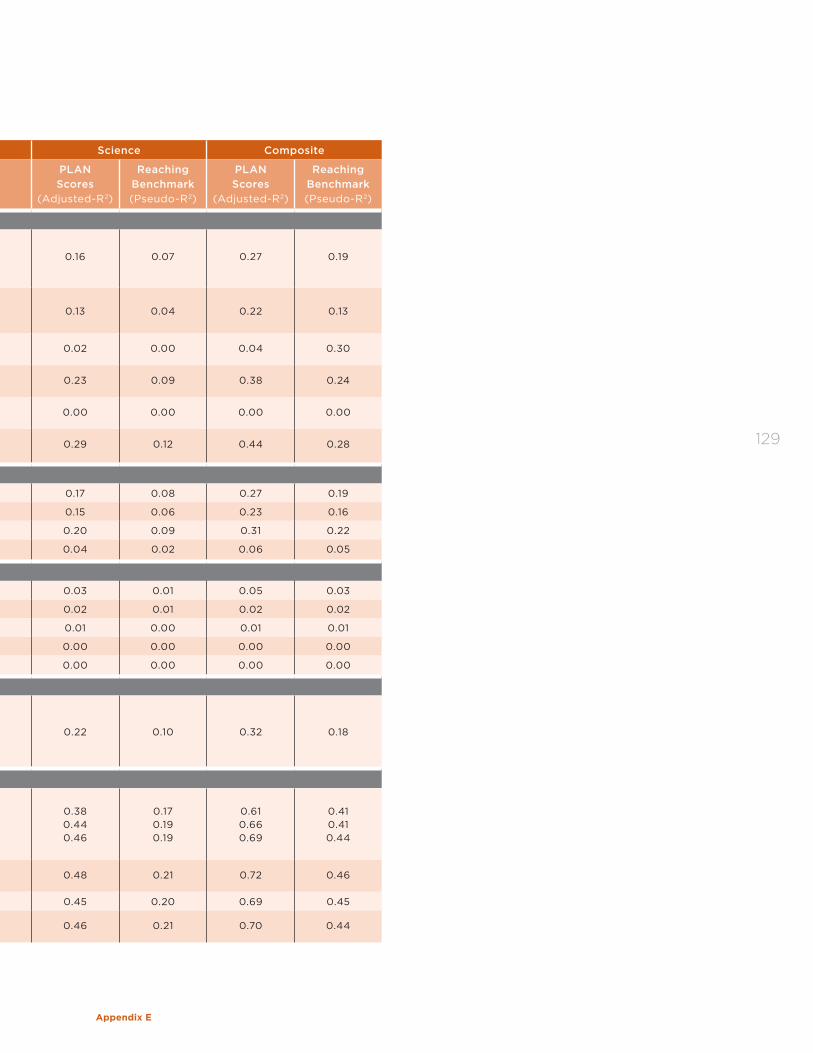
Appendix E
129
English Reading Math Science Composite
Middle Grade Indicators
PLAN Scores
(Adjusted-R2)
Reaching Benchmark (Pseudo-R2)
PLAN Scores
(Adjusted-R2)
Reaching Benchmark (Pseudo-R2)
PLAN Scores
(Adjusted-R2)
Reaching Benchmark (Pseudo-R2)
PLAN Scores
(Adjusted-R2)
Reaching Benchmark (Pseudo-R2)
PLAN Scores
(Adjusted-R2)
Reaching Benchmark (Pseudo-R2)
ISAT Score Indicators
Math Extended Response Points—Strategic Knowledge (8th-Grade ISAT)
0.23 0.18 0.17 0.15 0.25 0.15 0.16 0.07 0.27 0.19
Math Extended Response Points—Explanation(8th-Grade ISAT)
0.19
0.16
0.14
0.12
0.20
0.10
0.13
0.04
0.22
0.13
ISAT Reading Gains Over Middle Grades
0.05 0.04 0.04 0.03 0.02 0.01 0.02 0.00 0.04 0.30
Relative Class Rank Based on 8th-Grade ISAT Reading
0.34 0.26 0.30 0.23 0.26 0.14 0.23 0.09 0.38 0.24
ISAT Math Gains Over Middle Grades
0.00 0.00 0.00 0.00 0.00 0.00 0.00 0.00 0.00 0.00
Relative Class Rank Based on 8th-Grade ISAT Math
0.35 0.25 0.26 0.19 0.42 0.25 0.29 0.12 0.44 0.28
Grade-Based Indicators
8th-Grade English GPA 0.24 0.17 0.20 0.16 0.21 0.14 0.17 0.08 0.27 0.19
8th-Grade Math GPA 0.18 0.13 0.14 0.11 0.21 0.14 0.15 0.06 0.23 0.16
8th-Grade Core GPA 0.26 0.19 0.22 0.17 0.25 0.16 0.20 0.09 0.31 0.22
Number of Fs in 8th-Grade 0.05 0.04 0.04 0.04 0.05 0.04 0.04 0.02 0.06 0.05
Behavior-Based Indicators
8th-Grade Attendance 0.04 0.03 0.03 0.02 0.05 0.03 0.03 0.01 0.05 0.03
8th-Grade Suspensions 0.02 0.03 0.02 0.02 0.02 0.02 0.02 0.01 0.02 0.02
8th-Grade Misconducts 0.01 0.01 0.01 0.01 0.01 0.01 0.01 0.00 0.01 0.01
8th-Grade Grit 0.00 0.00 0.00 0.00 0.00 0.00 0.00 0.00 0.00 0.00
8th-Grade Study Habits 0.00 0.00 0.00 0.00 0.00 0.00 0.00 0.00 0.00 0.00
Background Characteristics
Race, Gender, Old-for-Grade, Neighborhood Poverty, Neighborhood Social Status, Special Education Status
0.27
0.19
0.21
0.15
0.27
0.14
0.22
0.10
0.32
0.18
Combinations of Indicators
Combination ISAT Tests 7th- and 8th-Grade Reading 7th- and 8th-Grade Math 8th-Grade Reading and Math
0.55 0.52 0.57
0.39 0.35 0.40
0.47 0.39 0.46
0.36 0.27 0.34
0.44 0.63 0.62
0.26 0.36 0.35
0.38 0.44 0.46
0.17 0.19 0.19
0.61 0.66 0.69
0.41 0.41 0.44
7th- and 8th-Grade Reading and Math
0.61 0.41 0.49 0.36 0.64 0.36 0.48 0.21 0.72 0.46
Two ISAT Tests* + Core GPA 0.58 0.40 0.48 0.36 0.63 0.37 0.45 0.20 0.69 0.45
Two ISAT Tests* + Background Characteristics
0.58 0.41 0.49 0.37 0.63 0.37 0.46 0.21 0.70 0.44

UCHICAGO CCSR Research Report | Middle Grade Indicators of Readiness in Chicago Public Schools
130
English Reading Math Science Composite
Middle Grade Indicators
PLAN Scores
(Adjusted-R2)
Reaching Benchmark (Pseudo-R2)
PLAN Scores
(Adjusted-R2)
Reaching Benchmark (Pseudo-R2)
PLAN Scores
(Adjusted-R2)
Reaching Benchmark (Pseudo-R2)
PLAN Scores
(Adjusted-R2)
Reaching Benchmark (Pseudo-R2)
PLAN Scores
(Adjusted-R2)
Reaching Benchmark (Pseudo-R2)
Combinations of Indicators
All (Two ISAT Tests* + Background Characteristics + Core GPA + Attendance + Suspensions + Number of Fs + Misconducts + Relative Class Rank)
0.59
0.41
0.50
0.37
0.64
0.37
0.47
0.21
0.71
0.45
School Effects
School Effects (Fixed Effects of Middle and High Schools)
0.40
†
0.33
†
0.41
†
0.39
†
0.50
†
All + School Effects (Fixed Effects)
0.63 † 0.52 † 0.67 † 0.53 † 0.75 †
TABLE E.2: CONTINUED
Relationships of Middle Grade Indicators with PLAN Scores
Note: Sample size was kept the same for most analyses to make comparisons easier, except when data from surveys were analyzed. In those cases the sample sizes get smaller. That is the case when grit and study habits are part of the analysis.
* For English and science PLAN test, as well as composite scores, the two tests are eighth-grade reading and math ISAT tests. For Reading PLAN test the two tests are eighth- and seventh-grade reading ISAT tests. For math PLAN test the two tests are eighth- and seventh-grade math ISAT tests.
** Given the data for this cohort and analyses, a model with no explanatory variables would be able to predict correctly 51.7 percent of students in English by assigning all of them to not reaching the benchmark, 69.6 percent in reading, 83.8 percent in math, 93.5 percent in science benchmarks, and 77.2 percent for the composite score of 18 and above.
†Given the low variability in whether or not students reach benchmarks by middle and high school, these models could not be run.
As was the case with PLAN composite, it is easier
to correctly predict which students are at risk of not
reaching benchmarks than which students will reach
the benchmarks, because so few students are success-
ful. But there are big differences among the subject-
specific tests. In English the proportion of student
correctly classified at risk is 80 percent, the lowest;
in reading it goes up to 91 percent, while in math and
science it is above 96 percent. Figure E.1 shows the pro-
portion of students correctly classified as not reaching
benchmarks in the Y-axis and the proportion of stu-
dents incorrectly classified as not reaching benchmarks
in the X-axis for models with different explanatory
variables for the four PLAN subject-specific tests.
In general, most subjects can have a large propor-
tion of students misclassified as at risk of not reach-
ing benchmarks when they actually do. This number
is especially high for science, 64 percent of students
who do reach the benchmark are identified as at risk of
not doing so using middle grade reading and math test
scores. Even though the proportion is large, there are
only 6.5 percent of students in our sample who reach the
science benchmarks. In reading and math the propor-
tion of students identified as at risk when they actually
reach the benchmark is 40 percent, and in English it is
23 percent.
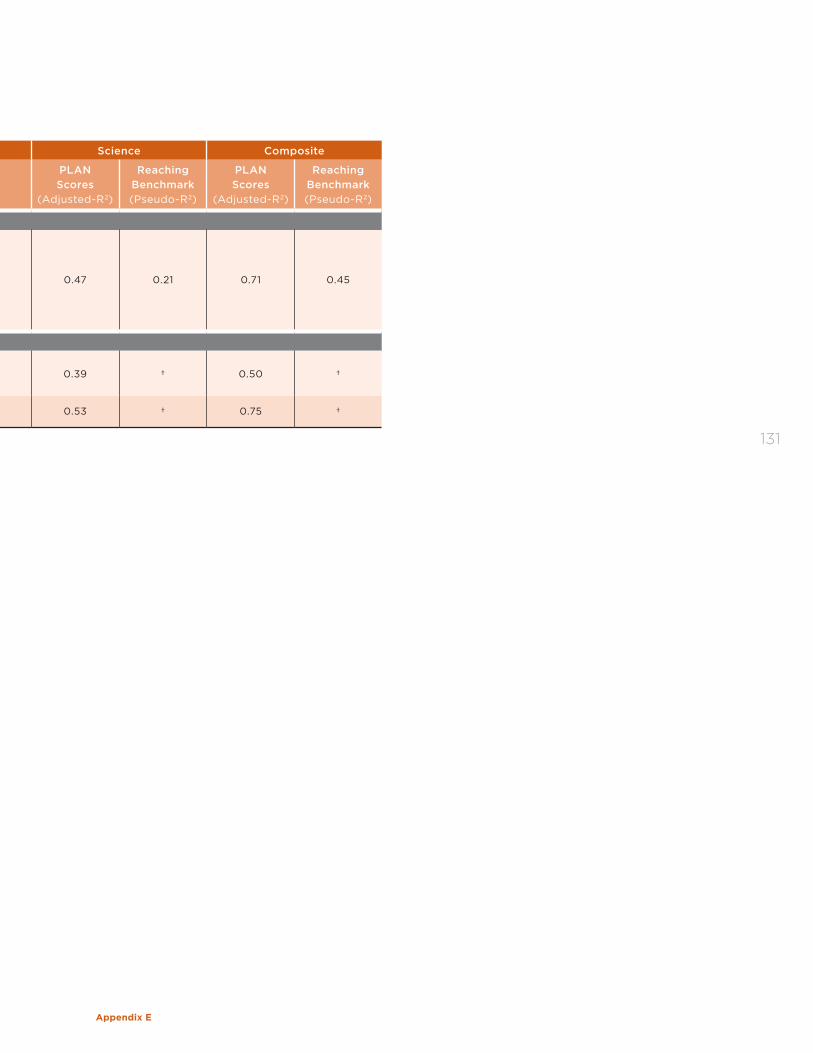
Appendix E
131
English Reading Math Science Composite
Middle Grade Indicators
PLAN Scores
(Adjusted-R2)
Reaching Benchmark (Pseudo-R2)
PLAN Scores
(Adjusted-R2)
Reaching Benchmark (Pseudo-R2)
PLAN Scores
(Adjusted-R2)
Reaching Benchmark (Pseudo-R2)
PLAN Scores
(Adjusted-R2)
Reaching Benchmark (Pseudo-R2)
PLAN Scores
(Adjusted-R2)
Reaching Benchmark (Pseudo-R2)
Combinations of Indicators
All (Two ISAT Tests* + Background Characteristics + Core GPA + Attendance + Suspensions + Number of Fs + Misconducts + Relative Class Rank)
0.59
0.41
0.50
0.37
0.64
0.37
0.47
0.21
0.71
0.45
School Effects
School Effects (Fixed Effects of Middle and High Schools)
0.40
†
0.33
†
0.41
†
0.39
†
0.50
†
All + School Effects (Fixed Effects)
0.63 † 0.52 † 0.67 † 0.53 † 0.75 †
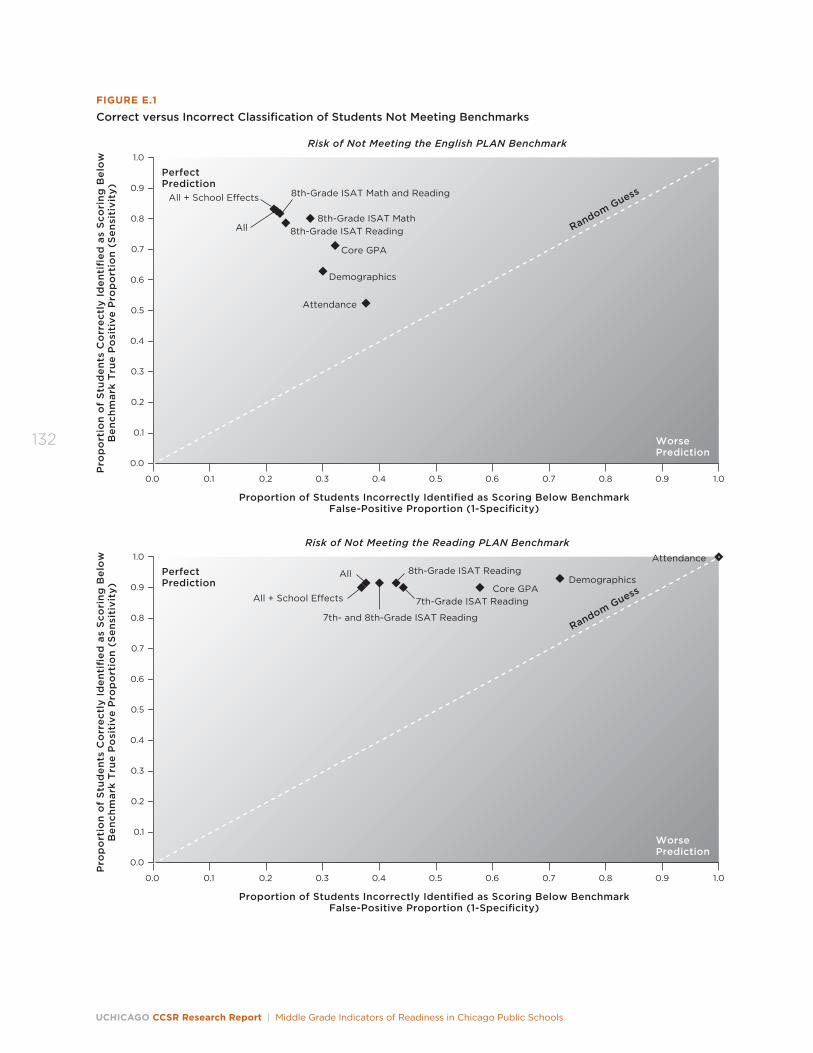
UCHICAGO CCSR Research Report | Middle Grade Indicators of Readiness in Chicago Public Schools
132
Proportion of Students Incorrectly Identified as Scoring Below Benchmark False-Positive Proportion (1-Specificity)
FIGURE E.1
Correct versus Incorrect Classification of Students Not Meeting BenchmarksP
rop
ort
ion
of
Stu
den
ts C
orr
ectl
y Id
enti
fied
as
Sco
rin
g B
elo
wB
ench
mar
k T
rue
Po
siti
ve P
rop
ort
ion
(S
ensi
tivi
ty)
Perfect Prediction
WorsePrediction
Random Guess
Core GPA
Demographics
All + School Eects
All
Attendance
8th-Grade ISAT Math and Reading
8th-Grade ISAT Math8th-Grade ISAT Reading
Risk of Not Meeting the English PLAN Benchmark
0.9
1.0
0.8
0.7
0.4
0.2
0.0
0.6
0.3
0.1
0.5
0.9 1.00.80.70.40.20.0 0.60.30.1 0.5
Proportion of Students Incorrectly Identified as Scoring Below Benchmark False-Positive Proportion (1-Specificity)
Pro
po
rtio
n o
f S
tud
ents
Co
rrec
tly
Iden
tifi
ed a
s S
cori
ng
Bel
ow
Ben
chm
ark
Tru
e P
osi
tive
Pro
po
rtio
n (
Sen
siti
vity
)
Perfect Prediction
WorsePrediction
Random GuessCore GPADemographics
All + School Eects
All
Attendance8th-Grade ISAT Reading
7th-Grade ISAT Reading
7th- and 8th-Grade ISAT Reading
Risk of Not Meeting the Reading PLAN Benchmark
0.9
1.0
0.8
0.7
0.4
0.2
0.0
0.6
0.3
0.1
0.5
0.9 1.00.80.70.40.20.0 0.60.30.1 0.5
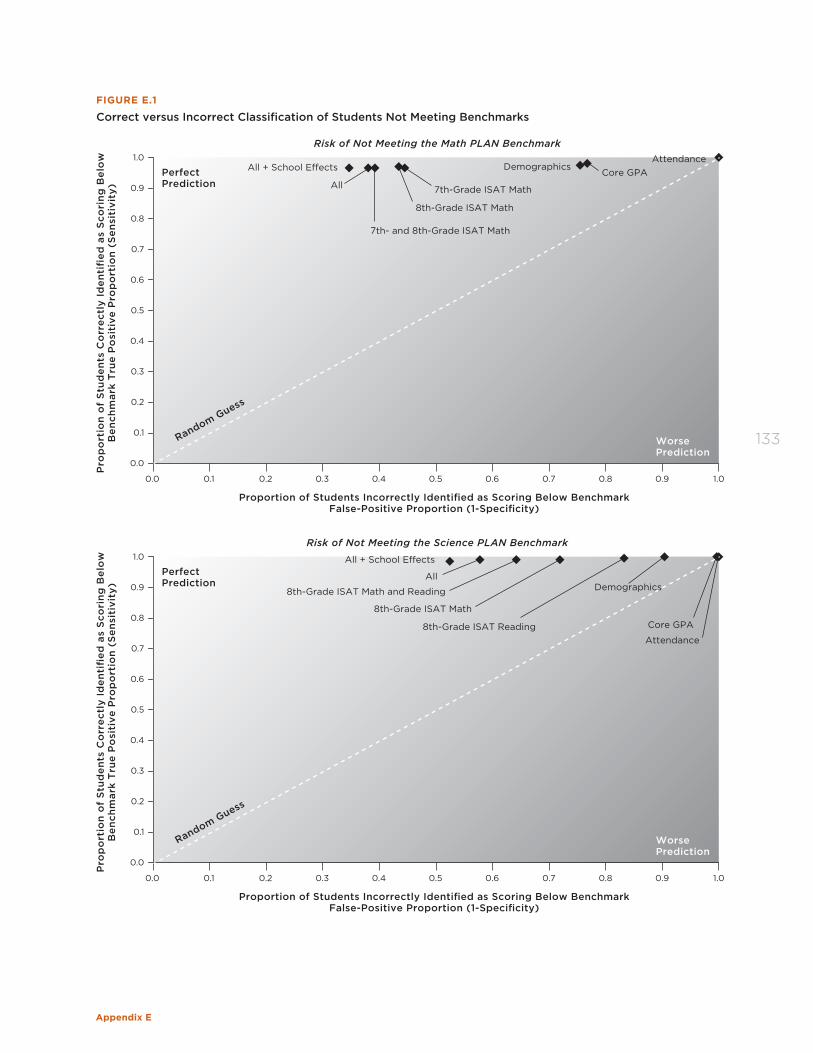
Appendix E
133
Proportion of Students Incorrectly Identified as Scoring Below Benchmark False-Positive Proportion (1-Specificity)
FIGURE E.1
Correct versus Incorrect Classification of Students Not Meeting BenchmarksP
rop
ort
ion
of
Stu
den
ts C
orr
ectl
y Id
enti
fied
as
Sco
rin
g B
elo
wB
ench
mar
k T
rue
Po
siti
ve P
rop
ort
ion
(S
ensi
tivi
ty)
Perfect Prediction
WorsePrediction
Random Guess
Core GPADemographicsAll + School Eects
All
Attendance
7th-Grade ISAT Math
8th-Grade ISAT Math
Risk of Not Meeting the Math PLAN Benchmark
0.9
1.0
0.8
0.7
0.4
0.2
0.0
0.6
0.3
0.1
0.5
0.9 1.00.80.70.40.20.0 0.60.30.1 0.5
Proportion of Students Incorrectly Identified as Scoring Below Benchmark False-Positive Proportion (1-Specificity)
Pro
po
rtio
n o
f S
tud
ents
Co
rrec
tly
Iden
tifi
ed a
s S
cori
ng
Bel
ow
Ben
chm
ark
Tru
e P
osi
tive
Pro
po
rtio
n (
Sen
siti
vity
)
Perfect Prediction
WorsePrediction
Random Guess
Core GPA
Demographics
All + School Eects
All
Attendance
8th-Grade ISAT Math and Reading
8th-Grade ISAT Math
8th-Grade ISAT Reading
7th- and 8th-Grade ISAT Math
Risk of Not Meeting the Science PLAN Benchmark
0.9
1.0
0.8
0.7
0.4
0.2
0.0
0.6
0.3
0.1
0.5
0.9 1.00.80.70.40.20.0 0.60.30.1 0.5
134134
ELAINE M. ALLENSWORTH is the Lewis-Sebring Director at UChicago CCSR where she has conducted research on educational policy for the last 15 years. She is best known for her studies of high school graduation and college readiness, and also conducts research in the areas of school leadership and school organization. Her work on early indicators of high school graduation has been adopted for tracking systems used in Chicago and other districts across the country. She is one of the authors of the book Organizing Schools for Improvement: Lessons from Chicago, which provides a de-tailed analysis of school practices and community conditions that promote school improvement. Dr. Allensworth holds a PhD in Sociology and an MA in Urban Studies from Michigan State University. She was once a high school Spanish and science teacher.
JULIA A. GWYNNE is a Senior Research Analyst at UChicago CCSR. Her current work focuses on early warning indicators of high school and college readiness and the use of indica-tors with groups such as English Language Learners and students with disabilities. In addition, she has conducted research on student mobility, school closings, and class-room instructional environments. She received her doctoral degree in sociology from the University of Chicago.
PAUL MOORE is a Research Analyst at UChicago CCSR and is in the process of completing an MA in the social sciences at the University of Chicago. His research interests include quantitative modeling and methodology. Moore is study-ing the effects of attending higher performing schools on students’ academic performance and noncognitive skills. He earned a BS in mathematics and education science from Vanderbilt University.
MARISA DE LA TORRE is the Director for Internal Research Capacity at the Consortium on Chicago School Research. She is very familiar with Chicago Public Schools’ policies and part of her work involves studying them. She was the author of two studies on the effects of policies aimed at the lowest-performing schools in the district. One, Turning Around Low-Performing Schools in Chicago, investigates the effects of these policies on whether schools see improve-ments after the reform. The other report deals with the effect of school closings on students’ academic outcomes, When Schools Close: Effects on Displaced Students in Chicago Public Schools, which has been widely cited in the press. This work prompted Chicago Public Schools to create a Student Bill of Rights for students affected by school closings. She is also familiar with the high school choice process in Chicago Public Schools and one of her studies was published in School Choice and School Improvement, a book edited by Mark Berends, Marisa Cannata, and Ellen B. Goldring. She is currently studying the impact that attending higher-performing high schools have on students’ academic and non-academic outcomes. Before joining UChicago CCSR, she worked for the Chicago Public Schools in the Office of Research, Evaluation, and Accountability. She received a master’s degree in economics from Northwestern University.
This report reflects the interpretation of the authors. Although UChicago CCSR’s Steering Committee provided technical advice, no formal endorsement by these individuals, organizations, or the full Consortium should be assumed.
134
ABOUT THE AUTHORS

CONSORTIUM ON CHICAGO SCHOOL RESEARCH
KATHLEEN ST. LOUIS CALIENTOCo-Chair Spark, Chicago
KIM ZALENTCo-Chair Business and Professional People for the Public Interest
Ex-Officio Members
TIMOTHY KNOWLESUrban Education Institute
Institutional Members
JOHN R. BARKERChicago Public Schools
CLARICE BERRYChicago Principals and Administrators Association
AARTI DHUPELIAChicago Public Schools
CHRISTOPHER KOCHIllinois State Board of Education
KAREN G.J. LEWISChicago Teachers Union
SHERRY J. ULERYChicago Public Schools
Individual Members
VERONICA ANDERSON Communications Consultant
JOANNA BROWNLogan Square Neighborhood Association
CATHERINE DEUTSCHIllinois Network of Charter Schools
RAQUEL FARMER-HINTONUniversity of Wisconsin, Milwaukee
KIRABO JACKSONNorthwestern University
CHRIS JONESStephen T. Mather High School
DENNIS LACEWELLUrban Prep Charter Academy for Young Men
LILA LEFFUmoja Student Development Corporation
RUANDA GARTH MCCULLOUGHLoyola University, Chicago
LUISIANA MELÉNDEZErikson Institute
CRISTINA PACIONE-ZAYASLatino Policy Forum
PAIGE PONDEROne Million Degrees
LUIS R. SORIAChicago Public Schools
BRIAN SPITTLEDePaul University
MATTHEW STAGNERMathematica Policy Research
AMY TREADWELLChicago New Teacher Center
ERIN UNANDERAl Raby High School
ARIE J. VAN DER PLOEG American Institutes for Research (Retired)
DirectorsELAINE M. ALLENSWORTHLewis-Sebring Director
EMILY KRONEDirector for Outreach and Communication
JENNY NAGAOKADeputy Director
MELISSA RODERICKSenior DirectorHermon Dunlap Smith ProfessorSchool of Social Service Administration
PENNY BENDER SEBRINGFounding Director
SUE SPORTEDirector for Research Operations
MARISA DE LA TORREDirector for Internal Research Capacity
Steering Committee

OUR MISSION The University of Chicago Consortium on Chicago School Research (UChicago CCSR) conducts research of high technical quality that can inform and assess policy and practice in the Chicago Public Schools. We seek to expand communication among researchers, policymakers, and practitioners as we support the search for solutions to the problems of school reform. UChicago CCSR encourages the use of research in policy action and improvement of practice, but does not argue for particular policies or programs. Rather, we help to build capacity for school reform by identifying what matters for student success and school improvement, creating critical indicators to chart progress, and conducting theory-driven evaluation to identify how programs and policies are working.
1313 East 60th Street
Chicago, Illinois 60637
T 773-702-3364
F 773-702-2010
ccsr.uchicago.edu