middle east economy watch - pwc: audit and assurance ... · middle east economy watch ... is...
TRANSCRIPT

Middle East Economy WatchAmbitious reforms across the region will continueto define 2018 prospects
February 2018
Source: World Bank Doing Business 2018, World Economic Forum Global Competitiveness Index 2017-18.Notes: Due to occasional changes in methodology and data, the World Bank no longer compares rankings between years, as we do here.
Business Environment Rankings 2017 Doing Business(out of 190)
UAE
Qatar
Bahrain
Saudi
Oman
Kuwait
Jordan
Pal. Terr.
Egypt
Lebanon
Iraq
Libya
GCC
Regional
21
83
66
92
71
96
103
114
128
133
168
185
105
71.5
17
25
44
30
62
52
65
-
100
105
-
-
55
38
Non-GCC 138.5 90
GlobalCompetitiveness(out of 137)
Averages
In this edition of Middle East Economy Watch we havestepped back to assess whether the region’s majoreconomies performed to expectations last year and tolook forward at the outlook for 2018.
OPEC-led oil production cuts are a dominant theme inboth years, however there is plenty else going on. Fiscalreforms are progressing, including the introduction ofVAT in various Gulf states. However, there are also newefforts in some countries, notably Saudi Arabia, to easeback on fiscal consolidation to stimulate the privatesector.
This is also a good time to take stock of the businessenvironment in the region. (See below)According to leading benchmarks, countries in theregion range from among the best in the world (UAE)to nearly the worst (Libya). There is also substantialflux as some countries implement ambitious reformprogrammes to attract investment (Saudi Arabia) whileothers languish.
While such assessments are useful, the rankings still onlytell a part of the story, and our discussions with clientsoften reveal opportunities and challenges in the regionthat can be obscured by only looking at the big picture.
Finally, our special feature takes a quick look into thecomplex issue of productivity, an area where we areplanning to do more detailed research in 2018. Nobelprize winning economist Paul Krugman has said thatproductivity determines “almost everything” about aneconomy in the long run. Many countries in the regionare beginning to wake up to the challenges they face inboosting productivity, which lags behind global peersand has been falling in more Middle Eastern countriesthan it has been improving in.
We wish you all a very productive 2018 and lookforward to continuing discussing Middle Easterneconomic issues with many of you through out the year.
25 - 501 - 25
50 - 7575 - 100100 - 125125 - 175175 - 200D
oin
g B
usi
nes
s

Economic update: 2017 review
Forecast in Apr-17 Forecast in Oct-17
Q1-2017 Q2-2017 Q3-2017
1.0
0.6
Real growth(GCC)
1.3
2.3
Real growth(Egypt &
Mashreq-4)
1.0
3.4
Inflation(GCC)
Qatar
2.5
0.6
1.9
Saudi Arabia
-0.5
-1.0
-0.4Pal. Terr.
1.1 1
5
Jordan
2.22
1.9
Egypt
4.94.3
Bahrain
3.83.5 3.6
A mixed year
In order to take stock of how the Middle East performed in 2017,at a time when only partial outturn data is available, it is helpfulto look at how benchmark forecasts, such as the IMF’s biannualWorld Economic Outlook, evolved during the year.
In some areas, the IMF latest forecasts, published in October,closely match the way things looked in April. However, therewere a couple of unexpected developments both regionally andfor individual economies.
Evolution of IMF forecasts for 2017
One area which seems to have panned out as expected is thelarge fiscal deficits, which remained broadly unchanged in theIMF’s two sets of forecasts. They average about 7% of GDP acrossthe 12 countries we cover, and partial outturn data, in the fewcountries where it is available, largely fits with this. SaudiArabia’s preliminary outturn shows a deficit of 8.9% of GDP,suggesting that there was sizable spending in the final quarter, asdata for the first three quarters had indicated a much lowerdeficit. For oil exporters, slightly higher oil prices in the secondhalf of the year broadly offset the fiscal impact of an extension inoutput cuts.
Non-Oil growth beats expectations
The extension of cuts naturally dragged down GDP for oilproducers, with the IMF’s latest forecasts seeing just 0.6% annualgrowth for the GCC, although stronger non-oil sectorperformance in some countries partly offset this impact; Oneindicator of this is that purchasing manager indices (PMIs) in theUAE and Saudi Arabia were at, or close to, two-year highs inNovember.
Meanwhile, some non-GCC countries are beating growthexpectations. Egypt’s economy is beating expectations, includinga very strong 4.9% y/y growth in Q2. These results contributedto an increase in the aggregate forecast to 2.3% from 1.3%growth for the group including Egypt and our 4 Mashreqcountries (for clarity, we’ve excluded Libya, where the dramaticrecovery in oil production should have increased its GDP by overa 50% in 2017).
Inflation muted in Gulf
In the Gulf countries, the most notable surprise is that inflationhas been much weaker than had been expected. The IMF cut itsforecast from 3.4% to 1.0% and the GGC’s actual inflation inOctober was just 0.7% y/y. Cuts in subsidies made in 2016 seemto have only had a one-off impact and deflation in some countriesin certain key price categories, such as rents, has more than offsetthe impact of more expensive fuel in countries like UAE where itis now benchmarked to crude prices. Outside the Gulf, inflationwas higher, particularly in Egypt where it reached 31% y/y inOctober.
Bahrain leads the GCC
Bahrain delivered a consistently strong performance through thefirst three quarters of 2017, leading the GCC, among thecountries that report on a quarterly basis, with 3.6% y/y growthin Jan-Sep, driven by the key sectors: finance and hospitality.
Saudi Arabia, however, has entered a recession in 2017, withthree quarters of contraction, averaging -0.7%, as the non-oilsector remained hamstrung by austerity. Qatar’s growthrebounded in Q3, after slowing at the start of the political crisis,because of strong gas output (given little maintenancedowntime) but also strong non-oil performance, despite somesigns of disruption in sectors such as accommodation and transportation.
The Palestinian Territories posted an unusually strong Q3, up5%, driven by a 19% jump in the domestic trade sector.
Quarterly real GDP (% change y/y)
Source: National statistics agencies
Source: IMF WEO, PwC analysis
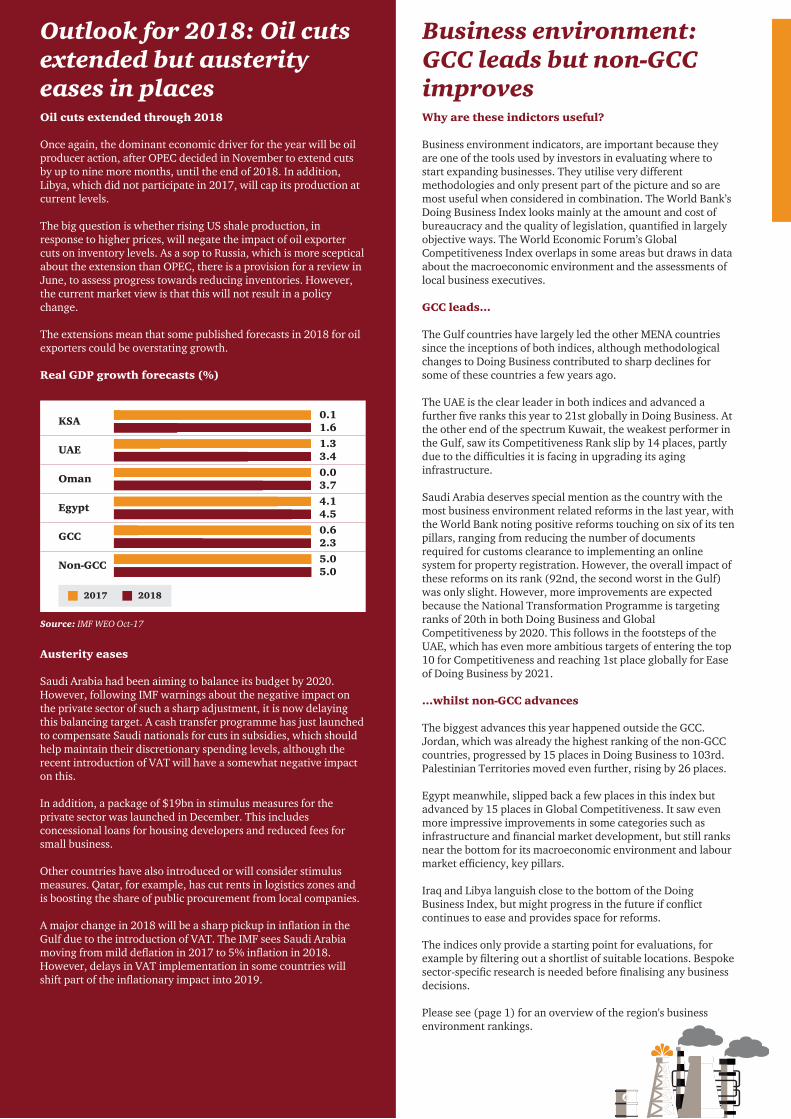
Source: IMF WEO Oct-17
KSA
UAE
Oman
Egypt
GCC
Non-GCC
0.11.6
1.33.4
0.03.7
4.14.5
0.62.3
5.05.0
2017 2018
Oil cuts extended through 2018
Once again, the dominant economic driver for the year will be oilproducer action, after OPEC decided in November to extend cutsby up to nine more months, until the end of 2018. In addition,Libya, which did not participate in 2017, will cap its production at current levels.
The big question is whether rising US shale production, inresponse to higher prices, will negate the impact of oil exportercuts on inventory levels. As a sop to Russia, which is more sceptical about the extension than OPEC, there is a provision for a review in June, to assess progress towards reducing inventories. However,the current market view is that this will not result in a policychange.
The extensions mean that some published forecasts in 2018 for oilexporters could be overstating growth.
Real GDP growth forecasts (%)
Austerity eases
Saudi Arabia had been aiming to balance its budget by 2020.However, following IMF warnings about the negative impact onthe private sector of such a sharp adjustment, it is now delayingthis balancing target. A cash transfer programme has just launchedto compensate Saudi nationals for cuts in subsidies, which shouldhelp maintain their discretionary spending levels, although therecent introduction of VAT will have a somewhat negative impacton this.
In addition, a package of $19bn in stimulus measures for theprivate sector was launched in December. This includesconcessional loans for housing developers and reduced fees forsmall business.
Other countries have also introduced or will consider stimulusmeasures. Qatar, for example, has cut rents in logistics zones andis boosting the share of public procurement from local companies.
A major change in 2018 will be a sharp pickup in inflation in theGulf due to the introduction of VAT. The IMF sees Saudi Arabiamoving from mild deflation in 2017 to 5% inflation in 2018.However, delays in VAT implementation in some countries willshift part of the inflationary impact into 2019.
Outlook for 2018: Oil cutsextended but austerityeases in places
Business environment:GCC leads but non-GCCimprovesWhy are these indictors useful?
Business environment indicators, are important because theyare one of the tools used by investors in evaluating where tostart expanding businesses. They utilise very differentmethodologies and only present part of the picture and so aremost useful when considered in combination. The World Bank’sDoing Business Index looks mainly at the amount and cost ofbureaucracy and the quality of legislation, quantified in largelyobjective ways. The World Economic Forum’s GlobalCompetitiveness Index overlaps in some areas but draws in dataabout the macroeconomic environment and the assessments oflocal business executives.
GCC leads...
The Gulf countries have largely led the other MENA countriessince the inceptions of both indices, although methodologicalchanges to Doing Business contributed to sharp declines forsome of these countries a few years ago.
The UAE is the clear leader in both indices and advanced afurther five ranks this year to 21st globally in Doing Business. Atthe other end of the spectrum Kuwait, the weakest performer inthe Gulf, saw its Competitiveness Rank slip by 14 places, partlydue to the difficulties it is facing in upgrading its aginginfrastructure.
Saudi Arabia deserves special mention as the country with themost business environment related reforms in the last year, withthe World Bank noting positive reforms touching on six of its tenpillars, ranging from reducing the number of documentsrequired for customs clearance to implementing an onlinesystem for property registration. However, the overall impact ofthese reforms on its rank (92nd, the second worst in the Gulf)was only slight. However, more improvements are expectedbecause the National Transformation Programme is targetingranks of 20th in both Doing Business and GlobalCompetitiveness by 2020. This follows in the footsteps of theUAE, which has even more ambitious targets of entering the top10 for Competitiveness and reaching 1st place globally for Easeof Doing Business by 2021.
...whilst non-GCC advances
The biggest advances this year happened outside the GCC.Jordan, which was already the highest ranking of the non-GCCcountries, progressed by 15 places in Doing Business to 103rd.Palestinian Territories moved even further, rising by 26 places.
Egypt meanwhile, slipped back a few places in this index butadvanced by 15 places in Global Competitiveness. It saw evenmore impressive improvements in some categories such asinfrastructure and financial market development, but still ranksnear the bottom for its macroeconomic environment and labourmarket efficiency, key pillars.
Iraq and Libya languish close to the bottom of the DoingBusiness Index, but might progress in the future if conflictcontinues to ease and provides space for reforms.
The indices only provide a starting point for evaluations, forexample by filtering out a shortlist of suitable locations. Bespokesector-specific research is needed before finalising any businessdecisions.
Please see (page 1) for an overview of the region's businessenvironment rankings.

We partner with our region’s Governments and businesses, to help solve the region’s most important problems and build trust in our society.We are investing in, and developing both the very best talent, over 4,000 people, an unparalleled range of expert capabilities from Strategy, through Advisoryand Consulting to Tax and Assurance Services, underpinned by the standout digital platform in the region.
This publication has been prepared for general guidance on matters of interest only, and does not constitute professional advice. You should not act upon the information contained in this publication without obtaining specific professional advice. No representation or warranty (express or implied) is given as to the accuracy or completeness of the information contained in this publication, and, to the extent permitted by law, PricewaterhouseCoopers LLP, its members, employees and agents do not accept or assume any liability, responsibility or duty of care for any consequences of you or anyone else acting, or refraining to act, in reliance on the information contained in this publication or for any decision based on it.
© 2018 PwC. All rights reserved. PwC refers to the PwC network and/or one or more of its member firms, each of which is a separate legal entity.Please see www.pwc.com/structure for further details.
Sources: PwC analysis, National statistical authorities, IMF (Regional Economic Outlook, October 2017), IMF World Economic Outlook Update January 2018. *Latest inflation is Nov (Libya=Sep, Iraq=Oct) and 2017 is IMF estimate, ^ Official preliminary estimate for Saudi Arabia.Notes: The Middle East region is defined here based on PwC’s business coverage. It excludes two conflict affected countries (Syria and Yemen), typically defined as being part of the Middle East, and also non-Arab countries.
GDP share (2017) Real GDP growth (% y/y) Inflation (% y/y) Fiscal bal. (% GDP)
PPP MER Q3-17 2018p Dec-17 2017e 2018p
100% 1.7 3.3 4.9 6.4 7.2 - 5.5
67.5% 0.2 2.5 0.8 0.8 4.1 - 4.6
31.7% - 0.7 1.6 0.1* - 0.2* 5.0 - 7.2
17.7% 1.3 3.4 1.7* 2.1* 2.9 - 2.2
7.8% 2.5 3.1 0.6 0.4 4.8 0.5
5.5% - 2.1 4.1 1.1 1.9 2.7 1.5
3.4% 0.0 3.7 1.7 1.6 3.2 - 11.4
1.6% 2.5 1.7 1.4 1.4 3.5 - 11.9
32.5% 5.0 5.0 13.4 18.1 13.5 - 7.2
16.9% 4.1 4.5 21.9 29.6 21.3 - 7.3
9.0% - 0.4 2.9 0.7* 2.0* 2.0 - 4.7
1.9% 2.3 2.5 3.2 3.3 1.5 - 0.4
2.5% 1.5 2.0 5.0 4.5 2.5 - 10.3
1.6% 55.1 31.2 25.7* 32.8* 32.1 - 23.3
0.6% 3.1 3.0 0.0 0.2 1.6 - 7.8
Middle East
GCC
Saudi
UAE
Qatar
Kuwait
Oman
Bahrain
Non-GCC
Egypt
Iraq
Jordan
Lebanon
Libya
Palestinian territories
100%
61.4%
32.5%
12.6%
6.2%
5.5%
3.4%
1.3%
38.6%
21.8%
12.0%
1.6%
1.6%
1.1%
0.4%
-
-
- 0.4
-
1.9
-
-
3.6
-
N/A
-
1.9
-
-
5.0
2017e
- 7.2
- 6.1
- 8.9^
- 3.7
- 1.0
1.5
- 13.0
- 13.2
- 9.5
- 9.5
- 5.1
- 2.5
- 9.9
- 43.0
- 8.4
2017e 2018p
Chart of the quarter: Iraq bond yield (matures 2028)
The defeat of Islamic State in Iraq during 2017 has led to a marked improvement in investor confidence. The yield on Iraq’s longest term bond, which matures in 2028, fell to a record low of 6.0% in the first week of 2018, dropping just below its previous low in 2013 and less than half its peak in early 2016. Levels of violence in the country are now close to their lowest since 2003. Although Iraq still has some significant political hurdles to overcome in 2018, including navigating elections in May, it is emerging as a more viable place to do business and post-war reconstruction will offer numerous opportunities by filtering out a shortlist of suitable locations. Bespoke sector-specific research is needed before finalising any business decisions.
Data and projections: January 2018
Contact details
Source: Bloomberg
11.0%
10.0%
9.0%
8.0%
7.0%
6.0%
2012 2013 2014 2015 2016 Mar- Jun- Sep- Dec- Jan-17 17 17 17 18
Hani Ashkar Middle East Senior PartnerE: [email protected]
Stephen AndersonMiddle East Clients & Markets LeaderE: [email protected]
Richard BoxshallMiddle East Senior EconomistE: [email protected]

The productivity challenge
Weak labour productivity is a persistent challenge across the Middle East. However, labour productivity data can give a misleading picture as few workers are needed to generate value in the oil sector or in capital-intensive downstream manufacturing.
In many other sectors, notably non-financial services, even the Gulf economies have weak labour productivity levels compared with peers, as they rely on low skilled expatriates. Meanwhile, public sectors across the region are heavily overstaffed. Significantly, productivity growth rates are weak in most countries. The International Labour Organisation estimated that real productivity grew by 10% globally in 2010-17, but only the UAE exceed this rate and many countries saw their productivity fall over this period, notably Oman and Lebanon.
The role of technology and education
Efforts in many countries to improve education and motivate nationals to work in the private sector should boost productivity.
However, the biggest change will come from technology, notably AI and robotics, replacing jobs in the services sector. This could have a unique impact in the Gulf as expatriates, made redundant by technology, will just depart resulting in a less dense but more productive population. However, other Middle East countries, like the rest of the world, will have to struggle with potential threat of large scale unemployment.
Gulf countries have capital to invest in technology and some are taking bold steps, ranging from the Saudi Arabia vision for Neom city and the UAE’s appointment of the world’s first minister devoted to AI. The combination of investment, leadership and improving education could lead to substantial productivity gains.
We will be taking a closer look at the impact of AI on the regional economy in future research.
Middle East Economy Watch: Special FeatureTechnology and education could boost weak productivity
Ch
ange
sin
ce20
10 (
%)
Prod
ucti
vity
($k/
wor
ker)
Labour productivity trends
Qatar Kuwait UAE KSA Bahrain Oman World Iraq Lebanon Jordan Egypt
-3%
-31%
-6%
5%10%
-10%
19%
91 53 36 21 1539 25 2466 60 9
10% 9%
-7%-22%