microbial ecology (barton/microbial ecology) || the how of microbial ecology studies
TRANSCRIPT

5
THE HOW OF MICROBIALECOLOGY STUDIES
5.1 CENTRAL THEMES
• Appropriate sampling and storage techniques are necessary to obtain a representativecharacterization of microbial diversity from the natural world.
• Some microbial diversity is revealed only by cultivation, which is also necessary tounderstand the whole organism and its physiology.
• Microscopy is an important tool in counting the number of microbial cells in anenvironment, determining cell shapes, and ascertaining the percentage of activelyrespiring microorganisms present.
• Tools such as fluorescent in situ hybridization (FISH) reveal which morphotypes ina community correspond to which phylogenetic groups and allow for quantification.
• Molecular phylogenetic techniques reveal that the diversity of the microbial worlddominates the tree of life, and new tools are required to study this immense diversity.
• While molecular phylogeny reveals a startling amount of new diversity, it pro-vides only limited clues to the functions of these newly discovered organisms. Newmethods such as metagenomics are helping to elucidate these functions.
Microbial Ecology, First Edition. Larry L. Barton, Diana E. Northup© 2011 Wiley-Blackwell. Published 2011 by John Wiley & Sons, Inc.
131
132 THE HOW OF MICROBIAL ECOLOGY STUDIES
5.2 INTRODUCTION
Microbial ecology requires the ability to measure and assess a variety of parametersabout the habitat, the community of organisms present, and the effect of the organismson the environment. These include, but are not limited to the following:
• Measuring of abiotic parameters• Counting the number of organisms present• Visualizing the morphology of organisms and their interactions with their environ-
ment• Culturing of organisms present• Identifying the nature of the organisms present and their diversity• Assessing the metabolic pathways employed by the community of organisms• Measuring and identifying metabolic products and their effects on the habitat
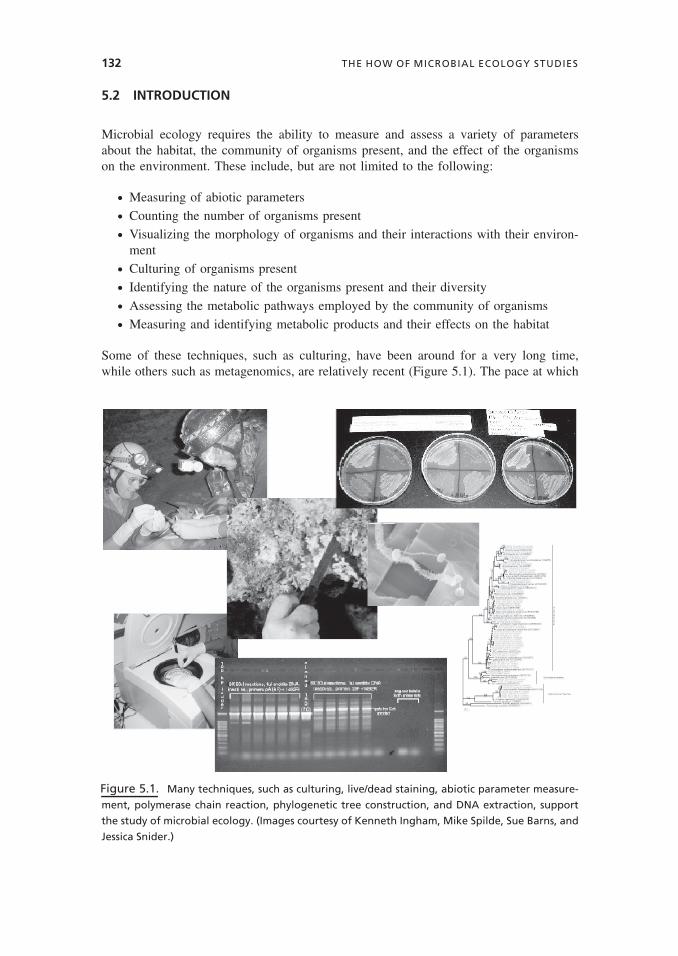
Some of these techniques, such as culturing, have been around for a very long time,while others such as metagenomics, are relatively recent (Figure 5.1). The pace at which
Figure 5.1. Many techniques, such as culturing, live/dead staining, abiotic parameter measure-
ment, polymerase chain reaction, phylogenetic tree construction, and DNA extraction, support
the study of microbial ecology. (Images courtesy of Kenneth Ingham, Mike Spilde, Sue Barns, and
Jessica Snider.)
INTRODUCTION 133
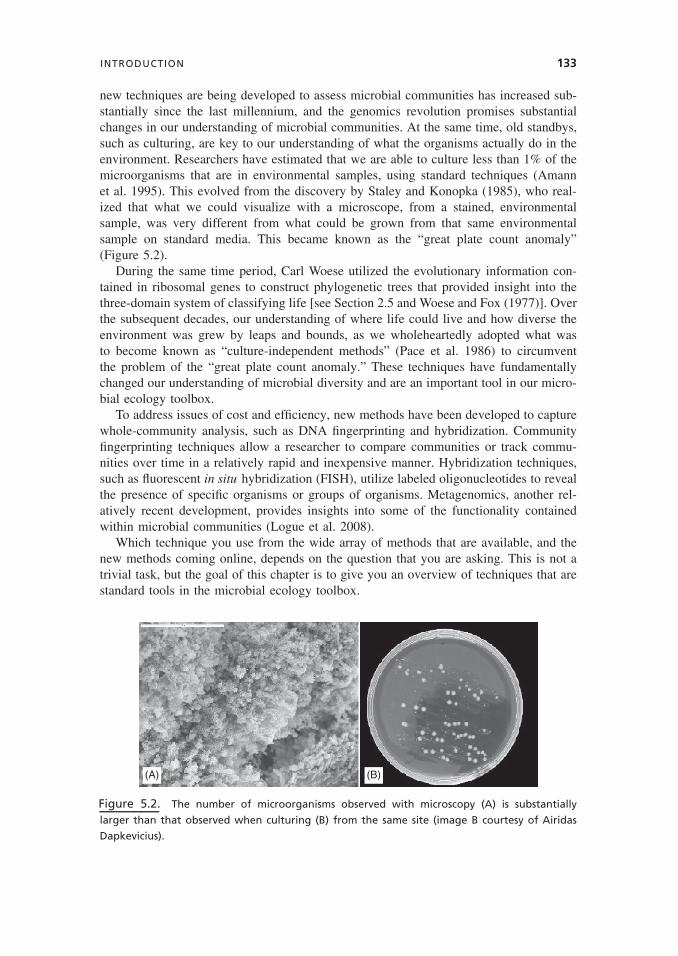
new techniques are being developed to assess microbial communities has increased sub-stantially since the last millennium, and the genomics revolution promises substantialchanges in our understanding of microbial communities. At the same time, old standbys,such as culturing, are key to our understanding of what the organisms actually do in theenvironment. Researchers have estimated that we are able to culture less than 1% of themicroorganisms that are in environmental samples, using standard techniques (Amannet al. 1995). This evolved from the discovery by Staley and Konopka (1985), who real-ized that what we could visualize with a microscope, from a stained, environmentalsample, was very different from what could be grown from that same environmentalsample on standard media. This became known as the “great plate count anomaly”(Figure 5.2).
During the same time period, Carl Woese utilized the evolutionary information con-tained in ribosomal genes to construct phylogenetic trees that provided insight into thethree-domain system of classifying life [see Section 2.5 and Woese and Fox (1977)]. Overthe subsequent decades, our understanding of where life could live and how diverse theenvironment was grew by leaps and bounds, as we wholeheartedly adopted what wasto become known as “culture-independent methods” (Pace et al. 1986) to circumventthe problem of the “great plate count anomaly.” These techniques have fundamentallychanged our understanding of microbial diversity and are an important tool in our micro-bial ecology toolbox.
To address issues of cost and efficiency, new methods have been developed to capturewhole-community analysis, such as DNA fingerprinting and hybridization. Communityfingerprinting techniques allow a researcher to compare communities or track commu-nities over time in a relatively rapid and inexpensive manner. Hybridization techniques,such as fluorescent in situ hybridization (FISH), utilize labeled oligonucleotides to revealthe presence of specific organisms or groups of organisms. Metagenomics, another rel-atively recent development, provides insights into some of the functionality containedwithin microbial communities (Logue et al. 2008).
Which technique you use from the wide array of methods that are available, and thenew methods coming online, depends on the question that you are asking. This is not atrivial task, but the goal of this chapter is to give you an overview of techniques that arestandard tools in the microbial ecology toolbox.
(A) (B)
Figure 5.2. The number of microorganisms observed with microscopy (A) is substantially
larger than that observed when culturing (B) from the same site (image B courtesy of Airidas
Dapkevicius).
134 THE HOW OF MICROBIAL ECOLOGY STUDIES
5.3 SAMPLING AND SAMPLE STORAGE
Microbial habitats tend to be heterogeneous in nature and can possess phenomenal diver-sity, particularly in soils. This diversity can be distributed unevenly throughout the habitat.Additionally, in order to compare different communities statistically, you need to have anadequate number of replicates. Therefore, selection of appropriate sampling methods forobtaining a representative sample of this heterogeneity must be considered. Sample sizecan be an important facet of the sampling strategy as seen in the study of soil microbialdiversity from agricultural soils by Grundmann and Gourbiere (1999). Smaller samplesof soil were more successful in cultivating more serotypes of Nitrobacter present in thesoils. The authors reason that the competition in larger samples is higher and thereforeonly the dominant serotypes succeeded in growing in the cultures. The small samplesize that appeared to be most successful in isolating the serotypes was a volume of0.13 × 103mm3. Other studies reviewed by Grundmann and Gourbiere (1999) supportthe idea of smaller samples that may limit species interactions, and the authors suggestthe collection of a large number of smaller samples.
When we examine the effect of sampling strategy on cultue-independent methods,the picture is a bit different and can depend on the type of soil, for example. Ranjardet al. (2003) suggest that the heterogeneous distribution of soil microorganisms may beimportant in determining sample size. Fungi tend to occur in the macropores and betweensoil aggregates, while bacteria often occur within the micropores of the aggregates, pos-sibly influencing which species are retrieved in samples of different sizes. The studiesby Ranjard et al. (2003) revealed that sample size for bacteria is not critically importantin sampling the full diversity, but that sample size is critical in fungal studies. Theirfindings support the protocol of taking smaller samples (<1 g) when attempting to deter-mine fungal species richness and larger samples (≥1 g) when comparing the structure ofcommunities using fingerprinting methods. Larger samples appear to mask some of themore minor members of the community.
Another important aspect of the sampling strategy is how you store and transport thesamples for DNA extraction from the sampling site. DNA can be degraded by microor-ganisms present in the sample, chemicals, enzymes, or other factors. Having lugged 40 lbof dry ice through a cave, one of the authors would suggest considering your samplepreservation strategy carefully. There are storage containers for liquid nitrogen that canbe used in the field, but these are bulky and difficult to transport by air. Several storagemedia have been utilized to stabilize DNA until samples can be frozen before extraction.Giovannoni et al. (1990) have utilized a sucrose lysis buffer that lyses the cell and sta-bilizes the DNA. This buffer can be applied in the field for immediate preservation ofthe DNA. The temperature at which samples are kept is another important consideration.Katsoulis and colleagues (2005) studied bacterial recovery from samples that were pro-cessed immediately versus those that were either stored at room temperature or frozen.Their results suggest that for some bacteria studied, the recovery rate is much greater forthose samples processed immediately rather than stored.
What strategy is best may also depend on the microorganisms being studied and thehabitats from which they were sampled. Consider experimenting with different samplingand storage regimes to determine what is best for a given experiment.
MICROSCOPY 135
5.4 MICROSCOPY
A wide variety of microscopy techniques is available to enhance the study of micro-bial ecology. These range from the more traditional light microscopy using a compoundlight microscope at relatively low magnification to electron microscopes that allow forthe imaging of cell surfaces or cellular internal structures at much high magnification.Microscopy allows microbial ecologists to count the number of organisms present inan environment, determine how many are metabolically active, visualize morphologiesassociated with environmental features, and determine the interactions between microor-ganisms and mineral surfaces. These methodologies will be explored in the next sections.
5.4.1 Gram Stains
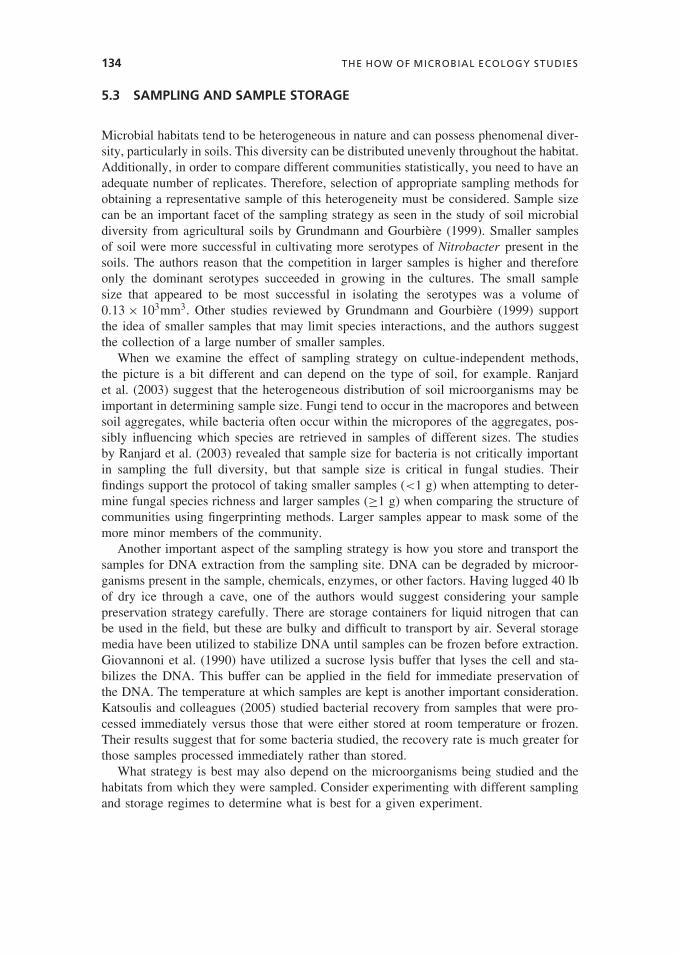
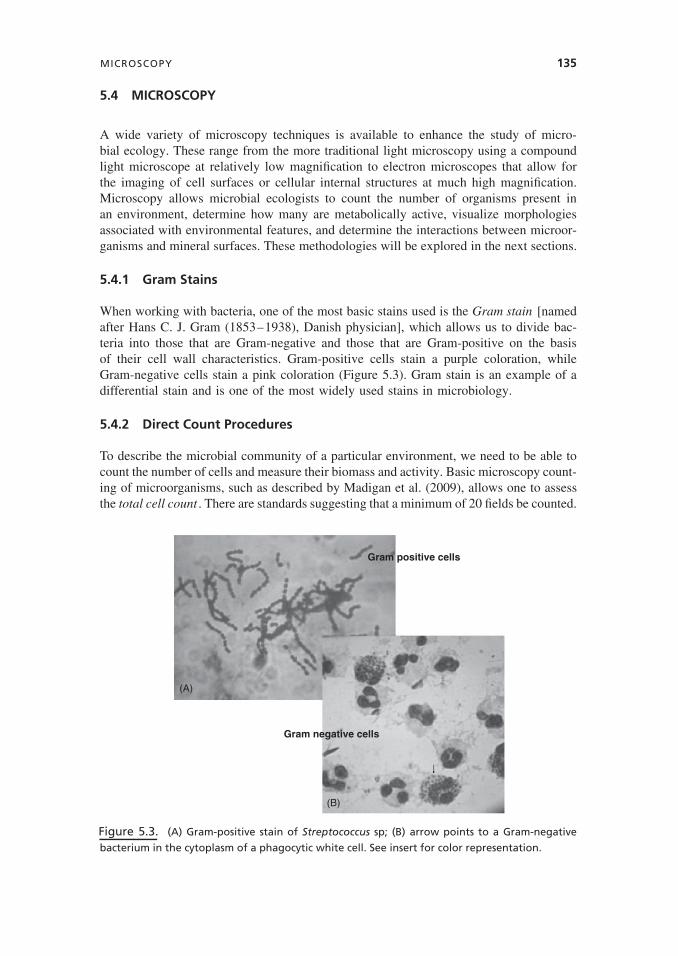
When working with bacteria, one of the most basic stains used is the Gram stain [namedafter Hans C. J. Gram (1853–1938), Danish physician], which allows us to divide bac-teria into those that are Gram-negative and those that are Gram-positive on the basisof their cell wall characteristics. Gram-positive cells stain a purple coloration, whileGram-negative cells stain a pink coloration (Figure 5.3). Gram stain is an example of adifferential stain and is one of the most widely used stains in microbiology.
5.4.2 Direct Count Procedures
To describe the microbial community of a particular environment, we need to be able tocount the number of cells and measure their biomass and activity. Basic microscopy count-ing of microorganisms, such as described by Madigan et al. (2009), allows one to assessthe total cell count . There are standards suggesting that a minimum of 20 fields be counted.
(A)
(B)
Gram positive cells
Gram negative cells
Figure 5.3. (A) Gram-positive stain of Streptococcus sp; (B) arrow points to a Gram-negative
bacterium in the cytoplasm of a phagocytic white cell. See insert for color representation.
136 THE HOW OF MICROBIAL ECOLOGY STUDIES
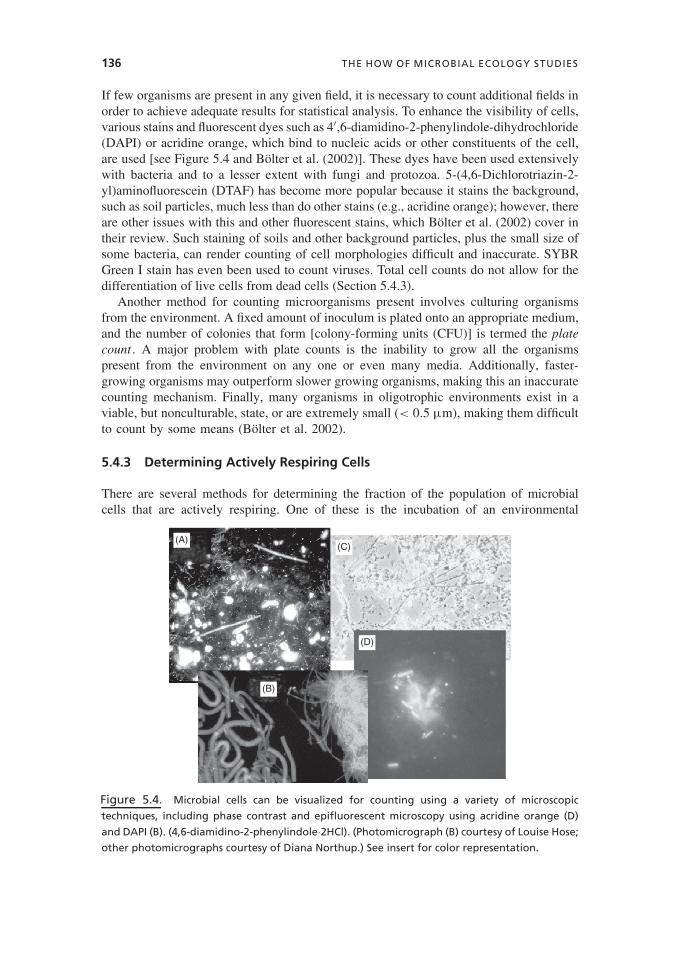
If few organisms are present in any given field, it is necessary to count additional fields inorder to achieve adequate results for statistical analysis. To enhance the visibility of cells,various stains and fluorescent dyes such as 4′,6-diamidino-2-phenylindole-dihydrochloride(DAPI) or acridine orange, which bind to nucleic acids or other constituents of the cell,are used [see Figure 5.4 and Bolter et al. (2002)]. These dyes have been used extensivelywith bacteria and to a lesser extent with fungi and protozoa. 5-(4,6-Dichlorotriazin-2-yl)aminofluorescein (DTAF) has become more popular because it stains the background,such as soil particles, much less than do other stains (e.g., acridine orange); however, thereare other issues with this and other fluorescent stains, which Bolter et al. (2002) cover intheir review. Such staining of soils and other background particles, plus the small size ofsome bacteria, can render counting of cell morphologies difficult and inaccurate. SYBRGreen I stain has even been used to count viruses. Total cell counts do not allow for thedifferentiation of live cells from dead cells (Section 5.4.3).
Another method for counting microorganisms present involves culturing organismsfrom the environment. A fixed amount of inoculum is plated onto an appropriate medium,and the number of colonies that form [colony-forming units (CFU)] is termed the platecount . A major problem with plate counts is the inability to grow all the organismspresent from the environment on any one or even many media. Additionally, faster-growing organisms may outperform slower growing organisms, making this an inaccuratecounting mechanism. Finally, many organisms in oligotrophic environments exist in aviable, but nonculturable, state, or are extremely small (< 0.5 μm), making them difficultto count by some means (Bolter et al. 2002).
5.4.3 Determining Actively Respiring Cells
There are several methods for determining the fraction of the population of microbialcells that are actively respiring. One of these is the incubation of an environmental
(A)
(B)
(C)
(D)
Figure 5.4. Microbial cells can be visualized for counting using a variety of microscopic
techniques, including phase contrast and epifluorescent microscopy using acridine orange (D)
and DAPI (B). (4,6-diamidino-2-phenylindole·2HCl). (Photomicrograph (B) courtesy of Louise Hose;
other photomicrographs courtesy of Diana Northup.) See insert for color representation.
MICROSCOPY 137
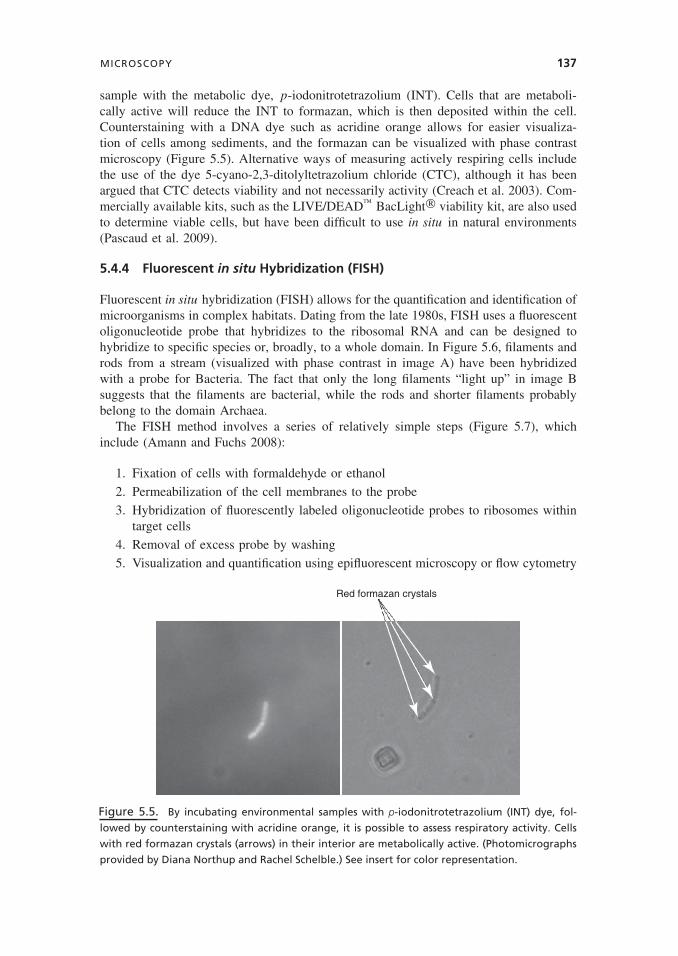
sample with the metabolic dye, p-iodonitrotetrazolium (INT). Cells that are metaboli-cally active will reduce the INT to formazan, which is then deposited within the cell.Counterstaining with a DNA dye such as acridine orange allows for easier visualiza-tion of cells among sediments, and the formazan can be visualized with phase contrastmicroscopy (Figure 5.5). Alternative ways of measuring actively respiring cells includethe use of the dye 5-cyano-2,3-ditolyltetrazolium chloride (CTC), although it has beenargued that CTC detects viability and not necessarily activity (Creach et al. 2003). Com-mercially available kits, such as the LIVE/DEAD™ BacLight® viability kit, are also usedto determine viable cells, but have been difficult to use in situ in natural environments(Pascaud et al. 2009).
5.4.4 Fluorescent in situ Hybridization (FISH)
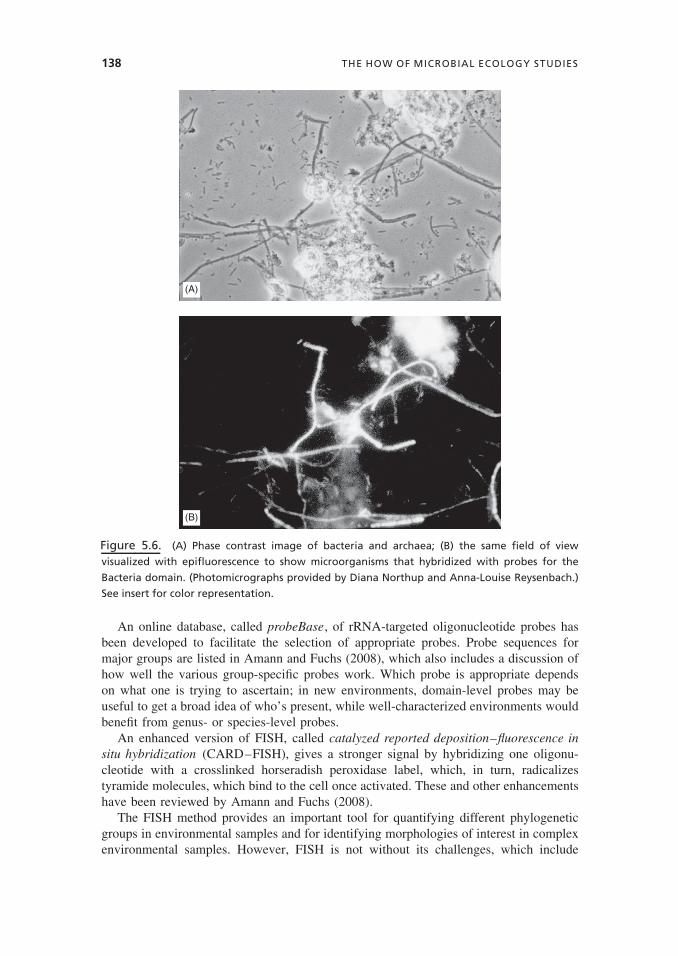
Fluorescent in situ hybridization (FISH) allows for the quantification and identification ofmicroorganisms in complex habitats. Dating from the late 1980s, FISH uses a fluorescentoligonucleotide probe that hybridizes to the ribosomal RNA and can be designed tohybridize to specific species or, broadly, to a whole domain. In Figure 5.6, filaments androds from a stream (visualized with phase contrast in image A) have been hybridizedwith a probe for Bacteria. The fact that only the long filaments “light up” in image Bsuggests that the filaments are bacterial, while the rods and shorter filaments probablybelong to the domain Archaea.
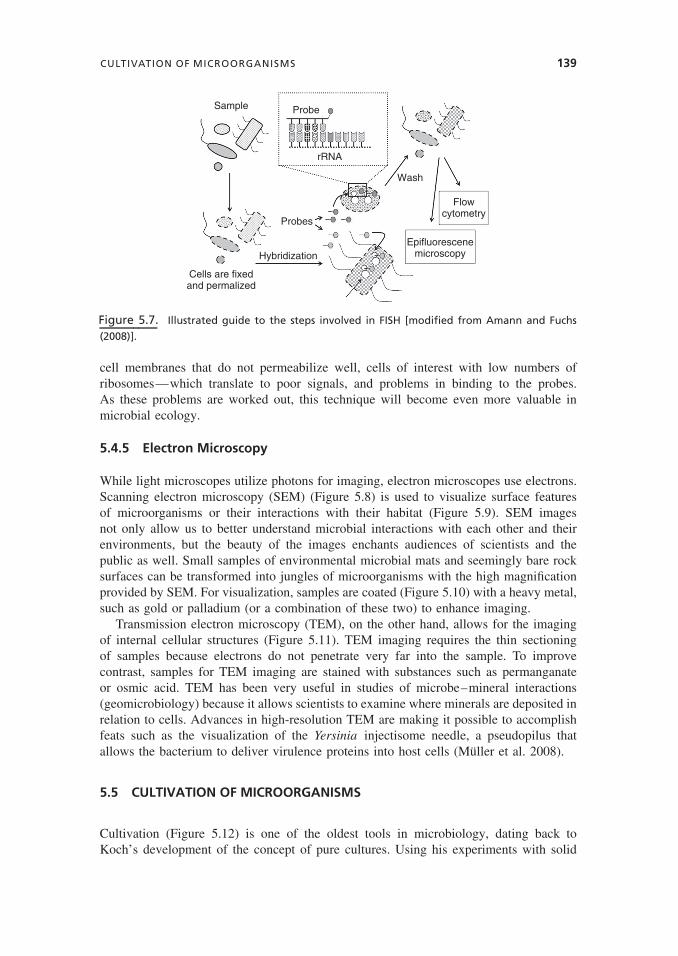
The FISH method involves a series of relatively simple steps (Figure 5.7), whichinclude (Amann and Fuchs 2008):
1. Fixation of cells with formaldehyde or ethanol
2. Permeabilization of the cell membranes to the probe
3. Hybridization of fluorescently labeled oligonucleotide probes to ribosomes withintarget cells
4. Removal of excess probe by washing
5. Visualization and quantification using epifluorescent microscopy or flow cytometry
Red formazan crystals
Figure 5.5. By incubating environmental samples with p-iodonitrotetrazolium (INT) dye, fol-
lowed by counterstaining with acridine orange, it is possible to assess respiratory activity. Cells
with red formazan crystals (arrows) in their interior are metabolically active. (Photomicrographs
provided by Diana Northup and Rachel Schelble.) See insert for color representation.
138 THE HOW OF MICROBIAL ECOLOGY STUDIES
(A)
(B)
Figure 5.6. (A) Phase contrast image of bacteria and archaea; (B) the same field of view
visualized with epifluorescence to show microorganisms that hybridized with probes for the
Bacteria domain. (Photomicrographs provided by Diana Northup and Anna-Louise Reysenbach.)
See insert for color representation.
An online database, called probeBase, of rRNA-targeted oligonucleotide probes hasbeen developed to facilitate the selection of appropriate probes. Probe sequences formajor groups are listed in Amann and Fuchs (2008), which also includes a discussion ofhow well the various group-specific probes work. Which probe is appropriate dependson what one is trying to ascertain; in new environments, domain-level probes may beuseful to get a broad idea of who’s present, while well-characterized environments wouldbenefit from genus- or species-level probes.
An enhanced version of FISH, called catalyzed reported deposition–fluorescence insitu hybridization (CARD–FISH), gives a stronger signal by hybridizing one oligonu-cleotide with a crosslinked horseradish peroxidase label, which, in turn, radicalizestyramide molecules, which bind to the cell once activated. These and other enhancementshave been reviewed by Amann and Fuchs (2008).
The FISH method provides an important tool for quantifying different phylogeneticgroups in environmental samples and for identifying morphologies of interest in complexenvironmental samples. However, FISH is not without its challenges, which include
CULTIVATION OF MICROORGANISMS 139
Probe
Probes
Hybridization
Cells are fixedand permalized
Sample
rRNA
Wash
Flowcytometry
Epifluorescenemicroscopy
Figure 5.7. Illustrated guide to the steps involved in FISH [modified from Amann and Fuchs
(2008)].
cell membranes that do not permeabilize well, cells of interest with low numbers ofribosomes—which translate to poor signals, and problems in binding to the probes.As these problems are worked out, this technique will become even more valuable inmicrobial ecology.
5.4.5 Electron Microscopy
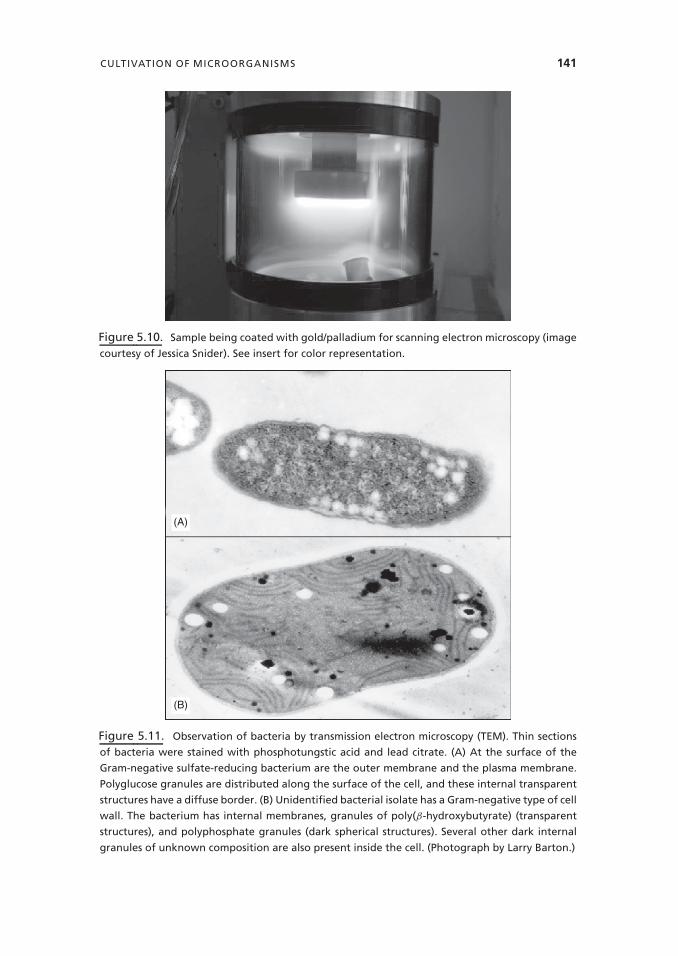
While light microscopes utilize photons for imaging, electron microscopes use electrons.Scanning electron microscopy (SEM) (Figure 5.8) is used to visualize surface featuresof microorganisms or their interactions with their habitat (Figure 5.9). SEM imagesnot only allow us to better understand microbial interactions with each other and theirenvironments, but the beauty of the images enchants audiences of scientists and thepublic as well. Small samples of environmental microbial mats and seemingly bare rocksurfaces can be transformed into jungles of microorganisms with the high magnificationprovided by SEM. For visualization, samples are coated (Figure 5.10) with a heavy metal,such as gold or palladium (or a combination of these two) to enhance imaging.
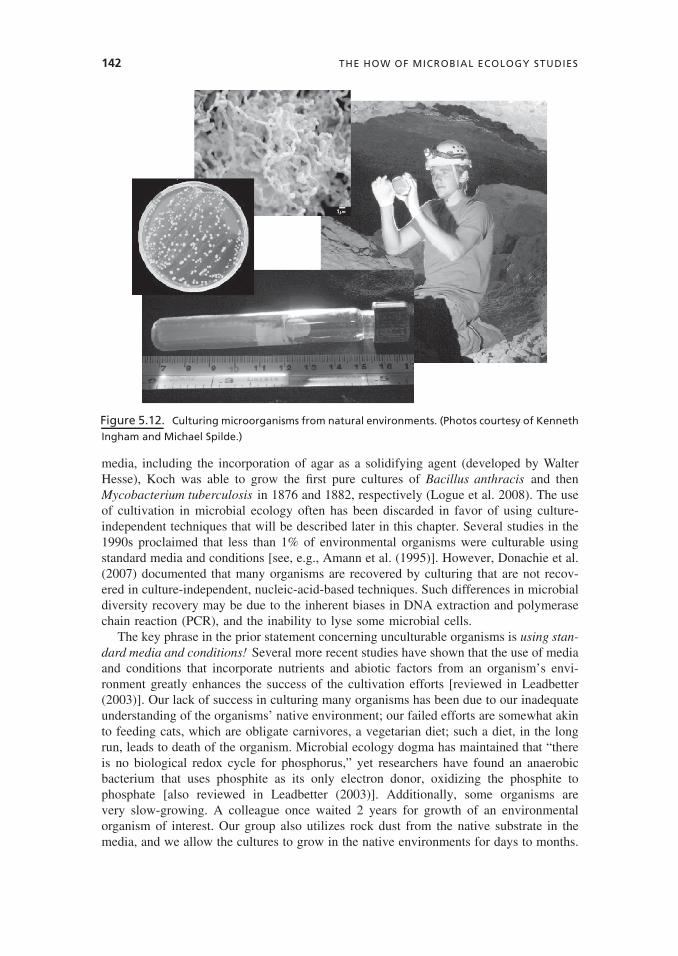
Transmission electron microscopy (TEM), on the other hand, allows for the imagingof internal cellular structures (Figure 5.11). TEM imaging requires the thin sectioningof samples because electrons do not penetrate very far into the sample. To improvecontrast, samples for TEM imaging are stained with substances such as permanganateor osmic acid. TEM has been very useful in studies of microbe–mineral interactions(geomicrobiology) because it allows scientists to examine where minerals are deposited inrelation to cells. Advances in high-resolution TEM are making it possible to accomplishfeats such as the visualization of the Yersinia injectisome needle, a pseudopilus thatallows the bacterium to deliver virulence proteins into host cells (Muller et al. 2008).
5.5 CULTIVATION OF MICROORGANISMS
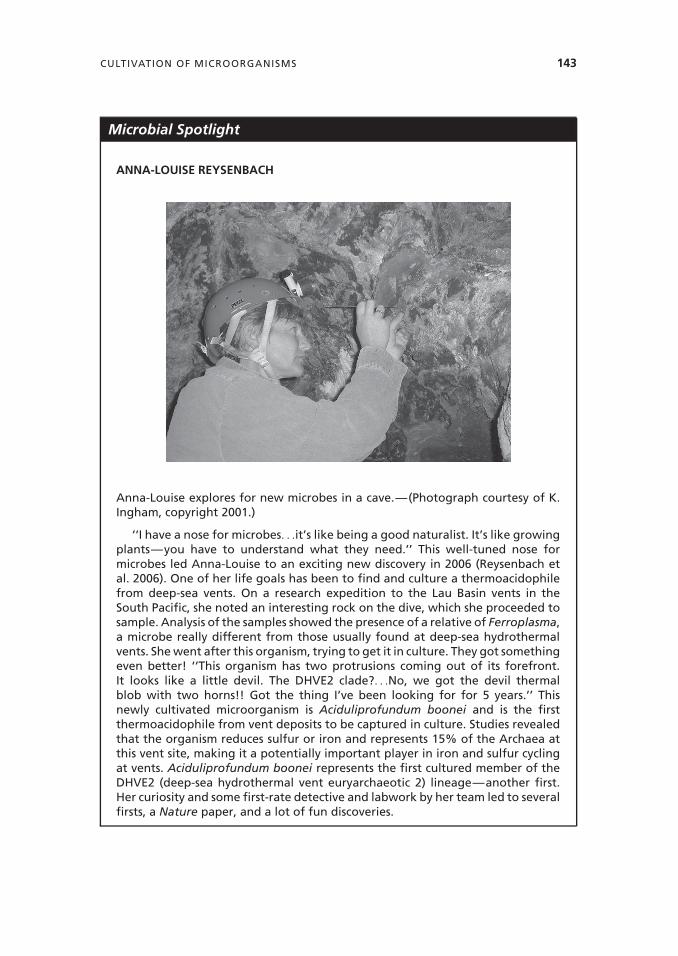
Cultivation (Figure 5.12) is one of the oldest tools in microbiology, dating back toKoch’s development of the concept of pure cultures. Using his experiments with solid

140 THE HOW OF MICROBIAL ECOLOGY STUDIES
Figure 5.8. Scanning electron microscope equipped with X-ray dispersive spectroscopy. (Image
courtesy of Kenneth Ingham.)
Figure 5.9. Filamentous bacteria associated with calcium carbonate formations in caves are
visualized with scanning electron microscopy (SEM). The lower image shows an elemental analysis
of the filaments, documenting a larger peak for carbon than would be expected if only calcium
carbonate were present. Also note the filament emerging from a hole in the rock in the upper
right of the SEM image. (Images courtesy of Michael Spilde and Leslie Melim.)
CULTIVATION OF MICROORGANISMS 141
Figure 5.10. Sample being coated with gold/palladium for scanning electron microscopy (image
courtesy of Jessica Snider). See insert for color representation.
(A)
(B)
Figure 5.11. Observation of bacteria by transmission electron microscopy (TEM). Thin sections
of bacteria were stained with phosphotungstic acid and lead citrate. (A) At the surface of the
Gram-negative sulfate-reducing bacterium are the outer membrane and the plasma membrane.
Polyglucose granules are distributed along the surface of the cell, and these internal transparent
structures have a diffuse border. (B) Unidentified bacterial isolate has a Gram-negative type of cell
wall. The bacterium has internal membranes, granules of poly(β-hydroxybutyrate) (transparent
structures), and polyphosphate granules (dark spherical structures). Several other dark internal
granules of unknown composition are also present inside the cell. (Photograph by Larry Barton.)
142 THE HOW OF MICROBIAL ECOLOGY STUDIES
Figure 5.12. Culturing microorganisms from natural environments. (Photos courtesy of Kenneth
Ingham and Michael Spilde.)
media, including the incorporation of agar as a solidifying agent (developed by WalterHesse), Koch was able to grow the first pure cultures of Bacillus anthracis and thenMycobacterium tuberculosis in 1876 and 1882, respectively (Logue et al. 2008). The useof cultivation in microbial ecology often has been discarded in favor of using culture-independent techniques that will be described later in this chapter. Several studies in the1990s proclaimed that less than 1% of environmental organisms were culturable usingstandard media and conditions [see, e.g., Amann et al. (1995)]. However, Donachie et al.(2007) documented that many organisms are recovered by culturing that are not recov-ered in culture-independent, nucleic-acid-based techniques. Such differences in microbialdiversity recovery may be due to the inherent biases in DNA extraction and polymerasechain reaction (PCR), and the inability to lyse some microbial cells.
The key phrase in the prior statement concerning unculturable organisms is using stan-dard media and conditions! Several more recent studies have shown that the use of mediaand conditions that incorporate nutrients and abiotic factors from an organism’s envi-ronment greatly enhances the success of the cultivation efforts [reviewed in Leadbetter(2003)]. Our lack of success in culturing many organisms has been due to our inadequateunderstanding of the organisms’ native environment; our failed efforts are somewhat akinto feeding cats, which are obligate carnivores, a vegetarian diet; such a diet, in the longrun, leads to death of the organism. Microbial ecology dogma has maintained that “thereis no biological redox cycle for phosphorus,” yet researchers have found an anaerobicbacterium that uses phosphite as its only electron donor, oxidizing the phosphite tophosphate [also reviewed in Leadbetter (2003)]. Additionally, some organisms arevery slow-growing. A colleague once waited 2 years for growth of an environmentalorganism of interest. Our group also utilizes rock dust from the native substrate in themedia, and we allow the cultures to grow in the native environments for days to months.
CULTIVATION OF MICROORGANISMS 143
Microbial Spotlight
ANNA-LOUISE REYSENBACH
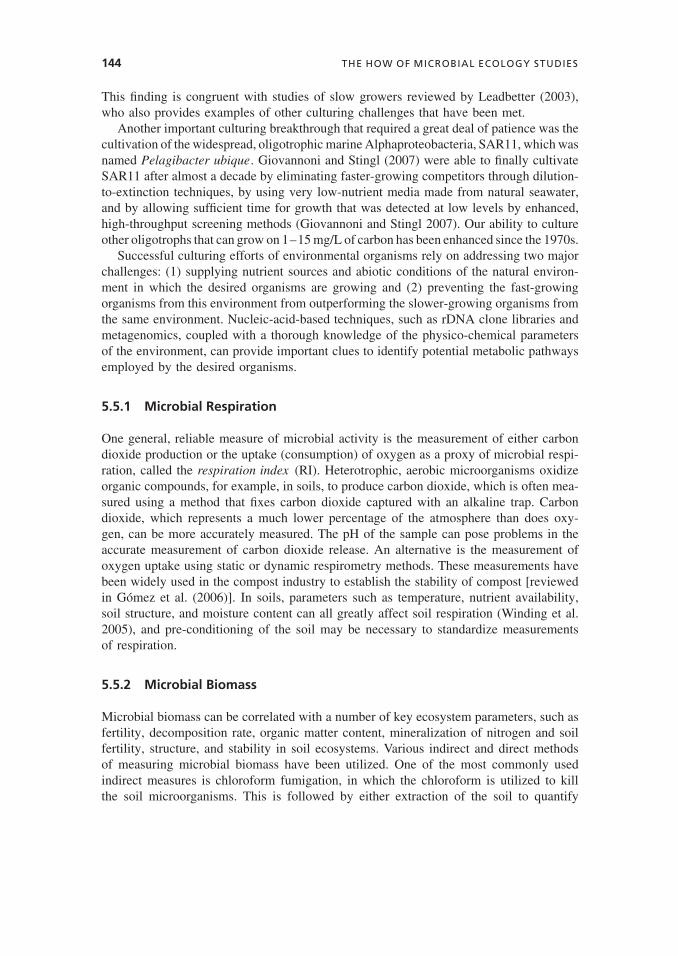
Anna-Louise explores for new microbes in a cave.—(Photograph courtesy of K.Ingham, copyright 2001.)
‘‘I have a nose for microbes. . .it’s like being a good naturalist. It’s like growingplants—you have to understand what they need.’’ This well-tuned nose formicrobes led Anna-Louise to an exciting new discovery in 2006 (Reysenbach etal. 2006). One of her life goals has been to find and culture a thermoacidophilefrom deep-sea vents. On a research expedition to the Lau Basin vents in theSouth Pacific, she noted an interesting rock on the dive, which she proceeded tosample. Analysis of the samples showed the presence of a relative of Ferroplasma,a microbe really different from those usually found at deep-sea hydrothermalvents. She went after this organism, trying to get it in culture. They got somethingeven better! ‘‘This organism has two protrusions coming out of its forefront.It looks like a little devil. The DHVE2 clade?. . .No, we got the devil thermalblob with two horns!! Got the thing I’ve been looking for for 5 years.’’ Thisnewly cultivated microorganism is Aciduliprofundum boonei and is the firstthermoacidophile from vent deposits to be captured in culture. Studies revealedthat the organism reduces sulfur or iron and represents 15% of the Archaea atthis vent site, making it a potentially important player in iron and sulfur cyclingat vents. Aciduliprofundum boonei represents the first cultured member of theDHVE2 (deep-sea hydrothermal vent euryarchaeotic 2) lineage—another first.Her curiosity and some first-rate detective and labwork by her team led to severalfirsts, a Nature paper, and a lot of fun discoveries.
144 THE HOW OF MICROBIAL ECOLOGY STUDIES
This finding is congruent with studies of slow growers reviewed by Leadbetter (2003),who also provides examples of other culturing challenges that have been met.
Another important culturing breakthrough that required a great deal of patience was thecultivation of the widespread, oligotrophic marine Alphaproteobacteria, SAR11, which wasnamed Pelagibacter ubique. Giovannoni and Stingl (2007) were able to finally cultivateSAR11 after almost a decade by eliminating faster-growing competitors through dilution-to-extinction techniques, by using very low-nutrient media made from natural seawater,and by allowing sufficient time for growth that was detected at low levels by enhanced,high-throughput screening methods (Giovannoni and Stingl 2007). Our ability to cultureother oligotrophs that can grow on 1–15 mg/L of carbon has been enhanced since the 1970s.
Successful culturing efforts of environmental organisms rely on addressing two majorchallenges: (1) supplying nutrient sources and abiotic conditions of the natural environ-ment in which the desired organisms are growing and (2) preventing the fast-growingorganisms from this environment from outperforming the slower-growing organisms fromthe same environment. Nucleic-acid-based techniques, such as rDNA clone libraries andmetagenomics, coupled with a thorough knowledge of the physico-chemical parametersof the environment, can provide important clues to identify potential metabolic pathwaysemployed by the desired organisms.
5.5.1 Microbial Respiration
One general, reliable measure of microbial activity is the measurement of either carbondioxide production or the uptake (consumption) of oxygen as a proxy of microbial respi-ration, called the respiration index (RI). Heterotrophic, aerobic microorganisms oxidizeorganic compounds, for example, in soils, to produce carbon dioxide, which is often mea-sured using a method that fixes carbon dioxide captured with an alkaline trap. Carbondioxide, which represents a much lower percentage of the atmosphere than does oxy-gen, can be more accurately measured. The pH of the sample can pose problems in theaccurate measurement of carbon dioxide release. An alternative is the measurement ofoxygen uptake using static or dynamic respirometry methods. These measurements havebeen widely used in the compost industry to establish the stability of compost [reviewedin Gomez et al. (2006)]. In soils, parameters such as temperature, nutrient availability,soil structure, and moisture content can all greatly affect soil respiration (Winding et al.2005), and pre-conditioning of the soil may be necessary to standardize measurementsof respiration.
5.5.2 Microbial Biomass
Microbial biomass can be correlated with a number of key ecosystem parameters, such asfertility, decomposition rate, organic matter content, mineralization of nitrogen and soilfertility, structure, and stability in soil ecosystems. Various indirect and direct methodsof measuring microbial biomass have been utilized. One of the most commonly usedindirect measures is chloroform fumigation, in which the chloroform is utilized to killthe soil microorganisms. This is followed by either extraction of the soil to quantify
CULTIVATION OF MICROORGANISMS 145
the extractable carbon, or by a period of incubation in which researchers measure thecarbon dioxide released by germination of microbial spores utilizing the carbon fromthe newly dead microbial biomass. The addition of a substrate such as glucose, which iseasily utilized by some microorganisms, to soils or other habitats, provides an indirectmeasure of microbial biomass, called substrate-induced respiration . After addition of thesubstrate, researchers measure the change in soil respiration rate and use this measurementto determine the metabolically active portion of soil microbial biomass (Winding et al.2005). Direct count procedures (Section 5.4.2) can be used with a conversion factor toestimate biomass, although special techniques are needed for some microorganisms, suchas fungi, where fungal hyphal length is measured.
5.5.3 Measuring Carbon Substrate Utilization
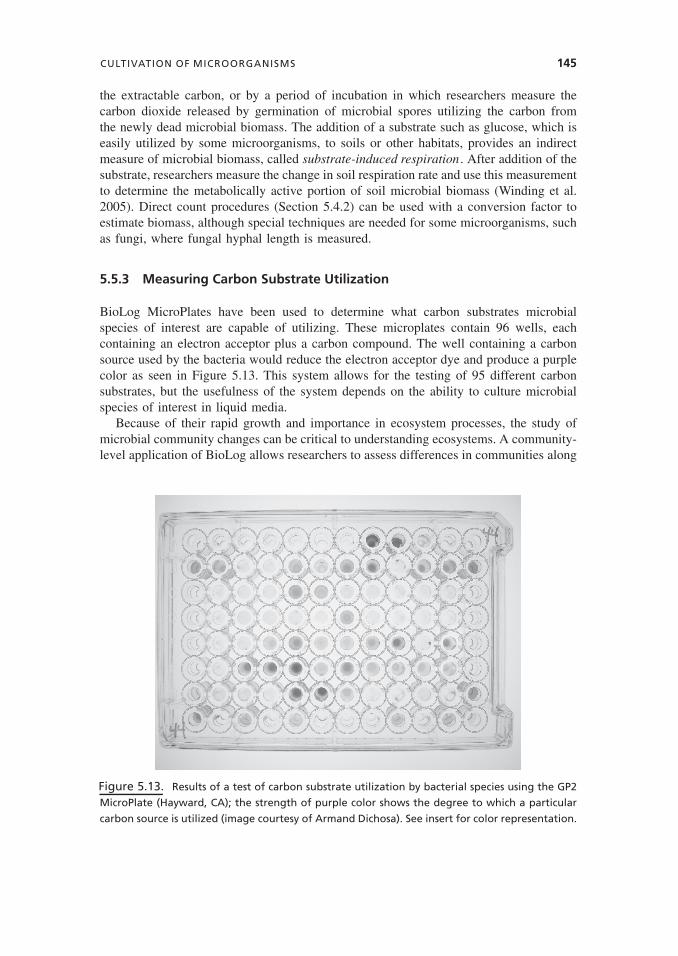
BioLog MicroPlates have been used to determine what carbon substrates microbialspecies of interest are capable of utilizing. These microplates contain 96 wells, eachcontaining an electron acceptor plus a carbon compound. The well containing a carbonsource used by the bacteria would reduce the electron acceptor dye and produce a purplecolor as seen in Figure 5.13. This system allows for the testing of 95 different carbonsubstrates, but the usefulness of the system depends on the ability to culture microbialspecies of interest in liquid media.
Because of their rapid growth and importance in ecosystem processes, the study ofmicrobial community changes can be critical to understanding ecosystems. A community-level application of BioLog allows researchers to assess differences in communities along
Figure 5.13. Results of a test of carbon substrate utilization by bacterial species using the GP2
MicroPlate (Hayward, CA); the strength of purple color shows the degree to which a particular
carbon source is utilized (image courtesy of Armand Dichosa). See insert for color representation.
146 THE HOW OF MICROBIAL ECOLOGY STUDIES
temporal and spatial scales (Garland 1997), which they termed “community-level physi-ological profiling” (CLPP). Different organisms within a community use different carbonsources at different rates, allowing insights into the community structure and functionaldiversity. This technique has been utilized to assess the effects of different treatments(e.g., nitrogen addition) across time. CLPP involves inoculation of environmental samplesinto microtiter plate wells that contain redox dyes, such as tetrazolium violet. BecauseBioLog is based on cultivation, some biases in the responding organisms will exist andthe amount of inoculum can affect the results. However, it is an economical tool withreproducible results, which, used in conjunction with other tools such as denaturing gra-dient gel electrophoresis (DGGE) (Section 5.8.1), can produce valuable results (Xue et al.2008).
5.6 MOLECULAR PHYLOGENETICS
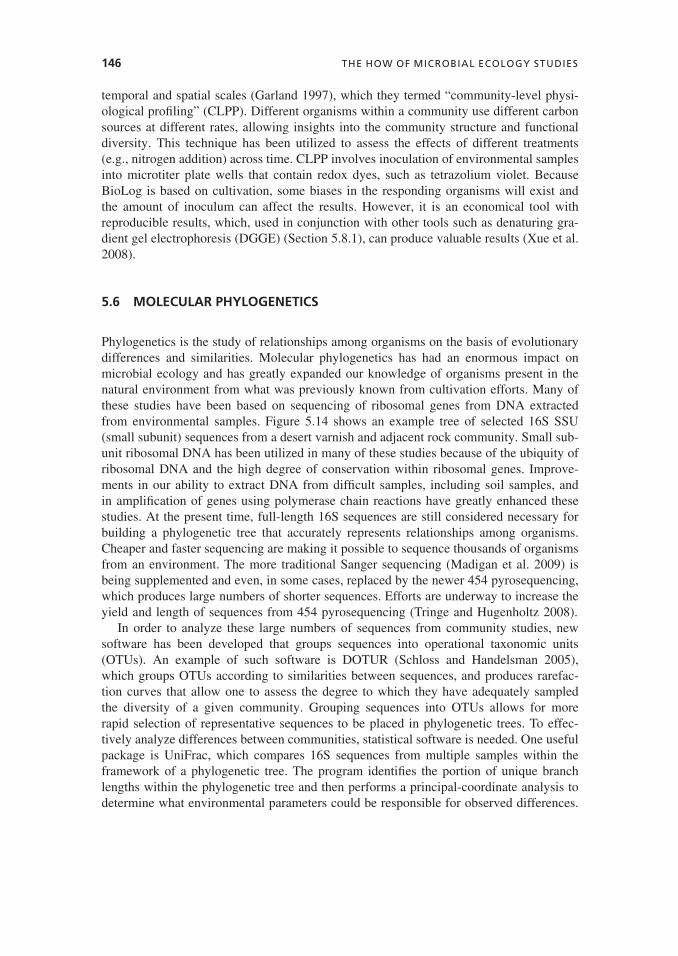
Phylogenetics is the study of relationships among organisms on the basis of evolutionarydifferences and similarities. Molecular phylogenetics has had an enormous impact onmicrobial ecology and has greatly expanded our knowledge of organisms present in thenatural environment from what was previously known from cultivation efforts. Many ofthese studies have been based on sequencing of ribosomal genes from DNA extractedfrom environmental samples. Figure 5.14 shows an example tree of selected 16S SSU(small subunit) sequences from a desert varnish and adjacent rock community. Small sub-unit ribosomal DNA has been utilized in many of these studies because of the ubiquity ofribosomal DNA and the high degree of conservation within ribosomal genes. Improve-ments in our ability to extract DNA from difficult samples, including soil samples, andin amplification of genes using polymerase chain reactions have greatly enhanced thesestudies. At the present time, full-length 16S sequences are still considered necessary forbuilding a phylogenetic tree that accurately represents relationships among organisms.Cheaper and faster sequencing are making it possible to sequence thousands of organismsfrom an environment. The more traditional Sanger sequencing (Madigan et al. 2009) isbeing supplemented and even, in some cases, replaced by the newer 454 pyrosequencing,which produces large numbers of shorter sequences. Efforts are underway to increase theyield and length of sequences from 454 pyrosequencing (Tringe and Hugenholtz 2008).
In order to analyze these large numbers of sequences from community studies, newsoftware has been developed that groups sequences into operational taxonomic units(OTUs). An example of such software is DOTUR (Schloss and Handelsman 2005),which groups OTUs according to similarities between sequences, and produces rarefac-tion curves that allow one to assess the degree to which they have adequately sampledthe diversity of a given community. Grouping sequences into OTUs allows for morerapid selection of representative sequences to be placed in phylogenetic trees. To effec-tively analyze differences between communities, statistical software is needed. One usefulpackage is UniFrac, which compares 16S sequences from multiple samples within theframework of a phylogenetic tree. The program identifies the portion of unique branchlengths within the phylogenetic tree and then performs a principal-coordinate analysis todetermine what environmental parameters could be responsible for observed differences.
MOLECULAR PHYLOGENETICS 147
Figure 5.14. Molecular phylogenetic analyses of 16S rDNA sequences produce a phylogenetic
tree that enables one to see evolutionary relationships among environmental sequences and
cultured relatives. (Phylogenetic tree courtesy of Jessica Snider.) See insert for color representation.
148 THE HOW OF MICROBIAL ECOLOGY STUDIES
Such tools enable microbial ecologists to move beyond descriptive studies of communitydiversity to asking questions about what drives diversity and other interesting questions.
5.7 CULTURING VERSUS MOLECULAR TECHNIQUES:COMPARISONS FROM SOIL STUDIES
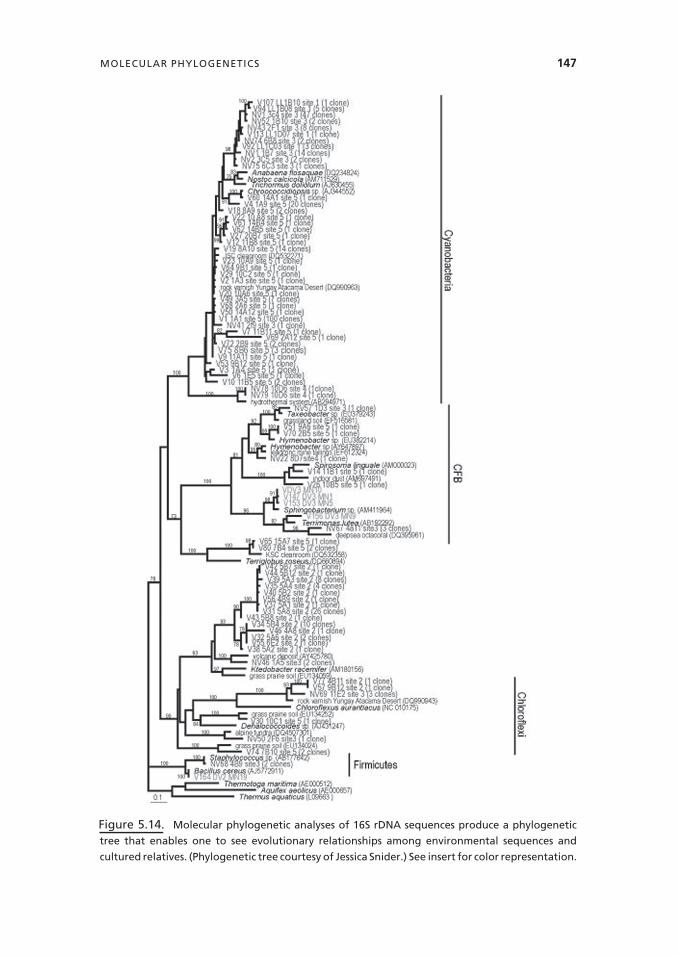
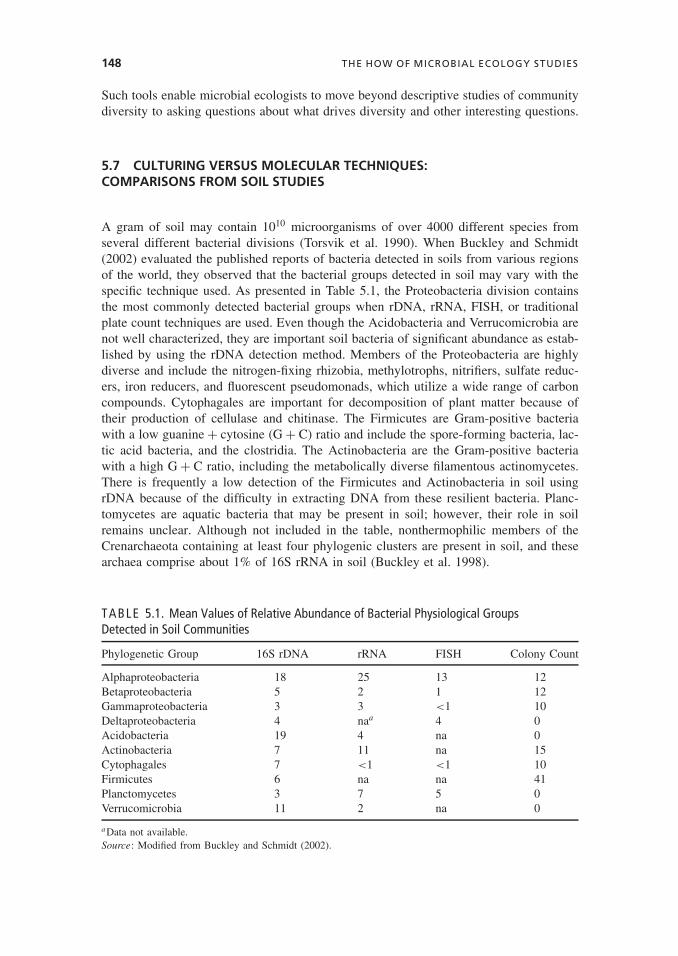
A gram of soil may contain 1010 microorganisms of over 4000 different species fromseveral different bacterial divisions (Torsvik et al. 1990). When Buckley and Schmidt(2002) evaluated the published reports of bacteria detected in soils from various regionsof the world, they observed that the bacterial groups detected in soil may vary with thespecific technique used. As presented in Table 5.1, the Proteobacteria division containsthe most commonly detected bacterial groups when rDNA, rRNA, FISH, or traditionalplate count techniques are used. Even though the Acidobacteria and Verrucomicrobia arenot well characterized, they are important soil bacteria of significant abundance as estab-lished by using the rDNA detection method. Members of the Proteobacteria are highlydiverse and include the nitrogen-fixing rhizobia, methylotrophs, nitrifiers, sulfate reduc-ers, iron reducers, and fluorescent pseudomonads, which utilize a wide range of carboncompounds. Cytophagales are important for decomposition of plant matter because oftheir production of cellulase and chitinase. The Firmicutes are Gram-positive bacteriawith a low guanine + cytosine (G + C) ratio and include the spore-forming bacteria, lac-tic acid bacteria, and the clostridia. The Actinobacteria are the Gram-positive bacteriawith a high G + C ratio, including the metabolically diverse filamentous actinomycetes.There is frequently a low detection of the Firmicutes and Actinobacteria in soil usingrDNA because of the difficulty in extracting DNA from these resilient bacteria. Planc-tomycetes are aquatic bacteria that may be present in soil; however, their role in soilremains unclear. Although not included in the table, nonthermophilic members of theCrenarchaeota containing at least four phylogenic clusters are present in soil, and thesearchaea comprise about 1% of 16S rRNA in soil (Buckley et al. 1998).
TABLE 5.1. Mean Values of Relative Abundance of Bacterial Physiological GroupsDetected in Soil Communities
Phylogenetic Group 16S rDNA rRNA FISH Colony Count
Alphaproteobacteria 18 25 13 12Betaproteobacteria 5 2 1 12Gammaproteobacteria 3 3 <1 10Deltaproteobacteria 4 naa 4 0Acidobacteria 19 4 na 0Actinobacteria 7 11 na 15Cytophagales 7 <1 <1 10Firmicutes 6 na na 41Planctomycetes 3 7 5 0Verrucomicrobia 11 2 na 0
aData not available.Source: Modified from Buckley and Schmidt (2002).
METAGENOMICS: A NEW TOOL FOR ANSWERING COMMUNITY ECOLOGY QUESTIONS 149
5.8 COMMUNITY FINGERPRINTING METHODS
5.8.1 Denaturing Gradient Gel Electrophoresis
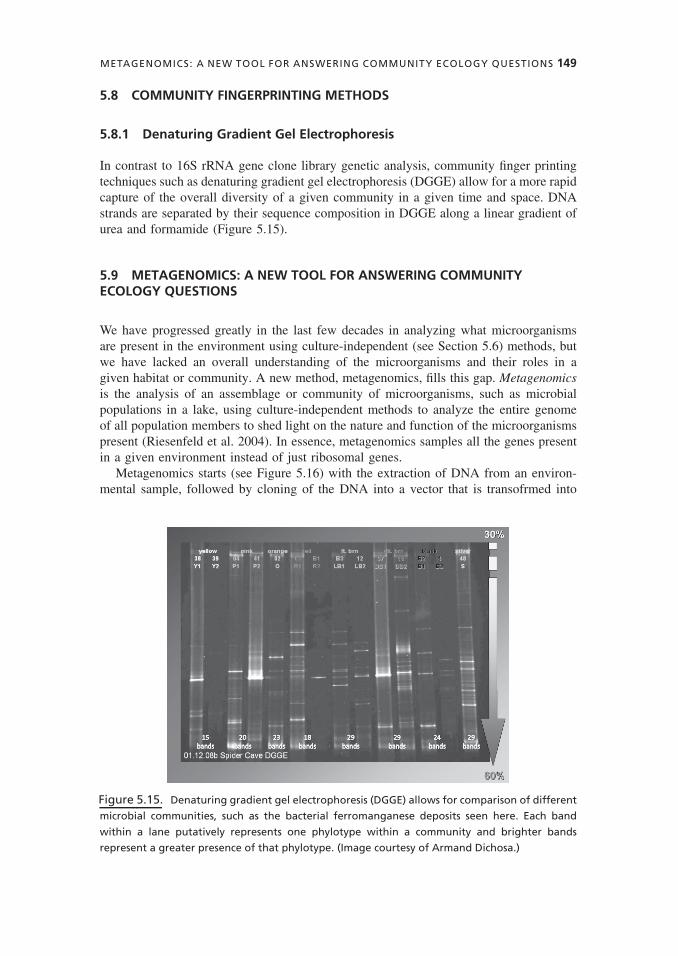
In contrast to 16S rRNA gene clone library genetic analysis, community finger printingtechniques such as denaturing gradient gel electrophoresis (DGGE) allow for a more rapidcapture of the overall diversity of a given community in a given time and space. DNAstrands are separated by their sequence composition in DGGE along a linear gradient ofurea and formamide (Figure 5.15).
5.9 METAGENOMICS: A NEW TOOL FOR ANSWERING COMMUNITYECOLOGY QUESTIONS
We have progressed greatly in the last few decades in analyzing what microorganismsare present in the environment using culture-independent (see Section 5.6) methods, butwe have lacked an overall understanding of the microorganisms and their roles in agiven habitat or community. A new method, metagenomics, fills this gap. Metagenomicsis the analysis of an assemblage or community of microorganisms, such as microbialpopulations in a lake, using culture-independent methods to analyze the entire genomeof all population members to shed light on the nature and function of the microorganismspresent (Riesenfeld et al. 2004). In essence, metagenomics samples all the genes presentin a given environment instead of just ribosomal genes.
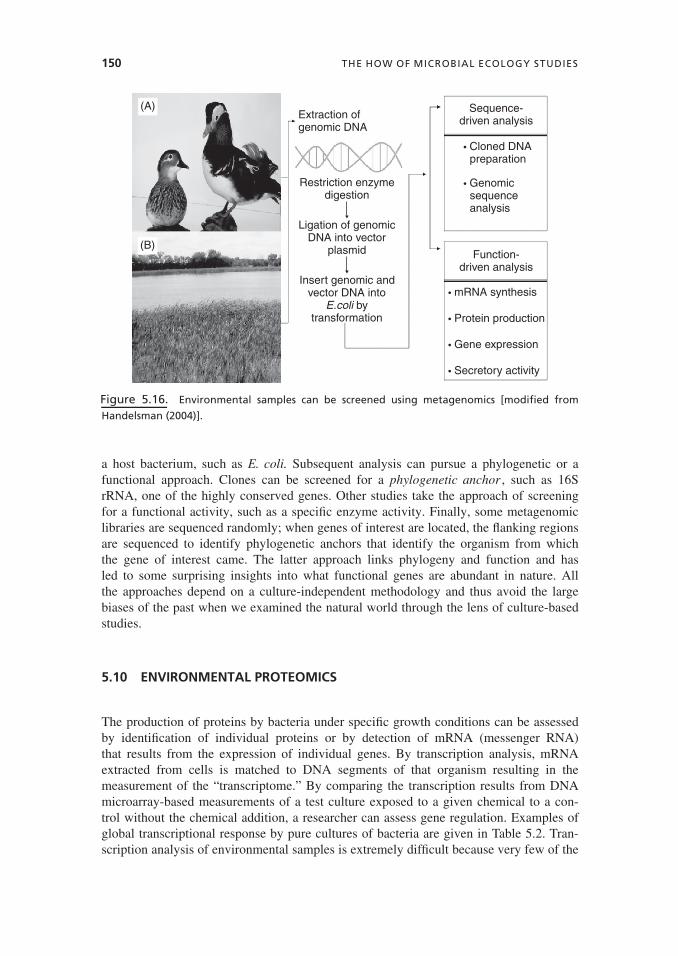
Metagenomics starts (see Figure 5.16) with the extraction of DNA from an environ-mental sample, followed by cloning of the DNA into a vector that is transofrmed into
Figure 5.15. Denaturing gradient gel electrophoresis (DGGE) allows for comparison of different
microbial communities, such as the bacterial ferromanganese deposits seen here. Each band
within a lane putatively represents one phylotype within a community and brighter bands
represent a greater presence of that phylotype. (Image courtesy of Armand Dichosa.)
150 THE HOW OF MICROBIAL ECOLOGY STUDIES
Extraction ofgenomic DNA
Sequence-driven analysis
Function-driven analysis
• Cloned DNA preparation
• mRNA synthesis
• Protein production
• Gene expression
• Secretory activity
• Genomic sequence analysis
Restriction enzymedigestion
Ligation of genomicDNA into vector
plasmid
Insert genomic andvector DNA into
E.coli bytransformation
(A)
(B)
Figure 5.16. Environmental samples can be screened using metagenomics [modified from
Handelsman (2004)].
a host bacterium, such as E. coli. Subsequent analysis can pursue a phylogenetic or afunctional approach. Clones can be screened for a phylogenetic anchor , such as 16SrRNA, one of the highly conserved genes. Other studies take the approach of screeningfor a functional activity, such as a specific enzyme activity. Finally, some metagenomiclibraries are sequenced randomly; when genes of interest are located, the flanking regionsare sequenced to identify phylogenetic anchors that identify the organism from whichthe gene of interest came. The latter approach links phylogeny and function and hasled to some surprising insights into what functional genes are abundant in nature. Allthe approaches depend on a culture-independent methodology and thus avoid the largebiases of the past when we examined the natural world through the lens of culture-basedstudies.
5.10 ENVIRONMENTAL PROTEOMICS
The production of proteins by bacteria under specific growth conditions can be assessedby identification of individual proteins or by detection of mRNA (messenger RNA)that results from the expression of individual genes. By transcription analysis, mRNAextracted from cells is matched to DNA segments of that organism resulting in themeasurement of the “transcriptome.” By comparing the transcription results from DNAmicroarray-based measurements of a test culture exposed to a given chemical to a con-trol without the chemical addition, a researcher can assess gene regulation. Examples ofglobal transcriptional response by pure cultures of bacteria are given in Table 5.2. Tran-scription analysis of environmental samples is extremely difficult because very few of the
ENVIRONMENTAL PROTEOMICS 151
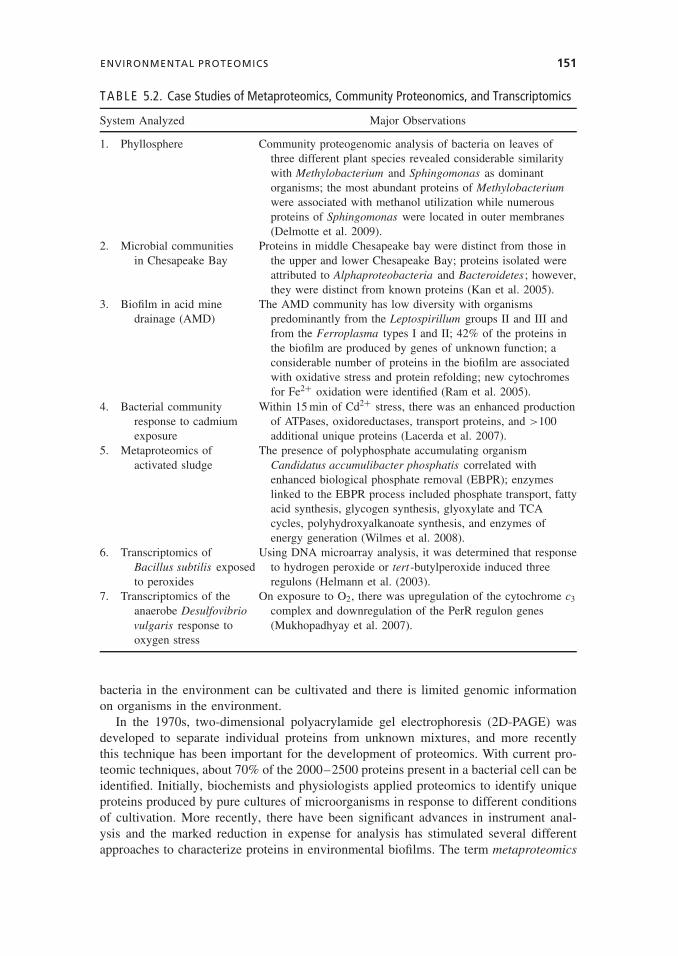
TABLE 5.2. Case Studies of Metaproteomics, Community Proteonomics, and Transcriptomics
System Analyzed Major Observations
1. Phyllosphere Community proteogenomic analysis of bacteria on leaves ofthree different plant species revealed considerable similaritywith Methylobacterium and Sphingomonas as dominantorganisms; the most abundant proteins of Methylobacteriumwere associated with methanol utilization while numerousproteins of Sphingomonas were located in outer membranes(Delmotte et al. 2009).
2. Microbial communitiesin Chesapeake Bay
Proteins in middle Chesapeake bay were distinct from those inthe upper and lower Chesapeake Bay; proteins isolated wereattributed to Alphaproteobacteria and Bacteroidetes; however,they were distinct from known proteins (Kan et al. 2005).
3. Biofilm in acid minedrainage (AMD)
The AMD community has low diversity with organismspredominantly from the Leptospirillum groups II and III andfrom the Ferroplasma types I and II; 42% of the proteins inthe biofilm are produced by genes of unknown function; aconsiderable number of proteins in the biofilm are associatedwith oxidative stress and protein refolding; new cytochromesfor Fe2+ oxidation were identified (Ram et al. 2005).
4. Bacterial communityresponse to cadmiumexposure
Within 15 min of Cd2+ stress, there was an enhanced productionof ATPases, oxidoreductases, transport proteins, and >100additional unique proteins (Lacerda et al. 2007).
5. Metaproteomics ofactivated sludge
The presence of polyphosphate accumulating organismCandidatus accumulibacter phosphatis correlated withenhanced biological phosphate removal (EBPR); enzymeslinked to the EBPR process included phosphate transport, fattyacid synthesis, glycogen synthesis, glyoxylate and TCAcycles, polyhydroxyalkanoate synthesis, and enzymes ofenergy generation (Wilmes et al. 2008).
6. Transcriptomics ofBacillus subtilis exposedto peroxides
Using DNA microarray analysis, it was determined that responseto hydrogen peroxide or tert -butylperoxide induced threeregulons (Helmann et al. (2003).
7. Transcriptomics of theanaerobe Desulfovibriovulgaris response tooxygen stress
On exposure to O2, there was upregulation of the cytochrome c3
complex and downregulation of the PerR regulon genes(Mukhopadhyay et al. 2007).
bacteria in the environment can be cultivated and there is limited genomic informationon organisms in the environment.
In the 1970s, two-dimensional polyacrylamide gel electrophoresis (2D-PAGE) wasdeveloped to separate individual proteins from unknown mixtures, and more recentlythis technique has been important for the development of proteomics. With current pro-teomic techniques, about 70% of the 2000–2500 proteins present in a bacterial cell can beidentified. Initially, biochemists and physiologists applied proteomics to identify uniqueproteins produced by pure cultures of microorganisms in response to different conditionsof cultivation. More recently, there have been significant advances in instrument anal-ysis and the marked reduction in expense for analysis has stimulated several differentapproaches to characterize proteins in environmental biofilms. The term metaproteomics
152 THE HOW OF MICROBIAL ECOLOGY STUDIES
is used to characterize all of the proteins collectively produced by organisms in anenvironmental system (Wilmes and Bond 2006), and the goal of metaproteomics is tounderstand the functional and metabolic contributions of microbial species in a complexenvironmental community. Currently, several specialized technologies are being devel-oped, including community proteomics and community proteogenomics (Verberkmoeset al. 2009). Environmental proteomics is a general designation referring to analysis ofall of the proteins present in an environmental sample without regard to biological origin.Community proteomics focuses on identifying proteins produced by a specific microbialspecies, and obviously this is most applicable when only a few species are dominant inthe environment. Community protogenomics is an extension of community proteomicsto include protein production correlated with species variation and evolutionary devel-opment. Assessment of proteins in the environment involves three activities: collectionof proteins, analysis of separated peptides, and identification of proteins. Environmentalsamples may be small (e.g., 10 mL), and if the sample contains minerals or humus, specialprocedures are used to ensure extraction of all proteins present. Generally the bacteria inthe sample are disrupted to release cellular proteins, and in some instances, procedures areused for fractionation of cellular proteins into extracellular proteins, cytoplasmic proteins,and membrane-bound proteins (Banfield et al. 2005). Individual proteins are separatedfrom the sample by either 2D-PAGE or multidimensional liquid chromatography (LC).Isolated proteins are digested by trypsin and the resulting peptides are analyzed by massspectrometry (MS). Identification of proteins is accomplished by matching the identi-fied amino acid composition of peptides with known proteins using dual (tandem) massspectrometry (MS/MS). A detailed report including methodology for environmental pro-teomics has been published by Keller and Hettich (2009). There is considerable interestin developing rapid processing of protein samples for analysis including developmentof chip-based methods. As reviewed by Verberkmoes et al. (2009), several communi-ties have been examined by proteome analysis, and results of some of these studies areprovided in Table 5.2.
5.11 STABLE-ISOTOPE STUDIES
Elements of biological importance have multiple forms of stable isotopes, and theseisotopic forms do not change because of radioactive decay. As can be seen from thelisting in Table 5.3 of stable isotopes for light elements important in microbial ecology,one isotopic form is dominant for each element. The distribution of isotopic forms ofeach element varies with the substance measured (e.g., air, water, plants, animals, rocks)and this variation is attributed to thermodynamic and kinetic characteristics reflectingdifferences in masses of the element. Using carbon as an example, the isotope abundancein a sample is expressed as follows:
δ13C(‰) =( 13C/12C ratiosample
13C/12C ratiostandard− 1
)× 1000
Since the delta values are small, the multiplication by 1000 produces values that areexpressed as parts per thousand (δ). Stable isotope analysis has been used for manyyears for dating of biological deposits and to assess global nutrient cycles of nitrogen orcarbon. Stable isotopes of N, Se, S, and other redox-active elements have been used to
STABLE-ISOTOPE STUDIES 153
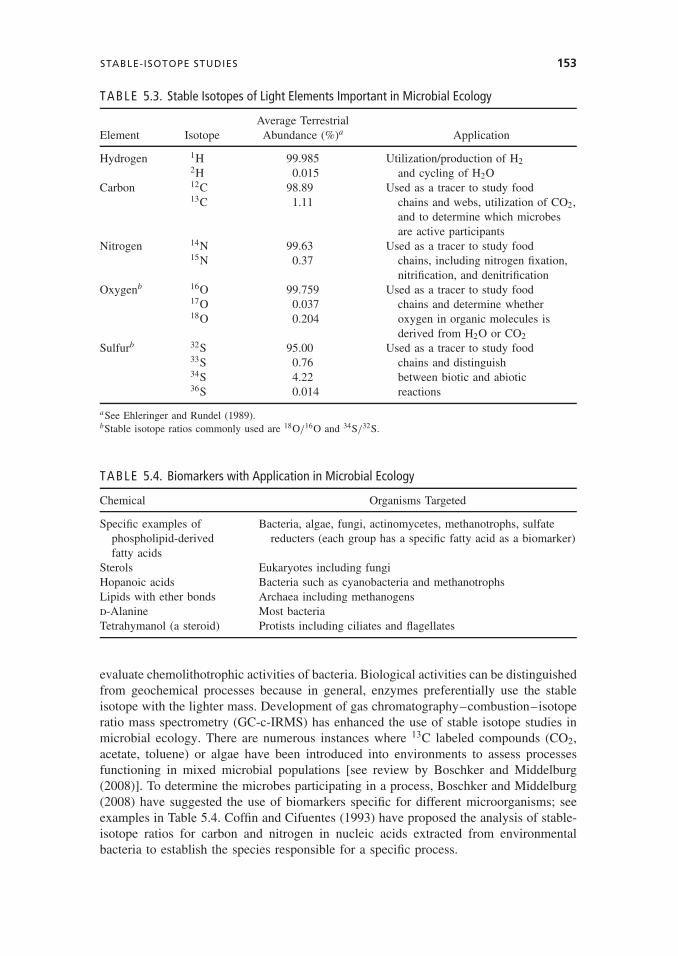
TABLE 5.3. Stable Isotopes of Light Elements Important in Microbial Ecology
Average TerrestrialElement Isotope Abundance (%)a Application
Hydrogen 1H 99.985 Utilization/production of H22H 0.015 and cycling of H2O
Carbon 12C 98.89 Used as a tracer to study food13C 1.11 chains and webs, utilization of CO2,
and to determine which microbesare active participants
Nitrogen 14N 99.63 Used as a tracer to study food15N 0.37 chains, including nitrogen fixation,
nitrification, and denitrificationOxygenb 16O 99.759 Used as a tracer to study food
17O 0.037 chains and determine whether18O 0.204 oxygen in organic molecules is
derived from H2O or CO2
Sulfurb 32S 95.00 Used as a tracer to study food33S 0.76 chains and distinguish34S 4.22 between biotic and abiotic36S 0.014 reactions
aSee Ehleringer and Rundel (1989).bStable isotope ratios commonly used are 18O/16O and 34S/32S.
TABLE 5.4. Biomarkers with Application in Microbial Ecology
Chemical Organisms Targeted
Specific examples ofphospholipid-derivedfatty acids
Bacteria, algae, fungi, actinomycetes, methanotrophs, sulfatereducters (each group has a specific fatty acid as a biomarker)
Sterols Eukaryotes including fungiHopanoic acids Bacteria such as cyanobacteria and methanotrophsLipids with ether bonds Archaea including methanogensd-Alanine Most bacteriaTetrahymanol (a steroid) Protists including ciliates and flagellates
evaluate chemolithotrophic activities of bacteria. Biological activities can be distinguishedfrom geochemical processes because in general, enzymes preferentially use the stableisotope with the lighter mass. Development of gas chromatography–combustion–isotoperatio mass spectrometry (GC-c-IRMS) has enhanced the use of stable isotope studies inmicrobial ecology. There are numerous instances where 13C labeled compounds (CO2,acetate, toluene) or algae have been introduced into environments to assess processesfunctioning in mixed microbial populations [see review by Boschker and Middelburg(2008)]. To determine the microbes participating in a process, Boschker and Middelburg(2008) have suggested the use of biomarkers specific for different microorganisms; seeexamples in Table 5.4. Coffin and Cifuentes (1993) have proposed the analysis of stable-isotope ratios for carbon and nitrogen in nucleic acids extracted from environmentalbacteria to establish the species responsible for a specific process.
154 THE HOW OF MICROBIAL ECOLOGY STUDIES
30
15
Movile Cavegrazers
Movile Cavecarnivores
Limanu Cave
Surfaceterrestrial
Surfaceaquatic
Hand-evacuatedwell
Movile Cave producers
0
–15
–45 –35 –25
δ 13C (per ml)
δ 15
N (
per
ml)
–15
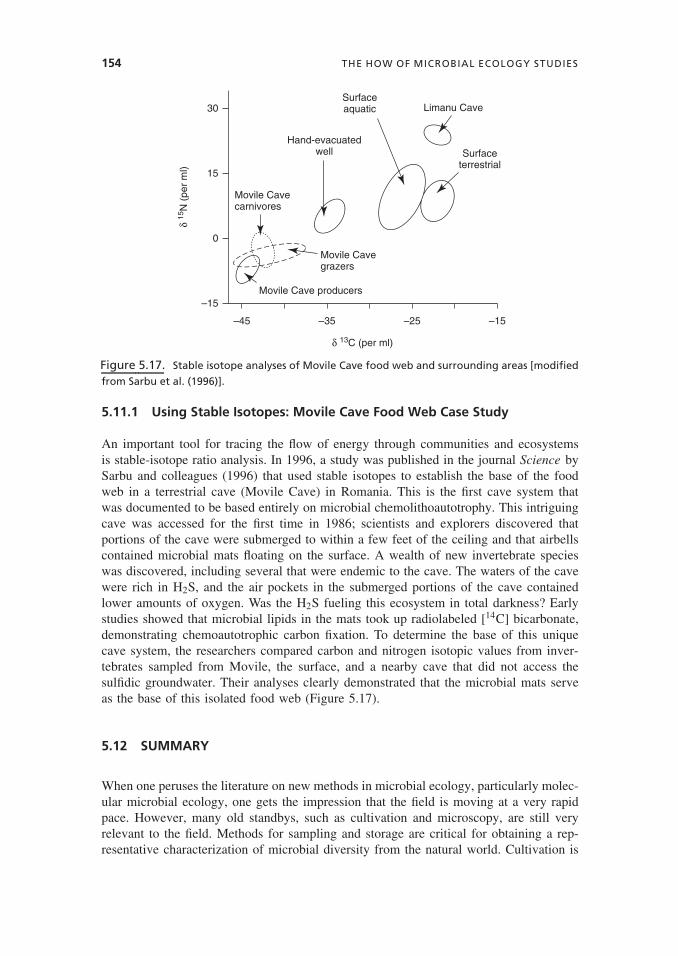
Figure 5.17. Stable isotope analyses of Movile Cave food web and surrounding areas [modified
from Sarbu et al. (1996)].
5.11.1 Using Stable Isotopes: Movile Cave Food Web Case Study
An important tool for tracing the flow of energy through communities and ecosystemsis stable-isotope ratio analysis. In 1996, a study was published in the journal Science bySarbu and colleagues (1996) that used stable isotopes to establish the base of the foodweb in a terrestrial cave (Movile Cave) in Romania. This is the first cave system thatwas documented to be based entirely on microbial chemolithoautotrophy. This intriguingcave was accessed for the first time in 1986; scientists and explorers discovered thatportions of the cave were submerged to within a few feet of the ceiling and that airbellscontained microbial mats floating on the surface. A wealth of new invertebrate specieswas discovered, including several that were endemic to the cave. The waters of the cavewere rich in H2S, and the air pockets in the submerged portions of the cave containedlower amounts of oxygen. Was the H2S fueling this ecosystem in total darkness? Earlystudies showed that microbial lipids in the mats took up radiolabeled [14C] bicarbonate,demonstrating chemoautotrophic carbon fixation. To determine the base of this uniquecave system, the researchers compared carbon and nitrogen isotopic values from inver-tebrates sampled from Movile, the surface, and a nearby cave that did not access thesulfidic groundwater. Their analyses clearly demonstrated that the microbial mats serveas the base of this isolated food web (Figure 5.17).
5.12 SUMMARY
When one peruses the literature on new methods in microbial ecology, particularly molec-ular microbial ecology, one gets the impression that the field is moving at a very rapidpace. However, many old standbys, such as cultivation and microscopy, are still veryrelevant to the field. Methods for sampling and storage are critical for obtaining a rep-resentative characterization of microbial diversity from the natural world. Cultivation is
BIBLIOGRAPHIC SOURCES 155
still necessary to reveal some diversity and is also necessary to understand the wholeorganism and its physiology. Metagenomics, proteomics, and other “omics” also arehelping to elucidate functions that microorganisms play in ecosystems. New sequencingtechnologies are revealing even more of the diversity in the microbial world. As newmethodologies come on line, our understanding of the microbial world will increase.
5.13 DELVING DEEPER: CRITICAL THINKING QUESTIONS
1. Compare and contrast the techniques that you would use to answer the question ofwho’s home in an environment versus what the microorganisms present are doingfunctionally.
2. If you have limited funds with which to investigate the microbial community of agiven habitat, what techniques would you choose to use?
3. When sampling in soil environments, what size and how many samples should betaken per site in general? What are the dangers in storing the samples improperly?
4. What information does culturing microorganisms give you that genetic sequencedata do not?
5. Electron microscopy can be very useful in answering what kinds of questions inmicrobial ecology?
6. In what kinds of studies is stable isotope analysis particularly useful?
BIBLIOGRAPHIC SOURCES
Further Reading
Amy PS, Halderman DL, eds. (1997), The Microbiology of the Terrestrial Deep Subsurface, BocaRaton, FL: CRC Lewis Press.
Burlage RS, Atlas R, Stahl D, Geesey G, Sayler G, eds. (1998), Techniques in Microbial Ecology ,New York: Oxford University Press.
Fredrickson JK, Fletcher M, eds. (2001), Subsurface Microbiology and Biogeochemistry , NewYork: Wiley-Liss.
Hurst CJ, Knudsen GR, McInerney MJ, Stetzenbach LD, Walter MV, eds. (1997), Manual ofEnvironmental Microbiology , Washington, DC: ASM Press.
Kemp PF, Sherr BF, Sherr EB, Cole JJ (1993), Aquatic Microbial Ecology , Boca Raton, FL: LewisPublishers.
Levin MA, Seidler RJ, Rogul M, eds. (1992), Microbial Ecology Principles, Methods and Appli-cations , New York: McGraw-Hill.
Madigan MT, Mrtinko JM, Dunlap PV, Clark DP (2009), Brock Biology of Microorganisms , 12thed., San Francisco: Pearson Benjamin Cummings.
Munn CB (2004), Marine Microbiology—Ecology and Applications , New York: BIOS ScientificPublishers.
Stewart-Tull DES, Dennis PJ, Godfree AF, eds. (1999), Aquatic Microbiology , Oxford, UK: Black-well Sciences.
156 THE HOW OF MICROBIAL ECOLOGY STUDIES
Cited References
Amann RI, Ludwig W, Schleifer KH (1995), Phylogenetic identification and in situ detection ofindividual microbial cells without cultivation, Microbiol. Rev . 59:143–169.
Amann R, Fuchs BM (2008), Single-cell identification in microbial communities by improvedfluorescence in situ hybridization techniques, Nature Rev. Microbiol . 6:339–348.
Banfield JF, Verberkmoes NC, Hettich RL, Thelen MP (2005), Proteogenomic approaches forthe molecular characterization of natural microbial communities, OMICS–J. Integrative Biol9:301–334.
Bolter M, Bloem J, Meiners K, Moller R (2002), Enumeration and biovolume determination ofmicrobial cells—a methodological review and recommendations for applications in ecologicalresearch, Biol. Fertil. Soils 36:249–259.
Boschker HTS, Middelburg JJ (2008), Stable isotopes and biomarkers in microbial ecology, FEMSMicrobial Ecol . 40:85–95.
Buckley DH, Graber JR, Schmidt TM (1998), Phylogenic analysis of nonthermophylic members ofthe kingdom Crenarchaeota and their diversity and abundance in soils, Appl. Environ. Microbiol .64:4333–4339.
Buckley DH, Schmidt TM (2002), Exploring the biodiversity of soil—A microbial rain forest, inStaley JT, Reysenbach A-L, eds., Biodiversity of Microbial Life, New York: Wiley-Liss, pp.183–234.
Coffin RB, Cifuentes LA (1993), Approaches for measuring stable carbon and nitrogen isotopes,in Kemp PF, Sherr BF, Sherr EB, Cole JJ, eds., Aquatic Microbial Ecology , Boca Raton, FL:Lewis Publishers, pp. 663–675.
Creach V, Baudoux AC, Bertru G, Le Rouzic B (2003), Direct estimate of active bacteria: CTCuse and limitations, J. Microbiol. Methods 52:19–28.
Delmotte N, Knief C, Chaffron S, Innerebner G, Roschitzki B, Schlapbach R, von Mering C, VorholtJA (2009), Community proteogenomics reveals insight into the physiology of phyllospherebacteria, Proc. Natl. Acad. Sci . (USA) 106:16428–16433.
Donachie SP, Foster JS, Brown MV (2007), Culture clash: Challenging the dogma of microbialdiversity, Int. Soc. Microbial Ecol. J . 1:97–99.
Ehleringer JR, Rundel PW (1989), Stable isotopes: History, units and instrumentation, in Run-del RW, Ehleringer JR, Nagy KA, eds., Stable Isotopes in Ecological Research, New York:Springer-Verlag, pp. 1–19.
Garland JL (1997), Analysis and interpretation of community-level physiological profiles in micro-bial ecology, FEMS Microbiol. Ecol . 24:289–300.
Giovannoni SJ, DeLong, EF, Schmidt TM, Pace, NR (1990), Tangential flow filtration andpreliminary phylogenetic analysis of marine picoplankton, Appl. Environ. Microbiol . 56:2572–2575.
Giovannoni S, Stingl U (2007), The importance of culturing bacterioplankton in the “omics” age,Nature Rev. Microbiol . 5:820–826.
Gomez RB, Lima FV, Ferrer AS (2006), The use of respiration indices in the composting process:A review, Waste Manage. Res . 24:37–47.
Grundmann LG, Gourbiere F (1999), A micro-sampling approach to improve the inventory ofbacterial diversity in soil, Appl. Soil Ecol . 13:123–126.
Handelsman J (2004), Metagenomics: application of genomics to uncultured microorganisms, Micr-biol Mol. Biol. Rev . 68:669–685.
Helmann JD, Wu MFW, Gaballa A, Kobel PA, Morshedi MM, Fawcett P, Paddon C (2003), Theglobal transcriptional response of Bacillus subtilis to peroxide stress is coordinated by threetranscription factors, J. Bacteriol . 185:243–253.
BIBLIOGRAPHIC SOURCES 157
Kan J, Hanson TE, Ginter JM, Wang K, Chen F (2005), Metaproteomic analysis of ChesapeakeBay microbial communities, Saline Syst . 1:7–19.
Katsoulis J, Heitz-Mayfield LJR, Weibel M, Hirschi R, Lang NP, Persson GR (2005), Impactof sample storage on detection of periodontal bacteria, Oral Microbiol. Immunol . 20:128–130.
Keller M, Hettich R (2009), Environmental proteomics: A paradigm shift in characterizing micro-bial activities at the molecular level, Microbiol. Molec. Biol. Rev . 73:62–70.
Lacerda CMR, Choe LH, Reardon KF (2007), Metaproteomic analysis of bacterial communityresponse to cadmium exposure, J. Proteome Res . 6:1145–1152.
Leadbetter Jr (2003), Cultivation of recalcitrant microbes: Cells are alive, well and revealing theirsecrets in the 21st century laboratory, Curr. Opin. Microbiol . 6:274–281.
Logue JB, Burgmann H, Robinson CT (2008), Progress in the ecological genetics and biodiversityof freshwater bacteria, Bioscience 58:103–113.
Madigan MT, Mrtinko JM, Dunlap PV, Clark DP (2009), Brock Biology of Microorganisms , 12thed., San Francisco: Pearson Benjamin Cummings.
Mukhopadhyay A, Redding AM, Joachimiak MP, Arkin AP, Borglin SE, Dehal PS, ChakrabortyR, Geller JT, Hazen TC, He Q, Joyner DC, Martin VJJ, Wall JD, Yang ZK, Zhou J, Keasling JD(2007), Cell-wide responses to low-oxygen exposure in Desulfovibrio vulgaris Hildenborough,J. Bacteriol . 189:5996–6010.
Muller SA, Aebi U, Engel A (2008), What transmission electron microscopes can visualize nowand in the future, J. Struct. Biol . 163:235–245.
Nocker A, Burr M, Camper AK (2007), Genotypic microbial community profiling: A criticaltechnical review, Microbial Ecol . 54:276–289.
Pace NR, Stahl DA, Lane DJ, Olsen GJ (1986), The analysis of natural microbial populations byribosomal RNA sequences, Adv. Microbial Ecol . 9:1–55.
Pascaud A, Amellal S, Soulas ML, Soulas G (2009), A fluorescence-based assay for measuringthe viable cell concentration of mixed microbial communities in soil, J. Microbiol. Methods76:81–87.
Ram RJ, Verberkmoes NC, Thelen MP, Tyson GW, Baker BJ, Blake RC 2nd, Shah M, Het-tich RL, Banfield JF (2005), Community proteomics of a natural microbial biofilm, Science308:1915–1920.
Ranjard L, Lejon DPH, Mougel C, Schehrer L, Merdinoglu D, Chaussod R (2003), Samplingstrategy in molecular microbial ecology: Influence of soil sample size on DNA fingerprintinganalysis of fungal and bacterial communities, Environ. Microbiol. 5:1111–1120.
Reysenbach A-L, Liu Y, Banta AB, Beveridge TJ, Kirshtein JD, Schouten S, Tivey MK, Von DammKL, Voytek MA (2006), A ubiquitous thermoacidophilic archaeon from deep-sea hydrothermalvents, Nature 442:442–447.
Riesenfeld CS, Schloss PD, Handelsman J (2004), Metagenomics: Genomic analysis of microbialcommunities, Annu. Rev. Genet . 38:525–552.
Sarbu SM, Kane TC, Kinkle BK (1996), A chemoautotrophically based cave ecosystem, Science272:1953–1955.
Schloss PD, Handelsman J (2005), Introducing DOTUR, a computer program for definingoperational taxonomic units and estimating species richness, Appl. Environ. Microbiol .71:1501–1506.
Staley JT, Konopka A (1985), Measurement of in situ activities of non-photosynthetic microor-ganisms in aquatic and terrestrial habitats, Annu. Rev. Ecol. Syst . 39:321–346.
Torsvik V, Goksoyr J, Daae FL (1990), High diversity in DNA of soil bacteria, Appl. Environ.Microbiol . 61:218–221.
158 THE HOW OF MICROBIAL ECOLOGY STUDIES
Tringe SG, Hugenholtz P (2008), A renaissance for the pioneering 16S rRNA gene, Curr. Opin.Microbiol . 11:442–446.
Verberkmoes NC, Denef VJ, Hettich RL, Banfield JF (2009), Functional analysis of natural micro-bial consortia using community proteomics, Nature Microbiol. Rev . 7:196–205.
Wilmes P, Bond PL (2006), Metaprotemics studying functional gene expression in microbialecosystems, Trends Microbiol . 4:92–97.
Wilmes P, Wexler M, Bond PL (2008), Metaproteomics provides functional insight into activatedsludge wastewater treatment, PLoS ONE 3: e1778.
Winding A, Hund-Rinke K, Rutgers M (2005), The use of microorganisms in ecological soilclassification and assessment concepts, Ecotoxicol. Environ. Safety 62:230–248.
Woese CR, Fox GE (1977), Phylogenetic structure of the prokaryotic domain: The primary king-doms, Proc. Natl. Acad. Sci . (USA) 74:5088–5909.
Xue D, Yao H-Y, Ge D-Y, Huang C-Y (2008), Soil microbial community structure in diverseland use systems: A comparative study using Biolog, DGGE, and PLFA analyses, Pedosphere18:653–663.
Internet Sources
http://www.phylo.org/ Cyberinfrastructure for Phylogenetic Research.
http://www.treebase.org/treebase/home.html TreeBASE: A Database of PhylogeneticKnowledge.
http://www.microbial-ecology.net/probebase/ An Online Resource for rRNA-TargetedOligonucleotide Probes .
http://tolweb.org/tree/ Tree of Life Web Project
http://www.mothur.org/wiki/Main Page The Microbiome Ecology Laboratory StatisticalTools for Microbial Ecology .