microbial community dynamics associated with biomass granulation in low-temperature (15 °c)...
TRANSCRIPT
Bioresource Technology 101 (2010) 6336–6344
Contents lists available at ScienceDirect
Bioresource Technology
journal homepage: www.elsevier .com/locate /bior tech
Microbial community dynamics associated with biomass granulationin low-temperature (15 �C) anaerobic wastewater treatment bioreactors
Joe O’Reilly a, Changsoo Lee a,1, Fabio Chinalia b, Gavin Collins c,d, Thérèse Mahony a, Vincent O’Flaherty a,d,*
a Microbial Ecology Laboratory, Microbiology – School of Natural Sciences and Environmental Change Institute, National University of Ireland, Galway, University Road,Galway, Irelandb Centre for Resource Management and Efficiency, School of Applied Science, Cranfield University, College Road, Cranfield, Bedfordshire MK43 0AL, UKc Microbial Ecophysiology Research Group, Microbiology – School of Natural Sciences and Environmental Change Institute, National University of Ireland, Galway, UniversityRoad, Galway, Irelandd Bioenergy Research Group, Energy Research Centre, Environmental Change Institute, National University of Ireland, Galway, University Road, Galway, Ireland
a r t i c l e i n f o
Article history:Received 11 November 2009Received in revised form 5 March 2010Accepted 10 March 2010Available online 7 April 2010
Keywords:Anaerobic granulesDGGELow-temperature anaerobic digestionMethanogensQuantitative PCR
0960-8524/$ - see front matter � 2010 Elsevier Ltd. Adoi:10.1016/j.biortech.2010.03.049
* Corresponding author at: Microbial Ecology Laborof Natural Sciences and Environmental Change InstIreland, Galway, University Road, Galway, Ireland. Tel91 494598.
E-mail address: [email protected] (V1 Present address: Division of Environmental and W
School of Civil and Environmental Engineering, NanyanNanyang Avenue, Singapore 639798, Singapore.
a b s t r a c t
Granular biofilms underpin the operation of several categories of anaerobic wastewater treatment biore-actors. Recent studies have demonstrated the feasibility of treating both industrial and domestic waste-waters at their discharge temperatures (usually <18 �C), thereby avoiding the heating expenses ofmesophilic (20–45 �C) or thermophilic (45–65 �C) treatments. Previous low-temperature trials used mes-ophilic inocula and little information is available on the viability of low-temperature anaerobic granula-tion. Six laboratory-scale, expanded granular sludge bed bioreactors (R1–6) were operated at 15 �C (R1–2and R4–5) and 37 �C (R3 and R6). R1–3 were fed glucose-based wastewater and R4–6 were fed volatilefatty acid-based wastewater. Quantitative real-time PCR and qualitative denaturing gradient gel electro-phoresis of 16S rRNA genes identified the dominance of Methanomicrobiales (mainly Methanocorpuscu-lum-like organisms) during low-temperature granulation. Granulation only occurred in glucose-fedbioreactors. The results suggest that (i) granulation is feasible in low-temperature bioreactors; (ii) carbo-hydrate decomposition likely favoured granulation, (iii) Methanocorpusculum-like organisms play a crit-ical role in low-temperature granulation.
� 2010 Elsevier Ltd. All rights reserved.
1. Introduction
Anaerobic digestion (AD) is an increasingly popular treatmentoption for both domestic and industrial wastewaters. AD confersseveral advantages over traditional treatments, including the (i)elimination of costly aeration processes and (ii) production of en-ergy in the form of methane (Liu et al., 2003; McCarty, 2001).Wastewater carbon is converted to biogas through a series of inter-linked processes involving phylogenetically- and functionally-dis-tinct microbial groups (Batstone et al., 2004). Anaerobic granularbiofilms form by the self-immobilisation of those diverse groupsin response to bioreactor operating conditions, such as liquid up-flow velocity and associated shear forces. The high biomass con-centration and optimal organisation of microbial trophic groups
ll rights reserved.
atory, Microbiology – Schoolitute, National University of.: +353 91 493734; fax: +353
. O’Flaherty).ater Resources Engineering,
g Technological University, 50
in anaerobic sludge granules, facilitates applied organic loadingrates in excess of 50 kg chemical oxygen demand (COD) m�3 d�1
and underpinned the development of several categories of high-rate anaerobic wastewater treatment systems (Hulshoff Pol et al.,2004).
Full-scale AD plants are mainly operated within the mesophilic(24–45 �C) or thermophilic (45–65 �C) temperature ranges(Lettinga et al., 2001). The majority of domestic and industrialwastewaters, however, are discharged 618 �C, thus incurring aconsiderable additional heating cost for mesophilic or thermo-philic systems (Connaughton et al., 2006). The economic attractive-ness of AD could be enhanced by treating wastewaters at theirdischarge temperature. Sub-ambient or low-temperature treat-ments were previously not considered feasible due to lower micro-bial activity, increased gas solubility and liquid viscosity (Lettingaet al., 1999; Rebac et al., 1999). Recently, several trials reported thesuccessful treatment of both real and synthetic wastewaters attemperatures as low as 4 �C, and demonstrated comparable perfor-mances to mesophilic systems (McKeown et al., 2009). However,most previous low-temperature anaerobic digestion (LTAD) stud-ies used pre-granulated, mesophilic sludge to seed anaerobic bio-reactors. Gradually, the microbial communities adapted to the
has
e3
day
255–
300
1R
2R
3R
4R
5R
6
GG
VV
V5
1537
1515
374
44
44
212
1212
1212
4±
1254
±14
76±
952
±16
61±
1380
±11
.25
1.25
1.25
1.25
1.25
1.25
465
7261
6071
238
61N
Aj
NA
j20
1.9
1.3
1.4
1.6
1.3
.92.
11.
1N
Aj
NA
j1.
2
atio
nal
phas
e.
J. O’Reilly et al. / Bioresource Technology 101 (2010) 6336–6344 6337
lower temperatures, leading to the emergence of distinct, psychro-tolerent communities (Connaughton et al., 2006; O’Reilly et al.,2009a). Psychrophilically-cultivated biomass would likely facili-tate shorter start-up times, as well as the application of higherorganic loads, improving the stability and cost-effectiveness ofLTAD (Akila and Chandra, 2007; McKeown et al., 2009). Thus, itis clear that a greater insight into the populations involved in theanaerobic granulation process, particularly under low-temperatureconditions, is required. Currently, little information is available onthe feasibility of low-temperature granulation, and its regulationby ecological and process factors is not yet understood.
In light of this, we compared the microbial community develop-ment in six expanded granular sludge bed (EGSB) bioreactors (R1–6), which were inoculated with non-granular biomass and wereused to treat synthetic glucose-based wastewater or volatile fattyacid (VFA)-based wastewater at psychrophilic or mesophilic tem-peratures. Temporal population dynamics were monitored in thesuspended and granulating biomass using a combination of quali-tative and quantitative molecular tools.
Phas
e2
day
120–
255
P
R4
R5
R6
R1
R2
R3
R4
R5
R6
R
VV
VG
GG
VV
VG
1515
3715
1537
1515
371
22
22
22
22
24
3636
3612
1212
1212
121
80±
1377
±15
84±
1764
±10
68±
973
±8
67±
1269
±11
82±
85
1.25
1.25
1.25
1.25
1.25
1.25
1.25
1.25
1.25
164
6172
6261
6767
6374
6N
Aj
NA
jN
Aj
1416
36N
Aj
NA
j10
33.
13.
11.
21.
51.
61.
21.
31.
41.
22
NA
jN
Aj
NA
j2.
41.
91
NA
jN
Aj
0.9
1
was
tew
ater
.
erm
ined
ever
y2
or3
days
(±st
anda
rdde
viat
ion
).
very
2or
3da
ys.
day
ofea
chph
ase,
mea
sure
das
prop
orti
on(%
)of
biom
ass
>1.0
mm
.es
insu
spen
ded
biom
ass,
dete
rmin
edfo
rse
edin
ocu
lum
(Ph
ase
1)an
dth
erea
fter
atth
een
dof
each
oper
esin
gran
ula
rbi
omas
s,w
asde
term
ined
atth
een
dof
each
oper
atio
nal
phas
e.
2. Methods
2.1. Bioreactor operation
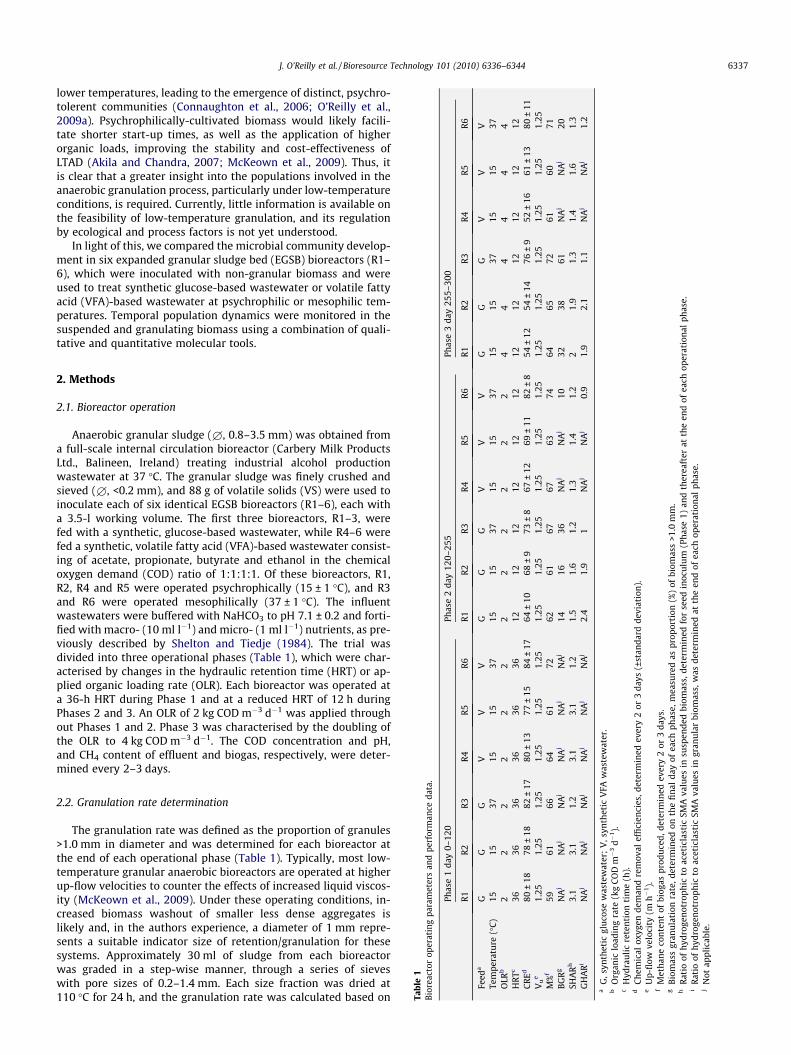
Anaerobic granular sludge (£, 0.8–3.5 mm) was obtained froma full-scale internal circulation bioreactor (Carbery Milk ProductsLtd., Balineen, Ireland) treating industrial alcohol productionwastewater at 37 �C. The granular sludge was finely crushed andsieved (£, <0.2 mm), and 88 g of volatile solids (VS) were used toinoculate each of six identical EGSB bioreactors (R1–6), each witha 3.5-l working volume. The first three bioreactors, R1–3, werefed with a synthetic, glucose-based wastewater, while R4–6 werefed a synthetic, volatile fatty acid (VFA)-based wastewater consist-ing of acetate, propionate, butyrate and ethanol in the chemicaloxygen demand (COD) ratio of 1:1:1:1. Of these bioreactors, R1,R2, R4 and R5 were operated psychrophically (15 ± 1 �C), and R3and R6 were operated mesophilically (37 ± 1 �C). The influentwastewaters were buffered with NaHCO3 to pH 7.1 ± 0.2 and forti-fied with macro- (10 ml l�1) and micro- (1 ml l�1) nutrients, as pre-viously described by Shelton and Tiedje (1984). The trial wasdivided into three operational phases (Table 1), which were char-acterised by changes in the hydraulic retention time (HRT) or ap-plied organic loading rate (OLR). Each bioreactor was operated ata 36-h HRT during Phase 1 and at a reduced HRT of 12 h duringPhases 2 and 3. An OLR of 2 kg COD m�3 d�1 was applied throughout Phases 1 and 2. Phase 3 was characterised by the doubling ofthe OLR to 4 kg COD m�3 d�1. The COD concentration and pH,and CH4 content of effluent and biogas, respectively, were deter-mined every 2–3 days.
Tabl
e1
Bior
eact
orop
erat
ing
para
met
ers
and
perf
orm
ance
data
.
Phas
e1
day
0–12
0
R1
R2
R3
Feed
aG
GG
Tem
pera
ture
(�C
)15
1537
OLR
b2
22
HR
Tc36
3636
CR
Ed80
±18
78±
1882
±17
Vu
e1.
251.
251.
25M
%f
5961
66B
GR
gN
Aj
NA
jN
Aj
SHA
Rh
3.1
3.1
1.2
GH
AR
iN
Aj
NA
jN
Aj
aG
,syn
thet
icgl
uco
sew
aste
wat
er;
V,s
ynth
etic
VFA
bO
rgan
iclo
adin
gra
te(k
gC
OD
m�
3d�
1).
cH
ydra
uli
cre
ten
tion
tim
e(h
).d
Ch
emic
alox
ygen
dem
and
rem
oval
effi
cien
cies
,det
eU
p-fl
owve
loci
ty(m
h�
1).
fM
eth
ane
con
ten
tof
biog
aspr
odu
ced,
dete
rmin
ede
gB
iom
ass
gran
ula
tion
rate
,det
erm
ined
onth
efi
nal
hR
atio
ofh
ydro
gen
otro
phic
toac
etic
last
icSM
Ava
lui
Rat
ioof
hyd
roge
not
roph
icto
acet
icla
stic
SMA
valu
jN
otap
plic
able
.
2.2. Granulation rate determination
The granulation rate was defined as the proportion of granules>1.0 mm in diameter and was determined for each bioreactor atthe end of each operational phase (Table 1). Typically, most low-temperature granular anaerobic bioreactors are operated at higherup-flow velocities to counter the effects of increased liquid viscos-ity (McKeown et al., 2009). Under these operating conditions, in-creased biomass washout of smaller less dense aggregates islikely and, in the authors experience, a diameter of 1 mm repre-sents a suitable indicator size of retention/granulation for thesesystems. Approximately 30 ml of sludge from each bioreactorwas graded in a step-wise manner, through a series of sieveswith pore sizes of 0.2–1.4 mm. Each size fraction was dried at110 �C for 24 h, and the granulation rate was calculated based on
6338 J. O’Reilly et al. / Bioresource Technology 101 (2010) 6336–6344
the proportion of biomass, measured as dry weight, in each frac-tion. Biomass fractions with diameters of <0.2 mm and >1.0 mmwere defined as suspended and granular biomass, respectively.
2.3. Specific methanogenic activity (SMA)
SMA was determined for seed sludge (day 0) and bioreactor bio-mass on days 255 and 300, using the pressure transducer tech-nique (Colleran et al., 1992). From day 255 onwards the SMA ofboth suspended and granular biomass was determined (whereapplicable). Acetate (30 mM) and H2/CO2 (80:20, v/v) were usedas direct methanogenic substrates (Coates et al., 1996; Colleranet al., 1992). SMA assays were conducted in triplicate with3 g VS l�1 per assay. The SMA assays were conducted at the operat-ing temperature of each bioreactor.
2.4. DNA extraction
Total DNA was extracted from the seed biomass and from eachbioreactor biomass on days 120, 255 and 300 using an automatednucleic acid extractor (Magtration 12 GC, PSS Co., Chiba, Japan). Foreach bioreactor (where applicable), the extraction was performedusing granular (£ > 1.0 mm) as well as suspended (£ < 0.2 mm)biomass. Prior to extraction, samples of suspended biomass wereconcentrated by centrifuging at 10,000g for 3.5 min. Each granularor suspended biomass sample (0.5 g wet weight) was finelycrushed using a mortar and pestle, and then re-suspended in50 ml of sterile double distilled water. A 100-ll aliquot of the bio-mass suspension was loaded per extraction. In parallel, the VS con-centration of each re-suspension was measured to estimate theamount of biomass used for DNA extraction. Each extraction wasperformed in duplicate and the extracted DNA was eluted inTris–HCl buffer (pH 8.0) and stored at �20 �C.
2.5. DGGE and phylogenetic analyses
Archaeal 16S rRNA gene fragments were amplified with the pri-mer set 787F-1059R (Takai and Horikoshi, 2000). Bacterial 16SrRNA genes were targeted with the primer set 338F-805R (Raskinet al., 1995). A 40-bp GC-clamp was attached at the 50-end of eachforward primer to stabilise the melting behaviour of the PCR prod-ucts (Muyzer et al., 1993). The PCR amplification was performed asfollows: initial denaturation at 95 �C for 3 min; a touch-down ther-mal cycling of denaturation at 95 �C for 1.5 min (archaeal) or 45 s(bacterial), annealing at 65–55 �C for 1.5 min (reducing 1 �C per cy-cle), and elongation at 72 �C for 1.5 min (archaeal) or 1 min (bacte-rial); an additional 20 cycles of (for archaeal or bacterial,respectively): 95 �C for 1.5 min or 45 s, 55 �C for 1.5 min or 45 s,and 72 �C for 1.5 min or 1 min; a final extension at 72 �C for4 min. A 20-ll aliquot of each PCR product was loaded onto a10% (w/v) polyacrylamide gel containing a denaturing gradient of30–60% (archaeal) or 30–70% (bacterial) (100% denaturant con-tained 7 M urea and 40% (v/v) formamide). Electrophoresis wasrun in a D-Code system (BioRad, Hercules, CA). The DGGE gelwas ethidium bromide-stained and photographed under UV trans-illumination. A binary matrix was generated by scoring the pres-ence (1) or absence (0) of each band, and then statisticallyanalyzed with non-metric multidimensional scaling (NMS) usingSorensen (Bray-Curtis) distance measurement, in PC-ORD softwareversion 5.0 (Grandin, 2006).
For further sequencing and phylogenetic analyses, bands ofinterest were excised from the gel using a sterile scalpel blade.For accurate correlation of band homology between different DGGEgels, a selection of bands were excised and sequenced from multi-ple gels. The excised bands were eluted in 25 ll of sterile water,and then re-amplified with the same primer sets (without
GC-clamp). The PCR products were gel-purified and cloned intothe TOPO TA 2.1 vector (Invitrogen, Carlsbad, CA). PCR fragmentswere sequenced using M13 primers and compared against theGenBank and RDP10 databases. A neighbour-joining tree wasconstructed using MEGA 4 software (Tamura et al., 2007). Thenucleotide sequences were deposited in the GenBank databaseunder accession numbers GQ304250-GQ304275.
2.6. Real-time PCR analysis
Quantitative real-time PCR was performed using a LightCycler480 (Roche, Mannheim, Germany) with five methanogenic primerand probe sets, specific to three orders (Methanomicrobiales, Met-hanobacteriales, and Methanococcales) and two families (Methano-saetaceae and Methanosarcinaceae) covering most methanogenspresent in anaerobic digesters (Lee et al., 2009; Yu et al., 2005).All DNA samples were analyzed with each primer and probe setin duplicate. Each reaction mixture was prepared using the Light-Cycler TaqMan Master kit (Roche): 8 ll of PCR-grade water, 1 llof the probe (final concentration 200 nM), 1 ll of each primer (finalconcentration 500 nM), 4 ll of 5� reaction solution, and 5 ll ofDNA template. Amplification was carried out using a two-stepthermal cycling protocol consisting of predenaturation for 10 minat 94 �C followed by 40 cycles of 10 s at 94 �C and 30 s at 60 �C(exception: 63 �C for Methanobacteriales-set as out lined by Yuet al. (2005).
Quantitative standard curves were constructed using the stan-dard plasmids containing the full-length 16S rRNA gene sequencesfrom the representative strains of the target methanogenic groupsas previously described (Lee et al., 2009; Yu et al., 2005). For eachprimer and probe set, an equimolar mixture of its correspondingstandard plasmids was used as the template solution for construct-ing the standard curve. The mass concentration of each plasmidwas measured in duplicate using a Qubit system (Invitrogen) andconverted into its copy concentration as previously described(Lee et al., 2009). A 10-fold serial dilution series (101–109 cop-ies ll�1 was generated for each standard solution and analyzedby real-time PCR in triplicate with its corresponding primer andprobe set. The threshold cycle (CT) values determined were plottedagainst the logarithm of their input copy concentrations. The 16SrRNA gene copy concentrations of target groups were then esti-mated against the corresponding standard curves within the linearrange (r2 > 0.995). The volume-based concentration (copies ll�1)were converted into the biomass-based concentration (copies g[VS]�1) using the VS concentration of each sludge sample usedfor the DNA extraction. In this study, the real-time PCR detec-tion limit for each primer and probe set was <107 copies g VS�1
level.
2.7. Analytical methods
Solids and COD were analyzed following the procedure in Stan-dard Methods (APHA-AWWA-WEF, 2000). Methane content wasdetermined using a Philips PYE Unicam 304 gas chromatograph(Cambridge, UK) equipped with a Propak Q packed capillary col-umn (100–120 mesh). Nitrogen was used as a carrier gas at a flowrate of 60 ml min�1. All samples were analyzed in duplicate.
3. Results and discussion
3.1. Bioreactor performance
Table 1 summarises bioreactor R1–6 operating parameters andperformance. During Phase 1, no granular biomass (£ > 1.0 mm)developed in any of the bioreactors, regardless of the operating
J. O’Reilly et al. / Bioresource Technology 101 (2010) 6336–6344 6339
temperature. Upon commencement of Phase 2, the HRT was de-creased from 36 to 12 h, and by the end of Phase 2, the granulationrates had reached 14–16% in the glucose-fed low-temperature bio-reactors R1 and 2% and 36% in the glucose-fed mesophilic R3 (Table1). Notably, Phase 2 was characterised by reduced COD removalefficiencies in R1–3 of 9–16%. However, the standard deviationsdecreased by almost half, indicating less variable COD removal(Table 1). The low-temperature VFA-fed R4 and 5 displayed a sim-ilar COD removal efficiency to R1–2, though no granulation wasobserved during this period (Table 1). The applied OLR wasincreased to 4 kg COD m�3 d�1 on day 255 (Phase 3), and the gran-ulation rates in the glucose-fed bioreactors almost doubled to 32–38% in R1–2; 61% in R3. Interestingly, throughout the trial, themost efficient COD removal of 80–84% along with the highestmethane content of 71–74%, was observed in the mesophilicallyoperated, VFA-fed, R6 (Table 1). In contrast to the glucose waste-water-fed bioreactors (R1–3), the biomass granulation rate wassignificantly lower (10% on day 255; 20% on day 300).
3.2. Methanogenic activity of biomass
The hydrogenotrophic to aceticlastic SMA ratio was consistentlyhigher in the low-temperature bioreactors and this phenomenonwas more pronounced in the bioreactors treating glucose waste-water and, in particular the granular biomass (Table 1). Interest-ingly, the highest SMA ratio of 3.1 was observed in the finelycrushed seed inoculum (£ < 0.2 mm) tested at 15 �C (Table 1). Thiswas likely due to the increased solubility and accessibility of H2/CO2 for methanogenic organisms normally present at the core ofspherical mesophilic granules (Kotsyurbenko 2005; Satoh et al.,2007).
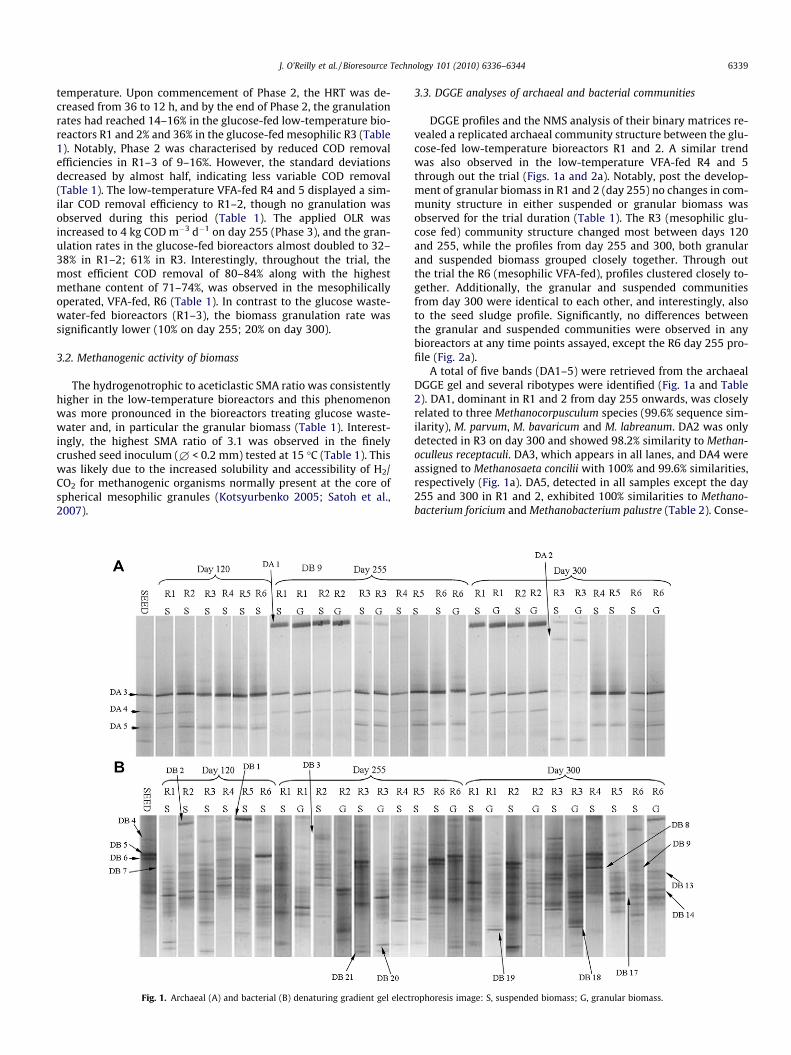
Fig. 1. Archaeal (A) and bacterial (B) denaturing gradient gel electr
3.3. DGGE analyses of archaeal and bacterial communities
DGGE profiles and the NMS analysis of their binary matrices re-vealed a replicated archaeal community structure between the glu-cose-fed low-temperature bioreactors R1 and 2. A similar trendwas also observed in the low-temperature VFA-fed R4 and 5through out the trial (Figs. 1a and 2a). Notably, post the develop-ment of granular biomass in R1 and 2 (day 255) no changes in com-munity structure in either suspended or granular biomass wasobserved for the trial duration (Table 1). The R3 (mesophilic glu-cose fed) community structure changed most between days 120and 255, while the profiles from day 255 and 300, both granularand suspended biomass grouped closely together. Through outthe trial the R6 (mesophilic VFA-fed), profiles clustered closely to-gether. Additionally, the granular and suspended communitiesfrom day 300 were identical to each other, and interestingly, alsoto the seed sludge profile. Significantly, no differences betweenthe granular and suspended communities were observed in anybioreactors at any time points assayed, except the R6 day 255 pro-file (Fig. 2a).
A total of five bands (DA1–5) were retrieved from the archaealDGGE gel and several ribotypes were identified (Fig. 1a and Table2). DA1, dominant in R1 and 2 from day 255 onwards, was closelyrelated to three Methanocorpusculum species (99.6% sequence sim-ilarity), M. parvum, M. bavaricum and M. labreanum. DA2 was onlydetected in R3 on day 300 and showed 98.2% similarity to Methan-oculleus receptaculi. DA3, which appears in all lanes, and DA4 wereassigned to Methanosaeta concilii with 100% and 99.6% similarities,respectively (Fig. 1a). DA5, detected in all samples except the day255 and 300 in R1 and 2, exhibited 100% similarities to Methano-bacterium foricium and Methanobacterium palustre (Table 2). Conse-
ophoresis image: S, suspended biomass; G, granular biomass.
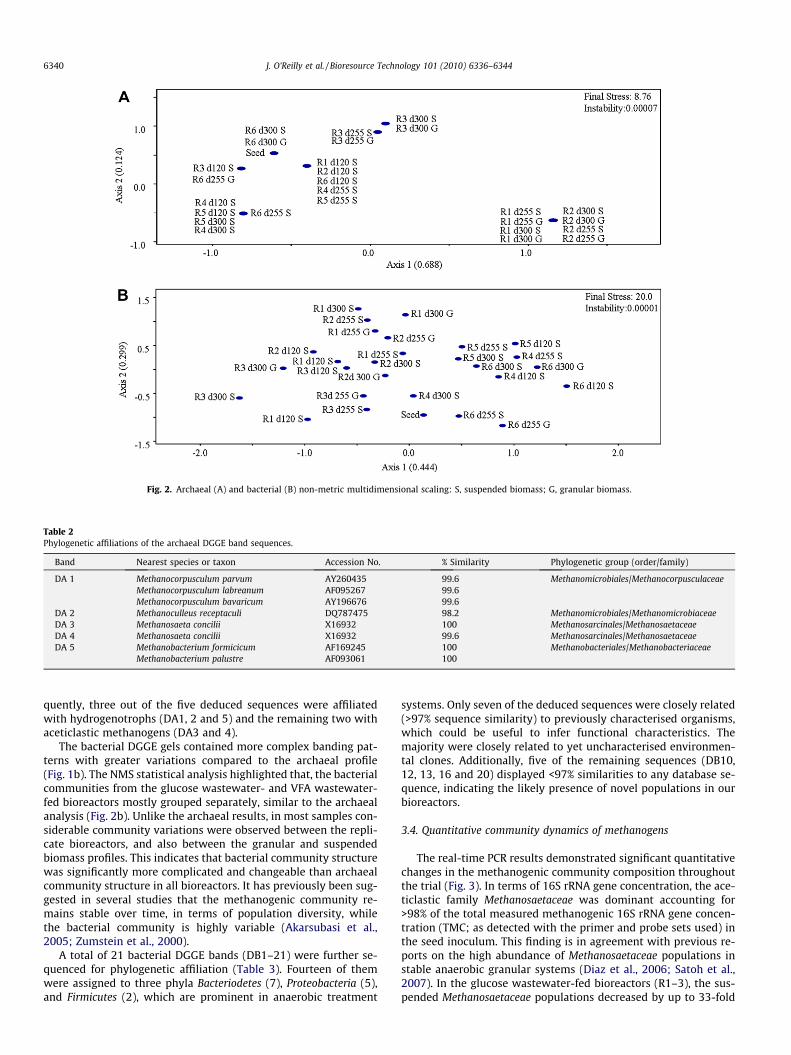
Fig. 2. Archaeal (A) and bacterial (B) non-metric multidimensional scaling: S, suspended biomass; G, granular biomass.
Table 2Phylogenetic affiliations of the archaeal DGGE band sequences.
Band Nearest species or taxon Accession No. % Similarity Phylogenetic group (order/family)
DA 1 Methanocorpusculum parvum AY260435 99.6 Methanomicrobiales/MethanocorpusculaceaeMethanocorpusculum labreanum AF095267 99.6Methanocorpusculum bavaricum AY196676 99.6
DA 2 Methanoculleus receptaculi DQ787475 98.2 Methanomicrobiales/MethanomicrobiaceaeDA 3 Methanosaeta concilii X16932 100 Methanosarcinales/MethanosaetaceaeDA 4 Methanosaeta concilii X16932 99.6 Methanosarcinales/MethanosaetaceaeDA 5 Methanobacterium formicicum AF169245 100 Methanobacteriales/Methanobacteriaceae
Methanobacterium palustre AF093061 100
6340 J. O’Reilly et al. / Bioresource Technology 101 (2010) 6336–6344
quently, three out of the five deduced sequences were affiliatedwith hydrogenotrophs (DA1, 2 and 5) and the remaining two withaceticlastic methanogens (DA3 and 4).
The bacterial DGGE gels contained more complex banding pat-terns with greater variations compared to the archaeal profile(Fig. 1b). The NMS statistical analysis highlighted that, the bacterialcommunities from the glucose wastewater- and VFA wastewater-fed bioreactors mostly grouped separately, similar to the archaealanalysis (Fig. 2b). Unlike the archaeal results, in most samples con-siderable community variations were observed between the repli-cate bioreactors, and also between the granular and suspendedbiomass profiles. This indicates that bacterial community structurewas significantly more complicated and changeable than archaealcommunity structure in all bioreactors. It has previously been sug-gested in several studies that the methanogenic community re-mains stable over time, in terms of population diversity, whilethe bacterial community is highly variable (Akarsubasi et al.,2005; Zumstein et al., 2000).
A total of 21 bacterial DGGE bands (DB1–21) were further se-quenced for phylogenetic affiliation (Table 3). Fourteen of themwere assigned to three phyla Bacteriodetes (7), Proteobacteria (5),and Firmicutes (2), which are prominent in anaerobic treatment
systems. Only seven of the deduced sequences were closely related(>97% sequence similarity) to previously characterised organisms,which could be useful to infer functional characteristics. Themajority were closely related to yet uncharacterised environmen-tal clones. Additionally, five of the remaining sequences (DB10,12, 13, 16 and 20) displayed <97% similarities to any database se-quence, indicating the likely presence of novel populations in ourbioreactors.
3.4. Quantitative community dynamics of methanogens
The real-time PCR results demonstrated significant quantitativechanges in the methanogenic community composition throughoutthe trial (Fig. 3). In terms of 16S rRNA gene concentration, the ace-ticlastic family Methanosaetaceae was dominant accounting for>98% of the total measured methanogenic 16S rRNA gene concen-tration (TMC; as detected with the primer and probe sets used) inthe seed inoculum. This finding is in agreement with previous re-ports on the high abundance of Methanosaetaceae populations instable anaerobic granular systems (Diaz et al., 2006; Satoh et al.,2007). In the glucose wastewater-fed bioreactors (R1–3), the sus-pended Methanosaetaceae populations decreased by up to 33-fold
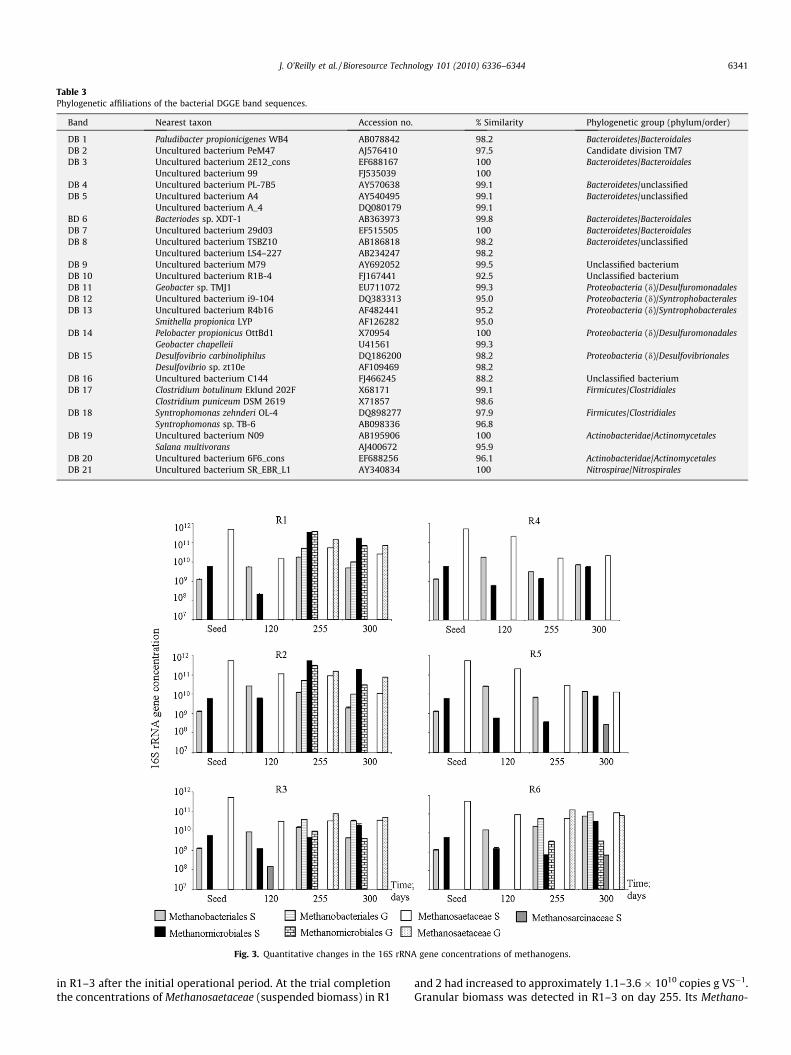
Table 3Phylogenetic affiliations of the bacterial DGGE band sequences.
Band Nearest taxon Accession no. % Similarity Phylogenetic group (phylum/order)
DB 1 Paludibacter propionicigenes WB4 AB078842 98.2 Bacteroidetes/BacteroidalesDB 2 Uncultured bacterium PeM47 AJ576410 97.5 Candidate division TM7DB 3 Uncultured bacterium 2E12_cons EF688167 100 Bacteroidetes/Bacteroidales
Uncultured bacterium 99 FJ535039 100DB 4 Uncultured bacterium PL-7B5 AY570638 99.1 Bacteroidetes/unclassifiedDB 5 Uncultured bacterium A4 AY540495 99.1 Bacteroidetes/unclassified
Uncultured bacterium A_4 DQ080179 99.1BD 6 Bacteriodes sp. XDT-1 AB363973 99.8 Bacteroidetes/BacteroidalesDB 7 Uncultured bacterium 29d03 EF515505 100 Bacteroidetes/BacteroidalesDB 8 Uncultured bacterium TSBZ10 AB186818 98.2 Bacteroidetes/unclassified
Uncultured bacterium LS4–227 AB234247 98.2DB 9 Uncultured bacterium M79 AY692052 99.5 Unclassified bacteriumDB 10 Uncultured bacterium R1B-4 FJ167441 92.5 Unclassified bacteriumDB 11 Geobacter sp. TMJ1 EU711072 99.3 Proteobacteria (d)/DesulfuromonadalesDB 12 Uncultured bacterium i9-104 DQ383313 95.0 Proteobacteria (d)/SyntrophobacteralesDB 13 Uncultured bacterium R4b16 AF482441 95.2 Proteobacteria (d)/Syntrophobacterales
Smithella propionica LYP AF126282 95.0DB 14 Pelobacter propionicus OttBd1 X70954 100 Proteobacteria (d)/Desulfuromonadales
Geobacter chapelleii U41561 99.3DB 15 Desulfovibrio carbinoliphilus DQ186200 98.2 Proteobacteria (d)/Desulfovibrionales
Desulfovibrio sp. zt10e AF109469 98.2DB 16 Uncultured bacterium C144 FJ466245 88.2 Unclassified bacteriumDB 17 Clostridium botulinum Eklund 202F X68171 99.1 Firmicutes/Clostridiales
Clostridium puniceum DSM 2619 X71857 98.6DB 18 Syntrophomonas zehnderi OL-4 DQ898277 97.9 Firmicutes/Clostridiales
Syntrophomonas sp. TB-6 AB098336 96.8DB 19 Uncultured bacterium N09 AB195906 100 Actinobacteridae/Actinomycetales
Salana multivorans AJ400672 95.9DB 20 Uncultured bacterium 6F6_cons EF688256 96.1 Actinobacteridae/ActinomycetalesDB 21 Uncultured bacterium SR_EBR_L1 AY340834 100 Nitrospirae/Nitrospirales
Fig. 3. Quantitative changes in the 16S rRNA gene concentrations of methanogens.
J. O’Reilly et al. / Bioresource Technology 101 (2010) 6336–6344 6341
in R1–3 after the initial operational period. At the trial completionthe concentrations of Methanosaetaceae (suspended biomass) in R1
and 2 had increased to approximately 1.1–3.6 � 1010 copies g VS�1.Granular biomass was detected in R1–3 on day 255. Its Methano-
6342 J. O’Reilly et al. / Bioresource Technology 101 (2010) 6336–6344
saetaceae concentration varied over time in R1 and 2 while it wasmaintained at around 1 � 1011 copies g VS�1 for the trial durationin R3. On the other hand, in R4 and 5, the suspended Methanosaet-aceae population gradually declined to 1.3–2.2 � 1010 cop-ies g VS�1 with no significant fluctuations. In R6, it decreased 5-fold by day 120 and remained at approximately 1 � 1011 cop-ies g VS�1 thereafter. A similar concentration was observed in theR6 granular biomass from day 255 onwards (Fig. 3).
A second aceticlastic family, Methanosarcinaceae, was detectedonly in the suspended biomass samples from R5 and 6, at relativelylow concentrations of 2.7–6.7 � 108 copies g VS�1, at the end ofPhase 3 (day 300). Notably, this phase was characterised by thedoubling of the OLR to 4 kg COD m�3 d�1 (Table 1), which likely re-sulted in an increased residual acetate concentration favoured byMethanosarcinaceae populations (Boone et al., 2001).
The populations of Methanobacteriales in the suspended bio-mass increased significantly in all bioreactors by 1.5–7.5-fold dur-ing the first 120 days. After which, it was roughly maintainedwithin 109–1010 copies g VS�1 in all bioreactors. Notably wheregranular biomass was detected, a higher concentration of Methan-obacteriales was observed in the granular relative to the suspendedbiomass (Fig. 3). It remained fairly constant, except for a decreaseon day 300 in R1 and 2 to 1.0 � 1010 copies g VS�1 and a rise on day300 in R6 to 1.3 � 1011 copies g VS�1.
The hydrogen utilising methanogenic order Methanomicrobi-ales, was present in the seed biomass at a concentration of5.8 � 109 copies g VS�1. Its population in the suspended biomassremained at or under the initial concentration throughout the trialin R3–6, except at the trial conclusion where concentrations of2.0 � 1010 and 4.0 � 1010 copies g VS�1, were observed in R3 and6, respectively (Fig. 3). By contrast, the increase and dominanceof Methanomicrobiales, in the low-temperature, glucose wastewa-ter fed, R1 and 2 coincided with the detection of granular biomass.In both bioreactors, its 16S rRNA gene concentration in the sus-pended biomass increased up to 3.6–5.2 � 1011 copies g VS�1 onday 255, which is >1700-fold higher than its minimum concentra-tion on day 120 (Fig. 3). The high abundance of Methanomicrobialesin R1 and 2 was also observed in the granular profiles, with con-centrations of 3.0 � 1010 to 4.0 � 1011 copies g VS�1, from day255 onwards. Notably, it was one of the least abundant methano-genic groups (<9.6 � 109 copies g VS�1) detected in the granularbiomass of the mesophilically operated R3 and 6. These findings,together with the granulation assays (Table 1), suggest that Met-hanomicrobiales populations may have been significantly involvedin the mechanism of psychrophilic biomass granulation in R1and 2 (Fig. 3).
Among the five target methanogenic groups, the order Methan-ococcales was not detected in our experimental trial. This is likelydue to the requirement of high salt concentration for growth(0.3–9.4% (w/v) NaCl) (Boone et al., 2001).
4. Discussion
The replicate low-temperature bioreactors, glucose-fed R1–2and VFA-fed R4–5, displayed similar performance levels (Table1), and the methanogenic community composition was qualita-tively and quantitatively comparable between the replicates. Theseresults imply that the low-temperature bioreactors were reproduc-ible in terms of methanogenic community dynamics as well as sys-tem performance. High COD removal efficiency of 77–84% wasobserved in all bioreactors during Phase 1, with no meaningful dif-ference according to the substrate treated or the operational tem-perature. In the VFA wastewater trial, biomass granulation wasobserved only in the mesophilic R6. In contrast, in the glucose trial,granulation was observed in all three bioreactors during Phase 2
and, notably, the mesophilic R3 had a 1.6–2.6-fold higher granula-tion rate than the low-temperature R1 and R2. Phase 2 was charac-terised by the 3-fold decrease in HRT to 12 h, which resulted in aconsiderable drop in the COD removal efficiency of all bioreactors.Interestingly, the COD standard deviations decreased by almosthalf indicating less variable COD removal (Table 1). The combina-tion of reducing the HRT while maintaining the same OLR andup-flow velocity, appeared to be fundamental in selecting for apsychrophilic granular community. It likely favoured species withhigher growth rates. An exception was in R6, where it is likelythe simple VFA constituents were easily degraded under meso-philic conditions. The data indicates that both wastewater and bio-reactor operating temperature/parameters had a major effect onbiomass granulation.
Previously reports have indicated that exocellular polysaccha-rides (ECP) are important for granulation. It is proposed they aidinitial microbial adhesion and maintain the architectural integrityof granules by hydrating the granule surface, protecting againstexcessive shear forces (Diaz et al., 2006; Schmidt and Ahring,1996; Tay et al., 2000). Higher levels of ECP are typically generatedthrough acidogenesis of carbohydrates, rather than from acetogen-esis and methanogenesis of VFAs (Liu et al., 2003). Therefore, thepoor granulation in R4–6 may be due to the absence of carbohy-drates in the VFA wastewater. Additionally, the composition ofthe synthetic VFA wastewater (acetate:propionate:butyrate:etha-nol = 1:1:1:1 in COD equivalent) may be unfavourable for granula-tion compared to the composition of the acidogenic intermediatesproduced from the decomposition of a glucose-based wastewater.
The NMS analysis of the DGGE profiles demonstrated that thearchaeal community was, in terms of diversity, much simplerand less varied than the bacterial community. Notably, after thedevelopment of granular biomass (day 255), the archaeal diversityin granular and suspended biomass from R1–2 remained identicalthroughout the trial duration (Figs. 1a and 2a). This indicates thatthe archaeal community in R1 and R2 was highly stable after theformation of granules. Furthermore, in the R1–3 DGGE profilesthe emergence of DA1 coincided with the observation of granularbiomass (Fig. 1a). DA1 is affiliated with Methanocorpusculum-likeorganisms and was the only species in R1 and R2 belonging tothe order Methanomicrobiales. This corresponded well to the quan-titative assays, which revealed the numerical dominance of Met-hanomicrobiales during the corresponding period in R1 and R2(Fig. 3). However, due to the limitations of DGGE, which is proneto overlook numerically minor populations in mixed microbialcommunities (Sanz and Kochling 2007; Talbot et al., 2008), no Met-hanomicrobiales-related bands were detected from R4–6, despitethe detection of this order by qPCR throughout the trial (Fig. 3).Similarly, the Methanobacteriales order were detected by qPCR ateach sampling point, but a corresponding ribotype was not de-tected in R1–3 DGGE profiles on days 255 and 300.
The family Methanosaetaceae varied greatly according to bothoperating temperature and wastewater composition (Fig. 3). Met-hanosaetaceae is known as a dominant and vital methanogenicgroup in mesophilic anaerobic granulation (Diaz et al., 2006; Huls-hoff Pol et al., 2004). In this study, we also observed that this groupcomposed a significant part of both granular and suspended meth-anogenic communities (first or second most abundant group) dur-ing the period of biomass granulation. R3 and 6 had identicaloperating conditions, except for wastewater composition (Table1). However, despite similar concentrations of Methanosaetaceaein both granular and suspended biomass, the granulation ratewas in excess of three-times greater in R3 at the trial completion.It appears wastewater composition and resultant bacterial com-munity dynamics have a profound effect on Methanosaetaceaedeveloping into granular biofilms, even at a mesophilic tempera-ture of 37 �C (Fig. 3).
J. O’Reilly et al. / Bioresource Technology 101 (2010) 6336–6344 6343
In contrast to Methanosaetaceae, the aceticlastic family Methan-osarcinaceae was not detected in any granular/suspended biomasssample, except from R5 and 6 at the end of Phase 3 (Fig. 3). Thisoperational period was characterised by the doubling of the OLRto 4 kg COD m�3 d�1 (Table 1). The members of this family are typ-ically favoured in substrate rich environments high in organicacids, particularly acetate >300 mg l�1 (Boone et al., 2001). Severalprevious studies have linked Methanosarcinaceae-related popula-tions to high residual acetate concentrations often associated withpoor COD removal (Hulshoff Pol et al., 2004; O’Reilly et al., 2009b).The limited detection of this family, in R5 and 6 was likely due tothe increased OLR in Phase 3, directly increasing influent acetateconcentrations.
Although the low-temperature bioreactors were operated at15 �C for 300 days, all DGGE sequences were assigned and relatedmainly to organisms, known to grow in and/or retrieved from mes-ophilic environments (Tables 2 and 3). A number of authors havealso highlighted a similar trend, indicating that the emergence ofpsychrophilic organisms does not appear to be necessary for suc-cessful low-temperature anaerobic biotreatment. The majority ofmesophilic granular sludges appear to have pre-existing popula-tions that are highly psychrotolerant (McKeown et al., 2009;O’Reilly et al., 2009a). However, several studies have reported theemergence and/or increased abundance of species within the mes-ophilic consortia. Most notably is the apparent increase in Methan-ocorpusculum species as mesophilic granular sludge adapt to lowertemperatures (Collins et al., 2003; O’Reilly et al., 2009b). This studyalso highlighted a similar trend. Both the DGGE and real-time PCRanalyses demonstrated that the order Methanomicrobiales variedconsiderably as granulation occurred in R1 and 2 (Fig. 3). In termsof the 16S rRNA gene concentration, this hydrogenotrophic orderwas the dominant group in both suspended and granular methano-genic communities (38.6–96.6% of TMC) during the period of gran-ulation from day 255 onwards in R1 and R2. Interestingly, it wasthe least abundant methanogenic group measured as granulationoccurred in R3. Our results suggest that Methanomicrobiales maybe a key microbial group in the formation of granular biofilms inLTAD. Although DGGE is not robustly quantitative, the emergenceand high band intensity of DA1 (Methanocorpusculum-like species),the only Methanomicrobiales-related ribotype, in R1 and R2(Fig. 1a) is in agreement with the quantitative results and supportsthe potential importance of Methanomicrobiales in psychrophilicbiomass granulation.
Physiological analysis of the biomass highlighted that thehydrogenotrophic to aceticlastic SMA ratio (HAR) was, as expected,significantly higher in R1 and R2 than in R3, and was more pro-nounced in the granular biomass (Table 1). On the other hand,the VFA-fed bioreactors with poor granulation (R4–6) showed noconsiderable differences in HAR between different temperaturesor between the suspended and granular biomass. This further sug-gests the importance of hydrogenotrophic methanogens in aspectsof both performance and granulation in LTAD. It has previouslybeen reported that hydrogen is metabolically and thermodynami-cally more favourable for methanogenesis than acetate at low-temperatures. Further, higher levels of hydrogen are retained dueto increased gas solubility at low-temperatures (Kotsyurbenko,2005; Lettinga et al., 2001).
5. Conclusion
This study demonstrated that, anaerobic granulation, underlow-temperature operating conditions was feasible. In addition,the data highlighted that operational conditions, particularlywastewater composition, have a significant effect on anaerobicbiomass granulation under mesophilic, as well as psychrophilic,
conditions. In this study, Methanomicrobiales and, in particular,Methanocorpusculum species appeared to play a key role in the psy-chrophilic granulation process. Future work will focus on theoperational requirements to facilitate enhanced psychrophilicgranulation, with a view towards more systematic operational con-trol of ambient or low-temperature anaerobic digestion.
Acknowledgements
This publication emanates from research conducted with thefinancial support of Science Foundation Ireland.
References
Akarsubasi, A.T., Ince, O., Kirdar, B., Oz, N.A., Orhon, D., Curtis, T.P., Head, I.M., Ince,B.K., 2005. Effect of wastewater composition on archaeal population diversity.Water Research 39, 1576–1584.
Akila, G., Chandra, T.S., 2007. Performance of an UASB reactor treating syntheticwastewater at low-temperature using cold-adapted seed slurry. ProcessBiochemistry 42, 466–471.
APHA-AWWA-WEF, 2000. Standard Methods for the Examination of Water andWastewater. American Public Health Association/American Water WorksAssociation/Water Environment Federation, Washington, DC, USA.
Batstone, D.J., Keller, J., Blackall, L.L., 2004. The influence of substrate kinetics on themicrobial community structure in granular anaerobic biomass. Water Research38, 1390–1404.
Boone, D.R., Castenholz, R.W., Garrity, G.M., 2001. Bergey’s manual of systematicbacteriology. Bergey’s Manual of Systematic Bacteriology i–xxi, 1–721.
Coates, J.D., Coughlan, M.F., Colleran, E., 1996. Simple method for the measurementof the hydrogenotrophic methanogenic activity of anaerobic sludges. Journal ofMicrobiological Methods 26, 237–246.
Colleran, E.C., Golden, T., Geoghegan, F., Crumlish, B.K., Henry, M., Coates, J., 1992.Use of methanogenic activity tests to characterize anaerobic sludges, screen foranaerobic biodegradability and determine toxicity thresholds against individualanaerobic trophic groups and species. Water Science and Technology 25, 31–40.
Collins, G., Woods, A., McHugh, S., Carton, M.W., O’Flaherty, V., 2003. Microbialcommunity structure and methanogenic activity during start-up ofpsychrophilic anaerobic digesters treating synthetic industrial wastewaters.FEMS Microbiology Ecology 46, 159–170.
Connaughton, S., Collins, G., O’Flaherty, V., 2006. Psychrophilic and mesophilicanaerobic digestion of brewery effluent: a comparative study. Water Research40, 2503–2510.
Diaz, E.E., Stams, A.J., Amils, R., Sanz, J.L., 2006. Phenotypic properties and microbialdiversity of methanogenic granules from a full-scale upflow anaerobic sludgebed reactor treating brewery wastewater. Applied and EnvironmentalMicrobiology 72, 4942–4949.
Grandin, U., 2006. PC-ORD version 5.0: a user-friendly toolbox for ecologists.Journal of Vegetation Science 17, 843–844.
Hulshoff Pol, H.L.W., Lopes, D.C., Lettinga, G., Lens, P., 2004. Anaerobic sludgegranulation. Water Research 38, 1376–1389.
Kotsyurbenko, O.R., 2005. Trophic interactions in the methanogenic microbialcommunity of low-temperature terrestrial ecosystems. FEMS Microbial Ecology53, 3–13.
Lee, C., Kim, J., Hwang, K., O’Flaherty, V., Hwang, S., 2009. Quantitative analysis ofmethanogenic community dynamics in three anaerobic batch digesters treatingdifferent wastewaters. Water Research 43, 157–165.
Lettinga, G., Rebac, S., Parshina, S., Nozhevnikova, A., van Lier, J.B., Stams, A.J., 1999.High-rate anaerobic treatment of wastewater at low temperatures. Applied andEnvironmental Microbiology 65, 1696–1702.
Lettinga, G., Rebac, S., Zeeman, G., 2001. Challenge of psychrophilic anaerobicwastewater treatment. Trends in Biotechnology 19, 363–370.
Liu, Y., Xu, H.L., Yang, S.F., Tay, J.H., 2003. Mechanisms and models for anaerobicgranulation in upflow anaerobic sludge blanket reactor. Water Resource 37,661–673.
McCarty, P.L., 2001. The development of anaerobic treatment and its future. WaterScience and Technology 44, 149–156.
McKeown, R.M., Scully, C., Mahony, T., Collins, G., O’Flaherty, V., 2009. Long-term(1243 days), low-temperature (4–15 �C), anaerobic biotreatment of acidifiedwastewaters: bioprocess performance and physiological characteristics. WaterResearch 43, 1611–1620.
Muyzer, G., de Waal, E.C., Uitterlinden, A.G., 1993. Profiling of complex microbialpopulations by denaturing gradient gel electrophoresis analysis of polymerasechain reaction-amplified genes coding for 16S rRNA. Applied andEnvironmental Microbiology 59, 695–700.
O’Reilly, J., Chinalia, F.A., Mahony, T., Collins, G., Wu, J., O’Flaherty, V., 2009a.Cultivation of low-temperature (15 �C), anaerobic, wastewater treatmentgranules. Letters in Applied Microbiology 49 (4), 421–426.
O’Reilly, J., Lee, C., Collins, G., Chinalia, F., Mahony, T., O’Flaherty, V., 2009b.Quantitative and qualitative analysis of methanogenic communities inmesophilically and psychrophilically cultivated anaerobic granular biofilms.Water Research 43 (14), 3365–3374.
6344 J. O’Reilly et al. / Bioresource Technology 101 (2010) 6336–6344
Raskin, L., Zheng, D.D., Griffin, M.E., Stroot, P.G., Misra, P., 1995. Characterization ofmicrobial communities in anaerobic bioreactors using molecular probes.Antonie Van Leeuwenhoek International Journal of General and MolecularMicrobiology 68, 297–308.
Rebac, S., van Lier, J.B., Lens, P., Stams, A.J.M., Dekkers, F., Swinkels, K.T.M., Lettinga,G., 1999. Psychrophilic anaerobic treatment of low strength wastewaters.Water Science and Technology 39, 203–210.
Sanz, J.L., Kochling, T., 2007. Molecular biology techniques used in wastewatertreatment: an overview. Process Biochemistry 42, 119–133.
Satoh, H., Miura, Y., Tsushima, I., Okabe, S., 2007. Layered structure of bacterial andarchaeal communities and their in situ activities in anaerobic granules. Appliedand Environmental Microbiology 73, 7300–7307.
Schmidt, J.E., Ahring, B.K., 1996. Granular sludge formation in upflowanaerobic sludge blanket (UASB) reactors. Biotechnology and Bioengineering49, 229–246.
Shelton, D.R., Tiedje, J.M., 1984. General-method for determining anaerobicbiodegradation potential. Applied and Environmental Microbiology 47, 850–857.
Takai, K., Horikoshi, K., 2000. Rapid detection and quantification of members of thearchaeal community by quantitative PCR using fluorogenic probes. Applied andEnvironmental Microbiology 66, 5066–5072.
Talbot, G., Topp, E., Palin, M.F., Masse, D.I., 2008. Evaluation of molecular methodsused for establishing the interactions and functions of microorganisms inanaerobic bioreactors. Water Research 42, 513–537.
Tamura, K., Dudley, J., Nei, M., Kumar, S., 2007. MEGA4: molecular evolutionarygenetics analysis (MEGA) software version 4.0. Molecular Biology and Evolution24, 1596–1599.
Tay, J.H., Xu, H.L., Teo, K.C., 2000. Molecular mechanisms of granulation. 2: protontranslocation activity. Environmental Engineering 126, 411–418.
Yu, Y., Lee, C., Jaai, K., Hwang, S., 2005. Group-specific primer and probe sets todetect methanogenic communities using quantitative real-time polymerasechain reaction. Biotechnology and Bioengineering 89, 670–679.
Zumstein, E., Moletta, R., Godon, J.J., 2000. Examination of two years of communitydynamics in an anaerobic bioreactor using fluorescence polymerase chainreaction (PCR) single-strand conformation polymorphism analysis.Environmental Microbiology 2, 69–78.