microbial communities || the influence of microbial community structure and function on...
TRANSCRIPT
The Influence of Microbial Commwiity Structure and Function on Community-Level Physiological Profiles.
Jay L. Garland!, K.L. Cook!, C. A. Loader!, and B. A. Hungate2
1 Dynamac Corporation, Mail Code DYN-3, Kennedy Space Center, Fla. 32899, USA 2 Smithsonian Environmental Research Center, PO Box 28, Edgewater, MD, 21037, USA
Abstract. Patterns of carbon source utilization, or community-level physiological profiles (CLPP), produced from direct incubation of environmental samples in BIOLOG microplates can consistently discriminate spatial and temporal gradients within microbial communities. While the resolving power of the assay appears significant, the basis for the differences in the patterns of sole carbon source utilization among communities remains unclear. Carbon source utilization as measured in this assay is a measure of functional potential, rather than in situ activity, since enrichment occurs over the course of incubation, which can range from 24 to 72 hours (or even longer) depending on inoculum density. The functional profile of a community could be an indicator of carbon source availability and concomitant selection for specific functional types of organisms. A more limited view of the profile is as a composite descriptor of the microbial community composition without any ecologically relevant functional information. We manipulated microbial community structure and function in laboratory microcosms to evaluate their influence on CLPP. The structure of rhizosphere communities was controlled by inoculating axenic plants (wheat and potato) with different mixed species (non-gnotobiotic) inocula. Inoculum source influenced CLPP more strongly than plant type, indicating that CLPP primarily reflected differences in microbial community structure than function. In order to more specifically examine the influence of microbial function on CLPP, specific carbon sources in the BIOLOG plates (asparagine and acetate) were added to a continuously stirred tank reactor (CSTR) containing a mixed community of microorganisms degrading plant material. Daily additions of these carbon sources at levels up to 50% of the total respired carbon in the bioreactor caused significant changes in overall CLPP, but caused no, or minor, increases in the specific response of these substrates in the plates. These studies indicate that the functional relevance of CLPP should be interpreted with caution.
Keywords. Communities, BIOLOG, carbon sources, rhizosphere, bioreactor
1. Introduction
Profiles of the potential utilization of multiple sole carbon sources by mixed microbial communities can be rapidly produced through direct inoculation of
H. Insam et al. (eds.), Microbial Communities© Springer-Verlag Berlin Heidelberg 1997
172
environmental samples (e.g., water, bacterial suspensions from soil or biofilms) into Biolog microplates (Garland and Mills 1991). Utilization of the 95 different sole carbon sources in the separate wells of the microplate is quantified by measuring the reduction of tetrazolium violet to colored formazan in respiring cells. The patterns of carbon source utilization, or community-level physiological profiles (CLPP), can consistently discriminate spatial and temporal gradients within microbial communities (Garland and Mills 1991, Garland and Mills 1994, Lehman et af. 1995, Winding 1994). Relatively subtle shifts in microbial communities, such as the response of rhizosphere communities to plant age (Garland 1996b) are discernible with the method. Discrimination is enhanced if differences in inoculum density and the concomitant effects on the overall rate of color formation are accounted for either in the inoculation of the plates or data analysis (Garland 1996a, Haack et af. 1995).
While the resolving power of the assay appears significant, the basis for the differences in the patterns of sole carbon source utilization among communities requires further research. Carbon source utilization as measured in this assay is a measure of functional potential, rather than in situ activity, since enrichment occurs over the course of incubation, which can range from 24 to 72 hours (or even longer) depending on inoculum density (Garland, 1996a). The ecological relevance of these changes in functional potential remains unclear. Do CLPP reflect in situ carbon source availability and concomitant shifts in the relative abundance of organisms capable of utilizing these compounds? The presence or absence of response in a specific well in the community-level assay does appear to reflect the presence or absence of individuals in the community capable of utilizing the substrate. Haack et al. (1995), working with simple gnotobiotic mixtures of bacteria (4 or 6 different strains), reported that a positive response reflected the presence of specific strains capable of using that substrate, while a negative response typically indicated the absence of individuals capable of degrading that substrate. Lehman et af. (1995) found that community-level profiles of deep subsurface communities rarely showed a positive response toward any carbohydrates, and a similar lack of utilization of sugars has been reported for isolates from deep subsurface samples (Fredrickson et al. 1991).
However, consistent differences in the community-level profiles among samples from complex, natural communities (e.g., soil types, rhizosphere communities from different plant types) are typically the result of variation in the rate and extent, rather than the presence or absence, of responses in different wells. Experience in our lab has indicated that most microbial samples with cell densities greater than 105 ml-I show positive responses toward the vast majority of substrates after extended incubations, but that the relative pattern of utilization at specific points during the incubation can be used to consistently discriminate sample types. Garland and Mills (1991) hypothesized that the degree of response may reflect the relative abundance of organisms able to utilize a particular substrate. This conceptual view of community-level physiological profiles as guild profiles did not fit results from studies with simple gnotobiotic mixtures. Haack et af. (1995) found that although different mixtures of bacterial strains produced distinctive profiles of carbon source utilization, the rate of response in
173
individual wells was not correlated to the number of organisms in the inoculum capable of utilizing the substrate. The relationship between CLPP and the distribution of functional abilities within natural, complex communities has not been established. Despite the lack of a clear linkage, CLPP are being used as indicators of in situ carbon source utilization (Insam et al. 1996) and functional biodiversity (Zak et al. 1994).
We experimentally manipulated microbial community structure and function in laboratory microcosms to determine their affects on CLPP. Microbial communities with distinctive community structures, but similar functional attributes, were created by introducing distinctive mixed microbial inocula into axenic plants. This rhizosphere inoculation experiment addressed the question: Do structurally dissimilar but functionally similar communities yield dissimilar CLPP? Community function was altered by amending aerobic bioreactors with specific carbon sources (Le., asparagine and acetate) found in the Biolog microplates. These bioreactor studies addressed the question: Do shifts in CLPP correspond to known changes in carbon source availability?
2. Material and Methods
2.1 Rhizospbere inoculation study
Wheat seeds (Triticum aestivum L. cv. Yecora roja) were sterilized using mercuric chloride and hydroxylamine hydrochloride (Barber 1967) and germinated for five days on moistened filter paper. Sterility of the plants was confirmed by growing randomly selected seedlings in 50 ml culture tubes containing 15 ml 0.55% R2A agar (Difco Laboratories) and checking for lack of visible microbial growth in the rhizosphere. Axenic white potato (Solanum tuberosum L. cv. Norland) plants were produced from nodal cuttings (Hussey and Stacey 1981), and grown for 4 weeks in Murashige and Skoog's media (Murashige and Skoog 1962) to allow for root development (Hussey and Stacey 1981). Sterility was confirmed by the lack of visible microbial growth in the rhizosphere of the sucrose-containing media.
Potato and wheat plants were placed into autoclaved foam plugs and transferred into sterile wide-mouth glass vessels containing 50 ml of 114 strength Hoagland's solution (Morales et al. 1996). These are subsequently refered to as plant growth vessels. Plants were grown ,for seven days on a bench top plant growth system containing fluorescent lamps and a humidifier enclosed within black plastic. Plants growth vessels were placed on a rotating shaker table (75 rpm) to provide aeration. Environmental conditions were as follows: 12h/12h light/dark, average photosynthetic photon flux of 100 f,Lmoles m-2 sec-1 ,
continuous temperature at 22±1° C, and 50±5% relative humidity. Plant growth vessels were inoculated with mixed microbial inocula from the
rhizosphere of mature wheat and potato plants grown in recirculating hydroponic systems. Separate inocula were prepared by shaking excised root samples from wheat and potato, respectively, in hydroponic solution, growing the resulting
174
suspension for 24 h in R2A broth, and freezing at -70°C in glycerol. In preparation for plant growth studies, the frozen vials of each inoculum type were thawed and 20 J..ll was added to 50 mls of R2A media. Three separate cultures were initiated; 1) wheat inoculum alone, 2) potato inoculum alone, and 3) wheat and potato inocula combined. After 16 h growth with shaking at 200 rpm, the cultures were centrifuged at 2000 g for 20 min, and the pellet was resuspended in 1/4 strength Hoagland's solution to a density of 0.1 abs. units at 600 nm. These suspensions (0.5 ml) were added to the nutrient solution of plant growth vessels immediately before addition of the plant. Four replicate microcosms containing each plant type were inoculated with each inoculum type (4 reps x 2 plant types x 3 inocula = 24 total plants).
After 7 days growth, plants were removed from the vessels, and roots were excised and placed into 0.85% saline. Suspensions of rhizosphere microorganisms were produced by shaking the roots in glass beads as previously described (Garland, 1996b). The suspensions were diluted lO-fold in 0.85% saline, and inoculated into Biolog GN microplates. Samples of the suspensions also were serially diluted on R2A agar for estimation of culturable bacteria and fixed for subsequent estimation of total numbers using the acridine-orange (AO) method with epiflourescent microscopy (Hobbie et al. 1977). Plant growth was estimated by measuring shoot length (wheat), shoot dry weight (potato), and root weight (both).
2.2 Bioreactor studies
An 8L continuously-stirred tank reactor (CSTR) containing dried plant material (plant material (25 gIL) was used for these studies (Finger and Strayer 1994). Relevant operating conditions were as follows: 35 ° C temperature, 6.5 pH, and 7.5 L min-! air flow rate, and 300 rpm stirring rate. Nominal operation of the reactor involved daily addition of 25 g of milled (2 mm) oven-dried wheat biomass (leaves, stems, and roots) and 1 L of deionized water following removal of 1 L of reactor contents. The ground biomass was added gradually over the course of the day using a screw-feed mechanism. Bioreactor headspace gas was circulated through a carbon dioxide analyzer (Model LI-6251, LI-COR). Approximately 40-50 % of the volatile solids of the wheat biomass were degraded with this 8 day retention time.
After nearly 3 months of continuous operation in the nominal mode, specific carbon amendment studies were performed. The first experiment involved daily additions of 1.5 g of asparagine for 10 consecutive days, followed by addition of 5 g for another 9 days. The asparagine was dissolved in 100 mls of deionized water, all of which was added to the reactor immediately after the daily harvesting/feeding schedule. Samples were taken from the daily harvests of the bioreactor, diluted 20 fold with 0.85% NaCl, and blended for 30 sec. The resulting suspension was diluted 20 fold in 0.85% NaCl, and inoculated into Biolog GN microplates.
After 21 days of nominal operation following the asparagine amendment study, daily amendments with 5 g of acetate were begun. The reactor was amended for 8
175
straight days, then amended for 2 additional days after being left unamended for 2 days. The reactor was sampled as above.
2.3 Data analysis
2.3.1 Plate reading
Plates were read over a time course of incubation as previously reported (Garland 1996a,b). Comparisons were made among plate readings of equivalent average well color development (A WCD).
2.3.2 Statistical analysis
Differences in CLPP among rhizosphere samples were tested statistically by comparing principal component scores among treatment groups using analysis of variance. Principal component scores 1 and 2 were each JUlalyzed using a twoway analysis of variance (ANOVA); the two factors were inoculum source (3 levels, potato, wheat, and potato+wheat) and plant type (2 levels, potato and wheat). Tukey's post hoc tests were used to determine significant differences (p<0.05) between individual pairs of means. Plant growth data were analyzed using a one-way ANOV A with inoculum as the factor.
We used one-way ANOV As to test for differences in principal component scores and the response of the amended carbon source. Mean values for each sampling time with common levels of asparagine (0 g, 1 g, 5g) and acetate (0 g or 5 g) amendments were used as replicates for the asparagine and acetate amendment "treatments". Because we observed a delayed response to the acetate addition and had difficulties with pH control immediately after acetate addition (see Figure 3), we excluded the first three time points after acetate addition from the 5 g treatment group. Data were log-transformed as necessary to conform with the ANOV A assumption of homogeneity of variance.
3. Results
3.1 Seedling inoculation experiment
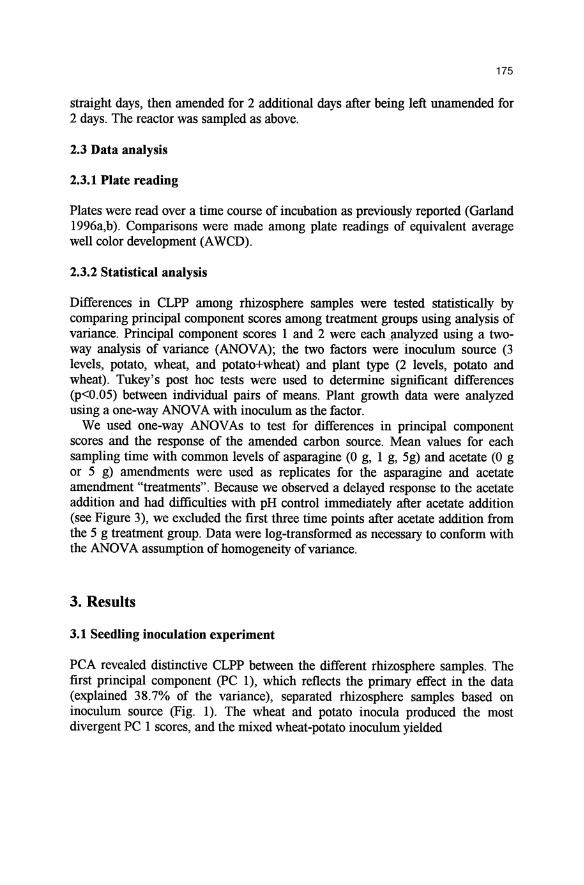
PCA revealed distinctive CLPP between the different rhizosphere samples. The first principal component (pC 1), which reflects the primary effect in the data (explained 38.7% of the variance), separated rhizosphere samples based on inoculum source (Fig. 1). The wheat and potato inocula produced the most divergent PC 1 scores, and the mixed wheat -potato inoculum yielded
176
N
lil c: o a. E 8 0
I ·0 ·2 ·1 Q.
-2
-3
• • ... a 0
A
6
Wheat Plant - Wheat Inoculum + Wheat Plant - Potato Inoculum Wheat Plant - W .. P Inoculum 2c
Po'~ P."-"" ... ,"~.m f ~ Potato Plant - Potato Inoculum 2bc Potato Plant - W .. p Inoculum
f+= 3a
8 10 12 14 16 18 20
Principal Component 1
Fig. 1. Principal component analysis of rhizosphere inoculation study. Points represent means and standard deviations of 4 replicate samples. Means with different nwnbers have significantly different scores for the first principal component. Means with different letters have significantly different scores for the second principal component.
24
22
20
18
16
~ 14
12
10
8
6 0.45
• Wheat Plant - Wheat Inoculum • Wheat Plant - Potato Inoculum ... Wheat Plant - W .. P Inoculum o Potato Plant - Wheat Inoculum o Potato Plant - Potato Inoculum A Potato Plant - W .. P Inoculum
0.50 0.55
R2= 0.96
0.60 0.65 0.70
Eveness of Response (within sample standard deviation)
0.75
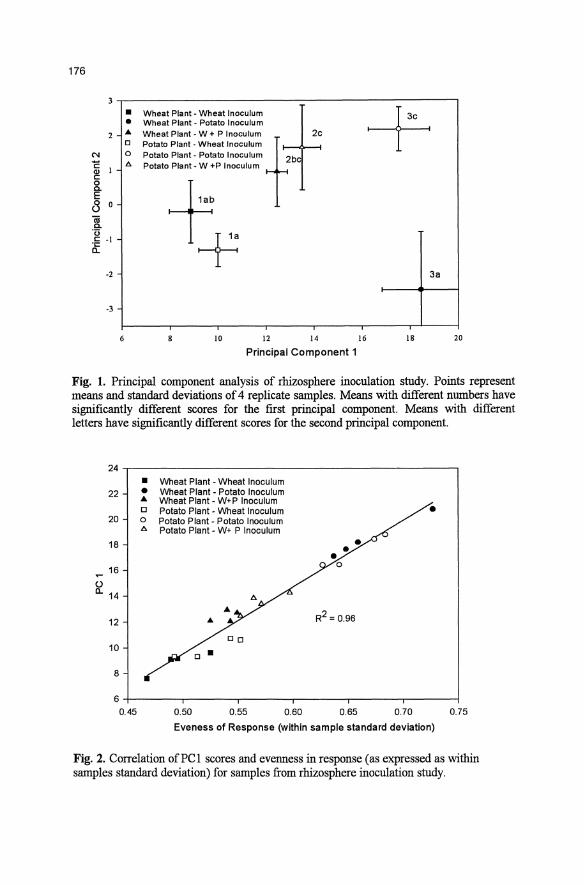
Fig. 2. Correlation of PC I scores and evenness in response (as expressed as within samples standard deviation) for samples from rhizosphere inoculation study.
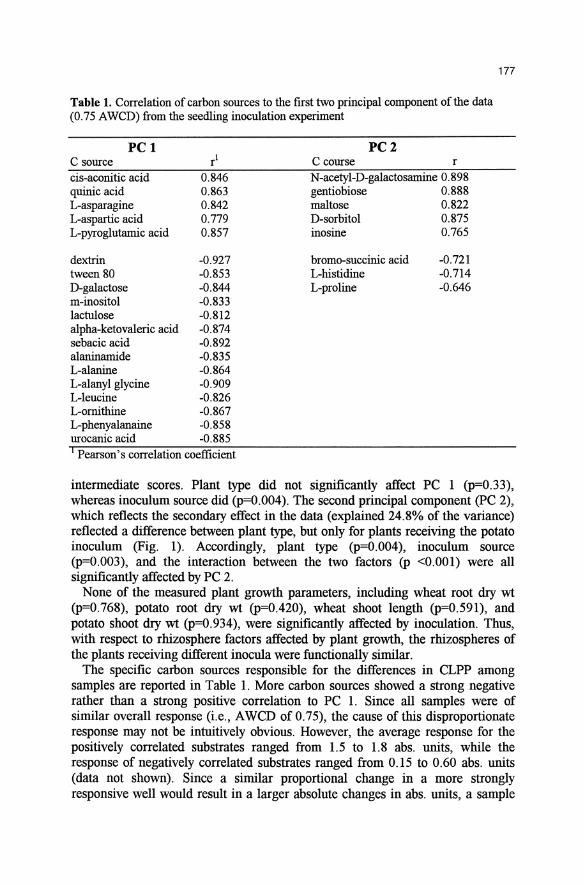
Table 1. Correlation of carbon sources to the first two principal component of the data (0.75 AWCD) from the seedling inoculation experiment
PCI C source cis-aconitic acid quinic acid L-asparagine L-aspartic acid L-pyroglutamic acid
dextrin tween 80 D-galactose m-inositol lactulose alpha-ketovaleric acid sebacic acid alaninamide L-alanine L-alanyl glycine L-Ieucine L-ornithine L-phenyalanaine urocanic acid
0.846 0.863 0.842 0.779 0.857
-0.927 -0.853 -0.844 -0.833 -0.812 -0.874 -0.892 -0.835 -0.864 -0.909 -0.826 -0.867 -0.858 -0.885
I Pearson's correlation coefficient
PC2 C course r N-acetyl-D-galactosamine 0.898 gentiobiose 0.888 maltose 0.822 D-sorbitol 0.875 inosine 0.765
bromo-succinic acid L-histidine L-proline
-0.721 -0.714 -0.646
177
intermediate scores. Plant type did not significantly affect PC I (p=O.33), whereas inoculum source did (p=O.004). The second principal component (pC 2), which reflects the secondary effect in the data (explained 24.8% of the variance) reflected a difference between plant type, but only for plants receiving the potato inoculum (Fig. 1). Accordingly, plant type (p=O.004), inoculum source (p=O.003), and the interaction between the two factors (p <0.001) were all significantly affected by PC 2.
None of the measured plant growth parameters, including wheat root dry wt (p=O.768), potato root dry wt (p=O.420), wheat shoot length (p=0.591), and potato shoot dry wt (p=0.934), were significantly affected by inoculation. Thus, with respect to rhizosphere factors affected by plant growth, the rhizospheres of the plants receiving different inocula were functionally similar.
The specific carbon sources responsible for the differences in CLPP among samples are reported in Table 1. More carbon sources showed a strong negative rather than a strong positive correlation to PC 1. Since all samples were of similar overall response (i.e., A WCD of 0.75), the cause of this disproportionate response may not be intuitively obvious. However, the average response for the positively correlated substrates ranged from 1.5 to 1.8 abs. units, while the response of negatively correlated substrates ranged from 0.15 to 0.60 abs. units (data not shown). Since a similar proportional change in a more strongly responsive well would result in a larger absolute changes in abs. units, a sample
178
with increases in a few strongly responsive wells and decreases in a greater number of less responsive wells would still yield the same overall A WCD. This suggests that PC I might reflect differences among samples in the relative evenness in the CLPP. The standard deviation in the response among wells for a given sample is inversely related to the evenness of well response in the plate. As predicted, the standard deviation of samples was highly correlated (R2 = 0.96) to their PC 1 scores (Fig. 2).
3.2 Bioreactor studies
3.2.1 Asparagine amendment
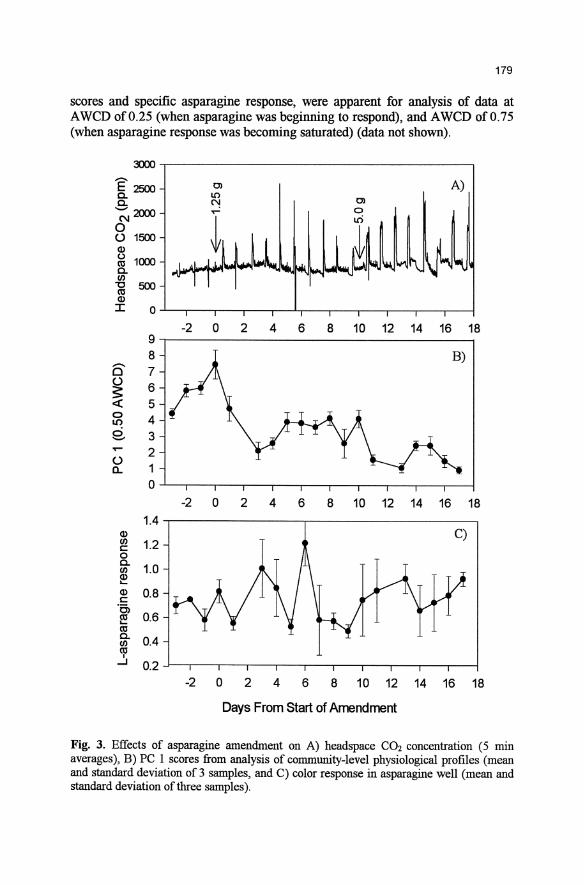
The added asparagine was rapidly respired as reflected by the spike in the concentration of CO2 in the headspace immediately after feeding. (Fig. 3a). Both the height and duration of the spike increased when the amendment level was changed from 1.25 to 5.0 glday. During normal operation, approximately 1.8-2.8 g CO2 day·1 are produced from the partial degradation of the plant biomass. Addition of 1.25 g and 5.00 g of asparagine increased CO2 production by 13-20% and 39-50%, respectively.
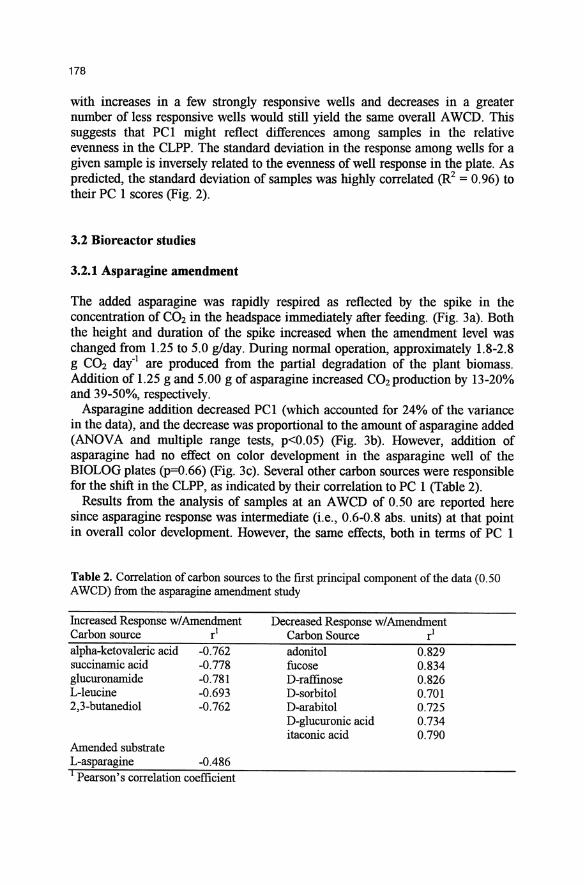
Asparagine addition decreased PCI (which accounted for 24% of the variance in the data), and the decrease was proportional to the amount of asparagine added (ANOVA and multiple range tests, p<0.05) (Fig. 3b). However, addition of asparagine had no effect on color development in the asparagine well of the BIOLOG plates (p=0.66) (Fig. 3c). Several other carbon sources were responsible for the shift in the CLPP, as indicated by their correlation to PC 1 (Table 2).
Results from the analysis of samples at an A WCD of 0.50 are reported here since asparagine response was intermediate (i.e., 0.6-0.8 abs. units) at that point in overall color development. However, the same effects, both in terms of PC I
Table 2. Correlation of carbon sources to the fIrst principal component of the data (0.50 AWCD) from the asparagine amendment study
Increased Response w/Amendment Carbon source rl
Decreased Response w/Amendment Carbon Source rl
alpha-ketovaleric acid -0.762 adonitol 0.829 succinamic acid -0.778 fucose 0.834 glucuronamide -0.781 D-raffmose 0.826 L-leucine -0.693 D-sorbitol 0.701 2,3-butanediol -0.762 D-arabitol 0.725
D-glucuronic acid 0.734 itaconic acid 0.790
Amended substrate L-asparagine -0.486 I Pearson's correlation coefficient
179
scores and specific asparagine response, were apparent for analysis of data at AWCD of 0.25 (when asparagine was beginning to respond), and AWCD of 0.75 (when asparagine response was becoming saturated) (data not shown).
~~--------------------------------------~
E2500 a. a. ~2000 o U 1500 Q)
~ 1000 a. en ~ 500 Q)
A)
I O~-.---.---r--.-~.---.--''--.---.---.--~
-2 0 2 4 6 8 10 12 14 16 18 9.------------------------------------.
U a.
8 7 6 5 4 3 2
-2 0 2 4 6
B)
8 10 12 14 16 18 1.4 -,-----------,------------,
Q) en r::: o
1.2
g. 1.0 ~ Q) r::: 0.8 '0, ~ 0.6 m a. en 0.4
C)
~ 0.2 J----,-----r---,----.-----.---.----r-----,-----,-----r----j
-2 0 2 4 6 8 10 12 14 16 18
Days From Start of Amendment
Fig. 3. Effects of asparagine amendment on A) headspace CO2 concentration (5 min averages), B) PC 1 scores from analysis of community-level physiological profiles (mean and standard deviation of 3 samples, and C) color response in asparagine well (mean and standard deviation of three samples).
180
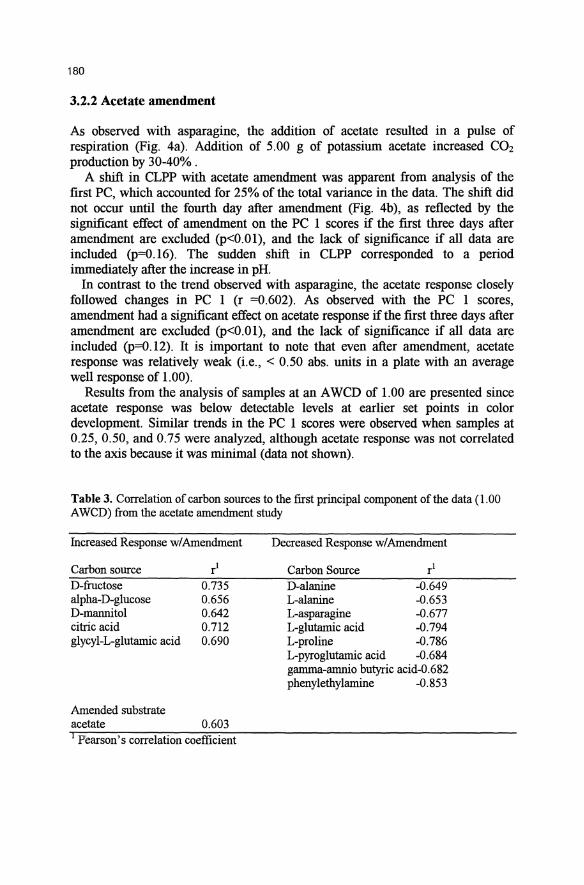
3.2.2 Acetate amendment
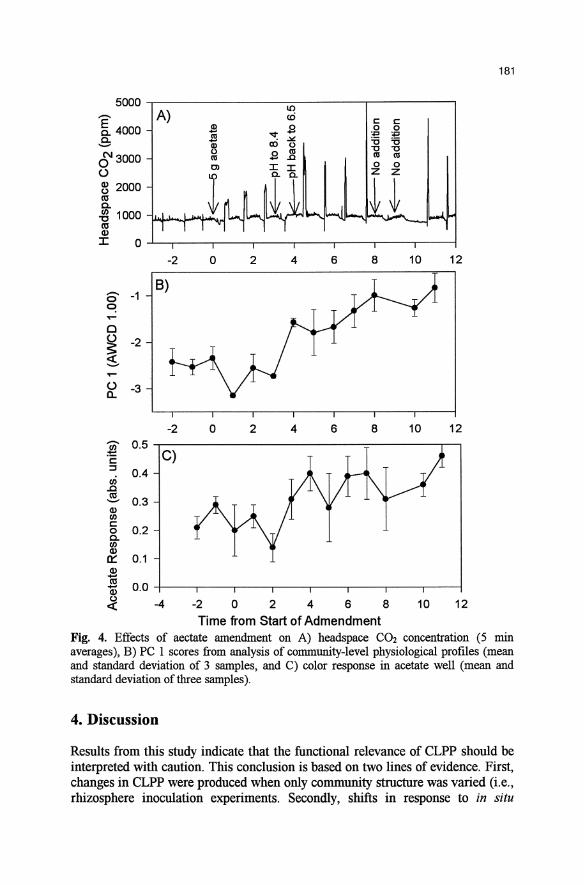
As observed with asparagine, the addition of acetate resulted in a pulse of respiration (Fig. 4a). Addition of 5.00 g of potassium acetate increased CO2
production by 30-40% . A shift in CLPP with acetate amendment was apparent from analysis of the
first PC, which accounted for 25% of the total variance in the data. The shift did not occur until the fourth day after amendment (Fig. 4b), as reflected by the significant effect of amendment on the PC I scores if the first three days after amendment are excluded (p<0.01), and the lack of significance if all data are included (p=O.16). The sudden shift in CLPP corresponded to a period immediately after the increase in pH.
In contrast to the trend observed with asparagine, the acetate response closely followed changes in PC I (r =0.602). As observed with the PC 1 scores, amendment had a significant effect on acetate response if the first three days after amendment are excluded (p<0.01), and the lack of significance if all data a,r~ included (p=O.12). It is important to note that even lifter amendment, acetate response was relatively weak (i.e., < 0.50 abs. units in a plate with an average well response of 1.00).
Results from the analysis of samples at an A WCD of 1.00 are presented since acetate response was below detectable levels at earlier set points in color development. Similar trends in the PC I scores were observed when samples at 0.25,0.50, and 0.75 were analyzed, although acetate response was not correlated to the axis because it was minimal (data not shown).
Table 3. Correlation of carbon sources to the first principal component of the data (1.00 AWCD) from the acetate amendment study
fucreased Response wi Amendment
Carbon source D-fructose alpba-D-glucose D-mannitol citric acid glycyl-L-glutamic acid
Amended substrate acetate
0.735 0.656 0.642 0.712 0.690
0.603 I Pearson's correlation coefficient
Decreased Response wi Amendment
Carbon Source rl D-alanine -0.649 L-alanine -0.653 L-asparagine -0.677 L-glutamic acid -0.794 L-proline -0.786 L-pyroglutamic acid -0.684 gamma-amnio butyric acid-O.682 phenylethylamine -0.853
5000,---------------~~~-------,----------,
'[ 4000 A) v ~ S cri-6 0'3000 U 8 2000 m c.. ~ 1000 m Q)
.a 11 J: Co
c: c: o 0 .... '6 '6 "C "C til til o 0 Z z
t~ I 0-'--,-----,---,------.--,----,---,---1
S -1 C!
o ~ -2
~
U -3 a.
-2
-2
o 2
o 2
4 6 8 10 12
4 6 8 10 12 W 0.5 ,---------------:::------,---, c: C) ::::I
ui 0.4
.0 m '-' 0.3 Q) II)
§ 0.2 c.. 16
0::: 0.1
~ 0.0 -i----,---,----..--...,.----r--,.---.----;
.:t -4 -2 o 2 4 6 8 10 12 Time from Start of Admendment
181
Fig. 4. Effects of aectate amendment on A) headspace C02 concentration (5 min averages), B) PC I scores from analysis of community-level physiological profIles (mean and standard deviation of 3 samples, and C) color response in acetate well (mean and standard deviation oftbree samples).
4. Discussion
Results from this study indicate that the functional relevance of CLPP should be interpreted with caution. This conclusion is based on two lines of evidence. First, changes in CLPP were produced when only community structure was varied (i.e., rhizosphere inoculation experiments. Secondly, shifts in response to in situ
182
carbon source availability involved weak or no change in the response of the amended substrate, even when it represented up to 50% of the readily available carbon.
The significant increase in acetate response, a weakly responsive test, in the carbon amendment study suggests that the presence/absence of a response in the CLPP may provide information on carbon source availability. However, the relative rate of utilization does not appear to provide useful functional information. This conclusion is based on the fact the response of asparagine did not increase with amendment, and the fact that neither acetate nor asparagine became the dominant response in the assay, even though they represented from 30-50% of the total respired C in situ. These results with complex microbial communities concur with previous studies with gnotobiotic mixtures (Haack et al. 1995).
An ancillary finding from the rhizosphere inoculation study was that the evenness in response can significantly influence classification of CLPP. This finding is relevant because the change in evenness of response was the result of variation in community structure, not function. It is unclear from this study if the change was due to the diversity of organisms present, and/or the metabolic diversity of individual organisms. However, it is clear that effects of community structure on the evenness of response will confound interpretation of functional diversity (Zak et al. 1994). Thus, richness - in this case, the number of positively responding Biolog wells - may be more functionally relevant than evenness.
Further carbon amendment studies could improve our understanding of CLPP. Amendments to more carbon-limited communities may be useful to mimic conditions in many natural environments. Preliminary findings from this study suggest that the interaction between carbon source availability and physiochemical stress (i.e., pH) should be evaluated. The delayed response to acetate amendment corresponded to a transient pH increase. One interpretation of the results is that the bioreactor community did not respond structurally to the supplemental carbon because it possessed an assimilative capacity, but that the pH stress restructured the community. Further experiments are necessary, but CLPP may be useful tool for evaluating stability in microbial communities.
This work has demonstrated apparent limitations of CLPP for measuring functional attributes of microbial communities. At the same time, this research has demonstrated that CLPP can reproducibly discriminate between microbial communities in different experimental treatments. Our results indicate that CLPP describe microbial community structure, but further work is needed to define what components of the in situ microbial community CLPP describe, as well as whether CLPP, perhaps in combination with other techniques, might provide any taxonomic information.
5. References
Barber DA (1967) The effects of microorganisms on the absorption of inorganic nutrients by intact plants. J Exp Bot 18:163-169
183
Finger BW, Strayer RF (1994) Development of an intermediate-scale aerobic bioreactor to regenerate nutrients from inedible crop residues. SAE Technical Paper 941501
Fredickson JK, Balkwill DL, Zachara 1M, Li SW, Brockman FJ, Simmons MA (1991) Physiological diversity and distributions of heterotrophic bacteria in deep Cretaceous sediments of the Atlantic coastal plain. Appl Environ Microb 57: 402-411
Garland JL (1996a) Analytical approaches to the characterization of samples of microbial communities using patterns of potential carbon source utilization. Soil BioI Biochem 28:213-221 .
Garland JL (1996b) Patterns of potential carbon source utilization by rhizosphere communities. Soil BioI Biochem 28:223-230
Garland JL, Mills AL (1991) Classification and characterization of heterotrophic microbial communities on the basis of patterns of community-level sole-carbonsource utilization. Appl Envrion Microb 57:2351-2359
Garland JL, Mills AL (1994). A community-level physiological approach for studying microbial communities, pp. 77-83. In Ritz K, Dighton J, Giller KE (ed.) Beyond the biomass: compositional and functional analysis of soil microbial communities. John Wiley & Sons, Chichester, UK
Haack SK, Garchow H, Klugg MI, Forney LJ (1995) Analysis of factors affecting the accuracy, reproducibility, and interpretation of microbial community carbon source utilization profiles. Appl Environ Microb 61: 1458-1468
Hobbie IE, Daley RI, Jasper S (1977) Use of Nucleopore filters for counting bacteria for fluorescent microscopy. Appl Environ Microb 33: 1225-1228
Hussey G, Stacey NJ (1981) In Vitro propagation of potato (Solanun tuberosum L.) Annals Bot 48:787-796
Insam H, Arnor K, Renner M, Crepaz C (1996) Changes in functional abilities of the microbial community during composting of manure. Microb EcoI31:77-87
Lehman RM, Colwell FS, Ringelberg DB, White DC (1995) Combined microbial community-level analyses for quality assurance of terrestial subsurface cores. J Microb Meth 22:263-281
Morales A, Garland JL, Lim DV (1996) Survival of potentially pathogenic human-associated bacteria in the rhizosphere of hydroponically-grown wheat. FEMS Microbiol EcoI20:155-162
Murashige T, Skoog F (1962) A revised medium for rapid growth and bioassays with tobacco tissue cultures. Physiol Plant 15:473-497
Winding A (1994) Fingerprinting bacterial soil communities using Biolog microtitre plates, pp. 85-94. In Ritz K, Dighton J, Giller KE (eds.) Beyond the biomass: compositional and functional analysis of soil microbial communities. John Wiley & Sons, Chichester, UK
Zak JC, Willig MR, Moorehead DL, Wildman HG (1994) Functional diversity of microbial communities: a quantitative approach. Soil BioI Biochem 26:1101-1108